A Wireless Sensor, AdHoc and Delay Tolerant Network System for
14
A Wireless Sensor, AdHoc and Delay Tolerant Network System for Disaster Response H. Chenji, A. Hassanzadeh, M. Won, Y. Li † , W. Zhang, X. Yang, R. Stoleru, G. Zhou † Department of Computer Science and Engineering, Texas A&M University † Department of Computer Science, College of William and Mary Abstract This paper presents AnonymousNet (AnonNet), a sys- tem for emergency response in large scale disaster areas, e.g., earthquake and tsunami in Japan (2011) and earthquake in Haiti (2010). Despite the attention the “emergency re- sponse” application area has received, we still lack data at the high spatial and temporal resolution needed to save lives, and to support disaster recovery efforts. Disaster victims are rescued after days, if not weeks; victims’ physiologi- cal information is not delivered reliably on time; good co- ordination among responders is lacking, or it is based on archaic methods (pencil, paper, paint on walls); the delay in receiving vast amounts of information is bounded by the time used to physically transport tapes or hard drives; and no sensing/communication system built and deployed lasts more than a few days. AnonNet, designed in collaboration with US&R responders, is a first step to address these chal- lenges. It is designed to aid in identifying victims under col- lapsed buildings, deliver victims’ physiological information on time, deliver high volumes of field data at high through- put and in an energy efficient manner, and integrates new social networking paradigms. AnonNet is a large academic effort, proposing open systems, instead of proprietary solu- tions. AnonNet and its subsystems are evaluated in real de- ployments and simulations. 1 Introduction Disasters, natural or man made, are unexpected events that cause significant distress and havoc on a global scale. The best that can be done in the face of such uncontrollable acts of nature is speedy and effective recovery. Recent dis- asters in Japan and Haiti [1, 2] have shown the effect that they can have on people, property, and the economy. Reper- cussions include, but are not limited to shortage of electric power, food, potable water, protection from the elements of nuclear and/or chemical hazards. In such situations, disaster response becomes increasingly difficult and constrained. Several countries have set up governmental agencies to deal with such disasters, such as the Urban Search & Res- cue (US&R), an agency part of FEMA [3] in US. Several Task Forces comprising of trained personnel and specialized equipment have been deployed by FEMA in the event of such disasters. From our collaborations with US&R responders, we are keenly aware of the 66 tons of equipment emergency responders maintain in their cache. While this equipment has been tried and tested in the field, there are numerous examples in which new technologies like deeply embedded sensors, adhoc and delay tolerant networking, energy effi- cient communication, high capacity storage devices and so- cial networking can make a significant impact. Some of these technologies have not been considered robust enough unless deployed by a military/government contractor until recently, when the US Army announced that it plans to adopt com- mercially available hardware (e.g., iPhones) for combat [4]. Preliminary goals (requirements) for AnonNet, obtained in consultation with US&R responders are to enable the dis- covery of victims under the rubble of collapsed buildings in a timely manner (unlike several days in Japan), to deliver physiological data from victims to specialized personnel in an energy efficient manner and ontime (unlike in Haiti), to enable responders with access to services in the cloud, over a delay tolerant network, to deliver large amounts of data from field, to the Command & Control Center (C2), in an energy efficient manner so that AnonNet can operate entirely off batteries for 10-14 days. AnonNet’s sensing is focused on collapsed buildings and emergency responders. AnonNet’s networking is focused on energy efficient and reliable deliv- ery of large amounts of data over a multitude of networking technologies, including victims’ physiological data. We propose AnonNet, a second generation wireless sen- sor, adhoc and delay tolerant network system for disaster re- sponse. Thousands of sensor networks, equipped with vi- bration and acoustic sensors, are deployed over all collapsed buildings, continuously monitoring them for potential sur- vivors under the rubble. Buildings surveyed by US&R re- sponders are digitally tagged, allowing for fast, reliable and inexpensive high resolution data collection and situational awareness. Teams of responders are equipped with mo- bile computing devices, warning the team members when they dangerously separate from their team, and providing the team members access to services in the cloud. Data and gen- erated events in the field are relayed over an open standard delay tolerant network to the Command and Control (C2). Strategically placed data waypoints allow for high through- put, energy efficient delivery of massive amounts of data. The entire AnonNet runs on batteries, as US&R emergency responders learned is necessary, during Hurricane Katrina. More precisely, the contributions of our paper are as follows: • To the best of our knowledge, we present the first design and implementation of a complex system (i.e., sens- ing, networking, data management) for emergency re- sponse that addresses US&R responder requirements and is evaluated in a realistic environment. • Development of sensing modality that allows continu- 1
Transcript of A Wireless Sensor, AdHoc and Delay Tolerant Network System for

A Wireless Sensor, AdHoc and Delay Tolerant Network System forDisaster Response
H. Chenji, A. Hassanzadeh, M. Won, Y. Li†, W. Zhang, X. Yang, R. Stoleru, G. Zhou†
Department of Computer Science and Engineering, Texas A&M University†Department of Computer Science, College of William and Mary
AbstractThis paper presents AnonymousNet (AnonNet), a sys-
tem for emergency response in large scale disaster areas,e.g., earthquake and tsunami in Japan (2011) and earthquakein Haiti (2010). Despite the attention the “emergency re-sponse” application area has received, we still lack data atthe high spatial and temporal resolution needed to save lives,and to support disaster recovery efforts. Disaster victimsare rescued after days, if not weeks; victims’ physiologi-cal information is not delivered reliably on time; good co-ordination among responders is lacking, or it is based onarchaic methods (pencil, paper, paint on walls); the delayin receiving vast amounts of information is bounded by thetime used to physically transport tapes or hard drives; andno sensing/communication system built and deployed lastsmore than a few days. AnonNet, designed in collaborationwith US&R responders, is a first step to address these chal-lenges. It is designed to aid in identifying victims under col-lapsed buildings, deliver victims’ physiological informationon time, deliver high volumes of field data at high through-put and in an energy efficient manner, and integrates newsocial networking paradigms. AnonNet is a large academiceffort, proposing open systems, instead of proprietary solu-tions. AnonNet and its subsystems are evaluated in real de-ployments and simulations.1 Introduction
Disasters, natural or man made, are unexpected eventsthat cause significant distress and havoc on a global scale.The best that can be done in the face of such uncontrollableacts of nature is speedy and effective recovery. Recent dis-asters in Japan and Haiti [1, 2] have shown the effect thatthey can have on people, property, and the economy. Reper-cussions include, but are not limited to shortage of electricpower, food, potable water, protection from the elements ofnuclear and/or chemical hazards. In such situations, disasterresponse becomes increasingly difficult and constrained.
Several countries have set up governmental agencies todeal with such disasters, such as the Urban Search & Res-cue (US&R), an agency part of FEMA [3] in US. SeveralTask Forces comprising of trained personnel and specializedequipment have been deployed by FEMA in the event of suchdisasters. From our collaborations with US&R responders,we are keenly aware of the 66 tons of equipment emergencyresponders maintain in their cache. While this equipmenthas been tried and tested in the field, there are numerousexamples in which new technologies like deeply embeddedsensors, adhoc and delay tolerant networking, energy effi-
cient communication, high capacity storage devices and so-cial networking can make a significant impact. Some of thesetechnologies have not been considered robust enough unlessdeployed by a military/government contractor until recently,when the US Army announced that it plans to adopt com-mercially available hardware (e.g., iPhones) for combat [4].
Preliminary goals (requirements) for AnonNet, obtainedin consultation with US&R responders are to enable the dis-covery of victims under the rubble of collapsed buildings ina timely manner (unlike several days in Japan), to deliverphysiological data from victims to specialized personnel inan energy efficient manner and ontime (unlike in Haiti), toenable responders with access to services in the cloud, overa delay tolerant network, to deliver large amounts of datafrom field, to the Command & Control Center (C2), in anenergy efficient manner so that AnonNet can operate entirelyoff batteries for 10-14 days. AnonNet’s sensing is focused oncollapsed buildings and emergency responders. AnonNet’snetworking is focused on energy efficient and reliable deliv-ery of large amounts of data over a multitude of networkingtechnologies, including victims’ physiological data.
We propose AnonNet, a second generation wireless sen-sor, adhoc and delay tolerant network system for disaster re-sponse. Thousands of sensor networks, equipped with vi-bration and acoustic sensors, are deployed over all collapsedbuildings, continuously monitoring them for potential sur-vivors under the rubble. Buildings surveyed by US&R re-sponders are digitally tagged, allowing for fast, reliable andinexpensive high resolution data collection and situationalawareness. Teams of responders are equipped with mo-bile computing devices, warning the team members whenthey dangerously separate from their team, and providing theteam members access to services in the cloud. Data and gen-erated events in the field are relayed over an open standarddelay tolerant network to the Command and Control (C2).Strategically placed data waypoints allow for high through-put, energy efficient delivery of massive amounts of data.The entire AnonNet runs on batteries, as US&R emergencyresponders learned is necessary, during Hurricane Katrina.More precisely, the contributions of our paper are as follows:
• To the best of our knowledge, we present the first designand implementation of a complex system (i.e., sens-ing, networking, data management) for emergency re-sponse that addresses US&R responder requirementsand is evaluated in a realistic environment.
• Development of sensing modality that allows continu-
1

ous monitoring of a large number of collapsed build-ings for survivors, in stark contrast with today’s state ofart, requiring responders to be physically present in thefield, and requiring no noisy activity, interfering withtheir acoustic monitoring.
• Development of networking analysis for energy effi-cient delivery of physiological data, with soft real-timeguarantees, over heterogeneous wireless networks.
• High throughput data dissemination and energy effi-cient management of data, communicated over hetero-geneous networks involving delay tolerant, WiFi, mesh,802.15.4 technologies.
2 Motivating Scenario and State of ArtOur motivating scenario is a large scale disaster (e.g., en-
tire cities/regions are affected) and not a local, block-wideemergency in a city or a town. Unfortunately, recent historygives a few motivating examples, e.g., the earthquake andtsunami in Japan [1], and the earthquake in Haiti [2]. In theseincidents, the communication infrastructure is disrupted (i.e.,cellular networks are completely or partially damaged, satel-lite networks are overloaded) for weeks if not months, thereare serious shortages of power (i.e., local power utilities - nu-clear reactor, are damaged), surveying the disaster area forsurvivors under the rubble takes from days to weeks (withsome inspiring examples of survivors emerging after tens ofdays), large areas are set up for triage of victims, the C2is flooded with sensing and multimedia data from the field.This febrile, fast pace environment lasts from one to severalweeks, until the infrastructure is being repaired.
2.1 State of ArtA mandated and standardized equipment list for FEMA
US&R teams is available online [5]. Each task force main-tains its own cache, containing over 16,000 items. The tech-nical equipment details Project 25 (P25) [6] compatible 2way portable wireless radios. A 120V AC powered base sta-tion is also mentioned, along with battery powered repeaters.Such radio systems have a large radio range capable of cov-ering large areas and are securely encrypted. However, onlyvoice and data channels are available on such systems at verylow data rates of 9.6kbps [7]. Since the P25 systems definesa physical as well as a MAC layer, it is difficult to integrateprotocols meant for low power wireless like 802.15.4 (hence-forth referred to as 15.4). Although reliable real time longrange secure communication systems like Project 25 exist,they have several caveats like cost, difficult integration withother systems, high power requirements, physical bulk.
Seismic sensing has been used alongside WSNs to pre-dict volcano activity [8], perform intrusion detection basedon footstep detection [9, 10] and heritage building moni-toring [11]. In [12], seismic data is analyzed both in thetime and frequency domain. A method to differentiate walk-ing footsteps from running is also presented, based on theFourier Transform technique. Techniques involving the sam-pling and processing of seismic data are the focus of researchin home intrusion detection systems and military area moni-toring.
The Wireless Internet Information System for Medical
Response in Disasters (WIISARD) [13, 14] is a 802.11 basedwireless mesh network (WMN) tailored to provide effectivemedical response in the event of a disaster. Mobile clientslike PDAs and laptops roam around the geographical areawhile being connected to the Internet via multiple backhaulconnections [15]. Digital tags on patients [16] are read bymedical personnel using PDAs. Changes to such digitalrecords are tracked and can be easily rolled back in caseof conflict due to multiple simultaneous editing. It is to benoted that network connectivity is assumed to be persistentand highly available.
Body sensor networks (BSN) are used for timely, reli-able reporting of physiological and behavioral informationof victims in a disaster. Throughput and time delay perfor-mance assurance is needed over heterogeneous sensing andcommunication hardware and software platforms. In [17],the authors propose or extend specific MAC protocols andradio platforms for providing statistical throughput and/ortime delay performance assurance. [18] presents adaptiveand radio-agnostic QoS solutions for BSN but do not con-sider joint throughput and time delay performance assurance.[19] guarantees different throughputs but only a single timedelay bound for different BSN data streams. This solution isalso based on a costly individual polling scheme, with 50+%overhead, rather than a more effective group polling scheme[18] [20]. Although [20] provides both throughput and timedelay performance assurance, it neglects the analysis of en-ergy consumption in a two hop setup where sensor data isaggregated over 15.4 by a battery powered device like a cell-phone and is delivered to the cloud over 802.11. We pro-pose a model of two-hop data transmission and analyze en-ergy consumption minimization opportunities, by reducingthe packet size.
We draw upon a large body of research experiences inthe field of delay tolerant networking (DTN). [21] advocatesthe use of DTN to provide situational awareness in a disaster.The proposed system provides elementary social networkingby helping victims disseminate information while not over-whelming the system. Dieselnet and the DOME testbed [22]provide rich information about implementing routing pro-tocols, providing services and a public DTN testbed us-ing WiFi devices mounted on buses covering a large area.In [23], data is collected from sensors deployed in a wildlifetracking environment leveraging the frequent movement ofzoologists and scientists in the area.
Project RESCUE [24] provides an overview of a WMNfor effective emergency response. [25, 26] argues for aWMN to be used in disaster response. It cites several short-comings in several real use cases which provide a baselinecomparison to such systems. In [27], a hybrid WMN makesuse of wireless WANs as a backhaul link to access traditionalnetworks. Several portable networked devices make use ofrouters affixed to lamp posts in order to achieve network con-nectivity. The SAFIRE project [28] deals with situationalawareness for firefighters. Among the many problems dealtwith are reliable data dissemination over adhoc networks.Responders use a WiFi enabled tablet which uses a centralpush-pull method of data movement. The intended purposeis for use in a local emergency, and not a region wide dis-
2

Vehicle Node8
02
.11
me
sh
C2C
Triage
DB
V
SData Waypoint Seismic Node
Smart PhonesBSN
Rubble Pile →
← Vibration Sensor
↗
Sensors (BTags)↗ ↗
↗
V
Btag Node
Vehicle Node
Mesh Routers↗ ↗
Body Sensors↖↑↗
Z
Base
Station↗
Figure 1. AnonNet architecture
aster. [29] has commercial offerings which accomplish net-work centric warfare. Based on the limited details available,the system offers robust middleware based on 802.11 and/orWiMax based networking. To the best of our knowledge,these systems assume an AC powered connected networkand do not offer integration of low power smart devices.
The problem of intelligent placement of relays to im-prove the performance of mobile DTNs have been stud-ied [30, 31, 32, 33]. [30] presents a scheme to deploy re-lays, called throwboxes, in mobile DTNs to maximize datarate between mobile nodes. [32] studies the hardware ar-chitecture for such relay nodes in an attempt to increase thelifetime. In [33], analysis on the performance of differentrelay strategies is presented. [31] later considers other typesof infrastructures such as mesh networks and provide cost-performance trade-offs. In this paper, we deal with a slightlydifferent problem where instead of maximizing the data ratebetween mobile nodes, we focus on optimizing the through-put of data delivered to the C2. This objective is based on anobservation that no matter how high a data rate a mobile nodehas, limited vehicle movement bounds the possible through-put, and hence, the amount of unique data passed to a vehiclehas to be maximized.
Sink election is an important primitive in AnonNet. Mostof the early research in this area propose single sink solu-tions for wireless sensor networks. Such solutions assumethat sink is always fixed and concentrate on delay and en-ergy consumption [34]. However, for our large scale appli-cation domain, this imposes drastic data latency and powerconsumption requirements. On the other hand, the positionof sinks must be changed depending on the traffic pattern.In [35], sink repositioning is proposed to maximize the net-work life time. Other recent research like [36], finds optimalpositions for the sinks in large scale sensor networks.
3 AnonNet ArchitectureThe AnonNet architecture is shown in Figure 1. Broadly,
there are four classes of devices:Monitoring/Sensing These are typically comprised of lowpower sensors, or sensors provided by third parties. Thedata sensed may be either time critical or informational. Be-ing heavily duty cycled, they are designed to last for severalweeks with a single charge. 802.11 support is rarely found onthese devices, with 15.4 or no networking being more com-mon.End User Interactive Devices Smartphones and popular
network centric consumer electronics like tablet PCs whichhave networking capabilities. These provide a rich interfaceto the data collected in the field, while also providing somefunctionality themselves. Not as resource constrained as thesensors to warrant 15.4, most devices have 802.11 capabilityand are designed to last a few days on a single charge.Network Backbone Non-interactive devices which providebasic networking functionality and are deployed in the field.An example is a common 802.11 router found in most homestoday. They can be assumed to have expansion ports to pro-vide additional functionality like persistent storage or cellu-lar connectivity. They consume a little more power and needto be powered by batteries, but are still portable. These caneither be static or deployed inside a vehicle. In AnonNet,these devices are the only ones implementing delay tolerantcapabilities and act as a middleman between sensed data andC2.Fixed Mesh Technically a subset of the network backbone,the fixed mesh comprises a C2 as well as the surroundinggeographical area to a small extent. This region typicallyhas a medical triage area as well as internet connectivitythrough terrestrial networks. Electric power usually comesfrom diesel generators and can be used to power routers andservers.
Table 1. AnonNet ComponentsComponent Software Class Hardware Class
BTag Sensor w/ UDP MonitoringSeismic Sensor Sensor w/ UDP SensingBody Sensor Sensor w/ TinyOS AM SensingSmartphone Smartphone End User DeviceVehicle Node DTN Router, w/ 15.4 Network BackboneData Waypoint DTN Router, w/o 15.4 Network BackboneSeismic Node DTN Router, w/ 15.4 Network BackboneBTag Node DTN Router, w/ 15.4 Network BackboneMesh Router Mesh Router Fixed Mesh
Base Station DTN/Mesh Router, w/o15.4
Network Backbone,Fixed Mesh
Extenders Mesh Router w/ IBSS Network Backbone
An explicit list of AnonNet components is shown in Ta-ble 1. BTag, which stands for BuildingTag is a 15.4 basedmonitoring device which is intended to be attached to build-ings externally. A BTag can have a dedicated BTag Nodewhich aggregates multiple buildings, or it can do the aggre-
3
UDP
IPv6
Hydro
AM
Messaging
Signal
Processing
802.15.4 (TDMA)Sensor
Drivers
Hardware (epic mote)
BTag Sink Election
BSN Client
Sensing
Applications Localization
(a)
UDP/TCP
IPv4,v6
Localization
802.11 a/b/g (2.4 GHz)
(A)-GPS,
Camera
Driver
Hardware
(Ipod Touch/Tablet/Smartphone)
BTag
App
Separation
Detection App
Social
Networking
App
Applications
(b)
UDP
IPv6
Hydro
AM
Mess
aging
802.15.4
Hardware (Netgear WNDR3700)
DTN-
Zigbee
Proxy
Applications DTN-
802.11
Proxy
Data Waypoint
Client
TCP/UDP
IPv4/6 and OLSR
802.11 abgn
DTN Bundle Server
NTP, Logging, OLSRd
(c)
Hardware (Netgear WNDR3700)
DHCP ServerBSN Aggregator
TCP/UDP
IPv4/6 and OLSR
802.11 abgn
NTP, Logging, OLSRd
(d)
Figure 2. AnonNet software architecture of (a) sensors; (b) mobile computing devices; (c) DTN router; (d) mesh router.
gation itself. In the latter case, they upload their data to Ve-hicle Nodes in their vicinity. Smartphones can be used to getand set BTags via any router with a 15.4 interface. SeismicSensors are an example of a third party IP-incapable device.IP capable motes query the seismic sensor and transmit thedata to a nearby Seismic Node. Body Sensors are 15.4 de-vices which sense physiological data and send it to a 802.11capable aggregator, which is typically a smartphone.
Vehicle Nodes, BTag Nodes, Seismic Nodes and DataWaypoints are battery powered DTN capable routers. Onlythe Data Waypoint does not have a 15.4 interface since itinstead has a large persistent data store. Upon receiving datafrom sensors, these routers convey the data in a DTN capableformat to the Base Station. The Base Station is a specialrouter that has both DTN as well as mesh capabilities. Alldata in the field is aggregated at the Base Station.
An Extender is a special kind of router that is cheaper,energy efficient due to duty cycling, has fewer capabilities(802.11bg only as opposed to 802.11abgn “bang” routers)including limited storage and computation). They are meantpurely for extending the service range of DTN routers in thefield. A typical use case would be that of a team of S&Rpersonnel wishing to deploy a BSN in a location that is notwithin range of the nearest DTN router. In such cases, thesesimple Extenders can act as a proxy between the BSN andthe DTN router using 802.11 networking.3.1 Software Architecture
Devices in AnonNet fall into four broad device categoriesof sensors, smartphones, DTN routers and mesh routers asshown in Figure 2.3.1.1 Sensing & Applications
Applications are deployed on end user devices as apps(various apps in Figure 2(b)) and on the sensors in AnonNet(sensing, sink election in Figure 2(a)). All the applicationscan either use their own data format or use a public schemaas the network is payload agnostic. In case they need touse DTN capabilities, they have to use a DTN proxy withinrange. A reverse proxy (which is also a DTN app) at thedestination converts the DTN format to an application nativeformat. In this way, third party applications can be easily in-tegrated since (reverse) proxy servers can be configured witha predetermined port number assigned in the system to a par-ticular application.
In case the third party application does not support IP ornetworking, there are several choices: it can proxy the data
via a mote running IP using on board interfaces like a serialport, or it can connect directly to the router itself via USB orany available interface.3.1.2 Networking & Data Management
The network architecture spans multiple protocols at alllayers of the network stack. The dominant stack used is802.11abgn in IBSS mode below IP/UDP (Figures 2(c) 2(d),and 2(b)). Since sensors use 802.15.4, an edge router or agateway is needed before the data can reach traditional net-works. This conversion happens in the Network Backbonehardware class of devices where 802.15.4 capable routers(Figure 2(c)) act as a proxy between sensors and 802.11 de-vices. Smartphones which are 802.11 capable can commu-nicate with each other in IBSS mode and also with 802.15.4devices via proxies. 15.4 devices need not have an IP basedstack, but a compatible interface needs to be available on thecorresponding router.
DTN is implemented as an overlay network in the appli-cation layer solely on DTN routers (Bundle server in Fig-ure 2(c)). Each DTN compliant device has a local serverto whom DTN “apps” (Data Waypoint client in Figure 2(c))can attach via a local API. In AnonNet, these apps can act asproxies and present a DTN interface to smartphones (“DTNIP Proxy” in Figure 2(c)) and 802.15.4 devices (”DTN802.15.4 Proxy” in Figure 2(c)). When such devices requestdata to be sent over DTN, the proxy enqueues the data in thelocal server queue. When a suitable neighbor is found in thefuture, either directly or via delay tolerant routing, the datais sent.
The fixed mesh operates as a regular WMN. The routersforming this network are not DTN capable (except the BaseStation). Services provided by these devices include DHCP(”DHCP Server” in Figure 2(d)) and BSN aggregator capa-bilities which aggregates data from BSN clients on motes.4 AnonNet Sensing and Apps Design4.1 Building Sensing Networks
The FEMA US&R equipment cache list [5] mentionsDelsar Life Detection sensors. These sensors are used byresponders to probe a rubble pile for victims and/or signsof life. A steel spike is driven into rubble or a magneticbox attaches the sensor to metallic rubble. Responders canthen monitor the pile for human voices or vibrations causedby victims knocking on surrounding objects. Based on thestrength of these vibrations, the responder can know howdeep or shallow the victim is within the pile. Upon taking
4
multiple measurements at different places, the victim can belocalized and rescue operations can commence. These LifeDetectors have been incorporated into AnonNet. Since theydo not have any native networking capabilities, EPIC motesare used to provide an interface. The onboard ADC samplesthe seismic sensor, which is then processed to yield usefuldata.
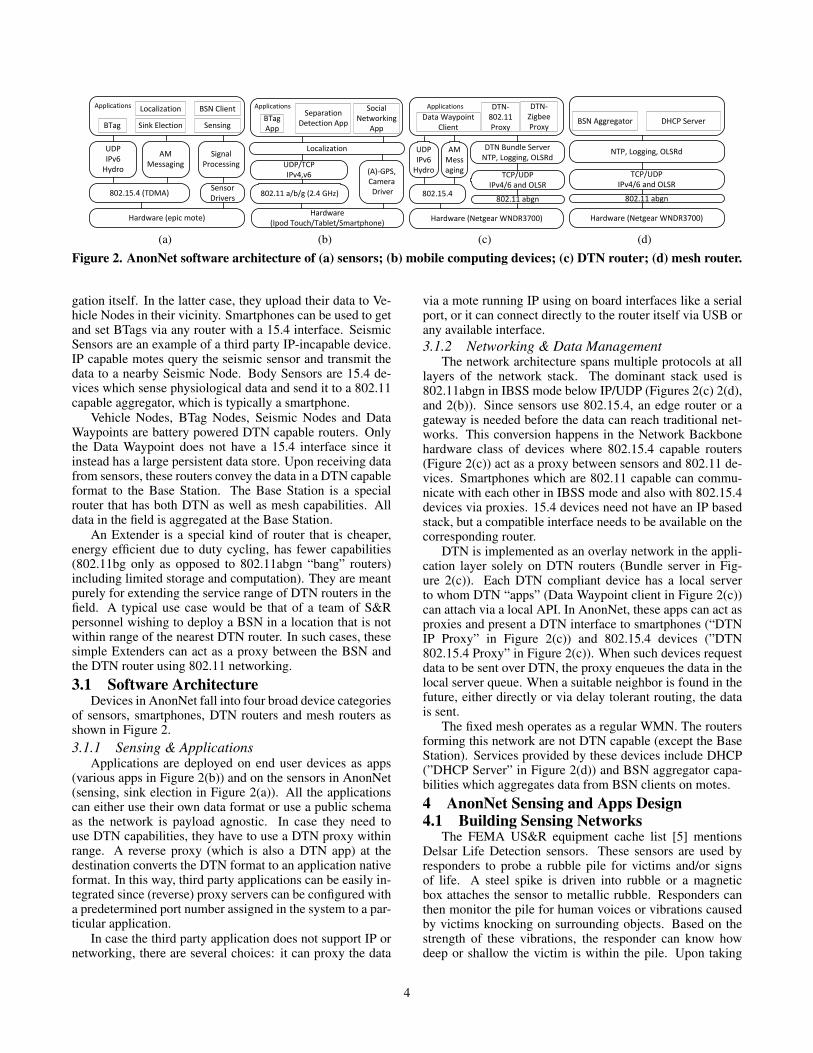
A victim trapped under a rubble pile may attempt toknock or pound on walls or use small objects like stones todo the same. These events need to be detected effectively.However, there are sources of noise in a disaster area whichare also picked up by the seismic sensor. Common sources ofnoise include footsteps and vibration caused by moving ve-hicles. To garner knowledge of these different types of dataand their intrinsic properties, we gathered a few samples us-ing these motes outdoors. The steel spike of the sensor wasdriven into a small wedge in a pavement outside our buildingon campus. Three sources of data were profiled: a stone dropfrom a height, footsteps of pedestrians and a knock madeby a hammer on a pavement. After sampling the vibrationcaused by these events using the mote, fixed-point in-place1024-bin FFT was performed. This knowledge of the spec-trum is essential for classifying these events as shown below.The eventual goal of using classification is to separate usefuldata like a knock made by a victim from a source of noiselike footsteps caused by movement in the area with high ac-curacy.
Both the raw signal and the FFT data for one sampleof each type of event is shown in Figure 3. A stone whendropped from a height tends to bounce and create vibrationsonce more - this is why we see multiple activity in Fig-ure 3(a)(top). It is important to note that amplitude alonecannot be used to classify a signal; the same stone droppedfrom a different height on the same point causes a signal withdifferent (which is not shown here for compactness). Twofeatures which best represent the data numerically were cho-sen: (i) average value of the frequencies weighted by theirrespective amplitudes and (ii) the mean amplitude of the fre-quencies. In Figure 3(d) we can see how these simple fea-tures cause the data to fall into different clusters.
We then design a simple feature based KNN (k-nearestneighbor) classifier to differentiate between the types of data.This choice is motivated by the fact that classification has tobe done on a Seismic Node which is a battery powered routerand hence resource constrained. Suppose that we have g dif-ferent types of data G1 . . .Gg. For each group, we have nsamples which makes for a total of gn samples s1 . . .sgn. Leteach sample be a vector consisting of (for simplicity), twofeatures [ f1, f2]. The KNN classifier first needs to be trainedusing these samples. Training consists of storing each sam-ple and its corresponding group in memory. Now, givena new sample S = [F1F2] that needs to be classified, Algo-rithm 1 explains the working of a Euclidean distance based,k nearest neighbor classifier which calculates the group Gthat S belongs to.4.1.1 Building Tags
Building Tags are low power devices which managemetadata related to a building from a search and rescue view-point. Data includes but are not limited to the last date/time it
0 5
10 15 20 25 30 35 40
0 100 200 300 400 500
Am
plit
ud
e
FFT Bin
0
500
1000
1500
2000
2500
3000
Am
plit
ud
e
(a)
0 2 4 6 8
10 12
0 100 200 300 400 500
Am
plit
ud
e
FFT Bin
600 800
1000 1200 1400 1600 1800 2000 2200 2400 2600
Am
plit
ud
e
(b)
0 5
10 15 20 25 30
0 100 200 300 400 500
Am
plit
ud
e
FFT Bin
0
500
1000
1500
2000
2500
3000
Am
plit
ud
e
(c)
3.5
4
4.5
5
5.5
6
6.5
60 70 80 90 100 110 120 130 140
Fe
atu
re 2
Feature 1
HammerFootstep
Stone
(d)
Figure 3. Spectrum and signal of (a) stone drop (b) foot-step (c) hammer strike. (d) shows the classifier resultsbased on 2 features
Algorithm 1 k-NN Classifier
1: for each si ∈ s1 . . .sgn do
2: Compute di←√
(F1− s f1i )2 +(F2− s f2
i )2
3: end for4: r1 . . .rk ← The k smallest di5: groups← Union of groups that each of r1 . . .rk belong to6: G← most common group in groups
was searched for survivors, any possible hazards inside andthe number of survivors present. This data is most likelyto remain constant and not change very often. For the pur-poses of saving energy and choosing an aggregator who ismost likely to encounter a vehicle node, these tags performsink election. Such aggregation by a sink ensures that nodeswhich may not have a LoS to a nearby road can still commu-nicate its data to the base station efficiently. These tags arefirst programmed by search and rescue personnel once thesearch is complete, by using the “BTag App” (Figure 2(b)).
4.2 US&R Team Separation Detection AppUS&R operations in an unexplored large area with low
visibility and potential hazards (e.g., collapsed tunnel, chem-icals) is dangerous. Members of a S&R team need to ensurethat they are within a safe range from the team leader. Tomeet this need, we develop an iOS application that enableseach team member to monitor the connectivity to a teamleader in real time using an iPod Touch, which then warnsa team member of impending physical separation from theteam leader, using audio-visual means. The design of the al-gorithm and the app saves energy by exchanging messagesonly with its immediate neighbors instead of multi-hop com-munications, eliminating the need for the implementation ofrouting protocols.
This app is inspired by the distributed cut detection algo-rithms [37] which enables each node to autonomously deter-mine the connectivity to a specially designated node calledthe “source node”, say v1, in the network. In these algo-
5
rithms, each node vi maintains a positive scalar s(vi) calledthe “state”. This value is updated at a regular interval byaveraging the scalars s(v j) of immediate neighbors v j ∈ Ni,where Ni is the set of immediate neighbors of node vi. For-mally, the state in the next iteration of the algorithm is com-puted as the following: s(vi) = ∑v j∈Ni
s(v j)
|Ni|+1 . In particular,the source node “injects” a positive constant s′ at each itera-tion of the algorithm. Specifically, the next state of the sourcenode is computed as the following: s(v1) = ∑v j∈N1
s(v j)+s′
|N1|+1 .Consequently, if a node is connected to the source node, itsstate converges to some positive value. On the other hand, ifa node is disconnected from the source node, its state rapidlyconverges to 0, signaling a cut. The nodes that are still con-nected to the source node detect a cut by observing a suddenchange in the converged value.
In our app, a team leader becomes the source node byselecting the appropriate option using the touchscreen basedinterface (screenshot not shown for brevity). This app is notlimited to the separation detection among the team mem-bers: a compatible IBSS capable device attached to expen-sive hardware also runs the cut detection algorithm, allowingteam members to make sure that hardware is not lost. Simul-taneous monitoring of multiple source nodes is supported.Unlike existing solutions that focus only on the “binary prob-lem” (i.e., is there a cut or not?), each member can keep trackof connectivity to multiple team leaders. This feature is use-ful when a team needs to be separated into sub-teams, andteam members need to know the connectivity to each sub-team leader. We implement this by maintaining an array ofstates, each representing the connectivity to correspondingleader. Each state of the array is updated by using the samestate update rule at a regular interval. The set of states arethen encoded in a single packet and broadcast to immediateneighbors. In essence, the support for multiple source nodesis based on overlaying multiple executions of cut detectionprocess for each source node while not increasing the com-munication overhead.
5 AnonNet Networking DesignA 802.11 wireless network is the fundamental net-
working primitive in AnonNet and is present both in thefixed mesh component as well as the field routers. TheWNDR3700 routers used have two wireless interfaces whichprovide 802.11an on the 5GHz band as well as 802.11abgnon the 2.4GHz band. Since most COTS WiFi compliant de-vices support only the 2.4GHz band, we decided to use the5GHz interface exclusively for implementing a mesh back-bone between routers and providing related services. Thisinterface always operates in 802.11 IBSS mode to facilitateeasy neighbor discovery. In the fixed mesh component, the2.4GHz interface broadcasts a WPA encrypted network in in-frastructure mode, whereas an IBSS mode network is broad-cast in the field. This is because the iPods are placed in IBSSmode since they need to communicate with each other withor without a router nearby, and there is no facility to makethem act as a station in infrastructure mode.
Services which are provided on the 5GHz interface areprimarily those which are not needed by end user devices,
like the DTN service (neighbor discovery and the actualtransfer of bundles) and routing. DHCP is provided on2.4GHz interface. All routers have statically assigned IPs- router n has an IP of 192.168.50.n for its 5GHz interfaceand 192.168.n.1 for the 2.4GHz interface. Each router canhandle 255 end user devices - they are assigned IPs in the192.168.n.0/24 range.
Energy Efficiency through duty cycling In our power-constrained application domain, we consider energy effi-ciency as an important issue. A common method is duty-cycling, which saves more power while keeping networkavailability and performance at an acceptable level. How-ever, duty cycling COTS wireless routers is unsupportedand highly hardware and driver dependent. Consequently,we propose to use a simple application layer duty-cyclingscheme as a first approximation. Based on our experiencewith Linksys WRT54GL wireless routers running Open-WRT, turning the radio on and off using the iwcon f ig toolreduces the current drawn by 70mA, while not allowing theestablished IP layer connections to time out. We use thisscheme to save power on Extenders (Table 1) which are es-sentially WRT54GL routers.
5.1 RoutingMesh Routing OLSR (RFC 3626) provides mesh rout-
ing services in AnonNet. It is implemented on all routers- both in the fixed mesh component as well as the networkbackbone component. Using the HNA feature, the local sub-net of 192.168.n.0/24 is advertised, thus allowing every de-vice in the network to talk to all other devices. To illustratethis, a few hypothetical routes on router #10 are providedbelow. The link quality algorithm was “etx ff”, which is anETX (= 1
LQ∗NLQ ) based algorithm that includes a hysteresismechanism to guard against fluctuations in link quality met-rics LQ (Link Quality) and NLQ (Neighbor Link Quality).Hysteresis was disabled since the contact times of 2 DTNnodes in the field is quite less and can cause problems. TheHELLO/TC/MID/HNA intervals were set to 5s,5s,18s,18srespectively.
192.168.50.4 192.168.50.10 wlan1(5GHz)192.168.4.0/24 192.168.50.4 wlan1(5GHz)192.168.10.0/24 192.168.10.1 wlan0(2.4GHz)
Note that an end user device connected to this router with IP192.168.10.24 can talk to its counterpart 192.168.4.25at router #4 via 192.168.10.1 → 192.168.50.10 →192.168.50.4→ 192.168.4.1.
DTN Routing There are several routing protocols specif-ically designed for delay tolerant networks. Node encounterscan be categorized into scheduled and opportunistic encoun-ters. Since scheduled encounters are not very common inAnonNet, we choose to model DTN routing based on op-portunistic encounters. Epidemic routing is a simple schemewhere a copy of each pending bundle is transferred to everynew node encountered. Prophet routing aims to select onlythose nodes which have a high probability of encounteringthe destination. These protocols are implemented within theDTN server itself as a module in user space. Simulations
6

were conducted in order to determine the most suitable rout-ing protocol (Sec. 7).
End User Devices COTS smartphones in general do notallow applications (developed using the offered SDK) to in-sert routes into the kernel for security reasons. Because ofthis limitation, the smartphones used in AnonNet were re-stricted to one hop communication. Data was sent over mul-ticast when a suitable router was within range. The IP proxypresent on the router then encapsulated the data in a bundleand transmitted it via DTN to the base station.
Motes For UDP/IP based sensor devices, the stable ver-sion of the Blip stack based on TinyOS was used. The de-fault routing protocol available, Hydro, was used for multi-hop communication.
5.2 Delay Tolerant NetworksA comprehensive description of motivating factors for a
new delay tolerant architecture can be found in [38] and RFC4838 [39]. Interoperability between devices with heteroge-neous capabilities and functionality is important. Special-ized low power devices should be able to seamlessly inte-grate with other classes of devices, different network stacksnotwithstanding. Since there may exist different types ofdata with different priorities and useful lifetimes, program-matic support for prioritizing data and specifying lifetimesis essential. Nodes may have a combination of many char-acteristics like low energy resources and limited storage ca-pacity. In the event that such nodes find that their resourcerequirements hamper functionality, the node needs to be ableto delegate the responsibility of ensuring data flow to anothersuitable node in the network.
With the above motivation, the Bundle protocol is pre-sented in [40]. The primary data unit is called a “bundle”.Application layer implementation ensures network abstrac-tion. The actual implementation of a DTN gateway will needto have support for “convergence layers” which are essen-tially interfaces to one or more network interfaces present.The custody transfer feature ensures that node can delegateresponsibility to another node. Acknowledgements can berequested either on a per-hop or on an end-to-end basis.
Each DTN node is identified by a special scheme-specificURI like dtn : //dn.zigbeegateway1. Applications whichconnect via the API need to provide an ID like mote1. Thus,any traffic intended for this application will need the des-tination field to be set to dtn : //dn.zigbeegateway1/mote1.Traffic intended for all applications at a node can use the URIdtn : //dn.zigbeegateway1/∗, for example.
5.2.1 Bundle protocolThe proposed Bundle protocol [40] can be seen as a pro-
tocol which implements features outlined above. The pri-mary data unit (PDU) of this protocol is called a bundle. Dif-ferent headers and flags are defined by the RFC which enablefeatures like custody transfer and forwarding. A “BundleProtocol Agent (BPA)” provides bundle services via a ser-vice interface/API. “Application Agents (AA)” connect to aBPA in order to utilize bundle services. Note that the methodof access is not specified - this is how protocol stack trans-parency is effected.
Custody Transfer This is of importance in mobile ad-hoc networks. If ACKing of successful bundle delivery isrequested, a lot of network overhead is generated as thesending node moves further away from the destination oris disconnected. For this purpose, highly mobile nodes cantransfer custody of bundles (originated or relayed) to certainspecial nodes with large storage capacity (data waypoints inAnonNet). These nodes then take responsibility for deliver-ing a bundle to its destination.5.3 Body Sensor Networks
Power efficient sensors placed on victims’ bodies in amedical triage area provide a reliable, low cost victim statusmonitoring solution in the event of a large disaster. In a BSN,multiple simple sensors like body temperature sensors, bloodpressure sensors, and EKG sensors are attached to a victim’sbody. The readings are transmitted to an aggregator (a cellphone in our case) that can be put in a victim’s pocket. Theaggregator consolidates and delivers this data using 802.11facilities in the Fixed Mesh to the intended destination whichcan be a medical cloud service. The victim’s status can bemonitored by a doctor in real-time through the cloud, andtreatment or surgery can be performed by a robot. In thissection, we investigate energy minimization in such scenar-ios while at the same time providing the required throughputand latency performance assurance.
Definitions and Models Consider a two-hop packettransmission communication system based on the bulk pre-ferred TDMA in the first hop and CSMA in the second. Con-sider N simple sensors and a more powerful aggregator inthe first hop, while the second consists of the aggregator andan Access Point (AP) belonging to the Fixed Mesh. Con-cretely, the aggregator delivers data from the sensors to theAP while contending with M− 1 potential contenders overCSMA. Both sensors and aggregator are battery poweredand energy constrained. We first develop analytical modelsfor the energy consumption when communicating over twohops, and finally minimize the overall energy consumption.The notations we use are in Table 2.
Energy Analysis in the First Hop In the first hop, N sen-sors with their priorities try to transmit data to the aggregatorusing TDMA. The priority is used to schedule the access ofeach sensor to the aggregator. For a standard packet trans-mission from a sensor to an aggregator, the aggregator firstpolls the sensor who then attempts to transmit. Since thetransmission/reception of a polling message consumes muchless energy than transmission/reception of data, we neglectpolling energy consumption. Assume that all sensors gener-ate data at an effective rate of b bps, and send it using equalsized packets composed of header and data, of sizes of Sh1and Sd1, respectively. Further, due to wireless phenomenon,the probability of a successful transmission from all sensorsto the aggregator is p1.
The total energy consumed by N sensors, generatingdata at b bps for transmitting packets, under considerationof retransmissions over the time period t is formulated asE11 = ρstt1(Nbt)/(Sd1 p1), where ρst denotes the transmis-sion power consumed by one sensor, t1 = (Sh1 + Sd1)/θ1specifies the average time period for a transmission attempt,N indicates the number of sensors and 1/p1 is the ex-
7

Table 2. NotationsN Number of sensors in the first hopM Number of contenders in the second hopt Time period for test in the modelt1 Average time period for a transmission attempt in the first hopt2t Average time period for a successful transmission without back-
off in the second hopt2i Average idle time period of one packet transmission in the second
hopp1 Possibility of a successful transmission from a sensorp2 Possibility of a successful transmission from an aggregatorb Data generation rate of a sensorSh1 Bit size of a packet header in the first hopSd1 Bit size of effective data of a packet in the first hopSh2 Bit size of a packet header in the second hopSd2 Bit size of effective data of a packet in the second hopρst Transmission power consumed by a sensorρat Transmission power consumed by an aggregatorρar Receiving power consumed by an aggregatorρai Idle power consumed by an aggregatorCW Size of the backoff windowR Maximum number of backoff retriesθ1 Throughput capacity of the first hopθ2 Throughput capacity of the second hopD the whole delay of packets transmission from sensors to AP
pected number of retransmissions needed for a successfuldelivery. The energy consumed by the aggregator for re-ceiving all packets from N sensors with consideration ofretransmissions over a time length of t is formulated asE12 = ρart1(Nbt)/(Sd1 p1), where ρar indicates power con-sumed by the aggregator that receives packets. Therefore,the average power consumed under possible retransmissionsin the first hop is expressed as E1 = E11 + E12 = (ρst +ρar)t1Nbt/(Sd1 p1).
Energy Analysis in the Second Hop In the second hop,one aggregator with other M − 1 potential contenders at-tempts to transmit packets to the AP using CSMA. All con-tenders deliver the same size packets, each of which is alsocomposed of header and data, with bit sizes of Sh2 and Sd2,respectively. The packet transmission bandwidth providedby the aggregator is Nb bps, which means the aggregatordelivers packets with the same transmission rate to that ofall sensors. Using CSMA, the aggregator having a packetto transmit senses the medium. If the channel is idle, ittransmits the packet immediately, else it randomly selectsa time from [0, CW ] as a backoff time counter before trans-mitting, where CW denotes the backoff window size, com-posed of time slots with each tsl = 20µs. The backoff timecounter is decremented as long as the channel is sensed idle,is stopped when a transmission is detected on the channel,and reactivated when the channel is sensed idle again. Itsends packets with a probability of p2 when the backofftime reaches 0 if the channel is clear, otherwise it backsoffagain. If we assume that all collisions are eliminated, the av-erage backoff time of each packet can be approximated byCWtsl/2 ·min{(M−1)/2,R} (i.e., idle time), where R is themaximum number of backoff retries.
We calculate the energy consumption of the aggregatorfor successfully transmitting the whole effective data Nbtfrom N sensors under consideration of retransmissions in thesecond hop over the same time period t is described as E2t =ρatt2t(Nbt)/(Sd2 p2), where ρat indicates the transmissionenergy consumption by the aggregator, t2t = (Sh2 + Sd2)/θ2specifies the average time period for a successful transmis-sion without backoff in the second hop and 1/p2 denotes theexpected number of retransmissions needed for a successfuldelivery.
The energy consumed by the aggregator during theidle period is formulated as E2i = ρait2i(Nbt)/(Sd2 p2),where ρai shows the energy consumption when the aggre-gator is idle due to carrier sensing and t2i = CW · tsl/2 ·min{(M−1)/2,R} specifies the average backoff time periodof one packet transmission. Therefore, the average powerconsumed by one aggregator with states of transmission andidling in the second hop is expressed as E2 = E2t +E2i =(ρatt2t +ρait2i)(Nbt)/(Sd2 p2).
Energy Consumption Minimization As assumed in theprevious sections, we address the problem of how to choosethe size of Sd1 and Sd2 over a time period of t, so that the totalenergy consumption of N sensors and one aggregator in themodel can be minimized in this paper. Therefore, the mini-mization problem of energy consumption can be formulatedas:
minimize E1 +E2 (1)subject to: Nb(Sd1 +Sh1)/(Sd1 p1)≤ θ1 (2)
Nb(Sd2 +Sh2)/(Sd2 p2)≤ θ2 (3)Sd1/b+ t1/p1 +(t2t + t2i)/p2+
+Sd1/(Nb)(Sd2/Sd1−1)≤ D (4)
where θ1 and θ2 denote the throughput capacities of the firstand second hops in Equations 2 and 3, respectively, D speci-fies the whole delay requirement of packet transmission fromsensors to AP in Equation 4. Equation 4 is the packet trans-mission delay constraint, which consists of the time periodneeded for packet generation by a sensor in the first hop, de-livery in two hops and the left packets generation which con-struct a new packet with the delivered packet in the secondhop. It is significant to note that only Sd1 and Sd2 are vari-ables and others are constants, which can be obtained duringimplementation.
6 AnonNet Data Management DesignVehicles are the main data carrier in AnonNet. They
gather data from various data sources such as sensors anddeliver it to the C2. Some vehicles like ambulances go to theC2 more frequently, while there may be some vehicles thatdo not visit C2 for hours. Time is a critical factor in disasterresponse. Thus, US&R operations happen simultaneouslyall round the disaster area, as long as the access to the areais cleared. These operations typically last for days; such pat-terns indicate that we may be able to take advantage of thetraces of vehicles from a previous day in order to improvethe data reception rate at C2.
Using the scenario above, our problem is described as thefollowing. Given a large amount of data generated from var-
8

ious data sources, how can we achieve maximum throughputfrom the field to the C2? Consider two techniques: first, asink for each sub sensor network (e.g., the network of build-ing tags) responsible for handing over the data to the vehiclespassing by must be elected such that the data can be deliv-ered to C2 as quickly as possible (e.g., a sink might prefer todeliver data to the vehicle that more frequently visits the C2).Second, a fixed number of nodes called “data waypoints” areoptimally placed in the disaster area to bridge the data trans-mission between the vehicles that have different frequenciesof visiting the C2. Vehicles which visit the data sources morefrequently drop off data at these waypoins, which then act asa data source to vehicles that visit the C2 more often. Notethat these nodes are not storage databases, but merely a way-point for data which is on its way to the C2.
Assuming that we have the GPS traces of vehicles fromprevious day and locations of deployed sensors and routers,selecting a sink for each sub sensor network and placing datawaypoints can be together formulated as centralized opti-mization problem. When a vehicle (broadcasting beacons)comes within communication range of a sink node, data seg-ment di is received until the vehicle is out of the communica-tion range. A set D = {d1,d2, ...,dn} represents all the datareceived during the operation. For each data segment, t f (di)is the contact time with the vehicle, tc(di) is the flush time(i.e., the time when the data is flushed at C2). s(di) is thesize of data segment di, and the throughput of di is definedas r(di)= s(di)/(t f (di)−tc(di)). Assume that we have n sen-sors in the field, denoted by a set V = {v1, ...,vn}. Each nodevi has residual energy b(vi) and the total number of receivedbeacons c(vi). The set V consists of k sub-sensor networksSi as V = S1∪ ...∪Sk. Each sub-sensor network Si has a sinksi. We denote the set of sinks as a set S = {s1, ...,sn}. Also,a set P = {p1, ..., pn} represents the data waypoints. Nowwe are ready to define the Data Placement Problem (DPP)as follows:
maximize α · ∑di∈D
r(di)+β · ∑si∈S
sc(vi) (5)
subject to: |P| ≤M (6)∀i,Si = /0 (7)∀i,∃si ∈ Si and |S|= k (8)
where sc(vi), the eligibility score of node i to be selectedas sink, is based on sink’s residual energy and the numberof received beacons from vehicles. The parameters α andβ are used to determine the priority between the throughputand the score of a sink. The first constraint (6) means thatthe number of data waypoints are limited by M. The secondconstraint (7) shows that sub sensor network is not empty,and the last constraint (8) means that only a single sink iselected from each sub sensor network. The above problemis NP-Hard by reduction to the facility location problem, butthe proof is omitted due to space constraints.
We separate the throughput maximization (Σdi∈Dr(di))and resource maximization (Σsi∈Ssc(vi)) problems into twooptimization problems and provide sub-optimal solutions forthem in the following sections. We call the former problemas Waypoint Placement Problem and the latter one as SinkSelection Problem.
Algorithm 2 Waypoint Placer
1: while k > 0 do2: for each li ∈ L do3: Place a storage unit at li
(Previously selected storageunits are in positions).
4: Simulate the operation (us-ing GPS traces, or mobilitymodel).
5: Compute Ki← ∑di∈D r(di).6: end for7: Find the largest K j .8: L← L\{l j}.9: k← k−1.
10: end while
Algorithm 3 Sink Election
1: Broadcast (HELLO)2: create (CanT bli,h)3: if fi > f j for all j = i then4: Snki = 15: Broadcast (IAMSINK)6: while Snki = 1 do7: Collect-Pass (DATA)8: end while9: Broadcast (RE-ELECTION)
10: else11: set-sink()12: end if
6.1 Waypoint Placement AlgorithmOur problem is to maximize the aggregate throughput
(i.e., ∑di∈D r(di)) by placing k temporary data holders calledthe storage units, denoted by a set L = {l1, l2, · · · , ln} in thetarget region. We use a greedy algorithm to find the locationsto place k storage units. The algorithm is shown in Algo-rithm 2. The algorithm proceeds by greedily selecting onestorage unit. Once a storage unit is selected, the next storageunits are selected based on an assumption that the previouslyselected storage units are already in position.
6.2 Sink Election AlgorithmGiven a set of n deployed sensor nodes in the disaster
area which attached to the buildings denoted by V = {vi :i = 1 . . .n}, b(vi) is the residual battery charge of node i,and c(vi) is the number of beacons received from vehiclesin the last τ time units. We normalize these two parame-ters by dividing them to maximum battery charge and maxi-mum number of beacons node can receive in τ; that dependson number of vehicles and their beaconing rate. Now, Letsc : V −→ [0,1] be a scoring function that assigns the eligi-bility score to any node i based on c(vi) and b(vi) as two in-dependent events; sc(vi) = c(vi)×b(vi) . The sink selectionproblem can be formulated as the maximization of Σsc(vi)for a set of selected sinks, each of which are at most h hopsfrom any node. This problem is reducible to the k-hop domi-nating set problem and is thus NP-Hard, but the proof is onceagain omitted for reasons of space.
This problem can be solved in a centralized way, wherea powerful central processing node collects all informationabout the nodes and finds the optimal solution. However,because of resource constraints and lack of any base station,we propose a distributed solution for it where nodes electsink nodes to cover all h hops nodes around.
We propose a distributed algorithm which is run by eachsensor node, given a h which is determined pre-deployment.Sensor nodes periodically broadcast HELLO messages in-cluding their node ID, list of one hop neighbors, and theirscore as sci. After receiving HELLO messages, every nodecreates a table, CanT bli,h, of all the nodes within h hops.As shown in Algorithm 3, each node checks whether it hasa higher score than all its h hop neighbors. If it does, thenode broadcasts an IAMSINK message. According to the
9
assumption for maximum hop count, any sensor node willreceive at least one IAMSINK message from h-hop neigh-bors. Sink nodes periodically update their score and compareit with others to see whether they are still a suitable node forbeing a sink or not. In case a sink finds itself an unsuitablecandidate, it broadcasts a RE-ELECTION message to all thenodes and goes to non-sink mode.
7 System Implementation and EvaluationHardware The hardware used in AnonNet includes the
Netgear WNDR3700v1 router, EPIC motes, iPod Touchsand the Linksys WRT54GL which acts as an Extender. TheWNDR3700 at an average cost of 100USD is in our opin-ion the best suited router, mainly because of the dual band802.11 radios (2.4 and 5 Ghz), the support available for anopen operating system (OpenWRT), a USB peripheral portand the comparatively luxurious 8MB of ROM and 64MBof RAM. The USB port can be used to provide excitingfunctionality like a new physical layer such as 802.15.4, en-hanced storage like a USB flash drive or all of them (usinga self powered USB hub). A cellphone can also be “teth-ered” to the router providing it with cellular network access.For implementing DTN functionality, we used the IBR-DTNimplementation which is readily available as a package forOpenWRT. The software ecosystem offered by OpenWRTallowed us to completely customize the router according toour needs, with a variety of available and possible function-ality. Using the widely used iOS SDK, the iPod Touch wascustomized. However, we were limited to the applicationlayer since the SDK does not allow non-trivial modificationsto the operating system for security reasons. The fact that802.11 IBSS mode was readily supported out of the boxmade us choose iOS over Android.
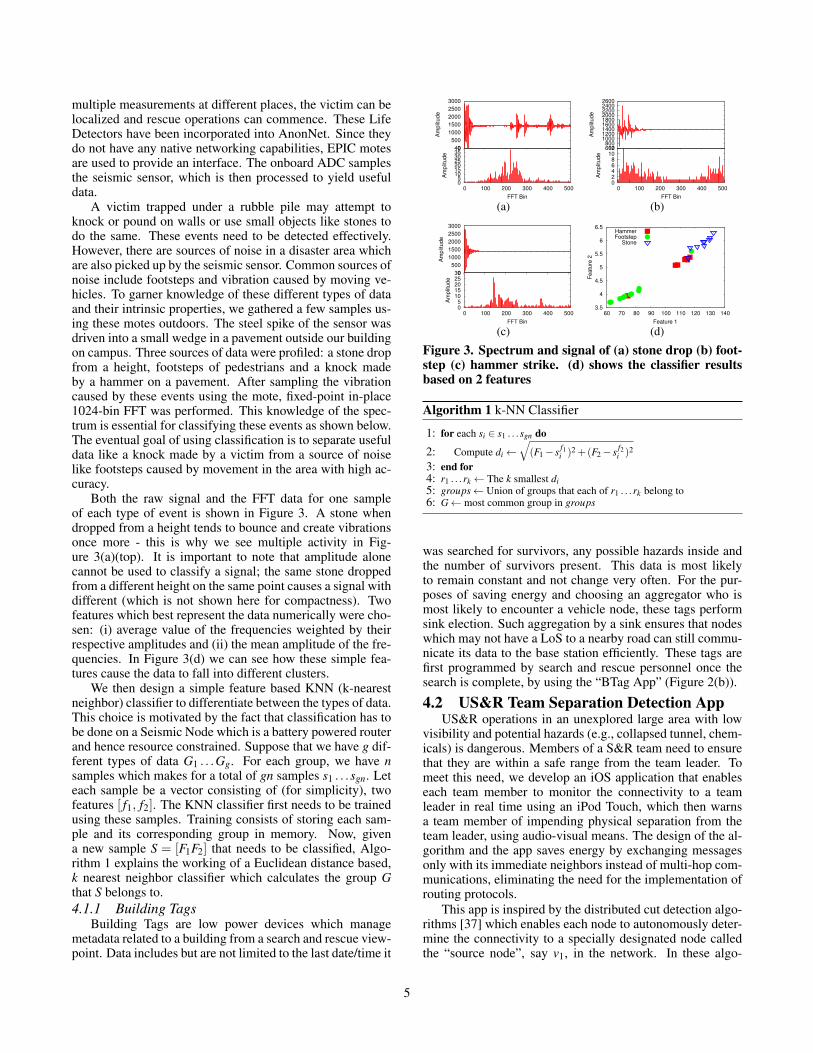
Evaluation AnonNet is a complex wireless, sensor andadhoc network system. In this section we present the per-formance evaluation of the individual components of thesystem, as well as the entire system. AnonNet was eval-uated over a period of 5 days in DisasterNewYork. (Fig-ure 4(a)). DisasterNewYork is a comprehensive 52-acretraining facility for emergency responders with extremely re-alistic wrecks. These include a passenger train wreck, sev-eral rubble piles of wood and concrete, a collapsed parkinglot with automobiles, a collapsed strip mall and a damagedmovie theater. The entire setup ensures a very realistic lifesized replica of a modern disaster.
Simulation Evaluation of such a diverse system consist-ing of mobile nodes by varying scenarios and parameterswith several runs per parameter is extremely labor/cost in-tensive and consumes precious man-hours. Therefore, wedecided to conduct certain experiments using simulation thatis as close to a real scenario as possible. We used the Op-portunistic Network Environment simulator (TheONE) as itmeets our needs for a mobility and networking simulator.Using a digital GIS map of DisasterNewYork and a GIS edit-ing program, routes for the vehicles along with the locationsof other components were designed and used in the simu-lator. All of the simulations described below use the samemobility traces, thus ensuring consistency.
Simulation Setup The entire setup in simulation consists
0
20
40
60
80
100
wood1 wood2 concreteconcrete&mud
Accu
racy (
%)
k=1 k=2 k=3 k=4
(a)
0
50
100
150
200
0 20 40 60 80 100 120 140 160
One
Two
Three
(b)
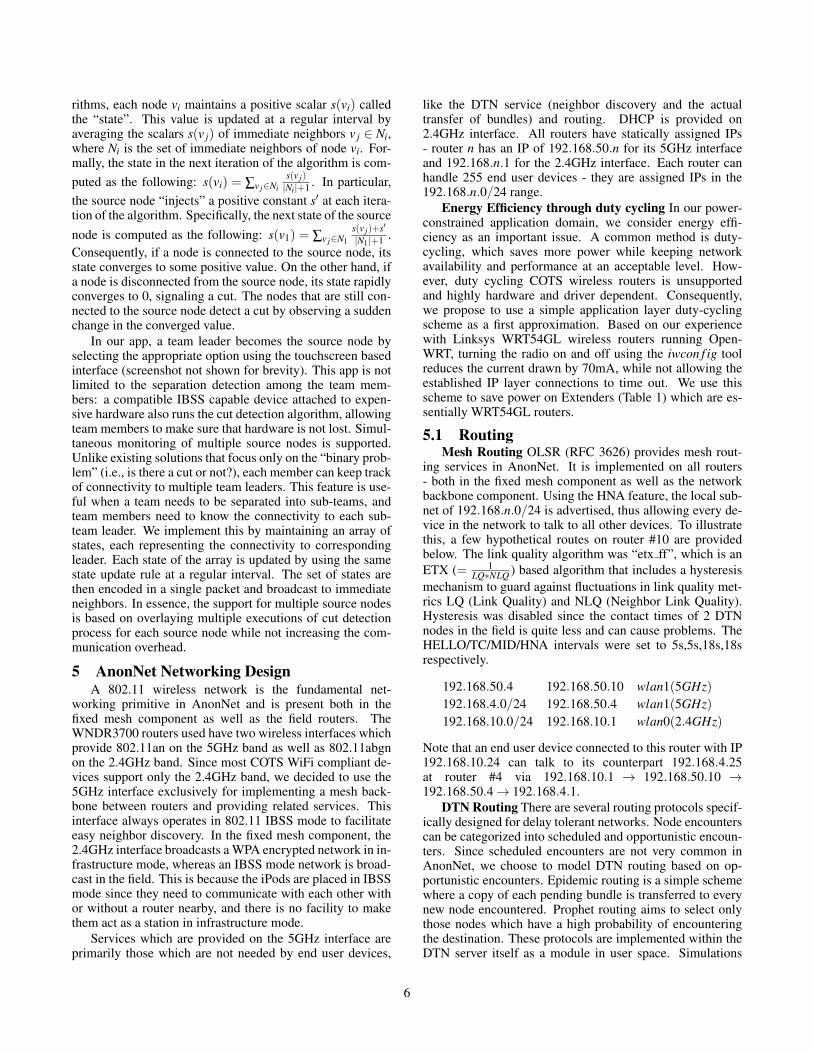
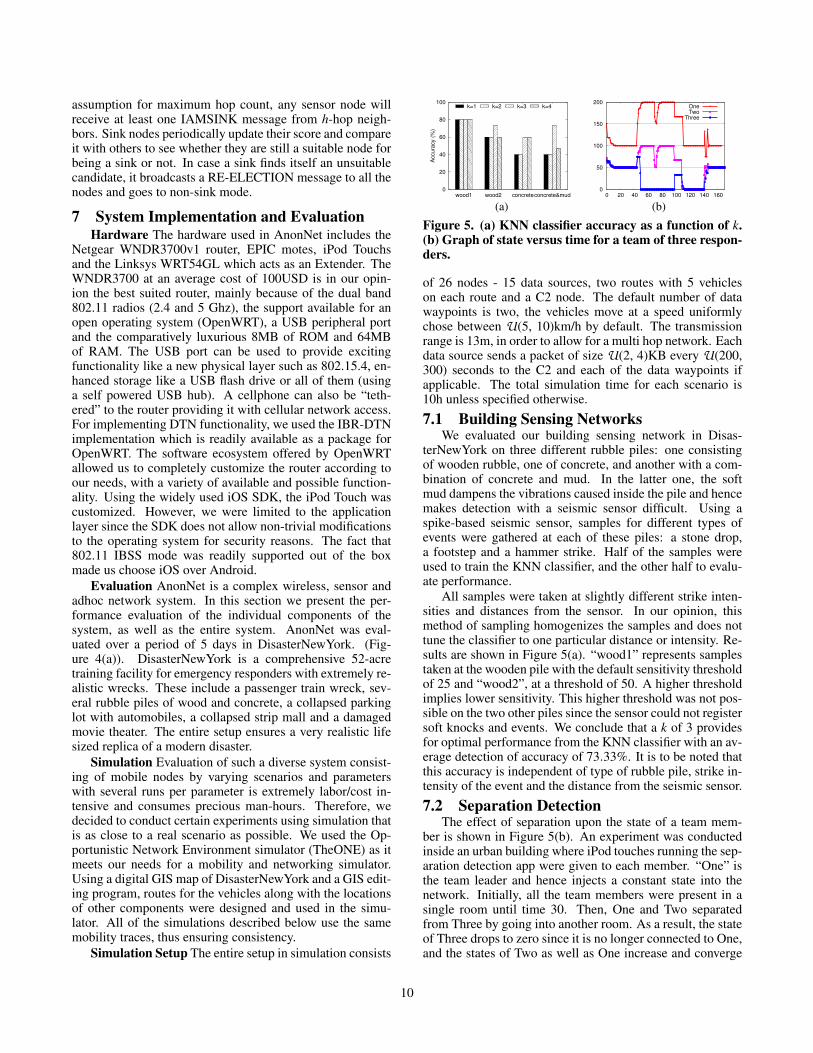
Figure 5. (a) KNN classifier accuracy as a function of k.(b) Graph of state versus time for a team of three respon-ders.
of 26 nodes - 15 data sources, two routes with 5 vehicleson each route and a C2 node. The default number of datawaypoints is two, the vehicles move at a speed uniformlychose between U(5, 10)km/h by default. The transmissionrange is 13m, in order to allow for a multi hop network. Eachdata source sends a packet of size U(2, 4)KB every U(200,300) seconds to the C2 and each of the data waypoints ifapplicable. The total simulation time for each scenario is10h unless specified otherwise.
7.1 Building Sensing NetworksWe evaluated our building sensing network in Disas-
terNewYork on three different rubble piles: one consistingof wooden rubble, one of concrete, and another with a com-bination of concrete and mud. In the latter one, the softmud dampens the vibrations caused inside the pile and hencemakes detection with a seismic sensor difficult. Using aspike-based seismic sensor, samples for different types ofevents were gathered at each of these piles: a stone drop,a footstep and a hammer strike. Half of the samples wereused to train the KNN classifier, and the other half to evalu-ate performance.
All samples were taken at slightly different strike inten-sities and distances from the sensor. In our opinion, thismethod of sampling homogenizes the samples and does nottune the classifier to one particular distance or intensity. Re-sults are shown in Figure 5(a). “wood1” represents samplestaken at the wooden pile with the default sensitivity thresholdof 25 and “wood2”, at a threshold of 50. A higher thresholdimplies lower sensitivity. This higher threshold was not pos-sible on the two other piles since the sensor could not registersoft knocks and events. We conclude that a k of 3 providesfor optimal performance from the KNN classifier with an av-erage detection of accuracy of 73.33%. It is to be noted thatthis accuracy is independent of type of rubble pile, strike in-tensity of the event and the distance from the seismic sensor.
7.2 Separation DetectionThe effect of separation upon the state of a team mem-
ber is shown in Figure 5(b). An experiment was conductedinside an urban building where iPod touches running the sep-aration detection app were given to each member. “One” isthe team leader and hence injects a constant state into thenetwork. Initially, all the team members were present in asingle room until time 30. Then, One and Two separatedfrom Three by going into another room. As a result, the stateof Three drops to zero since it is no longer connected to One,and the states of Two as well as One increase and converge
10
(a) (b) (c)
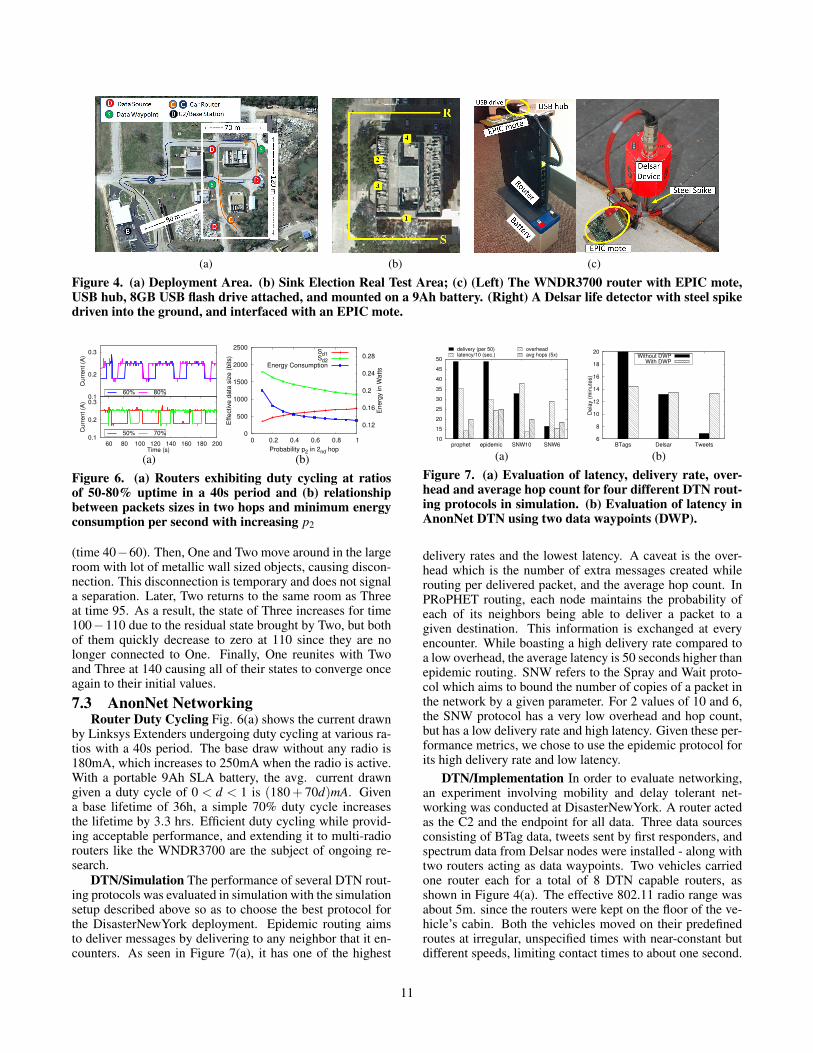
Figure 4. (a) Deployment Area. (b) Sink Election Real Test Area; (c) (Left) The WNDR3700 router with EPIC mote,USB hub, 8GB USB flash drive attached, and mounted on a 9Ah battery. (Right) A Delsar life detector with steel spikedriven into the ground, and interfaced with an EPIC mote.
0.1
0.2
0.3
60 80 100 120 140 160 180 200
Cu
rre
nt
(A)
Time (s)
50% 70%
0.1
0.2
0.3
Cu
rre
nt
(A)
60% 80%
(a)
0
500
1000
1500
2000
2500
0 0.2 0.4 0.6 0.8 1
0.12
0.16
0.2
0.24
0.28
Effective d
ata
siz
e (
bits)
Energ
y in W
atts
Probability p2 in 2nd hop
Sd1Sd2
Energy Consumption
(b)
Figure 6. (a) Routers exhibiting duty cycling at ratiosof 50-80% uptime in a 40s period and (b) relationshipbetween packets sizes in two hops and minimum energyconsumption per second with increasing p2
(time 40−60). Then, One and Two move around in the largeroom with lot of metallic wall sized objects, causing discon-nection. This disconnection is temporary and does not signala separation. Later, Two returns to the same room as Threeat time 95. As a result, the state of Three increases for time100−110 due to the residual state brought by Two, but bothof them quickly decrease to zero at 110 since they are nolonger connected to One. Finally, One reunites with Twoand Three at 140 causing all of their states to converge onceagain to their initial values.
7.3 AnonNet NetworkingRouter Duty Cycling Fig. 6(a) shows the current drawn
by Linksys Extenders undergoing duty cycling at various ra-tios with a 40s period. The base draw without any radio is180mA, which increases to 250mA when the radio is active.With a portable 9Ah SLA battery, the avg. current drawngiven a duty cycle of 0 < d < 1 is (180+ 70d)mA. Givena base lifetime of 36h, a simple 70% duty cycle increasesthe lifetime by 3.3 hrs. Efficient duty cycling while provid-ing acceptable performance, and extending it to multi-radiorouters like the WNDR3700 are the subject of ongoing re-search.
DTN/Simulation The performance of several DTN rout-ing protocols was evaluated in simulation with the simulationsetup described above so as to choose the best protocol forthe DisasterNewYork deployment. Epidemic routing aimsto deliver messages by delivering to any neighbor that it en-counters. As seen in Figure 7(a), it has one of the highest
10
15
20
25
30
35
40
45
50
prophet epidemic SNW10 SNW6
delivery (per 50)latency/10 (sec.)
overheadavg hops (5x)
(a)
6
8
10
12
14
16
18
20
BTags Delsar Tweets
De
lay (
min
ute
s)
Without DWPWith DWP
(b)
Figure 7. (a) Evaluation of latency, delivery rate, over-head and average hop count for four different DTN rout-ing protocols in simulation. (b) Evaluation of latency inAnonNet DTN using two data waypoints (DWP).
delivery rates and the lowest latency. A caveat is the over-head which is the number of extra messages created whilerouting per delivered packet, and the average hop count. InPRoPHET routing, each node maintains the probability ofeach of its neighbors being able to deliver a packet to agiven destination. This information is exchanged at everyencounter. While boasting a high delivery rate compared toa low overhead, the average latency is 50 seconds higher thanepidemic routing. SNW refers to the Spray and Wait proto-col which aims to bound the number of copies of a packet inthe network by a given parameter. For 2 values of 10 and 6,the SNW protocol has a very low overhead and hop count,but has a low delivery rate and high latency. Given these per-formance metrics, we chose to use the epidemic protocol forits high delivery rate and low latency.
DTN/Implementation In order to evaluate networking,an experiment involving mobility and delay tolerant net-working was conducted at DisasterNewYork. A router actedas the C2 and the endpoint for all data. Three data sourcesconsisting of BTag data, tweets sent by first responders, andspectrum data from Delsar nodes were installed - along withtwo routers acting as data waypoints. Two vehicles carriedone router each for a total of 8 DTN capable routers, asshown in Figure 4(a). The effective 802.11 radio range wasabout 5m. since the routers were kept on the floor of the ve-hicle’s cabin. Both the vehicles moved on their predefinedroutes at irregular, unspecified times with near-constant butdifferent speeds, limiting contact times to about one second.
11
None of the vehicles stopped or slowed down near any node.We chose this particular mobility model in order to evalu-ate based on harsh realities and not idealized, predeterminedmovement patterns like in simulations. To record the perfor-mance gain due to intelligent data waypoint placement, threebundles containing identical data was being generated every30 seconds on each of data source nodes - one for the C2, onefor each of the two data waypoints. Our results are presentedin Figure 7(b).
For each stream of data, the end-to-end delay for eachpacket is computed and averaged. On a whole, the pres-ence of data waypoints decreased the latency because pick-ing up data from a fixed DWP is deterministic, while ob-taining the same identical data from another mobile vehiclenode is highly opportunistic. DWPs also ensure that somedata which would have otherwise never made it to the C2 isnow delivered because it is first handed over to a DWP whichthen acts as a data source for other vehicles. For BTags whichwere generated at the node in the bottom left, the presence ofdata waypoints decreases the delay. This can be seen sinceboth DWPs are on the routes of both vehicles. The Delsarsource is similar - since it is situated on a corner, contacttimes are also slightly higher. For tweets generated at thedata source in the bottom, the number of packets receiveddirectly was extremely low because the only route is throughnon-storage routers. Because of this, the few packets thatwere received had a low delay. In conclusion, the presenceof data waypoints improves packet delay on average, in thesense that it helps deliver packets which otherwise wouldnever have reached the C2. A lot of other factors like thetemporal nature of wireless links also play a significant rolein these results.
Body Sensor Networks The optimal packet sizesto ensure minimum energy consumption in a two hopTDMA/CSMA network was investigated using MATLAB.The modeling parameters used [41, 18] were: N =3,ρat = 1.65W,M = 5,ρar = 1.4W, t = 1s,ρai = 1.15W, p1 =80%,CW = 32, p2 = 10% ∼ 100%,R = 5,b = 5kbps,θ1 =250kbps,Sh1 = 88bits,θ2 = 54Mbps,Sh2 = 240bits,D =177ms,ρst = 35mW . It is worth to note that D can meetthe requirement of a mouth-to-ear delay [42]. Based onp2 = 80%, we obtain E = 0.1335W , Sd1 = 690 bits andSd2 = 1205 bits. Fig. 6(b) shows the effect p2 has on E. Weconclude that with increasing successful transmission prob-ability p2, the energy consumption gradually decreases, andSd1 increases while Sd2 reduces. Actual implementation andevaluation of these packet sizes and energy consumption inthe sensing networks of AnonNet is ongoing.7.4 Data Management
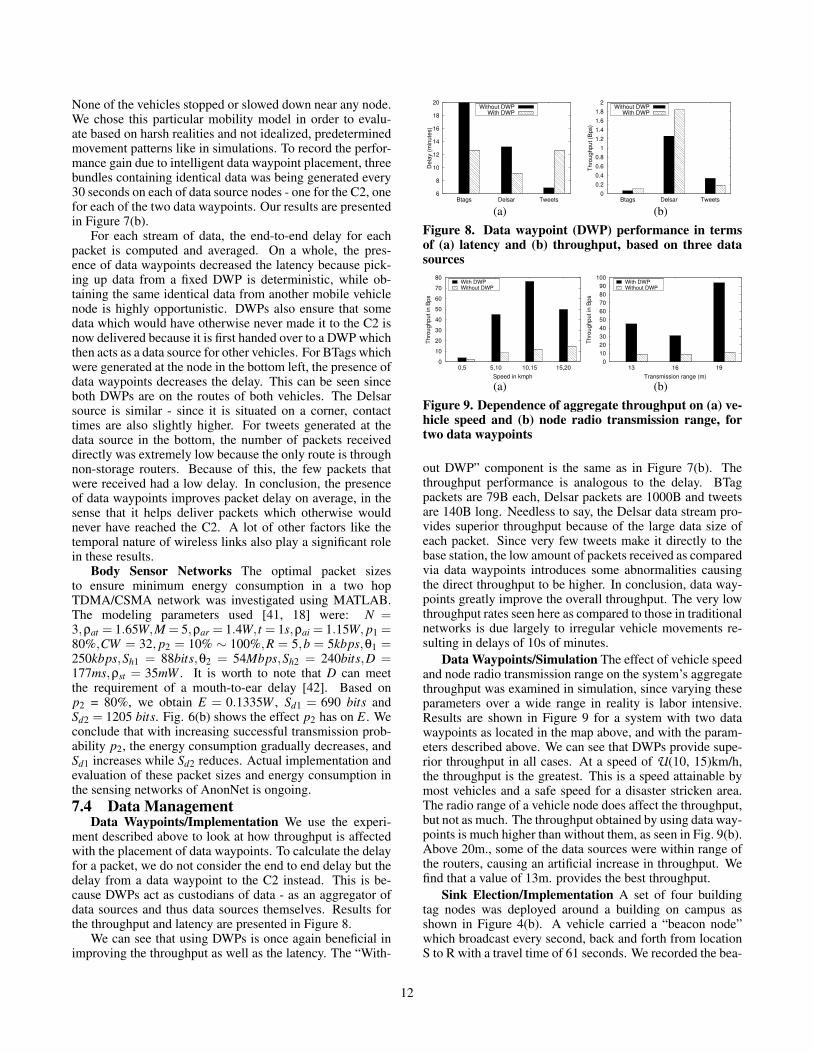
Data Waypoints/Implementation We use the experi-ment described above to look at how throughput is affectedwith the placement of data waypoints. To calculate the delayfor a packet, we do not consider the end to end delay but thedelay from a data waypoint to the C2 instead. This is be-cause DWPs act as custodians of data - as an aggregator ofdata sources and thus data sources themselves. Results forthe throughput and latency are presented in Figure 8.
We can see that using DWPs is once again beneficial inimproving the throughput as well as the latency. The “With-
6
8
10
12
14
16
18
20
�Btags� �Delsar� �Tweets�
De
lay (
min
ute
s)
Without DWPWith DWP
(a)
0
0.2
0.4
0.6
0.8
1
1.2
1.4
1.6
1.8
2
�Btags� �Delsar� �Tweets�
Th
rou
gh
pu
t (B
ps)
Without DWPWith DWP
(b)
Figure 8. Data waypoint (DWP) performance in termsof (a) latency and (b) throughput, based on three datasources
0
10
20
30
40
50
60
70
80
0,5 5,10 10,15 15,20
Th
rou
gh
pu
t in
Bp
s
Speed in kmph
With DWPWithout DWP
(a)
0
10
20
30
40
50
60
70
80
90
100
13 16 19
Th
rou
gh
pu
t in
Bp
s
Transmission range (m)
With DWPWithout DWP
(b)
Figure 9. Dependence of aggregate throughput on (a) ve-hicle speed and (b) node radio transmission range, fortwo data waypoints
out DWP” component is the same as in Figure 7(b). Thethroughput performance is analogous to the delay. BTagpackets are 79B each, Delsar packets are 1000B and tweetsare 140B long. Needless to say, the Delsar data stream pro-vides superior throughput because of the large data size ofeach packet. Since very few tweets make it directly to thebase station, the low amount of packets received as comparedvia data waypoints introduces some abnormalities causingthe direct throughput to be higher. In conclusion, data way-points greatly improve the overall throughput. The very lowthroughput rates seen here as compared to those in traditionalnetworks is due largely to irregular vehicle movements re-sulting in delays of 10s of minutes.
Data Waypoints/Simulation The effect of vehicle speedand node radio transmission range on the system’s aggregatethroughput was examined in simulation, since varying theseparameters over a wide range in reality is labor intensive.Results are shown in Figure 9 for a system with two datawaypoints as located in the map above, and with the param-eters described above. We can see that DWPs provide supe-rior throughput in all cases. At a speed of U(10, 15)km/h,the throughput is the greatest. This is a speed attainable bymost vehicles and a safe speed for a disaster stricken area.The radio range of a vehicle node does affect the throughput,but not as much. The throughput obtained by using data way-points is much higher than without them, as seen in Fig. 9(b).Above 20m., some of the data sources were within range ofthe routers, causing an artificial increase in throughput. Wefind that a value of 13m. provides the best throughput.
Sink Election/Implementation A set of four buildingtag nodes was deployed around a building on campus asshown in Figure 4(b). A vehicle carried a “beacon node”which broadcast every second, back and forth from locationS to R with a travel time of 61 seconds. We recorded the bea-
12

0 0 25 50 75 100 125
No
de
Sta
tus (
Up
: S
ink)
Time (seconds)
Node 1Node 2Node 3Node 4
(a)
0
5
10
15
20
25
0 25 50 75 100 125
Nu
mb
er
of
Re
cvd
. B
ea
co
ns
Time (seconds)
Node 1Node 2Node 3Node 4
(b)
0.1
0.2
0.3
0.4
0.5
5 10 15 20 25
Avg
. C
on
tact
Fra
ctio
n
Avg. Speed [km/h]
SinksNon-Sinks
(c)
0.68
0.7
0.72
0.74
5 10 15 20 25
Avg
. R
esid
ua
l B
att
ery
Avg. Speed [km/h]
SinksNon-Sinks
(d)
Figure 10. Sink election evaluation based on real imple-mentation and simulation
con receiving rate of each node and its elected. The beaconreceiving rate was considered as number of beacons a nodehas received in the last 20 seconds. We change this time in-terval intuitively based on the vehicles’ speed, network den-sity and re-election overhead. As depicted in Figure 10(b),the beacon receiving rate of the nodes changes while the po-sition of the vehicle changes. The status of the nodes are alsoshown in Figure 10(a), where the nodes with higher beaconrate are always selected as sink. As the vehicle passes by anode, that node will most likely be selected as a sink; sinceHELLO messages were set to be exchanges every 5 seconds.
Sink Election/Simulation Our solution was evaluated inMatlab, but by using the same mobility traces produced bythe setup described above. Vehicles broadcast beacons everysecond. We define the contact fraction metric as the num-ber of beacons received in the last 60 seconds divided bythe maximum receivable. Figure 10(c) shows that the con-tact fraction averaged over sinks is always higher than thoseof the non-sinks, at all speeds. The average residual batterycharge exhibits similar characteristics as shown in Fig. 10(d).The reason that faster speeds give better results is because ofthe lower probability of selecting nodes with shorter contacttimes. Since the scoring function is a function of both resid-ual charge and beacon rate, the nodes with shorter contactfraction do not get a higher score, even though they haveresidual battery as high as others.
8 AnonNet Status and Future RoadmapWe have presented AnonNet - a mobile, wireles, delay
tolerant network tailored for disaster response built with re-quirements from first responders. The design provides for arobust, reliable, efficient system which incorporates hetero-geneous technologies and is entirely battery powered. Seis-mic sensing systems can classify data with 73.3% accuracyon real rubble piles, based on mote based FFT and reportsit to responders via a prompt on their smart phones. Datawaypoints act as optimized data caches which improve thethroughput of the system as a whole. Support for third partytechnologies using open standards enables error free integra-
tion and deployment.AnonNet is an initial approximation of a system that can
be deployed in disasters. There is much that needs to be donein terms of energy efficiency, improving latency and addingnew functionality like chemical hazard sensors or acousticvictim detection that can locate victims from whispers. Welook forward to seamless integration of a wide variety ofcloud based services with AnonNet. Such services providefor cheap data storage, processing, and quick deployment.SIP based voice services can deliver simple audio and videostreams from iOS devices.
9 References[1] Japan hit by tsunami after massive earthquake. http://www.bbc.
co.uk/news/world-asia-pacific-12709850.[2] 2010 haiti earthquake (wikipedia). http://en.wikipedia.org/wiki/2010
Haiti earthquake.[3] Federal emergency management agency. http://www.fema.gov.[4] Army to deploy iphones in combat. http://abcnews.go.com/Techno-
logy/army-prepares-deploy-smartphones-iphones-combat/story?id=12395650.
[5] US&R Task Force Equipment. http://www.fema.gov/emergency/usr/equipment.shtm.
[6] Project 25 technology interest group. http://www.project25.org/.[7] Project 25 interoperable communications for public safety agen-
cies. http://www.motorola.com/web/Business/Solutions/Business So-lutions/Mission Critical Communications/ASTRO 25 Trunked Solu-tions/ Document/Project 25 Whitepaper.pdf.
[8] G. Werner-Allen, J. Johnson, M. Ruiz, J. Lees, and M. Welsh. Mon-itoring volcanic eruptions with a wireless sensor network. In EWSN,2005.
[9] S.G. Iyengar, P.K. Varshney, and T. Damarla. On the detection offootsteps based on acoustic and seismic sensing. In ACSSC, 2007.
[10] G.P. Mazarakis and J.N. Avaritsiotis. A prototype sensor node forfootstep detection. In EWSN, 2005.
[11] Matteo Ceriotti, Luca Mottola, Gian Pietro Picco, Amy L. Murphy,Stefan Guna, Michele Corra, Matteo Pozzi, Daniele Zonta, and PaoloZanon. Monitoring heritage buildings with wireless sensor networks:The torre aquila deployment. In IPSN, 2009.
[12] A. Pakhomov and T. Goldburt. Seismic signal and noise assessmentfor footstep detection range estimation in different environments. InProc. SPIE, volume 5417, pages 87–98.
[13] Steven W. Brown, Ms William, G. Griswold, Barry Demchak,Ba Leslie, and A. Lenert. Middleware for reliable mobile medicalworkflow support in disaster settings, 2006.
[14] M. Arisoylu, R. Mishra, R. Rao, and L. A. Lenert. 802.11 wirelessinfrastructure to enhance medical response to disasters. AMIA AnnuSymp Proc, pages 1–5, 2005.
[15] J. P. Killeen, T. C. Chan, C. Buono, W. G. Griswold, and L. A. Lenert.A wireless first responder handheld device for rapid triage, patientassessment and documentation during mass casualty incidents. AMIAAnnu Symp Proc, pages 429–433, 2006.
[16] L. A. Lenert, D. A. Palmer, T. C. Chan, and R. Rao. An Intelligent802.11 Triage Tag for medical response to disasters. AMIA Annu SympProc, pages 440–444, 2005.
[17] Krishna Kant Chintalapudi and Lakshmi Venkatraman. On the de-sign of mac protocols for low-latency hard real-time discrete controlapplications over 802.15.4 hardware. In IPSN, 2008.
[18] Gang Zhou, Jian Lu, Chieh-Yih Wan, M.D. Yarvis, and J.A.Stankovic. Bodyqos: Adaptive and radio-agnostic qos for body sensornetworks. In Infocom, 2008.
[19] I-Hong Hou and P. R. Kumar. Admission control and scheduling forqos guarantees for variable-bit-rate applications on wireless channels.In MobiHoc, 2009.
[20] Zhen Ren, Gang Zhou, Andrew Pyles, Matthew Keally, Weizhen Mao,and Haining Wang. Bodyt2: Throughput and time delay performanceassurance for heterogeneous bsns. In Infocom, 2011.
[21] Kevin Fall, Gianluca Iannaccone, Jayanthkumar Kannan, FernandoSilveira, and Nina Taft. A disruption-tolerant architecture for secureand efficient disaster response communications. In International Con-
13

ference on Information Systems for Crisis Response and Management,2010.
[22] Hamed Soroush, Nilanjan Banerjee, Aruna Balasubramanian,Mark D. Corner, Brian Neil Levine, and Brian Lynn. DOME: A Di-verse Outdoor Mobile Testbed. In HotPlanet, 2009.
[23] Vladimir Dyo, Stephen A. Ellwood, David W. Macdonald, AndrewMarkham, Cecilia Mascolo, Bence Pasztor, Salvatore Scellato, NikiTrigoni, Ricklef Wohlers, and Kharsim Yousef. Evolution and sus-tainability of a wildlife monitoring sensor network. In SenSys, 2010.
[24] S. Mehrotra, C. Butts, D. Kalashnikov, N. Venkatasubramanian,R. Rao, G. Chockalingam, R. Eguchi, B. Adams, and C. Huyck.Project rescue: Challenges in responding to the unexpected. In SEISC,2004.
[25] Raheleh B. Dilmaghani and Ramesh R. Rao. An ad hoc network in-frastructure: Communication and information sharing for emergencyresponse. IEEE International Conference on Wireless and MobileComputing, Networking and Communication, pages 442–447, 2008.
[26] B.S. Manoj and Alexandra Hubenko Baker. Communication chal-lenges in emergency response. Commun. ACM, 50:51–53, March2007.
[27] Raheleh B. Dilmaghani, B. S. Manoj, Babak Jafarian, and Ramesh R.Rao. Performance evaluation of rescue mesh: A metro-scale hybridwireless network. In Proceedings of WiMesh Workshop, SECON,2005.
[28] Bo Xing, S. Mehrotra, and N. Venkatasubramanian. RADcast: En-abling reliability guarantees for content dissemination in ad hoc net-works. In Infocom, 2009.
[29] Network-centric warfare and wireless communications. http://www.meshdynamics.com/documents/MD MILITARY MESH.pdf.
[30] Wenrui Zhao, Yang Chen, Mostafa Ammar, Mark Corner, BrianLevine, and Ellen Zegura. Capacity enhancement using throwboxesin dtns. In MASS, 2006.
[31] Nilanjan Banerjee, Mark D. Corner, Don Towsley, and Brian N.Levine. Relays, base stations, and meshes: enhancing mobile net-works with infrastructure. In Mobicom, 2008.
[32] N. Banerjee, M.D. Corner, and B.N. Levine. An energy-efficient ar-chitecture for dtn throwboxes. In INFOCOM, 2007.
[33] M. Ibrahim, P. Nain, and I. Carreras. Analysis of relay protocols forthrowbox-equipped dtns. In WiOPT, 2009.
[34] M. Farukh Munir, A.A. Kherani, and F. Filali. Stability and delay anal-ysis for multi-hop single-sink wireless sensor networks. In PerCom,2008.
[35] M. Younis, M. Bangad, and K. Akkaya. Base-station repositioning foroptimized performance of sensor networks. In VTC, 2003.
[36] D. Kim, W. Wang, N. Sohaee, C. Ma, W. Wu, W. Lee, and D.-Z. Du.Minimum data-latency-bound k-sink placement problem in wirelesssensor networks. IEEE/ACM ToN, 2011.
[37] Myounggyu Won, Mike George, and Radu Stoleru. Towards robust-ness and energy efficiency of cut detection in wireless sensor net-works. Elsevier Ad Hoc Networks, 9(3):249–264, 2011.
[38] Kevin Fall. A delay-tolerant network architecture for challenged in-ternets. In Proceedings of Conference on Applications, technologies,architectures, and protocols for computer communications, 2003.
[39] V. Cerf, S. Burleigh, A. Hooke, L. Torgerson, R. Durst, K. Scott,K. Fall, and H. Weiss. Delay-Tolerant Networking Architecture. RFC4838 (Informational), April 2007.
[40] K. Scott and S. Burleigh. Bundle Protocol Specification. RFC 5050(Experimental), November 2007.
[41] J. Polastre, R. Szewczyk, and D. Culler. Telos: enabling ultra-lowpower wireless research. In IPSN, 2005.
[42] Aruna Balasubramanian, Ratul Mahajan, Arun Venkataramani,Brian Neil Levine, and John Zahorjan. Interactive wifi connectivityfor moving vehicles. In SIGCOMM, 2008.
14