A wide range of biofuels and biochemicals can be produced ...
37
Transcript of A wide range of biofuels and biochemicals can be produced ...


CONTENTS Contents ......................................................................................................................................... iii Figures............................................................................................................................................ iii Tables ............................................................................................................................................. iv
Acknowledgments........................................................................................................................... v
Acronyms and Abbreviations ........................................................................................................ vi Abstract ........................................................................................................................................... 1
1 Introduction ............................................................................................................................. 1
1.1 Background .................................................................................................................... 3
1.2 Study Description ........................................................................................................... 5
2 Methodology ............................................................................................................................ 6
2.1 Scope of Study ................................................................................................................ 6
2.2 Feedstock Compositional Characteristics ...................................................................... 7
2.3 Process Description ........................................................................................................ 8
2.3.1 Dilute Acid Pretreatment .................................................................................... 9
2.3.2 Ammonia Fiber Expansion ............................................................................... 13
3 Fossil Energy Consumption and Greenhouse Gas Results for Fermentable Sugars ............. 19
3.1 FEC Results .................................................................................................................. 20
3.2 GHG Results ................................................................................................................. 21
3.3 Key Sources of Uncertainty ......................................................................................... 22
4 Discussion and Conclusions .................................................................................................. 22
5 References ............................................................................................................................. 24
FIGURES Figure 1 Schematic Diagram of the Potential Platform Chemicals and Bioproducts from Sugars 2
Figure 2 Summary of Different Pretreatment Technologies ....................................................... 3
Figure 3 System Overview of the Pretreatment Technology Processes for the Production of Clean Sugars from Lignocellulosic Feedstocks .............................................................................. 7
Figure 4 Simplified Process Flow Diagram for DAP Process .................................................... 9
Figure 5 Simplified Process Flow Diagram for AFEX Pretreatment Process .......................... 14
iii

Figure 6 Summary of Cradle-to-Gate FEC Associated with the Production of One Kilogram of Fermentable Sugar from Lignocellulosic Feedstocks via DAP and AFEX Preteatment Technologies ................................................................................................................................. 20
Figure 7 Summary of Cradle-to-Gate GHG Emissions Associated with the Producion of One Kilogram of Fermentable Sugar from Lignocellulosic Feedstocks via DAP and AFEX Pretreatment Technologies ............................................................................................................ 21
TABLES Table 1 Summary of Assumed Feedstock Compositions ............................................................ 8
Table 2 DAP Conditions in Pretreatment Reactor (R-101), per Data Source and Feedstock ... 10
Table 3 DAP Reactions and Molar Conversions (%) Assumed in Pretreatment Reactor (R-101), per Data Source and Feedstock ..................................................................................................... 11
Table 4 Summary of Assumed Stoichiometric Reactions and Yields (%) for DAP Enzymatic Saccharification, per Data Source and Feedstock ......................................................................... 11
Table 5 Clean Sugar Composition via DAP, per Product Flow Rate and Feedstock ................ 12
Table 6 Material and Energy Flow Inputs for Clean Sugars via DAP, per Feedstock .............. 13
Table 7 AFEX Conditions Assumed in Pretreatment Reactor (R-101), per Data Source and Feedstock 15
Table 8 AFEX Pretreatment Reactions and Conversions (Laser et al. 2009) ........................... 15
Table 9 Summary of Assumed Stoichiometric Reactions and Yields (%) for AFEX Pretreatment Enzymatic Saccharification, per Data Source and Feedstock ................................. 16
Table 10 Clean Sugar Composition via AFEX Pretreatment, per Product Flow Rate and Feedstock 17
Table 11 Summary of Key Parametric Assumptions Used in Aspen Plus ................................ 18
Table 12 Material and Energy Flow Inputs for Clean Sugars via AFEX Pretreatment, per Feedstock 18
iv

ACKNOWLEDGMENTS This work was supported by the Bioenergy Technology Office (BETO) in the Office of Energy Efficiency and Renewable Energy of the U.S. Department of Energy under Contract DE-AC02-06CH11357. We are grateful to Kristen Johnson, Alicia Lindauer, and Zia Haq of BETO for their support and guidance. Additionally, two reviewers provided comments that have helped us to improve this analysis and the report. Any errors remain the responsibility of the authors.
v
ACRONYMS AND ABBREVIATIONS AFEX ammonia fiber expansion
CAFI Consortium for Applied Fundamentals & Innovation
DAP dilute acid pretreatment
ELECNRTL electrolyte NRTL activity coefficient model
FEC fossil energy consumption
GHG greenhouse gas
GREET Greenhouse Gases, Regulated Emissions, and Energy Use in Transportation (model)
IL ionic liquid
LCA life-cycle analysis
LHW liquid hot water
NRTL nonrandom, two liquids property
SE steam explosion
vi

GREET Pretreatment Module
Felix Adom, Jennifer B. Dunn, Jeongwoo Han
September 2014
ABSTRACT
A wide range of biofuels and biochemicals can be produced from cellulosic biomass via different pretreatment technologies that yield sugars. Process simulations of dilute acid and ammonia fiber expansion pretreatment processes and subsequent hydrolysis were developed in Aspen Plus for four lignocellulosic feedstocks (corn stover, miscanthus, switchgrass, and poplar). This processing yields sugars that can be subsequently converted to biofuels or biochemical. Material and energy consumption data from Aspen Plus were then compiled in a new Greenhouses Gases, Regulated Emissions, and Energy Use in Transportation (GREETTM) pretreatment module. The module estimates the cradle-to-gate fossil energy consumption (FEC) and greenhouse gas (GHG) emissions associated with producing fermentable sugars. This report documents the data and methodology used to develop this module and the cradle-to-gate FEC and GHG emissions that result from producing fermentable sugars.
1 INTRODUCTION
One key route to producing cellulosic biofuels and bioproducts is through a sugar intermediate (Agler et al. 2011; de Jong et al. 2012). Pretreatment is an essential process for preparing biomass for the enzyme hydrolysis step that yields the sugars (Tao et al. 2013). Humbird et al. (2011) and Davis et al. (2013) provide detailed technoeconomic analyses of ethanol and hydrocarbon produced through sugar intermediates of a corn stover feedstock. Figure 1 summarizes some of the industrial chemicals that can be produced from cellulosic biomass-derived sugars.
Pretreatment processes are generally capital intensive and are estimated to represent about 18–20% of the total cost of a biorefinery (Yang and Wyman 2008). Pretreatment technology is therefore an active area of research with the aim of identifying and applying techniques to drive down pretreatment costs and energy consumption (Tao et al. 2013; Adom 2012; Banerjee et al. 2010). Examples of some pretreatment technologies that are now in use or under development include steam explosion (SE), liquid hot water (LHW), dilute acid pretreatment (DAP), ammonia fiber expansion (AFEX), and ionic liquid (IL) technologies (Li et al. 2013; Wyman 2013).
1

Given the importance of the pretreatment technologies in producing biofuels and biochemicals, a new pretreatment module has been developed for the Greenhouse Gases, Regulated Emissions, and Energy Use in Transportation (GREETTM) model to allow for close examination of this process step and the drivers of its environmental impacts. Characterizing the environmental burdens of pretreatment processes requires a knowledge of the material and energy inputs to them. We therefore developed process models in Aspen Plus to estimate the material and energy flows for each pretreatment technology. The GREET pretreatment module uses these data to analyze the energy use and emissions associated with two major pretreatment technologies: DAP and AFEX. These are followed by enzymatic hydrolysis to produce sugars from four feedstocks (corn stover, switchgrass, miscanthus, and poplar). This report documents key data sources and the underlying assumptions used in developing the pretreatment module.
Lignocellulosic Feedstock
Fermentable (C5 &C6) Sugars
ethyleneC2 Compound C2 Compound
3-hydroxypropionic acid, glycerol
C3 CompoundsC3 Compounds
succinic acid, fumaric acid, malic acid, aspartic acids, 3-
hydroxybutyrolactone
C4 CompoundsC4 Compounds
glutamic acid, itaconic acid, levulinic acid,
xylitol, arbinitol
C5 CompoundsC5 Compounds
2,5-furandicarboxylic acid, glucaric acid,
sorbitol
C6 CompoundsC6 Compounds
polylactic acid, polyethylene
Cn CompoundsCn Compounds
Figure 1 Schematic Diagram of the Potential Platform Chemicals and Bioproducts from Sugars
2

1.1 Background This section provides a high-level overview of various pretreatment technologies. A number of published, peer-reviewed articles provide more detailed information (Agbor et al. 2011; Conde-Mejía et al. 2012; da Costa Sousa et al. 2009; Gupta et al. 2011). Pretreatment involves the conversion of lignocellulosic biomass from its native form, in which it is recalcitrant to cellulase enzyme systems, into an activated form for which cellulose hydrolysis is much more effective (Zheng et al. 2009). Brodeur et al. (2011), in their review of pretreatment technologies, identified five main goals of a pretreatment step. First, it must result in the production of highly digestible solids that enhance glucose yields during enzyme hydrolysis. Second, it should minimize the degradation of sugars (mainly pentoses), including those derived from hemicellulose. Third, the formation of inhibitors before fermentation should be minimal. Fourth, a pretreatment process should allow lignin to be recovered for conversion into bioenergy or valuable co-products. Finally, in addition to being cost effective, it should minimize heat and power requirements.
Pretreatment technologies can generally be classified as physical, chemical, physicochemical, or biological (Brodeur et al. 2011; Eisenhuber et al. 2013). Figure 2 summarizes the major pretreatment categories and provides specific examples. The wet oxidation, DAP, SE, ammonia-based, mechanical extrusion, and LHW pretreatment technologies have been reported as being the six that are well-established and used in pilot plants in the United States and European Union (Balan et al. 2013).
Lignocellulosic Biomass
Physical ChemicalPhysico-chemical Biological
• Alkaline• Wet Oxidation• Acid Hydrolysis• Ionic liquids
• Steam -Explosion• Liquid Hot Water• Ammonia Fiber Expansion• Ammonia Recycle
Percolation• Supercritical Fluid
• Fungal-White-Brown-Soft-rot fungi
• Bacteria
• Mechanical comminution
• High Energy Radiation
Figure 2 Summary of Different Pretreatment Technologies
3

Different pretreatment technologies have different benefits and drawbacks (Adom 2012; Wyman 2013; Uppugundla et al. 2014), and different studies report that different pretreatment technologies are promising. Hendriks and Zeeman (2009) reviewed promising pretreatment technologies with regard to feedstock composition and concluded that the concentrated acid and wet oxidation forms of pretreatment are effective but costly. They reported that steam pretreatment, LHW systems, and ammonia-based pretreatment are the most promising technologies from an economic perspective because these techniques incur lower capital and wastewater treatment costs. Additionally, fewer inhibitors are produced when these technologyies are used as the pretreatment step. Finally, Harmsen et al. (2010) found that biological pretreatment processes suffer from long retention times, whereas mechanical processes can have high energy demands and might work best when used in combination with other pretreatment technologies (Chen et al. 2013, 2014).
The pretreatment technology might alter the co-products that form in the overall process to convert biomass to fuels or chemicals. The amount and type of co-products formed can affect the main product’s life-cycle emissions and energy use (Pourbafrani et al. 2014; Shen 2012). A few studies that investigated the energy use and associated life-cycle emissions of biofuels emphasized pretreatment technologies. Pourbafrani et al. (2014) analyzed the life-cycle energy use and greenhouse gas (GHG) emissions associated with alternative pretreatment technologies (dilute acid hydrolysis, AFEX, and autohydrolysis) and their coproducts (electricity, pellet, protein, and xylitol) via a consistent life-cycle framework for ethanol production from corn stover. This study reported that the product ethanol’s life-cycle fossil energy consumption (FEC) and GHG emissions depend on the combination of pretreatment technology and associated co-products. In addition, pathways with electricity as a co-product tended to have lower FEC than did other pathways, while the co-production of pellets that were assumed to displace coal in biomass co-fired plants generally resulted in the greatest reductions in GHG emissions. The Consortium for Applied Fundamentals & Innovation (CAFI) team performed extensive studies of leading pretreatment technologies using a single source of cellulosic biomass with the key objective of providing information to help industry select technologies for commercial applications (Wyman et al, 2013). In CAFI 1, the emphasis was comparative data for corn stover while CAFI 2 and 3 focused on poplar wood and switchgrass respectively. Tao et al. (2013) investigated the process economics and LCA of six pretreatment technologies applied to hybrid poplar. They reported that, for the case of poplar feedstock using sugar yields demonstrated in the CAFI 2 project, pretreatment technologies that used alkaline chemicals (e.g., lime and ammonia [NH3)]) for pretreatment hydrolysis emitted more GHGs and consumed more fossil energy than did the technologies that used acids as pretreatment chemicals.
The Conde-Mejía et al. (2012) evaluation of pretreatment processes for ethanol production employed a high-level literature review and screening approach. It evaluated lignocellulosic feedstocks, such as corn stover, sugarcane bagasse, and poplar. The evaluation concluded that SE and DAP resulted in the lowest energy requirements when heat integration was not considered. Even though SE, LHW, DAP, and AFEX pretreatment techniques became more energy-efficient when process design included heat integration, SE was a less desirable pretreatment approach from the perpectives of inhibition and waste minimization. In a follow-up study (Conde-Mejía et al. 2013), process models of the four pretreatment methods (SE, LHW, DAP, and AFEX) as well as six conversion options (acid hydrolysis and fermentation, acid
4

hydrolysis and co-fermentation, separated enzymatic hydrolysis and fermentation, simultaneous saccharification and fermentation, separated enzymatic hydrolysis and co-fermentation, and simultaneous saccharification and co-fermentation [SSCF]) were developed in Aspen Plus. Three key indices (energy, water consumption, and cost) were also developed for each pretreatment- conversion technology combination. One key conclusion of this study was that the DAP/enzymatic hydrolysis and co-fermentation combination had the best economic potential. Spatari et al. (2010) compared technological features and life-cycle environmental impacts of DAP and AFEX for lignocellulosic ethanol by considering a single co-product (electricity). The study concluded that ethanol production via AFEX probably has lower life-cycle GHG emissions than does ethanol production via DAP. Finally, Laser et al. (2009) examined the environmental impacts of AFEX-based routes for converting switchgrass to ethanol with various co-products (protein, electricity, Fischer-Tropsch liquids, and hydrogen. As with Pourbafrani et al., these authors also concluded that co-product choice significantly influences the environmental performance of the AFEX pretreatment technology. An examination of the literature describing the LCAs that address the energy and environmental impacts of pretreatment processes reveals that there is no clear consensus on which pretreatment technology has the lowest FEC and GHG emission levels, especially considering variations in feedstock types and characteristics.
Given pretreatment’s notable contribution to the overall biorefinery energy consumption and environmental impacts, it is important to understand these processes’ energy and materials consumption and associated life-cycle energy and environmental impacts. The GREET pretreatment module has been developed to improve our understanding of pretreatment technologies’ influence on the energy consumption and GHG emissions of fermentable sugars from different feedstocks. Currently, the pretreatment module is not linked to downstream production of fuels and chemicals in GREET; this link will be established in a future release. AFEX and DAP, two of the pretreatment technologies that have been subject to a good deal of research and significant development, they will be the first to be included in the module, which will be expanded in the future to include other pretreatment technologies. 1.2 Study Description In this report, we describe the development of the GREET pretreatment module, beginning with a description of the underpinning Aspen Plus process models in Chapter 2. Results from our analysis are summarized in Chapter 3. Finally, in Chapter 4, we discuss results and identify potential next steps to take in developing this module.
5

2 METHODOLOGY
In this chapter, we discuss the system boundaries for our analysis and provide details on feedstock compositions. We report the assumptions and data sources used to build the process simulations in Aspen Plus. Finally, we describe how the mass and energy flow data extracted from Aspen Plus were incorporated into GREET and used for energy consumption and emissions analysis. 2.1 Scope of Study The lignocellulosic feedstocks included in the pretreatment module are corn stover, switchgrass, poplar, and miscanthus. One reason we chose these feedstocks is because the energy consumption and emissions associated with their harvesting and cultivation are modeled and well-documented in GREET (Argonne National Laboratory 2013; Wang et al. 2013). Second, a significant number of studies have reported bench-scale experimental data (pretreatment conditions and yields) for these feedstocks (Kumar and Murthy 2011; Liu et al. 2013; Uppugundla et al. 2014; Wyman 2013). Further, DAP and AFEX pretreatment of these three feedstocks, corn stover, switchgrass, and poplar have been subject to detailed process modeling in the literature (Wyman et al. 2005; Wyman et al. 2009; Laser et al. 2009; Kim et al. 2011; Tao et al. 2011).
Figure 3 summarizes the major components of the system considered for our analysis. Briefly, fertilizer and energy inputs are required during the cultivation and harvesting of the various feedstocks. Preprocessing steps (e.g., milling, densification, etc.) after feedstock harvesting were excluded in our analysis but detailed examination of physical preprocessing steps will be an important next step. Harvested feedstock is transported to the biorefinery facility, where it is processed via DAP or AFEX to produce the hydrolysate, which undergoes subsequent saccharification using cellulases. After the saccharification process, most of the glucan and xylan are converted to fermentable monomeric C5 and C6 sugars. The residual undegraded polymers, such as lignin, can be recovered and combusted to generate electricity to meet plant energy demands. The pretreatment technologies, enzymatic saccharification, and lignin recovery sections were modeled in Aspen Plus.
The next sections of this chapter describe in detail the assumed feedstock compositions, process descriptions, and specific unit operations for DAP and AFEX.
6

Pretreatment Technologies
(DAP &AFEX)
Removal of undegraded polymers
Enzymatic Saccharification
Enzyme
Energy
CO2 Emissions
Energy
CO2 Emissions
Chemicals
Energy
CO2 Emissions
Lignin
Feedstock Cultivatione.g. poplar, miscanthus
Transportation
Fertilizer & Energy
N2O and CO2 Emissions
Atmospheric CO2
Fuel CO2 Emissions
ASPEN PLUS SIMULATION
Input
Emissions from fossil energy consumption
Clean Sugars
Product and coproduct stream
Power GeneratorHeat & Electricity
Hydrolysate
Figure 3 System Overview of the Pretreatment Technology Processes for the Production of Clean Sugars from Lignocellulosic Feedstocks
2.2 Feedstock Compositional Characteristics Feedstock composition informs the choice of the conversion platform, which could be thermochemical, chemical or bio-chemical (Adom et al. 2014). Table 1 summarizes the feedstock compositions used in the Aspen simulations we developed. Assumed moisture content for the feedstocks are as follows; corn stover (20%), miscanthus (15%), switchgrass (20%), and poplar (50%).
7

Table 1 Summary of Assumed Feedstock Compositions
Feedstock Component
Mass Composition (%) on a Dry Matter Basis, per Data Source and Feedstock Humbird et al. 2011 Kim et al. 2011 Wyman 2013 Zhang et al. 2012
Corn Stover Switchgrass Poplar Miscanthus Sucrose 1 – – 3 Extract 15 – – – Cellulose 35 34 46 40 Galactan 1 1 1 – Mannan 1 – 3 – Xylan 19 23 17 21 Arabinan 2 3 1 0 Lignin 16 26 26 24 Acetate 2 2 5 – Protein 3 1 0 – Ash 5 8 1 3 Biomass – 2 – 9 Total 100 100 100 100
2.3 Process Description To develop simulations of the pretreatment technologies, yield, reaction temperature, and materials consumption data were adopted from peer-reviewed articles and technical reports. Two key issues affect all the simulations developed in this study: the choice of property estimation method in Aspen Plus and the assumed plant capacity. First, two slightly different property methods were assumed for DAP and AFEX. In the case of DAP, the non-random, two liquids (NRTL) property method was adopted, as it was in the Humbird et al. (2011) modeling of this process. The Electrolyte NRTL Activity Coefficient (ELECNRTL) model assumed for the AFEX model is able to represent aqueous electrolyte systems (such as water-ammonia systems) as well as mixed-solvent electrolyte systems over the entire range of electrolyte concentrations (AspenTech 2010). Laser et al. (2009) used this thermodynamic property set in AFEX simulations. Second, we followed the basis set in Humbird et al. (2011) and assumed a plant capacity of 2,000 dry metric tons of feedstock per day for all our simulations, regardless of feedstock.
Detailed process descriptions of the DAP and AFEX process simulations are reported in the next sections of this chapter. Reported natural gas intensities reflect the assumption that 80%-efficient natural-gas-fired boilers provide steam to meet process heat demands. One important point is that the process simulations we developed do not consider heat integration. It is possible that the production of sugars will be co-located with unit operations that will subsequently convert the sugars to final fuels or products, and that heat integration will look very different depending on the final conversion scenario. Future development of the pretreatment module may allow users to incorporate FEC and GHG results for sugars that use data from heat-
8

integrated process simulations. Because the process simulations described in Sections 2.3.1 and 2.3.2 do not incorporate heat integration, energy demand can be viewed as an upper bound. 2.3.1 Dilute Acid Pretreatment Humbird et al. (2011) developed an Aspen Plus model of biochemical ethanol production from corn stover that was the basis of our simulation. The front end of that model (i.e., DAP and subsequent saccharification) was adopted, as summarized in Figure 4. Pretreatment reactor (R-101) conditions and reactions are summarized in Table 2 and Table 3, respectively.
R-102
Steam
Water
H2SO4
R-101
Lignin
Corn Stover, Switchgrass,Miscanthus, Poplar
Mixer-101Flash 101
Clean SugarsSteam
NH3/Water
Centrifuge
PreheaterGases Cellulase
R-103
DAP SACCHARIFICATION
Hyd
roly
sate
stre
am
Figure 4 Simplified Process Flow Diagram for DAP Process
After pretreatment, the effluent is flashed (Flash-101) to remove volatile organic compounds before it is neutralized in the reactor (R-102). We assume an ammonia/water mixture is used to condition the hydrolysate in R-102 by raising the pH from ~1 to ~5 prior to saccharification with cellulase. Table 4 summarizes assumed yields in the saccharification reactor. Details on the process are reported in Humbird et al. (2011).
9

Table 2 DAP Conditions in Pretreatment Reactor (R-101), per Data Source and Feedstock
Condition in Reactor
Humbird et al. 2011
Wyman 2013
Wyman 2013
Khullar et al. 2013
Corn Stover Switchgrass Poplar Miscanthus H2SO4 loading (wt%) 1 1 1 1 Temperature (°C) 158 140 190 160 Pressure (atm) 5.5 5.5 5.5 5.5 Reaction time (min) 5 40 1.1 10 Solid loading in DAP reactor (wt%)
30 30 25 30
The hydrolysate stream from the neutralization step is passed into a saccharification reactor (R-103) and loaded with cellulases. Assumed cellulase dosages are reported in Table 4. We assumed total initial solids loading of 20 wt % in the saccharifaction reactor and residence time of 3.5 days. After saccharification, the sugar-rich slurry is centrifuged to remove undegraded polymers as co-products. These polymers can be combusted to generate electricity. Finally, the composition of the produced clean sugar stream is summarized in Table 5. It must be noted that cellulase as used throughout this report is a combination of glucanase and xylanase. Additionally, reported enzyme loadings throughout this document are conservative. Advances in enzyme technology continue to reduce required dosages and updates to the GREET model will reflect reduced loadings based on publicly available data when it becomes available.
10

11
Table 3 DAP Reactions and Molar Conversions (%) Assumed in Pretreatment Reactor (R-101), per Data Source and Feedstock
Reaction Reactant
Humbird et al. 2011
Wyman et al 2013
Wyman et al 2013
Khullar et al. 2013
Corn Stover Switchgrass Poplar Miscanthus Cellulose + H2O → Glucose Cellulose 10 7 26 3 Xylan + H2O → Xylose Xylan 90 80 71 83 Mannan + H2O → Mannose Mannan 90 80 71 83 Galactan + H2O → Galactose Galactan 90 80 71 83 Arabinan + H2O → Arabinose Arabinan 90 80 71 83
Table 4 Summary of Assumed Stoichiometric Reactions and Yields (%) for DAP Enzymatic Saccharification, per Data Source and
Feedstock
Reaction Reactant
Mass Conversion (%) Humbird et al. 2011
Wyman et al. 2013
Wyman et al. 2013
Khullar et al. 2013
Corn Stover Switchgrass Poplar Miscanthus Cellulose + H2O → Glucose Cellulose 90 86 59 96 Xylan + H2O → Xylose Xylan 88 65 59 81 Galactan + H2O → Galactose Galactan 90 86 59 96 Mannan + H2O → Mannose Mannan 90 86 59 96 Arabinan + H2O → Arabinose Arabinan 88 65 59 81 Cellulase loading (mg protein/g glucan) 20 30 13 17

Table 5 Clean Sugar Composition via DAP, per Product Flow Rate and Feedstock
Component
Composition (wt%) per Product Flow Rate (kg per hour) and Feedstock
420,000 410,000 410,000 490,000 Corn Stover Switchgrass Poplar Miscanthus
Water 0.83 0.86 0.86 0.87 Glucose 0.071 0.056 0.071 0.06 Galactose 2.8×10⁻³ 2.8×10⁻³ 2.3×10⁻³ 0.000 Mannose 1.2×10⁻³ 1.1×10⁻³ 5.7×10⁻³ 0.00 Xylose 0.039 0.032 0.027 0.032 Arabinose 4.7×10⁻³ 3.9×10⁻³ 9.1×10⁻⁴ 0.000 Glucooligomer 3.3×10⁻³ 2.1×10⁻⁴ 2.8×10⁻⁴ 2.2×10⁻⁴ Galactooligomer 6.8×10⁻⁵ 6.8×10⁻⁵ 6.3×10⁻⁵ 0.0000 Mannaoligomer 0.0000 0.0000 1.5×10⁻⁴ 0.0000 Extract 0.031 0.032 7.4×10⁻³ 0.00 Soluble lignin 1.6×10⁻³ 1.6×10⁻³ 2.7×10⁻³ 2.8×10⁻³ HMFa 8.8×10⁻⁴ 9.0×10⁻⁴ 5.7×10⁻⁴ 2.3×10⁻³ Furfural 8.0×10⁻⁴ 1.0×10⁻³ 4.8×10⁻⁴ 6.5×10⁻⁴ Lactic acid 1.0×10⁻³ 9.9×10⁻⁴ 1.4×10⁻⁴ 8.3×10⁻⁵ Ammonia 4.8×10⁻⁷ 4.9×10⁻⁷ 7×10⁻⁷ 4×10⁻⁷ NH4SO4 0.059 6.1×10⁻³ 0.019 0.036 NH4CO2CH3 4.4×10⁻³ 4.5×10⁻³ 0.012 0.000 a HMF = hydroxymethylfurfural
Table 6 shows the overall material and energy intensity for this process. Meeting the steam requirements for the pretreatment reaction consumes about 90% of the natural gas demand. Heating the reactor consumes the rest of the natural gas.
12

Table 6 Material and Energy Flow Inputs for Clean Sugars via DAP, per Feedstock
Input Corn Stover Switchgrass Poplar Miscanthus Energy (MJ/kg Sugar)
Natural gas 2.1 5.4 9.3 5.3 Electricity 0.22 0.28 0.27 0.24
Material (kg/kg Sugar) Corn stover 1.5 Switchgrass 1.4 Poplar 1.4 Miscanthus 1.4 H2SO4 0.03 0.03 0.1 0.2 NH3 0.02 0.02 0.05 0.07 Cellulase protein 0.02 0.01 0.01 0.01 Yeast 0.01 0.01 0.01 0.01
2.3.2 Ammonia Fiber Expansion We developed an Aspen model of the AFEX pretreatment process based on Laser et al. (2009). A simplified process flow diagram is shown in Figure 5. There are two major sections in the process: AFEX pretreatment and enzymatic saccharification.
In brief, the lignocellulosic feedstock is mixed with water and liquid ammonia before it passes into the pretreatment reactor (R-101), where it is exposed to a high temperature and high pressure. The pressure is then reduced, and the reactor effluent is sent to a flash tank (Flash-101). The top effluent from Flash-101 is an ammonia–water mixture. The bottom effluent is a mixture of ammonia, water, and other components of the lignocellulosic feedstock; it is sent to a gas stripper (D-101). In D-101, steam is used as a stripping gas to recover residual liquid ammonia via the overhead of the column. Overhead effluent from D-101 is mixed with the top effluent from Flash-101. This mixture is further cleaned in the separator (Sep-101) to remove more wastewater. The resultant stream, which is mainly ammonia, is recycled back into the process after compression (Compr) to increase the pressure.
13

D-101Water
R-101
Lignin
Corn Stover, Switchgrass,Miscanthus, Poplar Mixer-101
Flash 101
Clean Sugars
Steam
Centrifuge
Cellulase
R-102
Compr
Makeup Ammonia
Waste water
Recycled aqueous ammonia
Mixer-102
Sep-101Mixer-103
AFEX PRETREATMENT SACCHARIFICATION
Figure 5 Simplified Process Flow Diagram for AFEX Pretreatment Process
The ability to recover and recycle ammonia is what makes the AFEX pretreatment technology economically competitive. One important assumption on which our Aspen process development models are based is that about 97% of ammonia can be recovered after pretreatment for reuse (Wyman et al. 2013). The assumption is essential because for the AFEX process to be economically feasible, nearly all the unreacted ammonia must be recovered (Chundawat et al. 2013). Table 7 shows the process conditions for AFEX based on reports found in the literature. Feedstock-dependent variations in parameters (e.g., ammonia loading) arise because each of the cited studies optimized these parameters based on experimental results for a specific feedstock. Unlike DAP, for which reactions are well-documented, the reactions that occur during AFEX are poorly understood. Based on the available information in Laser et al. (2009) for AFEX of switchgrass, we summarize the stoichiometric reactions that constitute AFEX pretreatment in Table 8. These reactions and associated yields were applied to AFEX of corn stover, miscanthus, and switchgrass because no specific reaction parameters were available for AFEX pretreatment of the other feedstocks.
14

Table 7 AFEX Conditions Assumed in Pretreatment Reactor (R-101), per Data Source and Feedstock
Condition in Reactor
Teymouri et al. 2004
Kim et al. 2011
Wyman et al.
2013 Murnen et al.
2007
Corn Stover Switchgrass Poplar Miscanthus Liquid NH3 (kg liquid NH3/kg biomass) 1 1.5 2 2 H2O loading (kg H2O/kg biomass) 0.25 2.0 0.5 2.33 Temperature (°C) 110 145 180 160 Pressure (atm) 21 48 21 21 Reaction time (min) 5 25 10 5 Solid loading in AFEX reactor (wt%) 40 22 40 40
Table 8 AFEX Pretreatment Reactions and Conversions (Laser et al. 2009)
Reaction Reactant Mass Conversion
(%) Lignin → Soluble Lignin Lignin 33 Xylan → Xylan Oligomers Xylan 50 Arabinan → Arabinan Oligomers Arabinan 50 Galactan → Galactan Oligomers Galactan 50 Mannan → Mannan Oligomers Mannan 50 Acetate + NH3 → Ammonium Acetate Acetate 100
Assumed yields for enzymatic saccharification in Aspen were based on experimental data summarized in Table 9. We assumed 20% solids loading in the saccharification reactor. After saccharification, centrifugation removes solid residues, such as cell mass, lignin, and undegraded polymeric sugars (see Figure 6). Solid residues can be combusted to coproduce electricity to meet onsite energy demand and displace grid electricity. The composition of the product-clean sugar stream is summarized in Table 10.
15

16
Table 9 Summary of Assumed Stoichiometric Reactions and Yields (%) for AFEX Pretreatment Enzymatic Saccharification, per Data Source and Feedstock
Reaction Reactant
Mass Conversion (%) Teymouri et al. 2004
Kim et al. 2011
Wyman et al. 2013
Murnen et al. 2007
Corn Stover Switchgrass Poplar Miscanthus Cellulose + H2O → Glucose Cellulose 97 86 59 96 Xylan + H2O → Xylose Xylan 88 65 59 81 Galactan + H2O → Galactose Galactan 97 86 59 96 Mannan + H2O → Mannose Mannan 97 86 59 96 Arabinan + H2O → Arabinose Arabinan 88 65 59 81 Cellulase loading (mg protein/g glucan) 13 30 13 20

Table 10 Clean Sugar Composition via AFEX Pretreatment, per Product Flow Rate and Feedstock
Component
Composition (wt%) per Product Flow Rate (kg per hour) and Feedstock
360,000 380,000 390,000 410,000 Corn Stover Switchgrass Poplar Miscanthus
Water 0.82 0.86 0.86 0.85 Glucose 0.09 0.067 0.058 0.088 Galactose 1.7 ×10⁻³ 1.1 ×10⁻³ 8.2×10⁻⁴ 0.000 Mannose 7.3×10⁻⁴ 3.0×10⁻⁴ 2.0×10⁻³ 0.000 Xylose 0.022 0.017 0.011 0.018 Arabinose 2.6×10⁻³ 2.3×10⁻³ 3.6×10⁻⁴ 0.000 Sucrose 1.9×10⁻³ 0.00 0.00 7.0×10⁻³ Galactan oligomer 1.6×10⁻³ 1.1×10⁻³ 1.4×10⁻³ 0.00 Mannan oligomer 6.6×10⁻⁴ 3.4×10⁻⁴ 3.4×10⁻³ 0.00 Xylan oligomer 0.022 0.025 0.018 0.023 Arabinan oligomer 2.7×10⁻³ 3.3×10⁻³ 6.1×10⁻⁴ 0.000 Extract 0.034 0.00 7.7×10⁻³ 0.00 Soluble lignin 3.0×10⁻⁶ 0.019 0.018 0.017 Ammonia 0.000 3.3×10⁻⁴ 1.5×10⁻³ 8.0×10⁻⁶ Ammonium acetate 5.7×10⁻³ 5.8×10⁻³ 0.013 0.00 Table 11 summarizes the key parametric assumptions for the major unit operations for this process. Finally, the overall material and energy intensity for this process is summarized in Table 12. Note that energy intensity for AFEX of corn stover is lower than that for other feedstocks because of the relatively lower reaction temperature.
17

Table 11 Summary of Key Parametric Assumptions Used in Aspen Plus
Component Label in Aspen
Modeling Parameter
Corn Stover Switchgrass Poplar Miscanthus
Stoichiometric Reactor R-101
RSTOIC
Pressure (bar) Temperature (°C)
21
110
48
145
21
180
21
160 Stoichiometric Reactor R-102
RSTOIC
Pressure (bar) Temperature (°C)
1
48
1
48
1
48
1
48 Distillation column D-102
RadFrac Condenser pressure (bar)
4
4
4
4
No. of stages
12
12
12
12
Molar reflux ratio 1.3 2.6 2.6 1.7 Compressor Compr Process type
Isentropic Isentropic Isentropic Isentropic
Pressure (bar) 21 48 21 21
Table 12 Material and Energy Flow Inputs for Clean Sugars via AFEX Pretreatment, per Feedstock
Input Corn Stover Switchgrass Poplar Miscanthus Energy (MJ/kg Sugar) Natural gas 2.4 3.6 8.5 6.6 Electricity 1.3 0.37 1.9 0.44 Material (kg/kg Sugar) Corn stover 1.2 Switchgrass 1.5 Poplar 1.6 Miscanthus 1.4 Cellulase 0.01 0.01 0.01 0.01 Yeast 0.01 0.01 0.01 0.01
18

3 FOSSIL ENERGY CONSUMPTION AND GREENHOUSE GAS RESULTS FOR FERMENTABLE SUGARS
In Chapter 2, we reported the material and energy flows for each pretreatment technology applied to the four feedstocks included in the module. After these data were assembled in the GREET pretreatment module, existing upstream energy use and emissions data for process material and energy inputs were used to estimate the FEC, air emissions, and GHG emissions associated with the pretreatment processes. The resultant estimates are on a cradle-to-gate basis; that is, they encompass the life-cycle stages from feedstock production to the production of fermentable sugars. The conversion from sugars to the final fuel or bioproduct, the use phase, and the end-of-life stage were excluded from the estimates.
As illustrated in Figure 3, recovered lignin can be combusted to generate electricity to meet some onsite energy demands. In the Humbird et al. (2011) design for producing ethanol from corn stover, the combustion of lignin to produce heat and electricity meets all process heat and power requirements. Excess electricity is exported to the grid. The environmental analysis of this process applies a credit for displaced electricity to the final ethanol product (Wang et al. 2012). The fermentable sugars, which are the endpoint for analysis in the pretreatment module, could also receive a credit for displaced electricity if this same methodology was followed and the sugars were the endpoint for the analysis. In this chapter, we report results that account for an electricity displacement credit being applied to the sugars. If the sugars are subsequently used to produce biofuels or bioproducts, care must be taken to avoid applying this credit twice. To develop the credit for displaced electricity, we are assuming that lignin will be combusted via cogeneration with a biomass-fired power utility with a conversion-to-electricity efficiency of 39% (Humbird et al. 2011). Sections 3.1 and 3.2 describe the results for FEC and GHG emissions associated with the production of fermentable sugars.
19

3.1 FEC Results Results for the cradle-to-gate FEC for various pretreatment technologies are summarized in Figure 6.
Figure 6 Summary of Cradle-to-Gate FEC Associated with the Production of One Kilogram of Fermentable Sugar from Lignocellulosic Feedstocks via DAP and AFEX Preteatment Technologies
Without considering electricity displacement, production of sugars via poplar DAP consumed the most energy (16 MJ/kg sugar), and sugars produced from DAP of corn stover were the least energy intensive (8.6 MJ/kg sugar). One factor behind this result is that sugar yields from pretreatment and saccharification processes were relatively higher when a corn stover feedstock was used. Moreover, sugar yields from poplar-based processes were relatively small (see Tables 3 and 4) and poplar pretreatment with DAP had the highest natural gas requirement (9.3 MJ/kg sugar) (Table 6), which was attributable to the relatively harsh poplar pretreatment conditions (see Table 2). Wyman et al. (2009) suggest that the recalcitrant nature of poplar could, in part, be due to the lignin composition or the nature of the hemicellulose component, although more evidence is needed to further confirm this hypothesis. The aqua diamond-shaped points in Figure 6 show the net results when electricity coproduction is considered. In this case, the net FEC values for DAP-pretreated switchgrass and corn stover were about 46% less than the FEC for the DAP-pretreated poplar and miscanthus. The net FEC values for AFEX-pretreated feedstocks were highest for poplar and lowest for switchgrass. It is
-10
-5
0
5
10
15
20
Poplar Miscanthus Corn Stover Switchgrass Poplar Miscanthus Corn Stover Switchgrass
DAP AFEX
Cra
dle-
to-G
ate
Foss
il E
nerg
y C
onsu
mpt
ion
(MJ/
kg S
ugar
)
Feedstock Prodution and Conversion to Fermentable Sugars Displaced Electricity Net FEC
20

notable that poplar-derived sugars had the highest emissions despite the greatest potential for displaced electricity, given poplar’s high lignin content (Table 1). The high electricity requirement (Table 12) of the AFEX process for pretreating poplar offsets this potentially available credit. 3.2 GHG Results Figure 7 summarizes cradle-to-gate GHG emissions for the different pretreatment processes, all of which show a GHG emissions credit. Note that because these results are reported on a cradle-to-gate basis, the biogenic carbon embedded in the product has not been released. The amount of biogenic carbon in the fermentable sugar is larger than the amount of carbon emitted as a result of using fossil fuels during feedstock production and conversion to sugars, which is why the GHG emissions are less than zero, implying carbon sequestration. Of the feedstocks pretreated with DAP, switchgrass had the highest GHG emissions credit. Of the feedstocks pretreated with AFEX, poplar had the lowest GHG emissions credit because AFEX pretreatment is particularly energy intensive for this feedstock (Table 12). Switchgrass and corn stover offered the highest GHG emissions credit for AFEX-pretreated feedstocks. Of the DAP-pretreated feedstocks, switchgrass and corn stover had a higher GHG credit than did poplar and miscanthus.
Figure 7 Summary of Cradle-to-Gate GHG Emissions Associated with the Producion of One Kilogram of Fermentable Sugar from Lignocellulosic Feedstocks via DAP and AFEX Pretreatment Technologies
-1.4
-1.2
-1
-0.8
-0.6
-0.4
-0.2
0
Poplar Miscanthus Corn Stover Switchgrass Poplar Miscanthus Corn Stover Switchgrass
DAP AFEX
Cra
dle-
to-G
ate
Gre
enho
use
Gas
Em
issi
ons (
kgC
O2/k
g Su
gar)
Feedstock Prodution and Conversion to Fermentable Sugars Displaced Electricity Net GHG Emissions
21

3.3 Key Sources of Uncertainty It is important to note that there is a fair amount of uncertainty in the values we adopted for chemical usage, ammonia recovery rates, and bench-scale yields based on information in the literature. In Laser et al. (2009), the absence of commercial examples of ammonia recovery via high-solids steam stripping is acknowledged; however, the authors did envision the development of ammonia recovery processing equipment for mature AFEX pretreatment technology. Their argument for envisioning the commercialization of an ammonia recovery unit is based on the similarity of the ammonia recovery process to direct steam drying, which uses similar unit operations and for which commercial examples is increasing (Kudra and Mujumdar 2009; Pronyk et al. 2004).
In addition, actual material and energy flows in commercial biorefineries are unavailable because commercialization is limited at this point and because data for existing processes are generally proprietary. As a result, we have used experimental data to build process simulations. This introduces uncertainty because bench scale yield, material and energy consumption will change significantly during scale up. Nonetheless, the pretreatment module is useful for understanding the energy use and emissions associated with various pretreatment technologies and can serve as a basis for the development of LCA results for sugar-derived fuels and chemicals from lignocellulosic feedstocks in the context of the simulation assumptions documented in this report.
4 DISCUSSION AND CONCLUSIONS
We developed a new pretreatment module in GREET to analyze FEC and GHG emissions associated with producing fermentable sugars via the DAP or AFEX pretreatment technology based on Aspen Plus models of two pretreatment processes, DAP and AFEX.
The FEC values obtained for sugars produced from the same feedstock but by using different pretreatment technologies were largely comparable. The exception was poplar, for which DAP-derived sugars were 16% less fossil-energy intensive than were AFEX-derived sugars. On average, the GHG emissions credit for DAP-derived sugars was about 26% higher than that for AFEX-derived sugars. This result was directly attributable to our assumption (Table 8) that about 33% of the lignin is solubilized (Laser et al. 2009) in the AFEX process, whereas only 5% of the lignin is solubilized in the DAP process (Humbird et al. 2011). As a result, less lignin is available for electricity production when AFEX pretreatment is used.
It is difficult to compare these results with those from other studies. Except for Tao et al. (2013), peer-reviewed articles focusing on GHG emissions and the FEC of fermentable sugars as a function of pretreatment type are scarce. Most studies looking at the effects of pretreatment type report FEC and GHG results for a final fuel or product; it is difficult to extract results for the sugar intermediate. The Tao et al. (2013) assessment developed GHG and FEC results for fermentable sugars produced from poplar by using a range of pretreatment technologies,
22
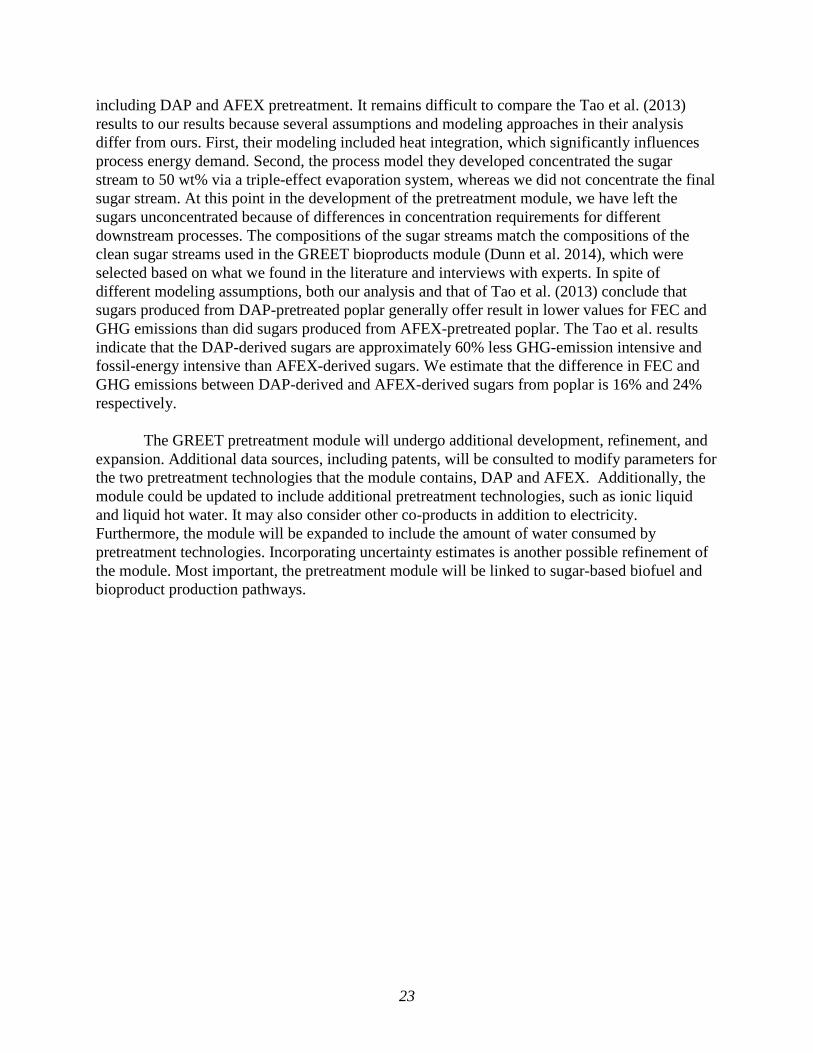
including DAP and AFEX pretreatment. It remains difficult to compare the Tao et al. (2013) results to our results because several assumptions and modeling approaches in their analysis differ from ours. First, their modeling included heat integration, which significantly influences process energy demand. Second, the process model they developed concentrated the sugar stream to 50 wt% via a triple-effect evaporation system, whereas we did not concentrate the final sugar stream. At this point in the development of the pretreatment module, we have left the sugars unconcentrated because of differences in concentration requirements for different downstream processes. The compositions of the sugar streams match the compositions of the clean sugar streams used in the GREET bioproducts module (Dunn et al. 2014), which were selected based on what we found in the literature and interviews with experts. In spite of different modeling assumptions, both our analysis and that of Tao et al. (2013) conclude that sugars produced from DAP-pretreated poplar generally offer result in lower values for FEC and GHG emissions than did sugars produced from AFEX-pretreated poplar. The Tao et al. results indicate that the DAP-derived sugars are approximately 60% less GHG-emission intensive and fossil-energy intensive than AFEX-derived sugars. We estimate that the difference in FEC and GHG emissions between DAP-derived and AFEX-derived sugars from poplar is 16% and 24% respectively.
The GREET pretreatment module will undergo additional development, refinement, and expansion. Additional data sources, including patents, will be consulted to modify parameters for the two pretreatment technologies that the module contains, DAP and AFEX. Additionally, the module could be updated to include additional pretreatment technologies, such as ionic liquid and liquid hot water. It may also consider other co-products in addition to electricity. Furthermore, the module will be expanded to include the amount of water consumed by pretreatment technologies. Incorporating uncertainty estimates is another possible refinement of the module. Most important, the pretreatment module will be linked to sugar-based biofuel and bioproduct production pathways.
23

5 REFERENCES Adom, F., 2012, The Potential of Industrial Waste and Agricultural Feedstock towards Sustainable Biofuels Production: Techno-economic and Environmental Impact Perspectives. Adom, F., J. Fan, J. Davis, P. Dunn, and D. Shonnard, 2014, “Compositional Analysis of Defatted Syrup from a Corn Ethanol Dry-Grind Process as a Feedstock for Biobased Products,” ACS Sustain. Chem. Eng. 2:1139–1146. Agbor, V.B., N. Cicek, R. Sparling, A. Berlin, and D.B. Levin, 2011, “Biomass Pretreatment: Fundamentals toward Application,” Biotechnol. Adv. 29, 675–685. Agler, M.T., B.A. Wrenn, S.H. Zinder, and L.T. Angenent, 2011, “Waste to Bioproduct Conversion with Undefined Mixed Cultures: The Carboxylate Platform,” Trends Biotechnol. 29:70–78. Argonne National Laboratory, 2013, Greenhouse Gases, Regulated Emissions, and Energy Use in Transportation (GREET) Computer Model, Argonne, Ill. AspenTech, 2010, Aspen Physical Property System: Physical Property Models, Technical Report. Balan, V., D. Chiaramonti, and S. Kumar, 2013, “Review of US and EU Initiatives toward Development, Demonstration, and Commercialization of Lignocellulosic Biofuels,” Biofuels Bioprod. Biorefining 7:732–759. Balan, V., L. da Costa Sousa, S.P.S. Chundawat, D. Marshall, L.N. Sharma, C.K. Chambliss, and B.E. Dale, 2009, “Enzymatic Digestibility and Pretreatment Degradation Products of AFEX-Treated Hardwoods (Populus nigra),” Biotechnol. Prog. 25:365–375. Banerjee, S., S. Mudliar, R. Sen, B. Giri, D. Satpute, T. Chakrabarti, and R.A. Pandey, 2010, “Commercializing Lignocellulosic Bioethanol: Technology Bottlenecks and Possible Remedies,” Biofuels Bioprod. Biorefining 4:77–93. Brodeur, G., E. Yau, K. Badal, J. Collier, K.B. Ramachandran, and S. Ramakrishnan, 2011, “Chemical and Physicochemical Pretreatment of Lignocellulosic Biomass: A Review,” Enzyme Res., e787532. Chen, Xiaowen, Erik Kuhn, Wei Wang, Sunkyu Park, Keith Flanegan, Olev Trass, Lisette Tenlep, Ling Tao, and Melvin Tucker. 2013. “Comparison of Different Mechanical Refining Technologies on the Enzymatic Digestibility of Low Severity Acid Pretreated Corn Stover.” Bioresource Technology 147 (November): 401–8. doi:10.1016/j.biortech.2013.07.109. Chen, Xiaowen, Joseph Shekiro, Thomas Pschorn, Marc Sabourin, Ling Tao, Rick Elander, Sunkyu Park, et al. 2014. “A Highly Efficient Dilute Alkali Deacetylation and Mechanical (disc)
24

Refining Process for the Conversion of Renewable Biomass to Lower Cost Sugars.” Biotechnology for Biofuels 7 (1): 98. doi:10.1186/1754-6834-7-98. Chundawat, S.P.S., B. Bals, T. Campbell, L. Sousa, D. Gao, M. Jin, P. Eranki, R. Garlock, F. Teymouri, V. Balan, and B.E. Dale, 2013, “Primer on Ammonia Fiber Expansion Pretreatment,” in C.E. Wyman (Editor), Aqueous Pretreatment of Plant Biomass for Biological and Chemical Conversion to Fuels and Chemicals, John Wiley & Sons, Ltd., pp. 169–200. Conde-Mejía, C., A. Jiménez-Gutiérrez, and M. El-Halwagi, 2012, “A Comparison of Pretreatment Methods for Bioethanol Production from Lignocellulosic Materials,” Process Saf. Environ. Prot., Special Issue on Energy from Waste 90:189–202. Conde-Mejía, C., A. Jiménez-Gutiérrez, and M.M. El-Halwagi, 2013, “Assessment of Combinations between Pretreatment and Conversion Configurations for Bioethanol Production,” ACS Sustain. Chem. Eng. 1:956–965. da Costa Sousa, L., S.P. Chundawat, V. Balan, and B.E. Dale, 2009, “ ‘Cradle-to-Grave’ Assessment of Existing Lignocellulose Pretreatment Technologies,” Curr. Opin. Biotechnol., Energy Biotechnology/Environmental Biotechnology 20, 339–347. Davis, R., E. Tao, C.D. Tan, M. Biddy, G. Beckham, and C. Scarlata, 2013, Process Design and Economics for the Conversion of Lignocellulosic Biomass to Hydrocarbons: Dilute-Acid and Enzymatic Hydrolysis Deconstruction of Biomass to Sugars to Hydrocarbons, Report NREL/TP-5100-60223, National Renewable Energy Laboratory. de Jong, E., A. Higson, P. Walsh, and M. Wellisch, 2012, Bio-based Chemicals Value Added Products from Biorefineries, report prepared on behalf of International Energy Agency, Bioenergy Task 42, Biorefinery, Feb. 28. Dunn, J.B., F. Adom, N. Sather, J. Han, and S. Snyder, 2014, Life-Cycle Analysis of Bioproducts and Their Conventional Counterparts in GREET, Technical Report No. ANL/ESD-14/9, Argonne National Laboratory, Argonne, Ill. Eisenhuber, K., K. Krennhuber, V. Steinmüller, and A. Jäger, 2013, “Comparison of Different Pre-treatment Methods for Separating Hemicellulose from Straw during Lignocellulose Bioethanol Production,” Energy Procedia, Vol. 40, pp. 172–181, from the European Geosciences Union General Assembly 2013, EGU Division, Energy, Resources abnd the Environment, published by Elsevier. Gupta, R., Y,P. Khasa, and R.C. Kuhad, 2011, “Evaluation of Pretreatment Methods in Improving the Enzymatic Saccharification of Cellulosic Materials,” Carbohydr. Polym. 84:1103–1109. Harmsen, P.F., H. Huijgen, L. Bermudez, and R. Bakker, 2010, Literature Review of Physical and Chemical Pretreatment Processes for Lignocellulosic Biomass, ECN-E-10-013, Energy
25

Research Center of the Netherlands, Biosynergy Project, Wageningen UR Food and Biobased Research, Sept. Harun, S., V. Balan, M.S. Takriff, O. Hassan, J. Jahim, and B.E. Dale, 2013, “Performance of AFEXTM Pretreated Rice Straw as Source of Fermentable Sugars: The Influence of Particle Size,” Biotechnol. Biofuels 6:40. Hendriks, A.T., and G. Zeeman, 2009, “Pretreatments to Enhance the Digestibility of Lignocellulosic Biomass,” Bioresour. Technol. 100(1):10–18, Jan. Humbird, D., R. Davis, L. Tao, C. Kinchin, D. Hsu, D. Aden, P. Schoen, J. Lukas, B. Olthof, M. Worley, D. Sexton, and D. Dudgeon, 2011, Process Design and Ecnomics for Biochemical Conversion of Lignocellulosic Biomass to Ethanol: Dilute-Acid Pretreatment and Enzymatic Hydrolysis of Corn Stover, Technical Report NREL/TP-5100-47764), National Renewable Energy Laboratory. Khullar, E., B.S. Dien, K.D. Rausch, M.E. Tumbleson, and V. Singh, 2013, “Effect of Particle Size on Enzymatic Hydrolysis of Pretreated Miscanthus,” Ind. Crops Prod. 44:11–17. Kim, Youngmi, Nathan S. Mosier, Michael R. Ladisch, V. Ramesh Pallapolu, Y. Y. Lee, Rebecca Garlock, Venkatesh Balan, et al. 2011. “Comparative Study on Enzymatic Digestibility of Switchgrass Varieties and Harvests Processed by Leading Pretreatment Technologies.” Bioresource Technology 102 (24): 11089–96. doi:10.1016/j.biortech.2011.06.054. Kudra, T., and A.S. Mujumdar, 2009, Advanced Drying Technologies, Second Edition, CRC Press. Kumar, D., and G.S. Murthy, 2011, “Impact of Pretreatment and Downstream Processing Technologies on Economics and Energy in Cellulosic Ethanol Production,” Biotechnol. Biofuels 4:27. Laser, M., H. Jin, K. Jayawardhana, and L.R. Lynd, 2009, “Coproduction of Ethanol and Power from Switchgrass,” Biofuels Bioprod. Biorefining 3:195–218. Li, C., D. Tanjore, W. He, J. Wong, J.L. Gardner, K.L. Sale, B.A. Simmons, and S. Singh, 2013, “Scale-up and Evaluation of High Solid Ionic Liquid Pretreatment and Enzymatic Hydrolysis of Switchgrass,” Biotechnol. Biofuels 6:154. Liu, C., L. Xiao, J. Jiang, W. Wang, F. Gu, D. Song, Z. Yi, Y. Jin, and L. Li, 2013, “Biomass Properties from Different Miscanthus Species,” Food Energy Secur. 2:12–19. Murnen, H.K., V. Balan, S.P.S. Chundawat, B. Bals, L. da Costa Sousa, and B.E. Dale, 2007, “Optimization of Ammonia Fiber Expansion (AFEX) Pretreatment and Enzymatic Hydrolysis of Miscanthus x giganteus to Fermentable Sugars,” Biotechnol. Prog. 23:846–850.
26

Pourbafrani, M., J. McKechnie, T. Shen, B.A. Saville, and H.L. MacLean, 2014, “Impacts of Pre-treatment Technologies and Co-products on Greenhouse Gas Emissions and Energy Use of Lignocellulosic Ethanol Production,” J. Clean. Prod. 78, 104–111. Pronyk, C., S. Cenkowski, and W.E. Muir, 2004, “Drying Foodstuffs with Superheated Steam,” Dry. Technol. 22:899–916. Shen, T., 2012, “Life Cycle Modelling of Multi-product Lignocellulosic Ethanol Systems,” Thesis, University of Toronto. Spatari, S., D.M. Bagley, and H.L. MacLean, 2010, “Life Cycle Evaluation of Emerging Lignocellulosic Ethanol Conversion Technologies,” Bioresour. Technol. 101:654–667. Tao, L., E.C.D. Tan, A. Aden, and R.T. Elander, 2013, “Techno-Economic Analysis and Life-Cycle Assessment of Lignocellulosic Biomass to Sugars Using Various Pretreatment Technologies,” in J. Sun, S.Y. Ding, and J. Doran-Peterson (Editors), Biological Conversion of Biomass for Fuels and Chemicals: Explorations from Natural Utilization Systems, RSC Energy and Environment Series No. 10, Royal Society of Chemistry, Cambridge, England, pp. 358–380, NREL Report CH-5100-54944, National Renewable Energy Laboratory. Teymouri, F., L. Laureano-Pérez, H. Alizadeh, and B.E. Dale, 2004, “Ammonia Fiber Explosion Treatment of Corn Stover,” in M. Finkelstein, J.D. McMillan, B.H. Davison, and B. Evans (Editors), Proceedings of the Twenty-Fifth Symposium on Biotechnology for Fuels and Chemicals, May 4–7, 2003, Breckenridge, Colo.; also in Biotechnology for Fuels and Chemicals, Humana Press, pp. 951–963. Uppugundla, N., L. da Costa Sousa, S.P. Chundawat, X. Yu, B. Simmons, S. Singh, X. Gao, R. Kumar, C.E. Wyman, B.E. Dale, and V. Balan, 2014, “A Comparative Study of Ethanol Production Using Dilute Acid, Ionic Liquid and AFEXTM Pretreated Corn Stover,” Biotechnol. Biofuels 7:72. Wang, M., J. Han, J.B. Dunn, H. Cai, and A. Elgowainy, A., 2012, “Well-to-Wheels Energy Use and Greenhouse Gas Emissions of Ethanol from Corn, Sugarcane and Cellulosic Biomass for US Use,” Environ. Res. Lett. 7(4), 045905. Wang, Z., J.B. Dunn, J. Han, and M. Wang, 2013, Material and Energy Flows in the Production of Cellulosic Feedstocks for Biofuels for GREET1_2013, Technical Report ANL/ESD-13/9), Argonne National Laboratory, Argonne, Ill. Wyman, Charles E., Bruce E. Dale, Richard T. Elander, Mark Holtzapple, Michael R. Ladisch, and Y. Y. Lee. 2005. “Comparative Sugar Recovery Data from Laboratory Scale Application of Leading Pretreatment Technologies to Corn Stover.” Bioresource Technology 96 (18): 2026–32. doi:10.1016/j.biortech.2005.01.018.
27

Wyman, C.E., B.E. Dale, R.T. Elander, M. Holtzapple, M.R. Ladisch, Y.Y. Lee, C. Mitchinson, and J.N. Saddler, 2009, “Comparative Sugar Recovery and Fermentation Data Following Pretreatment of Poplar Wood by Leading Technologies,” Biotechnol. Prog. 25:333–339. Wyman, C.E., B.E. Dale, V. Balan, R.T. Elander, M.T. Holtzapple, R.S. Ramirez, M.R. Ladisch, N.S. Mosier, Y.Y. Lee, R. Gupta, S.R., Thomas, B.R. Hames, R. Warner, and R. Kumar, 2013, “Comparative Performance of Leading Pretreatment Technologies for Biological Conversion of Corn Stover, Poplar Wood, and Switchgrass to Sugars,” in C.E. Wyman, (Editor), Aqueous Pretreatment of Plant Biomass for Biological and Chemical Conversion to Fuels and Chemicals, John Wiley & Sons, Ltd, pp. 239–259. Yang, B., and C.E. Wyman, 2008, “Pretreatment: The Key To Unlocking Low-Cost Cellulosic Ethanol,” Biofuels Bioprod. Biorefining 2:26–40. Zhang, T., C.E. Wyman, K. Jakob, and B. Yang, 2012, “Rapid Selection and Identification of Miscanthus Genotypes with Enhanced Glucan and Xylan Yields from Hydrothermal Pretreatment Followed by Enzymatic Hydrolysis,” Biotechnol. Biofuels 5:56. Zheng, Y., Z. Pan, and R. Zhang, 2009, “Overview of Biomass Pretreatment for Cellulosic Ethanol Production,” Int. J. Agric. Biol. Eng. 2:51–68.
28