A WellBeing Return on Investment Assessment of … · 50% (9) were graduates from the STEP program...
49
A WellBeing Return on Investment Assessment of the BCCA Connector Models Prepared by Mark Anielski and Dominic Mishio October 2, 2013 ANIELSKI Management Inc.
Transcript of A WellBeing Return on Investment Assessment of … · 50% (9) were graduates from the STEP program...

A WellBeing Return on Investment Assessment
of the BCCA Connector Models
Prepared by Mark Anielski and Dominic Mishio
October 2, 2013
ANIELSKI
Management Inc.

Table of Contents
About Anielski Management Inc. ................................................................................. 4
Purpose of this Report .................................................................................................. 4
Executive Summary ...................................................................................................... 5
Skilled Trades Employment Programs (STEP) 5
JobMatch 6
BCCA Program Data in this Study 6
Marginal Wage Benefits 7
Living Wage Benefits 7
Income Tax Benefits to Governments 7
Income Assistance Program Cost Savings 7
WellBeing Return on Investment 8
Scaling the Analysis to all BCCA Clients 8
JobMatch 9
Stories and Testimonies: Lived Well-being Impacts 10
Conclusions 10
Introduction ................................................................................................................. 11
The BCCA Connector Models: STEP and JobMatch ................................................ 11
ISTEP 11
STEP 3.0 12
Immigrants in Trades Training (IITT) 13
Women in Trades Training (WITT) 14
Aboriginals in Trades Training (AITT) 15
JobMatch 16
Genuine Wealth Model for Assessing WellBeing Impacts ...................................... 17
Establishment of a WellBeing Impact Evaluation Framework 17
Identification of Impact Criterion and Indicators: Measuring What Matters to WellBeing 19
Genuine Wealth Assessment and WellBeing-ROI 19
BCCA Connector Model Genuine Wealth Assessment and WellBeing Impact Assessment ..................................................................................................... 20
Understanding the Data 20
Societal Economic WellBeing Impacts: the Costs of Unemployment and Underemployment 21
Marginal Wage Benefits 22
Living Wage Benefit 23
Income Assistance Program Cost Savings 24

Income Tax Benefits to Government 24
WellBeing Return on Investment 25
Quality of Life Impacts: Stories and Testimonies 26
Summary of Wellbeing Impacts of all BCCA Programs 26
What about the new JobMatch Program? 27
Appendices .................................................................................................................. 28
Appendix 1: Economic Well-Being Analysis Results 28
Appendix 2: BCCA Program Statistics 29
Appendix 3: BCCA Connector Programs’ Eligibility Checklist & Programs Summary 33
Appendix 4: Building Blocks of Individual, Business, and Community Genuine Wealth 35
Five Asset Building Blocks of Individual Genuine Wealth 35
Genuine Wealth model for Business/Enterprise/Organizations 36
Genuine Wealth Model for Communities and Nations 37
Appendix 5: BCCA Connector/STEP Participant Personal Stories 38
Appendix 6: One-Page WellBeing Report Summary 49

About Anielski Management Inc.
Anielski Management Inc. provides communities, businesses, governments and other organizations with practical tools and processes for assessing, building and sustaining their genuine wealth – the human, social, natural, built and financial capital assets that contribute to well-being. The Genuine Wealth Model was developed specifically to help assess the well-being impacts (economic, social, environmental) of public policies, programs, services and business practices.
Mark Anielski, founder of Anielski Management Inc, has over 25 years experience in public sector economic policy analysis, performance measurement, triple-bottom and sustainability accounting, full-cost accounting, strategic-business planning, and natural capital accounting.
For further information on our work please see www.anielski.com
Purpose of this Report
The purpose of this report is to share results of an assessment of the tangible economic well-being impacts of the BC Construction Association (BCCA) STEP and JobMatch programs.

Executive Summary
The objective of this assessment was to evaluate the financial well-being impacts of the BC Construction Association (BCCA) “Connector Model” programs STEP 3.0 and JobMatch. The Genuine Wealth Model – an integrated economic, social and environmental wellbeing impact assessment tool – developed by economist Mark Anielski of Anielski Management Inc. was used for the assessment.
These publicly-funded programs connect skilled labourers with jobs in BC’s construction sector.
Key questions are:
What are the well-being impacts on individual participants?
What are the relative economic and well-being returns on government tax dollars?
Looking at measurable (income) data, we can begin to understand the tangible economic wellbeing impacts of the BCCA programs. This first phase of assessment will help determine if further analysis of other well-being or quality of life impacts is warranted, advancing a new concept of well-being impact analytics, namely the W-ROI or WellBeing Return on Investment analysis developed by Anielski Management Inc.The W-ROI assessment expresses well-being impacts “big picture” terms combining the economic (monetary), community, employer, and personal/family (mental, physical, emotional) quality of life impacts of the BCCA programs.
The costs of underemployment and unemployment can be substantial to the individual worker, their families and communities, and to entire economies. These costs include losses of productive output to the economy and potential loss of skills due to minimal work experience. Socially, unemployment is linked with increased suicide, increased crime, increased family breakdown, and negative psychological impacts. Many of these societal costs cannot be easily monetized.
The BCCA programs have had an impact on reducing the number of unemployed and underemployed workers in BC, saving the BC economy money otherwise spent on income assistance and employment insurance.
These programs are:
Skilled Trades Employment Programs (STEP)
The STEP programs have been connecting people with employment opportunities in BC’s construction sector since 2005. Since then, an estimated 7,000 clients have been successfully placed into jobs through various STEP programs for immigrants, women, Aboriginals and other unemployed and underemployed low-skill workers (including JobMatch):
► ISTEP - Immigrant Skilled Trades Employment Program
The ISTEP program ran between June 2006 and August 15, 2010, placing roughly 1051 clients into employment opportunities.
A similar program ran from April 15, 2009 until October 31, 2010 with 492 clients participating in the program.

► STEP 3.0
Between 2010 and February 2013, STEP placed 584 clients. The average program operating cost per placement ranged from $4,301 (2011-12) to $5,998 (2012-13), with a three-year average operating cost of $4,955. The average employment placement time for a STEP 3.0 participant ranged from 1 day to 18 months.
► Immigrants in Trades Training (IITT)
IITT was developed by the BCCA to help immigrants get an ITA recognized certificate. The IITT program ran successive programs from January 2009 to present with 449 clients. The average operating cost per placement in the WITT program ranged from $5,809 (2011-12) to $6,341 (2012-13), with a three-year average operating cost of $6,083 per placement.
► Women in Trades Training (WITT)
WITT was developed to support women through their transition to apprenticeship, apprenticeship placement, and/or challenge application to gaining an ITA recognized certificate. The WITT program ran successive programs between January 2009 and March 31, 2013 with 326 clients placed. The average operating cost per employee placement in the WITT program ranged from $8,303 (2011-12) to $9,396 (2010-11), with a three-year average operating cost of $8,777 per placement.
► Aboriginals in Trades Training (AITT)
AITT was developed to support Aboriginal participants through their transition to apprenticeship, apprenticeship placement, and/or challenge application to gaining an ITA recognized certificate. The AITT program ran programs from January 2009 to present with 183 clients. The average program operating cost per employee placement has ranged from $4,500 (2011 pilot period) to $5,828 (2012-13), with a three-year average operating cost of $5,225 per placement.
JobMatch
At time of writing JobMatch is in the pilot stage. This program connects unemployed British Columbians with employment opportunities based on specific labour market vacancies in the industrial, commercial and institutional construction sectors.
JobMatch has an 80% success rate finding candidates sustainable employment in the construction field. Based on BCCA statistics, the average placement time for successfully job-matched participants ranged from 24-72 hours.
BCCA Program Data in this Study
The analysis is based on a qualitative survey tool of a sample of 18 BCCA program participants in 2011-12 operating period (3.5 percent of a total potential sample of 520 BCCA program participants and placements in 2011-12).
Questions were asked about their employment and wage conditions prior to entering the BCCA programs.

Of the respondents:
50% (9) were graduates from the STEP program
33% (6) completed the WITT program
17% (3) completed the ITTI program
There were no respondents for the AITT program.
Weeks of Work
Weekly Salary
Annual Salary
Before 22.5 $435 $22,636
After 39.1 $700 $35,753
Change +73% +61% +58%
Marginal Wage Benefits
The net increment in average weekly salaries of the BCCA graduates (i.e. the difference between weekly salaries before entering the BCCA program following job placement) averaged $264 (or a 60.6% increase) in average weekly wages. Converted to annual salary terms, the average net annual salary increment was $20,517 ranging (the median value was $14,431) from a loss of income (due to a condition of moving into a lower paying apprenticeship position from a previous full-time trade position) to a high of $100,000 net annual salary increment.
Living Wage Benefits
The average estimated hourly salary was $22.56 per hour (the median value was $20.29 per hour): more than 33 percent higher than the $16.90 per hour living wage salary estimates for the communities in which these participants live and work.
Earning a living wage has important psychic benefits through reduction of financial stress and personal stress levels. While these psychic benefits cannot be easily monetized, they are an essential positive wellbeing impact on individuals, their families, employers, and communities.
Income Tax Benefits to Governments
The estimated annual provincial and federal income taxes payable (for 2012) on the estimated net annual salary increment post-BCCA averaged $7,934 for 2012 (the median value was $6,259 for 2012). Taxes payable ranged from $1,990 to $38,290.
Income Assistance Program Cost Savings
Eleven percent of participants in the survey had been on Income Assistance (IA) prior to becoming involved in the BCCA programs.
We estimate that the annual cost to the Province for these individuals averaged $12,220 per annum.1
The forgone spending on Income Assistance benefits to these workers is considered as a net cost saving to the BC Government and to society. Between January 2011 and February 2013, of the estimated 2,372 individual clients who attempted to go through the ASTEP, ITTI, STEP, and WTTI programs, roughly 1,325 were placed into jobs, with 91 having previously drawn on Income Assistance.
Assuming an average societal cost of $12,220 per IA client, we estimate a cost saving to the BC Government of roughly $1.112 million as a result of these clients being successfully placed into employment opportunities.
WellBeing Return on Investment
W-ROI is calculated as the ratio of incremental provincial/federal income taxes payable plus any IA cost savings associated with each individual client, over the average cost of processing a client through the program. The W-ROI can be interpreted as estimated number of months that it requires for Government funds invested in the BCCA programs to return back to provincial and federal government coffers.
The W-ROIs for the 2011-12 BCCA clients we evaluated averaged 1.67 (with a median value of 1.15). The average W-ROI for the STEP clients was 1.76, 0.65 for WITT clients, and 0.33 for the ITTI clients. This wide range reflects the diversity and variety of circumstances for each client and each respective BCCA program.
The W-ROI estimates can be translated into the number of months it takes for $1 of government investment in the BCCA programs to return back to provincial and federal government coffers.
For example, if the average estimated W-ROI for the BCCA clients was 1.67 this would equate to over 7 months and 5 days as the pay-back period. This could vary considerably for each client and for each BCCA program. The average pay-back period for the WITT participants was over 18 months while the ITTI clients had a pay-back period of over 36 months. Clients from STEP 3.0 had a pay-back period of less than 7 months, based on an average W-ROI of 1.76.
Scaling the Analysis to all BCCA Clients
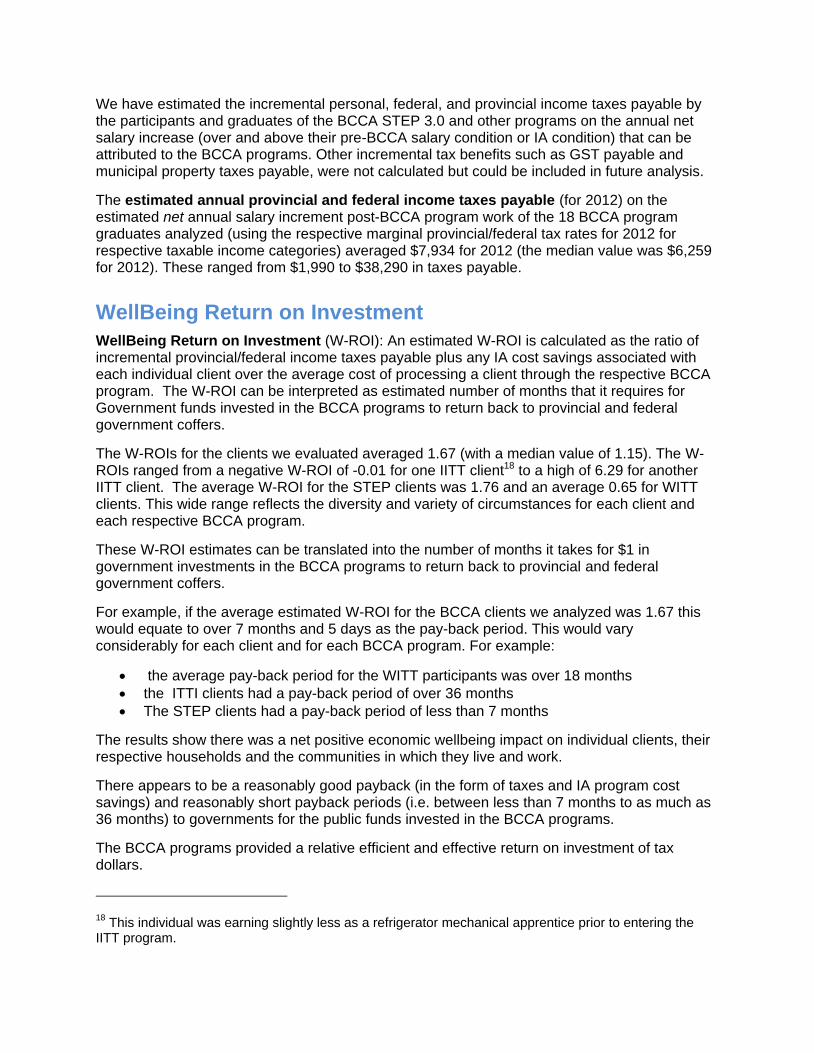
Applying the economic well-being impact assessment estimates of a sample of the 2011-12 BCCA placements to the total cohort of BCCA program participants (STEP, ITTI, WTTI, and ATTI) between 2011 and 2013 suggests that there are very positive societal economic well-being impacts, including incremental salary increases, more net income taxes payable to governments, and Income Assistance cost savings (see Table 1).2.
1 This rate is based on a maximum weekly rate of $235/week (size 1, rate schedule A) for a single
individual worker based on the most current IA rates from the BC Employment and Assistance Rates Tables (http://www.eia.gov.bc.ca/mhr/ia.htm), then calculated on an annualized basis. The rate assumed is conservative, in our opinion.
2 These estimated economic well-being impacts should be considered as preliminary estimates as they
were based on a small cohort of BCCA participants from the 2011-12 year who agreed to participate in our study. In future, a larger number (if not all) participants in BCCA programs should be evaluated using similar well-being impact criterion.

This preliminary assessment suggests a favourable societal return on investment or pay-back period of less than 10 months.
Table 1: BCCA Program Well-being Impacts for 2011-13
Well-being Impact Measure
BCCA Programs 2011-2013
Employee Placements 1345
Total Program Costs $7.55 million
Incremental Salary Benefits $31.0 million
Annual Income Tax Benefits to Governments (est.)
+$8.17 million incremental revenue
IA Cost Savings (est.) -$1.11 million -Reduced Cost
TOTAL Societal Benefit $9.28 million
Pay-Back Period Less than 10 months
JobMatch
In the past seven months of program operations (September 1, 2012 to March 31, 2013), the JobMatch program has placed roughly 366 into employment opportunities.
Of these, 152 (41.5%) had been on Employment Insurance (EI) and 69 (18.9 percent) had been on Income Assistance (IA) through the British Columbia Employment and Assistance program (BCEA).
Applying the same economic well-being impact analytics to the 329 individuals still employed since they entered the JobMatch program:
Average hours worked per week: 47.4
Average hourly salary: $23.91/hour (about 40 percent higher than the BC living wage of $17.13/hour).
Average estimated annual salary: $58,935
Total earnings of JobMatch employed clients: $19.39 million
Estimated income taxes (federal and provincial) payable on earnings: $5.76 million.
Estimated annual cost savings to BC Government from eliminating IA dependents: $841,800.
These preliminary results suggest that the estimated economic well-being impacts for JobMatch may be even more impressive than previous BCCA programs because JobMatch has shorter turn-around times between contact, placement, and program exit.

Stories and Testimonies: Lived Well-being Impacts
Personal well-being impact stories and testimonies were collected from 20 individual BCCA program participants from the 2011-12 operating year which provide powerful anecdotal information about the intangible well-being and quality of life impacts experienced by BCCA program participants, their families, their employers and their communities.
These testimonials complement and amplify the economic well-being impacts that were calculated providing a more comprehensive understanding of the well-being impacts and the genuine value of the BCCA programs.
Conclusions
Our study shows a net positive economic well-being impact on the individual client, their respective households and the communities in which they live and work.
There appears to be good payback to governments in the form of income taxes payable on the incremental salary benefits and cost savings from foregone Income Assistance program payouts.
The new JobMatch program will generate similar net well-being impacts upon completion of a full operating period in August 2013. Many of the qualitative impacts on quality of life of the worker, their families, their employer and their community were exhibited through the testimonials of participants.
We can conclude that the BCCA programs provide a relative efficient and effective return on investment of tax dollars, achieving the desired outcome of improving the skills of workers and matching these prospective employees with the demand for skilled labour.
Introduction
The objective of this work was to evaluate the net societal well-being impacts of the BCCA Connector Models.
The goal of our analysis is to demonstrate the well-being impacts to individuals, households, employers, and community from the publicly funded BCCA programs. This approach to assessing well-being impacts builds on successful analytic models such as Cost-Benefit Analysis tools and Social Return on Investment (SROI). This study lays the foundation for a new model called W-ROI (WellBeing Return on Investment).
What are the well-being impacts on individual participants in the BCCA Connector Model programs in terms of their overall individual or household economic well-being? What are the relative economic returns on government tax dollars invested in BCCA program/services? These are some of the questions explored in this report that lays the foundation for a deeper W-ROI or WellBeing Return on Investment analysis of the BCCA Connector Model programs.
The BCCA Connector Models: STEP and JobMatch
The BCCA has been developing and operating programs to assist unemployed or underemployed people enter the construction trades since 2005. The BCCA programs (including STEP and JobMatch) have successfully placed an estimated 7,000 clients into jobs. The programs were developed to answer to the need for skilled workers for employers in the construction industry and all operate from the demand-side needs.
All programs utilize Regional Trades Employment Specialists (REPS) to assist individuals interested in the skilled trades by identifying their skill level and recommending the proper employment path. If training is needed, the specialist works closely with each individual until they are ready for employment placement.
ISTEP
ISTEP (Immigrant Skilled Trades Employment Program) was a pilot project to help landed immigrants build careers in British Columbia’s construction industry and provide employers with skilled trades workers.
Immigrants with experience in construction or who wanted to start a career in the construction industry were matched up with employers with jobs available. Immigrants were required to have a standard of English which ensured their capability of doing their job, and doing it safely. They were paid at industry standards, according to their skill levels.
The ISTEP program ran successfully between June 2006 and August 15, 2010 placing roughly 1051 clients into employment opportunities.
A similar program, STEP 2.0, ran from April 15, 2009 until October 31, 2010 with 492 clients participating in the program. The next edition (STEP 3.0) was launched in November 2010,

and has processed 584 clients to date. In addition to the STEP programs, the BCCA administered STEP for Small Business between April 2009 and October 2010 with 719 clients.
STEP 3.0
STEP 3.0 was launched by the BCCA in 2010 to help individuals who have minimal experience in the trades and those wanting to enter the trades. The goal is to build opportunities for British Columbians to enter and advance in meaningful, well-paying construction careers. STEP 3.0 also helps businesses manage workforce fluctuations.
Participants include:
Unemployed/non-EI clients (not eligible for EI assistance nor has established a claim in the past 3 years (or 5 years for maternity leave)).
Employed, low-skilled clients (lacking recognized certification, high school diplomas, or essential skills)
The measures of success include:
One-on-one assessments
Complete assessments
Placing participants into employment in construction trades-related occupations
Placing participants into construction trades-related formal training
Providing participants with assistance to attain trade-related credentials or certification
Apprenticeship registration numbers
STEP 3.0 was funded through the Canada-BC Labour Market Agreement. The current funding year concludes March 31, 2014.
The following table provides a summary and comparison of the last three years of operations. The program operating cost per employee over three years averaged to $4,955 per placement. The placement time for a STEP 3.0 participant ranges from 1 day to 18 months.
Table 2: STEP 3.0 Placement and Cost Statistics
STEP 3.0 Actual Total
2010-11 Actual Total
2011-12 Actual Total
2012-13
Number of placements 492 251 596
Contract total $2,246,018 $1,079,583 $3,575,060
Innovation Fund (IF) total $346,663 $163,804 $568,425
Invoicing per placement $705 $653 $954
Total operating costs per placement
$4,565 $4,301 $5,998

Immigrants in Trades Training (IITT)
IITT was developed by the BCCA to help immigrants through their transition to apprenticeship, apprenticeship placement, and/or to challenge applications to gaining an ITA-recognized certificate. The focus is on increasing the number of LMA-funded participants who become registered apprentices and/or become ITA certified.
The IITT program has run successively from January 2009 to present, with 449 clients. Prior to IITT, the EU-STEP program (the IITT predecessor) placed 141 clients between 2007 and 2009).
Participants include:
Unemployed/non-EI clients (not eligible for EI assistance nor has established a claim in the past 3 years or 5 years for maternity leave)
Employed, low skilled clients
The measures of success include:
Placed into upgrading/training (essential skills, ESL, Code Refresher, Foundation, Technical training)
Employment into Skilled Trades positions (active ITA trade) leading to apprenticeship
Received apprentice registration
Attained ITA certificate
The current IITT program funding year concludes on March 31, 2014.
The following table provides a summary and comparison of the last three years of operation. The average operating cost per employee placement in the IITT program has ranged from $5,809 (2011-12) to $6,341(2012-13), with a three-year average operating cost of $6,083 per placement.
Table 3: ITTI Placement and Cost Statistics
ITTI Actual Total 2010-11
Actual Total 2011-12
Actual Total 2012-13
Number of placements 95 99 91
Invoicing per placement $4,500 $4,500 $4,674
Innovation Fund (IF) total $138,156 $117,806 $135,429
Total IF cost per placement
$1,454 $1,190 $1,488
Total operating costs per placement
$4,645 $4,619 $4,853
Total cost per placement $6,100 $5,809 $6,341

Women in Trades Training (WITT)
WITT was developed by the BCCA to support women participants through their transition to apprenticeship, apprenticeship placement, and/or challenge application to gaining an ITA-recognized certificate. The focus has been on increasing the number of LMA-funded participants who become registered apprentices and/or who become ITA certified.
The WITT program ran successive programs from January 2009 to present, with 326 clients placed. Prior to WITT, the STEP for Women program placed 116 women between August 2007 and July 2008.
Participants include:
Unemployed/non-EI clients (not eligible for EI assistance nor has established a claim in the past 3 years or 5 years for maternity leave).
Employed, low skilled clients
The measures of success include:
Placed into upgrading/training (essential skills, ESL, Code Refresher, Foundation, Technical training)
Employment into Skilled Trades positions (active ITA trade) leading to apprenticeship
Received apprentice registration
Attained ITA certificate
The current funding year for WITT concludes on March 31, 2014.
The following table provides a summary and comparison of the last three years of operations. The average operating cost per employee placement in the WITT program has ranged from $8,303 (2011-12) to $9,396 (2010-11), with a three-year average operating cost of $8,777 per placement.
Table 4: WITT Placement and Operating Costs, 2010/11 to 2012-13
WITT Actual Total 2010-11
Actual Total 2011-12
Actual Total 2012-13
Number of placements 52 80 78
Invoicing per placement $6,000 $6,000 $6,000
Innovation Fund (IF) total $160,539 $167,542 $183,300
Total IF cost per placement $3,087 $2,094 $2,350
Total operating costs per placement
$6,308 $6,209 $6,282
Total cost per placement $9,396 $8,303 $8,632

Aboriginals in Trades Training (AITT)
AITT was developed by the BCCA to support Aboriginal participants through their transition to apprenticeship, apprenticeship placement, and/or challenge application to gaining an ITA recognized certificate. The focus has been to increase the number of LMA-funded participants who become registered apprentices and/or who become ITA certified.
The AITT program has run successful programs from January 2009 to present, with 183 clients. Prior to AITT, the ASTEP Duncan pilot project placed 240 Aboriginals in 2005. Another 166 Aboriginal clients were placed into employment through the ASTEP program which ran between January 5, 2009 and March 31, 2010.
Participants include:
Unemployed/non-EI clients (not eligible for EI assistance nor has established a claim in the past 3 years or 5 years for maternity leave).
Employed, low skilled clients
The measures of success include:
Placed into upgrading/training (essential skills, ESL, Code Refresher, Foundation, Technical training)
Employment into Skilled Trades positions (active ITA trade) leading to apprenticeship
Received apprentice registration
Attained ITA certificate
The current AITT funding year concludes March 31, 2014.
The following table provides a summary and comparison of the last three years of operations. The average program operating cost per employee placement ranged from $4,500 (2011 pilot period) to $5,828 (2012-13), with a three-year average operating cost of $5,225 per placement.
Table 5: AITT Placement and Operating Costs, 2010/11 to 2012-13
AITT Actual Total 2010-11
Actual Total 2011-12
Actual Total 2012-13
Number of placements 12 90 60
Invoicing per placement $4,500 $3,400 $3,700
Innovation Fund (IF) total $15,114 $159,256 $114,000
Total IF cost per placement $1,259 $1,770 $1,900
Total operating costs per placement $3,241 $3,577 $3,928
Total cost per placement $4,500 $5,346 $5,828

JobMatch
The BCCA developed JobMatch to connect unemployed British Columbians with employment opportunities based on specific labour market vacancies in the industrial, commercial and institutional construction sectors.
The JobMatch program mobilizes qualified workers to local construction-based projects in all regions of the province, including the Northeast. They have the capacity and resources to make sure labour requirements are met quickly (within several weeks).
A unique aspect of JobMatch is the urgency created as a result of being a demand-driven program hiring less-skilled workers. Construction employers have high expectations to produce results quickly. The BCCA programs have the capacity to mobilize an unemployed client from one region of the province to another within 48 hours, in response to market demands.
This includes employer interviews, training, relocation, and starting the job. Although relocation has been a relatively small component of JobMatch to date, BCCA expects significant growth in those opportunities as they expand province-wide, adding offices in southern BC.
A significant asset of the JobMatch program is BCCA’s ability to quickly customize individual training agreements so they are precisely and immediately responsive to the needs of the employer and employee.
This has been a far more effective approach than group training. It is this specific capacity which is used by Placement Coordinators to encourage an employer to hire an individual who has some challenges which must be addressed before they are job-ready.
It is a more costly process per candidate but it also takes individuals off government support programs such as IA and EI, and creates employment for individuals who normally would not form an attachment to the construction sector.
Between the September 2012 inception of the $2.92 million3 JobMatch program and March 2013, an estimated 366 individuals participated in this new BCCA program with 252 being placed in employment opportunities.
Of the 366 participants, roughly 38.0% (139) were non-EI clients, 41.5% (152) were EI clients, 1.6% (6) were IA/BCEA applicants, 0.6% (36) were IA/BCEA over the last 0 to 12 months, and 18.9% (69) had been on IA/BCEA over the last 12 months or more. Of these 366 participants in JobMatch, 37 are no longer working, for several varied reasons.
Given that a full 12-month fiscal and operating period has not yet been completed, it is not possible to express the cost efficiencies of the JobMatch program on a per individual participant or per employee placement basis. JobMatch thus has an 80% success rate in finding candidates sustainable employment in the construction field.
Based on BCCA statistics, the average placement time for the 366 successfully job-matched participants ranged from 24-72 hours, between the time of contact with the BCCA JobMatch specialist and job placement.
3 The total cost of the JobMatch contract is $2.92 million with $1.7 million coming from the Innovation
Fund which is funded through a shared funding arrangement between the BC/Federal government employment support funding and employer funding.

Since the JobMatch program is relatively new, it is too early to evaluate the wellbeing impacts of this BCCA Connector Model. However, the same tools used to evaluate the STEP 3.0 program participants could be used to evaluate the JobMatch program after a complete annual lifecycle.
Table 6: JobMatch Placement and Operating Costs September 2012 to February, 2013
JobMatch Totals
September 2012 to February 2013
Number of placements 252
Contract total $2,920,000
Innovation Fund (IF) total $1,700,000
Cost per placement from IF funds (to date, February 2013)
$6,746
Total costs (contract) per placement $6,746
Genuine Wealth Model for Assessing WellBeing Impacts
The model used to assess the WellBeing impacts is the Genuine Wealth Model© developed by economist Mark Anielski of Anielski Management Inc.
This current study of the BCCA programs does not include the WellBeing impacts, but is focused on Phase 1 of the assessment – the financial return, which can be measured by quantitative data.
Establishment of a WellBeing Impact Evaluation Framework
The first step in the evaluation project is to establish the framework which provides a comprehensive economic and social impact assessment of STEP.
The assessment framework, using the Genuine Wealth Model, was developed in consultation with the various stakeholders involved with BCCA Connector Model programs. The Genuine

Wealth Model has been used successfully to evaluate the net societal WellBeing impacts of government programs.4
A relational map was developed to depict the relationship between the client/employee engaged and the various care-holders in their WellBeing.
Figure 1 shows this relational map, which includes the BCCA, the employer, the BC and Federal Governments (as funders of the BCCA programs), labour unions, and local communities in which the employee lives and works.
The individual participant/client is identified in the centre of the constellation of relationships as having five core assets as their building blocks for achieving a thriving and successful life.
These attributes are discussed in the following section.
Figure 1: WellBeing Impact Relational Map
for Relational Connector Models (STEP/JobMatch)
4 Anielski Management Inc. completed a similar net societal (economic, social, environmental) well-being
assessment for Alberta Environment’s recycling programs in 2009.
ANIELSKI © 2013
STEP/JobMatchpar cipants
Family
BCCA
FederalGovernment
B.C.Government
Community
Well-beingImpactRela onalMapforBCCAConnectorModels(STEP/JobMatch)
Employers
LabourUnions
Financial
Capital
Social
Capital
Human
Capital
Natural
Capital
Built
Capital
Social
Assets
Personal
Assets
Physical
Assets
Human
Assets
Financial
Assets
* Cooperation* Networks, interconnectedness* Family support* Friendships* Relationships of trust/exchanges* Partnership and collaboration* Political participation
* Motivation* Self-esteem* Self-confidence* Self-perception* Emotional well-being* Assertiveness* Spirituality
* Child/elder care* Secure shelter* Clean affordable energy* Information* Banking and access to related services* Basic consumer needs (e.g. local grocery store and other service)* Affordable transportation* Tools and equipment* Natural resources* Air and water quality
* Skills (including technical and interpersonal)* Knowledge* Ability* Employability and earning power* Good health* Leadership
* Income from productive activity (employment/self- employment)* Available finances/savings* Regular flows of money from:
* Government transfers* Family* Gifts* In-kind
* Credit rating* Access to credit
The Five Asset
Building Blocks
STEP/SKILLS participant

Identification of Impact Criterion and Indicators: Measuring What Matters to WellBeing
Working with a team representing the BCCA and STEP 3.0 participants, a suite of Key Performance Indicators (KPI) was developed. These KPIs represent meaningful measures of the personal, economic and societal impacts of the programs (STEP 3.0 and JobMatch) and are drawn from the Genuine Wealth Model (personal assets, physical assets, human assets, social assets and financial assets5).
See Appendix 4 for diagrams illustrating the Personal, Business, and Community Relational Maps.
Genuine Wealth Assessment and WellBeing-ROI
A Genuine Wealth Assessment measure how investments of time, money and resources contribute to changes in economic, societal and environmental wellbeing conditions. The Genuine Wealth Model uses both quantitative (objective) indicators and qualitative (subjective) indicators, amplified by stories/narrative and anecdotal information6, to provide a comprehensive assessment of wellbeing impacts.
The ultimate objective of a Genuine Wealth assessment is to derive a WellBeing Return on Investment (W-ROI) assessment that expresses WellBeing impacts (objective, subjective and stories) in relationship to the financial, time and other resources invested in the programs and services (see figure 2).
Figure 2: Genuine Wealth ROI Model
5 This model has also been proposed and used by the United Way of Northern Alberta in Edmonton.
6 Stories and narrative can be as important and powerful as objective statistics or indicators of
performance particularly in cases where impacts to quality of life and well-being are being assessed.
ANIELSKI © 2013
Financial
Capital
Social
Capital
Human
Capital
Natural
Capital
Built
Capital
ObjectiveWell-beingIndicators
SubjectiveWell-beingIndicators
Five Capitals Accounts
Genuine Wealth WROI Model
Wel l -being ROIANIELSKI © 2012
Well-being Value($$ per change in well-being)
NarrativeStories

The W-ROI assessment tool of the Genuine Wealth Model is a tool similar to SROI analysis (Social Return on Investment). W-ROI involves a full cost or monetized accounting (an advanced cost/benefit analysis tool) to assess the full costs and benefits of an organization’s operations or services or the net societal benefits of government programs/services.
The result is a ‘sustainable income’ statement which reveals not only revenues but also unaccounted intangible benefits (e.g. goodwill, trust, relational capital) and unfunded or contingent liabilities which risk the capacity of an enterprise or organization to flourish and remain resilient. We call this analysis W-ROI or WellBeing Return On Investment.
W-ROI builds on the success and standardization of SROI (Social Return On Investment) model7 used by foundations, private investors and philanthropists, government agencies, academics, private social service agencies and other nonprofits. For the assessment of the BCCA programs, only a partial W-ROI was conducted – namely, the economic wellbeing impact analysis.
BCCA Connector Model Genuine Wealth Assessment and WellBeing Impact Assessment
Understanding the Data
The analysis conducted in this study constitutes qualitative research in which 3.5% (18) of the 520 total STEP 3.0 placements were successfully contacted and surveyed about their financial and employment conditions along with their personal stories.
Because of the recent launch of the JobMatch program (beginning in September 2012) it was not possible to apply the same W-ROI. However, the same accounting and assessment protocols applied to the STEP 3.0 program can be applied to the JobMatch program.
The WellBeing benefits we have estimated may not be sustained over time. For example, some participants may become unemployed again, may go back to school or further skill training, or other life circumstances arise where their employment situation changes.
It is difficult to scale up the individual participant experiences for the entire BCCA programs participant cohort or to the larger economy-wide impact scale, as each individual’s circumstances, respective trades/skills and other life circumstances vary greatly. However, we are able to determine a typical or ‘average’ set of circumstances.
7 For many years nonprofits have attempted to document the non-monetizable benefits they have
generated, and many organizations have attempted to calculate their SROI as part of their attempts to measure the outcomes of programs more comprehensively.

Societal Economic WellBeing Impacts: the Costs of Unemployment and Underemployment
The societal economic wellbeing costs of underemployment8 and unemployment can be substantial to the individual worker, their families, to communities and to entire economies. These include losses of productive output to the economy and potential loss of skills due to minimal work experience.
Socially, unemployment in particular is linked with increased suicide, increased crime, increased family breakdown, negative psychological impacts as well as trauma, stress and low self-esteem.
Many of these societal costs, while being identified and assessed in qualitative terms, cannot be easily monetized even though they should make up part of a full wellbeing cost impact analysis.
In this component of the GPI we need to be particularly mindful of the dangers of double counting.
The costs of unemployment are the following:
1. Loss of output in the economy due to under-utilization of factors of production; 2. Loss of human capital due to declines in levels of skills, especially as a result of long-
term unemployment; 3. Declining levels of health and increasing suicide among the unemployed; 4. Increasing levels of crime associated with higher unemployment; 5. Increasing rates of family breakdown; 6. Psychological impacts on the families of unemployed people; and 7. Trauma, stress and loss of self-esteem associated with being unemployed.9
What is known is that many of these societal wellbeing impacts do show up in the provincial and national GDP (national income accounts) in terms of expenditures by individuals, businesses, and government programs and services to alleviate deal with these impacts.
New research into the emerging field of the economics of happiness and wellbeing shows that unemployment and underemployment is one of the greatest detractors of self-rated happiness and wellbeing. Economists such as Dr. John Helliwell (UBC) have conducted studies that show that unemployment is one of the most significant risks to wellbeing.10
8 Underemployed workers are defined as those who work part-time but would like to work full-time. These
are workers performing tasks that do not make full use of their skills and experience. The absence of reliable time series data on underemployment in BC meant that this aspect of our wellbeing impact analysis is incomplete.
9 Clive Hamilton and Richard Denniss, 2000. Tracking Well-being in Australia The Genuine Progress
Indicator 2000. Prepared by Australia Institute, 2000.
10 New measures of the costs of unemployment: Evidence from the subjective well-being of 2.3 million
Americans. Paper and presentation by John F. Helliwell and Haifang Huang∗ February 24, 2011, University of Alberta. NBER Working Papers 16829, National Bureau of Economic Research, Inc.
When people become unemployed they experience sharp falls in wellbeing and their wellbeing remains at this low level until they are re-employed.11 The main impact of unemployment on wellbeing is not through the loss of income, per se, but rather the loss of social status, self-esteem, workplace social life, and other factors that matter to quality of life.12
High unemployment has spillover effects the families of the unemployed as well as on those workers, who may feel less secure in their jobs. Private sector employees are more affected than public sector employees, who jobs are more secure.13
There are no studies of society costs of un- and under-employment for British Columbia, but estimates are available for Alberta (The Alberta Genuine Progress Indicator (GPI) study in 200114). The cost of unemployment in Alberta in 2003 (when the unemployment rate was 5.1% with 92,100 unemployed workers) was estimated at $2.7 billion or 2.1% of Alberta’s GDP. The cost of underemployment15 in Alberta in 2003 was estimated at $87 million or 0.07% of Alberta’s GDP.
Marginal Wage Benefits
The economic and financial benefits that result from the BCCA STEP 3.0 and other Connector programs were evaluated in terms of the marginal wage benefit, by evaluating the difference between wages (or IA benefits) earned prior to participating the STEP 3.0 program and wages being earned after being successful placed in a new employment situation as a result of the STEP 3.0 program.
The net increment in average weekly salaries averaged $264/week or a 60.6% increase in average weekly wages. Converted to annual salary terms, the average net annual salary increment was $20,517 ranging (the median value was $14,431/annum) from a loss of income (due to a condition of moving into a lower paying apprenticeship position from a previous full-time trade position) to $100,000 net annual salary increment.
The average estimated hourly salary was $22.56 (the median value was $20.29/hour), or more than 33 percent higher than the estimated $16.90 living wage salary estimates for the respective communities in which these participants live and work.
The benefits of incremental individual and household disposable income will increase personal and household purchasing power with increased expenditures on housing, food, transportation and other services having a positive impact on local community economies.
11 The World Happiness Report. 2012. Edited by John Helliwell, Richard Layard and Jeffrey Sachs.
12 Ibid.
13 Ibid.
14 Anielski, Mark and Amy Taylor. 2001. The Alberta GPI Accounts: Employment. Prepared for Western
Economic Diversification. Pembina Institute. January 23, 2001.
15 Underemployment is defined as those who sought full time work but could only find part time
work. Thus, for an individual to be considered underemployed, they must be looking for full time employment.

Living Wage Benefit
Ideally, workers in society should be earning a living wage which provides for their material and well-being needs. The ‘living wage’ is a wage sufficient to support one’s own and family needs based on the actual cost of living in a specific community.
A living wage is different from the minimum wage, which is the legislated minimum set by the provincial government. The living wage calls on employers to meet a higher standard for both their direct staff and major contractors.
Living wage estimates are available for various regions and communities in British Columbia.16 Based on the table below, the average living wage for British Columbia was roughly $17.13/hour.
Table 7: Living Wage estimates (annual and hourly) for BC
Annualized Living
Wage/Income Hourly Living Wage
Metro Vancouver $34,835 $19.14
Sunshine Coast $34,216 $18.80
Greater Victoria $34,216 $18.07
Kamloops $32,669 $17.95
Regional District of Central Okanagan
$31,249 $17.17
District 69 (Qualicum) $30,831 $16.94
Prince George $30,758 $16.90
Fraser Valley $29,793 $16.37
Williams Lake $28,701 $15.77
Cranbrook $25,771 $14.16
16 See http://livingwageforfamilies.ca/?page_id=7

Our analysis of the impacts of the BCCA Connector programs assesses the wages of a successful STEP 3.0 or other Connector program placement in their current employment situation relative to the relative living wage estimate for the community in which they work and reside.
Income Assistance Program Cost Savings
Many participants in the BCCA Connector programs were previously drawing Income Assistance (IA) benefits from the B.C. Government. STEP 3.0 and other Connector programs draws from self-declared IA recipients, which the JobMatch program is pulling from Employment Insurance (EI).
About 11% of placement workers assessed had been on Income Assistance (IA) prior to becoming involved in the STEP, WITT or the ITTI programs. We estimate that the annual cost to the Province for these individuals averaged $12,220.17
The forgone spending on Income Assistance benefits to these workers is considered as a net cost saving to the BC Government and society.
Alternatively, there is a net financial benefit to the provincial economy from these workers being employed and paying provincial and federal income taxes on their incremental earnings as a result of the benefits of the BCCA programs.
Between January 2011 and February 2013, of the estimated 2,372 individual clients who attempted to go through the ASTEP, ITTI, STEP, and WTTI programs, roughly 1,325 (55.9% of entrants) were placed into jobs.
Of these job-placed clients, 91 had previously been on Income Assistance. Assuming an average societal cost of $12,220 per IA client, we estimate a cost saving to the BC Government of roughly $1.112 million as a result of these 91 clients being successfully placed into employment opportunities.
The average cost per client of for administering the respective BCCA programs was $6,447 (with a median value of $5,789). This ranged from an average per client cost of $4,955 per STEP client, $6,083 per ITTI client and $8,777 per WTTI client.
These costs will vary over time and across programs depending on the changing circumstances of the client group and administrative processes.
Income Tax Benefits to Government
As a result of being placed into a new job or employment situation, workers are now contributing to provincial and federal income taxes (personal income tax, GST, and other taxes), as well as contributing to local municipal taxes (e.g. property taxes).
17 This rate is based on a maximum weekly rate of $235/week (size 1, rate schedule A) for a single
individual worker based on the most current IA rates from the BC Employment and Assistance Rates Tables (http://www.eia.gov.bc.ca/mhr/ia.htm), then calculated on an annualized basis. The rate assumed is conservative, in our opinion.
We have estimated the incremental personal, federal, and provincial income taxes payable by the participants and graduates of the BCCA STEP 3.0 and other programs on the annual net salary increase (over and above their pre-BCCA salary condition or IA condition) that can be attributed to the BCCA programs. Other incremental tax benefits such as GST payable and municipal property taxes payable, were not calculated but could be included in future analysis.
The estimated annual provincial and federal income taxes payable (for 2012) on the estimated net annual salary increment post-BCCA program work of the 18 BCCA program graduates analyzed (using the respective marginal provincial/federal tax rates for 2012 for respective taxable income categories) averaged $7,934 for 2012 (the median value was $6,259 for 2012). These ranged from $1,990 to $38,290 in taxes payable.
WellBeing Return on Investment
WellBeing Return on Investment (W-ROI): An estimated W-ROI is calculated as the ratio of incremental provincial/federal income taxes payable plus any IA cost savings associated with each individual client over the average cost of processing a client through the respective BCCA program. The W-ROI can be interpreted as estimated number of months that it requires for Government funds invested in the BCCA programs to return back to provincial and federal government coffers.
The W-ROIs for the clients we evaluated averaged 1.67 (with a median value of 1.15). The W-ROIs ranged from a negative W-ROI of -0.01 for one IITT client18 to a high of 6.29 for another IITT client. The average W-ROI for the STEP clients was 1.76 and an average 0.65 for WITT clients. This wide range reflects the diversity and variety of circumstances for each client and each respective BCCA program.
These W-ROI estimates can be translated into the number of months it takes for $1 in government investments in the BCCA programs to return back to provincial and federal government coffers.
For example, if the average estimated W-ROI for the BCCA clients we analyzed was 1.67 this would equate to over 7 months and 5 days as the pay-back period. This would vary considerably for each client and for each BCCA program. For example:
the average pay-back period for the WITT participants was over 18 months
the ITTI clients had a pay-back period of over 36 months
The STEP clients had a pay-back period of less than 7 months
The results show there was a net positive economic wellbeing impact on individual clients, their respective households and the communities in which they live and work.
There appears to be a reasonably good payback (in the form of taxes and IA program cost savings) and reasonably short payback periods (i.e. between less than 7 months to as much as 36 months) to governments for the public funds invested in the BCCA programs.
The BCCA programs provided a relative efficient and effective return on investment of tax dollars.
18 This individual was earning slightly less as a refrigerator mechanical apprentice prior to entering the
IITT program.

Quality of Life Impacts: Stories and Testimonies
Personal stories and testimonies provide powerful anecdotal input to the lived experience of employees, their employers and their communities.
Personal stories were collected from various STEP, WITT, ITTI, and AITT program participants for the 2012-13 program operating period. These stories are contained in the Appendix 3 of this report.
Anecdotal information, while not translatable into quantitative or monetary equivalents, provides the importance qualitative impact input which is key to understanding the experiential well-being impacts experienced by the BCCA program participants and their employers.
These testimonies attest the genuine value of the BCCA programs in matching the capacities and energy of skilled labour, with the needs of their employers, for the benefit of their communities and the BC economy.
Because of limits to information about other aspects of the BCCA clients’ economic life, we did not extend our tax impact analysis to include GST payable on goods and services or municipal property taxes payable on housing/property. This could be conducted in future assessments.
Summary of Wellbeing Impacts of all BCCA Programs
We applied the results of the wellbeing impact assessment of the BCCA participants to all BCCA program participants (a total of 1345 successful placements) for a two-year period January 2011 to February 2013 (Table 8).
Table 8 summarizes the wellbeing impacts of all BCCA programs with a summary for all programs.
Table 8: BCCA Program Well-being Impacts for 2011-13
Well-being Impact
Measure STEP ITTI WTTI ATTI
Totals (All BCCA
programs)
Employee Placements
847 190 158 150 1345
Total Program Costs
$4,196,780 $1,152,117 $1,404,358 $830,862 $7,584,116
Incremental Salary Benefits
$26,426,400 $1,884,800 $1,392,640 $1,305,600 $31,009,440
Annual Income Tax Benefits to Governments
(est.)
$6,398,712 $378,091 $1,092,901 $296,371 $8,166,075
IA Cost Savings (est.)
$(647,660) Reduced Cost
0 (no IA
recipients)
$(183,300) Reduced
Cost
$(281,060) Reduced
Cost
($1,112,020) Reduced
Cost
TOTAL Societal Benefit
$7,046,372 $378,091 $1,276,201 $577,431 $9,278,095
Pay-Back Period
7 months 36 months 13 months 17 months 10 months
What about the new JobMatch Program?
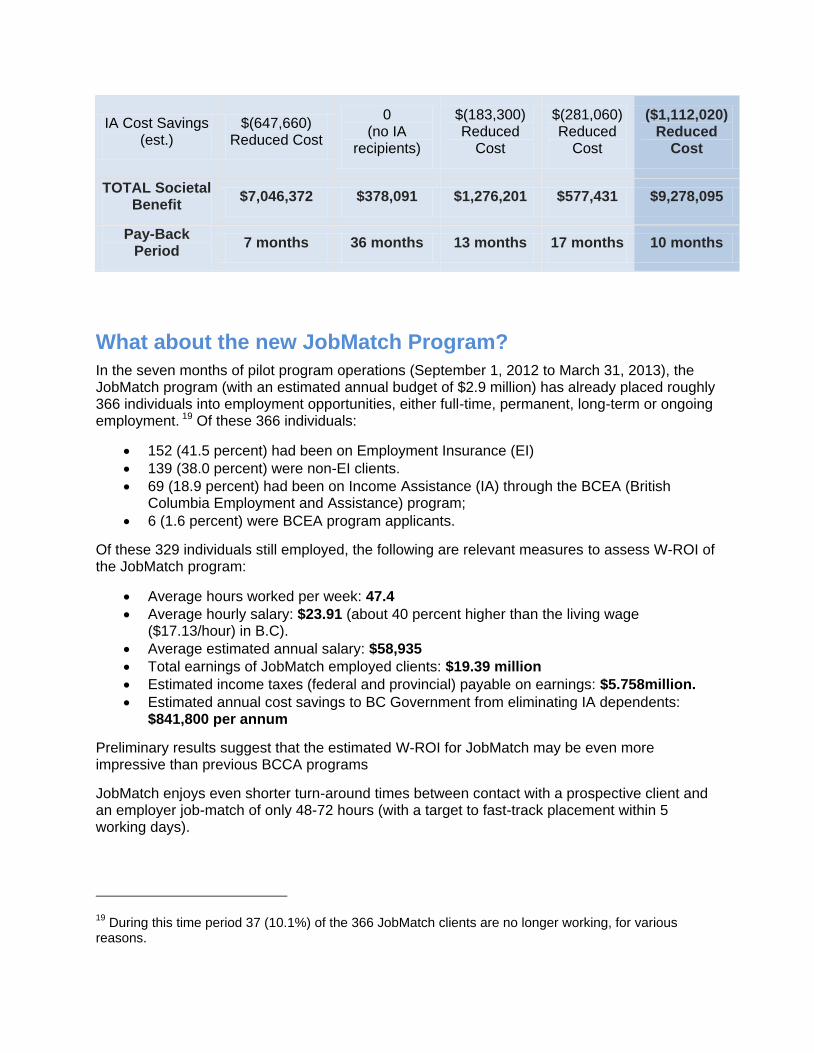
In the seven months of pilot program operations (September 1, 2012 to March 31, 2013), the JobMatch program (with an estimated annual budget of $2.9 million) has already placed roughly 366 individuals into employment opportunities, either full-time, permanent, long-term or ongoing employment. 19 Of these 366 individuals:
152 (41.5 percent) had been on Employment Insurance (EI)
139 (38.0 percent) were non-EI clients.
69 (18.9 percent) had been on Income Assistance (IA) through the BCEA (British Columbia Employment and Assistance) program;
6 (1.6 percent) were BCEA program applicants.
Of these 329 individuals still employed, the following are relevant measures to assess W-ROI of the JobMatch program:
Average hours worked per week: 47.4
Average hourly salary: $23.91 (about 40 percent higher than the living wage ($17.13/hour) in B.C).
Average estimated annual salary: $58,935
Total earnings of JobMatch employed clients: $19.39 million
Estimated income taxes (federal and provincial) payable on earnings: $5.758million.
Estimated annual cost savings to BC Government from eliminating IA dependents: $841,800 per annum
Preliminary results suggest that the estimated W-ROI for JobMatch may be even more impressive than previous BCCA programs
JobMatch enjoys even shorter turn-around times between contact with a prospective client and an employer job-match of only 48-72 hours (with a target to fast-track placement within 5 working days).
19 During this time period 37 (10.1%) of the 366 JobMatch clients are no longer working, for various
reasons.

Appendices
Appendix 1: Economic Well-Being Analysis Results
Participant/ Respondent
BCCA Program
Weeks worked per year before joining BCCA
program Date joined
BCCA programs
Weeks worked per year after joining BCCA
program
Weekly salary prior to joining BCCA program
Estimated annual
earnings after BCCA
Estimated net salary
benefit due to STEP
Income taxes payable on net annual salary due to STEP
Estimated annual cost of unemploymen
t or under-employment
BCCA average cost per participa
nt
WellBeing Return on Investment
(WROI)
A IITT 50 Apr-12 52 $960 $47,840 $(160) $(32) $6,083 (0.01)
B IITT 0 Feb-12 50 $0 $100,000 $100,000 $38,290 $6,083 6.29
C IITT 14 Apr-12 26 $480 $16,640 9,920 $1,990 $6,083 0.33
D STEP 44 Jul-10 52 $840 $43,680 $6,720 $1,996 $4,955 0.40
E STEP 0 May-11 52 $235 $31,200 $31,200 $6,259 $12,220 $4,955 3.73
F STEP 0 Apr-12 44 $320 $38,280 $38,280 $8,690 $5,495 1.58
G STEP 50 Apr-11 52 $560 $41,600 $13,600 $9,443 $4,955 1.91
H STEP 44 Nov-11 12 $840 $8,400 $(28,560) $1,907 $4,955 0.38
I STEP 0 Dec-11 52 $332 $33,280 $33,280 $7,555 $12,220 $4,955 3.99
J STEP 26 Apr-12 52 $230 $38,480 32,500 $8,735 $4,955 1.76
K STEP 0 Dec-11 52 $572 $37,440 37,440 $8,499 $12,220 $4,955 4.18
L STEP 3 Sep-11 24 $32 $15,360 15,263 $3,487 $4,955 0.70
M WITT 52 Jul-12 52 $448 $31,200 $7,904 $6,259 $8,777 0.71
N WITT 26 Aug-12 0 $267
Still in school
$8,777 -
O WITT 3 Apr-12 0 $205
In school $8,777 -
P WITT 42 Jul-12 52 $880 $53,664 $16,704 $15,938 $8,777 1.82
Q WITT 0 27 $235 $9,504 $9,504 $2,823 $12,220 $8,777 1.71
R WITT 52 May-12 52 $400 $25,480 $4,680 $5,111 $8,777 0.58
Averages
22.6
39.06 $435 $35,753 $20,517 $7,934 $6,447 1.67
Median 20.0 $366 $35,360 $14,432 6,259 $5,789 1.15
*Indicates online survey

Appendix 2: BCCA Program Statistics STEP is administered by the BCCA. As such, STEP management at the local/regional level is executed from the STEP offices within BCCA’s four regional associations, as indicated in the columns below.
Gender
BC Construction Association North
(BCCA-N)
Southern Interior Construction
Association (SICA)
Vancouver Island Construction
Association (VICA)
Vancouver Regional Construction
Association (VRCA) Unlisted Region Total
Female 34 13 9 45 0 101
Male 538 471 412 995 10 2426
Unknown 0 2 0 1 0 3
Age
18 to 29 262 166 222 490 3 1143
30 and older 310 320 199 551 7 1387
Income Assistance
Yes 51 70 50 151 2 324
No 517 409 362 860 7 2155
Unknown 4 7 9 30 1 51
Immigrant
Yes 19 83 12 168 3 285
No 500 289 299 628 5 1721
Unknown 53 114 110 245 2 524
Employment Status
Employed 82 194 164 237 0 677
Unemployed 489 291 255 801 10 1846
Unknown 0 1 2 3 0 6
Aboriginal Status
First Nations 75 25 48 38 1 187
Inuit 1 0 1 1 0 3
Metis 12 9 7 29 0 57
Not Aboriginal 481 448 362 957 9 2257
Unknown 3 4 3 16 0 26

Education Level
BC Construction Association North
(BCCA-N)
Southern Interior Construction
Association (SICA)
Vancouver Island Construction
Association (VICA)
Vancouver Regional Construction
Association (VRCA) Unlisted Region Total
Less than high school 121 118 99 180 2 520
High school (or equivalent) 293 230 184 389 5 1101
Some post-secondary 111 70 86 220 3 490
Non-university certificate or diploma (such as trade
certificate) 41 56 42 195 0 334
University – Bachelor’s degree 6 9 9 44 0 68
University – above Bachelor’s degree
0 3 1 10 0 14
Unknown 0 0 0 3 0 3
Employment
Employed 76 117 137 207 0 537
Self-employed 6 77 27 30 0 140
Unemployed – Have looked for work in the past four weeks
445 239 215 700 10 1609
Unemployed – Have not looked for work in past four weeks
5 16 12 36 0 69
Unemployed – On temporary layoff and available for work
21 26 21 41 0 109
Unemployed – Available with new jobs starting within four
weeks 18 10 7 24 0 59
Unknown 1 1 2 3 0 7
Education vs. Employment: Employed
Less than high school 20 24 29 45 0 118
High School (or equivalent) 37 63 71 97 0 268
Non-university certificate or diploma (such as trade certificate)
5 14 7 16 0 42
Some post-secondary 13 14 30 38 0 95
University – Bachelor’s Degree 1 2 0 9 0 12
University – above Bachelor’s Degree
0 0 0 2 0 2

Education vs. Employment:
Self-Employed
BC Construction Association North
(BCCA-N)
Southern Interior Construction
Association (SICA)
Vancouver Island Construction
Association (VICA)
Vancouver Regional Construction
Association (VRCA) Unlisted Region Total
Less than high school 3 16 10 4 0 33
High School (or equivalent) 3 39 13 10 0 65
Non-university certificate or diploma (such as trade certificate)
0 4 3 4 0 11
Some post-secondary 0 18 1 9 0 28
University – Bachelor’s Degree 0 0 0 2 0 2
University – above Bachelor’s Degree
0 0 0 1 0 1
Education vs. Employment: Unemployed (available for
work and have job to start in 4 weeks)
Less than high school 3 3 4 3 0 13
High School (or equivalent) 8 5 3 6 0 22
Non-university certificate or diploma (such as trade certificate)
2 1 0 4 0 7
Some post-secondary 5 1 0 9 0 15
University – Bachelor’s Degree 0 0 0 2 0 2
University – above Bachelor’s Degree
0 0 0 0 0 0
Education vs. Employment: Unemployed (have looked for
work in last four weeks)
Less than high school 90 62 49 112 2 315
High School (or equivalent) 230 113 84 246 5 678
Non-university certificate or diploma (such as trade certificate)
31 24 29 156 0 240
Some post-secondary 90 32 45 151 3 321
University – Bachelor’s Degree 4 6 8 25 0 43
University – above Bachelor’s Degree
0 2 0 7 0 9

Education vs. Employment:
Unemployed (have not looked for work in last four weeks)
BC Construction Association North
(BCCA-N)
Southern Interior Construction
Association (SICA)
Vancouver Island Construction
Association (VICA)
Vancouver Regional Construction
Association (VRCA) Unlisted Region Total
Less than high school 0 8 3 7 0 18
High School (or equivalent) 4 2 3 14 0 23
Non-university certificate or diploma (such as trade certificate)
1 4 1 4 0 10
Some post-secondary 0 0 3 7 0 10
University – Bachelor’s Degree 0 1 1 4 0 6
University – above Bachelor’s Degree
0 1 1 0 0 2
Education vs. Employment: Unemployed (on temporary
layoff and available for work)
Less than high school 5 5 4 9 0 23
High School (or equivalent) 11 7 9 16 0 43
Non-university certificate or diploma (such as trade certificate)
2 9 2 9 0 22
Some post-secondary 3 5 6 6 0 20
University – Bachelor’s Degree 0 0 0 1 0 1
University – above Bachelor’s Degree
0 0 0 0 0 0
Unknown 0 0 0 0 0 0
*Note: Employment status is “Unknown” for 7 participants

Appendix 3: BCCA Connector Programs’ Eligibility Checklist & Programs Summary
Program Purpose Participants Measurable Objectives or Deliverables
Skilled Trades Employment Project 3.0 This second phase (third term) focuses on strengthening and growing BC’s skilled trades in the Construction sector End date – March 31, 2013
Enhancing the opportunities of non-EI eligible persons and low-skilled employees to enter and advance in meaningful, well-paying construction trades related careers
Assisting businesses to manage workforce fluctuations by creating a highly skilled workforce
Unemployed / Non-EI clients (not eligible for EI, nor has established a claim in the past 3 years or 5 years for maternity leave)
Employed, low skilled Be legally entitled to work in Canada Be living in BC Not be a student Not currently participating in another LMA-
funded program Not receiving funding under any other
government funded labour market program
One-on-one Assessments Complete Assessments Placements involve:
- placing participants into employment in construction trades-related occupations
- placing participants into construction trades-related formal training
- providing participants with assistance to attain trade-related credentials or certification
Apprenticeship Registration numbers
Immigrants In Trades Training (IITT) End date – March 15, 2013
To help Immigrants: To support participants through their
transition to apprenticeship, apprenticeship placement, and/or challenge application to gaining an ITA recognized certificate
The focus is on increasing the number of LMA funded participants who become registered apprentices and/or who become ITA certified
Unemployed / Non-EI clients (not eligible for EI, nor has established a claim in the past 3 years or 5 years for maternity leave)
Employed, low skilled Be legally entitled to work in Canada Be living in BC Not be a student Not currently be participating in another LMA
funded program
Placed into Upgrading/Training (Essential Skills, ESL, Code Refresher, Foundation, Technical training)
Employment into Skilled Trades position (active ITA trade) leading to apprenticeship Received Apprentice Registration Attained ITA Certificate (not Supervisory &
Sign-Off Authority)
Women In Trades Training (WITT) End date – March 15, 2013
To help Women: To support participants through their transition to apprenticeship, apprenticeship placement, and/or challenge application to gaining an ITA recognized certificate The focus is on increasing the number of LMA funded participants who become registered apprentices and/or who become ITA certified
Unemployed / Non-EI clients (not eligible for EI nor has established a claim in the past 3 years or 5 years for maternity leave)
Employed, low skilled Be legally entitled to work in Canada Be living in BC Not be a student Not currently be participating in another LMA
funded program
Placed into Upgrading/Training (Essential Skills, ESL, Code Refresher, Foundation, Technical training)
Employment into Skilled Trades position (active ITA trade) leading to apprenticeship Received Apprentice Registration Attained ITA Certificate (not Supervisory &
Sign-Off Authority)
Aboriginals In Trades Training (AITT) End date – March 15, 2013
To help Aboriginals: To support participants through their transition to apprenticeship, apprenticeship placement, and/or challenge application to gaining an ITA recognized certificate Focus on increasing the number of LMA-
funded participants who become registered apprentices and/or who become ITA certified
Unemployed / Non-EI clients (not eligible for EI nor has established a claim in the past 3 years or 5 years for maternity leave)
Employed, low skilled Be legally entitled to work in Canada Be living in BC Not be a student Not currently be participating in another LMA
funded program
Placed into Upgrading/Training (Essential Skills, ESL, Code Refresher, Foundation, Technical training)
Employment into Skilled Trades position (active ITA trade) leading to apprenticeship Received Apprentice Registration Attained ITA Certificate (not Supervisory &
Sign-Off Authority)

Definitions Unemployed – Non-EI Clients
Non EI clients are individuals who do not currently qualify for (not eligible for) Employment Insurance (EI benefits) and have not established a claim, and/or been in receipt of EI benefits within the past three years (or five years for those who received maternity or parental benefits).
A Non-EI client is NOT eligible for assistance under labour market programs provided by the Canada Employment Insurance Commission under Part II. Be legally entitled to work in Canada. Be living in BC (BC Drivers’ License or BC Care Card are proof of residence) Not be a full-time post-secondary student Not be a high school student Not be participating in another Canada-BC Labour Market Agreement funded program Employed Clients – Full Time >30 hours / week and Part Time < 30 hours / week
Employed – Is receiving, or entitled to receive, wages for work performed for an employer and who is subject to regular employment deductions Self Employed - Working business owner, includes farm or professional. Low skilled are those who do not have any post-secondary education towards a degree, do not have a high school diploma (or equivalent) or recognized certification Has high school diploma (or equivalent) but lacks essential skills (this should be verified) Self Employed
Persons who are working owners of an incorporated or un-incorporated business, farm, or professional practice, with or without paid help. Self Employed include unpaid family members for business such as a farm or professional practice owned and operated by another member living in the same dwelling.
General Essential Skills – Reading Text, Document Use, Numeracy, Writing, Oral communications, Working with others, Thinking skills, Computer Use,
Continuous learning (HRSD Canada). Low-skilled are those who do not have any post-secondary education towards a degree, do not have a high school diploma (or equivalent) or recognized certification. Immigrants are defined as individuals who were foreign-born and have been permitted by immigration authorities to live in Canada permanently.
Document Control No. 3 – Aug 1-12

Appendix 4: Building Blocks of Individual, Business, and Community Genuine Wealth The assessment for the BCCA Connector Models uses the Genuine Wealth models for the individual, business/enterprise and community to understand the interrelationship between the flourishing of an individual’s capacities and wellbeing, a flourishing enterprise/business or employer and a flourishing community. The Genuine Wealth Model is a suitable tool for assessing the relative performance and success of the BCCA Connector Models/programs is it pertains to improving the conditions of wellbeing for individual participants, their families, businesses who employ them and the community, at large.
Five Asset Building Blocks of Individual Genuine Wealth

Genuine Wealth model for Business/Enterprise/Organizations
The Genuine Wealth five-capital-asset model also applies at the enterprise, business or organization level except that the five capital assets are defined as: financial assets, built assets, natural assets, human and social assets. The following diagram shows these five capital asset classes with some examples of indicators. This enterprise or business-based Genuine Wealth model has been used successfully as a corporate sustainability assessment tool for Suncor Energy and Epcor (Edmonton public utility).

Genuine Wealth Model for Communities and Nations
The Genuine Wealth model for communities (or provincial and national levels) uses the same integrated five-capital asset framework used for business/enterprise to evaluate the overall wellbeing conditions of the human, social, natural, built and financial capital assets. The Genuine Wealth model has been used and applied in several communities (e.g. Leduc (Alberta), Edmonton, Innsbruck (Austria), the province of Alberta and for China’s municipal governments) to assess overall economic, societal and economic wellbeing. The following diagram shows a Community Genuine Wealth framework with suggested indicators to measure wellbeing.

Appendix 5: BCCA Connector/STEP Participant Personal Stories
The following are the personal testimonials/stories of some of the recent participants in the STEP 3.0 and other BCCA Connector Model programs (AITT, WITT, ITTI) who have been successfully placed in employment opportunities. In some cases, employer testimonials have also been provided.
Maxime Cyr
Red Seal Roofer STEP 3.0: Skilled Trades Employment Program
Maxime Cyr joined STEP in December of 2011. He moved to B.C. from Quebec with a goal to find a solid career path in the trades. He was 23 years old with plenty of entry-level experience as a labourer in various trades, but lacked formal training and knowledge. He was unaware of how B.C.’s apprenticeship system could help him advance in one dependable trades career.
Because Maxime had worked on construction sites alongside roofers and carpenters and found casual jobs as a building maintenance worker, he chose to pursue a carpentry apprenticeship with the help of TES Faith Dempster. He was appreciative of the employer connections he was given through STEP, as he had a limited network here in B.C.
Maxime’s experience with finding permanent trades employment on his own was not successful, before using STEP – when we met him, he feared he would have to move back to Quebec because he was not close to achieving any professional goals. Faith assessed Max and helped him create a trades-oriented resume, showing Maxime how he could market his accumulated skills to employers.
After creating an action plan with Maxime, to set him up for success in the trades, Faith helped him find work in construction with exposure to carpentry, and a chance at an apprenticeship registration. Unfortunately because of the unstable winter season, this employer was not able to offer full time employment immediately upon hiring him - they were experiencing delays in starting some larger projects.
Maxime and Faith decided to try another job placement instead of waiting for full time hours to begin with the first interested employer. The top priority for the next job sourcing was to find a supportive employer who would apprentice Maxime to help him advance his trades skills, but who could offer year-round employment and full time hours. Maxime marketed his roofing exposure and experience with cutting, measuring and problem-solving, and secured a position as a Roofing Helper after being set up with an interview with Neo Roofing Solutions.
Neo has enjoyed having him on their team and have now officially registered him as a Roofing Apprentice. Maxime is learning shingling, metal cladding, and torch-on flat roofing – he has exposure to the full scope of his designated trade with this job placement. Maxime is commonly referred to as their “best apprentice,” and Neo plans to sponsor him through ITA-recognized Level 1 Roofing training in the near future.

Jason Wood, Neo Roofing’s owner and operator, says he is grooming Maxime for long-term advancement in the company. Jason says, “This is the first time I have had an apprentice with such a strong sense of responsibility. He cares about his work and our company’s reputation. I can also rely on him for superior problem-solving and for completing projects to our high standards. This is the kind of employee I reward with promotions and specialized training opportunities.”
Maxime is happy because he fits in with the crew, has one-on-one training under two Journeymen Roofers, and occasional visits to suppliers for product training and demonstrations. He describes Neo Roofing Solutions as a company he would like to grow with. Maxime says he feels relieved that he is now seeing his career goals manifest in B.C. and will not have to return to Quebec where opportunities for him were slim.
He believes he would not be in such a stable and supportive employment position without the help of Faith and the STEP program. We believe we have set him up for success to become a Red Seal Roofer and maintain gainful employment in a trade he enjoys.
Kevin Gonzales
Level 1 Machinist Apprentice Immigrant in Trades Training Initiative (ITTI)
Where are they from? What is their personal history/background? Kevin was born and raised in the Philippines, and came to Canada in 2011. Kevin was a 3rd year Mechanical Engineering student in the Philippines, and had worked as a helper/machine operator in a machine shop prior to coming to Canada. He moved here with his parents, and was having a hard time finding steady work. Kevin was interested in the Machinist trade, and found on-call work in a shop. The shop wasn’t able to give Kevin work very often, and eventually Kevin wasn’t getting called in at all. Lack of work meant that money was tight for Kevin, and he didn’t know how to source trades jobs effectively.
Why did they come to STEP? Kevin came to STEP because he wanted help finding a job in the trades so that he could start a career.
How did they find their TES? Kevin visited the ITA to get information on trades, and ITA referred him to STEP.
What did the TES do to help? Kyle helped Kevin by giving him information on trades and apprenticeship in BC. Kyle then helped Kevin to refine his resume, and coached him on effective job sourcing techniques. Kyle also helped Kevin to source jobs and set him up with two interviews before eventually finding him an apprentice position in a machine shop. Once Kevin started working, Kyle was also able to get Kevin some basic tools required to start work. What kind of job did the client get? Kevin is now working as a Level 1 Machinist Apprentice at Blair Machine Ltd.

How did working with STEP change things for the client? Kevin says that his life is much better since working with STEP, and he is happier and more confident now that he has started a career in the trades. He is really enjoying his new job. His employer is very happy with him as well, they feel that Kevin is a very enthusiastic young man with a great attitude. Kevin plans to complete his apprenticeship as a Machinist, and get his Red Seal certification. He is very happy with what STEP has done for him, and he has told friends of his about STEP.
Ohsan “Shaun” Kweon
Welder Immigrant in Trades Training Initiative (ITTI)
Ohsan Kweon and his wife moved to BC from South Korea in search of a better quality of living. Ohsan had worked as a Welder in his homeland, but all his training was in-house and as a result, he arrived in Canada with no credentials in his trade. He was referred to STEP by the Ocean Program, and attended a STEP info session in order to check out his options and seek assistance with getting back into his trade. Being a newcomer to Canada, Ohsan found this all very overwhelming and was glad to find a program with TES’s who knew how things worked in the skilled trades.
Gary Schwaiger, the TES giving the info session that day, saw huge potential in Ohsan. They made an appointment and sat down together to sort out how to get Ohsan back into welding. With an assessment from Gary and some assistance with improving his resume to show off his welding skills, they decided that he was ready to jump into a Welder apprentice position… the only catch was finding an employer who would take him on without any Canadian experience or training.
Gary soon found an available position with Alum Tek Industries, a company that makes enclosures, containers and sub-base fuel tanks out of steel, and set up an interview there for Ohsan. Alum Tek hired Ohsan the same day they interviewed him, and after talking to Gary, they agreed to register Ohsan, or Shaun as they call him, as their apprentice. Gary is also working with Ohsan and his new employer to get him certified by the Canadian Welding Bureau, a certification without which a Welder is prohibited from working on any structural projects, thus assuring Ohsan a long, stable career with Alum Tek.
Alum Tek say they love having Ohsan on their team and can see his skills growing more every day. Ohsan says that being new to Canada, he may never have found the help he needed, or the job he loves, without STEP’s guidance. He is now able to support his family and plans to expand his experience as a successful Welder / Fabricator. He would recommend STEP to anyone looking for work in the trades and will tell anyone who will listen that STEP is here to help.

Scott Lahrs
Electrician Immigrants in Trades Training Initiative

Dillon Meier
Heavy Duty Technician (Mechanic) Skilled Trades Employment Program
Dillon Meir had decided early in in his life to enter into the trades and wanted to pursue a career as a Heavy Duty Mechanic. This decision was due in part to the strong support he received by his family and friends in deciding to become a tradesman.
Dillon first became aware of the STEP program though an information session that was held for the foundation Heavy Duty Mechanic class at the College of New Caledonia, Prince George. The STEP program was explained to the students – they were made aware of how they could be assisted with potential needed supports and in securing employment in their apprenticeships. Dillon was one of the many enthusiastic students that wanted to begin working as soon as his schooling was finished and made immediate contact with the program.
In meeting with Dillon, the TES evaluated his situation and began creating an action plan to assist Dillon become successful. This plan included securing an employer that was willing to hire and sponsor Dillon and continue to train him in his trade. It was also determined that the greatest need was for start-up tools that were required to begin his apprenticeship. Working together with the employer and on-site journeyman HD mechanic, the TES and Dillon created a list of required tools. Within a week Dillon picked up his tools and was ready to begin his apprenticeship and would be taking his first step in obtaining Journeyman status.
The employer, Excel Transportation, has worked closely with STEP and has several apprentices. They continue to hire providing ongoing apprenticeship opportunities while working with STEP. They are a great supporter and have expressed a great appreciation for the help we give the apprentices and their company in acquiring new dedicated employees that are willing to put in a strong effort.
The employer is very happy with Dillon Meier and also continues to promote from within and advance several of there on site employees into apprentice positions. They have asked for our assistance in working with these clients and will include STEP in their future plans to expand and enlarge their company into the North.

Matthew Pitcher
Carpenter Skilled Trades Employment Program
Matthew Pitcher first came to STEP to attend an info session back in March of 2012. He was holding down a part-time job as a Parking Attendant in downtown Vancouver. His facility manager offered him odd sporadic shifts with minimal opportunity for advancement and wage increases. With some renovation carpentry and construction labour experience gathered from previous employers, Matthew dreamed of finding a position as an Apprentice Carpenter with a reputable company to learn and grow his repertoire of hands-on trade skills. Matthew met with TES Jazret Mraze, a Red Seal Carpenter, who assessed his skills, gave him some job leads, and helped him revise his resume to highlight actual carpentry skills performed, projects worked on, and components built and installed. From there, Matthew set out on his bicycle to cultivate potential apprentice positions with employers from a list of companies that Jazret gave him. Matthew was happy to report that one of the first employers he approached wished to hire him as a Renovation Carpenter, yet unfortunately they were not willing to sponsor him as an apprentice. “Stick to your guns, and keep your goals and objectives fixed firmly in mind,” Jazret told Matthew as they both continued the search for an ITA sponsor to register him as an apprentice Carpenter. After discussing the benefits of cutting his teeth on commercial construction projects, and of the wide-ranging skills that one will pick up while engaged in rough carpentry, Jazret forwarded Matthew’s resume to Wayne Marsden of PCL Constructors Westcoast Inc. In a return email, Wayne mentioned how an energetic, detail oriented, young worker will acclimatize to the senior, Journeyman carpenters on a project, where a mutual understanding of respect and mentoring takes place – the real heart of the apprenticeship process. As Matthew prepared for an interview with Wayne and PCL, Jazret suggested he speak directly to this point while in the interview, and stake his claim as an aspiring Red Seal Carpenter right from the get-go! After PCL agreed to hire Matthew at $17.88/hr to start, Matthew needed to undergo a three month probationary period (company policy) before he was eligible to be registered as an apprentice there. Living in North Vancouver and travelling to his first job site posting at YVR, Jazret stressed the importance of allowing oneself enough of a buffer of commuting time to ensure a steady record of early arrivals to the job. This action speaks volumes to an employer and reinforces the devotion needed to be excited about work, especially in a city that rates second worst for traffic congestion in all of North America. By establishing himself as a reliable, dedicated, and motivated worker with a good attitude, Matthew has long surpassed his probationary period, taken additional in-house safety training courses, and is now preparing to schedule himself a six-week window to attend Level 1 Carpentry technical training at a local ITA-recognized training facility. Being open to work for PCL’s projects outside of Metro Vancouver in Northern BC has also painted Matthew as a go-to guy for accepting challenge and responsibility. With his recent earnings, Matthew is now happy to report that he has acquired his BC Driver’s License for the first time, just prior to his 24th birthday. Way to go Matthew!!

Steven Robbins
2nd Year Electrical Apprentice Skilled Trades Employment Program (STEP 3.0)
Steven Robbins has a plan! And with a little help from Laurie Schuerbeke of the Skilled Trades Employment Program (STEP), he is rapidly moving towards it.
As a young man, Steven kicked around Vancouver for a couple of years without finding meaningful work. When an acquaintance suggested he go to Japan and teach English he thought, “Sure, why not!”
Steven lived and worked in Japan for ten years. He spent his first two years working for an established company before seeing an opportunity to start his own language business. “I rented some space and had the students come to me. Shortly afterwards I had to hire an administrator. It was a good business and I did well until the financial crash in 2008.”
By that time Steven had managed to save some money, get married, and have a son. “I started to think it was time to come home as my son was about to enter elementary school. So we returned to Canada. However, my wife has since returned to Japan and I have my son with me full time.”
Steven noted that it took some time to adjust to being back in Canada. “I was juggling ideas around about what to do. I had the math and physics prerequisites so I decided to take the Electrical Foundation program at Vancouver Island University (VIU). During the program Laurie Schuerbeke, a Trades Employment Specialist with STEP, came to our class and made a presentation about their services.”
When he graduated that April, Steven tried to find employment as an electrical apprentice. When November rolled around and he was still looking, he took a friend’s advice and called STEP. “I decided to give STEP a call and they put me in touch with Laurie.”
Laurie recalls that Steven was a single dad grappling with child care issues. “He was going through a career transition and was trying to get into the electrical trade. We turned him on to some resources for single parents so that he could sort out his child care needs.”
Laurie explained, “Eventually I found Steven an apprenticeship position with Mazzei Electrical. They often come to us for apprentices and we have placed three or four people with them.”
Steven was impressed by how well it came together. “It was amazing how quickly they got me work, after I had spent months trying.” Before Steven could get started with Mazzei he needed a power drill and some work clothes, which was a barrier to his employment. “Laurie was able to get those for me,” he noted. Laurie confirmed, “Having tools is a big part of being job ready. So if someone is offered a job on a Thursday, for example, we can pay for and have those tools ready to go by Monday morning.”

Steven had been with Mazzei Electrical for several months when he was laid off. He wanted to take this time to continue with his apprentice training. He did not have enough hours to qualify for employment insurance, so Laurie was able to sponsor the training portion of his level-two apprenticeship at VIU.
Laurie explains, “We can provide resource support and in some cases we can sponsor training into entry level foundation programs.
Steven’s long-term plan is to attain his journeyman status as soon as possible. “After one year as a journeyman, I’ll be able to take additional training to attain my B Foreman status. That will allow me to work with certain voltages. I’ll make more money and work less,” he added with a smile.
Steven’s advice for others looking into the trades is to do your research. “There are so many different trades and so much variety in terms of what you’ll be doing. It really helps if you know what you’re getting into.”
He added, “It also helps if you know someone or have a contact that can help you get your foot in the door.” In Steven’s case, contacting Laurie and the STEP program was all it took to get his plan off the ground.
Shannon Russ
Meatcutter Women in Trades Training Initiative
Growing up on a farm, Shannon was exposed to all aspects of raising livestock including the butchering. To attend a meat cutting course would be a natural fit for Shannon with her background. When an opportunity presented itself to attend a Meat Cutter Foundation course at Thompson Rivers University, Shannon didn’t need to think twice, she jumped at the opportunity.
Shannon’s short work history had included several dead end jobs in the service industry that were going nowhere fast. She made up her mind to pursue meat cutting as a profession. She contacted several agencies who could offer little to no help, one person pointed her in the right direction, to STEP. It was there where she met Tully, who was a big help, working around her schedule to get Shannon into her course and get her new life started. It took a mere four weeks from the time of Shannon’s first appointment with Tully to the time she started the meat cutting course at TRU. Now Shannon couldn’t be happier.
“Tully did a lot,” Shannon said when talking about what went into her even getting into the meat cutting course. She needed to take the Accuplacer, as well as her Food Safe, both of which Tully got her into. STEP also got her the equipment she needed for the course as well, equipping her with her aprons, knives, proper footwear and so much more.
“It wouldn’t have been possible without STEP and Tully, who went above and beyond to get me into the course.”

Derich Seidl - Electrician
STEP – VRCA
Derich Seidl contacted STEP after a recent move to the lower mainland, looking for a job opportunity. He was sleeping on a friend’s couch until he could find a job and make enough money to bring his family to Vancouver to join him.
STEP’s Trades Employment Specialist did an assessment with Derich which highlighted some of the specific hands-on skills that Derich had obtained from his previous experience, and encouraged his forward and personable approach which would work well in an interview process. Through STEP’s continued relationship with a local Electrical company, Derich was encouraged to approach the company’s site foreman, and an interview was arranged with the hiring manager, which turned into employment for Derich!
Derich thrived in his new position and is surrounded by a healthy support network of experience from his Red Seal certified colleagues and is scheduled to undertake his first level of Electrical technical training in the new year. Derich is extremely grateful to now be heavily engaged in the skilled trades sector as an Apprentice Electrician. He is currently learning and developing the practical aspects of his occupation, while at the same time, he is very excited for the opportunity to learn the technical theory content of his trade at his upcoming Level 1 training. Congratulations Derich on establishing yourself as an aspiring Electrician, and good luck with your continued success in the trades!
Louis Sylvester
1st Year Carpentry Apprentice Aboriginals in Trades Training (ATTI)
Sometimes all it takes to make a connection is one phone call. For Louis Sylvester, it was a call made to Bill Lucas, a Trades Employment Specialist with STEP. He recalled, “Early one day I received a phone call from an Employment Service Provider to set up an appointment with Louis Sylvester. Louis was a young Aboriginal man looking for a position as an apprentice carpenter. So I went ahead and booked him an appointment.”
In the meantime, Bill received a phone call from SupErb Construction requesting a carpenter. Bill asked for “a week or two to find them someone.”
Rather than wait for his scheduled appointment, Bill got in touch with Louis on the phone to begin the Assessment process. “I asked him about his background and education and got a sense of what he was all about. Louis had some carpentry training but he was having a hard time finding steady work and had very few hours under his belt. However, he was very enthusiastic and when I mentioned the apprentice opportunity with SupErb, I could feel his excitement.”
Bill advised Louis to connect with SupErb directly before they got together. When the interview went well, Bill arranged to meet with the owner of SupErb Construction to sign a Trades Training Agreement (TTA). The TTA ensures that among other things

Louis’ hours will be recognized by the Industry Training Authority. Louis may be eligible for additional support under the Aboriginals in Trades Training program, an initiative funded by the ITA.
Bill reports that the feedback on Louis has been positive. “They’ve got a big project in Nanaimo coming up that they plan to move him to.”
Trevor Botkin, site foreman for SupErb Construction agreed, “Louis has been excellent. He’s been super, a stand-up guy. If he keeps up the hard work he’ll have an excellent future in the industry.”
Bikash Thapa
Electrician Immigrants in Trades Training Initiative (ITTI)
Bikash is a journeyperson, or at least he’s been on a few journeys; he was born in Nepal, and lived in Spain, Holland, and Australia before coming to Canada in 2011.
His past work experience included various cook and construction laborer positions, but a career as an electrician was what he was really interested in so he enrolled in the Electrical Foundation Program at BCIT. Bikash has a family to support so had to work part-time (at minimum wage) while going to school full time – it was very challenging but he was determined.
The STEP team did presentations to several Electrical Foundation classes at BCIT and this is where Bikash found the direction he needed. Once the Foundation course was complete, he met with a TES for an assessment and intake into the Immigrant In Trades Training program through STEP. Due to his strained financial situation, Bikash wanted (needed!) to start working as soon as possible.
Through the employer connections that STEP has established, the TES arranged an interview with an electrical company and was successfully placed as an Electrical Apprentice and registered with the ITA – double win! Bikash now has a full-time career in a well-paying trades job. His goal is to complete his apprenticeship through to Red Seal Certification and hopes to have his own electrical business in the future.

Brittani J. Wesley
Heavy Equipment Operator Women in Trades Training Initiative (WITT)
After graduating from high school in May of 2012, Brittani felt strongly that she needed to make a decision regarding her future and career possibilities. After conducting research centred on her interests including Labour Market research and conversations with relatives and friends, Brittani decided that Heavy Equipment Operator was the trade for her. She was confident that committing to this decision would provide her with the future she sought, and could be both lucrative and long term.
The first step she took was to apply to the HEO foundation program at North West Community College, Terrace campus. With a great deal of excitement and minimal surprise, she was accepted for the August 28, 2012 start date.
Brittani approached her Band to discuss possible funding to assist her with tuition, which she was approved for. Brittani’s family was able to contribute some financial assistance but there were still barriers for her to overcome to continue forward. Through the relationship that STEP had developed with her band, they referred Brittani to the Prince Rupert office to see if there was any support available for a young woman focused on a trade’s path.
Brittani was assessed by a Trades Employment Specialist (TES) who determined that Brittani was eligible and a good fit for the program. An Action Plan was created with steps outlined for achieving her apprenticeship goal. STEP was able to support Brittani with help finding accommodation while going to school, as well as needed safety equipment required for her to take the course, and personal support along the way.
Brittani has now completed her Heavy Equipment Operator Foundations Certification along with Traffic Control, WHMIS, Occupational First Aid Level 1 and Transportation of Dangerous Goods. This Foundation Certificate will qualify her for the Heavy Equipment Operator Technician Apprentice Program. Brittani has applied for the second part of the program and is awaiting acceptance from the North West Community College Terrace Campus for an anticipated 2013 start date, to be announced by the college. Brittani is very proud of her accomplishments so far and continues to work with her TES as she continues on her career path as a Heavy Equipment Operator!

Appendix 6: One-Page WellBeing Report Summary