A Weekly Update from SMC 2012: Issue 320, Week: 28th...
20
2012: Issue 320, Week: 28th - 31st May A Weekly Update from SMC (For private circulation only) WISE M NEY A Weekly Update from SMC (For private circulation only) Brand smc 146
Transcript of A Weekly Update from SMC 2012: Issue 320, Week: 28th...

2012: Issue 320, Week: 28th - 31st MayA Weekly Update from SMC(For private circulation only)
WISE M NEYA Weekly Update from SMC(For private circulation only)
Bra
nd
sm
c 1
46


(Saurabh Jain)
Contents
Equity 4-7
Derivatives 8-9
Commodity 10-13
Currency 14
IPO 15
Fixed Deposit 16
Mutual Fund 17-18
EDITORIAL STAFF
Editor Saurabh Jain
Executive Editor Jagannadham Thunuguntla
+Editorial Team
Nikhil Mehta Dr. R.P. Singh
Nitin Murarka Vandana Bharti
Tejas Seth Sandeep Joon
Dinesh Joshi Vineet Sood
Shitij Gandhi Dhirender Singh Bisht
Subhranil Dey Parminder Chauhan
Ajay Lakra Mudit Goyal
Rahul Kumar Rajeev Mogha
Content Editor Kamla Devi
Graphic Designer Pramod Chhimwal
Research Executive Simmi Chibber
REGISTERED OFFICES:
11 / 6B, Shanti Chamber, Pusa Road, New Delhi 110005.
Tel: 91-11-30111000, Fax: 91-11-25754365
MUMBAI OFFICE:
Dheeraj Sagar, 1st Floor, Opp. Goregaon sports Club, Link Road
Malad (West), Mumbai 400064
Tel: 91-22-67341600, Fax: 91-22-28805606
KOLKATA OFFICE:
18,Rabindra Sarani, Poddar Court, Gate No-4, 4th & 5th Floor,
Kolkata-700001
Tel : 91-33-39847000/39801300, Fax No : 91-33-39847004
AHMEDABAD OFFICE :
10/A, 4th Floor, Kalapurnam Building, Near Municipal Market,
C G Road, Ahmedabad-380009, Gujarat
Tel : 91-79-26424801 - 05, 40049801 - 03
CHENNAI OFFICE:
2nd Floor, Mookambika Complex, 4, Lady Desikachari Road,
Mylapore, Chennai-600004
Tel: 91- 44 - 39109100 Fax: 91- 44 - 39109111
SECUNDERABAD OFFICE:
206, 3rd Floor, above CMR Exclusive, Bhuvana Towers, S.D.Road,
Secunderabad - 500003
Tel: 91-40-30780298/99, 39109536
DUBAI OFFICE:
312, Belshalat Building, Al Karama, Dubai, P.O. Box 117210, U.A.E.
Tel: 97143963120, Mobile : 971502612483
Fax : 9714 3963122
Email ID : [email protected]
Printed and Published on behalf of
Mr. Saurabh Jain @ Publication Address
11/6B, Shanti Chamber, Pusa Road, New Delhi-110005
Website: www.smcindiaonline.com
Investor Grievance : [email protected]
Printed at: KOZMIC STYLE OFFSET
D-137, Okhla Industrial Area, Phase-I, New Delhi - 110020 (India)
Ph.: +91-11-46251190, Email: [email protected]
From The Desk Of Editor
lobal markets recouped the losses in the initial part of week as Investors
concerns over the debt crisis in Euro region subsided with the likelihood Gof Greece stay in the Euro along with European leaders supporting the
idea of issuing joint bonds to raise money.
The sovereign debt rating of Japan got cut by two notches with a negative outlook
by the rating agency Fitch on the concerns that the country is not doing enough
for the fiscal consolidation. The cut in the rating would increase the pressure on
the authorities to raise revenues from taxes or by other means while contrary to
that the nations warrant some kind of stimulus as the industry is going through
the stress because lower exports as a result of appreciation in the local currency
and also lower demand for goods and services globally.
Recently Chinese premier statement to bolster growth has increased chances of
some kind of stimulus package in the days to come. But the matter of the fact is that
such expectations are there in the markets for quite a long time and indeed if
something positive does not come soon then the markets would take it as a negative.
Back at home, bleeding and cash starved oil marketing companies that are selling
petroleum products at below cost raised the petrol prices by 11% at a one go. Since
petrol prices are already deregulated the move would not benefit government to
reduce the burgeoning subsidies but the step taken is viewed as a precursor to raise
the diesel prices as well. On the rupee deceleration, RBI said that the both
possibilities of direct market intervention or adopting unconventional measure like
selling direct dollars to oil marketing companies cannot be ruled out. RBI once again
hinted that fiscal consolidation is necessary for inflation to come down. RBI
governor indicated that any monetary action in the 18th June policy meet would
depend on the inflation and economic growth data. As a matter of fact inflation
inched up in the month of April primarily driven by high food prices. Central Bank's
recent measures seriously proved to be of little help to bring any kind of stability in
the domestic currency. Understandably with the fall in rupee to the levels of 56, the
inflation concerns have come now to the fore.
If we talk about commodities, there are more concerns to stay wary than to
cheer. We can sense a pause in the commodity super cycle with slowing China,
which is a huge importer of commodities, Euro zone crisis amid U.S. recovery is
still uncertain. If politicians fail to provide much needed support market will get
jittery and people will either sit on cash or look for safe haven buying. Dollar rally
is narrating the same story. If dollar continues to rally than commodities may not
see upside in the prices. A strong dollar generally drags on commodities priced in
the currency. If we get some good economic numbers it may add some cheers in
the market, like it happened last week when home sales data was better than
expected and metals rose. Economic releases which can move the commodities
prices in a significant way are CPI and unemployment change data of Germany,
GDP of Switzerland, US and Canada, change in Non-farm Payrolls, unemployment
rate, personal consumption expenditure core and ISM manufacturing of US.

4
NOTES:
1) These levels should not be confused with the daily trend sheet, which is sent every morning by e-mail in the name of "Morning Mantra ".
2) S1 & S2 indicate first support & second support respectively & R1 & R2 indicate first resistance and second resistance respectively.
3) Sometimes you will find the stop loss to be too far but if we change the stop loss once, we will find more strength coming into the stock. At the moment, the stop loss will be far as we are seeing the graphs on weekly basis and taking a long-term view and not a short-term view.
TREND SHEET
STOCKS CLOSING TREND DATE RATE S1 R1 S2 R2 CL.
PRICE TREND TREND S/L
CHANGED CHANGED
SENSEX 16222 DOWN 10.05.12 16420 17300 17700 18100
S&P NIFTY 4921 DOWN 10.05.12 4966 5175 5325 5400
CNX IT 5886 DOWN 19.04.12 5862 6100 6250 6350
CNX BANK 9438 DOWN 10.05.12 9411 9900 10200 10400
ACC 1156 DOWN 17.05.12 1171 1225 1250 1280
BHARTIAIRTEL 298 DOWN 23.02.12 339 320 330 340
BHEL 208 DOWN 22.03.12 261 230 240 250
CIPLA 310 DOWN 23.02.12 315 320 330 335
DLF 185 DOWN 01.03.12 214 205 215 220
HINDALCO 111 DOWN 29.03.12 125 121 128 132
ICICI BANK 821 DOWN 10.05.12 814 835 860 880
INFOSYS 2381 DOWN 19.04.12 2405 2550 2640 2700
ITC 233 UP 04.03.11 172 230 224 218
L&T 1168 DOWN 26.04.12 1227 1280 1320 1350
MARUTI 1144 DOWN 17.05.12 1205 1230 1260 1300
NTPC 142 DOWN 29.03.12 163 153 157 161
ONGC 258 DOWN 29.03.12 260 260 268 275
RELIANCE 695 DOWN 07.03.12 762 740 760 780
SAIL 91 UP 25.01.12 98 95 92 88
NEWS
FORTHCOMING EVENTS
MEETING DATE SYMBOL PURPOSE28/05/2012 AMARAJABAT Results/Dividend28/05/2012 NMDC Results/Dividend28/05/2012 OIL Results/Dividend28/05/2012 COALINDIA Audited Financial Results28/05/2012 IOC Results/Dividend28/05/2012 NEYVELILIG Results/Dividend29/05/2012 MCDOWELL-N Results/Dividend29/05/2012 HINDPETRO Results/Dividend29/05/2012 HOTELEELA Results/Others29/05/2012 ONGC Results/Dividend29/05/2012 SAIL Results/Dividend29/05/2012 TATAMOTORS Results/Dividend29/05/2012 SCI Audited Financial Results29/05/2012 RENUKA Audited Financial Results29/05/2012 POWERGRID Results/Dividend29/05/2012 SUNPHARMA Results/Dividend30/05/2012 DLF Results/Dividend30/05/2012 BGRENERGY Results/Dividend30/05/2012 EDUCOMP Results/Dividend30/05/2012 COLPAL Audited Financial Results30/05/2012 M&M Results/Dividend30/05/2012 TATACHEM Results/Dividend30/05/2012 JPASSOCIAT Results/Dividend30/05/2012 ABAN Results/Dividend30/05/2012 GAIL Results/Dividend30/05/2012 BEML Results/Dividend01/06/2012 MPHASIS Audited Financial Results
DOMESTIC NEWSEconomy·India's state-owned Oil Marketing Companies (OMCs) hiked gasoline/petrol
prices steeply on Wednesday. Gasoline prices were hiked by 6.28 rupees per litre excluding value added tax/sales tax, the Indian Oil Corporation said in a statement. The increase will come into effect midnight of 23/24 May 2012, the company added. HPCL and BPCL are the other two OMCs.
Mining/ Minerals·NMDC signed a contract for a steel melting shop (SMS) package with a
consortium led by Siemens VAI MT GmbH & Co, Austria, for its upcoming integrated steel plant in Chhattisgarh.
Healthcare·Piramal Healthcare has completed the first phase of clinical trials of a new
oral drug for treating cancer and will move to the next stage of development.
Capital Goods·ABB has bagged a ̀ 175 crore order from NTPC for setting up the transmission
network for the state-owned company's plant in Maharashtra.Metals·Tata Steel is hopeful of completing the first phase of its project at
Kalinganagar in Odisha by the early part of the next financial year. The company, the world's seventh largest steel maker, has already invested `11,000 crore in the new plant.
Pharmaceutical·Sun Pharmaceutical Industries has received approval from the US health
regulator to sell its generic version of Astelin, used in treating nasal allergies, in the American market.
·Aurobindo Pharma has received the final approval from the US health regulator for its generic Nevirapine tablets and oral suspension used for treating human immunodeficiency virus (HIV).
·Suven Life Sciences has received four product patents in different international markets for its new chemical entities (NCEs) which could be used in treating various central nervous system disorders.
·Dr Reddy's Laboratories has launched its generic version of lansoprazole delayed-release capsules used for treating acidity and heartburns in the US market.
Telecommunication·Bharti Airtel had signed a pact to buy a 49% stake in Qualcomm Inc's fourth-
generation (4G) broadband venture in the country for 921 crore.Information Technology·Tech Mahindra announced the launch of its delivery and development centre
in Noida. Set up with an investment of Rs 100 crore, the facility is spread over 2.5 acres of land and is Tech Mahindra's sixth SEZ unit.
Realty/ Infrastructure·Shriram EPC has bagged two contracts worth of 165 crore from Kerala Water
Authority for creating a water distribution network for Kozhikode and its adjoining villages.
Oil & Gas·Essar Oil has signed an agreement with engineering and construction
company Larsen & Toubro (L&T) for supply of high quality bitumen.
INTERNATIONAL NEWS·US new home sales rose 3.3 percent to an annual rate of 343,000 in April from
the revised March rate of 332,000. Economists had expected new home sales to climb to 335,000 from the 328,000 originally reported for the previous month.
·U.K Gross domestic product shrank 0.3 percent, slightly bigger than the previously estimated drop of 0.2 percent. The first quarter decline follows a similar 0.3 percent GDP decline in the fourth quarter of 2011. Two straight quarters of contraction signals a recession.
·U.K retail sales volume, including automotive fuel, dropped 2.3 percent from a month ago, much faster than the 0.8 percent decrease forecast by economists. This was the biggest drop since January 2010 and followed a revised 2 percent growth in March.
·Fitch Ratings trimmed Japan's credit ratings, citing growing risks to credit profile as a result of high and increasing public debt ratios. The long-term foreign and local currency Issuer Default Ratings were lowered to 'A+' from 'AA' and 'AA-' respectively. The outlooks on both ratings are negative.
·Core consumer prices in Japan climbed 0.2 percent on year on April - beating forecasts for a gain of 0.1 percent and unchanged from the previous month. Overall inflation was up 0.4 percent - in line with expectations and easing from 0.5 percent in March.
`
`

INDIAN INDICES (% Change)
5
BSE SENSEX GAINERS & LOSERS TOP (% Change) NSE NIFTY GAINERS TOP & LOSERS (% Change)
SECTORAL INDICES (% Change)
SMC Trend
SMC Trend
FMCGHealthcare
FTSE 100CAC 40
Auto BankRealty
Cap GoodsCons Durable
Oil & GasPower
NasdaqDow jonesS&P 500
NikkeiStrait times
Hang SengShanghai
INSTITUTIONAL ACTIVITY (Equity) (` Crore)
ITMetal
Down SidewaysUp
SMC Trend
Nifty BSE Midcap Nifty JuniorSensex BSE Smallcap S&P CNX 500
GLOBAL INDICES (% Change)
-205.90
-58.50
-217.70
-320.20
77.10
103.20
-17.10
94.40
-350.00
-300.00
-250.00
-200.00
-150.00
-100.00
-50.00
0.00
50.00
100.00
150.00
Friday Monday Tuesday Wednesday
FII Activity MF Activity
0.61
0.43
0.17
0.47
-0.16
0.41
-0.30
-0.20
-0.10
0.00
0.10
0.20
0.30
0.40
0.50
0.60
0.70
Nifty Sensex BSE Midcap BSE Smallcap
Nifty Junior S&P CNX 500
0.13
1.29
0.77
-1.58
-1.83
0.47
0.25
-0.81
1.57
0.12
0.48
-2.50
-2.00
-1.50
-1.00
-0.50
0.00
0.50
1.00
1.50
2.00
Auto Index Bankex Cap Goods Index
Cons Durable Index
FMCG Index Healthcare Index
IT Index Metal Index Oil & Gas Index
Power Index Realty Index
2.18
1.30
1.97
-0.56
0.02
-1.51
0.28
1.56
1.01
-2.00
-1.50
-1.00
-0.50
0.00
0.50
1.00
1.50
2.00
2.50
Nasdaq Comp. Dow Jones S&P 500 Nikkei Strait Times Hang Seng Shanghai Comp.
FTSE 100 CAC 40
8.00
6.92
5.19 5.104.49
-7.56
-5.40
-3.95
-2.59 -2.51
-10.00
-8.00
-6.00
-4.00
-2.00
0.00
2.00
4.00
6.00
8.00
10.00
Ranbaxy Labs.
Bank of Baroda
I D F C Axis Bank H D F C Sesa Goa Sterlite Inds.
JP Associates
ITC Hero Motocorp
4.39
3.40 3.30
2.65 2.49
-5.55
-2.56 -2.38 -2.35-2.04
-8.00
-6.00
-4.00
-2.00
0.00
2.00
4.00
6.00
H D F C B H E L O N G C Tata Motors GAIL (India) Sterlite Inds. Hero Motocorp
ITC Tata Power Co.
Sun Pharma.Inds.

6
Above calls are recommended with a time horizon of 1 year.
Beat the street - Fundamental Analysis
RANBAXY LABORATORIES LIMITEDBusiness Profile Canada. The re-launch is part of the strategy of Ranbaxy Laboratories Limited is engaged in the Ranbaxy to focus on dermatology to strengthen its marketing, production and distribution of presence in the branded drug business. pharmaceuticals products. It operates in two ·Ranbaxy Laboratories has commenced exports of segments: pharmaceuticals and other business. Atorvastatin Calcium Oral tablets to the US market, Pharmaceuticals segment comprises of manufacture from its state-of-the-art Mohali SEZ manufacturing and trading of formulations, Active Pharmaceuticals facility. Meanwhile the company has also launched Ingredients (API) and intermediate, generics, drug this tablet in Italy, Sweden, Gremany and the discovery and consumer health care products. Other Netherlands.business comprises of rendering financial services. The ·The revenues grew by sharp 73% YoY during the Company has manufacturing facilities in seven quarter ended March 2012 to 3695.40 crore driven countries, namely India, the United States of America, by the US base business and continued strong sales Ireland, Malaysia, Nigeria, Romania and South Africa. from the First To File (FTF) exclusivity launches Its major markets include the United States, India, (Lipitor and Caduet). Further, it has been leading Europe, Russia/ Commonwealth of Independent States the market share in both of the FTF's - Lipitor (47%) and South Africa. The research and development with 60-70% price erosion and Caduet (more than activities of the Company are principally carried out at 40%). Operating margins expanded by 760 bps YoY its facilities in Gurgaon, near New Delhi, India. to 26.8% and going forward the margins seems to
improve further on the back of resumption of Investment Rationale exports to the US from Indian facility (Mohali). PAT ·The company is planning to consolidate its position grew by sharp 309% to ̀ 1246.76 crore.
in the emerging markets like Malaysia, South Africa, Nigeria, Egypt and Morocco. It is setting up Greenfield manufacturing facilities in Nigeria and Malaysia as a part of efforts to boost its overall business. The Malaysian plant, which is expected to be completed in 2014, will cater to the increased demand and exports to countries like Singapore and Thailand. The Nigeria facility, which would be Ranbaxy's second facility in the African nation, would be ready by December 2012
·The company plans to re-launch its former flagship skincare brand `Sotret' in US through a marketing partnership with Cipher Pharmaceuticals of
`
Stock Chart
` in cr
Particulars QE Mar’12 QE Mar’11 Var.(%) TTM
Total Income 480.24 410.49 17.00 1820.23
Net Sales 453.28 390.98 15.90 1760.82
Expenditure 415.98 368.73 12.80 1611.59
PBDIT 64.26 41.76 53.90 208.64
PBDT 50.13 35.16 42.60 166.13
PAT 27.82 12.53 122.00 88.11
ATUL LIMITED
Stock Chart
Business Profile valued customers in India. Rudolf Atul Chemicals
Atul Limited, incorporated in 1947, is a member of Ltd, the joint venture company, will become a total
Lalbhai Group. The Company is serving diverse solution provider and help the two partners to
industries such as agriculture, automobile, participate in the growing market of textile
construction, cosmetic, food & beverage, flavour & chemicals in the country.
fragrance, marine, packaging, paint & coatings, ·Atul Europe, wholly Subsidiary of company, has
paper, personal care, pharmaceutical, textile and acquired 88% shares of D.P.D. Ltd (an U.K.
tyre. The Company has seven businesses, namely, Company). Due to this acquisition D.P.D. Ltd has
Aromatics, Bulk Chemicals & Intermediates, Colors, become a subsidiary company of Atul Europe
Crop Protection, Floras, Pharmaceuticals & Limited, consequently of Atul Limited. D.P.D. Ltd is
Intermediates, and Polymers. It has established in the business of Tissue culture Date Palm.
subsidiary companies in the USA, the UK, Germany, ·Net profit of Atul rose 122.03% to 27.82 crore in the
China and Brazil to service its international quarter ended March 2012 as against 12.53 crore
customers. Atul Chemical Complex in Valsad is spread during the previous quarter ended March 2011. Sales
over 1400 acres of land and is amongst the largest and rose 15.93% to 453.28 crore in the quarter ended
the greenest chemical sites of its kind in the world. March 2012 as against `390.98 crore during the
previous quarter ended March 2011.
Investment Rationale
·The company is doing a number of projects with an
investment of 130 crore and expects 400-500
crore of additional revenues. The company expects
to cross 2500 crore of revenues by FY'14.
·Going forward, the company expects to increase
sale of high margin products, diversify and expand
product portfolio, add new business verticals of
strategic importance, expand brand business,
reduce cost and improve working capital cycle and
grow through Inorganic and Organic route.
·Atul and Rudolf GmbH collaborate to manufacture
and offer a complete range of Textile Chemicals to
`
`
`
` `
`
VALUE PARAMETERS
Current Mkt.Price (`) 197.00
Face Value ( ) 10.00
52 Week High/Low 240.60 / 135.00
M.Cap ( Cr.) 584.30
EPS ( ) 28.14
P/E Ratio (times) 7.00
P/B Ratio (times) 2.28
Dividend Yield (%) 2.28
Stock Exchange BSE
`
`
`
VALUE PARAMETERS
Current Mkt.Price (`) 526.45
Face Value ( ) 5.00
52 Week High/Low 570.00 / 366.50
M.Cap ( Cr.) 22222.51
EPS ( ) 32.69
P/E Ratio (times) 16.10
P/B Ratio (times) 7.76
Stock Exchange BSE
`
`
`
` in cr
Particulars QE Mar'12 QE Mar'11 Var.(%) TTM
Total Income 4268.19 2285.17 86.78 12731.35
Net Sales 3695.40 2141.50 72.56 11510.70
Expenditure 2771.62 1788.02 55.01 13596.02
PBDIT 1496.57 497.15 201.03 -864.67
PBDT 1477.91 457.82 222.81 -1272.38
PAT 1246.76 304.39 309.59 -1957.35
% OF SHARE HOLDING
% OF SHARE HOLDING
June July August September November 2012 February March April May
500
1000
x1000
500
1000
x1000
130135140145150155160165170175180185190195200205210215220225230235240245
130135140145150155160165170175180185190195200205210215220225230235240245
June July August September November 2012 February March April May
500
1000
x1000
500
1000
x1000
360
380
400
420
440
460
480
500
520
540
560
580
360
380
400
420
440
460
480
500
520
540
560
580

Charts by Spider Software India Ltd
EQUITY
Above calls are recommended with a time horizon of 1-2 months
The stock closed at 407.55 on 24th May 2012. It made a 52-week low at 322.25
on 28th December 2011 and 52-week high of ̀ 476.40 on 07th July 2011. The 200
days Exponential Moving Average (EMA) of the stock on the weekly chart is
currently at 331.98.
After many whipsaws, finally it succeed to sustain above its 200 EMA with the
support of volumes. It suggests that there are chances of a more upside in near
term. in the range of 406-410 levels with closing below stop loss of
397 levels for the target of 430-440 levels.
` `
`
One can Buy
7
The stock closed at ̀ 73.75 on 24thMay 2012. It made a 52-week low at 62.05 on
09th August 2011 and 52-week high of 119.35 on 27th March 2012. The 200
days Exponential Moving Average (EMA) of the stock on the weekly chart is
currently at 106.64.
After a sharp movement in last few months it could not sustain at the higher
levels and reversed back. As we can see on the charts volume descended with
the fall in price which indicates that bears have exhausted and there are signs of
pullback in the near term. in the range of 74-75 levels with closing
below stop loss of 69 levels for the target of 81-83 levels.
`
`
`
One can Buy
The stock closed at ̀ 525.55 on 24thMay 2012. It made a 52-week low at 365.50
on 19th December 2011 and 52-week high of 570 on 02th August 2011. The 200
days Exponential Moving Average (EMA) of the stock on the weekly chart is
currently at 449.51.
After it witnessed a major fall it bounced back sharply in last few weeks with the
support of volumes. At present the volumes and prices are increasing
indicating consolidation at these levels. We anticipate that it will again give a
major spike on the higher note in the near term as the congestion is visible on
the charts. One can Buy in the range of 517-522 levels with closing below stop
loss of 500 levels for the target of 540-550 levels.
`
`
`
FEDERAL BANK
RANBAXY
INDIA CEMENT

8
DERIVATIVES
BASIS GAP IN NIFTY
BANKINDIA (MAY FUTURE)
Buy: Above 324
Target: 331
Stop loss: 320
`
`
`
COALINDIA (MAY FUTURE)
Buy: Above 316
Target: `323
Stop loss: `313
`
DERIVATIVE STRATEGIES
HDILBuy MAY. 65. CALL 1.20Buy MAY. 60. PUT 0.65
Lot size: 2000Upside BEP: 66.85Downside BEP: 58.15Max. Profit: UnlimitedMax. Loss: 3700.00 (1.85*2000)`
ITCBuy MAY. 240. CALL 1.15Buy MAY. 230. PUT 2.20
Lot size: 250Upside BEP: 243.35Downside BEP: 226.65Max. Profit: UnlimitedMax. Loss: 3350.00 (3.35*1000) `
OPTIONSTRATEGY
FUTURESTRATEGY
ICICIBANKBuy MAY. 820. CALL 6.65Buy MAY. 800. PUT 11.00
Lot size: 250Upside BEP: 837.65Downside BEP: 782.35Max. Profit: UnlimitedMax. Loss: 4412.50 (17.65*250)`
OPTOCIRCUI (MAY FUTURE)
Sell: Below 165
Target: 160
Stop loss: 167
`
`
`
VOLATILITY BASED STRATEGIES
The put-call ratio of open interest closed at 0.94 levels which indicate call writing. Options open interest concentration has shifted to the 5000 and
5100-strike call with the highest open interest of above 70 lakh & 66Lakh shares. Among the put options, the 4700-strike put option has the total open
interest of more than 90 lakh shares which is the highest open interest among all options. Based on Nifty option concentration Nifty is expected to
expire in the range of 5000 to 4700. The Implied Volatility (IV) of call options closed at 22.82% on while the average IV of put options closed at 23.13%.
VIX and implied volatility increased in the May month indicating uncertainty in the market. On the technical front, the last week's profit booking was
on the back of rising volumes indicating further weakness till 4750 levels. Nifty cost-of-carry ended negative indicating short buildup. Nifty is
expected to remain weak.
WEEKLY VIEW OF THE MARKET
NIFTY TOTAL OPEN INTEREST (in share)
FII'S ACTIVITY IN F&O IN LAST TEN SESSIONS
(Derivative segment) `(Cr)
FII'S ACTIVITY IN F&O IN LAST WEEK
(Derivative segment)
931120
2759140
4578780
66766506772030
6248300
5486380
4074170 36212603781600
9414870
7898770
5466710
2991820
2366900
1260530822880
399990 465600321600
0
1000000
2000000
3000000
4000000
5000000
6000000
7000000
8000000
9000000
10000000
4700 4800 4900 5000 5100 5200 5300 5400 5500 5600
Call Put
2.45
-19.55
-0.55-1.35
-17.90
-2.50
-12.15
-19.30
-21.10
-8.30
-25.00
-20.00
-15.00
-10.00
-5.00
0.00
5.00
11-May 14-May 15-May 16-May 17-May 18-May 21-May 22-May 23-May 24-May
-64.40 -35.23
-305.04
377.89 372.15459.64
-92.62
863.14
164.12
-597.64
-800.00
-600.00
-400.00
-200.00
0.00
200.00
400.00
600.00
800.00
1000.00
11-May 14-May 15-May 16-May 17-May 18-May 21-May 22-May 23-May 24-May
BUY68.3%
SELL31.7%

BHARTIARTL 9831000 8733000 -11.17 0.63 0.57 -0.06 29.33 31.70 2.37
DLF 16621000 15896000 -4.36 0.59 0.81 0.22 47.75 49.52 1.77
HINDALCO 25688000 23508000 -8.49 0.34 0.42 0.08 44.94 43.77 -1.17
HINDUNILVR 5560000 5201000 -6.46 1.10 1.18 0.08 19.14 18.16 -0.98
ICICIBANK 10424750 10184750 -2.30 0.49 0.47 -0.02 30.53 31.42 0.89
IDEA 10500000 9620000 -8.38 0.45 0.36 -0.09 42.95 43.23 0.28
INFY 1957875 1757500 -10.23 0.37 0.42 0.05 25.52 25.72 0.20
ITC 16267000 15309000 -5.89 0.52 0.49 -0.03 26.76 28.35 1.59
JPASSOCIAT 29336000 32360000 10.31 0.35 0.31 -0.04 55.16 58.35 3.19
NTPC 10012000 8888000 -11.23 0.24 0.23 -0.01 31.97 33.28 1.31
ONGC 4916000 4221000 -14.14 0.32 0.45 0.13 25.67 29.56 3.89
RANBAXY 2495500 2159500 -13.46 0.25 0.48 0.23 37.03 32.26 -4.77
RCOM 44308000 39224000 -11.47 0.34 0.32 -0.02 53.86 55.71 1.85
RELIANCE 10412000 8951000 -14.03 0.46 0.41 -0.05 26.00 28.29 2.29
S&P CNX NIFTY 22817100 20863800 -8.56 0.84 0.94 0.10 21.56 22.82 1.26
SAIL 11026000 9886000 -10.34 0.40 0.51 0.11 46.94 45.02 -1.92
SBIN 5572625 5290750 -5.06 0.44 0.69 0.25 38.52 35.20 -3.32
SUZLON 99920000 87336000 -12.59 0.54 0.63 0.09 59.86 57.07 -2.79
TATASTEEL 15805000 16391500 3.71 0.43 0.42 -0.01 41.82 36.27 -5.55
UNITECH 38080000 36056000 -5.32 0.44 0.42 -0.02 69.94 73.27 3.33
IMPORTANT INDICATORS OF NIFTY AND OTHER ACTIVE FUTURE CONTRACTS
OPEN INTEREST PCR RATIO IMPLIED VOLATILITY
SCRIPTS PREV. CURRENT % PREV. CURRENT PREV. CURRENT WEEK WEEK CHANGE WEEK WEEK CHANGE WEEK WEEK CHANGE
DERIVATIVES
NIFTY ANALYSIS
Put Call Ratio Analysis : The Put-Call open interest ratio of Nifty is increased to
0.94 from 0.84. At the end of the week, the maximum stocks had a negative
trend of change in put call open interest ratio.
Implied Volatility Analysis :The Implied Volatility (IV) for Nifty futures this week
has increased to 22.82% from 21.56%. The IV of the stock futures has changed this
week ranging from -5.55% to 3.89%.
Open Interest Analysis : The open interest for the index at the end of this week
has decreased by 8.56% as compared to the previous week. All future stocks saw
changes in their open interest ranging from -14.14% to 10.31%. ONGC has the
maximum decrease in open interest as compared to other stocks.
Statistical Analysis·
Open High 4940.00
Low 4767.45 Close 4913.10
4778.00
9
NIFTY & IV CHART
20.00
21.00
22.00
23.00
24.00
25.00
4800.00
4900.00
5000.00
18-May 21-May 22-May 23-May 24-May
Nifty Close IV
10
OTHER COMMODITIES
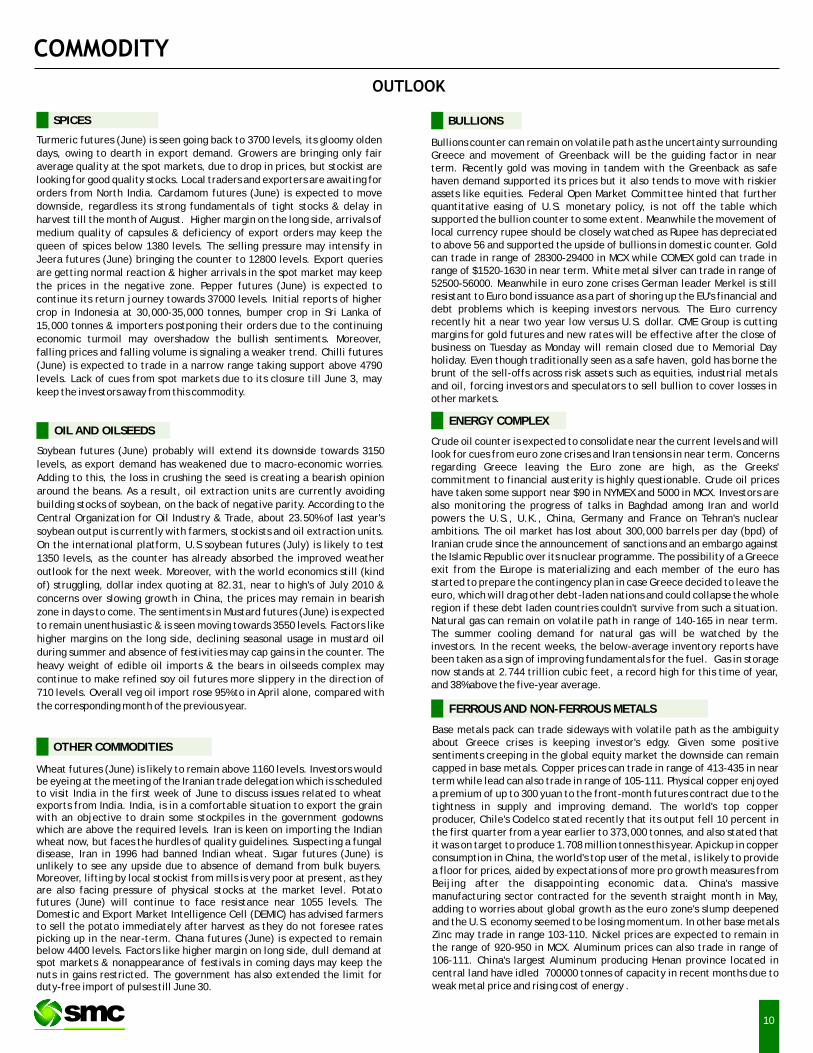
Wheat futures (June) is likely to remain above 1160 levels. Investors would be eyeing at the meeting of the Iranian trade delegation which is scheduled to visit India in the first week of June to discuss issues related to wheat exports from India. India, is in a comfortable situation to export the grain with an objective to drain some stockpiles in the government godowns which are above the required levels. Iran is keen on importing the Indian wheat now, but faces the hurdles of quality guidelines. Suspecting a fungal disease, Iran in 1996 had banned Indian wheat. Sugar futures (June) is unlikely to see any upside due to absence of demand from bulk buyers. Moreover, lifting by local stockist from mills is very poor at present, as they are also facing pressure of physical stocks at the market level. Potato futures (June) will continue to face resistance near 1055 levels. The Domestic and Export Market Intelligence Cell (DEMIC) has advised farmers to sell the potato immediately after harvest as they do not foresee rates picking up in the near-term. Chana futures (June) is expected to remain below 4400 levels. Factors like higher margin on long side, dull demand at spot markets & nonappearance of festivals in coming days may keep the nuts in gains restricted. The government has also extended the limit for duty-free import of pulses till June 30.
OIL AND OILSEEDS
Soybean futures (June) probably will extend its downside towards 3150
levels, as export demand has weakened due to macro-economic worries.
Adding to this, the loss in crushing the seed is creating a bearish opinion
around the beans. As a result, oil extraction units are currently avoiding
building stocks of soybean, on the back of negative parity. According to the
Central Organization for Oil Industry & Trade, about 23.50% of last year's
soybean output is currently with farmers, stockists and oil extraction units.
On the international platform, U.S soybean futures (July) is likely to test
1350 levels, as the counter has already absorbed the improved weather
outlook for the next week. Moreover, with the world economics still (kind
of) struggling, dollar index quoting at 82.31, near to high's of July 2010 &
concerns over slowing growth in China, the prices may remain in bearish
zone in days to come. The sentiments in Mustard futures (June) is expected
to remain unenthusiastic & is seen moving towards 3550 levels. Factors like
higher margins on the long side, declining seasonal usage in mustard oil
during summer and absence of festivities may cap gains in the counter. The
heavy weight of edible oil imports & the bears in oilseeds complex may
continue to make refined soy oil futures more slippery in the direction of
710 levels. Overall veg oil import rose 95% to in April alone, compared with
the corresponding month of the previous year.
Turmeric futures (June) is seen going back to 3700 levels, its gloomy olden
days, owing to dearth in export demand. Growers are bringing only fair
average quality at the spot markets, due to drop in prices, but stockist are
looking for good quality stocks. Local traders and exporters are awaiting for
orders from North India. Cardamom futures (June) is expected to move
downside, regardless its strong fundamentals of tight stocks & delay in
harvest till the month of August. Higher margin on the long side, arrivals of
medium quality of capsules & deficiency of export orders may keep the
queen of spices below 1380 levels. The selling pressure may intensify in
Jeera futures (June) bringing the counter to 12800 levels. Export queries
are getting normal reaction & higher arrivals in the spot market may keep
the prices in the negative zone. Pepper futures (June) is expected to
continue its return journey towards 37000 levels. Initial reports of higher
crop in Indonesia at 30,000-35,000 tonnes, bumper crop in Sri Lanka of
15,000 tonnes & importers postponing their orders due to the continuing
economic turmoil may overshadow the bullish sentiments. Moreover,
falling prices and falling volume is signaling a weaker trend. Chilli futures
(June) is expected to trade in a narrow range taking support above 4790
levels. Lack of cues from spot markets due to its closure till June 3, may
keep the investors away from this commodity.
SPICES BULLIONS
Bullions counter can remain on volatile path as the uncertainty surrounding Greece and movement of Greenback will be the guiding factor in near term. Recently gold was moving in tandem with the Greenback as safe haven demand supported its prices but it also tends to move with riskier assets like equities. Federal Open Market Committee hinted that further quantitative easing of U.S. monetary policy, is not off the table which supported the bullion counter to some extent. Meanwhile the movement of local currency rupee should be closely watched as Rupee has depreciated to above 56 and supported the upside of bullions in domestic counter. Gold can trade in range of 28300-29400 in MCX while COMEX gold can trade in range of $1520-1630 in near term. White metal silver can trade in range of 52500-56000. Meanwhile in euro zone crises German leader Merkel is still resistant to Euro bond issuance as a part of shoring up the EU's financial and debt problems which is keeping investors nervous. The Euro currency recently hit a near two year low versus U.S. dollar. CME Group is cutting margins for gold futures and new rates will be effective after the close of business on Tuesday as Monday will remain closed due to Memorial Day holiday. Even though traditionally seen as a safe haven, gold has borne the brunt of the sell-offs across risk assets such as equities, industrial metals and oil, forcing investors and speculators to sell bullion to cover losses in other markets.
ENERGY COMPLEX
Crude oil counter is expected to consolidate near the current levels and will look for cues from euro zone crises and Iran tensions in near term. Concerns regarding Greece leaving the Euro zone are high, as the Greeks' commitment to financial austerity is highly questionable. Crude oil prices have taken some support near $90 in NYMEX and 5000 in MCX. Investors are also monitoring the progress of talks in Baghdad among Iran and world powers the U.S., U.K., China, Germany and France on Tehran's nuclear ambitions. The oil market has lost about 300,000 barrels per day (bpd) of Iranian crude since the announcement of sanctions and an embargo against the Islamic Republic over its nuclear programme. The possibility of a Greece exit from the Europe is materializing and each member of the euro has started to prepare the contingency plan in case Greece decided to leave the euro, which will drag other debt-laden nations and could collapse the whole region if these debt laden countries couldn't survive from such a situation. Natural gas can remain on volatile path in range of 140-165 in near term. The summer cooling demand for natural gas will be watched by the investors. In the recent weeks, the below-average inventory reports have been taken as a sign of improving fundamentals for the fuel. Gas in storage now stands at 2.744 trillion cubic feet, a record high for this time of year, and 38% above the five-year average.
FERROUS AND NON-FERROUS METALS
Base metals pack can trade sideways with volatile path as the ambiguity about Greece crises is keeping investor's edgy. Given some positive sentiments creeping in the global equity market the downside can remain capped in base metals. Copper prices can trade in range of 413-435 in near term while lead can also trade in range of 105-111. Physical copper enjoyed a premium of up to 300 yuan to the front-month futures contract due to the tightness in supply and improving demand. The world's top copper producer, Chile's Codelco stated recently that its output fell 10 percent in the first quarter from a year earlier to 373,000 tonnes, and also stated that it was on target to produce 1.708 million tonnes this year. A pickup in copper consumption in China, the world's top user of the metal, is likely to provide a floor for prices, aided by expectations of more pro growth measures from Beijing after the disappointing economic data. China's massive manufacturing sector contracted for the seventh straight month in May, adding to worries about global growth as the euro zone's slump deepened and the U.S. economy seemed to be losing momentum. In other base metals Zinc may trade in range 103-110. Nickel prices are expected to remain in the range of 920-950 in MCX. Aluminum prices can also trade in range of 106-111. China's largest Aluminum producing Henan province located in central land have idled 700000 tonnes of capacity in recent months due to weak metal price and rising cost of energy .

Closing as on 24.05.12
NOTES : 1) Buy / Sell 25% of Commodity at S1/R1 respectively & rest 75% at S2/R2 respectively.2) S1 & S2 indicate first support & second support & R1 & R 2 indicate first resistance & second resistance. 3) Sometimes you will find the stop loss to be too far but if we change the stop loss once, we will find more strength coming into the commodity. At the moment, the stop loss will be far as we are seeing the graphs on weekly
basis and taking a long-term view and not a short-term view.4) These levels should not be confused with the daily trend sheet, which is sent every morning by e-mail in the name of Daily report- commodities.
TECHNICAL RECOMMENDATIONS
EXCHANGE CONTRACT CLOSING DATE TREND
CHANGED
NCDEX SOYABEAN (JUNE) 3264.00 07.03.12 UP 2790.00 3250.00 - 3200.00 - 3150.00
NCDEX JEERA (JUNE) 13105.00 02.02.12 DOWN 14347.00 - 14100.00 - 14800.00 15200.00
NCDEX PEPPER (JUNE) 38160.00 3.04.12 SIDEWAYS - - - - - -
NCDEX RED CHILLI (JUNE) 4822.00 07.03.12 SIDEWAYS - - - - - -
NCDEX RM SEEDS (JUNE) 3665.00 15.03.12 UP 3729.00 3600.00 - 3550.00 - 3500.00
MCX MENTHA OIL (JUNE) 1285.00 26.04.12 DOWN 1719.00 - 1850.00 - 1950.00 2000.00
MCX CARDAMOM (JUNE) 1353.20 23.02.12 UP 867.80 1100.00 - 1000.00 - 950.00
MCX SILVER (JULY) 54180.00 09.02.12 SIDEWAYS - - - - - -
MCX GOLD (JUNE) 28807.00 23.02.12 SIDEWAYS - - - - - -
MCX COPPER (JUNE ) 423.95 09.02.12 UP 434.00 408.00 - 400.00 - 390.00
MCX LEAD (JUNE) 108.90 26.04.12 UP 111.20 102.00 - 98.00 - 95.00
MCX ZINC (JUNE) 105.20 26.04.12 UP 106.75 98.00 - 93.00 - 91.00
MCX NICKEL(JUNE) 954.80 08.03.12 DOWN 949.50 - 970.00 - 980.00 990.00
MCX ALUMINIUM(JUNE) 111.65 26.04.12 UP 109.20 103.00 - 100.00 - 98.00
MCX CRUDE OIL (JUNE) 5092.00 17.05.12 SIDEWAYS - - - - - -
MCX NATURAL GAS (JUNE) 153.40 03.05.12 SIDEWAYS - - - - - -
TREND RATE TREND S1 R1 S2 R2 CLOSING
PRICE CHANGED STOP/LOSS*
TREND SHEET
COMMODITY
11
CRUDE OIL MCX (JUNE) contract closed at 5092 on 24th May '12. The contract made its high of
5629.00 on 3rd May '12 and a low of 4710.00 on 2nd February '12 .The 18-day Exponential Moving
Average of the commodity is currently at 5139. On the daily chart, the commodity has Relative Strength Index (14-day) value of 38.One can Buy in the
range 5050-5030 with the stop loss of 4975 for a target of 5200.
`
` `
`
` `
COPPER MCX (JUNE) contract closed at 423.95 on 24th May '12.The contract made its high of 449.50
on 30th April '12 and a low of 413.65 on 16th April '12.The 18-day Exponential Moving Average of the
Commodity is currently at 427.75.
On the daily chart, the commodity has Relative Strength Index (14-day) value of 42.76. One can Sell in
the range 428-430 with the stop loss of 435 for a target of 415.
` `
`
`
` `
NICKEL MCX (JUNE) contract closed at ̀ 954.80 on 24th May '12.The contract made its high of 979.10
on 30th May '12 and a low of 922.00 on 15th May '12.The 18-day Exponential Moving Average of the
Commodity is currently at 945.37.
On the daily chart, the commodity has Relative Strength Index (14-day) value of 54.67. One can Sell in
the range 965-970 with the stop loss of 985 for a target of 920.
`
`
`
` `
CRUDE OIL MCX (JUNE)
COPPER MCX (JUNE)
NICKEL MCX (JUNE)

COMMODITY
12
NEWS DIGEST
A selling wave swept across many commodity futures last week, which compelled many
commodities to made new yearly lows. The grim situation of Euro zone quaked many investors
to ran for safer assets and the major beneficiary was dollar index, which saw swift recovery in
past four week, closed above 82 mark. With the sharp fall in crude and other major
commodities CRB touched multi months low on fears of a euro zone contagion spreading. Even
falling BDI was giving indication of slowing down of shipping activities worldwide. With
uncertainty surrounding economies from Europe to China, price of oil dropped below $90 per
barrel. Iran allowed the Nuclear Engineer to check the progress of nuclear activities which
cooled down the prices. Meanwhile, Saudi Arabia, Libya and Iraq have been delivering more oil
to world markets to cover potential lost oil supplies from Iran. Furthermore, U.S. crude
inventories rose 883,000 barrels last week to 382.5 million, the highest level since August 1990.
All these factors proved bearish for crude and it traded down. Natural gas astonished market
players with its speedy recovery in past few weeks. In India, depreciation of rupee was the hot
discussion and major driver for trade. It has dropped more than 13 percent from its 2012 high
reached in February. Crude was up due to this currency depreciation. Bullion traded down in
both international market and domestic markets. Most of the base metals, except aluminium
closed the week on positive note on the news that China will accelerate efforts to spur
economic growth. Copper stocks in Shanghai's bonded storage, the biggest in China, are now
double the 300,000 tonnes average of the past four years.
Agri commodities noticed seesaw movements throughout the week. Selling pressure was
continued in edible oil and oil seeds futures as scorching heat lessen the demand for edible oil.
Crude palm oil was marginally up whereas mustard seed and refined soya oil traded dull on
small activities in spot market. Mentha oil fell further on lower buying interest in spot market.
Spices complex was under the grip of bear on selling pressure. Pepper, jeera, turmeric and chilli
prices moved in negative territory whereas cardamom recovered its weekly loss on lower level
buying. Rally looked tired in chana owing to profit booing at higher levels. Major grains wheat
and maize behaved in different way. Maize had no relief and it shed gains further on ample of
supply whereas wheat closed up. Upside attributed to a drought mixed with hot weather in
major growing regions of the US as well as Russia.
WEEKLY COMMENTARY
WEEKLY STOCK POSITIONS IN WAREHOUSE (NCDEX)
COMMODITY UNIT 17.05.12 24.05.12 DIFFERENCE
QTY. QTY.
CHANA MT 73876.00 77193.00 3317.00
CHILLI MT 8135.00 8130.00 -5.00
GUAR SEED MT 44053.00 43545.00 -508.00
GUAR GUM MT 8388.00 8388.00 0.00
JEERA MT 11237.00 11131.00 -106.00
PEPPER MT 1585.00 1327.00 -258.00
RAPE MUSTARD SEED MT 123579.00 132702.00 9123.00
SOYA BEAN SEEDS MT 70928.00 47445.00 -23483.00
STEEL LONG MT 2914.00 3013.00 99.00
SUGAR S KOL MT 19016.00 6188.00 -12828.00
TURMERIC MT 6388.00 6636.00 248.00
COMMODITY UNIT 17.05.12 24.05.12 DIFFERENCE
QTY. QTY.
CARDAMOM MT 40.20 40.20 0.00
COTTON BALES 58400.00 70500.00 12100.00
GOLD KGS 123.00 123.00 0.00
GOLD MINI KGS 57.50 54.70 -2.80
MENTHA OIL KGS 769560.39 544353.24 -225207.15
SILVER KGS 124821.63 118364.73 -6456.89
SUGAR MT 3655.10 3456.22 -198.88
NCDEX TOP GAINERS & LOSERS (% Change) MCX TOP GAINERS & LOSERS (% Change)
·Vietnam's Ministry of Industry and Trade (MoIT) has
proposed that cotton fibre may be listed for trade
on the Vietnam Commodity Exchange (VNX).
·China's Dalian Commodity Exchange (DCE) has
drafted the world's first coking coal futures
contract, which it hopes will help steelmakers,
coal and coke producers to hedge the key
steelmaking raw material.
·The India Finance Ministry is considering levying four
per cent countervailing duty (CVD) to protect the
domestic gold jewellery industry from the glut of
ready-made ornament imports through Thailand.
·Trading hours extended on the CME's Chicago Board of
Trade for corn, mini-sized corn, soybeans, mini-sized
soybeans, wheat, mini-sized wheat, soybean meal,
soybean oil, rough rice, oats and ethanol futures.
·Rio Tinto Alcan has written to Japanese buyers
asking them to pay a record premium of $200 per
tonne for July-September primary aluminium
shipments. (average premiums of $121-$122)
·The south-west monsoon has missed its date of
onset over Andaman Sea, the first port of call in the
Indian territorial waters. The normal timeline for
the onset here is May 15 to 20.
·Next year, New York City will get a 20-mile (32-km)
pipeline, to deliver about 800 million cubic feet of
natural gas per day to homes and businesses.
WEEKLY STOCK POSITIONS IN WAREHOUSE (MCX)
4.45
3.04 3.012.48
2.21
-10.90
-4.61
-4.00
-3.01 -3.00
-12.00
-10.00
-8.00
-6.00
-4.00
-2.00
0.00
2.00
4.00
6.00
ALMOND ATF CORIANDER NICKEL CARDAMOM MENTHA OIL
COTTON IRON ORE CHANA (DEL)
REF.SOY OIL
2.59
1.71 1.671.42 1.28
-9.13
-5.95
-5.48
-4.74 -4.58
-10.00
-8.00
-6.00
-4.00
-2.00
0.00
2.00
4.00
POTATO WHEAT CORIANDER SILVER INTL. NEW STEEL LONG
COTTON SD. OC. (AKL)
BARLEY KAPAS SOYABEAN RM SEEDS

When metals warehouses in top consumers like China, are full; workers has started stockpiling metals in car parks. Is the global economy is in trouble? In its twice-yearly update on developments in the region the World Bank has once again cut China's growth forecast to 8.2%. Calling on China to act quickly, the World Bank added that a slowing Chinese economy will be a burden to emerging East Asian economies, and warned
that a deteriorating European debt crisis could inflict even greater damage on China.On flip side of the world, several euro zone economies are in recession and there are serious fears about the solvency of several more.
Bulging Inventories…At Qingdao Port, home to one of China's largest iron ore terminals, hundreds of mounds of iron ore, each as tall as a three-storey building, spill over into an area signposted "grains storage" and almost to the street. Further south, some bonded warehouses in Shanghai are using carparks to store swollen copper stockpiles - another unusual phenomenon that bodes ill for global metal prices and raises questions about China's ability to sustain its economic growth as the rest of the world falters.Commodity markets saw China's inventories swell in the first quarter, when manufacturing slowed down due to the Lunar New Year holidays, and then gradually declined during the second quarter when industrial activity picks up. This year, however, is different. Copper stocks in Shanghai's bonded storage, the biggest in China, are now double the 300,000 tonnes average of the past four years and iron ore stocks are about a third more than their 74 million tonnes average.
Aftermath….This slowdown has hit hard some of the small and medium-sized manufacturers and traders who form the bulk of China's metals business. The glut has already prompted some firms to sell copper into London Metals Exchange warehouses, a move which would further depress the exchange's benchmark prices. Copper has already shed 9% in the past two weeks to hit a four-month low of $7,625. Copper has also lost its luster as a financing tool for investors who use the metal as collateral to borrow yuan in a punt on the Chinese currency and also to invest in the property sector, which has fizzled out. Steel futures are also down over 5 percent this year, as mills produce at record levels even though demand is weak. Some Chinese steel mills have postponed delivery of iron ore from miners, as a slow steel market cuts demand and producers expect a further drop in prices.
Plunging indicators…·China's industrial output growth slowed in April to the lowest level since May
2009, stoking worries over slowing growth in the world's second-largest economy.
·The preliminary HSBC China Manufacturing Purchasing Managers Index fell to 48.7 in May compared with a final reading of 49.3 in April.
·The World Bank cut its GDP growth forecast for the country in 2012 to 8.2%.·China's home prices fell in a record, 46 of 70 cities tracked by the government
in April.·China's total vehicle sales declined 1.3 percent in the January-April period,
the worst showing since 1998.·A composite index based on a survey of purchasing managers in both
industries in the 17-nation euro area fell to 45.9 from 46.7 in April.·UK 1Q12 GDP growth has been revised down to -0.3%QoQ from -0.2%. This
pushes the YoY rate down to -0.1% from 0.0%.
CHINA'S SLOWDOWN… MURKY EUROPE….A GLOOMY YEAR !!!SPOT PRICES (% change)
COMMODITY
13
WEEKLY STOCK POSITIONS IN LME (IN TONNES)
COMMODITY STOCK POSITION STOCK POSITION DIFFERENCE
ON 17.05.12 ON 24.05.12
COPPER 217450 224075 6625
ALUMINIUM 4982900 4956325 -26575
NICKEL 105564 105510 -54
ZINC 940250 940975 725
LEAD 358975 352550 -6425
TIN 14355 13625 -730
INTERNATIONAL COMMODITY PRICES
COMMODITY EXCHANGE CONTRACT UNIT 18.05.12 24.05.12 CHANGE (%)
Soya CBOT JULY Cent per Bushel 1405.00 1376.00 -2.06
Maize CBOT JULY Cent per Bushel 635.50 578.50 -8.97
CPO BMD AUG MYR per MT 3096.00 3069.00 -0.87
Sugar LIFFE AUG 10 cents per MT 570.30 556.00 -2.51
COMMODITY EXCHANGE CONTRACT 18.05.12 24.05.12 CHANGE%
ALUMINIUM LME 3 MONTHS 2055.50 2008.00 -2.31
COPPER LME 3 MONTHS 7744.50 7612.00 -1.71
LEAD LME 3 MONTHS 1957.00 1945.00 -0.61
NICKEL LME 3 MONTHS 17140.00 17000.00 -0.82
TIN LME 3 MONTHS 19425.00 19690.00 1.36
ZINC LME 3 MONTHS 1919.00 1878.00 -2.14
GOLD COMEX JUNE 1591.90 1557.50 -2.16
SILVER COMEX JULY 2871.50 2815.70 -1.94
LIGHT CRUDE OIL NYMEX JULY 91.80 90.66 -1.24
NATURAL GAS NYMEX JULY 2.82 2.71 -4.00
PRICES OF METALS IN LME/ COMEX/ NYMEX (in US $)
7.21
0.00
2.30
0.24
3.30
3.80
4.77
1.81
3.85
-2.05
-1.76
-0.18
-0.68
-0.71
-1.63
-1.35
-0.11
-0.44
-0.64
BARLEY (JAIPUR)
CARDAMOM (VANDANMEDU)
CHILLI (GUNTUR)
CHANA (DELHI)
CORIANDER (KOTA)
CRUDE PALM OIL (KANDLA)
GOLD KG (MUMBAI)
GUR (MUZAFFARNGR.)
JEERA (UNJHA)
MASOOR (INDORE)
MILD STEEL INGOTS (GHAZIABAD)
MUSTARD (JAIPUR)
PEPPER MALABAR GAR (KOCHI)
RAW JUTE (KOLKATA)
REFINED SOYA OIL (INDORE)
RUBBER (KOCHI)
SILVER (DELHI)
SOYABEAN (INDORE)
TURMERIC (NIZAMABAD)

14
CURRENCY
Currency Table
Currency Pair Open High Low Close
USD/INR 54.47 56.38 54.32 55.55
EUR/INR 68.93 71.13 68.81 68.81
GBP/INR 85.77 88.43 85.55 87.04
JPY/INR 68.45 70.95 68.32 69.80
(Source: Thomson Reuters, Open: Friday (Prior) 9.00 AM IST, Close: Thursday 5.00 PM IST)
News Flows of last week
22nd May: Existing home sales in U.S rose 3.4 percent in April
23rd May: Euro hit nearly 2-year low on Greek exit fears
23rd May: New home sales, prices rose in April
23rd May: Indian rupee skid to new low
24th May: April durable goods orders in U.S edged up as machinery drags
24th May: New claims for unemployment benefits in U.S fell slightly last week,
government data showed
Economic gauge for the next week
Date Currency Event Previous
28-May JPY Jobless Rate 4.50%
29-May GBP Nationwide House Prices n.s.a. (YoY) -0.90%
29-May EUR German Consumer Price Index (YoY) 2.10%
29-May EUR German Consumer Price Index - EU Harmonised (YoY)2.20%
29-May USD Consumer Confidence 69.2
30-May GBP Mortgage Approvals 49.9K
30-May USD Pending Home Sales (YoY) 10.80%
30-May GBP GfK Consumer Confidence Survey -31
01-Jun USD Personal Consumption Expenditure Core (YoY) 2.00%
01-Jun USD Unemployment Rate 8.10%
01-Jun USD Change in Non-farm Payrolls 115K
Market Stance
The Indian rupee slumped to another record low against the dollar, ratcheting up pressure on policymakers to restore confidence in the currency at a time when appetite for risky assets is ebbing around the world. However, the government announced that it will allow state-run companies to raise gasoline prices, a measure that on its own will have negligible fiscal impact but that is at least seen as a signal that India could begin to look at fuel reform. Global risk aversion due to the crisis in the euro zone has exposed India's vulnerabilities, most prominently a current account deficit that reached 4.3 percent of GDP in the December quarter. Worries about the government's ability to fix its finances have also weighed heavily on the rupee, as investors worry that the government will overshoot its deficit target of 5.1 percent of gross domestic product for the fiscal year ending in March 2013. In the currency futures market, the most-traded near-month dollar-rupee contracts on, the MCX-SX ended at 55.71 on 24th May. However, in coming week USD/INR may trade in volatile manner as the best defense for the rupee rests with the Indian government, which needs to implement more confidence-boosting measures about its finances and stimulate investment.
Technical Commendation USD/INR EUR/INR
USD/INR (JUNE) contract closed at `56.03 on 24th May'12. The contract made its high of `56.73 on 24th May'12 and a low of `46.21 on 02nd Aug.'11.The 14-day Exponential Moving Average of the USD/INR is currently at ̀ 55.08.
On the daily chart, the USD/INR has Relative Strength Index (14-day) value of 73.05.One can Buy in the range of 55.45-55.35 for a target of ̀ 56.50 with the stop loss of ̀ 54.90
EUR/INR (JUNE) contract closed at `70.42 on 24th May'12. The contract made its high of `71.50 on 04th May'12 and a low of `68.12 on 10th April'12.The 14-day Exponential Moving Average of the EUR/INR is currently at ̀ 70.28.
On the daily chart, EUR/INR has Relative Strength Index (14-day) value of 52.37. One can Buy in the range of 69.60-69.50 for a target of ̀ 70.50 with the stop loss of `69.00
GBP/INR JPY/INR
GBP/INR (JUNE) contract closed at `87.84 on 24th May'12. The contract made its high of `88.91 on 24th May'12 and a low of `83.07 on 17th April '12. The 14-day Exponential Moving Average of the GBP/INR is currently at ̀ 87.32.
On the daily chart, GBP/INR has Relative Strength Index (14-day) value of 59.71. One can Buy in range of 87.30-87.20 for a target of `88.40 with the stop loss of `86.70.
JPY/INR (JUNE) contract closed at `70.53 on 24th May'12. The contract made its high of `71.62 on 24th May'12 and a low of `61.24 on 21st March '12 .The 14-day Exponential Moving Average of the JPY/INR is currently at ̀ 68.96.
On the daily chart, JPY/INR has Relative Strength Index (14-day) value of 71.54. One can Buy in the range of 69.10-69.00 for a target of ̀ 70.00 with the stop loss of `68.50.

IPO
14
IPO
15
INDIAN IPO NEWS
Speciality Restaurants sets IPO price at ̀ 150/share
Speciality Restaurants, a fine dining operator in India, has fixed the issue price at ̀ 150 per equity share for an initial public offering of 11,739,415 equity shares of face value of 10 each for cash at a premium. The price band for the issue was between 146 and 155 per equity share. The issue was opened during May 16-18, 2012. The issue was oversubscribed approximately 2.55 times as per the initial data available on the stock exchanges. The issue constitutes 25% of the post-issue paid-up equity share capital of the company. The book running lead manager to the issue was Kotak Mahindra Capital Company Limited.
Rashtriya Ispat Nigam files IPO papers with SEBI
State-owned Rashtriya Ispat Nigam (RINL) may be the first initial public offer (IPO) that would be launched by the government in financial year 2012-13. The company has filed draft red herring prospectus (DRHP) with SEBI for its IPO of 48.898 crore equity shares (a dilution of 10% stake by the government) on May 18. A discount upto 5% on the offer price would be offered to retail investors and employees of the company, according to the DRHP. India's second largest government owned steel company has original liquid steel production capacity of 3 mtpa, which would be expanded to 6.3 mtpa by the financial year 2013. The public offer is a part of divestment programme for FY13 (that is 30,000 crore), so the entire money would be received by government.
Vodafone India says IPO unlikely in 2012
British mobile operator Vodafone's Indian unit may not go ahead with an initial public offering this year because of uncertainty over the rules and pricing of radio airwaves. Vodafone India has started preparing its IPO but a flotation this year is "highly unlikely" as the company awaits final rules on a crucial airwaves auction. Vodafone, the biggest overseas corporate investor in India, has grown fast since entering the Indian arena in 2007. It took a charge of 2.3 billion pounds ($3.6 billion) in 2010 due to fierce competition and escalating spectrum costs. The company also faces a tax bill of as much as 200 billion rupees, including interests and penalties, over its 2007 acquisition.
Plastene, Goodwill Hospital & Samvardhana Motherson Finance withdraw IPOs amid weak market conditions
As many as three companies have withdrawn their initial public offerings, together worth over 1,800 crore, this year so far amid poor market conditions roiling investor sentiment. Packaging materials maker Plastene India, healthcare firm Goodwill Hospital and auto parts manufacturer Samvardhana Motherson Finance, have shelved their IPOs since the beginning of this year. These entities were aiming to mop up a total of 1,805 crore from the capital market.
` ` `
`
`
`
MT Educare Miscellaneous 394.12 99.00 12-Apr-12 80.00 86.05 99.65 24.56
NBCC Construction 984.60 124.97 12-Apr-12 106.00 100.00 82.05 -22.59
Olympic card. Media 49.75 24.75 28-Mar-12 30.00 29.95 30.50 1.67
Multi Comm. Exc. Exchange 4529.06 663.31 9-Mar-12 1032.00 1387.00 888.05 -13.95
Indo Thai Sec. Finance 10.20 29.60 2-Nov-11 74.00 75.00 10.20 -86.22
Vaswani Inds. Steel 21.96 49.00 24-Oct-11 49.00 33.45 8.45 -82.76
M and B Switch. Capital Goods 165.4 93.00 20-Oct-11 186.00 180.00 82.70 -55.54
Flexituff Intl. Packaging 778.15 104.63 19-Oct-11 155.00 155.00 358.10 131.03
Prakash Constro. Construction 139.72 60.00 4-Oct-11 138.00 145.00 111.15 -19.46
PG Electro. Cons. Durables 298.66 120.65 26-Sep-11 210.00 200.00 182.00 -13.33
TD Power Sys. Capital Goods 996.70 227.00 8-Sep-11 256.00 251.60 299.85 17.13
Tree House Edu. Miscellaneous 656.67 112.06 26-Aug-11 135.00 132.80 194.80 44.30
L&T Fin.Holdings Finance 7201.99 1245.00 12-Aug-11 52.00 51.00 42.00 -19.23
Inventure Grow. Finance 377.16 81.90 4-Aug-11 117.00 119.00 44.90 -61.62
Readymade Steel Steel 85.03 34.75 13-Jul-11 108.00 115.00 72.55 -32.82
Birla Pacific Healthcare 54.16 65.18 7-Jul-11 10.00 10.10 4.83 -51.70
Rushil Decor Miscellaneous 305.57 40.64 7-Jul-11 72.00 81.25 212.20 194.72
Timbor Home Miscellaneous 35.57 23.25 22-Jun-11 63.00 72.00 24.10 -61.75
VMS Industries Shipping 151.85 25.75 14-Jun-11 40.00 43.95 92.20 130.50
Aanjaneya Life. Pharma 760.69 117.00 27-May-11 234.00 229.45 547.65 134.04
Sanghvi Forg. Forgings 86.29 36.90 23-May-11 85.00 85.00 68.00 -20.00
Innoventive Ind. Steel 703.75 217.41 13-May-11 117.00 110.00 118.00 0.85
Servalaksh.Paper Paper 21.12 60.00 12-May-11 29.00 30.00 4.90 -83.10
Future Ventures Finance 1298.82 750.00 10-May-11 10.00 9.50 8.24 -17.60
Para. Print. Packaging 14.23 45.83 9-May-11 35.00 35.00 5.33 -84.77
Muthoot Finance Finance 4559.02 901.25 6-May-11 175 180 122.65 -29.91
IPO TRACKER
Company Sector M.Cap(In Cr.) Issue Size(in Cr.) List Date Issue Price List Price Last Price %Gain/Loss(from Issue price)
*


MUTUAL FUND
17
NEWS
NFOs WATCH
Fund Name NFO NFO Scheme Objective Fund Type Fund Class Fund Manager MinimumOpens on Closes on Amount
17-May-2012 31-May-2012 Open Ended Income `5000/-BNP Paribas Income & Gold Fund
Mr. Puneet PalTo generate income from a portfolio constituted of debt and money market securities, along with investments in Gold Exchange Traded Funds (ETFs). However, there can be no assurance that the investment objective of the scheme will be achieved. The scheme does not guarantee/indicate any returns.
Birla Sun Life MF introduces Birla Sun Life Fixed Term Plan - Series FLBirla Sun Life Mutual Fund has launched the New Fund Offer (NFO) Birla Sun Life Fixed Term Plan - Series FL, a close ended income scheme. The NFO opens for subscription on May 28, 2012 and closes on May 31, 2012. No entry and exit load charge is applicable for the scheme. The duration of the scheme will be 368 days from the date of allotment. The scheme offers dividend payout and growth option. The investment objective of the scheme is to generate income by investing in a portfolio of fixed income securities maturing on or before the duration of the scheme.
Kotak MF introduces Kotak FMP Series 88Kotak Mutual Fund has launched the New Fund Offer (NFO) Kotak FMP Series 88, a close ended debt scheme. The NFO opens for subscription on May 24, 2012 and closes on May 28, 2012. No entry and exit load charge is applicable for the scheme. The duration of the scheme will be 370 days from the date of allotment. The scheme offers dividend payout and growth option. The investment objective of the scheme is to generate returns through investments in debt and money market instruments with a view to significantly reduce the interest rate risk. The scheme will invest in debt and money market securities, maturing on or before maturity of the scheme.
DSP BlackRock MF introduces FMP - Series 52DSP BlackRock Mutual Fund has launched the New Fund Offer (NFO) DSP BlackRock FMP - Series 52 - 9M, a close ended income scheme. The NFO opens for subscription on May 25, 2012 and closes on May 29, 2012. No entry and exit load charge is applicable for the scheme. The duration of the scheme will be 9 months from the date of allotment. The scheme offers dividend payout and growth option. The investment objective of the scheme is to seek to generate returns and capital appreciation by investing in a portfolio of debt and money market securities.
SBI MF introduces Debt Fund Series - 90 Days - 64SBI Mutual Fund has launched the New Fund Offer (NFO) SBI Debt Fund Series - 90 Days - 64, a close ended debt scheme. The NFO opens for subscription on May 25, 2012 and closes on May 28, 2012. No entry and exit load charge is applicable for the scheme. The scheme offers dividend payout and growth option. The investment objective of the scheme is to provide regular income, liquidity and returns to the investors through investments in a portfolio comprising of debt instruments such as Government Securities, PSU & Corporate Bonds and Money Market Instruments maturing on or before the maturity of the scheme.
Tata MF introduces Tata Fixed Maturity Plan Series 40 Scheme DTata Mutual Fund has launched the New Fund Offer (NFO) Tata Fixed Maturity Plan Series 40 Scheme D, a close-ended debt scheme. The NFO opens for subscription on May 23, 2012 and closes on May 28, 2012. The duration of the scheme will be 370 days from the date of allotment. No entry and exit load charge is applicable for the scheme. The scheme offers dividend payout and growth option. The investment objective of the scheme is to generate income and / or capital appreciation by investing in wide range of debt and money market instruments having maturity in line with the maturity of the scheme. The maturity of all investments shall be equal to or less than the maturity of the scheme.
DSP BlackRock MF introduces FMP - Series 51DSP BlackRock Mutual Fund has launched the New Fund Offer (NFO) DSP BlackRock FMP - Series 51 - 12M, a close ended income scheme. The NFO opens for subscription on May 25, 2012 and closes on May 31, 2012. No entry and exit load charge is applicable for the scheme. The duration of the scheme will be 12 months from the date of allotment. The scheme offers dividend payout and growth option. The investment objective of the scheme is to seek to generate returns and capital appreciation by investing in a portfolio of debt and money market securities.
Birla SL Short Term Opportunities Fund revises exit loadBirla Sun Life Mutual Fund has announced revision of exit load under Birla Sun Life Short Term Opportunities Fund, an open ended fund effective May 25, 2012. Accordingly a load of 0.50% will be charged if redeemed/switched out within 365 days from the date of allotment and NIL if redeemed/switched after days from the date of allotment.
Bharti AXA (R) Return Fund announces change in fund managerBharti AXA Mutual Fund has announced change in fund manager of Bharti AXA Regular Return Fund effective May 21 2012. Accordingly, Mr Alok Singh has replaced Mr Ramesh Rachuri and Mr Gaurav Kapur. Mr. Alok Singh aged 36 is Chief Investment Officer-Fixed Income and key personnel of Bharti Axa AMC and holds B.com, PGDBA, CFA degrees. He has around 12 years of experience, including 7 years in mutual fund industry.
24-May-2012 30-May-2012 Close Ended Income `5000/-DWS Fixed Maturity Plan - Series 14 (DFMP - 14)
Kumaresh Ramkrishnan
To generate income by investing in debt and money market instruments maturing on or before the date of the maturity of the Scheme. There can be no assurance that the investment objective of the Scheme will be realized
MUTUAL FUND
17
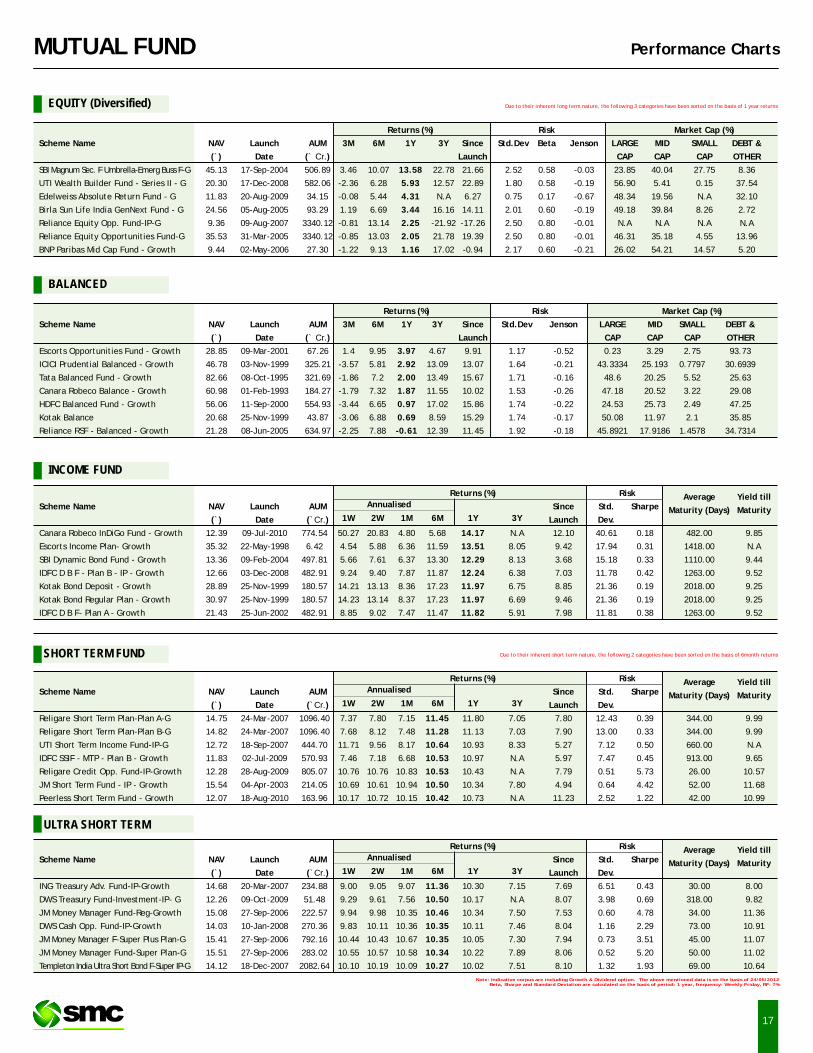
Performance Charts
Returns (%) Risk Market Cap (%)
Scheme Name NAV Launch AUM 3M 6M 1Y 3Y Since Std.Dev Beta Jenson LARGE MID SMALL DEBT &
(`) Date (` Cr.) Launch CAP CAP CAP OTHER
SBI Magnum Sec. F Umbrella-Emerg Buss F-G 45.13 17-Sep-2004 506.89 3.46 10.07 13.58 22.78 21.66 2.52 0.58 -0.03 23.85 40.04 27.75 8.36
UTI Wealth Builder Fund - Series II - G 20.30 17-Dec-2008 582.06 -2.36 6.28 5.93 12.57 22.89 1.80 0.58 -0.19 56.90 5.41 0.15 37.54
Edelweiss Absolute Return Fund - G 11.83 20-Aug-2009 34.15 -0.08 5.44 4.31 N.A 6.27 0.75 0.17 -0.67 48.34 19.56 N.A 32.10
Birla Sun Life India GenNext Fund - G 24.56 05-Aug-2005 93.29 1.19 6.69 3.44 16.16 14.11 2.01 0.60 -0.19 49.18 39.84 8.26 2.72
Reliance Equity Opp. Fund-IP-G 9.36 09-Aug-2007 3340.12 -0.81 13.14 2.25 -21.92 -17.26 2.50 0.80 -0.01 N.A N.A N.A N.A
Reliance Equity Opportunities Fund-G 35.53 31-Mar-2005 3340.12 -0.85 13.03 2.05 21.78 19.39 2.50 0.80 -0.01 46.31 35.18 4.55 13.96
BNP Paribas Mid Cap Fund - Growth 9.44 02-May-2006 27.30 -1.22 9.13 1.16 17.02 -0.94 2.17 0.60 -0.21 26.02 54.21 14.57 5.20
EQUITY (Diversified)
BALANCED
INCOME FUND
Note: Indicative corpus are including Growth & Dividend option. The above mentioned data is on the basis of 24/05/2012Beta, Sharpe and Standard Deviation are calculated on the basis of period: 1 year, frequency: Weekly Friday, RF: 7%
ULTRA SHORT TERM
SHORT TERM FUND
Due to their inherent long term nature, the following 3 categories have been sorted on the basis of 1 year returns
Due to their inherent short term nature, the following 2 categories have been sorted on the basis of 6month returns
Returns (%) Risk Market Cap (%)
Scheme Name NAV Launch AUM 3M 6M 1Y 3Y Since Std.Dev Jenson LARGE MID SMALL DEBT &
(`) Date (` Cr.) Launch CAP CAP CAP OTHER
Escorts Opportunities Fund - Growth 28.85 09-Mar-2001 67.26 1.4 9.95 3.97 4.67 9.91 1.17 -0.52 0.23 3.29 2.75 93.73
ICICI Prudential Balanced - Growth 46.78 03-Nov-1999 325.21 -3.57 5.81 2.92 13.09 13.07 1.64 -0.21 43.3334 25.193 0.7797 30.6939
Tata Balanced Fund - Growth 82.66 08-Oct-1995 321.69 -1.86 7.2 2.00 13.49 15.67 1.71 -0.16 48.6 20.25 5.52 25.63
Canara Robeco Balance - Growth 60.98 01-Feb-1993 184.27 -1.79 7.32 1.87 11.55 10.02 1.53 -0.26 47.18 20.52 3.22 29.08
HDFC Balanced Fund - Growth 56.06 11-Sep-2000 554.93 -3.44 6.65 0.97 17.02 15.86 1.74 -0.22 24.53 25.73 2.49 47.25
Kotak Balance 20.68 25-Nov-1999 43.87 -3.06 6.88 0.69 8.59 15.29 1.74 -0.17 50.08 11.97 2.1 35.85
Reliance RSF - Balanced - Growth 21.28 08-Jun-2005 634.97 -2.25 7.88 -0.61 12.39 11.45 1.92 -0.18 45.8921 17.9186 1.4578 34.7314
Returns (%) Risk Average Yield tillScheme Name NAV Launch AUM Since Std. Sharpe Maturity (Days) Maturity
1W 2W 1M 6M 1Y 3Y(`) Date (`Cr.) Launch Dev.
Canara Robeco InDiGo Fund - Growth 12.39 09-Jul-2010 774.54 50.27 20.83 4.80 5.68 14.17 N.A 12.10 40.61 0.18 482.00 9.85
Escorts Income Plan- Growth 35.32 22-May-1998 6.42 4.54 5.88 6.36 11.59 13.51 8.05 9.42 17.94 0.31 1418.00 N.A
SBI Dynamic Bond Fund - Growth 13.36 09-Feb-2004 497.81 5.66 7.61 6.37 13.30 12.29 8.13 3.68 15.18 0.33 1110.00 9.44
IDFC D B F - Plan B - IP - Growth 12.66 03-Dec-2008 482.91 9.24 9.40 7.87 11.87 12.24 6.38 7.03 11.78 0.42 1263.00 9.52
Kotak Bond Deposit - Growth 28.89 25-Nov-1999 180.57 14.21 13.13 8.36 17.23 11.97 6.75 8.85 21.36 0.19 2018.00 9.25
Kotak Bond Regular Plan - Growth 30.97 25-Nov-1999 180.57 14.23 13.14 8.37 17.23 11.97 6.69 9.46 21.36 0.19 2018.00 9.25
IDFC D B F- Plan A - Growth 21.43 25-Jun-2002 482.91 8.85 9.02 7.47 11.47 11.82 5.91 7.98 11.81 0.38 1263.00 9.52
Annualised
Returns (%) Risk Average Yield tillScheme Name NAV Launch AUM Since Std. Sharpe Maturity (Days) Maturity
1W 2W 1M 6M 1Y 3Y(`) Date (`Cr.) Launch Dev.
Religare Short Term Plan-Plan A-G 14.75 24-Mar-2007 1096.40 7.37 7.80 7.15 11.45 11.80 7.05 7.80 12.43 0.39 344.00 9.99
Religare Short Term Plan-Plan B-G 14.82 24-Mar-2007 1096.40 7.68 8.12 7.48 11.28 11.13 7.03 7.90 13.00 0.33 344.00 9.99
UTI Short Term Income Fund-IP-G 12.72 18-Sep-2007 444.70 11.71 9.56 8.17 10.64 10.93 8.33 5.27 7.12 0.50 660.00 N.A
IDFC SSIF - MTP - Plan B - Growth 11.83 02-Jul-2009 570.93 7.46 7.18 6.68 10.53 10.97 N.A 5.97 7.47 0.45 913.00 9.65
Religare Credit Opp. Fund-IP-Growth 12.28 28-Aug-2009 805.07 10.76 10.76 10.83 10.53 10.43 N.A 7.79 0.51 5.73 26.00 10.57
JM Short Term Fund - IP - Growth 15.54 04-Apr-2003 214.05 10.69 10.61 10.94 10.50 10.34 7.80 4.94 0.64 4.42 52.00 11.68
Peerless Short Term Fund - Growth 12.07 18-Aug-2010 163.96 10.17 10.72 10.15 10.42 10.73 N.A 11.23 2.52 1.22 42.00 10.99
Annualised
Returns (%) Risk Average Yield tillScheme Name NAV Launch AUM Since Std. Sharpe Maturity (Days) Maturity
1W 2W 1M 6M 1Y 3Y(`) Date (`Cr.) Launch Dev.
ING Treasury Adv. Fund-IP-Growth 14.68 20-Mar-2007 234.88 9.00 9.05 9.07 11.36 10.30 7.15 7.69 6.51 0.43 30.00 8.00
DWS Treasury Fund-Investment-IP- G 12.26 09-Oct-2009 51.48 9.29 9.61 7.56 10.50 10.17 N.A 8.07 3.98 0.69 318.00 9.82
JM Money Manager Fund-Reg-Growth 15.08 27-Sep-2006 222.57 9.94 9.98 10.35 10.46 10.34 7.50 7.53 0.60 4.78 34.00 11.36
DWS Cash Opp. Fund-IP-Growth 14.03 10-Jan-2008 270.36 9.83 10.11 10.36 10.35 10.11 7.46 8.04 1.16 2.29 73.00 10.91
JM Money Manager F-Super Plus Plan-G 15.41 27-Sep-2006 792.16 10.44 10.43 10.67 10.35 10.05 7.30 7.94 0.73 3.51 45.00 11.07
JM Money Manager Fund-Super Plan-G 15.51 27-Sep-2006 283.02 10.55 10.57 10.58 10.34 10.22 7.89 8.06 0.52 5.20 50.00 11.02
Templeton India Ultra Short Bond F-Super IP-G 14.12 18-Dec-2007 2082.64 10.10 10.19 10.09 10.27 10.02 7.51 8.10 1.32 1.93 69.00 10.64
Annualised

Team SMC with winner trophy of Kotak Infinity Cup 2012 Mr. Rupesh Mishra ( Captain, Team SMC ) receiving winner's trophy
Mr. Subhash C Aggarwal (Chairman & Managing Director, SMC Group) being felicitated with“Entrepreneur of the Year 2012 - Innovation in Financial and Business Services” by Franchisee India
Prize distribution to the winners of
“Holi Dhamaal Scheme - 2012” organized at
SMC Corporate Office.