
A Watershed Protection Plan - Arroyo Colorado |...
263
Update to the Arroyo Colorado Watershed Protection Plan 2017 Developed By The Arroyo Colorado Watershed Partnership
Transcript of A Watershed Protection Plan - Arroyo Colorado |...

Update to theArroyo Colorado
Watershed Protection Plan2017
Developed ByThe Arroyo Colorado Watershed Partnership


Table of Contents
TABLE OF CONTENTS...................................................................................................................................................... I
LIST OF FIGURES.......................................................................................................................................................... III
LIST OF TABLES........................................................................................................................................................... IV
EXECUTIVE SUMMARY..................................................................................................................................................1CHAPTER 1 – WATERSHED MANAGEMENT.......................................................................................................................6
Definition of a Watershed.......................................................................................................................... 6A Watershed’s Impacts on Water Quality...................................................................................................6The Watershed Approach........................................................................................................................... 6Watershed Protection Plan Development Process.......................................................................................6Private Property Rights.............................................................................................................................. 7Adaptive Management.............................................................................................................................. 7
CHAPTER 2 – THE ARROYO COLORADO WATERSHED..........................................................................................................8Brief History............................................................................................................................................... 8Channel Classification and Characteristics..................................................................................................9Topography............................................................................................................................................. 11Geology and Soils..................................................................................................................................... 11Climate and Rainfall................................................................................................................................. 13Demographics.......................................................................................................................................... 13Land Cover............................................................................................................................................... 15
CHAPTER 3 – HABITAT, WILDLIFE AND ECOTOURISM........................................................................................................17Arroyo Colorado Connection to Bay.......................................................................................................... 20Ecotourism............................................................................................................................................... 20USFWS Refuges and TPWD Managed Lands..............................................................................................21
CHAPTER 4 – WATER QUALITY ASSESSMENT..................................................................................................................24Dissolved Oxygen and Associated Parameters..........................................................................................27Bacteria................................................................................................................................................... 35
CHAPTER 5 – SOURCES OF POLLUTION...........................................................................................................................38Cropland.................................................................................................................................................. 39Wastewater Treatment Facilities.............................................................................................................. 39Onsite Sewage Facilities and Colonias....................................................................................................... 46Urban Stormwater................................................................................................................................... 54Wildlife and Feral Animals........................................................................................................................ 58Livestock.................................................................................................................................................. 61Pets......................................................................................................................................................... 61Illegal Dumping........................................................................................................................................ 62Physical Channel Modification.................................................................................................................. 62
CHAPTER 6 – SOURCE LOADING ANALYSIS......................................................................................................................65SWAT Analysis of Loading Sources............................................................................................................ 65Bacterial Source Tracking Analysis............................................................................................................ 70Discussion and Conclusions....................................................................................................................... 74
CHAPTER 7 – WATERSHED GOALS................................................................................................................................76Arroyo Colorado Partnership Mission Statement and Vision......................................................................76Watershed Goals...................................................................................................................................... 76
i | P a g e

CHAPTER 8 – MANAGEMENT MEASURES.......................................................................................................................78Agriculture............................................................................................................................................... 78Wastewater Treatment Facility Permits....................................................................................................81Sanitary Sewer Overflows......................................................................................................................... 83Enhanced Wastewater Treatment and Reuse............................................................................................86Onsite Sewage Facilities and Colonias....................................................................................................... 88Habitat.................................................................................................................................................... 93Urban Stormwater................................................................................................................................... 95Illegal Dumping...................................................................................................................................... 114Wildlife.................................................................................................................................................. 115Port of Harlingen.................................................................................................................................... 116Instream Measures................................................................................................................................. 116Flood Abatement BMPs.......................................................................................................................... 119
CHAPTER 9 – FUTURE SCENARIO ASSESSMENT..............................................................................................................120Modeling Scenarios................................................................................................................................ 120Impact of Management Measure Implementation on Segment 2202......................................................124Impact of Management Measure Implementation on Segment 2201......................................................125Impact of Advanced Treatment and Management Measures..................................................................128Impact of Spring Restoration and Management Measures......................................................................128Impact of Implementation of Aerators in Zone of Impairment.................................................................128Discussion and Conclusions..................................................................................................................... 128
CHAPTER 10 – EDUCATION AND OUTREACH.................................................................................................................130The Watershed Coordinator.................................................................................................................... 130Arroyo Colorado Partnership.................................................................................................................. 130Education and Outreach Plan................................................................................................................. 131
CHAPTER 11 – WATER QUALITY MONITORING PLAN.....................................................................................................137Historical Monitoring............................................................................................................................. 137Current Monitoring................................................................................................................................ 137Arroyo Colorado Watershed Plan Monitoring Plan..................................................................................140
CHAPTER 12 – MEASURING SUCCESS..........................................................................................................................141Water Quality Target Assessment Plan...................................................................................................141Interim Measurable Milestones.............................................................................................................. 143
CHAPTER 13 – PLAN IMPLEMENTATION.......................................................................................................................144Technical Assistance Needs..................................................................................................................... 151Implementation Coordination................................................................................................................. 151Expected Load Reductions...................................................................................................................... 152
APPENDIX A: LIST OF ABBREVIATIONS..........................................................................................................................154APPENDIX B: ELEMENTS OF SUCCESSFUL WPPS............................................................................................................157References..........................................................................................................................................................159
List of Figuresii | P a g e
Figure 2.1: Hydrologic map of the Arroyo Colorado showing floodway systems (Arroyo Colorado WPP 2007)..........9Figure 2.2: Arroyo Colorado Classified Segments.......................................................................................................11Figure 2.3: Surface Geology in the Arroyo Colorado Watershed (Arroyo Colorado WPP 2007).................................12Figure 2.4: Hydrologic soil groups in the Arroyo Colorado watershed (Arroyo Colorado WPP 2007)........................12Figure 2.5: Land cover map........................................................................................................................................15Figure 3.1: Physiographic zones of the LRGV (Hathcock et al. 2012).........................................................................17Figure 3.2: Convergence of two major migration flyways (World Birding Center 2016)............................................21Figure 3.3: State and Federal wildlife refuges, management areas, and parks..........................................................22Figure 4.1: Arroyo Colorado Assessment Units..........................................................................................................25Figure 4.2: 24-hour data collected within the DO Zone of Impairment.....................................................................27Figure 4.3: Time series of daily minimum DO and daily average DO at the USGS station on Arroyo Colorado Tidal at
FM 106, Rio Hondo, TX for the period of March 1, 2015 – February 29, 2016........................................28Figure 4.4: DO time series data for Segments 2202 and 2201...................................................................................29Figure 4.5: Nitrate + Nitrite nitrogen concentrations in the Arroyo Colorado...........................................................30Figure 4.6: Ammonia-N concentrations at sites 13073 and 13074.............................................................................31Figure 4.7: Total phosphorus concentrations in the Arroyo Colorado.......................................................................32Figure 4.8: Chlorophyll-a concentrations in the Arroyo Colorado..............................................................................33Figure 4.9: Total suspended solids concentrations in the Arroyo Colorado...............................................................34Figure 4.10: E. coli and enterococcus concentrations in the Arroyo Colorado...........................................................36Figure 5.1: Land use map of Arroyo Colorado showing types of cropland.................................................................39Figure 5.2: Permitted Wastewater Outfalls within the Arroyo Colorado Watershed.................................................41Figure 5.3: Average daily effluent flows (left axis) and corresponding percentages of the combined effluent flow
(right axis) for all 17 WWTFs, September 2010 and August 2011............................................................43Figure 5.4: Average WWTF effluent TN concentrations, September 2010 and August 2011.....................................43Figure 5.5: Average WWTF effluent ammonia-N concentrations, September 2010 and August 2011.......................44Figure 5.6: Average WWTF effluent TKN mass loadings (i.e., the sum of the organic-N and ammonia-N loadings),
September 2010 and August 2011..........................................................................................................45Figure 5.7: Average WWTF effluent total-P concentrations for the 46-week sampling period..................................46Figure 5.8: Soil suitability for OSSFs and OSSF locations in the Arroyo Colorado watershed.....................................47Figure 5.9: Colonias and current classification status................................................................................................49Figure 5.10: Estimated service area boundaries within the Arroyo Colorado watershed for WWTFs........................50Figure 5.11: Estimated OSSFs.....................................................................................................................................51Figure 5.12: Colonias inside and outside of the estimated service area boundaries..................................................52Figure 5.13: OSSFs and colonias within the coastal zone...........................................................................................54Figure 5.14: Increases in impervious surfaces in the Arroyo Colorado watershed.....................................................55Figure 5.15: Map of 2010 Census urbanized areas.....................................................................................................56Figure 5.16: LLM of the Texas gulf coast provides habitats to migratory birds that follow Central Flyway................59Figure 5.18: Aerial view of Llano Grande Lake and adjacent channelization..............................................................63Figure 5.19: Aerial view of Port of Harlingen and Barge Turn Basin...........................................................................64Figure 6.1: Arroyo Colorado sub-basins used by SWAT..............................................................................................66Figure 6.2: Predominant sources of sediment loads in the Arroyo Colorado watershed...........................................67Figure 6.3: Estimated sediment concentrations by sub-basin....................................................................................67Figure 6.4: Predominant sources of nitrogen loads in the Arroyo Colorado watershed............................................68Figure 6.5: Estimated total nitrogen concentrations by sub-basin.............................................................................68Figure 6.6: Predominant sources of phosphorus in the Arroyo Colorado watershed................................................69Figure 6.8: Primary E. coli sources estimated by SWAT..............................................................................................70
iii | P a g e

Figure 6.9: E. coli loads by sub-basin as predicted by SWAT......................................................................................70Figure 6.10: Arroyo Colorado BST monitoring stations..............................................................................................71Figure 6.11: BST results for the Arroyo Colorado watershed (* indicate presence of cosmopolitan species)............72Figure 6.12: Three-way split of E. coli BST results for each station as percent of isolates per sampling station........73Figure 6.13: Three-way split of E. coli source class identifications by month for all stations combined....................74Figure 8.1: Stormwater Management Concepts (Barrett et al. 2014)......................................................................101Figure 8.2: Proposed instream BMP locations.........................................................................................................117Figure 9.1: Schematic of modeling system...............................................................................................................120Figure 9.2: Schematic of modeling system...............................................................................................................123Figure 11.1: Location of water quality monitoring stations on the Arroyo Colorado currently monitored routinely by
the TCEQ and the NRA...........................................................................................................................138
List of TablesTable 2.1: Population Changes of Cities in the Arroyo Colorado Watershed.............................................................14Table 2.2: Population Projections for Cameron, Hidalgo, and Willacy Counties........................................................14Table 2.3: Median Household Income for Cameron, Hidalgo, and Willacy Counties.................................................15Table 2.4: Land cover in the Arroyo Colorado watershed..........................................................................................16Table 3.1: TPWD managed properties/acreage.........................................................................................................23Table 4.1: Designated uses, impairments and concerns for the Arroyo Colorado.....................................................24Table 4.2: Water quality standards for designated uses of the Arroyo Colorado.......................................................25Table 4.3: Arroyo Colorado assessment units (upstream to downstream)................................................................26Table 4.4: Number of days with DO below the 24-hour minimum and average criteria at the USGS station on
Arroyo Colorado Tidal at FM 106, Rio Hondo, TX for March 1, 2015 – February 29, 2016......................28Table 5.1: Summary of potential sources of pollutants occurring within the Arroyo Colorado watershed................38Table 5.2: Active wastewater discharge permits in the Arroyo Colorado..................................................................40Table 5.3: Principal point source contributors of pollutants of concern within Arroyo Colorado watershed............42Table 5.4: RCAP colonia needs prioritization descriptions and color codes...............................................................48Table 5.4: Colonias not within service areas. Note: underlined colonias are within 350 feet of the Arroyo or its
tributaries and italicized colonias contain greater than 50% very limited soils.......................................53Table 5.5: MS4 Permits with areas within the Arroyo Colorado WPP watershed......................................................56Table 5.6: Population of migratory waterfowl in the LLM (Smith 2002)....................................................................60Table 5.7: Arroyo Colorado livestock estimates.........................................................................................................61Table 6.1: E. coli and TP loadings and reductions to meet water quality goals at FM1015 in Weslaco and the Port of
Harlingen.................................................................................................................................................65Table 6.2: Annual sub-basin loadings estimated by SWAT model (loadings >75th percentile are highlighted)...........66Table 8.1: Priority BMPs for Irrigated and Dry Cropland............................................................................................79Table 8.2: Priority BMPs for Irrigated Pasture/Hay Land and Rangeland/Wildlife.....................................................79Table 8.3: Other/Complimentary BMPs.....................................................................................................................80Table 8.4: Goals for new and updated conservation plans for new 10-year implementation period........................80Table 8.5. Summary of municipal permit changes (Source: Arroyo Colorado PRP)....................................................83Table 8.6: OSSF Contacts for WPP OSSF Tracking......................................................................................................93Table 8.7: Separate Storm Sewer Systems within the Arroyo Colorado watershed...................................................96Table 8.8: LID demonstration projects funded by CWA Section 319(h)...................................................................107Table 8.9: Suggested minimum BMPs to report to Arroyo Colorado Partnership Annually.....................................114Table 9.1: Overview of major point source facilities scenario modeled...................................................................122
iv | P a g e

Table 9.2: SWAT output at Subbasin 10 (Site 13074) for select parameters (used by CE-QUAL-W2).......................124Table 9.3: CE-QUAL-W2 Enterococci geometric mean results for modeled scenarios by AU. (Non-attainment shown
in Red font)............................................................................................................................................125Table 9.4: CE-QUAL-W2 24-hr DO results for modeled scenarios showing the % time each criterion is met..........126Table 9.5: CE-QUAL-W2 24-hour Dissolved Oxygen results for different scenarios showing average and median
values of daily average, minimum and range........................................................................................127Table 11.1: Description of sampling locations, parameters analyzed, sampling frequency and agency currently
conducting water quality sampling in the Arroyo Colorado..................................................................139Table 12.1: E. coli* and Enterococci interim targets for evaluating effectiveness based on modeled results AU. (Non-
attainment shown in Red font)..............................................................................................................141Table 12.2: DO interim targets (% time each criterion is met) for evaluating effectiveness based on modeled results.
(Non-attainment shown in Red font).....................................................................................................142Table 13.1. Management measure implementation schedule and responsible parties...........................................144Table 13.2. Education and outreach implementation schedule and responsible party............................................147Table 13.3. Management measure responsible parties and costs...........................................................................148Table 13.4: Estimated annual E. coli and Enterococcus load reductions expected upon implementation of the
Arroyo Colorado WPP............................................................................................................................152Table 13.5: Estimated sediment, TN, and TP load reductions expected upon implementation of the Arroyo Colorado
WPP.......................................................................................................................................................153
v | P a g e

Executive SummaryThe Arroyo Colorado stretches for 90 miles through the heart of the Lower Rio Grande Valley (LRGV). It originates near Mission and empties into the Lower Laguna Madre (LLM), one of only three hyper-saline lagoons in the world. As the primary source of fresh water to the Laguna Madre, the lower 25 miles of the Arroyo Colorado is an important estuary and a nursery for many fish and shrimp species.
Originally, a habitat-rich stream channel of the Rio Grande, the Arroyo Colorado now serves many more purposes:
Aids in control of flooding and drainage; Carries commercial barge traffic from the Port of Harlingen to the Laguna Madre; Receives treated wastewater from municipal plants, stormwater runoff from urban areas
and irrigation return flows; Is a nursery for fish, shrimp, crab and other aquatic species, Provides sanctuary for birds; and Provides recreation for families and tourists including swimming, fishing, hiking, and
bird and butterfly watching.
The Arroyo Colorado watershed encompasses about 420,000 acres and is mostly used for agricultural production including row crops, sugar cane and citrus fruit; however, rapid urbanization and population growth are quickly transforming the area into an urbanized metroplex. The transformation of the river and its watershed from its natural state have contributed to water quality problems that this plan seeks to address.
Problem/Need StatementFor assessment purposes, the Arroyo Colorado has been classified by the Texas Commission on Environmental Quality (TCEQ) into two segments called the tidal (Segment 2201) and the above-tidal (Segment 2202) segments. These segments are included in TCEQ’s water quality assessment of Texas streams that occurs every two years. The tidal segment has been included on Texas’ list of impaired water bodies (Clean Water Act (CWA) Section 303(d) List) since 1978, due to periods of low dissolved oxygen (DO) levels that occur mostly during the months of May through October. Low DO levels are not optimal for the support of fish and other aquatic life. Both the tidal and above-tidal segments are impaired by high levels of bacteria that exceed the state’s contact recreation standard.
In 2002, the TCEQ completed a total maximum daily load (TMDL) study for the tidal segment that indicated low DO levels are related as much to the physical setting and geomorphology of the Arroyo Colorado as it is to the loading of nutrients and oxygen-demanding substances from the watershed. This study spawned the development of a partnership of local, state, and federal stakeholders called the Arroyo Colorado Partnership who were tasked with developing a
1 | P a g e

community-based watershed protection plan (WPP) to improve water quality in the Arroyo Colorado. Pollution causes and sources were investigated and best management practices (BMPs) to address them were selected by local stakeholders. The 10-year plan was published in 2007.
Watershed stakeholders have achieved great success implementing the plan and many milestones have been reached. One of the main accomplishments has been significant upgrades to approximately eight wastewater treatment facilities (WWTFs) and the completion of two new WWTFs discharging to the Arroyo Colorado. Approximately $120 million was spent upgrading these facilities from outdated, non-mechanical, lagoon treatment plants to modern mechanical plants. The eight facilities have also adopted new lower permit limits for biological oxygen demand (BOD), total suspended solids (TSS), and ammonia. This has led to a significant decrease in loading to the Arroyo Colorado from the main sources of continuous flow and a significant decrease in ammonia concentrations has been observed in stream. Additional accomplishments include:
Adoption of BMPs on 130,000 acres of irrigated cropland; Centralized wastewater service provided to 17,054 residents in 42 colonias; Tertiary wetland treatment ponds constructed at three WWTFs to provide enhanced
effluent treatment and wildlife habitat; Construction of a physical watershed model used to educate over 100,000 watershed
residents at 221 education and outreach (E&O) events conducted since 2007; “Entering the Arroyo Colorado Watershed” or “Crossing the Arroyo Colorado” road
signs installed at 36 watershed locations; Approximately 8,000 storm drain markers installed throughout the watershed; 22 Stormwater Management Plans developed by the Cities, Counties and Texas
Department of Transportation (TxDOT) in the watershed; and 9 Low Impact Development/Green Infrastructure demonstration projects completed.
The Partnership has been working to update the WPP. Workgroup meetings, Steering Committee meetings and individual meetings with stakeholders were held to evaluate and make adjustments to existing management measures and determine new measures to address the DO and bacteria impairments. A Soil and Water Assessment Tool (SWAT) model of the watershed was developed to better understand the mechanisms influencing water quality in the Arroyo and to quantify pollutant load reductions that management measures can produce once implemented. Results were then used to select measures expected to yield the most water quality benefit for the least cost. This document is a comprehensive update to the original WPP and was written to contain the Environmental Protection Agency’s (EPA) nine-minimum elements of watershed plans, which can be found in Appendix B.
2 | P a g e

Water Quality GoalsThe long-term goal of the WPP is to achieve state water quality standards in the Arroyo Colorado by lowering pollutant loadings, enhancing streamflow and aeration, and restoring aquatic and riparian habitat through voluntary measures and existing regulatory controls. Specifically, the WPP seeks to ensure the Arroyo Colorado meets an average 24-hour DO concentration of 4.0 mg/L or above and a daily minimum DO concentration of 3.0 mg/L or above at least 90% of the time. For bacteria, the WPP seeks to meet an E. coli geometric mean less than 126 cfu/100 mL for the Above-Tidal segment and an Enterococcus geometric mean less than 35 cfu/100 mL for the Tidal segment.
Management RecommendationsRecommendations are focused on addressing sources of bacteria, nutrients, and other pollutants that adversely affect DO and bacteria concentrations that can be reasonably managed. Measures were selected primarily from a willingness to adopt perspective, but also because of their pollutant removal efficiency.
Agriculture and livestock management will focus on enhancing operations through voluntary adoption of 300 new or updated Resource Management Systems (RMS) and Water Quality Management Plans (WQMPs) by local landowners. On farms, these plans will focus on mitigating nutrient losses from properties and on ranches will work to reduce bacteria runoff.
Human wastewater will continue to be addressed through WWTF permit updates and subsequent system upgrades. The goal is to eliminate all 30 mg/L BOD and 90 mg/L TSS discharge permits in the watershed and transition all facilities to 10 mg/L BOD and 15 mg/L TSS treatment levels by year 2020 and 7 mg/L BOD, 12 mg/L TSS, and 3 mg/L NH3-N treatment levels by 2027. Reducing sanitary sewer overflows (SSO) will also reduce the effects of human derived pollutants. WWTFs will be encouraged to participate in TCEQ’s SSO Initiative and identify areas in collection systems where inflow and infiltration (I/I) issues routinely occur or aging infrastructure is a problem. Subsequent repairs in these areas combined with homeowner education regarding I/I issues and problems caused by Fat, Oil, Grease & Grit (FOGG) and improper sewer cleanout use will reduce the number of incidents where raw sewage spills occur. Voluntary utilization of enhanced wastewater treatment projects will also be encouraged to further reduce pollutant loading to the stream. These projects can include wastewater reuse for landscape irrigation, effluent polishing pond systems, small-scale constructed wetland systems, and tertiary wastewater treatment using denitrification. Extending wastewater service to colonia residents and other areas with high onsite sewage facility (OSSF) densities in the watershed, developing an OSSF inventory database, inspecting and replacing failing OSSFs, and conducting OSSF education programs will all improve water quality.
Habitat preservation and restoration is a primary concern for Arroyo Colorado stakeholders and efforts to accomplish this will also have positive water quality impacts. Management
3 | P a g e

recommendations to improve habitat include supporting existing federal, state, and local efforts to implement terrestrial habitat conservation objectives in the Arroyo Colorado watershed through partnerships and funding, including protection and restoration of existing riparian areas, resacas and freshwater wetlands. Prioritization of filter strips/buffer zones along agricultural fields adjacent to the Arroyo Colorado will also provide additional habitat.
Urban stormwater related pollutant sources will be addressed through implementation of stormwater management plans developed by Municipal Separate Storm Sewer Systems (MS4s). In addition, a combination of stormwater detention and green infrastructure/low impact development (GI/LID) projects for future and existing development will be prioritized. Mitigation of stormwater effects will also be accomplished through designation of parks and green space, promoting urban forestry, and tree census to establish tree inventories. Enhancing drainage policies and land development codes/ordinances to reduce stormwater volume and improve water quality will be encouraged. Education and outreach programs designed to address specific stormwater pollutants will also be delivered including pet waste, proper lawn maintenance, recycling, and illegal dumping education.
In stream practices are also recommended to improve water quality in the Arroyo Colorado. Three aeration structures (i.e. water falls) are proposed for implementation just upstream of the tidal segment and mechanical aerators or diffusers are recommended in the Port of Harlingen Turning Basin in order to improve DO in the impaired zone. Dredging the Llano Grande Lake to its original depth and restoring groundwater flow will improve water quality, provide additional capacity and restore a native deep water habitat to the Arroyo Colorado.
Identifying flood prone areas of the watershed and implementing flood event BMPs that will help alleviate flooding is also proposed. A project on Tio Cano Lake will alleviate flooding in the area and provide stormwater detention and treatment thus reducing nonpoint source (NPS) pollution into the Arroyo Colorado.
Continuing to conduct appropriate education and outreach programs in the watershed is a top priority. Not only will these programs raise awareness regarding water quality in the Arroyo, but they will also allow for implementation efforts to be promoted. These efforts are critical to the successful implementation of the updated WPP. The watershed coordinator will continue to coordinate and provide education and outreach in the watershed an
4 | P a g e

Progress Tracking and Future UpdatesThe watershed coordinator will continue to track progress toward achieving implementation targets and provide annual reports to stakeholders regarding progress. Steering Committee and some Work Group meetings will continue to be held in order to provide forums for discussion regarding progress, BMP planning, and future updates. Planned water quality monitoring is described in Chapter 11 and necessary to determine if implementation efforts are having positive effects on the Arroyo. This information will provide the Partnership with valuable information in order to better characterize the sources of pollution in the watershed and continue to adapt the WPP as implementation lessons are learned.
To support adaptive management, every two years an addendum to the WPP will be developed and approved by stakeholders. The addendum will describe modifications/updates to goals and milestones, explain new understandings of sources and causes of water quality issues, document success in achieving goals and milestones, and success in achieving water quality improvement and load reductions.
5 | P a g e

Chapter 1 – Watershed ManagementDefinition of a WatershedA watershed is the land area that drains to a common waterway such as a stream, lake, estuary, wetland or ultimately, the ocean. All land surfaces on Earth are included in a watershed; some are very small while others encompass large portions of countries or continents. For example, many smaller watersheds, or sub-watersheds, combine to form the Arroyo Colorado watershed, which is actually a part of the LLM watershed.
A Watershed’s Impacts on Water QualityAll activities, both human and natural, that occur within the boundaries of a watershed have the potential to influence water quality in the receiving water body. As a result, an effective management strategy that addresses water quality issues in a watershed’s receiving water body must examine all human activities and natural processes within that watershed.
The Watershed ApproachThe Watershed Approach is “a flexible framework for managing water resource quality and quantity within a specified drainage area or watershed. This approach includes engaging stakeholders to make management decisions supported by sound science and appropriate technology” (USEPA 2008). The Watershed Approach is based on:
a geographic focus based on hydrology rather than political boundaries; water quality objectives based on scientific data; coordinated priorities and integrated solutions; and diverse, well-integrated partnerships.
A watershed’s boundaries often cross municipal, county and state boundaries because they are determined by the landscape. Using the Watershed Approach, all potential sources of pollution entering a waterway can be addressed by all potential watershed stakeholders.
A stakeholder is anyone who lives, works or has an interest within the watershed or may be affected by decisions. Stakeholders can include individuals, groups, organizations or agencies. Stakeholder involvement is critical for effectively employing a holistic approach to watershed management that adequately addresses all watershed concerns.
Watershed Protection Plan Development ProcessWatershed Protection Plans (WPPs) are locally driven mechanisms for voluntarily addressing complex water quality problems that cross multiple jurisdictions. WPPs are coordinated frameworks for implementing prioritized water quality protection and restoration strategies driven by environmental objectives.
6 | P a g e
Through the development process, stakeholders are encouraged to holistically address all of the sources and causes of impairments and threats to both surface water and groundwater resources within a watershed. To help ensure that plans will effectively address water quality issues when implemented, the United States Environmental Protection Agency (USEPA) has established nine key elements that it deems critical for achieving water quality improvements. These elements are listed and defined in Appendix B.
WPPs serve as tools to better leverage resources of local governments, state and federal agencies and non-governmental organizations (NGOs). WPPs integrate activities and prioritize implementation projects based upon technical merit and benefits to the watershed, promote a unified approach to seeking funding for implementation and create a coordinated public communication and education program. Developed and implemented through diverse, well-integrated partnerships, a WPP assures the long-term health of the watershed with solutions that are socially acceptable, economically viable and achieve environmental goals for water resources.
Private Property RightsThis WPP establishes a coordinated plan to voluntarily implement management strategies to restore and protect water quality through partnerships and cooperative efforts. Although this plan is completely voluntary, stakeholders realize that the goals of this plan will not be achieved unless action is taken. As a result, this plan includes implementation activities that can improve water quality without infringing upon the rights of watershed landowners.
Adaptive ManagementAdaptive management is a defined natural resource management approach that promotes decision making supported by an ongoing, science-based process. This approach incorporates results of continual testing, monitoring, evaluation of applied strategies and incorporation of new information into revised management approaches that are modified based on science and societal needs (USEPA 2000). Essentially, adaptive management allows stakeholders to maintain a flexible approach in their decision-making process to account for inherent uncertainty and to make adjustments that improve the performance of designated management measures over time (Williams et al. 2009). Using this process, members of the Arroyo Colorado Watershed Partnership will implement strategies known to address manageable pollutant loadings within the watershed.
7 | P a g e

Chapter 2 – The Arroyo Colorado WatershedThe Arroyo Colorado stretches for 90 miles through the heart of the LRGV. For much of its course, the Arroyo Colorado is a floodway and conduit used for wastewater conveyance. It originates near Mission, Texas, and empties into the LLM, one of the most productive hypersaline lagoon systems in the world (TPWD 2006a). As the primary source of fresh water to the LLM, the lower 25 miles of the Arroyo Colorado is an important estuary and nursery for many fish, crab, and shrimp species that require less saline waters in their developmental stages. The Arroyo Colorado is the primary source of fresh water to the LLM but sometimes provides too much freshwater to the system. The lower third of the river also serves as an inland waterway for commercial barge traffic and a recreational area for boating and fishing.
Perennial (year-round) flow in the Arroyo Colorado is primarily sustained by flows from municipal wastewater treatment facilities. Irrigation return flows and urban runoff supplement the flow on a seasonal basis. Shallow groundwater is also known to contribute base-flow to the stream, primarily in Cameron County.
Brief HistoryIn its most pristine condition before the arrival of European settlers, the Arroyo Colorado was undoubtedly a coastal stream of extraordinary grace and beauty. Its pools of mirror-still water bore the reflection of a diverse and unique semi-tropical, coastal environment which exists today in only a very few and special places. Gliding across the delta plain of the once mighty Rio Grande River, the quiet waters of the Arroyo Colorado would have crept almost unnoticed through a haunting maze of moss draped hardwoods that crowded its banks, tethered by woody vines and shading a thick, thorny understory of acacias, low palms, scrub brush and cactus. In its slow journey to the coast, the Arroyo Colorado flowed into large expanses of brackish marshland where shorter but equally dense vegetation concealed a complex coastal ecosystem no less exotic than the rich wildlife community that thrived in the headwaters of the upper delta region. Sadly, this image of the Arroyo Colorado vanished long ago, along with those who were fortunate enough to behold it.
Shortly after the beginning of the 20th century, large-scale production agriculture began in the Rio Grande Valley and Arroyo Colorado watershed. Clearing native plant cover was the first step necessary to access the rich organic soils of the delta plain. Clearing was accomplished on a massive scale in the 1920s and 1930s.
The region’s semi-arid climate led to the second necessary step in agricultural development – construction of an irrigation system capable of extracting, conveying and distributing huge quantities of water over large areas of farm land. Canal building began in the 1900s, the modern irrigation system in the Rio Grande Valley was not completed until the early 1930s.
8 | P a g e

The flat topography and flood-prone nature of the Rio Grande Delta led to the third necessary step in the development of the LRGV – the construction of a flood-control system capable of mitigating the effects of catastrophic flooding. Major floods are relatively frequent events in this and all natural deltaic systems.
In 1947 the United States Section of the International Boundary and Water Commission (IBWC) completed the LRGV Flood Control Project. It spanned the entire length of the LRGV from the city of Mission (in the west) to the city of Harlingen (in the east) and the city of Brownsville (in the southeast) (Figure 2.1). The Main and North floodways drain a total of 2,344 square miles (TWC 1990) and approximately 80% of the Arroyo Colorado’s flow is diverted to the North Floodway during flood conditions, which the IBWC defines as flow exceeding 1,400 cubic feet per second (IBWC 2003).
Figure 2.1: Hydrologic map of the Arroyo Colorado showing floodway systems (Arroyo Colorado WPP 2007)
Channel Classification and CharacteristicsThe Arroyo Colorado is described by the TCEQ as having a freshwater segment and a tidally influenced (i.e., marine) segment. The TCEQ classified the two portions of the Arroyo Colorado separately because of the distinct physical characteristics of each segment of the stream.
The tidally influenced segment is approximately 26 miles long and is referred to as Segment 2201 or Arroyo Colorado Tidal (Figure 2.2). It extends from the confluence with the Laguna Madre in Cameron/Willacy County to a point 100 meters south of the Port of Harlingen in Cameron County and includes the Port of Harlingen turning basin. Designated uses in Segment 2201 include contact recreation, high aquatic life and fish consumption.
9 | P a g e

The freshwater portion of the Arroyo Colorado is approximately 63 miles long and is referred to as Segment 2202 or the Arroyo Colorado Above Tidal. It extends from the tidal segment boundary, south of the Port of Harlingen, to its headwaters located southwest of the city of Mission. Designated uses in Segment 2202 include contact recreation, intermediate aquatic life use, and fish consumption.
The Arroyo Colorado Above Tidal is an extensively modified natural channel designed to carry floodwater from the Rio Grande and the LRGV to the Laguna Madre. It is characterized by a steep-walled channel entrenched within a wide floodplain bounded by flood control levees. It averages less than 40 feet wide and is approximately two to three feet deep. The channel bottom is mainly composed of loosely consolidated silty-clay sediments and the sparsely vegetated banks are in a continual state of sloughing.
The Arroyo Colorado Tidal is dredged to accommodate barge traffic to the Port of Harlingen and is characterized by steep eroding slopes with bank heights up to 50 feet. The steep banks are partly the result of placing dredge spoil material on the stream banks. In the upper portions of the Tidal segment, steep banks are thought to occasionally impede the air flow across the surface of the stream. This can reduce aeration and vertical mixing which, contribute to low levels of dissolved oxygen (DO) observed in this stream segment. The average width and depth of the Tidal segment are about 200 feet and the average depth is 13 feet respectively. Water quality is brackish to saline and usually stratifies under warm weather conditions, forming layers of warmer, fresher water on the surface and cooler, more saline water near the bottom. For most of its course, the Above-Tidal segment of the Arroyo Colorado has a significant degree of natural sinuosity. This is diminished in the final four miles of the Tidal segment of the Arroyo Colorado as it flows into a man-made channel that leads to the Intracoastal Waterway and the LLM.
10 | P a g e
Figure 2.2: Arroyo Colorado Classified Segments
TopographyGenerally, the watershed slopes from west to east through the heart of the LRGV with an average slope of less than 1.5 feet per mile. The highest elevation in the Arroyo Colorado watershed is about 120 feet above mean sea level. Common natural landscape features in the LRGV include depressions, resacas (oxbow lakes), salt lagoons, coastal marshes, tidal flats, point-bars and barrier islands. Man-made landscape features include levees, drainage ditches and raised irrigation canals.
Geology and SoilsThe upper two-thirds of the Arroyo Colorado are underlain by alluvium consisting mostly of muds and silts deposited by the Rio Grande; the lower third is underlain by barrier island deposits of mostly sand with some silt and clay. Almost all of the deposits underlying the Arroyo Colorado watershed are of Holocene origin except for a short distance in the lower one-third of its course where the Beaumont Formation (Figure 2.3), of Pleistocene origin, abuts the northern and western banks of the Arroyo Colorado (Brown et. al., 1980).
Geologic age of the sediments in the region increases from east to west. Pleistocene sediments, (Beaumont Formation), were deposited after the last interglacial period about 70,000 years ago. This formation is mostly composed of clay with some fine sand and silt. Holocene sediments (approximately 10,000 years old) consist of sands and silts and are both open marine and meandering fluvial.
11 | P a g e

Figure 2.3: Surface Geology in the Arroyo Colorado Watershed (Arroyo Colorado WPP 2007)
The LRGV is characterized by its unconsolidated soil substrate. The soils in the Arroyo Colorado watershed are clays, clay loams and sandy loams. Most soil depths range from about 63-78 inches. The Harlingen, Mercedes and Raymondville soil series consist predominantly of clay soils with low permeability. A representative soil profile consists of about 71-78 inches of clay. The Hidalgo, Rio Grande and Willacy soil series consist predominantly of sandy loam and sandy clay loam soils with moderate permeability. A representative soil profile consists of about 14-15 inches of sandy loam overlying 48-60 inches of sandy clay loam. Hydrologic soil group B and D dominate the watershed (Figure 2.4).
Figure 2.4: Hydrologic soil groups in the Arroyo Colorado watershed (Arroyo Colorado WPP 2007)
12 | P a g e

The Arroyo Colorado flows over the fluvio-deltaic plain of the Rio Grande. Fluvio-deltaic plains are large geographic features that form in coastal areas near the outlets of large rivers. Fluvio-deltaic sediments are typically composed of interwoven lenses of sands, silts and clays deposited by rivers as they reach the coast and distribute their load of fine, organic-rich sediment over a triangular coastal region known as the delta plain. The entire delta plain of the Rio Grande slowly subsides or sinks, as does the entire Gulf Coast. However, subsidence rates in the LRGV (~6 mm/yr) are some of the lowest in the Gulf Coast.
The Arroyo Colorado is thought to have been an ancient channel of the Rio Grande that became isolated from the main river during one of many flood events that caused the river to change its course. Prior to dam construction on the Rio Grande, it overflowed its banks annually, depositing new sediments and moving fresh water into a variety of abandoned river segments and meander channels that became cut off from the main flow of the river. These abandoned channels are known as resacas. The Arroyo Colorado is considered a special type of resaca that once flowed naturally into the Laguna Madre. Resacas are found scattered throughout the LRGV, where they form isolated freshwater reservoirs and wetlands.
Groundwater in the LRGV is typically shallow (1-30 feet from the surface) and varies in quality from fresh to very brackish (TDS <1000 mg/L to TDS >10,000 mg/L) with local occurrences of high nitrate, sodium, chloride and boron. The shallowest groundwater is found throughout the watershed in surface sand deposits that alternate with layers of clays and silts in the shallow subsurface. In the upper portion of the Arroyo Colorado watershed, the Gulf Coast Aquifer is sometimes used as a consistent source of groundwater. The aquifer typically produces fresh to brackish groundwater from the Chicot (0-1000 feet) and Evangeline (0-2500 feet) formations. Groundwater quality in the Gulf Coast Aquifer generally declines toward the coast and is generally too brackish for human use in Cameron and Willacy counties (TWDB 2003a).
Climate and RainfallThe climate of the LRGV is hot, windy, dry and subject to frequent droughts and occasional floods. Dramatic wet and dry cycles commonly yield rainfall totals that are considerably above or below normal. Tropical weather systems also occur and produce extreme rainfall totals. Since 1954, 8 hurricanes have made landfall in south Texas. Winters are mild and temperate but are subject to arctic cold fronts, which can produce freezing temperatures for up to 24 hours every 10-15 years. The climate of the LRGV is characterized by diverging temperate and tropical climates, and is semi-arid and subtropical. Average annual precipitation in the area is about 26 inches and the mean annual temperature is 72oF.
DemographicsThe LRGV is one of the fastest growing regions in the nation (Tables 2.1-2.2). There are 11 cities with populations greater than 10,000 within the watershed. McAllen, located in southern
13 | P a g e

Hidalgo County, is the largest city with an estimated population of 138,082 as of January 1, 2015 according to the Texas Demographic Center. From 2000 to 2015, the population of the major cities in the watershed increased by about 38%. By 2050, the population of Hidalgo County is expected to increase by 130% and the population of Cameron County is estimated to increase by more than 50%.
Table 2.1: Population Changes of Cities in the Arroyo Colorado Watershed
City
2000 Census Population
2010 Census Population
2015 Estimated Population*
Percent Increase (2000-2012)
McAllen 106,414 129,877 138,082 30%Harlingen 57,564 64,849 66,037 15%Pharr 46,660 70,400 76,476 64%Mission 45,408 77,058 83,394 84%Weslaco 26,935 35,670 37,797 40%San Juan 26,229 33,856 36,634 40%San Benito 23,444 24,250 24,670 5%Donna 14,768 15,798 17,429 18%Alamo 14,760 18,353 19,149 30%Mercedes 13,649 15,570 16,798 23%Hidalgo 7,322 11,198 12,610 72%La Feria 6,115 7,302 7,773 27%Progreso 4,851 5,507 5,999 24%Palmview 4,107 5,460 6,667 62%Rio Hondo 1,942 2,356 2,432 25%Total 400,168 517,504 551,947 38%
*Source: Texas Demographic Center estimates as of January 1, 2015
Table 2.2: Population Projections for Cameron, Hidalgo, and Willacy Counties County 2010 2020 2030 2040 2050Cameron 406,220 493,571 584,883 668,322 741,902Hidalgo 774,769 1,005,539 1,271,656 1,531,900 1,779,370Willacy 22,134 26,817 31,526 35,787 39,693
*Source: Texas Demographic Center 2014 Population Projections
Despite prolific trade and high industrial production occurring across the LRGV border area, the Arroyo Colorado watershed is in an economically distressed area (Table 2.3). Many communities within or adjacent to the watershed are lacking or have inadequate water and wastewater infrastructure; however, the number of these areas are decreasing due to recent extensions of service. These communities are typically unincorporated developments with low income housing
14 | P a g e

known as “colonias” and are frequently found near many population centers along the Texas-Mexico border. Evidence suggests that the lack of sanitary sewage, stormwater drainage and solid waste disposal facilities in colonias significantly contributes to water quality problems in the Arroyo Colorado.
Table 2.3: Median Household Income for Cameron, Hidalgo, and Willacy Counties County Median Household Income
(2009 – 2013)*Cameron $33,179Hidalgo $34,146Willacy $25,886Texas $51,900
*Source: U.S. Census Bureau, American Community Survey, 5-Year Estimates
Land CoverThe watershed is characteristic of the Western Gulf Coast Plain – Lower Rio Grande Valley ecoregion. It once supported low woodlands dense, diverse grassland and shrub communities. Now, the watershed is mostly cropland, pasture, and urban land. Over 50% of the watershed is cultivated and 20% is urbanized (Figure 2.5). Pastureland, rangeland, and wetlands comprise the remainder of the watershed (Table 2.4). Urban growth in the watershed will primarily occur in areas that are currently cultivated and will likely influence the region’s water quality.
Figure 2.5: Land cover map
Table 2.4: Land cover in the Arroyo Colorado watershed.
15 | P a g e

Land Cover Acres % of TotalOpen Water 8,717 2%Developed, Open Space 24,896 6%Developed, Low Intensity 31,231 7%Developed, Medium Intensity 20,382 5%Developed High Intensity 5,846 1%Barren Land 4,267 1%Deciduous Forest 2,753 1%Evergreen Forest 217 <1%Mixed Forest 422 <1%Shrub/Scrub 33,057 8%Grassland/Herbaceous 15,810 4%Pasture/Hay 24,805 6%Cultivated Crops 219,051 52%Woody Wetlands 9,656 2%Herbaceous Wetlands 17,185 4%Total 418,294
*Source: 2011 National Land Cover Database
16 | P a g e

Chapter 3 – Habitat, Wildlife and EcotourismThe people that settled the LRGV began calling it the “Magic Valley” in reference to the seemingly magical fertility and biodiversity of the region. The LRGV is a floodplain, where temperate semi-desert, brush and grassy plains meet and mingle with sub-tropical vegetation and riparian forest, river and resacas, lagoons, and ocean. These vegetative communities are known as Tamaulipan brushland. Biologically, the LRGV is one of the richest, most diverse areas in U.S. supporting at least 776 plant species. Plant communities occur as a continuum across the landscape changing, from one into another depending primarily on topography, soils, hydrology or physiographic zones. There are six major physiographic zones in the LRGV, which influence the types of vegetative communities (Figure 3.1).
Figure 3.1: Physiographic zones of the LRGV (Hathcock et al. 2012)
Much of the watershed lies within the Rio Grande Delta physiographic zone, which naturally contains mostly woodlands and shrublands that include mesquite and granjeno association mixed with Texas ebony, anacua and brazil. Sugar hackberry and Rio Grande Ash are common within riparian areas of the watershed. Tamaulipan brushland once formed an extensive thicket that covered most of the Rio Grande delta but now is highly fragmented and covers less than 5%, mostly along highways, canals, ditch banks, and fence rows (USFWS 1988). Extensive vegetation in this habitat once captured stormwater and slowed runoff allowing it to evaporate or infiltrate into the ground. Its loss has increased stormwater and sediment loss.
17 | P a g e

The Arroyo Colorado is one of the most important and prominent landscape features in the LRGV. Many of the vegetative communities found in the LRGV are only found along the banks of the Arroyo Colorado. The Arroyo Colorado is just as vital to the flora and fauna found in this region as the Rio Grande River that created it. The Arroyo Colorado and the Rio Grande shaped and formed the LRGV and are the main reason that this region is so biologically diverse. Wetlands, resacas, pothole depressions and the various water features in the LRGV were created by the ancestral Rio Grande and are key habitats and invaluable sources of water to wildlife that rely on the region. Water is the biggest factor in making the LRGV the “Magic Valley”.
The Arroyo Colorado is an abandoned river channel of the Rio Grande and the largest resaca in Texas. Once cut off from the Rio Grande, freshwater inflow only occurred when the Rio Grande flooded. The Arroyo Colorado is also a Yazoo River, a tributary that parallels the main channel of a stream for a considerable distance, making it particularly unique to this portion of Texas.
Wetlands are common in the LRGV. Saltwater wetlands occur along the coast while freshwater wetlands and resacas are scattered throughout the coastal plain. Wetlands were once prolific due to ample freshwater from frequent flooding across the LRGV. Flood control projects have mostly eliminated this water source making rainfall the primary source of inflow to wetlands and resacas (Jahrsdoerfer and Leslie 1988). Despite this, resacas and other depressional freshwater wetlands remain good habitat for waterfowl, shorebirds, wading birds, and several species of mammals, fish and invertebrates, including the state listed threatened black-spotted newt and lesser Rio Grande siren (TPWD 1997). Riparian areas bordering natural resacas often retain forest and woodland vegetation communities once prevalent throughout the deltaic plain of the Rio Grande. In urban areas, many resacas have been modified to serve as water supply storage systems, stormwater retention areas, or amenities within commercial and residential developments. Shorelines are often bulkheaded and water levels are artificially maintained. In addition, resaca riparian zones in urban areas have been cleared to build homes and other developments and the natural plant communities have been replaced with nonnative landscapes.
Historically, the Arroyo Colorado above tidal’s banks were dominated by sub-tropical mesic woodland plant communities. Remnants of this habitat are now found along some portions of the Rio Grande and its former channels. These communities have a relatively high canopy dominated by Texas ebony and anacua, a dense shrub layer dominated by brasil (Condalia hookeri) and a sparse ground layer dominated by plant litter. Dense brush and wetlands provide feeding, nesting and cover for many wildlife species. The Rio Grande, Arroyo Colorado, resacas and their associated riparian forests provide corridors that connect remnant tracts of undisturbed terrestrial habitats and supports an abundance of neotropical migratory songbirds, mammals, snakes, lizards and salamanders. It is also home to rare and unique plant and animal species, many of which reach the northernmost limits of their distribution in the LRGV (USFWS 1997). Several state and federally listed threatened and endangered species are found in the region including the ocelot (Leopardus pardalis) and the jaguarundi (Herpailurus yagouaroundi).
18 | P a g e

Adjacent to the Arroyo Colorado tidal, mangrove swamps, flats and marshes provide feeding and nursery habitat for important marine fish species and feeding areas for many avian species. Productivity of these coastal environments is highly dependent on water quality. A delicate balance of physical and chemical factors typically occurs in areas where rivers meet marine environments and drives water quality in these areas. Anthropogenic changes can dramatically effect productivity of these coastal systems. For example, excessive algal growth resulting from high nutrient levels can reduce light penetration in shallow areas of the bay, threatening the growth of sea grasses and reducing the important shallow bottom habitat they provide for juvenile marine species.
High and steep cut-banks occur regularly along the Arroyo Colorado. Erosion is a natural process along riverine systems that contributes to changes in natural river courses, but it also contributes to pollutant loading in those systems. Erosion can be exacerbated by watershed land uses including conversion of open space to impervious cover, crop production, roads/trails and livestock grazing. When riparian areas are disturbed, their ability to intercept and slow runoff from adjacent uplands is reduced. This leads to gully formation, reduced stream bank integrity, and further degradation of riparian habitat.
Habitat alterations, including modification of hydrology, dredging, stream bank destabilization and the loss or degradation of wetlands also contribute to impaired water quality in streams and rivers (USEPA 2005). The combined impacts of physical modifications, placement of dredge materials and loss of riparian habitat are thought to be exacerbating low dissolved oxygen (DO) concentrations in the Arroyo Colorado Tidal (TCEQ 2003). Straightening, widening and deepening to facilitate barge traffic has reduced velocity of the stream flow, circulation re-aeration rates in the stream. Sand bars and woody debris removal also decreases turbulence that would facilitate re-aeration of the water column (APAI 2006).
Invasive plant species occur in terrestrial and aquatic habitats associated with the Arroyo Colorado and the LRGV and they have a negative impact on native plant and wildlife populations. In riparian areas common reed (Phragmites australis) and giant reed (Arundo donax), spread quickly and form expansive monospecific stands that decrease plant diversity and reduce valuable wildlife habitat. Exotic plants exclude native plant species from growing near or beneath them either directly, through allelopathic processes (suppression of growth through the release of toxins) as is the case with tamarisk (Tamarix sp.) and buffelgrass (Pennisetum ciliare), or indirectly, through competition for water and/or light, as with Brazilian pepper (Schinus terebinthifolius). Other invasive species, such as guinea grass (Megathyrsus maximum), reduce the vigor and density of desirable native species around them through resource competition. Invasive plant species generally provide lower quality habitat (including food, cover, and nesting sites) for native wildlife species than do non-aggressive native plant species.
19 | P a g e

Arroyo Colorado Connection to BayThe Arroyo Colorado is the primary source of fresh water to the LLM. The Arroyo Colorado Tidal is an estuary that serves as a nursery for juvenile fish, shrimp, crabs and other marine wildlife. In contrast to other Texas estuaries, the LLM is a hyper-saline lagoon, ecosystem that did not develop with a substantial reliance on freshwater inflow to maintain a sound environment. The Lower Rio Grande Basin and Bay Area Expert Science Team (BBEST) determined that freshwater flows can negatively impact the LLM. Under wet conditions, high freshwater pulses create low salinities that stress seagrass communities. Under dry conditions, freshwater inflow is dominated by municipal and agricultural return flow that exceeds “natural” flow volume. Additionally, these inflows contain a high nutrient loading that creates phytoplankton blooms, excessive growths of seagrass epiphytes and drifting macroalgae, which can reduce light availability to sea grass (Lower Rio Grande BBEST 2012). The BBEST study concluded that the overall health of the LLM would improve and be a sound environment with substantially less freshwater inflow and nutrient loading than it currently receives. The recommendations offered by the BBEST are intended to provide necessary information and guidance so that stakeholders and the regulatory community can use them to explore strategies to reduce wastewater flows and nutrient loading to the LLM.
EcotourismEcotourism is a major economic driver in the LRGV and generated $360 million in 2014 alone and is expected to grow in the future. It started with birding and has expanded to other nature related activities such as butterflying, dragonfly watching, nature photography, and general nature and wildlife experiences. There are many state, local, and federally owned parks and land in the area that are visited annually by tourists. In addition, there are seven major nature festivals held in the valley every year, including the Rio Grande Valley Birding Festival.
The Eastern and Central North American Bird migration routes converge in the LRGV as they round the Gulf of Mexico (Figure 3.2). To date, 503 of the 624 Texas and 930 U.S. bird species identified can be found in the LRGV. The LRGV is home to 300 of the 500 U.S. butterfly species (Hackland 2004). These factors combine to make the LRGV the most popular destination for bird and butterfly watching in North America. The Rio Grande Birding Festival held in Harlingen every November, is the largest Birding Festival in the U.S. The LRGV is also home to the World Birding Center (WBC). It is a network of nine sites dotted along 120 miles of river from South Padre Island west to Roma. It was created in partnership with the Texas Parks and Wildlife Department (TPWD), the United States Fish and Wildlife Service (USFWS), and nine LRGV communities. The mission of the WBC is to protect native habitat while increasing the understanding and appreciation of the birds and wildlife.
20 | P a g e
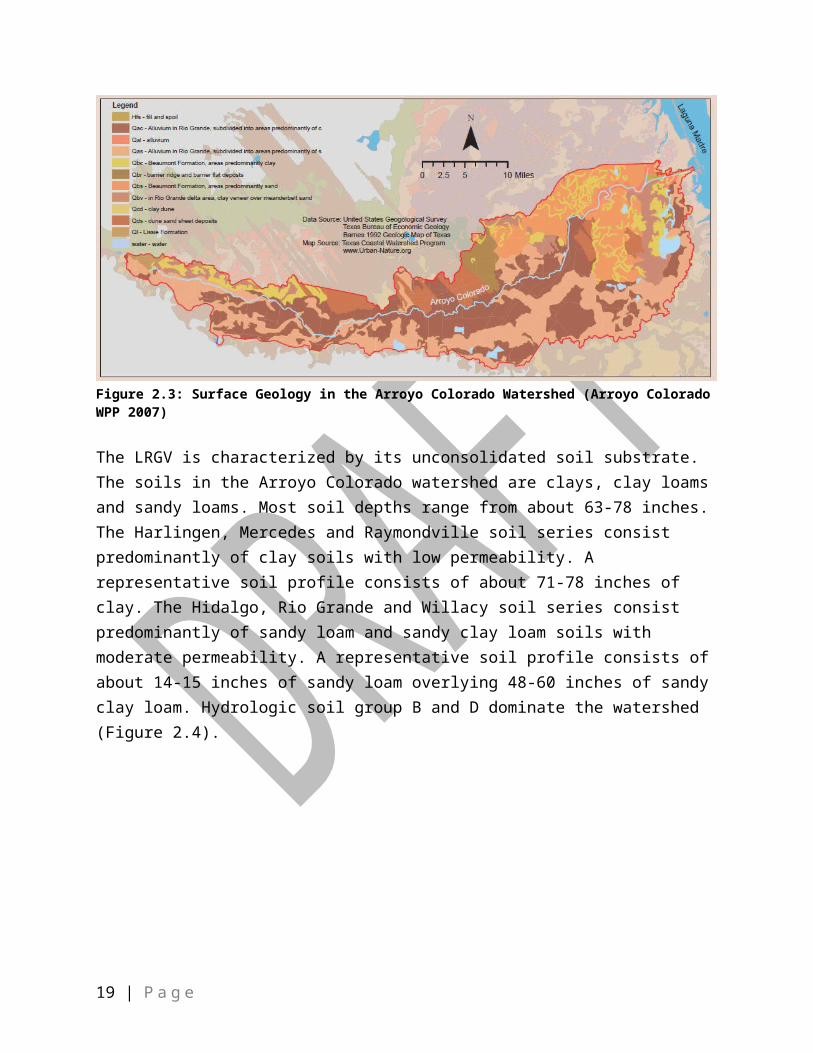
Figure 3.2: Convergence of two major migration flyways (World Birding Center 2016)
USFWS Refuges and TPWD Managed LandsMaintaining native habitat in the LRGV is very important since less than 5% of native habitat is still intact. The USFWS and TPWD work to protect, maintain and manage these remaining tracks of land and provide outdoor recreational opportunities to the public. Representatives from USFWS and TPWD serve on the Arroyo Colorado Steering Committee and technical advisory committee for the Arroyo Colorado Habitat Workgroup. As the Partnership continues implementing the habitat component of the updated WPP, it is vital that the Partnership collaborates with these agencies to protect and preserve remaining native vegetation in the LRGV.
National Wildlife RefugesThe USFWS National Wildlife Refuge System is a national network of lands and waters set aside for the benefit of wildlife and people. The USFWS works with willing landowners to purchase tracts of land or conservation easements within the approved acquisition boundaries of the refuge. The LRGV is home to three USFWS National Wildlife Refuges (Figure 3.3): the Lower Rio Grande Valley, the Laguna Atascosa, and the Santa Ana National Wildlife Refuges.
The LRGV Refuge was established in 1979 to connect and protect remaining tracts of habitat and to protect biodiversity in the region. The refuge follows the Rio Grande along its last 275 river miles, connecting isolated tracts of land managed by private landowners, nonprofit
21 | P a g e

organizations, the State of Texas, and two other National Wildlife Refuges. The refuge’s approved acquisition boundary includes all of Hidalgo, Cameron, and Willacy counties.The Laguna Atascosa refuge was established in 1946 to provide habitat for wintering waterfowl and other migratory birds, principally redhead ducks. Since establishment, focus has expanded to include endangered species conservation and management for shorebirds. The refuge is a premiere bird-watching destination and includes more recorded bird species than any other refuge in the National Wildlife Refuge System. The refuge is also home to the largest population of ocelots in the U.S. The refuge’s approved acquisition boundary includes a large area along the coast and a strip of land along both sides of a portion of the Arroyo Colorado Tidal. The Santa Ana refuge was established in 1943 for protection of migratory birds. This small 2,088 acre refuge along the Rio Grande River offers visitors opportunities to see birds, butterflies, and other species found nowhere else in the U.S. outside deep South Texas.
Figure 3.3: State and Federal wildlife refuges, management areas, and parks.
TPWD Managed LandTexas Wildlife Management Areas (WMAs) offer a unique opportunity for the public to learn and experience the natural ecosystems of Texas. WMAs are established to represent habitats and wildlife populations typical of each ecological region of Texas. The Wildlife Division of TPWD manages 18 WMAs in the LRGV totaling 3,828 acres (Table 3.1).
Table 3.1: TPWD managed properties/acreage.
22 | P a g e

TPWD Managed Properties No. of acres City/LocationEstero Llano Grande State Park 270 Mercedes, TXLas Palomas WMA - Anacua Unit 243 Hidalgo County Las Palomas WMA – Arroyo Colorado Unit 800 Hidalgo CountyLas Palomas WMA – Baird Unit 123 Hidalgo County Las Palomas WMA – Carricitos Unit 118 Cameron CountyLas Palomas WMA – Champion Unit 2 Hidalgo CountyLas Palomas WMA – Chapote Unit 220 Hidalgo CountyLas Palomas WMA – Ebony Unit 276 Cameron CountyLas Palomas WMA – Frederick Unit 35 Willacy CountyLas Palomas WMA – Kelly Unit 46 HidalgoLas Palomas WMA – La Grulla Unit 136 Starr Las Palomas WMA – Longoria Unit 374 CameronLas Palomas WMA – McManus Unit 56 HidalgoLas Palomas WMA – Penitas Unit 120 Hidalgo Las Palomas WMA – Prieta Unit 164 StarrLas Palomas WMA – Taormina Unit 601 StarrLas Palomas WMA – Tucker/Deshazo Unit 176 CameronLas Palomas WMA – Voshell Unit 68 Cameron
23 | P a g e

Chapter 4 – Water Quality AssessmentWater quality in the Arroyo Colorado has been monitored and assessed by TCEQ since 1974 to satisfy requirements of Sections 305(b) and 303(d) of the Clean Water Act (CWA). Section 305(b) requires states to survey the health of surface water bodies every two years and submit a report summarizing results to the USEPA. Title 30, Chapter 307 of the Texas Administrative Code (30 TAC Chapter 307) describes the Texas Surface Water Quality Standards. These regulations specify designated uses (Table 4.1) of surface water bodies and establish water quality criteria to protect these uses (Table 4.2). When a water body fails to meet criteria associated with specific designated uses, it is placed on the state’s 303(d) list of impaired water bodies (Table 4.1).
Table 4.1: Designated uses, impairments and concerns for the Arroyo Colorado.Water body Designated Uses* Impairments and
Concerns**Corrective Action
Arroyo Colorado Above Tidal, Segment 2202
Contact Recreation
Bacteria Arroyo Colorado WPP
Fish Consumption
DDE, mercury, PCBs in edible tissue
DDE – TMDLOther Impairments - none
Intermediate Aquatic Life Use
Total phosphorus, nitrate, chlorophyll-a
Arroyo Colorado WPP
Arroyo Colorado Tidal, Segment 2201
Contact Recreation
Bacteria Arroyo Colorado WPP
Fish Consumption
DDE, mercury, PCBs in edible tissue
None
High Aquatic Life Use
DO, chlorophyll-a, nitrate
Arroyo Colorado WPP
*As described in Texas Surface Water Quality Standards (TAC 307.1-307.10)**Concerns are shown in italics
The 2014 Texas CWA Section 305(b) Water Quality Inventory Report and 303(d) List reaffirmed the long-standing water quality impairment in the upper 7.1 miles of the Tidal segment (2201) of the Arroyo Colorado, where DO concentrations are sometimes lower than criteria established to assure optimum conditions for aquatic life. This portion of the Arroyo Colorado is known as the “Zone of Impairment” and was the focus of the original WPP. In addition, the Tidal segment was first listed as impaired for bacteria in the 2006 303(d) List and remains impaired today. In the freshwater segment of the Arroyo Colorado (Segment 2202), E. coli concentrations have exceeded water quality standards established for contact recreation since 1998. This WPP addresses the DO and bacteria impairments and nutrient and chlorophyll concerns. A prior TMDL addressed the DDE impairment in the Above Tidal segment.
24 | P a g e

Table 4.2: Water quality standards for designated uses of the Arroyo Colorado.Segment
#Segment Name Cl
(mg/L)SO4
(mg/L)TDS
(mg/L)DO
(mg/L)pH
(SU)Bacteria Temp
(oF)2201 Arroyo Colorado tidal 4.0/3.0 6.5-9.0 351 952202 Arroyo Colorado abv tidal 1,200 1,000 4,000 4.0/3.0 6.5-9.0 1262 95
1 The indicator bacteria for saltwater is Enterococci (#/100 mL). 2 The indicator bacteria for freshwater is E. coli (#/100 mL).
For assessment purposes, water body segments are subdivided by TCEQ into smaller assessment units (AU). The Arroyo Colorado Above Tidal (segment 2202) and Tidal (segment 2201) are divided into four and five AUs, respectively (Figure 4.1). Water body assessments are completed at the AU level thus a water body segment can have multiple impairments for the same use. Table 4.3 provides written descriptions of each AU and defines their extent in the watershed and the current impairments according to the 2014 303 (d) List (TCEQ 2014). In this WPP, all available data from the monitoring stations used by TCEQ in the 2014 303 (d) List for the parameters of concern collected since December 1, 2005 (start date of the 2014 303 (d) List) within each segment were evaluated to gauge compliance with water quality standards. This approach differs from the biennial assessment conducted by TCEQ where each AU is assessed using a seven-year moving window of time; however, it presents useful information regarding the general water quality in each segment and captures more recent data collected. For more detailed assessments of DO concentrations in each AU and for determining if water quality in the Arroyo Colorado is improving over time, the TCEQ’s biennial 303 (d) List will continue to be relied upon.
Figure 4.1: Arroyo Colorado Assessment Units.
25 | P a g e

Table 4.3: Arroyo Colorado assessment units (upstream to downstream).AU Length
(mi)Description Impairment* *Assessment
Monitoring Stations Used
2202_04
18 From confluence with La Cruz Resaca to upper end of segment at FM 2062
Bacteria 13083130841308617644
2202_03
25 From confluence with La Feria Main Canal just upstream of Dukes Highway to confluence with La Cruz Resaca just downstream of FM907
Bacteria 130811308216137
2202_02
15 From confluence with Little Creek to confluence with La Feria Main Canal just upstream of Dukes Highway
Bacteria 13079130801614116445
2202_01
6 From downstream end of segment to confluence with Little Creek just upstream of State Loop 499
Bacteria 13074
2201_05
4 From just upstream of Hondo wastewater discharge at point N-97.58359, W26.247186 to upstream end of segment
Bacteria, DO
13072161421765020200
2201_04
2 From confluence with Harding Ranch Ditch tributary to just upstream of the city of Hondo Wastewater Discharge at point N-97.58359, W26.247186
Bacteria, DO
13073
2201_03
6 From confluence with an unnamed drainage ditch with NHD RC 12110108005353 at point N-97.53, W 26.31 to confluence with Harding Ranch Ditch tributary
Bacteria 13559
2201_02
4 From confluence with San Vincente Drainage Ditch to confluence with an unnamed drainage ditch with NHD RC 12110108005353 at point N-97.53, W 26.31
Bacteria 13071
2201_01
9 From downstream end of segment to confluence with San Vincente Drainage Ditch
Bacteria 1378215551
*Texas 2014 Integrated Report (TCEQ 2014)
26 | P a g e

Dissolved Oxygen and Associated ParametersDO concentrations are largely dependent on water temperature and salinity. The amount of air entering the water column through diffusion, physical turbulence, and photosynthesis are also key factors in determining DO concentrations, as is the presence of oxygen-demanding substances and living organisms in the water. DO concentrations typically fluctuate daily. Higher DO levels are usually observed in the afternoon at the height of photosynthetic activity, and the lowest DO levels typically occur in the early morning when algal respiration (i.e., oxygen consumption) is at its maximum. Detailed hourly data for a 5-day period of depressed DO is provided in Figure 4.2 showing how the observations vary during the day. Elevated nutrient levels in the Tidal segment contribute to periodic low DO levels by enhancing instream algae growth. Wide diurnal fluctuations in DO observed in the Tidal segment, which range from 0 to 12 mg/L, are characteristic of a eutrophic (i.e., high algal productivity) water body (APAI 2006).
Figure 4.2: 24-hour data collected within the DO Zone of Impairment.
Data collected at a United States Geological Survey (USGS) operated station in the Tidal segment at FM 106 near Rio Hondo demonstrate this effect. DO data have been collected at this location hourly at four fixed depths since May 30, 2014. Data collected nearest the water surface were analyzed for March 1, 2015 through February 29, 2016. Comparing daily average DO and minimum daily DO to their respective criterion of 4 mg/L and 3 mg/L indicated that occurrences of depressed DO below each criterion are most common during summer months and depressed minimum DO is more common than depressed average DO (Table 4.4 and Figure 4.3). Further analysis indicates that minimum and maximum DO concentrations occur at 8 AM and 5 PM, respectively. DO observations at this station support the description of a eutrophic water body.
27 | P a g e

Table 4.4: Number of days with DO below the 24-hour minimum and average criteria at the USGS station on Arroyo Colorado Tidal at FM 106, Rio Hondo, TX for March 1, 2015 – February 29, 2016.DO Jan Feb Mar Apr May Jun Jul Aug Sep Oct Nov Dec Tota
lMin. 0 0 0 0 1 5 23 24 5 7 0 0 65Avg. 0 0 0 0 0 2 16 17 2 2 0 0 39
Figure 4.3: Time series of daily minimum DO and daily average DO at the USGS station on Arroyo Colorado Tidal at FM 106, Rio Hondo, TX for the period of March 1, 2015 – February 29, 2016.
Instantaneous DO measurements are a common method of gauging water quality. DO concentrations in Segment 2202 of the Arroyo Colorado are generally well above the water quality criterion of 4 mg/L and with the exception of a single data point, are also all above the minimum allowable DO concentration of 3 mg/L. On average, DO concentrations recorded throughout the segment have generally improved during this ten-year monitoring period (Figure
28 | P a g e

4.4). In the Tidal segment (2201), a considerable number of individual DO concentrations have occurred below the 4 mg/L and 3 mg/L average and minimum concentration standards. In AUs 2201_04 & 05, a sufficient number of DO concentrations have been recorded below the 4 mg/L threshold for these AUs to be considered impaired for depressed DO.
02468
10121416
12/0
5
12/0
6
12/0
7
11/0
8
12/0
9
12/1
0
12/1
1
11/1
2
12/1
3
12/1
4
12/1
5
mg/
L
Dissolved Oxygen - Segment 2202
DO Grab Avg DO Criterion DO Min Criterion Ten-Year Data Trendline
0
5
10
15
20
25
12/0
5
12/0
6
12/0
7
11/0
8
12/0
9
12/1
0
12/1
1
11/1
2
12/1
3
12/1
4
12/1
5
mg/
L
Dissolved Oxygen - Segment 2201
DO Grab Average DO Criterion DO Min Criterion Ten-Year Data Trendline
Figure 4.4: DO time series data for Segments 2202 and 2201.
NitrogenOther water quality parameters also provide insight into drivers of DO concentrations. Aquatic vegetation and algae are major drivers of instream DO concentrations in many water bodies and 24-hour DO data presented previously suggest that this connection is strong in the Arroyo Colorado. Therefore, parameters such as nutrients (nitrogen and phosphorus) and chlorophyll-a are valuable metrics to consider when gauging changes in water quality over time. Nitrogen is one of the primary plant nutrients required by aquatic vegetation and algae. Aquatic systems are naturally nutrient limited thus vegetation and algae growth is usually suppressed. However, when nutrient levels increase from natural sources or pollution events, instream productivity increases.
29 | P a g e

This is especially true for free-floating organisms such as algae. The combined measure of nitrate and nitrite provide information on the overall nitrogen load in the water body. Data collected over the last ten years indicate that nitrate + nitrite levels are gradually increasing in both segments and are generally higher in Segment 2202 than in 2201 (Figure 4.5). It should be noted that nitrate screening level exceedances are concerns for all AUs in the 2014 303 (d) List.
0
2
4
6
8
10
12
14
12/0
5
12/0
6
12/0
7
11/0
8
12/0
9
12/1
0
12/1
1
11/1
2
12/1
3
12/1
4
12/1
5
mg/
L
Nitrate + Nitrite N - Segment 2202
Nitrate + Nitrite N Ten-Year Data Trendline
01234567
12/0
5
12/0
6
12/0
7
11/0
8
12/0
9
12/1
0
12/1
1
11/1
2
12/1
3
12/1
4
12/1
5
mg/
L
Nitrate + Nitrite N - Segment 2201
Nitrate + Nitrite N Ten-Year Data Trendline
Figure 4.5: Nitrate + Nitrite nitrogen concentrations in the Arroyo Colorado.
30 | P a g e

Conversely, ammonia concentrations are declining at all sites, particularly at non-tidal sites. As shown in Figure 4.6. Significant declines were observed at the lowermost freshwater monitoring station (Site 13074) and the lowermost tidal monitoring station in the impaired segment (Site 13073); however, the reduction is most pronounced in the freshwater segment. Certainly, the wastewater treatment facility upgrades contributed to this observed improvement.
Figure 4.6: Ammonia-N concentrations at sites 13073 and 13074.
31 | P a g e
PhosphorusPhosphorus is important for controlling aquatic vegetation and algal growth as it is naturally in short supply in aquatic systems. Phosphorus typically enters a water body through direct discharges, storm runoff or irrigation return flows. Similar to nitrogen, phosphorus is prone to causing rapid proliferation of aquatic vegetation and algae. Total phosphorus (TP) screening levels have been established by TCEQ to identify concerns for freshwater (0.69 mg/L) and tidal (0.66 mg/L) systems. In Segment 2202, TP concentrations are generally above the 0.69 mg/L screening level and have been gradually increasing over the last 10 years (Figure 4.7). This slight increase in TP has not been accompanied by declines in DO levels but has caused TP screening level concerns to be included in the 2014 303 (d) List for all AUs in the segment. In the Tidal segment 2201, TP are much lower and generally below the 0.66 mg/L screening level (Figure 4.7). TP concentrations have been relatively constant over the last 10 years in the Tidal segment and have not caused screening level concerns in any Tidal AUs.
0
0.5
1
1.5
2
2.5
3
12/0
5
12/0
6
12/0
7
11/0
8
12/0
9
12/1
0
12/1
1
11/1
2
12/1
3
12/1
4
12/1
5
mg/
L
Total Phosphorus - Segment 2202
Total P Screening Level Ten-Year Data Trendline
0
0.2
0.4
0.6
0.8
1
12/0
5
12/0
6
12/0
7
11/0
8
12/0
9
12/1
0
12/1
1
11/1
2
12/1
3
12/1
4
12/1
5
mg/
L
Total Phosphorus - Segment 2201
Total P Screening Level Ten-Year Data Trendline
Figure 4.7: Total phosphorus concentrations in the Arroyo Colorado.
32 | P a g e

Chlorophyll-aChlorophyll-a is a photosynthetic pigment that allows phytoplankton biomass to be estimated. High chlorophyll-a concentrations indicate excessive algal growth and high primary productivity. Screening levels for chlorophyll-a have been established for freshwater (14.1 µg/L) and tidal waters (21 µg/L). Chlorophyll-a concentrations are routinely above the established screening levels in both segments and concentrations have been increasing over time (Figure 4.8). As a result, the 2014 303 (d) List includes screening level concerns for chlorophyll-a for all AUs in the Arroyo Colorado. This indicates that nitrogen and phosphorus concentrations present in the Arroyo Colorado support a large algae community which can and does produce large amounts of DO when photosynthesis is occurring but at night when respiration occurs, large amounts of DO are consumed leading to the numerous low DO concentrations measured.
1
10
100
12/0
5
12/0
6
12/0
7
11/0
8
12/0
9
12/1
0
12/1
1
11/1
2
12/1
3
12/1
4
12/1
5
ug/L
Chlorophyll a - Segment 2202
Chl-a Screening Level Ten-Year Data Trendline
1
10
100
12/0
5
12/0
6
12/0
7
11/0
8
12/0
9
12/1
0
12/1
1
11/1
2
12/1
3
12/1
4
12/1
5
ug/L
Chlorophyll a - Segment 2201
Chl-a Screening Level Ten-Year Data Trendline
Figure 4.8: Chlorophyll-a concentrations in the Arroyo Colorado.
33 | P a g e
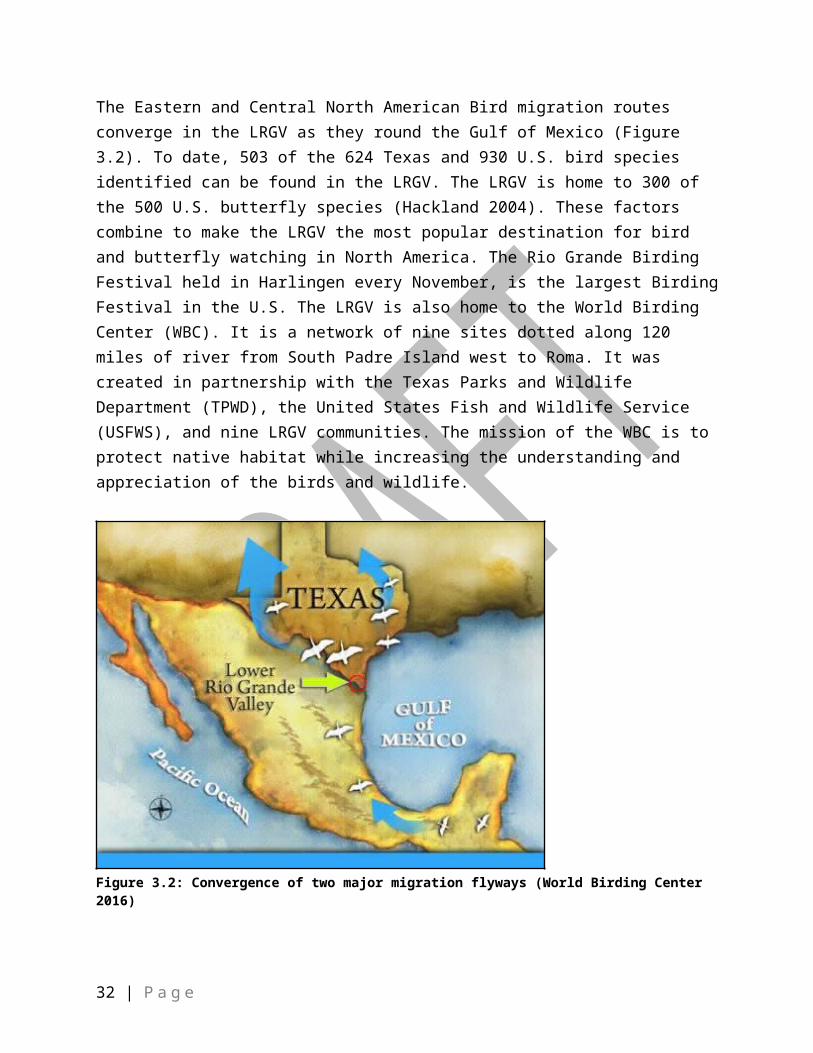
SedimentSediment concentrations in water bodies are another measure of water quality that demonstrates the overall health of the water body. Total suspended solids (TSS) are a common measure used to quantify the amount of all suspended particles in water including sediment, organic matter, and even algae. Sediment is also a primary transport mechanism for many pollutants that enter and are transported in water bodies. Phosphorus has an especially strong affinity for binding to soil particles and is thus commonly associated with sediment in stream systems. Many other pollutants also bind to particles, thus the quantity of TSS in streams is a particularly effective metric for assessing the overall health of a water body. In the Arroyo Colorado, TSS concentrations have remained relatively stable over the last 10 years (Figure 4.9).
0
200
400
600
800
12/0
5
12/0
6
12/0
7
11/0
8
12/0
9
12/1
0
12/1
1
11/1
2
12/1
3
12/1
4
12/1
5
mg/
L
Total Suspended Solids - Segment 2202
Total Suspended Solids Ten-Year Data Trendline
0
20
40
60
80
12/0
5
12/0
6
12/0
7
11/0
8
12/0
9
12/1
0
12/1
1
11/1
2
12/1
3
12/1
4
12/1
5
mg/
L
Total Suspended Solids - Segment 2201
Total Suspended Solids Ten-Year Data Trendline
Figure 4.9: Total suspended solids concentrations in the Arroyo Colorado.
34 | P a g e

Concentrations in Segment 2202 continue to be about five times higher than those in the Tidal segment (2201). This difference is largely due to differences in hydrology within these segments and aggregation of suspended solids caused by salt ions in the Tidal segment. Stream velocity is higher in Segment 2202 than it is in 2201, thus allowing for more and larger particles to be suspended in the stream and transported downstream. Once upstream water enters the saline Tidal segment, many sediment particles aggregate and settle to the stream bed and are only re- suspended during high flows or through mechanical disturbances. This increased clarity increases algal growth and likely contributes to the lower DO concentrations measured in Segment 2201.
BacteriaFecal indicator bacteria are used to evaluate the ability of a water body to support contact recreation uses. In freshwater, Escherichia coli (E. coli) is used while enterococcus is used in tidal waters. Elevated bacteria concentrations signify an increased risk of contracting a gastrointestinal illness for those recreating in the water body. In the Arroyo Colorado, E. coli is the fecal indicator bacteria for Segment 2202 and enterococcus is used in Tidal segment 2201. According to the 2014 303 (d) List, contact recreation is considered impaired in all AUs in both segments due to mean bacteria concentrations above the water quality standard. For E. coli, this standard is a geometric mean of 126 colony forming units (CFUs)/100 mL while the enterococcus standard is 35 CFU/100 mL. Generally, bacteria concentrations have been consistent over the last 10 years with the majority of individual samples containing concentrations higher than the applicable water quality standard (Figure 4.10). A slightly decreasing trend in E. coli concentrations has occurred when all data are considered together; however, TCEQ’s recent biennial water quality assessments, which use a 7-year moving window of time for selecting data to use and evaluate water quality within AUs, only shows generally increasing bacteria concentrations in Segment 2202. Routine enterococcus data has not been collected in Segment 2201 since 2008; however, a special project was conducted in 2014 and 2015 that collected intensive enterococcus data at previously monitored stations. These data demonstrate that no significant change in measured concentrations has occurred over time (Figure 4.10). Special project data are not used in future water body assessments; thus additional data collection is critical in this segment.
35 | P a g e

1
10
100
1000
10000
100000
12/0
5
12/0
6
12/0
7
11/0
8
12/0
9
12/1
0
12/1
1
11/1
2
12/1
3
12/1
4
12/1
5
CFU
Escherichia coli - Segment 2202
E. coli Avg E. coli Criterion Ten-Year Data Trendline
1
10
100
1000
10000
12/0
5
12/0
6
12/0
7
11/0
8
12/0
9
12/1
0
12/1
1
11/1
2
12/1
3
12/1
4
12/1
5
CFU
Enterococcus - Segment 2201
Avg Enterococcus Criterion Enterococcus
Figure 4.10: E. coli and enterococcus concentrations in the Arroyo Colorado
Recreational Use-Attainability Analysis of Segment 2202The Arroyo Colorado above Tidal is designated for primary contact recreation uses. Since it is used primarily to convey wastewater, stormwater, irrigation tail water, and has been extensively modified to accommodate these uses, a Recreational Use Attainability Analysis (RUAA) was conducted by the Nueces River Authority (NRA) in 2010 to determine if primary contact recreation was an appropriate designation. Historical research was conducted regarding past water body uses and 23 sites were physically surveyed on two separate occasions (i.e. 46 site surveys were conducted) during times when water related recreation activities were most likely to occur. Data collected included general stream characteristics, physical measurements, evidence of recreational use, surrounding conditions that promote recreation, and surrounding conditions that impede recreation including channel obstruction. Field observations indicate that there was sufficient water to support recreation at the time of the survey despite moderate drought conditions.
36 | P a g e

Additionally, 11 children were observed carrying out primary contact recreation activities and more than 11 people were observed carrying out secondary contact recreation activities (i.e. predominately fishing) on all AUs. Interviews were conducted to further document the frequency and types of recreation that occur. Both primary and secondary contact recreation uses were confirmed by those interviewed. Based on information collected, the primary contact recreation use was confirmed for Segment 2202.
37 | P a g e

Chapter 5 – Sources of PollutionPotential pollution sources in the watershed were identified using stakeholder input, local project partner expertise, and multiple local research projects (Table 5.1).
Table 5.1: Summary of potential sources of pollutants occurring within the Arroyo Colorado watershed.Source Parameter
impactedDischargetype
Notes
Cropland Bacteria, DO IndirectRunoff of wildlife fecal matter, eroded soil, organic matter, and fertilizer from cropland during rainfall and irrigation events.
WWTFs Bacteria, DO DirectDaily discharges and occasional elevated discharges during large flood events.
Sanitary Sewer Overflows
Bacteria, DO IndirectLeaking sewer lines and sanitary sewer overflows, especially during storm events.
OSSFs Bacteria, DO Indirect Failing or non-existent onsite septic systems.Pets Bacteria Indirect Deposition of fecal matter onto land.
Urban Stormwater
Bacteria, DO IndirectRunoff of wildlife fecal matter, eroded soil, organic matter, and fertilizer from urban lawns and impervious surfaces
Wildlife and Feral Animals
BacteriaDirect and Indirect
Deposition of fecal matter onto urban and agricultural lands and directly into the water.
Livestock BacteriaDirect and Indirect
Deposition of fecal matter onto land or water.
Illegal Dumping
Bacteria, DODirect and Indirect
Includes yard waste which contributes nutrients, organics, and trash and debris (and associated pollutants)
Industrial Activity
DO Direct
Includes spillage of concentrated fertilizer and raw sugar during barge off-loading and loading operations at Port of Harlingen (POH) and at similar facilities located near the port and city of Rio Hondo. Includes three industrial permits allowing for discharge to the Arroyo Colorado.
Physical Channel Modification
DO NAChannel modification reduces velocity of the stream flow, reduces circulation and lowers re-aeration rates impacting DO.
38 | P a g e

CroplandThere are approximately 219,000 acres of cropland in the watershed making it the dominant land use. Most cropland in the watershed is irrigated and used to grow crops like cotton, grain sorghum, corn, sugarcane, vegetables, and citrus (Figure 5.1). Per the Phase I TMDL study, cropland production contributes significant amounts of BOD, nutrients and sediment to the Arroyo Colorado via:
1. Direct surface rainfall runoff from fields via drainage ditches2. Direct surface irrigation return flow from fields via drainage ditches3. Indirect irrigation return flow from fields via shallow groundwater base flow.
Figure 5.1: Land use map of Arroyo Colorado showing types of cropland.
Wastewater Treatment FacilitiesThere are currently 25 active wastewater discharge permits within the Arroyo Colorado watershed including 22 municipal and domestic wastewater facilities and 3 industrial facilities (Table 5.2, Figure 5.2). Together, the facilities have a total permitted flow of approximately 160 million gallons per day (mgd). However, 100 mgd of this permitted flow is associated with an aquaculture facility that is no longer in operation but still has an active permit until 2017.
The original WPP included a separate Pollutant Reduction Plan (PRP), which was an agreement by 17 municipal and domestic facilities, identified as the principal point source contributors of pollutants for concern, to reduce loadings to the Arroyo Colorado and connect colonia residents for wastewater treatment.
39 | P a g e

Since then, many of these facilities have undergone upgrades and voluntarily amended their permits to higher standards for the pollutants of concern. Table 5.3 contains a summary of current permit limits and average flow per day for these facilities.
Table 5.2: Active wastewater discharge permits in the Arroyo Colorado.
Facility Name TPDES Permit No. Discharge Type
Permitted Flow (mgd)
McAllen PUB Facility No.2 WQ0010633-003 Municipal 10.0
City of Pharr WQ0010596-001 Municipal 8.0
City of Mission WQ0010484-001 Municipal 7.3
Harlingen Water Works Facility No. 2 WQ0010490-003 Municipal 7.25
City of Mercedes WQ0010347-001 Municipal 5.0
City of San Juan WQ0011512-001 Municipal 4.0
City of San Benito WQ0011512-001 Municipal 3.75
City of Weslaco South Plant WQ0010619-005 Municipal 2.5
City of Alamo WQ0013633-001 Municipal 2.0
City of Donna WQ0010504-001 Municipal 1.8
City of La Feria WQ0010697-001 Municipal 1.25
City of Hidalgo WQ0011080-001 Municipal 1.2
City of Rio Hondo WQ0010475-002 Municipal 0.4
Winter Garden Park Assoc. WQ0011628-001 Domestic 0.011
City of Palm Valley WQ0010972-002 Domestic(irrigation) 0.28
Military Hwy Water Supply Corporation (La Paloma) WQ0013462-002 Domestic (Irrigation) 0.21
Military Hwy Water Supply Corporation (Santa Maria) WQ0013462-003 Domestic (Irrigation) 0.23
Military Hwy Water Supply Corporation (Los Indios) WQ0013462-005 Domestic (Irrigation) 0.135
Military Hwy Water Supply Corporation (Progreso) WQ0013462-001 Domestic 0.75
Military Hwy Water Supply Corporation (Lago) WQ0013462-008 Domestic 0.51
Military Hwy Water Supply Corporation (Balli Rd) WQ0013462-006 Domestic 0.51
East Rio Hondo Water Supply Corporation (Lozano) WQ0014558-001 Domestic 0.08
La Paloma Energy Center LLC WQ0005137-000 Industrial 1.63
Taiwan Shrimp Village Assoc. and Arroyo Aquaculture Inc. WQ0003596-000 Industrial 100
Frontera Generations Ltd. WQ0004051-000 Industrial 1.8
40 | P a g e

Figure 5.2: Permitted Wastewater Outfalls within the Arroyo Colorado Watershed.
41 | P a g e

Table 5.3: Principal point source contributors of pollutants of concern within Arroyo Colorado watershed.
Facility NameTPDES Permit No.
2016 Flow and Effluent Set (mgd) BOD5/TSS/NH3-N
Reported Flow (3-yr avg.) (mgd)
City of Mission WQ0010484-001 (9) 7/15/2 7.3City of McAllen WWF #2 WQ0010633-003 (10) 10/15/2 5.86City of Hidalgo WQ0011080-001 (1.2) 10/15/3 0.97Military Hwy WSC (Balli Rd.) WQ0013462-006 (0.51) 20/20/NA 0.16City of Pharr WQ0010596-001 (8.0) 7/15/2 4.7City of San Juan WQ0011512-001 (4.0) 10/15/3 2.06City of Alamo WQ0013633-001 (2.0) 30/90/NA 0.94City of Donna WQ0010504-001 (1.8) 10/15/3 1.42City of Weslaco WQ0010619-005 (2.5) 10/15/3 0.96Military Hwy WSC (Progreso) WQ0013462-001 (0.75) 10/15/3 0.35City of Mercedes WQ0010347-001 (5) 7/15/2 1.57
City of La FeriaWQ0010697-001/2 (1.25) 10/15/3
0.43
Harlingen Water Works WWF #2 WQ0010490-003 (7.25) 10/15/3
5.44
City of San BenitoWQ0010473-002
(3.75) 10/15/3 1.56WQ0014454-001
Military Hwy WSC (Lago) WQ0013462-008 (0.51) 20/20/3 0.18City of Rio Hondo WQ0010475-002 (0.4) 20/20/NA 0.15East Rio Hondo WSC WQ0014558-001 (0.08) 10/15/3 0.03
Wastewater Effluent MonitoringTexas A&M University-Kingsville (TAMUK) and the University of Texas at Brownsville (UTB) collected effluent samples from 17 permitted WWTFs and three constructed wetlands every two weeks between September 2010 and August 2011. Effluent samples were analyzed for total phosphorus, orthophosphate-phosphorus, ammonia-nitrogen, total Kjeldahl nitrogen (TKN), and total nitrate/nitrite-nitrogen. Total nitrogen (TN) was calculated by summing of the nitrate/nitrite-N, ammonia-N, and organic-N concentrations.
Average daily flow ranged from 7.0 mgd for the McAllen South WWTF, (20.7% of total WWTF flow to the Arroyo Colorado), to 0.022 mgd for the East Rio Hondo Water Supply Corporation (ERHWSC) Lozano facility (Figure 5.3). Mean effluent TN concentrations ranged from 7.7 to 37 mg/L (Figure 5.4), and averaged 21 mg/L for all 17 facilities. Highest average TN concentrations were associated with smaller WWTFs [Military Highway WSC (MHWSC) Balli Rd and ERHWSC Lozano]. Average effluent TKN concentrations ranged from 0.41 to 22 mg/L, and averaged 3.6 mg/L for all 17 facilities. Only three facilities had average effluent TKN concentrations above 3.2 mg/L – Alamo (22 mg/L), MHWSC Progreso (11 mg/L) and MHWSC Joines Rd (13 mg/L).
42 | P a g e
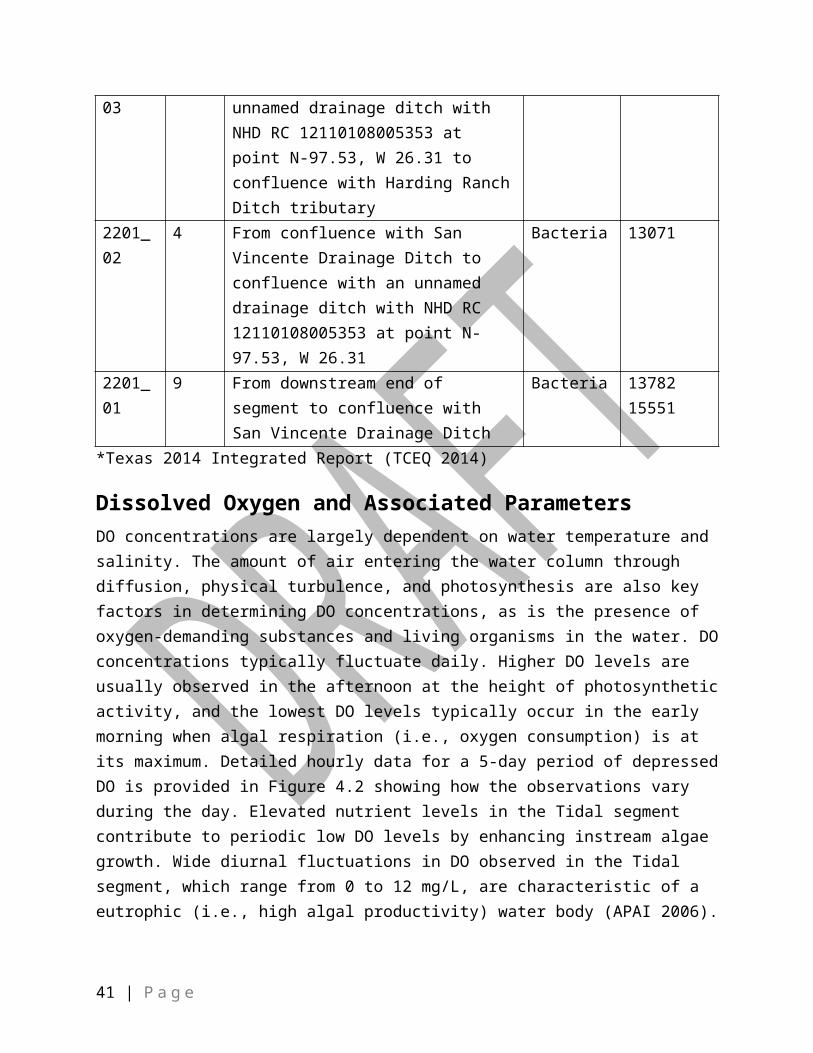
Figure 5.3: Average daily effluent flows (left axis) and corresponding percentages of the combined effluent flow (right axis) for all 17 WWTFs, September 2010 and August 2011.
Figure 5.4: Average WWTF effluent TN concentrations, September 2010 and August 2011.
Mean effluent ammonia-N concentrations ranged from 0.07 to 13 mg/L (Figure 5.5), and averaged 1.8 mg/L for all 17 facilities. Only three facilities had average effluent ammonia-N concentrations above 1.9 mg/L – Alamo (13 mg/L), MHWSC Progreso (3.2 mg/L) and MHWSC Joines Rd (5.8 mg/L). During the study, none of these three WWTFs had a permit limit for ammonia-N. The Harlingen WWTF exceeded its permit limit for average daily ammonia-N (3.0 mg/L) twice with measurements of 7.36 mg/L in February 2011 and 3.12 mg/L in July 2011, but its average ammonia-N concentration over the 46-week sampling period was 1.65 mg/L.
43 | P a g e

Ammonia-N not only provides a nutrient source for phototrophic algae (which can contribute to eutrophication), it also exerts a total nitrogenous biochemical oxygen demand equivalent to approximately 4.1 g O2/g NH4+-N and is toxic to fish and amphibians.
Figure 5.5: Average WWTF effluent ammonia-N concentrations, September 2010 and August 2011.
The combined average effluent TKN mass loading for all 17 WWTFs was 234 kg/d (or 85 metric tons/yr) and ranged from a high of 59 kg/d for the Alamo WWTF to a low of 0.04 kg/d for the ERHWSC Lozano WWTF (Figure 5.6). The average WWTF effluent daily TKN mass loadings were anomalously high for the MHWSC Progreso, MHWSC Joines Rd, and particularly the Alamo WWTF. The Alamo WWTF only contributed 2.0% of the total average effluent flow for all 17 facilities combined, yet contributed 25% of the total combined TKN mass loading. The high TKN mass loadings for these three WWTFs were probably attributable to the absence of significant nitrification, as well as to the visibly high algae concentrations in the effluent from the facultative lagoon systems.
44 | P a g e

Figure 5.6: Average WWTF effluent TKN mass loadings (i.e., the sum of the organic-N and ammonia-N loadings), September 2010 and August 2011.
The calculated average organic/polyphosphate-P concentrations (Figure 5.7) ranged from 0.75 to 3.0 mg/L, and averaged 1.2 mg/L for all 17 facilities. The highest calculated average effluent organic/polyphosphate-P concentrations were for the Alamo and MHWSC Progreso WWTPs (3.0 and 1.8 mg/L, respectively), which again were both facultative lagoon facilities that routinely had visually high concentrations of algae in the effluent.
The highest organic-polyphosphate-P/total-P ratios were observed for the Alamo and MHWSC Progreso WWTPs (80% and 84%, respectively). Consequently, the lowest orthophosphate- P/total-P ratios were also observed for these two facilities (20% and 16%, respectively). At the15 other facilities, orthophosphate-P constituted from 61% to 84% of the average total-P concentrations. The comparatively high organic-polyphosphate-P/total-P percentages for the Alamo and MHWSC Progreso WWTPs were probably attributable to visibly higher concentrations of suspended algae in the effluents from these two facultative lagoon facilities.
Since the completion of the monitoring in 2011, MHWSC Progresso and MHWSC Joines Rd. have completed construction of new aerated, mechanical WWTFs in 2010 and 2012, respectively, and decommissioned the original facultative-lagoonal ponds. The city of Harlingen completed the construction of their new WWTF in 2012. The city of Alamo is planning to upgrade their WWTF by adding a new head works and a biological nutrient reduction batch plant to meet current and future wastewater effluent discharge limits.
45 | P a g e

Figure 5.7: Average WWTF effluent total-P concentrations for the 46-week sampling period.
Wastewater InfrastructureWastewater infrastructure refers to the pipes and lift stations needed to convey wastewater to the WWTFs. Much of the wastewater infrastructure is old and was installed when the original lagoon plants were built. Clay pipes are still used in some cities and aging infrastructure can cause numerous problems through increased leaks, breaks, clogs, or lift station pump failures. These failures lead to inflow/infiltration (I/I) into the sewer system during storm events, which can overwhelm the collection system. Some homeowners use sewer cleanouts to drain their properties during storm events allowing stormwater to directly enter the system further overloading the system. These factors can contribute to the collection system backing up and overflowing, resulting in significant bacteria and nutrient loading to the Arroyo Colorado.
Onsite Sewage Facilities and ColoniasMany residents in the Arroyo Colorado watershed are not within the existing WWTF service area and use on-site sewage facilities (OSSFs). Many factors affect the efficiency of OSSFs including the soil properties of the soil absorption field. In the Arroyo Colorado watershed, soil properties are very limited throughout much of the watershed (Figure 5.8), and thus the likelihood of failure increases. Approximately 57% of OSSFs in the watershed are associated with very limited soils and should be prioritized for evaluation. Conversely, 42% of OSSFs are associated with soils that are suitable (i.e. soils not limited). Per the USEPA (2002), nationwide OSSF failure rates range from 10-20%. A Texas study found an average of 12% failure rate for the state (Reed et al 2001).
46 | P a g e

Figure 5.8: Soil suitability for OSSFs and OSSF locations in the Arroyo Colorado watershed.
Other factors impact OSSF function including lack of maintenance and damage. Sludge should be removed from the tank every three to five years and annual inspections should be conducted at a minimum. If routine maintenance is neglected, the system may malfunction and discharge improperly treated wastewater. Leaking and ruptured pipes or tanks may also lead to discharges. Lack of maintenance is the major limiting factor for aerobic OSSFs as well. If effluent is not properly disinfected, it could result in improperly treated wastewater being applied to the land. Accumulated solids, oils and greases need to be periodically removed for aerobic OSSFs to function properly.
Approximately 15-20% of Texas’ border residents live in communities called colonias. The term means settlement or neighborhood and is commonly used to refer to unincorporated rural and peri-urban subdivisions along Texas’ border with Mexico (Olmstead 2004). These communities are generally characterized by a lack of physical infrastructure such as water and wastewater, storm drainage, and paved streets. It is unclear exactly when colonias appeared in the LRGV but most researchers agree that some date back to the 1960s when there was an influx of migrants to the LRGV associated with unprecedented growth in the manufacturing and agricultural sectors. Colonias appeared almost overnight outside of city limits in rural, unincorporated areas as land speculators sprang at the opportunity to provide affordable housing by purchasing and subdividing large tracts of cheap, agriculturally-poor land. This land often had the poorest terrain with very little natural drainage, soil permeability, transportation access, or water supply. Colonias were planned to maximize the number of lots purchased from the original landowner, thus lots were small, usually 50 ft. by 50 ft. Colonias typically rely on OSSFs consisting of a septic tank and a drain field to treat wastewater; however, soil type, soil permeability, and lot
47 | P a g e

size limit the efficiency of these OSSFs. Watershed soils generally consist of heavy clays with little, if any, porosity and permeability. Lot sizes are also too small to install a proper drain field. Other factors affecting the efficacy of these systems include improper installation, improper sizing of the system in relation to the number of people living in the home, OSSF density in the colonias, and lack of maintenance and inspections. Further, most colonia residents lack the resources to maintain the OSSFs properly resulting in OSSFs that are not functioning properly if at all. Due to these factors, OSSF failures are likely in colonias and may contribute a significant source of bacteria to the Arroyo Colorado.
A priority ranking system developed by the Rural Community Assistance Partnership (RCAP) rated the infrastructure needs of colonias based on the observed status of water and wastewater infrastructure and the presence of human health hazards. Priorities range from one to five with one signifying the greatest need and five the lowest (Table 5.4). Colonias within the watershed were rated under all Priorities one-five (Figure 5.9) (RCAP et al., 2015).
Table 5.4: RCAP colonia needs prioritization descriptions and color codesRating Priority Classification DescriptionPriority 1 Communities NOT served by a public water and/or wastewater facility, AND
A health hazard is (or may) be presentPriority 2 Colonia residents are NOT served by a public water system; no health hazard
indicated, ORColonia residents are NOT served by a publicly owned wastewater disposal system, and existing onsite wastewater treatment system is not adequate; no health hazard indicated, ORColonia residents ARE served by publicly owned water and wastewater facilities but one or both are in serious violation of regulations
Priority 3 Some residents are NOT served by a publicly owned water, AND/ORSome residents do NOT have access to wastewater service, ANDPlans are in development and proceeding for financing new water or wastewater services to all areas affected or are currently under construction
Priority 4 Residents ARE served by public water facilities, ANDResidents are NOT served by public wastewater service, BUTIndividual onsite wastewater disposal systems appear to be adequate, ORResidents ARE served by BOTH public water service and publicly owned wastewater facilities
Priority 5 The identified colonia does not have any occupied residences*source: RCAP et al., 2015
48 | P a g e

Figure 5.9: Colonias and current classification status.
49 | P a g e

Estimating Onsite Sewage Facility DistributionTo estimate the number of OSSFs within the watershed, 911 address data for Cameron and Hidalgo counties were obtained. Due to missing addresses, especially in Hidalgo County, parcel Geographical Informational Systems (GIS) layers were obtained from the counties and used in conjunction with satellite imagery to fill any address gaps. A final address layer was generated and consisted of 114,424 addresses in the watershed. Meetings were held with WWTF representatives and maps, GIS data, and other information concerning sewer lines and/or service were provided. This information was used to develop a GIS polygon layer of the estimated WWTF service area boundaries (Figure 5.10), and addresses outside the service areas were considered to utilize an OSSF (Figure 5.11). In total, 17,048 addresses (around 15%) are outside the estimated WWTF boundaries and likely utilize an OSSF, and 2,875 addresses are within designated colonia areas. All OSSFs have potential adverse environmental impact if they are improperly functioning, but those closer to streams present an elevated risk. Additionally, during flood events, bacteria transmission may be accelerated. In the Arroyo Colorado watershed, approximately 2,512 OSSFs are estimated to lie within 107 meters (350 feet) of the Arroyo Colorado and its tributaries. It is important to ensure that OSSFs near the river are functioning properly.
Figure 5.10: Estimated service area boundaries within the Arroyo Colorado watershed for WWTFs.
50 | P a g e

Figure 5.11: Estimated OSSFs.
51 | P a g e

There has been a major effort to provide wastewater service to colonia residents. There are a total of 278 colonias within the Arroyo Colorado watershed. Of these, 183 are within the estimated WWTF service area boundaries, 92 are not and 3 are partially served (Figure 5.12). This indicates that roughly 65% of the residents within the areas classified as colonias currently have wastewater service or have immediate access. Table 5.4 lists colonias that are not within the service areas and the WWTF that holds the Certificate of Convenience and Necessity (CCN).
Figure 5.12: Colonias inside and outside of the estimated service area boundaries.
52 | P a g e

Table 5.4: Colonias not within service areas. Note: underlined colonias are within 350 feet of the Arroyo or its tributaries and italicized colonias contain greater than 50% very limited soils.
CCN ColoniasEstimated residents*
Agua SUD
Acevedo Subd. #4, Americana Grove #2, Americana Grove Subd., Canadiana Ests., Carlos Acres, Chihuahua, Ebony Hollow Subd. #1, Ezequiel Acevedo Jr. Subd. #2, Ezequiel Acevedo Subd., Four Sure All Right, Josefina L. Chapa Subd., La Camellia Subd., La Camellia Subd. A, Los Trevinos Subd., Los Trevinos Subd. #2, Los Trevinos Subd. #3 , Los Trevinos Subd. #4, Los Trevinos Subd. #5 , Mata Subd. #2, Park Lane Subd., Perezville, Royal Palms Ests., Sno-Bird Ests., Sno-Bird Ests.#2, Sotira Ests., Sunny Haven Ests., Umberto Garcia Jr. Subd.
2,880
City of AlamoAlamo Orchards, Alamo Rose RV Resort, Country Living Ests., Country Living Ests.#2, Moore Road Subd., Plumosa Village
301
City of Donna Balli #2, Victoria Belen, 9 North/East FM 493, Runn (partially served) 251City of Weslaco Midway Village Subd, La Loma Alta Subd 443
City of MercedesColonia Victoriana, C.A. Conner & Co. Inc. Subd, Elizabeth Subd, North Capisallo, Old Rebel Field Subd. (0 pop.)
370
City of La Feria Solis, Nancy, Robles Ranch, Solis Road, Bixby, Alto Real 448
City of San BenitoExpressway 83/77, Graham, Norma Linda Road, Rancho Grande, South Ratliff Street, South Fork Subd.
232
East Rio Hondo WSC
Alfredo Garza, Arroyo Gardens #1, Arroyo Gardens #2, Arroyo Gardens #4, Glenwood Acres, Green Valley Farms, Gumesindo Galvan, Juan Gonzales, Lantana Acres, Leonar B. De Villarreal, Vicente Sandoval, Villa del Sol, Arroyo City Annex Subd.
1,292
Harlingen Water Works System
Rangerville Center, Gonzales, Bonnaville Terrace, Gotwin Rd, Lasana, Lasana West, Laguna Escondida, Laguna Escondida Heights #2, Santa Elena, North 30 Subdivision (HOA)
571
Military Hwy WSC
Runn (partially served by city of Donna) 30
City of Los Fresnos
Casa Del Rey Subdivision, East Fresnos, Esquina, Paredes Ests. (partially served), Laureles (mostly served)
1,725
NoneArroyo City Subdivision, Bustamante Subd., Channel Lots, Coulson, Lasana, Lasana West, Leisure Time Mobile Home Park, Robinette Subd., Schwartz, XX Farms, Colonia Saenz, De Anda Subd.
597
*Population estimates from colonias Map (RCAP 2015) -https://www.arcgis.com/home/item.html?id=a5b2efdea2a844029dbf45e19b014946
53 | P a g e

Finally, it is notable that there are 2,424 OSSFs within the Coastal Management Program (CMP) Boundary (Figure 5.13). This makes them a priority for funding through the Coastal Zone Act Reauthorization Amendments (CZARA).
Figure 5.13: OSSFs and colonias within the coastal zone.
Urban StormwaterThe LRGV is one of the fastest growing regions in the nation. With this growth comes increased impervious cover and increased stormwater discharges. Stormwater often contains pollutants that can adversely affect water quality. Increases in impervious surfaces are common in the upper reaches of the watershed (Figure 5.14).
54 | P a g e

Figure 5.14: Increases in impervious surfaces in the Arroyo Colorado watershed.
Municipal Separate Storm Sewer Systems (MS4s) that are located within urbanized areas (UA), as defined by the U.S. Census Bureau (Figure 5.15), are required to obtain coverage under the Texas Pollutant Discharge Elimination System (TPDES) Phase II General permit.
Areas covered under the Phase II small MS4 system regulations are based on total population and population density. Urban areas with populations of 10,000 or more and population densities of 1,000 per square mile are designated UAs requiring coverage under a TPDES stormwater permit. In the Arroyo Colorado watershed, there are 27 MS4 permits (Table 5.5). Under the TPDES Stormwater Program for small MS4s, operators of regulated small MS4s are required to design and implement a stormwater management program (SWMP) that:
- Reduces the discharge of pollutants to the “maximum extent practicable”,- Protects water quality, and- Satisfies the appropriate water quality requirements of the CWA
55 | P a g e

Figure 5.15: Map of 2010 Census urbanized areas.
Table 5.5: MS4 Permits with areas within the Arroyo Colorado WPP watershed.Auth # Permittee City Site LocationTXR040002 City Of Primera Primera Area within the city of Primera located within the
city of Harlingen UATXR040051 Cameron County Brownsville Area within jurisdiction of Cameron County and
located within the Brownsville and Harlingen UAsTXR040074 City Of McAllen McAllen Area within the city of McAllen limits located
within the McAllen UATXR040161 City Of San
BenitoSan Benito Area within the city of San Benito located within
the Harlingen UA and all areas within the city jurisdiction including its urban ETJ
TXR040164 City Of Harlingen Harlingen Area within the regulated boundaries of the city of Harlingen within the Harlingen UA and all areas within the city jurisdiction including its urban ETJ
TXR040165 City Of Donna Donna Area within the city of Donna within the McAllen UA and all areas within the city jurisdiction including its urban ETJ
TXR040167 City Of San Juan San Juan Area within the city of San Juan within the McAllen UA and all areas within the city jurisdiction including its urban ETJ
TXR040168 City Of Mission Mission Area within the city of Mission within the McAllen UA and all areas within the city jurisdiction including its urban ETJ
TXR040171 Texas Department Pharr Facilities located within the McAllen, Harlingen,
56 | P a g e

Auth # Permittee City Site LocationOf Transportation and Brownsville UAs and portions of Cameron
CountyTXR040236 Cameron County
Drainage Distr 1Brownsville Southeast Cameron County from the Resaca De Los
Cuates to the Rio Grande River Flood Levee and within the Brownsville UA
TXR040243 Cameron County Drainage Distr 5
Harlingen Cameron County Drainage District 5 is located within the Harlingen UA
TXR040262 City Of Weslaco Weslaco The MS4 regulated boundaries of city of Weslaco within the McAllen UA and all areas within the city’s jurisdiction including its urban ETJ
TXR040264 City Of Brownsville
Brownsville The MS4 regulated boundaries of city of Brownsville within the Brownsville UA and all areas within the city’s jurisdiction including its urban ETJ
TXR040270 City Of Los Fresnos
Los Fresnos Area within the city of Los Fresno within the Brownsville UA
TXR040276 Cameron County Drainage Distr 3
San Benito Area of the CCDD #3 jurisdiction within the Harlingen and Brownsville UAs
TXR040286 City Of La Feria La Feria All areas within La Feria and all areas within its 5 mile ETJ located within the Harlingen UA
TXR040287 City Of Pharr Pharr Area within city of Pharr within the McAllen UATXR040288 City Of La Joya La Joya The regulated boundaries of the city of La Joya
within the Harlingen UA and all areas within the city’s jurisdiction including its urban ETJ
TXR040289 City Of Alamo Alamo The area within the city of Alamo is within the McAllen UA and all areas within the city’s jurisdiction including its urban ETJ
TXR040322 Hidalgo County Drainage Distr 1
Edinburg Area within the limits of Hidalgo County Drainage District 2 within the McAllen UA
TXR040333 City Of Palmhurst Palmhurst Regulated area within the entire jurisdiction of the city of Palmhurst
TXR040339 City Of Mercedes Mercedes Area within city of Mercedes in the McAllen UATXR040343 Town Of Combes Cibolo Area within the town of Combes within the city of
Harlingen UATXR040400 City Of Hidalgo Hidalgo Area within Hidalgo City within the Hidalgo UATXR040406 City Of Palm
ValleyHarlingen Areas within the city of Palm Valley and within the
city's urban ETJ and subsequent annexed areas all within Harlingen UA
TXR040408 Hidalgo County Edinburg Area within limits of Hidalgo CountyTXR040536 City Of Palmview Palmview Area within the city of Palmview Limits and all
areas within it ETJ that is located within the McAllen UA
57 | P a g e

Wildlife and Feral AnimalsThe LRGV supports an abundance of neotropical wildlife and is home to rare and unique plant and animal species. Migration routes converge in the LRGV making it the most popular destination in North America for bird and butterfly watching. As the area continues to grow beyond its current population of 1.3 million people, habitat is becoming rarer. Approximately 5% of old growth habitat remains. Despite this, the Arroyo Colorado watershed provides rich habitat for many plants and animals that are only found in deep South Texas. In addition to migratory waterfowl, large game species such as white tailed deer, nilgai antelope, and javelina hog can also be found in the watershed, particularly in the larger tracts of undeveloped land along the coast such as the Laguna Atascosa National Wildlife Refuge. Fortunately, feral hogs have not yet become a major issue in the Arroyo as they have in many other watersheds in Texas.
DeerTPWD estimates that in the South Texas Plains (Resource Management Unit Number 8), the closest RMU to the Arroyo Colorado watershed, the average deer density between 2005 and 2010 is 16.7 deer per 1,000 acres. Approximately 79,000 acres are classified as forest, shrub/scrub, rangeland grasses (i.e. grassland/herbaceous), and wetlands and presumed to provide potential habitat for deer (Figure 2.5 and Table 2.4). Based on this assessment, there are approximately 1,321 deer in the watershed.
JavelinaOriginally distributed in Texas from Brownsville to the Red River, the javelina’s current range has been restricted to the southwestern third of the state, including portions of the lower coastal plains, the South Texas Plains, the western half of the Edwards Plateau, the Trans-Pecos, and the southern edge of the Rolling Plains. Although there is not a reliable census technique, javelina population trends have been determined from aerial surveys in conjunction with deer and pronghorn surveys. Based on this data, there are an estimated 100,000 javelina currently occupying approximately 62 million acres of Texas rangelands (i.e. 620 ac/javelina). Assuming this density is present across the 79,000 acres classified as forest, shrub/scrub, rangeland grasses (i.e. grassland/herbaceous), and wetlands, there are an estimated 127 javelina in the watershed.
NilgaiAccording to a 1988 survey, 36,756 nilgai inhabited 36 ranches in South Texas with the majority on large ranches in Kenedy and Willacy Counties. They now readily reproduce and have established free-ranging populations in Kleberg, Kennedy, Brooks, Hidalgo, Willacy and Cameron counties. According to Traweek (1995), very few (only 0.2% of total) were confined and numbers had declined 22% to 28,493 between 1988 and 1994. In some parts of South Texas, nilgai density is as high as 30 per square mile (21 ac/nilgai); however, according to U.S. Department of Agriculture (USDA) Animal and Plant Health Inspection Service (APHIS) (2014) in the Boca Chica Beach area in Cameron County near Brownsville (just outside the watershed),
58 | P a g e

an estimated 100 nilgai inhabited the 42,000 ac area (i.e. 420 ac/nilgai). Assuming this density throughout the watershed and that nilgai reside on the 79,000 acres classified as forest, shrub/scrub, rangeland grasses (i.e. grassland/herbaceous), and wetlands, a total of 188 nilgai may be present in the watershed.
WaterfowlCentral America has the highest density of wintering birds in the world, and Texas is close behind being the very next stop on most migration routes (Figure 5.16). With 615 species documented in Texas, it has the most species of any state; however, most are migratory. Mild winters, abundant food, and protection of wildlife refuges make the Texas Gulf Coast prime winter habitat for nesting migratory birds. Fall migration starts in August and generally goes through October for late species with their return usually beginning in March.
About 250 bird species frequent the regions along the river, with roughly 70% being migratory. Due to the favorable climate and habitat, many species reside in the LRGV even though they are considered migratory (Shackelford et al., 2005). This is not unusual for this region. Many rare migrants and wintering birds stay in the area or become permanent residents. Aerial surveys (Smith, 2002) of winter waterfowl populations in the Lower Texas Coast suggest that over 300,000 migratory waterfowl winter in the LLM (Table 5.6). Presumed habitat for waterfowl are wetlands and open water throughout the watershed, which are primarily found near the coast in Cameron County (Figure 5.17).
Figure 5.16: LLM of the Texas gulf coast provides habitats to migratory birds that follow Central Flyway. (Picture modified from Shackelford et al., 2005)
59 | P a g e

Table 5.6: Population of migratory waterfowl in the LLM (Smith 2002).
SpeciesWinter pop.in lower TX
% inLLM
Winter pop.in LLM
Total winter pop. in LLM
Birds/ac*
GeeseLesser Canadian Goose 12,100 27.3 3,303
302,300 1.17
White-fronted goose 3,900 28.6 1,115Lesser Snow goose 34,300 21.2 7,272
Ducks
Mottled duck 2,200 26.7 587Gadwall 14,900 28.2 4,202Northern pintail 107,000 61.1 65,377Green-winged teal 4,300 13.4 576Blue-winged teal 0 0.4 0American wigeon 22,800 42.8 9758Northern shoveler 6,700 9.4 630Redhead 208,000 97.5 202,800Ring-necked duck 100 2.9 3Canvasback 700 55.2 386Scaup 14,100 36.7 5,175Ruddy duck 3,300 33.8 1,115
*Area of LLM is 257,803 ac.
Figure 5.17: Waterfowl habitat in Arroyo Colorado watershed.
60 | P a g e

LivestockThe 2012 National Agricultural Statistics Service census data reports cattle, goats and sheep counts at the county level. Fractional watershed areas in each county were extracted from the state county polygons and the watershed boundary. Based on this assessment, there are 3,887 cattle, 1,761 goats, and 763 sheep in the watershed (Table 5.7).
Table 5.7: Arroyo Colorado livestock estimates.County Cattle Goats SheepHidalgo 1,576 623 400Cameron 2,094 1,119 343Willacy 217 19 20Total 3,887 1,761 763
It was assumed that most livestock resided on areas classified as range (i.e. grassland/herbaceous and shrub/scrub) and pastureland. Approximately 18% of the watershed falls into these categories (Figure 2.5 and Table 2.4). It was also assumed that the overall livestock density (i.e. stocking rate) was comparable between the county averages and in the watershed and that rangeland is not irrigated while pastureland can potentially be irrigated. Stocking rates for cattle on grass dominated rangeland ranges from 10-15 acres per animal unit and 15-22 acres per animal unit on brush dominated rangeland. It should be noted that much of the suitable grazing land in Hidalgo County is north of the watershed, and a lot of suitable grazing land in Cameron County is south of the watershed.
PetsPer the American Veterinary Medical Association’s 2012 U.S. Pet Ownership and Demographics Sourcebook, 44% of households in Texas own dogs and there is an average of 1.6 dogs in these households. Based on the method used to estimate OSSFs, there are 114,424 addresses within the Arroyo Colorado watershed. Using these numbers, approximately 50,347 households in the watershed own dogs and there are approximately 80,554 dogs in the watershed. These dogs are likely concentrated in areas of higher human population densities. It is likely many dog owners do not collect their dog’s waste, especially in rural areas, and thus, this waste represents a likely contributor to E. coli in the Arroyo Colorado watershed. Stray dogs and cats are big problem in the rural parts of the watershed. Unwanted dogs and cats are dumped in rural areas and pose a health risk to residents and their pets.
61 | P a g e

Illegal DumpingIllegal dumping is a major issue in the Arroyo Colorado watershed. Most illegal dumping is associated with residential and construction related debris. Many people that live in rural areas of the watershed frequently report illegal dumping to local authorities. Many residents may not take their trash to landfills but simply drive out to rural areas of the watershed where there is little or no lighting and dump the trash directly on the road or in the ditches along the road. This may be related to a lack of collection services in colonias and rural areas. In addition, stakeholders have indicated that some landfills are closed on the weekend when many people need to dispose of trash. The Sheriff’s departments in Hidalgo, Cameron and Willacy counties have illegal dumping hotlines where residents can call to report illegal dumping.
Physical Channel ModificationThe Arroyo Colorado is a constructed floodway through nearly half its course in southern Hidalgo County. From 1932 to 1947, IBWC built flood levees and converted the main channel into a pilot channel designed to convey low flow drainage and floodwaters from the LRGV. From 1945 to 1951, the US Army Corps of Engineers (USACE) dredged and straightened the Arroyo Colorado Tidal, widening an area near Harlingen to accommodate barge traffic from the Laguna Madre to the POH. These two large-scale physical modifications limit the Arroyo Colorado’s ability to assimilate pollutants naturally and meet the uses designated by the TCEQ.
The designed flow velocity of the pilot channel in the Main Floodway (i.e., the Arroyo Colorado above Tidal in southern Hidalgo County) is significantly higher than the slow movement of water that normally occurs in oxbow lakes and other types of natural resaca systems. High flow velocities create an unstable, erosional regime in a coastal stream like the Arroyo Colorado. The loss of sinuosity in the main channel from rectification and channelization and a lack of adequate riparian vegetation further decreases bank stability (Figure 5.18).
Stream instability helps keep suspended sediment loads high in the Arroyo Colorado. This prevents nutrient assimilation along its course. Under normal conditions, ammonia and nitrates are removed by algae, which use these nutrients to grow. However, algal growth is suppressed when sediment loads are high because light penetration limits photosynthesis. Suspended sediments also transfer phosphate that is bound to sediment particles.
Lack of adequate riparian habitat reduces shading and results in elevated surface water temperatures that subsequently can decrease DO concentration. Cooler water temperatures increase the amount of oxygen that can remain dissolved in water. The canopy offered by trees and other riparian vegetation help to keep surface water temperatures lower, and thereby increasing the solubility of oxygen.
62 | P a g e

Figure 5.18: Aerial view of Llano Grande Lake and adjacent channelization.
Dredging in the Tidal segment also contributes to the stream’s inability to meet state water quality standards for a high aquatic life use. Removal of bottom sediments from the Arroyo Colorado results in the intrusion of hypersaline (very salty) water from the Laguna Madre to the POH. Saltwater intrusion this far inland causes the upper and lower portions of the water column of the Arroyo Colorado to segregate into distinct density layers that do not mix well vertically. During periods of low fresh water flow and warm temperatures, the bottom depths (~3m) of the water column in much of the Tidal segment become almost completely depleted of oxygen (0-1.5 mg/L) leaving a surface layer of less than one meter with adequate conditions for aquatic life (DO between 4-6 mg/L).
Natural aeration in coastal streams is largely dependent on wind action. Oxygen is introduced into surface layers of coastal water bodies through mechanical agitation caused by wind. Wind aeration can be inhibited in stream channels with steep banks such as those of entrenched (i.e., excavated) channels. The Tidal segment is an excavated channel that is maintained through periodic dredging (~5-year intervals). Dredge material is commonly placed on or near the banks of the excavated channel creating bank heights of 30-50 ft. Lower bank heights in the Tidal segment would allow more wind action on its surface and help increase surface aeration.
63 | P a g e

Widening of the Arroyo Colorado at the Port of Harlingen (barge) Turning Basin reduces the flow velocity of the non-tidal segment of the Arroyo Colorado as it enters the tidal segment (Figure 5.19). This slowing of flow causes suspended sediment and particles of organic matter to drop out of suspension and deposit in the turning basin, reducing turbidity in the water column downstream of the turning basin. Less turbid water allows for deeper light penetration, and plentiful nutrients complete the stage for perfect algal growth conditions. Algal blooms are common in the Arroyo Colorado Tidal in the spring and summer.
Figure 5.19: Aerial view of Port of Harlingen and Barge Turn Basin.
During the day, algal blooms can produce high levels of DO through photosynthesis. But during the night, the same oxygen-producing algae can consume large amounts of DO through respiration. This can deplete oxygen in the water column, depriving aquatic animals of this life-sustaining element. Excessive algal growth can create large amounts of organic matter from the reproduction and death of individual algal cells. Bacteria in natural waters decompose the dead algae and other sedimentary organic particles. In doing so, they also consume large amounts of DO through respiration. Consequently, excessive algal growth and the deposition of sedimentary organic matter can lead to depletion of DO from algal and bacterial respiration.
64 | P a g e

Chapter 6 – Source Loading AnalysisData from FM1015 in Weslaco (Site 13081) and the POH (Site 13074) were used to assess current TP and E. coli loadings and reductions needed to meet screening criteria (TP) and water quality standards (E. coli). Current loadings were determined by the Soil and Water Assessment Tool (SWAT) model for TP and by multiplying the observed E. coli geomean (for the period of 2000-2011) by the mean annual flow for each site. The difference between the estimated annual loads and allowable load (flow rate multiplied by the water quality standard or screening criteria minus a 10% margin of safety) is the estimated load reduction needed to achieve the water quality goal (Table 6.1).
Table 6.1: E. coli and TP loadings and reductions to meet water quality goals at FM1015 in Weslaco and the Port of Harlingen. FM1015, Weslaco Port of HarlingenEstimated Annual E. coli Load (cfu/yr) 1.90E+14 3.43E+14Annual E. coli Loading Reduction Needed (cfu/yr) 4.56E+13 9.60E+13% Reduction Needed to Meet E. coli Goal 24% 28% Estimated Annual TP Load (kg/yr) 195,614 236,540Annual TP Loading Reduction Needed (kg/yr) 116,759 101,081% Reduction Needed to Meet TP Goal 60% 43%
SWAT Analysis of Loading SourcesNutrients, sediment, and E. coli loadings were assessed using the SWAT model. SWAT is a river basin scale model developed to quantify the impact of land management practices on water, sediment, and agricultural chemical yields in large complex watersheds with varying soils, land use, and management conditions over long periods of time. Chief components of SWAT include weather, surface runoff, return flow, percolation, evapotranspiration, pond and reservoir storage, transmission losses, groundwater flow, reach routing, nutrient and pesticide loading, crop growth and irrigation, and water transfer. SWAT is a public domain model actively supported by the USDA-Agricultural Research Service and Blackland Research and Extension Center in Temple, Texas. SWAT uses best available information and stakeholder input to estimate potential pollutant loading from each modeled source. Using outputs generated by the model, the relative potential for pollutant loading from each evaluated source across the watershed can be compared and prioritized for future management. Using SWAT, the watershed was subdivided into 17 sub-basins (Figure 6.1).
65 | P a g e

Figure 6.1: Arroyo Colorado sub-basins used by SWAT.
Table 6.2 provides the combined contributions from nonpoint and point sources within each sub-basin. SWAT modeling results suggest that highest E. coli loadings are found in sub-basins 1, 11, 15, and 17 while highest nutrient loadings are in sub-basins 3, 4, and 10 (along with sub-basins 2, 12 and 15).
Table 6.2: Annual sub-basin loadings estimated by SWAT model (loadings >75th percentile are highlighted).Sub Area (km2) Sediment (tons) TN (tons) TP (tons) E. coli (cfu)
1 90 10,038 7 11 2.174E+142 50 6,992 165 71 3.883E+133 74 3,406 198 68 4.27E+134 157 6,913 188 87 6.914E+135 58 10,506 82 47 9.102E+136 83 7,444 116 22 8.839E+137 100 15,583 152 48 1.211E+148 143 29,314 163 49 1.065E+149 47 4,840 18 5 3.42E+1310 105 12,891 333 53 1.003E+1411 97 9,434 70 14 1.554E+1412 156 21,321 181 32 1.285E+1413 59 8,671 25 9 1.225E+1414 59 12,669 31 11 8.239E+1315 249 11,064 182 33 1.657E+1416 54 10,954 9 9 1.444E+1417 110 8,395 19 5 2.46E+14
66 | P a g e
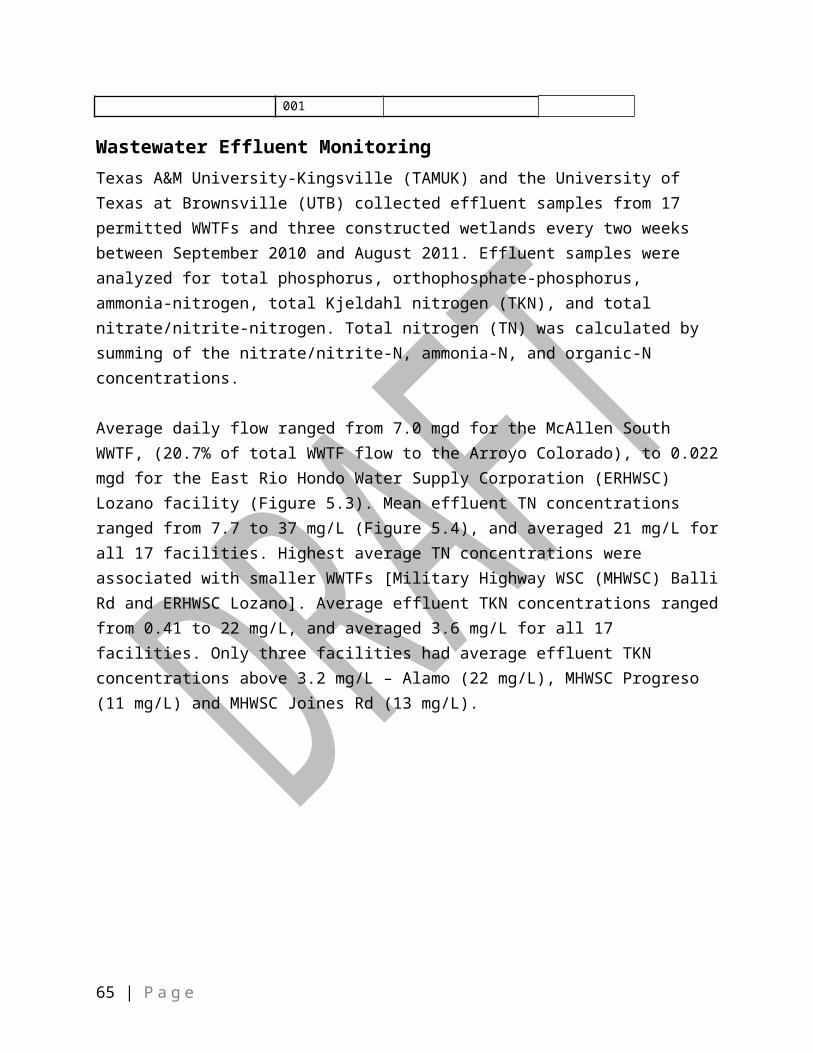
SedimentEstimated runoff/WWTF sediment concentrations were highest in sub-basins 8, 12, 13, 14, and 16 (Figure 6.3). Although the predominant source of loading varied by sub-basin, on the watershed scale, approximately 88% of the sediment loading resulted from cropland and rangeland erosion (Figure 6.2).
Figure 6.2: Predominant sources of sediment loads in the Arroyo Colorado watershed.
Figure 6.3: Estimated sediment concentrations by sub-basin.
67 | P a g e
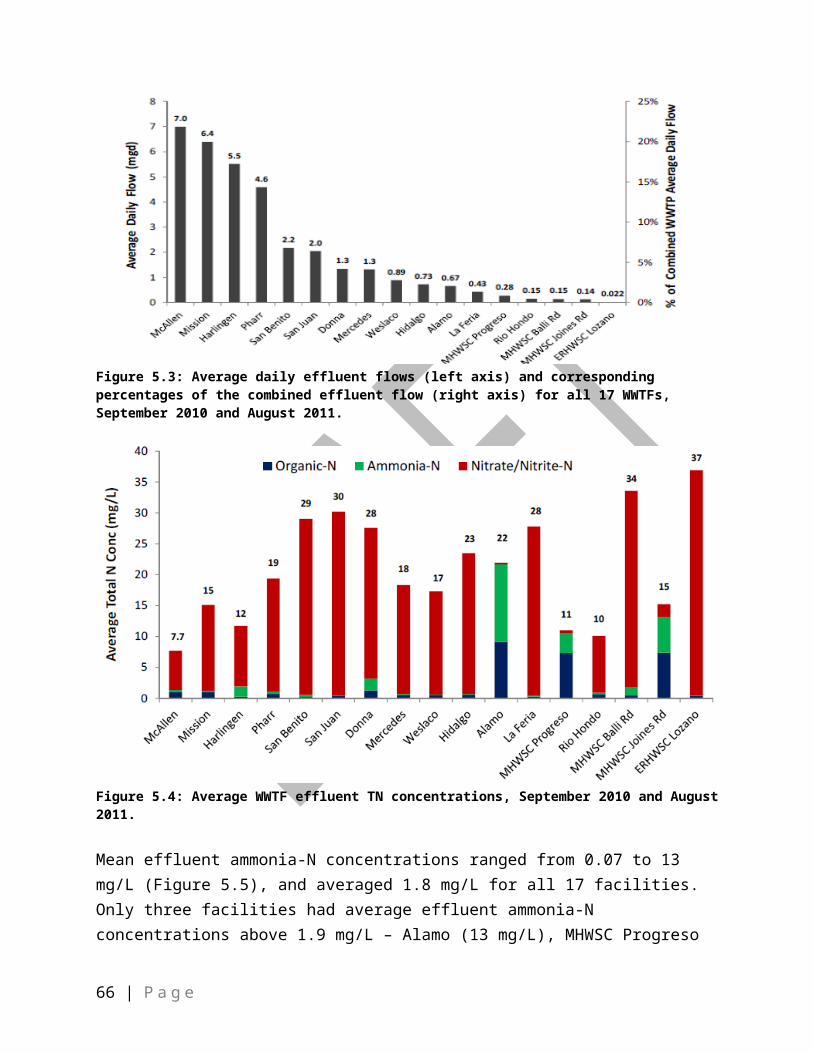
NitrogenEstimated runoff/WWTF total nitrogen concentrations were less than 10 mg/L throughout the watershed. Highest concentrations were found in sub-basins 2, 3, 8, 10, 12, and 14 (Figure 6.5). Although sources of nitrogen loads varied by sub-basin, cropland and point source discharges were estimated to contribute most (97%) of the total nitrogen loads (Figure 6.4).
Figure 6.4: Predominant sources of nitrogen loads in the Arroyo Colorado watershed.
Figure 6.5: Estimated total nitrogen concentrations by sub-basin.
68 | P a g e

PhosphorusEstimated runoff/WWTF sub-basin phosphorus concentrations were generally highest in the upper basin (sub-basins 2 and 3) and lowest near the coast (Figure 6.7). Sources of phosphorus loading varied by sub-basin; however, cropland and point source discharges were estimated to contribute most (99%) of the total phosphorus load (Figure 6.6).
Figure 6.6: Predominant sources of phosphorus in the Arroyo Colorado watershed.
Figure 6.7: Wastewater treatment plant outfalls and estimated total phosphorus concentrations by sub-basin.
69 | P a g e

E. coliE. coli loads were estimated at the sub-basin level to show the relative potential loading in each of the 17 sub-basins (Figure 6.9). Results of this assessment indicate that overall, E. coli loadings are highest in the lower sub-basins of the watershed (i.e. Cameron and Willacy Counties) and lowest in the upper reaches of the watershed. Dominant E. coli sources vary by sub-basin; however, SWAT estimates suggest that the primary sources of E. coli (Figure 6.8) are wildlife and OSSFs with smaller contributions from livestock (i.e. grazing land) and point sources (i.e. wastewater treatment facilities).
Figure 6.8: Primary E. coli sources estimated by SWAT.
Figure 6.9: E. coli loads by sub-basin as predicted by SWAT.
Bacterial Source Tracking AnalysisIn addition to SWAT modeling, bacterial source tracking (BST) was conducted along the main stem of the Arroyo Colorado to assess bacterial sources. BST can identify different strains of E. coli that have adapted to conditions in the guts of their specific animal hosts, resulting in strains that are specifically associated with that species or class of animals (e.g. avian and non-avian
70 | P a g e

wildlife, cattle, humans, etc.). Thus, BST allows the identification of likely human and animal sources of E. coli fecal pollution impacting a water body.
BST methods used for the Arroyo Colorado are automated ribosomal ribonucleic acid genetic fingerprinting (RiboPrinting) and enterobacterial repetitive intergenic consensus sequence polymerase chain reaction (ERIC-PCR). These tests generate DNA fingerprints resembling bar codes. RiboPrinting and ERIC-PCR are known as ‘library-dependent’ methods that require reference libraries of DNA fingerprints for E. coli isolated from known human, livestock, and wildlife fecal samples. The fingerprints of E. coli isolated from water samples are matched with the fingerprints in the identification library to identify the likely sources of fecal pollution. This composite method, referred to as ERIC-RP, has been successfully used for a decade in Texas.
Technical ApproachThe University of Texas – Rio Grande Valley collected 113 water samples from 10 sampling sites (Figure 6.10) between June 2014 and May 2015. Brownsville Public Utilities Board – Analytical Laboratory isolated E. coli from the 113 water samples using USEPA Method 1603.
Figure 6.10: Arroyo Colorado BST monitoring stations.
The University of Texas Health Science Center at Houston School of Public Health, El Paso successfully isolated E. coli from the modified mTEC plates for all 113 water samples and a total of 774 isolates (up to eight per sample) were archived. Up to five isolates per sample, for a total of 529 isolates from the 113 water samples, were analyzed with ERIC-PCR and RiboPrint composite (ERIC-RP) fingerprinting. Analysis of composite ERIC-RP DNA fingerprints was
71 | P a g e

performed using Applied Maths BioNumerics software. Genetic fingerprints of E. coli from ambient water samples were compared to fingerprints of known source E. coli isolates in the Texas E. coli BST library (ver. 5-15), which included 144 isolates from 99 known source fecal samples representing 19 distinct species collected from the Arroyo Colorado watershed, and the likely human and animal sources were identified. ERIC-RP composite patterns of water isolates were compared to the library using a best match approach and an 80% similarity cutoff (Casarez, Pillai et al. 2007). If a water isolate was not at least 80% similar to a library isolate it was considered unidentified. Although fingerprint profiles were considered a match to a single entry, identification was to the source class, and not to the individual animal species represented by the best match. When analyzing data for the entire watershed, source classes were divided into seven groups, 1) human; 2) pets; 3) cattle; 4) avian livestock; 5) other non-avian livestock; 6) avian wildlife; and 7) non-avian wildlife, including feral hogs. When analyzing subset data (e.g. individual stations), source classes were divided into three groups: 1) human; 2) domestic animals (including cattle, other non-avian livestock, avian livestock, and pets); and 3) wildlife (avian and non-avian).
Arroyo Colorado BST ResultsNinety percent of the 529 water isolates were identified using the Texas E. coli BST Library. Like the SWAT analysis, BST identified wildlife as the largest contributor of E. coli to the Arroyo Colorado (Figure 6.11). Given the rural nature of the watershed and isolation of the best wildlife habitat to riparian areas, this finding was not surprising. Nine percent of isolates were identified as human and 13% identified as domestic animals.
Figure 6.11: BST results for the Arroyo Colorado watershed (* indicate presence of cosmopolitan species).
All ten water sampling stations in the Arroyo Colorado exceeded the regulatory enterococci geometric mean standard of 35 MPN/100 mL during this study. All freshwater stations (13086, 13084, 13082, 13080, 13079, and 13074) were above the regulatory E. coli geometric mean standard of 126 MPN/100 mL during the study. Figure 6.12 presents E. coli BST results for each station. Results are presented as a 3-way split of sources (i.e., wildlife, domestic animals, and human), since 7-way splits typically need 80 or more E. coli isolates from each sampling station so that percent identifications are not greatly affected by very low numbers of isolates. Wildlife was the leading contributor at all stations. It should be noted that station 13559, one of the tidally
72 | P a g e
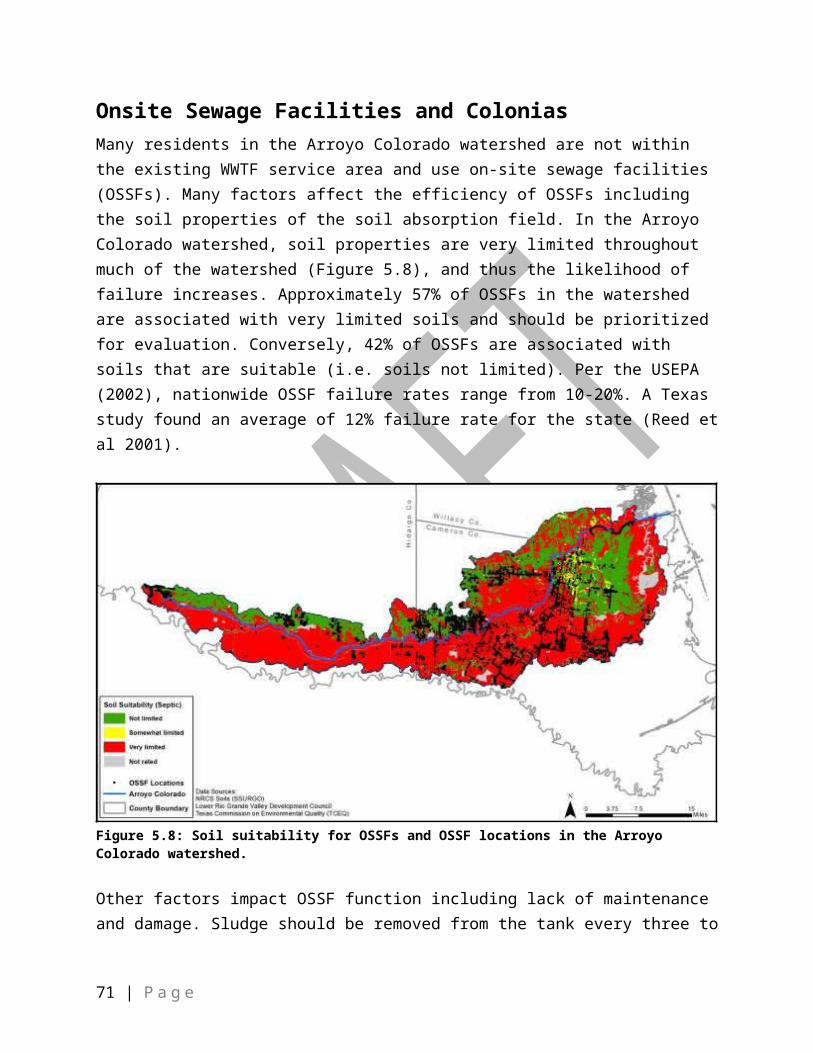
influenced stations, was only accessible for 7 of the 12 sampling dates, and had low E. coli counts when sampled, and so is only represented by 22 isolates.
Figure 6.12: Three-way split of E. coli BST results for each station as percent of isolates per sampling station.
Since there are a high number of OSSFs in the watershed including OSSFs in colonias , many of which are likely failing or not routinely maintained, the relatively low numbers of E. coli isolates identified as human derived was unexpected. Some known source E. coli isolates are considered “cosmopolitan” since they cross-identify with a known source isolate in another source class during self-validation or cross validation of watershed local libraries. However, in some cases these cosmopolitan isolates appear to be source specific during local watershed library self-validation, but do not pass cross validation between watershed libraries. Although they do not pass broader geographical and temporal scale specificity testing, at the local watershed scale they may be preferentially associated with a particular source class. Therefore, E. coli water isolates were also identified against the very small self-validated Arroyo Colorado local watershed library. Again wildlife was still the major contributor at all stations. In contrast, the human contribution increased from 12% to 21% for station 13086 and from 11% to 24% for station 13082, providing at least some indication of more significant human fecal pollution. Since human fecal pollution poses the greatest public health risk it is recommended that the areas surrounding the sampling stations be investigated further for potential human fecal pollution sources.
Changes in E. coli source identifications over the course of the study were also evaluated (Figure 6.13), although it should be noted that with only one year of data strong conclusions cannot be
73 | P a g e

drawn. There were no significant changes in the source distribution profiles, with wildlife the leading contributor with some minor fluctuations in domestic animal and human contributions.
Figure 6.13: Three-way split of E. coli source class identifications by month for all stations combined.
Discussion and ConclusionsSWAT modeling results indicate the predominant sources of nitrogen and phosphorus are cropland and point sources (i.e. wastewater plants) with highest levels being predicted in the uppermost reaches of the watershed. Increasing voluntary implementation of conservation measures to reduce nutrient runoff from cropland along with improving levels of wastewater treatment or reuse are needed to reduce instream nutrient concentrations and improve DO conditions.
SWAT results found that the predominant sources of sediment in the watershed are cropland and rangeland erosion with highest levels being predicted in sub-basins 8, 12, 13, 14, and 16 in the lower reaches of the watershed. Again, this points to the need for increased voluntary implementation of conservation measures on farms and ranches in the watershed.
SWAT modeling also suggests that, like sediment, E. coli loadings were highest in the lower reaches of the watershed, particularly sub-basins 1, 8, 10, 12, and 15. SWAT estimates suggest that the primary sources of E. coli are wildlife and septic systems with smaller contributions from livestock (i.e. grazing land) and point sources (i.e. wastewater treatment facilities).
74 | P a g e

Similarly, BST analysis indicated wildlife to be a major contributor of fecal pollution and E. coli bacteria throughout the watershed. It is important to remember that wildlife can include small mammals such as rodents, raccoons, opossums, and skunks, as well as waterfowl and other wild birds whose densities can be very high in riparian zones and are likely to have direct deposition of fecal material into waterways. These small animals may also contribute to fecal loading in urban runoff. Although rain events can greatly increase levels of E. coli in water, BST consistently identified wildlife as a major contributor for each month and station. Further, it should be recognized that conservation measures implemented in both rural and urban settings are effective means for reducing E. coli from wildlife.
Despite significant E. coli contributions from wildlife, human fecal pollution still poses the greatest human health risk. Although only 9% of the total water isolates from the BST study were identified as human derived using the Texas E. coli BST Library, there is some evidence based on use of the local watershed library that stations 13086 and 13082 may have more significant human pollution impacts. SWAT modeling results, which showed that 26% of the bacteria originated from OSSFs and WWTF, show this as well suggesting that solutions to failing OSSFs and sewage releases should be a priority to protect human health.
75 | P a g e

Chapter 7 – Watershed GoalsArroyo Colorado Partnership Mission Statement and VisionMission Statement - Reduce the additions of pollutants to the Arroyo Colorado to the maximum extent possible to meet state water quality standards and improve the natural terrestrial, riparian, and aquatic habitat associated with the Arroyo Colorado Watershed.
Vision - An ecologically sound Arroyo Colorado and LLM that is understood and valued by all residents of the LRGV.
Watershed GoalsWater quality goals establish the need to effectively implement the Arroyo Colorado WPP in the future and provide a basis for securing funds to implement this plan. Watershed stakeholders have established an overarching goal and sub-goals as targets to achieve in the short- and long-term to improve the health of the watershed. The long-term goal of the WPP is to achieve state water quality standards in the Arroyo Colorado by lowering pollutant loadings, enhancing streamflow and aeration, and restoring aquatic and riparian habitat through voluntary measures and existing regulatory controls. Specifically, the WPP seeks to ensure the Arroyo Colorado meets an average 24-hour DO concentration of 4.0 mg/L or above and a daily minimum DO concentration of 3.0 mg/L or above at least 90% of the time. For bacteria, the WPP seeks to meet an E. coli geometric mean less than 126 cfu/100 mL for the Non-Tidal segment and an Enterococcus geometric mean less than 35 cfu/100 mL for the Tidal segment.
To achieve these water quality goals, the partnership will: Encourage voluntary BMP adoption on an additional 35,000 acres of cropland (i.e. 75%
of cropland under a conservation plan), 10,000 acres of pastureland, and 7500 acres of rangeland,
Improve the quality of treated effluent from WWTFs, reduce SSOs, and where possible, encourage voluntary implementation of enhanced biological treatment projects to remove nutrients from WWTF effluent,
Increase wastewater and stormwater infrastructure development for rural and unincorporated low-income communities (i.e., colonias) in the Arroyo Colorado watershed,
Repair/replace 300 failing OSSFs and provide colonia residents and homeowners with OSSFs information on how to properly inspect, maintain and service their septic systems,
Pursue installation of 3 aeration structures (i.e. water falls) in the non-tidal segment Pursue installation and operation of 3-5 aerators in the zone of DO impairment, Encourage adoption of landscaping/Low Impact Development (LID)/Green Infrastructure
(GI)/Urban Forestry ordinances on new development and retrofitting of existing development
76 | P a g e

Reduce lawn fertilizer use by homeowners by 10% through education and outreach Reduce pet waste loading by 10% Focus Phase II Stormwater Management Programs for small MS4s on the pollutants of
concern in the Arroyo Colorado, Introduce and encourage alternative urban development designs and adding LID and
drainage policies to LID Code that help protect and restore water quality. Protect and restore valuable terrestrial habitat areas throughout the watershed, Protect and restore riparian areas, resacas, and freshwater and coastal wetlands, Protect, restore, and expand urban habitat and urban forestry, Continue to improve the awareness and understanding of the water quality issues
associated with the Arroyo Colorado, its connection to the LLM and the value both these natural resources bring to the communities of the LRGV,
Coordinate decision-making for the protection, restoration, and enhancement of the Arroyo Colorado and its watershed, and
Implement an Illegal Dumping campaign in cooperation with existing municipal, county, and Lower Rio Grande Valley Development Council (LRGVDC) Illegal Dumping programs.
77 | P a g e
Chapter 8 – Management MeasuresThe Partnership recommends the management measures described in this chapter to be implemented to meet water quality standards in the Arroyo Colorado.
AgricultureCropland is the predominant land use in the Arroyo Colorado watershed, accounting for approximately 52% of the watershed’s total land use. To reduce pollutant loading from cropland, state and federal governments have been working with local stakeholders to focus state and federal cost share and educational programs on cropland issues. The programs encourage and support the voluntary adoption of Resource Management Systems (RMS) and Water Quality Management Plans (WQMPs) by local landowners. RMS and WQMPs are site-specific plans that outline appropriate land treatment practices and a schedule for their implementation appropriate for each individual farm. The criteria established for developing them is contained within the USDA Natural Resources Conservation Service (NRCS) Field Office Technical Guide (FOTG).
The original WPP established a goal of encouraging the voluntary implementation and maintenance of conservation plans on 150,000 acres of irrigated cropland, or approximately 50% of irrigated cropland estimated in the watershed at that time, by 2015. At the end of 2015, a total of 130,000 acres of irrigated cropland were being managed under a WQMP.
The Partnership recommends continued focus of state and federal cost share and educational programs towards the voluntary adoption of RMS and WQMPs by local landowners. Additionally, to address livestock bacteria contributions, the Partnership recommends some additional BMPs. The main priority will still be establishment of management plans on cropland because of the relatively few livestock operations in the watershed as described in Chapter 5 and confirmed by stakeholders.
Since cropland is still the predominant land use in the watershed, addressing agricultural nonpoint source pollution is a priority but presents challenges. The cropland is spread out over three counties and extremely flat topography with differing soil types and a wide variety of row crops, citrus and vegetables being grown year-round. Due to the diffuse nature of nonpoint source pollution, a combination of BMPs is most commonly required to address nonpoint source pollution from agricultural operations (McFarland et al. 2015). When a producer decides to prepare a WQMP or RMS, the suite of BMPs selected for the plan is based on the overall goals of the agricultural producer and the physical and operational characteristics of the property. Each RMS and WQMP is tailored to the operation, which makes it difficult to calculate the extent of individual management measures for agricultural lands in the watershed. For a WQMP to optimize the water quality benefits of BMP implementation, management practices, which most
78 | P a g e

effectively reduce nutrients and bacteria from agricultural NPS runoff will be promoted and given top priority. Based on site-specific characteristics, plans should include a suite of three or more appropriate priority BMPs (Table 8.1 and 8.2) to reduce pollutant loads. These BMPs are currently part of Texas State Soil and Water Conservation Board (TSSWCB) and USDA-NRCS programs that provide technical assistance and may also provide financial assistance. Complementary BMPs can also be implemented and will produce positive production and environmental quality effects in many cases (Table 8.3). A complete description of these practices can be found at: http://www.nrcs.usda.gov/wps/portal/nrcs/detailfull/national/technical/cp/ncps/?cid=nrcs143_026849.
Table 8.1: Priority BMPs for Irrigated and Dry Cropland.
BMPCode
NumberBMP
Code Number
Crop Rotation 328 Pipeline* 430No Till 329 Irrigation Land Leveling* 464Cover Crops with No Till (329) 340 Precision Land Forming** 462Reduced Till 345 Cropland Conversion 512/550Filter Strip 393 Nutrient Management 590*Irrigated cropland only**Dry cropland only
Table 8.2: Priority BMPs for Irrigated Pasture/Hay Land and Rangeland/Wildlife.
BMPCode
NumberBMP
Code Number
Brush Management* 314 Prescribed Grazing 528ACover Crops 340 Range Planting 550Cross Fencing 382 Nutrient Management** 590Pipeline** 430 Watering Facility 614Land Leveling** 464 Wildlife Habitat Management*** 645Forage Planting** 512 Wetlands Enhancement*** 657*For Irrigated Pasture/Hay Land in conjunction with Forage Planting (512), Nutrient Management (590), and/or Range Planting (550)**Irrigated Pasture/Hay Land only***Rangeland/Wildlife only
79 | P a g e

Table 8.3: Other/Complimentary BMPs.BMP Code
NumberBMP Code
NumberHerbaceous Weed Control 315 Livestock Pipeline 516Irrigation Canal or Lateral 320 Structure for Water Control 587Contour Buffer Strip 332 Subsurface Drain 606Prescribed Burning 338 Tree/Shrub Establishment 612Critical Area Planting 342 Wildlife Water Facility 642Pond 378 Wetland Wildlife Habitat
Management644
Irrigation Field Ditch 388 Upland Wildlife Management
645
Grade Stabilization Structures 410 Shallow Water Management for Wildlife
646
Irrigation Water Conveyance 428 Constructed Wetland 656Irrigation Reservoir 436 Wetland Enhancement 657Irrigation System 441-443 Wetland Creation 658Irrigation Tailwater Recovery 447 Wetland Enhancement 659Irrigation Water Management 449
The Partnership developed recommended acreage goals for coverage under management plans (Table 8.4). Also, plans on 50,000 acres were in place prior to fiscal year 2006 and are in need of evaluation and possible update as the expected life for many practices is 5-10 years. Priority for management plan development will be placed on voluntary implementation of cropland and livestock practices in closest proximity to the impaired segment and in sub-basins identified as highest contributors and will progress outward from this area. Cropland acres will continue to be the highest priority with a goal of developing or updating management plans on 50,000 acres of irrigated cropland and 30,000 acres of dryland cropland.
Table 8.4: Goals for new and updated conservation plans for new 10-year implementation period.
LanduseTotalacres
Originalgoal (ac)
Current acunder plan
New goalacres (%)
Update plans>10 yrs old
Cropland 219,051150,000
(est. 50%)130,000 (59%)
165,000 (75%)
45,000
Pasture 24,805 NANA 10,000
(40%)
Range 48,867 NANA 7,500
(15%)Total ac 292,723 150,000 130,000 182,500 45,000
80 | P a g e

Based on an estimated average farm size of approximately 320 acres, to reach the new goal outlined above, will require an estimated 300 new or updated WQMPs or RMS to be developed over the 10-year implementation period, or 30 conservation plans per year. Based on average Environmental Quality Incentives Program (EQIP) contract costs in the LRGV of $30,000, full implementation will require $9M or $900,000/year.
Conservation Plan Development and ImplementationObjectives:
Work with agricultural producers/farmers and ranchers to develop WQMPs and RMS Provide producers with technical and financial assistance Implement and maintain WQMPs and RMS Reduce fecal loading from grazing livestock Reduce nutrient and sediment loading from cropland
Critical Areas: Sub-basins with highest nutrient and sediment loadings from cropland (i.e. 7, 8, 12, 15, along with 5, 6, 10 and 14) and farms in closest proximity to the impaired segments and their tributaries. Sub-basins with highest bacteria loadings (i.e. 1, 12, 15, 17) and nutrient/sediment loading (i.e. 8, 11, 13, 16) from range and pasture and ranches in closest proximity to the impaired segments and their tributaries.Goal: The voluntary implementation and maintenance of 300 additional WQMPs or RMS to bring the total number of acres under a conservation plan to 227,500 acres in the watershed Description: WQMPs will be developed, adopted and implemented in priority sub-watersheds and fields and pastures in closest proximity to the riverPotential Funding Sources: WQMPs: TSSWCB WQMP program, CWA §319(h) grant programRMS: NRCS EQIP programEducation: CWA §319(h) grant programImplementation StrategiesParticipation Recommended StrategiesSWCDs, NRCS, TSSWCB, Landowners
WQMPs - Develop, implement and provide financial assistance for 300 WQMPs and RMS at an estimated average cost of $30,000 per plan for a total cost of $9,000,000
Texas A&M AgriLife Extension Service
Education - Deliver education programs to producers throughout the watershed on BMPs and cost share programs available
Texas A&M AgriLife Extension Service
Lone Star Healthy Streams - Deliver Lone Star Healthy Streams programming to watershed landowners
Wastewater Treatment Facility PermitsGoals and milestones for the wastewater component of the original WPP were contained within the Pollutant Reduction Plan for the Arroyo Colorado (PRP). The PRP is an agreement between
81 | P a g e

local wastewater operators and the TCEQ to reduce the amount of pollutants from domestic and municipal wastewater entering the Arroyo Colorado to the maximum extent feasible. The management measures in the PRP included permit limits, extension of wastewater service, enhanced wastewater treatment, and wastewater reuse. The PRP identified load reduction measures for 17 municipal WWTFs. These facilities were the focus of the original WPP due to limited resources, and because these facilities accounted for over 95% of the total permitted point source loading to the Arroyo Colorado at the time the WPP was completed.
The first priority of the PRP was to eliminate permits that allowed 30 mg/L BOD and 90 mg/L TSS to be discharged in the Arroyo Colorado watershed by the year 2010. These types of permits, commonly referred to as 30/90 permits, represent the most basic treatment required of centralized wastewater treatment systems under the TPDES program. The second priority was to transition all facilities to treatment levels of 10 mg/L BOD and 15 mg/L TSS or lower by 2015. Since then, approximately $120 million has been spent upgrading these facilities from outdated, non-mechanical, lagoon treatment plants to modern mechanical plants. Currently only one 30/90 permit is still active in the watershed and 13 of 17 WWTFs are operating at 10/15/3 or better. Three facilities that have 20/20 permits have low flow limits of 0.51 mgd or less and two of these only receive wastewater from residential properties that were until recently using OSSFs for waste disposal. This has led to a significant decrease in loading to the Arroyo Colorado from the main sources of continuous flow. Table 8.5 compares historical permit limits based on the PRP versus the latest permit information from TCEQ’s database.
This plan update recommends continued work to achieve the management measure of the original WPP and PRP to transition the principal point source facilities to treatment levels of 10 mg/L BOD and 15 mg/L TSS by the year 2020 and then 7 mg/L BOD, 12 mg/L TSS, and 3 mg/L NH3-N by 2027. Of note, the city of Alamo has plans to add a new biological nutrient reduction plant to its existing facility. Potential funding sources for WWTFs to upgrade are the Texas Water Development Board’s (TWDB) State Revolving Fund (SRF), USDA Rural Block Development program, and local funds.
82 | P a g e

Table 8.5. Summary of municipal permit changes (Source: Arroyo Colorado PRP).
Facility NameTPDES
Permit No.2000 Flow and Effluent Set*
2005 Flow and Effluent Set*
2016 Flow and Effluent Set
City of Mission WQ0010484-001 (4.6) 10/15/3 (9) 10/15/2 (9) 7/15/2City of McAllen WWF #2 WQ0010633-003 (10) 10/15/2City of Hidalgo WQ0011080-001 (0.41) 30/90/NA (1.2) 10/15/3 (1.2) 10/15/3Military Hwy WSC (Balli Rd.)
WQ0013462-006 (0.51) 20/20/NA
City of Pharr WQ0010596-001 (5.0) 10/15/3 (8.0) 7/15/2City of San Juan WQ0011512-001 (1.15) 20/20/NA (4.0) 10/15/3 (4.0) 10/15/3City of Alamo WQ0013633-001 (2.0) 30/90/NA (2.0) 30/90/NACity of Donna WQ0010504-001 (2.7) 20/20/NA (1.8) 10/15/3City of Weslaco WQ0010619-005 (2.0) 10/15/3 (2.5) 10/15/3 (2.5) 10/15/3Military Hwy WSC (Progreso)
WQ0013462-001 (0.4) 30/90/NA (0.75) 10/15/3
City of Mercedes WQ0010347-001 (2.3) 10/15/3 (5) 7/15/2
City of La FeriaWQ0010697-
001/2(0.5) 30/90/NA (1.25) 10/15/3
Harlingen Water Works WWF #2
WQ0010490-003 (3.1) 20/20/NA (7.25) 10/15/3
City of San BenitoWQ0010473-002 WQ0014454-001
(2.16) 30/30/NA (2.5) 10/15/3 (3.75) 10/15/3
Military Hwy WSC (Lago) WQ0013462-008 No permit (0.5) 20/20/3 (0.5) 20/20/3City of Rio Hondo WQ0010475-002 (0.4) 20/20/NA (0.4) 20/20/NAEast Rio Hondo WSC WQ0014558-001 No permit (0.16) 10/15/3 (0.08) 10/15/3
* Flow is mgd and effluent set is BOD5/TSS/NH3-N reported in mg/L.
Sanitary Sewer OverflowsA sanitary sewer overflow (SSO) is a discharge of untreated or partially treated wastewater from a collection system or its components (e.g. a manhole, lift station, or cleanout). The original WPP and PRP didn’t include management measures for SSOs. During the process of updating this WPP, multiple meetings were conducted with WWTF representatives across the watershed. Many WWTF representatives identified SSOs as a problem for their collection systems. Some of the main reasons identified for SSOs were aging collection systems, improper installations, soil movement, and I/I. SSOs are reported to the TCEQ Regional Field Office in Harlingen. In fiscal year 2015, 126 SSOs associated with the Arroyo Colorado were reported. The average gallons per event was 7,642 with 4 events greater than 50,000 gallons. Many of the SSOs were due to excessive rainfall.
83 | P a g e
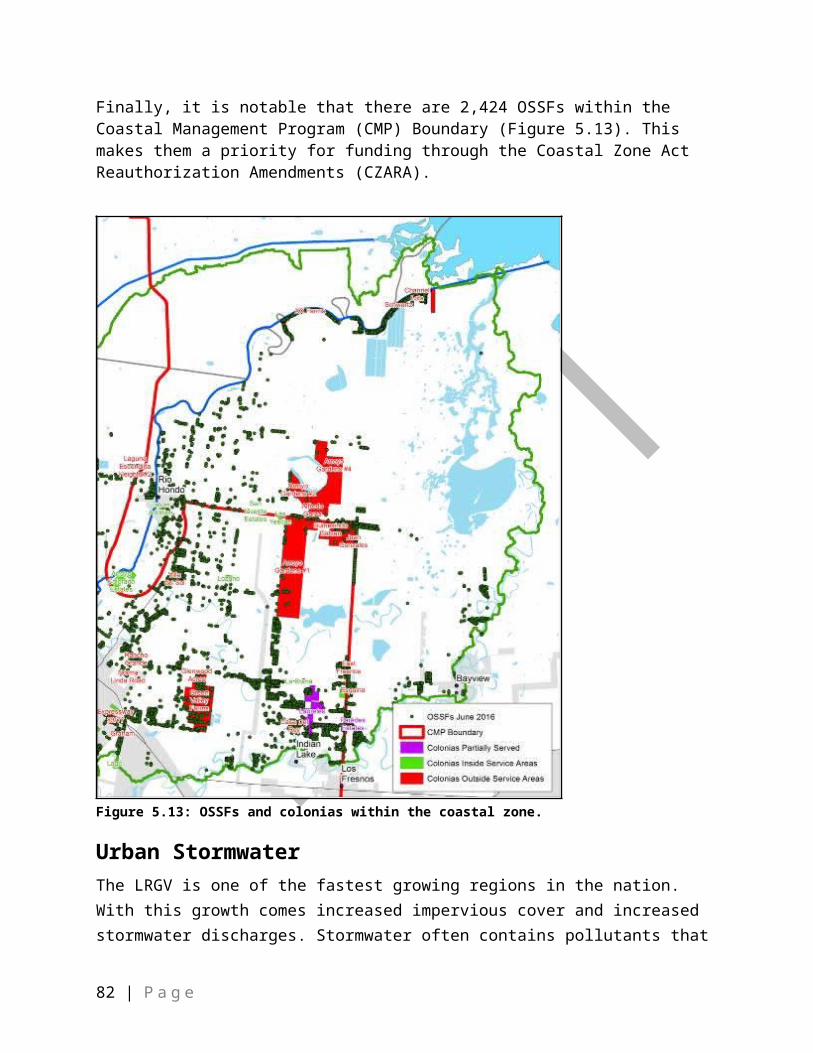
Collection SystemsAging wastewater collection systems were identified by many WWTF representatives as an issue within their service areas. Some reported encountering clay pipes that are brittle and broken in the oldest parts of the collection system. Some of the older parts of the collection system date back to the early 1940s. In many cases, these older portions of the collection system are not discovered until a repair has been made to another portion of the system and the additional pressure causes the older portion of the system to fail. The cities are working to eliminate the entire old and outdated infrastructure.
I/I was identified as a concern by many WWTF representatives and the cause of episodic releases of untreated wastewater due to system overload during flood events. I/I into a sewer system occurs when water, other than wastewater, enters the system. Infiltration can occur when groundwater enters the sewer system through defective pipe joints or broken pipes. Pipes may allow infiltration because of improper installation or because of damage due to differential ground movement, heavy vehicle traffic above the pipe, or degradation of the pipe materials. Infiltration will also occur where local groundwater elevation is higher than the sewer pipe. Water entering sanitary sewers from inappropriate connections is called inflow.
Typical sources of inflow include sump pumps, roof drains and sewer cleanouts in yards. Inflow tends to peak during storm events. Most WWTF representatives reported that many residents open their sewer cleanouts to drain stormwater from their property during and after storms that cause standing water in their yards, I/I during storm events can overload the system and cause untreated discharges of stormwater and wastewater. The increase of water to the system has a diluting effect and decreases treatment efficiency, and may cause sewage to exceed design capacity. Dilution of sewage directly increases the cost of pumping and chlorination or ultraviolet disinfection. I/I is a problem in the watershed due to the flat topography, high groundwater table and expansive clays throughout the watershed. The Table below summarizes the Partnership’s recommended management measures to address these issues.
84 | P a g e

SSO PlanObjectives:
Identify areas in collection systems where I/I or aging infrastructure is a problem Repair and replace failing collection system pipes and components Implement I/I prevention plan prior to storm events Educate homeowners about I/I
Critical Areas: WWTF Service Boundary AreasGoal: Reduce collection system sources of continuous and episodic releases of untreated wastewater into the Arroyo Colorado watershed.Description: Identify areas of the collection systems where issues are and set up schedule for repair/replacement. Repairs should be done during the driest times of the year when groundwater and stormwater are not a factor. Repairs can also coincide with routine scheduled maintenance or WWTF upgrades in order to eliminate dilution, exceedance of design capacity, and overflows.Potential Funding Sources: TWDB, USDA Rural Block Development program, local fundsImplementation StrategiesParticipation Recommended StrategiesWWTFs Mapping – Map remaining areas of sewer systems not yet mapped.WWTFs Local Studies – Conduct local studies and create databases, with a
geographic information component, based on complaints, service interruption, repairs and flood events identifying problem areas in the collection system.
WWTFs Repairs or Replacement – Identify oldest portions of collection system and areas with significant I/I, plan projects to repair or replace components. Coordinate repairs with WWTF upgrades when possible.
TBD Education and Outreach– Educational materials to educate homeowners on WWTF operations, proper maintenance of sewer cleanouts, and dangers of improper use of sewer cleanouts.
WWTFs/Cities Enforcement/Fines Program – Enforcement/fines for people using sewer cleanouts to drain stormwater from their property.
Sewer Blockages/Fats, Oil & GreaseFat, oil, grease & grit (FOGG) do not mix with water (are insoluble) and have a tendency to separate from a liquid solution. When FOGG is hot and in liquid form, it may appear to be harmless since it flows easily down the drain. However, as the liquid cools, the FOGG hardens and sticks to the sewer pipe creating layers of buildup that restrict wastewater flow or cause blockages that can result in overflows. This problem requires pipes to be cleaned more frequently or replaced sooner than expected. FOGG are natural by-products of the cooking and food preparation process. Common sources include food scraps, meat fats, cooking oils, lard,
85 | P a g e

baked goods, salad dressings, sauces, marinades, dairy products, shortening, butter and margarine, coffee grinds, eggshells, grain, rice, seeds, etc. Anything put through the garbage disposal adds to the buildup.
November 2015, Brownsville Public Utilities Board (BPUB) received a $25,000 grant from the Border Environment Cooperation Commission in support of the FOGG Outreach Campaign in Brownsville. The Partnership supports BPUB FOGG program and encourages other cities to adopt similar E&O programs.
TCEQ SSO InitiativeWWTFs are encouraged to participate in TCEQ’s SSO Initiative. The SSO Initiative is a voluntary program initiated in 2004 in an effort to address an increase in SSOs due to aging collection systems throughout the state and encourage corrective action before there is harm to human health and safety or the environment. The SSO Initiative is open to publicly owned permitted facilities and subscribers. The TCEQ, Region 15 office, verified that 2 facilities in the watershed are currently participating in the Initiative and a third facility has applied to the program. More information can be found at http://www.tceq.texas.gov/field/ssoinitiative.
Enhanced Wastewater Treatment and ReuseThe original WPP and PRP encouraged the voluntary utilization of enhanced treatment projects to reduce the loading of pollutants to the Arroyo Colorado using tertiary treatment mechanisms or post-treatment biological systems to polish treated effluent produced through conventional wastewater treatment. The enhanced treatment projects included:
Reuse of wastewater effluent through landscape irrigation, Effluent polishing pond systems, Small-scale, constructed wetland systems for enhanced wastewater treatment and Tertiary wastewater treatment using denitrification.
There have been many projects planned and completed relating to these management measures. Below is a list of the projects completed.
McAllen South– Currently reuses 432 Million Gallons per Year (MGY) to irrigate Cimarron Golf Course and WWTF. Plans to reuse 438 MGY by selling reclaimed effluent to two electrical energy generation plants located in Edinburg, Texas.
City of Pharr – Currently reuses 216 MGY for irrigating Los Lagos Golf Course and 60 MGY for irrigation at WWTF. Plans to increase reuse by 50% or by 108 MGY by installing R.O. treatment plant. Their long-term goal is zero discharge.
City of San Juan – Currently 74 MGY of wastewater effluent is diverted to a constructed wetland and for irrigation at the WWTF.
City of Weslaco – Currently reuses 401 MGY to irrigate Tierra Santa Golf Course
86 | P a g e

City of La Feria – Currently 24 MGY of wastewater effluent is diverted to a constructed wetland and for irrigation at WWTF.
City of Harlingen – Currently reuses 551 MGY for irrigating Treasure Hills Golf Course and Harlingen Soccer Complex. Plans to increase reuse by 50% or by 275 MGY by selling reuse water to an energy generation plant. Their long-term goal is zero discharge.
City of Harlingen – Currently 1 MGY of wastewater effluent is diverted to a constructed wetland at Hugh Ramsey Nature Park
City of San Benito – Currently 49.2 MGY of wastewater effluent is diverted to a 4-acre constructed wetland and used for irrigation at the WWTF. Plans to increase reuse by 880 MGY.
Part of the reason these management measures have been well received are the many incentives for municipalities to complete these types of projects. Constructed wetlands have an ecotourism aspect and reuse of wastewater can offer another option for irrigation, especially during times of drought, thus saving money by eliminating the need to find other water resources.
Reuse of wastewater continues to gain acceptance among stakeholders within the watershed. During the development of this update, multiple WWTF representatives indicated intentions to reuse wastewater. The original WPP recognized the reuse of effluent as a viable option for reducing the amounts of pollutants entering the Arroyo Colorado as long as instream water needs for aquatic life are considered. The Rio Grande (Region M) Regional Water Plan approved by TWDB in 2016, states that inflows from the Arroyo Colorado are critical to the ecological health of the Laguna Madre estuary, which is both economically and ecologically important to the region (RGRPG 2016). In 2012, the BBEST team determined that freshwater inflows from the Arroyo Colorado exceed “natural” inflows and are dominated by municipal and agricultural returns resulting in high nutrient loading. The BBEST team recommended that stakeholders and agencies explore strategies to reduce wastewater flows and nutrient loading to the LLM. Enhanced wastewater treatment and reuse are two strategies that are already being implemented in the watershed and are consistent with the BBEST recommendations. During the next 10-year implementation period, the Partnership will continue to monitor and evaluate the effects wastewater reuse is having on instream water quality and aquatic habitat.
This update continues to encourage the adoption of these types of projects identified in the original WPP and PRP. Some potential funding sources include: TWDB, CWA §319(h) grant program, and local funds. Below is a list of the projects currently planned. The Partnership also supports projects within the original WPP and PRP that have yet to be completed.
San Benito WWTFThis project consists of diverting treated effluent into an abandoned lagoon pond system for tertiary treatment. Phase I was completed in 2009 and diverted effluent into 4 abandoned ponds
87 | P a g e

covering approximately 5 acres. Phase II will convert 10 additional abandoned lagoon ponds into constructed wetlands and cover approximately 11 acres. Phase III will convert 3 abandoned settling ponds into approximately 65 acres of deep water wetland habitat.
Ramsey ParkRamsey Park is located on the banks of the Arroyo Colorado and makes up a portion of the World Birding Centers in the LRGV. The city of Harlingen owns and operates the park, which contains four wetland ponds. The city connected their WWTF to the park to transfer treated effluent to the wetland ponds. In 2014, the Texas Water Resources Institute (TWRI) and the city of Harlingen were awarded a Coastal Impact Assistance Program (CIAP) grant to expand the wetlands in the park and rebuild the parking lot. The City also constructed a bio-retention basin in the parking lot to capture stormwater from the parking lot and planted native plants in the bio-retention basin and wetlands to provide wildlife food and habitat.
Harlingen WWTFThe city of Harlingen is planning to build a constructed wetland adjacent to its WWTF to treat effluent before it enters the Arroyo Colorado. A secondary aspect of the project is to divert water directly from the Arroyo Colorado into the wetland to reduce nutrients and sediment. Harlingen WWTF has initiated a reuse program where treated effluent is used to irrigate landscaping at municipal buildings, a soccer complex, Treasure Hills Golf Course and Ramsey Park. Zero discharge of WWTF effluent is the city’s ultimate goal.
Pharr WWTFThe city of Pharr plans to build a large impoundment to store treated effluent for use in times of severe drought. Construction of a Reverse Osmosis facility to further treat the effluent and later blend it into the public water supply during severe drought is also being planned. Treated effluent is being used for landscape irrigation at municipal buildings, all city parks and Los Lagos Golf Course.
Onsite Sewage Facilities and ColoniasThe original WPP and PRP identified extension of wastewater service to colonia residents as a top priority. Substantial progress towards achieving this goal has occurred. Since the original WPP was developed, wastewater treatment service has been provided to 17,054 residents from 42 colonias; however, additional colonias within and near WWTF service area boundaries remain without service. There are 278 colonias in the watershed, 183 of them are within estimated WWTF service boundaries, and 3 are partially served; however, not all colonias within the WWTF service boundaries receive service. This is due to several factors; many of the homes in colonias were constructed by the residents themselves and may not meet the city or county requirements needed to be connected to the wastewater system, many residents may not want to
88 | P a g e

be connected because of financial reasons, and residents may not want any disruptions associated with connecting the household to the system.
The Partnership recommends continuing efforts to provide service to colonia residents within the watershed, especially in densely populated colonias with small lot sizes not suitable for OSSFs (See Figures 5.12 and Table 5.4). Additionally, the Partnership recommends extending wastewater service to residents with OSSFs outside of classified colonias in densely populated areas (See Figure 5.10). Subdivisions and colonias in closest proximity to the Arroyo Colorado should be given higher priority due to a higher likelihood of pollutants getting to the stream. Potential funding sources for extension of service projects include TWDB, USDA Rural Block Development Program, and local funds.
The following three tables outline management measures to limit the amount of pollutants entering the Arroyo Colorado from OSSFs. They consist of conducting an OSSF inventory and developing a database, Education and Outreach for OSSF owners, inspection and replacement of OSSFs and extension of WWTF service to high density OSSF areas.
89 | P a g e

OSSF Inventory and Database PlanObjectives:
Develop watershed-wide OSSF database for information tracking Obtain County Health Department OSSF databases and information Identify all OSSFs within the watershed Utilize database for prioritization of repair/replacement funding, etc. Update estimated WWTF service area boundary GIS layer
Critical Areas: Entire watershed with priority given to colonias and OSSFs within 1-5 miles of the Arroyo ColoradoGoal: Development of a database useful for parties involved with OSSF and colonia tracking and useful for prioritization of areas in need of assistance.Description: Work with cities, WWTFs, colonias, designated representatives (DRs), and other entities to identify all OSSFs. Use 911 addresses outside estimated service area boundaries and County Health Department databases as a starting point. Develop a database with specific attributes for tracking information. WWTF service area boundary GIS layer will be updated every few years. Potential Funding Sources: TWDB, USDA, CWA §319(h) grant program, Local fundsImplementation StrategiesParticipation Recommended StrategiesCounties Inventory all OSSFs within the watershed and develop an OSSF databaseTBD Update estimated WWTF service area boundary as neededTBD Obtain sewer line GIS layers from all WWTFs and combine into watershed-
wide GIS layer. Update layer as needed.
90 | P a g e

OSSF Education, Inspection, and Replacement PlanObjectives:
Identify and inspect failing OSSFs in the watershed Determine priority areas for OSSF repair and replacement Repair or replace OSSFs as funding allows Provide education and outreach to colonia residents, OSSF owners, installers and
maintenance providers on the proper selection, design, installation, operation and maintenance of OSSFs.
Critical Areas: Colonias and OSSFs in closest proximity to the Arroyo Colorado particularly those in sub-basins 10, 12, 15, 1, 8, and 17.Goal: To provide education and outreach to colonia residents and watershed landowners who own and operate OSSFs. Utilize available funds to inspect, repair, and replace 300 failing OSSFs (i.e. approximately 10% of those estimated to be failing), especially those in critical areas within 5 miles of the Arroyo Colorado. Description: Deliver education and outreach to OSSF owners outlining proper OSSF installation, operation, inspection, maintenance, and repair procedures. Provide information regarding available resources to assist them with OSSF repair or replacements.Potential Funding Sources: TWDB, USDA, CWA §319(h) grant program, local fundsImplementation StrategiesParticipation Recommended StrategiesCameron, Hidalgo, Willacy Counties
Inspect/repair/replace or pump out OSSFs as funding allows
TWRI Coordinate with TWRI Coastal Zone Act Reauthorization Amendments (CZARA) contract with TCEQ 319 NPS Program to provide OSSF maintenance training for residents and possible repair/replacement of failing OSSFs within the Coastal Management Boundary.
TWRI Coordinate with DRs and TCEQ 319 NPS Program to provide OSSF maintenance training for residents and possible repair/replacement of failing OSSFs within the Arroyo Colorado watershed.
Texas A&M AgriLife Extension
Deliver education and outreach events:1) homeowners and landowners2) installers, maintenance providers, sludge haulers
91 | P a g e

Connect Colonias and High-Density OSSF areas to WWTFs Objectives:
Identify colonias and high-density OSSF areas where WWTF service will generate significant reduction in environmental pollutant loading
Coordinate with WWTFs to determine feasibility of service extension to identified priority areas
Facilitate construction of wastewater infrastructure to priority areas and residencesCritical Areas: Colonias and high-density OSSF areas in closest proximity to the Arroyo Colorado and in close proximity to existing WWTF service areas.
- Arroyo City along the tidal segment- Southern portion of the city of Alamo and areas south of the city- Area west of Harlingen- Area south of Palmview
Goal: Provide WWTF service to colonia residents with little or no current wastewater treatment capacity and connect homeowners with ineffective OSSFs in high-density clusters to WWTFs. Description: Work to identify colonias and areas of high-density OSSFs were sufficient wastewater treatment is not provided. Extend WWTF service to these areas and connect residences to the system. Potential Funding Sources: TWDB, USDA Rural Block Development Program, local fundsImplementation StrategiesParticipation Recommended StrategiesTWRI Coordinate with DRs, colonia representatives, WWTFs and others as
appropriate to identify colonias and high-density OSSF areas were WWTF service is needed to improve wastewater treatment efficiency
TWRI, WWTFs
Determine areas where WWTF system extension and sustained service is feasible
WWTFs Extend WWTF service areas and connect colonia residents and high-density OSSFs to expanded system
OSSF Permitting and InspectionsAuthorized Agents (AA) are responsible for issuing OSSF permits, conducting inspections and investigating complaints. The Cameron and Hidalgo County Health Departments are the AAs within their respective counties. However, some cities are the designated AA within their city boundaries. To identify the appropriate AA visit this webpage https://www6.tceq.texas.gov/oars/index.cfm?fuseaction=search.county. The TCEQ regional office in Harlingen assists the AAs with overseeing their OSSF Programs. The CZARA Program also conducts inspections, repairs, and replacements of OSSFs within the CMP Boundary (Figure 5.13). The Partnership will work with the AAs to obtain a list of existing permits and both the
92 | P a g e

AAs and the CZARA Program to determine the number of inspections, repairs, and replacements conducted in the watershed in order to track progress in meeting WPP goals. Table 8.6 contains a list of the main OSSF contacts.
Table 8.6: OSSF Contacts for WPP OSSF Tracking.Organization ContactHidalgo County Health & Human Services, Environmental Health Division
Ruben Hernandez1304 S. 25th Avenue, Edinburg, TX 78539 (956) 383-0111/0112
Cameron County Health Department Gus Olivarez1390 W. Expressway 83San Benito, Texas 78586(956) 247-3607
Willacy County Permits Department Amos Prado576 W. Main AveRaymondville, Texas 78580 Office (956) 689-3393
CZARA OSSF Program Ryan [email protected](979) 458-4185
TCEQ Regional Office – Harlingen 1804 W Jefferson AveHarlingen, Texas 78550-5247(956) 412-5059
HabitatHabitat preservation and restoration is a primary concern for Arroyo Colorado stakeholders. A well-functioning ecosystem provides pollutant filtration, landscape stability, and stormwater mitigation, especially in riparian areas. While the Arroyo Colorado watershed is a highly modified watershed, low impact development practices and filter strips can minimize environmental impacts where development or land clearing is necessary.
The original WPP specified a multifaceted strategy that involved wetland construction, conservation and restoration of existing riparian and wetland habitats, preservation of natural areas, and reduction of channel and stream bank erosion. Original action items included:
Action 1 - Support ongoing efforts of federal, state and local agencies and other organizations to implement terrestrial habitat conservation objectives in the Arroyo Colorado watershed through partnerships and funding
Action 2 - Protect and restore existing riparian areas, resacas and freshwater wetlands
93 | P a g e

Action 3 - Work with drainage districts to modify drainage ditches and maintenance practices to reduce channel and stream bank erosion
Action 4 - Participate with IBWC during development of Arroyo Colorado maintenance and new work projects. Representatives of the Partnership could serve in advisory capacities to assist in the development of pilot channel configurations with banks that are less steep and that can support vegetation such as riparian woodland plants or native prairie grasses
Action 5 - Develop partnerships with the IBWC, drainage districts, and private landowners to implement blank/slope stabilization projects in hot spots along the Arroyo Colorado or in drainages within the watershed
Action 6 - Implement projects that detain stormwater runoff, reduce sediment load and reduce runoff volume and velocity in drainage ditches and the Arroyo Colorado
Action 7 - Support ongoing and increased use of vegetated filter strips around agricultural production and urban development areas to slow stormwater runoff from these areas
Action 8 - Implement stormwater wetland systems in urban developments, redevelopments and agricultural production areas to reduce NPS pollutant loading to the Arroyo Colorado
Action 9 - Build constructed wetlands for tertiary treatment of waste streams from individual WWTFs and/or for polishing flows from multiple WWTFs in close proximity with habitat features when feasible
Action 10 - Construct large off-channel treatment wetlands that treat flows from multiple sources including WWTFs and NPS runoff from urban and agricultural areas
The Partnership will continue to implement these action items. Actions one and two are particularly important. Acquiring conservation easements through the purchase or donation of development rights within the Arroyo Colorado watershed, especially riparian areas, can protect sensitive areas of the watershed from development. Easements allow landowners to retain ownership of their land while agreeing to leave it in its natural state for perpetuity. Conservation easements do not imply, nor provide for public access to these lands. Land can also be purchased and managed for its protection by a conservation organization or public entity. Agencies and organizations that assist with acquiring conservation easements include:
USFWS Laguna Atascosa National Wildlife Refuge: includes area of land along the shores of the Arroyo Colorado from the current refuge boundaries to the POH
USFWS LRGV Wildlife Refuge: Cameron, Hidalgo and Willacy counties TPWD Private Lands Enhancement and Landowner Incentive Program Valley Land Fund Nature Conservancy NRCS via the Farm and Ranch Lands Protection Program
94 | P a g e

Urban StormwaterThe rapid urbanization in the LRGV is increasing urban runoff and pollutant loading. This section presents the Arroyo Colorado Partnership’s plan and BMPs to address urban stormwater.
Separate Storm Sewer SystemsA “separate storm sewer system” includes ditches, curbs, gutters, storm sewers, and similar means of collecting or conveying runoff that do not connect with a wastewater collection system or treatment plant. A “Municipal Separate Storm Sewer System” (MS4), is a system owned or operated by a public agency such as a city, county, or municipal utility district. MS4s that are located within UAs defined by the U.S. Census Bureau (Figure 5.14) are required to obtain coverage under the Texas Pollutant Discharge Elimination System Phase II General permit.
Areas covered under the Phase II small MS4 system regulations are based on total population and population density. Urban areas with populations of 10,000 or more and population densities of 1,000 per square mile are designated UAs requiring coverage under a TPDES stormwater permit. Under the TPDES Stormwater Program for small MS4s, operators of regulated small MS4s are required to design and implement a SWMP that:
- Reduces the discharge of pollutants to the “maximum extent practicable”,- Protects water quality, and- Satisfies the appropriate water quality requirements of the CWA
When the original WPP for the Arroyo Colorado was being finalized, the TCEQ was in the process of issuing a final general permit for regulated small MS4s. Since then, the regulated MS4s have developed SWMPs and received coverage under the general permit. The entities under this permitting program have been increasingly investing local resources to comply, leading to pollutant load reductions to the Arroyo Colorado. It is important to mention that the TPDES program is considered by local entities as an “unfunded mandate”, where all the regulated entities do not receive Federal or State funds to develop and operate an SWMP and control the discharges in the MS4s.
Table 8.7 lists the Separate Storm Sewer Systems that are within the Arroyo Colorado watershed. These entities are committed to implementing this WPP.
95 | P a g e

Table 8.7: Separate Storm Sewer Systems within the Arroyo Colorado watershed.System Department Contact AddressCity of Alamo Stormwater
ManagementErnesto Solis(956) 787-0006 x [email protected]
420 N Tower RoadAlamo, TX 78516
City of Alton Public Works Rudy Garza(956) [email protected]
509 S. Alton Blvd.Alton, TX 78573
City of Brownsville
Public Works Jose Figueroa(956) [email protected]
6035 Jaime J. Zapata Ave.Brownsville, TX 78521
Cameron County
Department of Transportation
Paolina Vega, P.E.(956) [email protected]
1390 West Expressway 77San Benito, TX 78586
Cameron Co. Drainage District #1
N/A Albert Barreda(956) [email protected]
3510 Old Port Isabel Rd.Brownsville, TX 78526
Cameron Co. Drainage District #3
(956) 399-7637 26041 FM 510San Benito, TX 78586
Cameron Co. Drainage District #5
Alan Moore(956) 423-6411
301 E Pierce AveHarlingen, TX 78550
City of Donna Code Enforcement
Roy Jimenez(956) 464-3314/[email protected]
307 S. 12th StreetDonna, TX 78537
City of Edinburg
Engineering Department
Omar Cano, P.E.(956) [email protected]
415 W. University Dr.Edinburg, TX 78539
City of Harlingen
Environmental Services (Stormwater Division)
Omar Rios (956) [email protected]
502 E TylerHarlingen, TX
City of Hidalgo Utilities & Public Works
Ruben Puente(956) 843-2286 x3020
704 E. TexanoHidalgo, TX 78557
Hidalgo County Environmental Compliance Division
(956) 318-2840 1304 South 25th St., Edinburg, TX 78539
City of La Feria Planning Paula Rodriguez(956) [email protected]
115 E. Commercial AvenueLa Feria, TX 78559
96 | P a g e

System Department Contact AddressCity of La Joya Water Isidro Venecia
(956) 581-7002 [email protected]
101 N. Leo AvenueP.O. Box HLa Joya, TX 78560
City of Los Fresnos
Public Works Mark W. Milum, City Manager(956) [email protected]
200 North Brazil StreetLos Fresnos, TX 78566
City of McAllen Environmental Services
Dalilah Martinez(956) [email protected]
4101 N. Bentsen RoadMcAllen, TX 78504
City of Mercedes
Public Works Arturo Garcia(956) 565-6147
2314 N. FM 491Mercedes, TX 78570
City of Mission Public Works Juan De La Garza (956) [email protected]
1201 E. 8th StreetMission, TX 78572
City of Palmview
Code Enforcement
David [email protected]
400 West Veterans Blvd.Mission, TX 78572
City of Palm Valley
Public Works Rosendo Flores(956) [email protected]
1313 N Stuart Place RdHarlingen, TX 78552
City of Pharr Environmental Education Coordinator
Grace Gonzales(956) 402-4310
1015 E. Ferguson Ave.Pharr, TX 78577
City of Primera City Administration
Javier Mendez, City Manager(956) [email protected]
22893 Stuart PlacePrimera, TX 78552
City of Rio Hondo
Public Works Jose Perea(956) [email protected]
121 N. Arroyo Blvd.PO Box 389Rio Hondo, TX 78583
City of San Benito
Code Enforcement
Roberto Valenzuela(956) 361-3804 ext [email protected]
400 North Travis StreetSan Benito, TX 78586
City of San Juan Planning Xavier Cervantes(956) [email protected]
709 S. NebraskaSan Juan, TX 78589
Texas Department of Transportation
Environmental Affairs
Carlos Swonke(956) 702-6100
600 W. US Hwy 83Pharr, TX 78577
City of Weslaco Engineering Israel Gaona(956) [email protected]
255 S. KansasWeslaco, TX 78596
97 | P a g e
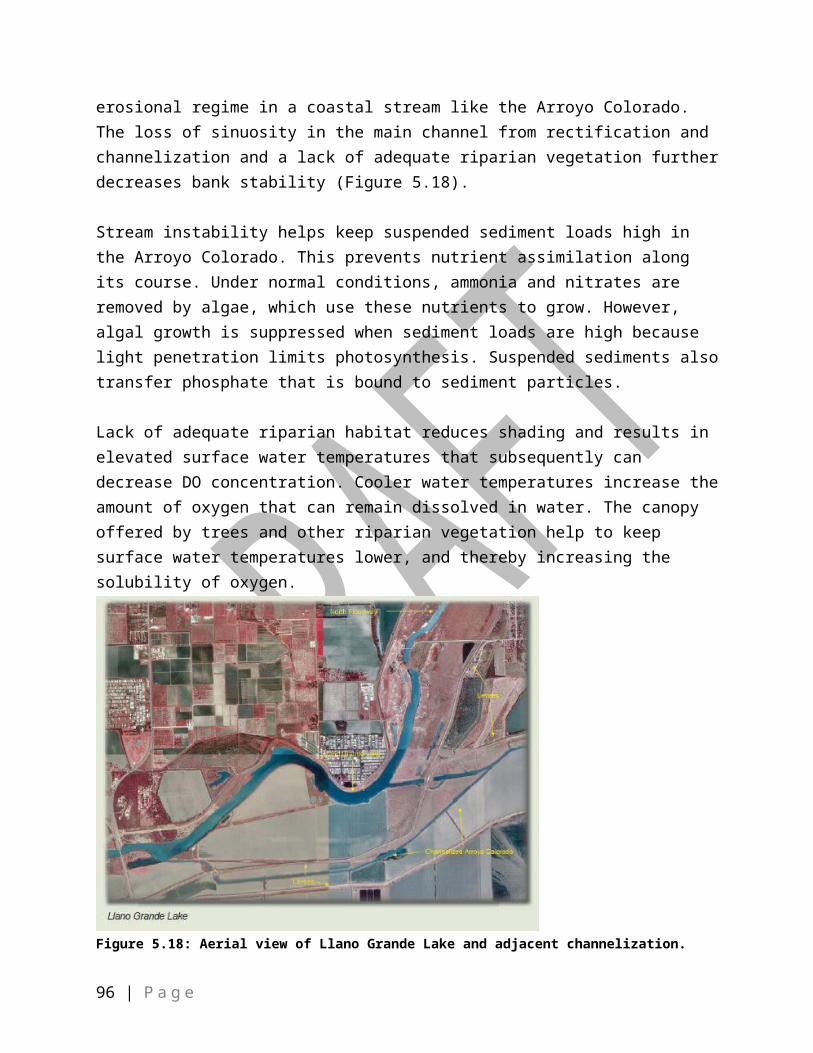
The original WPP recommended that SWMPs for UAs in the Arroyo Colorado watershed be consistent with the goals of the WPP and that information and resources be shared between the Partnership and regulated MS4s in order to achieve mutually beneficial goals. The Partnership and regulated MS4s have worked together to achieve this measure and will continue to work together in aligning their SWMPs with the goals of this update.
Stormwater Task ForceIn 2002, many regulated MS4s in the LRGV saw the need to collaborate and share resources regarding urban stormwater issues within the area. As a result, the Stormwater Task Force (SWTF), in partnership with TAMUK, was formed. The Task Force was the vehicle by which the regulated entities developed an umbrella SWMP for SWTF member MS4s. The SWMP for the first TPDES MS4 permit cycle was approved by the TCEQ in 2007; the second cycle permit was approved in 2013. The Task Force continues to thrive and has expanded its efforts beyond MS4 compliance.
The SWTF, as a regional organization, has served the LRGV communities as an “institutional memory” and knowledge/training hub for all its members. At a municipal level, it is common to observe leadership changes (e.g. moving the stormwater management from public works to planning) and/or stormwater personnel loss. The SWTF minimizes the burden (technical and financial) the municipalities have to bear to train new employees. Continuing to support these kind of regional/watershed-based initiatives will be key to increasing the understanding, characterization and minimization of the stormwater NPS pollution.
The SWTF is developing a separate planning document that will expand on the BMPs proposed within this section.
In 2016, the SWTF initiated the implementation of a transition plan that entails moving the multi-MS4-organization from TAMUK to the University of Texas Rio Grande Valley. (UTRGV). The SWTF mission remains unchanged and it will continue to function as it has for the last 15 years. It is important to mention TAMUK will maintain its involvement with water quality issues in the Arroyo Colorado and the LRGV as it becomes a member of the SWTF.
Interconnected SystemIn the LRGV as in most areas, stormwater drainage systems are separate from the wastewater transport systems, but often infiltration can occur from damaged pipes and tree root intrusions. Stormwater drainage systems are a series of interconnected roadside ditches, underground pipes and culverts, and major collection ditches and drains that channel rainfall runoff directly into tributaries and then to the Arroyo itself. Curb and gutter systems carry runoff into the curb inlets, which channels the water into retention systems, ponds, and underground pipes, leading to larger culverts and ditches.
98 | P a g e

Agricultural runoff can also contribute some flows into these systems from poorly designed drainage systems and tile drains or overflows and flood events. Thus, the interconnection of these systems creates challenges but also opportunities to improve the management of NPS pollution in the watershed. Improved mapping and management of these system interconnects, drainage slopes and pre-treatment BMP approaches will be needed to provide enhanced stormwater management and control to better manage these flows into the Arroyo.
Stormwater DrainageCharacterization of urban stormwater is a multi-tiered process that is important to understanding the quantity and quality of the stormwater entering the Arroyo Colorado. The first step in the process is gathering information concerning systems so that accurate drainage and subwatershed maps can be generated and subsequent hydrologic/flood models built from this information. Once sufficient mapping and monitoring information is gathered modeling of MS4 systems can be developed (including new development, extreme weather events, emergency situations, etc). The terrain in the watershed is very flat, and the watershed includes a complex manmade drainage and irrigation network, which in and of itself presents a challenge to understand drainage patterns. Some of the MS4s in the watershed have already completed this initial step or are in the process of completing. However, some MS4s may lack the resources necessary to gather or identify this information. In addition, many stormwater personnel wear multiple hats and may not have adequate time or personnel to devote to stormwater issues. These MS4s may need additional resources and/or assistance in completing this initial step. These MS4s may benefit from a region-wide effort to equip them with the GIS tools/capabilities to better characterize their stormwater system and plan for future development.
Drainage Boundary RefinementSince the topography of the region is predominantly flat, it is relatively easy to modify the watershed while building gravity flow infrastructures such as an MS4. The SWAT model was used to delineate the boundaries of the watershed. However, during the process of this update stakeholders raised concerns regarding the accuracy of the boundary in some areas. Additional areas, primarily urban, along the northern boundary likely drain to the Arroyo Colorado. Based on meetings and conversation with MS4 operators, it is believed that Interstate Highway 2 (Expressway 83) may be the actual northern boundary of the watershed from around Pharr to Weslaco. In addition, available City of McAllen drainage maps indicate that a significant portion of the city north of the watershed boundary drains to the Arroyo Colorado. The Partnership recommends that a detailed study of the watershed drainage be conducted prior to the next update of this WPP and incorporated into modeling updates.
99 | P a g e

MonitoringThe next step is to conduct monitoring of the stormwater system and determine/evaluate sources of input. Several cities have indicated that they conduct visual monitoring of systems and outfalls. The City of McAllen collects quarterly grab samples from some of the outfalls within their stormwater system. Samples are analyzed by their water laboratory for several parameters including E. coli. MS4s are encouraged to develop routine monitoring programs of their systems and share this information with the Arroyo Colorado Partnership for assessment of effectiveness of this WPP and for input into future Arroyo Colorado watershed models. Of note, the SWTF has plans to establish a regional monitoring program to assess existing water quantity and quality conditions and then evaluate effectiveness of BMPs.
New monitoring strategies and approaches to analysis are needed as the watershed transforms from rural and agricultural land into more urbanized centers. Resources are limited for monitoring and evaluating so key representative projects and strategies are needed. More efficient and creative methods to collect, analyze and coalesce critical data for decision makers are needed. Examples may include using simpler measurements such as volatile suspended solids (VSS) and other surrogates for bacteria sampling, holding time variations in results, uncertainty metrics, and others.
There is also a need for modeling tools for subwatershed analysis and BMP optimization including WinSLAMM for small interconnected areas, U.S. EPA’s SUSTAIN model for subwatershed BMP geospatial optimization, economic models and others with outputs that can be integrated into the watershed’s larger scale SWAT model. Gathering the data needed for initializing and calibrating these models to help decision makers and water planners should be a priority.
Urban Stormwater BMPsBMPs to address urban stormwater come in a variety of forms. Figure 8.1 below describes some of the basic concepts.
100 | P a g e

Figure 8.1: Stormwater Management Concepts (Barrett et al. 2014)
101 | P a g e
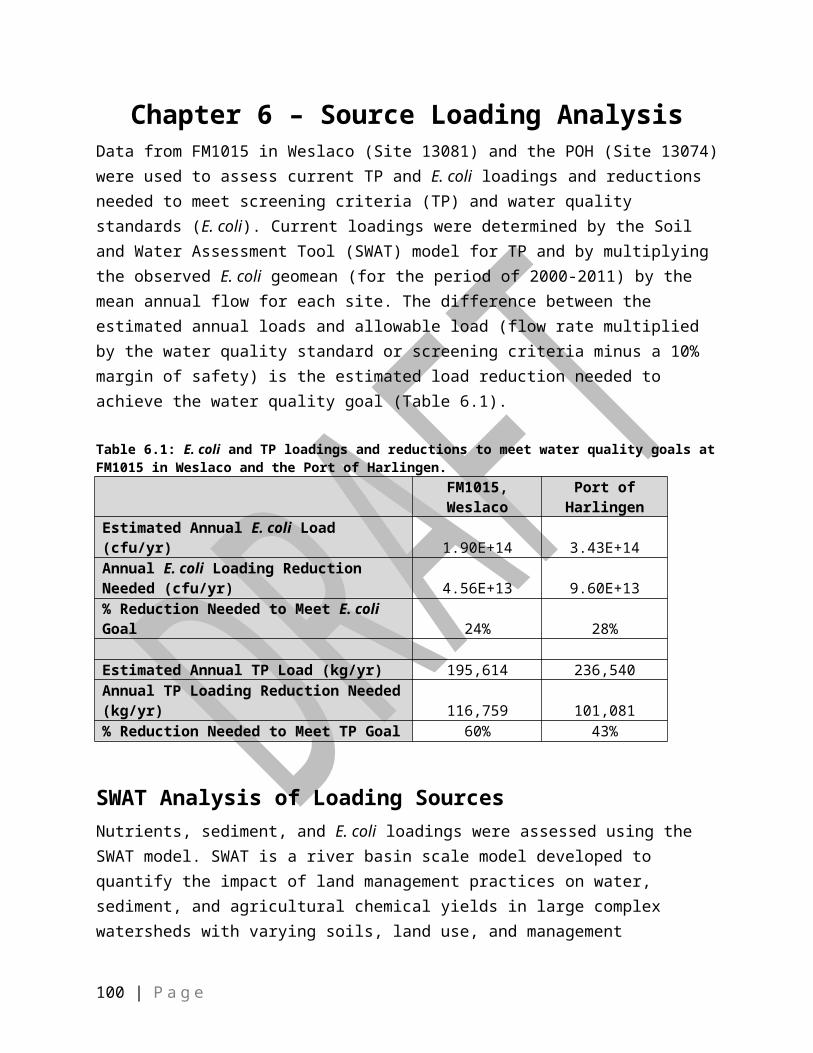
Texas Coastal Stormwater Management GuidanceThe Texas Coastal Nonpoint Source Pollution Program developed guidance for small communities in the Texas Coastal Zone for the management of stormwater runoff from new development. The guidance is available at http://txcoastalbmp.org/. The Partnership recommends cities within the Arroyo Colorado watershed, especially cities within the Texas Coastal Zone, utilize this document.
Urban ForestryAs the watershed becomes more urbanized, Urban Forestry has emerged as a necessary stormwater management practice. Trees intercept rainwater before it reaches the ground and some of the water is evaporated back into the atmosphere. Increasing tree canopy decreases the storage needed onsite. Cities recognize the benefits that trees have. The cities of McAllen, Brownsville and Edinburg have urban foresters that help plan and manage existing trees in the city as well as planning for future development with trees and greenspace as requirements.
In 2014, The South Texas Tree Council (STTC) was established by certified Arborists and Foresters in the watershed. Several cities within the watershed participate in and support the STTC. The STTC promotes native and beneficial tree planting to help protect and develop sustainable urban forests, provide habitat for wildlife, increase native flora and fauna, beautify neighborhoods, and improve community livability and sustainability. For more information visit (https://southtexastreecouncil.wildapricot.org/).
Inventorying existing trees can help cities effectively manage this important resource. Several resources are available to assist with urban tree inventories, maintaining healthy forests, and assessing environmental benefits through the U.S. Forest Service and the Texas A&M Forest Service. More information can be found at http://www.fs.fed.us/research/urban/fia.php and http://www.fs.fed.us/ucf/.
The US Forest Service and the Texas A&M Forest Service partner together to provide technical, financial, research and educational services to local governments and others. The US Forest Service is working to expand its inventory to cities throughout the United States. Through this effort, the Texas A&M Forest Service recently developed the first, ever, web-based graphic presentation of Urban Forestry Inventory and Analysis for the City of Austin called “My City’s Trees”. The application enables civic leaders, community planners, elected officials and anyone with access to the Internet, to learn about, explore, and analyze Austin’s urban forest. This web tool can be very useful to community leaders when creating long-range community tree plans, defining urban forest management and tree health care options, allocating resources and prioritizing programs. The web tool is accessible at http://texasforestinfo.tamu.edu/.
102 | P a g e

The Texas A&M Forest Service also offers the Texas Big Tree Registry that is connected to the National Big Tree Program. The Program seeks to: 1) Locate and recognize the largest known species of its kind that grows in the state of Texas, 2) Obtain the cooperation of tree owners to preserve these specimens as landmarks for future generations to enjoy, and 3)Stimulate interest in and a greater appreciation of trees and their role in sustaining a healthy environment. Currently there 20 Champion trees listed in the Registry in the watershed.
Both the Texas A&M Forest Service and STTC support and recommend that cities conduct a tree census to establish a tree inventory for their respective city. The Partnership also supports and recommends this strategy as a BMP for the watershed.
Landscaping/Greenspace Ordinances Greenspace is an asset to an MS4 because it can intercept, slow down and treat the stormwater before it enters a MS4. Several cities in the watershed have landscaping and/or greenspace ordinances. The City of Harlingen has a landscaping ordinance that requires new development to have a minimum of 15% green space. Harlingen, as well as some other cities, are proposing to increase this landscaping ordinance to 20-25% greenspace for new development in the future The Outlet Mall in Mercedes is an excellent example of stormwater management and treatment that utilizes landscaping with native plants. The contractor installed stormwater detention ponds on the east side of the mall and planted native trees and grasses around the detention ponds to treat the stormwater. The contractors also landscaped the entire mall with native plant gardens to intercept rainwater. The Outlet Mall can serve as an example to local contractors on how to incorporate stormwater management with landscaping techniques to create a functional stormwater management system that is sustainable and aesthetically pleasing.
Parks and Recreation and StormwaterPeople of all walks of life enjoy recreating outdoors. It gives them a way to exercise, relax, observe nature and instills a greater appreciation for natural resources around them. People using these resources develop a feeling of ownership for the trails and water bodies they recreate in and are more willing to care for and protect these resources. Parks and outdoor spaces have the added benefit of naturally built in stormwater management. Residents and community leaders recognize these benefits and work together to create Master Plans for their cities that incorporate Parks and Recreation as a vital component.
A frequent comment from stakeholders, MS4 operators and drainage authorities is that stormwater ditches and canals are common places for illegal dumping. Since these structures are in remote locations with limited accessibility and little or no human traffic, they are an easy target and difficult to clean up. The partnership proposes that mobility and municipal parks masterplans design the hike-and-bike trail paths alongside existing (or planned) drainage canals. This will increase visibility in these areas (increased human transit) that will potentially
103 | P a g e
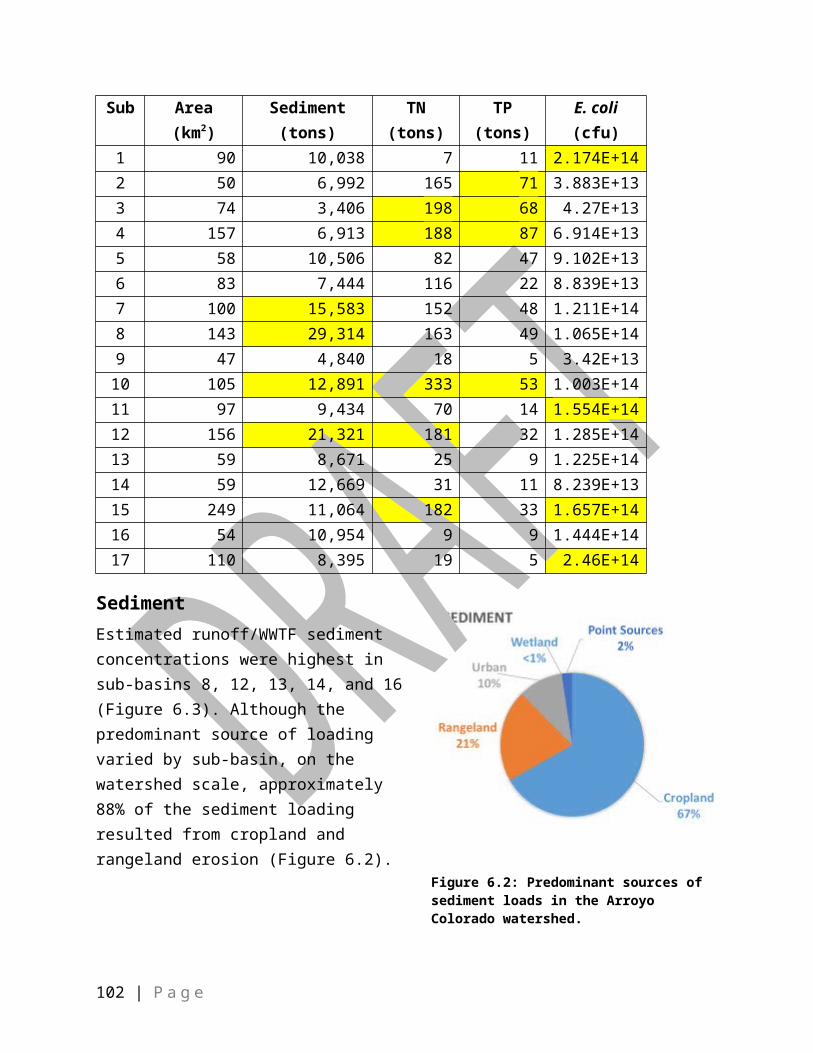
discourage illegal dumping and, at the same time, increase accessibility for maintenance crews. These kinds of projects will create stakeholder collaboration between drainage and irrigation districts, counties and municipalities to address NPS pollution issues in the region.
Several cities in the watershed are proposing hike and bike trails and kayak launches to get residents outdoors, exercising, and connected with nature throughout the LRGV.
City of HarlingenThe City of Harlingen has a unique relationship with the Arroyo Colorado. It is the only city where the Arroyo Colorado cuts a diagonal path and flows through the city, essentially cutting the city in half. Because of this unique relationship with the Arroyo Colorado, city leaders have developed a City of Harlingen Trails Master Plan that utilizes the Arroyo Colorado as an integral component of their plan. With its ability to bypass major barriers such as roads, and its extensive reach from west to east, the Arroyo Colorado corridor is the strongest regional corridor across the city, providing connectivity to existing destinations, existing residential neighborhoods, and future developable areas. Portions of the Arroyo Colorado Trail have already been constructed between US 83/US 77 and Hugh Ramsey Nature Park. The existing 2+ mile trail is the first phase of what could be a strong citywide trail, connecting the east side of the city to the west side via this natural corridor. The city of Harlingen has also excavated a small earthen ramp at McKelvey Park that allows kayakers to launch kayaks and paddle approximately 3 miles down the Arroyo Colorado to Ramsey Park. The city is planning to construct more earthen ramps at city parks adjacent to the Arroyo Colorado to provide additional access points to kayakers.
Pharr, San Juan, Alamo, Santa Anna Refuge Hike and Bike TrailThe cities of Pharr, San Juan, and Alamo plan to develop a hike and bike trail along the Arroyo Colorado to connect their communities with nature and to the Santa Ana National Wildlife Refuge. This project will utilize native plants for landscaping, including interpretive signage about the Arroyo Colorado watershed and the wildlife that depends on it.
Mission, McAllen, Edinburg TrailThe Run, Ride and Share campaign was initiated by the City of McAllen in May of 2014. Part of the campaign was a collaboration between the cities to expand their existing Hike and Bike trails, work together to join the trails from city to city and incorporate canals and drainage ditches into the trail system. The trail system will not only provide residents with more access to the outdoors and exercise but also alternative modes of transportation. The cities will continue to work together to join the trails and expand the number of road miles with designated bike lanes until the cities are connected to one another.
104 | P a g e

Operation Clean Sweep InitiativeThe TxDOT and the cities of McAllen, Edinburg, Pharr, San Juan, Alamo and Hidalgo County joined forces to deploy a convoy of street sweepers across Hidalgo County for the first Operation Clean Sweep on February 19, 2015. The Operation is part of the Run, Ride and Share campaign that was initiated in May of 2014 to encourage residents to get outside and enjoy the hike and biking opportunities that available in their cities. The Clean Sweep Initiative’s objective is to keep designated bike lanes clear of debris, increase the safety of road shoulders and bike lanes, encourage the community to enjoy the facilities and bring awareness to motorists, cyclists and runners to share the road responsibly. A second Operation was held May, 16, 2016 and was expanded to include the cities of Mission and La Villa.
Sport Complex and Municipal Parks Environmental Council (SCEC)The SWTF recognized the stormwater benefits that municipal parks can provide and formed the SCEC in 2014. The SCEC is composed of nineteen (19) members who represent the entities of the SWTF. One of the principal goals of the SCEC is to advance innovative LID and NPS mitigation strategies to address the needs of the Arroyo Colorado watershed using municipal parks and recreational facilities. These projects can showcase new LID strategies through important public and community-based venues and activities and educate stakeholders and young people. Engaging LRGV stakeholders through athletic and recreational outreach events and meetings can be an important strategy in building a common understanding and new approaches for enhanced environmental policy leading to improved water quality.
Colonia DrainageColonias in the LRGV are typically located in flood-prone areas where utility services are provided partially (drinking water and electricity). The lack of sanitary sewage and stormwater infrastructure makes them a hot spot for NPS pollution generation (e.g. flooded OSSFs).
The Texas Legislature established the Colonia Initiative Program in 1999 and established a Director and six Colonia Ombudspersons to work in counties with the highest colonia populations. More information at http://www.sos.state.tx.us/border/colonias/program.shtml. In addition to this program, there are numerous groups and nonprofits representing and assisting colonias with infrastructure issues in the Arroyo Colorado watershed. BC Workshop, a nonprofit organization dedicated to housing and livability project development in low income neighborhoods, is working with some colonias on neighborhood plans to improve their drainage. TAMUK is currently implementing a LID demonstration project in a colonia near the City of Los Fresnos, (La Esquina Subdivision). The objective is to mitigate flooding in a flood-prone area by installing LID techniques and turn this BMP into a green space with park amenities for the community.
105 | P a g e

The Arroyo Colorado Partnership recommends that projects to improve colonia drainage and reduce pollutants to the Arroyo Colorado be implemented. In addition, engagement of low income housing agencies with the Partnership needs to be fostered, since it is critical for the dissemination of stormwater ideas and techniques across the watershed.
Low Impact Development/Green InfrastructureThe original WPP included low impact development/Green Infrastructure (LID/GI) as a management measure to address urban stormwater. The basic idea behind stormwater management through LID is to keep the developed site hydrology as close to the pre-development conditions as possible. Practices include onsite measures such as vegetated swales, rain gardens, green roofs, and porous pavement. There has been a lot of progress implementing this management measure.
The SWTF has been conducting efforts to evaluate the feasibility of LID practices for broader application throughout the LRGV. The initial focus was to construct demonstration projects at strategic locations to educate stakeholders and monitor practice effectiveness (Table 8.8) through funding provided by the TCEQ through CWA Section 319(h) grant funds and administered by TAMUK. Water quality and quantity benefits were assessed for each practice and perceived feasibility of the practices by local stakeholders was recorded. Information gleaned is being used to inform LID ordinance development and regulation throughout the watershed. For more information about more LID sites in the LRGV please visit http://rgvstormwater.org/
The Partnership will continue to implement LID practices within the watershed. The existing LID sites will continue to be used for training and monitoring of effectiveness, especially permeable pavements and bioretention practices for more complete analysis and important predictive modeling for the watershed. Additional LID demonstration projects may be completed as needed. Innovative LID practices with a high potential for bacteria and nutrient removal such as bioswales, rain gardens, bioretention cells, biodetention ponds and other eco-technologies will be needed for implementation and monitoring for load reduction estimation.
In the Arroyo Colorado Watershed, most of the urbanization has taken place without LID concepts/techniques. Downtown and old commercial/industrial areas are characterized by high traffic and high percentage of impervious surfaces. Although retrofitting old development to reduce NPS could be challenging, the table below lays out a strategy to increase green infrastructure and reduce stormwater runoff in this type of settings.
106 | P a g e

Table 8.8: LID demonstration projects funded by CWA Section 319(h).Project Lead Site DescriptionCity of La Joya Municipal Building A pervious surface parking lot was constructed at
the library.City of Alton Fire Station A new fire station was built. The station includes a
pervious pavement parking lot.City of San Juan Amigos Del Valle
BuildingThe building and site was retrofitted to include a green roof, rainwater collection system, rain garden, and bioswale.
City of Alamo Alamo Sports Complex
LID practices and “green technology" components were constructed at the Alamo Sports Complex. A pergola was constructed with solar panels and a rainwater harvesting system. A bioswale and a rain garden were constructed surrounding a storm drain. A pervious concept trail was built.
City of Weslaco Weslaco Public Library
A rainwater harvesting system was installed at the public library. The collected rainwater is used for landscaping needs.
Valley Nature Center
Valley Nature Center (Weslaco)
The center was upgraded to include a rainwater harvesting system, green roof, pervious walking trails, pervious service road, and a treatment wetland with native and riparian plantings.
City of La Feria La Feria Indoor Recreation Center
The new Recreation Center was built with a pervious parking lot and bioswale.
City of Brownsville
Monte Bella Trail Park
A pervious pavement parking lot and walking trails, bioswale, and a rainwater collection system were included in the development of the park.
Cameron County Drainage District #1
Cascade Park (Brownsville)
An education public park was built that included bioretention areas, wetlands for biofiltration, pervious pavement, and rainwater harvesting.
107 | P a g e
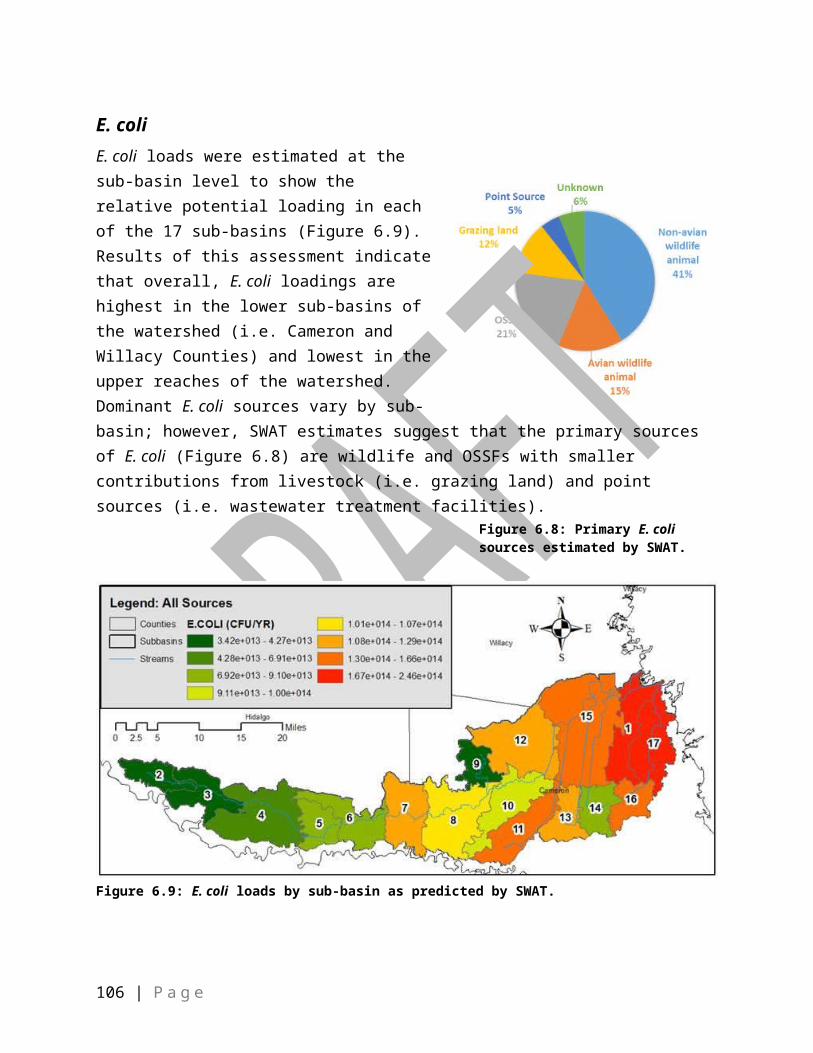
Existing Development Stormwater Green Infrastructure PlanObjectives:
Work with municipalities to develop specific master plans and strategies to decrease impervious surfaces and/or hydraulically disconnect structures from the MS4 using GI/LID techniques.
Work with municipal engineers to develop construction standards and specifications for GI/LID best management practices.
Establish a training program and outreach campaign to engage nonprofit organizations and the community in general.
Reduce stormwater runoff and pollutant loading from bacteria and nutrients from the existing urban settings.
Critical Areas: Areas with highly urbanized development completed prior to establishment of drainage/detention requirements (e.g. downtown areas).Goal: Reduce NPS pollutant loading from urbanized areas with no GI/LID and/or runoff detention BMPsDescription: Engage municipalities, nonprofits and the community in programs to eliminate unused/superfluous impervious surfaces and hydraulically disconnect structures from the MS4 Potential Funding Sources: CWA 319, GLO CMP, CIAP, Border 2020, RESTORE ActImplementation StrategiesParticipation Recommended StrategiesMunicipalities and MS4s
Develop, promote and provide training to remove and disconnect impermeable surfaces/structures in already urbanized areas
Nonprofit organizations and communities
Engage, provide training, and event planning to remove and disconnect impermeable surfaces/structures in already urbanized areas
TAMUK Develop a “depave-disconnect” masterplan identifying priority areas across the watershed and facilitate training and technical assistance.
From 2011-2016, the LID program implemented by TAMUK has shed light on the regional challenges and local cost of green infrastructure implementation in the LRGV. Information collected shows a high degree of variability, especially regarding the cost of these BMPs. For effective LID implementation throughout the watershed, economic drivers must be sound and realistic to provide city planners and leaders the support needed to convince the public and city leadership of the benefits. Economic data must be collected and planning and implementation tools and decision models formulated to support LID implementation and its benefits for water quality. Examples of data to be collected may include construction costs, operating costs for LID, ecotourism impacts and benefits, property value trends with green infrastructure, fisheries benefits, quality of life impacts, pollution mitigation reduction costs, and others.
108 | P a g e

As mentioned above, the SWTF LID program has installed many LID BMPs across the LRGV in a variety of municipal facilities. Thus, some cities have enticed developers to integrate these BMPs in their plans. As this new paradigm of development becomes more popular, training, outreach and education about operation and maintenance of these BMPs becomes more relevant. The SWTF proposes to develop a LID training, education and knowledge hub for the LRGV.
In addition, simple models such as excel based-planning decision making tools are needed to provide city planners, engineers and subdivision coordinators with the ability to assist design engineers, consultants and land developers with alternatives by using LID BMPs. The overall idea of these tools would be to reduce the traditional detention pond footprint by allowing the storage volume of LID BMPs to be incorporated into the design detention calculations. It would not only assist city officials and consultants but provide additional land development opportunities for developers, and load reduction potential data for the WPP.
Drainage Policies and Comprehensive PlansDrainage policies and land development codes/ordinances can be instrumental in reducing stormwater volume and improving water quality. Many of the cities in the watershed have existing drainage policies/codes. For example, the city of McAllen requires the 50-year storm event to be detained on-site for new development.
Some cities have also been exploring modifications to their code to allow for LID practices. For example, the cities of Weslaco and Edinburg have recently added LID codes.
Another tool available for planning BMPs is through Master or Comprehensive Plans. It has been observed that most municipal master plans (drainage, land development, parks and recreation, etc.) include language and strategies that will reduce stormwater runoff pollution into the Arroyo Colorado. These plans are updated every five years (on average) and many existing comprehensive plans contain BMPs that align with the goals and strategies of this WPP for the Arroyo Colorado (e.g. installation of pet waste station in parks and recreational plazas). Strategies within these plans that benefit water quality within the Arroyo Colorado are supported by the Partnership and this WPP.
The Partnership recommends cities continue to develop and pursue drainage policies, LID-friendly codes, and incorporation of BMPs into city Master Plans. In addition, the SWTF has developed a plan to institutionalize LID practices through drainage policies, comprehensive plans, and other avenues. The table below describes their strategy.
109 | P a g e

SWTF LID Institutionalization PlanObjectives:
Continue to expand the NPS training program established by the TAMUK and SWTF. Work with municipal planners to develop land development codes/ordinances and or
drainage policies that include LID/GI Work with municipal engineers to develop construction standards and specifications
for LID/GI. Provide municipalities with technical and financial assistance. Reduce stormwater runoff pollutant loading from bacteria, and nutrients.
Critical Areas: Rapid growth areas and urban settingsGoal: Encourage municipalities, drainage districts and other MS4s to formally adopt LID/GI practices in their land development plans to mitigate stormwater runoff from future or redevelopmentDescription: Promote development of new or amended land development codes/ordinances. Develop drainage policies for the municipalities, drainage districts and other MS4s. Potential Funding Sources: CWA 319, GLO CMP, CIAP, Border 2020, RESTORE ActImplementation StrategiesParticipation Recommended StrategiesTAMUK Continue to offer LID and NPS training including the annual stormwater
conference at South Padre IslandMunicipalities and MS4s
Develop, promote and provide technical assistance adoption of new LID/GI based land development codes /drainage policies
TAMUK Delivery of LID/GI workshops about code development and standards
Pet WasteThere are an estimated 82,611 dogs in the watershed. Many residents likely don’t pick up their pet’s waste, especially in rural areas. In addition, there are likely many stray dogs in the watershed. Some of the cities in the watershed have existing pet waste programs and pet waste stations installed at local parks. The Partnership proposes to implement the following objectives to reduce pet waste bacteria loading:
- Provide Education and Outreach to area residents regarding picking up pet waste, especially in areas where pets and pet owners typically gather (dog parks, pet friendly events, etc.)
- Install pet waste stations in strategic areas such as parks
Lawn MaintenanceRainfall runoff can carry soil, fertilizers, and pesticides from lawns to nearby ditches and canals and eventually the Arroyo Colorado. Over application of fertilizer is a common mistake made by homeowners and is unnecessary and can harm local water bodies. Composting and grass recycling can help to reduce runoff pollution, because they prevent erosion, increase the soil’s
110 | P a g e

ability to absorb and retain water, and reduce the need for fertilizers that contribute to high nutrient levels in the Arroyo Colorado. The Partnership recommends an education and outreach campaign regarding proper lawn maintenance be conducted within the watershed.
McAllen Composting ProgramThe City of McAllen opened its Composting Facility in 2004. The compost produced by the facility has been classified as Class A Compost and labeled, Nature’s Organics, Enriched Soil Products. The city offers four different products; Premium Compost, Regular Mulch, Stump Mulch and Christmas Tree Mulch. The compost is a mixture of ground brush collected as part of the city’s brush collection services and green waste. In 2012, the city introduced two new, innovative programs to reduce the amount of grass clipping and vegetables and produce being thrown into the trash and ending up in landfills; the “Bag It” program & the “Save the Greens” program. The Bag IT program provides residents with free compostable bags to dispose of grass clippings and leaves. The bags are collected once a month in accordance with the City’s brush collection service schedule. The grass and leaves are used in the composting process. The City began the “Save the Greens” program by entering an agreement with all the HEB’s and Walmart’s in the City. The City would provide the store with specialized, industrial trash bins designated for spoiled vegetables, produce and citrus, “the Greens”, and stores would separate “the Greens” and dispose of them in the proper trash receptacle. By providing residents with affordable compost and mulch, residents can conserve water and have an alternative to using chemical fertilizers.
Recycling, Tires, and BrushIllegal dumping of tires, trash and brush is a big problem in the LRGV. Illegally dumped tires and trash clog drainage canals and storm drains. The blockage of the drainage canals leads to localized flooding and creates a breeding ground for pests, rodents, vermin and mosquitos. Many cities in the watershed have set up recycling programs as part of their SWMP to decrease the amount of trash in the city and keep stormwater drainage systems cleared and operating correctly. E&O is a big part of a recycling program being effective. If the community is not educated on the benefits of recycling and proper brush and trash disposal, remediation costs for the cities will continue to rise. Many cities have established recycling and tire disposal programs. In 1994, the City of McAllen introduced a new Automated Curbside Recycling Program as part of their Recycling Center and Program. TCEQ, recognized it as the first ever, in the state of Texas. The Curbside Recycling program was successful and the Recycling Center has grown to keep up with the increase in materials being recycled.
111 | P a g e
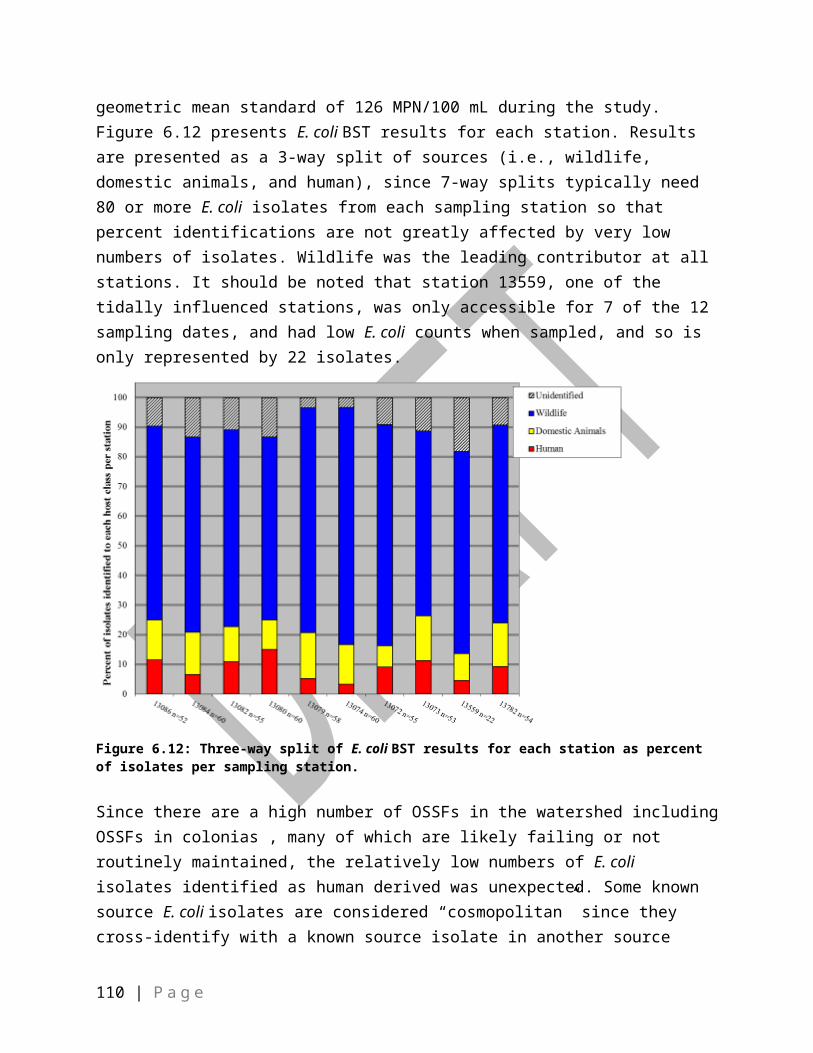
City of Pharr Tire Success StoryThe City of Pharr established their Recycling Center in 2009 and subsequently developed the city’s SWMP. In the fall of 2010, the city passed a Tire Ordinance that required all tire shops to register with the city and require mandatory “proper” disposal of tires. The city also developed a manifest process for each tire shop in Pharr that requires each tire shop to properly collect, store, transport and eventually dispose of the tires in the most legal and proper method available. As part of the recycling program, the city offers residents free disposal of up to 4 tires and businesses are charged a small fee per tire. Early in the development of the household tire disposal program, the city was faced with the challenge of residents not cooperating and dumping their tires on neighboring properties or other parts of the city. The city developed a tire tagging program that uses different colors, dashes and symbols that allows city code enforcement inspectors to track each tire to the household it originated from. During routine code enforcement inspections, if an inspector identifies old tires at a household that have been there a while, he or she will tag the tires and place a “door knocker” or warning informing the resident that they have 7 days to take the tires to the recycling center for free tire disposal. If the resident does not comply, the resident will be assessed a fine. At first, some residents would try to move the tires to another property until they realized that the tires could still be traced backed to them. Eventually through the E&O efforts and word of mouth, the residents began to comply and then embrace the recycling and tire disposal programs. This has reduced the illegal dumping of tires within the city limits by 50% according the City of Pharr Code Compliance Department. City officials also commented the overall visual appearance of the City has improved since the implementation of the SWMP.
Stormwater Detention ProjectsThe Arroyo Colorado is used for stormwater conveyance and is essential during large storm events to minimize LRGV flooding. NPS runoff associated with flooding and large rain events is a large source of pollution entering the Arroyo Colorado. Storm and floodwaters pick up and transport pollutants from all sources, which contribute to the overall load of bacteria and nutrients in the Arroyo Colorado.
Slowing down runoff through detention or retention facilities is a necessary BMP to prevent flooding and allows time for sediment to settle out. TAMUK partnered with the City of McAllen to study water quality enhancements to regional detention facilities (RDFs) at Morris Elementary School, McAuliffe Elementary School and the Dog Park. Overall this project found that RDF enhancements can offer significant flow and pollutant reduction when applied in different areas. The McAuliffe RDF includes a set of permanent retention ponds that were more efficient at pollutant removal than the often dry basin at the Morris Middle School RDF. A stormwater wetland at Morris probably helps remove nutrients but it can be easily bypassed during large events.
112 | P a g e

The Partnership supports stormwater detention projects, especially with enhanced water quality treatment. A few stormwater detention projects that have been specifically identified are summarized below.
Hickery Hill ParkHickery Hill Park is proposed to include a 46-acre, tiered detention facility. Undeveloped farmland adjacent to flood prone residential areas contributes stormwater to this area. Once constructed, the facility will capture runoff from approximately 201 acres and will allow sediment to settle out and treat the stormwater before it is released through a controlled discharge that ultimately drains to the Arroyo Colorado. In addition to the detention basin, other proposed improvements are to create a park that includes walking trails, birding observation stations, wetlands, playgrounds, restrooms, and parking areas that incorporate LID practices such as permeable pavements, green roofs, rainwater tanks, and bioswales.
Palm Valley Stormwater Ponds and Drainage Rehabilitation ProjectPalm Valley is a retirement community and country club and a formally established city surrounded by the city of Harlingen thus preventing future expansion. The city operates a WWTF and discharges effluent into ponds that eventually discharge into the Arroyo Colorado. These ponds serve as the stormwater collection and drainage system for the city and are water hazards for the golf course. The ponds capture stormwater from surrounding cropland and the homes and streets of Palm Valley. Over time, the ponds have silted in and have lost their original storage capacity. The Partnership, in cooperation with the city of Palm View, is planning to dredge the ponds and stormwater discharge pipe to restore the holding capacity of the ponds. This project will reduce NPS stormwater runoff by capturing and treating stormwater before it is released to the Arroyo.
Tracking Progress and Load ReductionsMultiple departments at each municipality budget and perform routinely activities that have a positive impact in reducing NPS pollution in the Arroyo, most of which are carried out by departments that are not related to environmental/stormwater issues and therefore are neither quantified nor characterized. Since these activities constitute a direct investment from the cities, an effort to monitor these activities will give deserving credit to the municipalities. Municipalities in the watershed are encouraged to report annually to the Arroyo Colorado Partnership the BMPs in Table 8.9. In addition, studies into the optimization of BMPs, inventorying of BMPs, and quantification of load reductions are supported by the Partnership.
113 | P a g e

Table 8.9: Suggested minimum BMPs to report to Arroyo Colorado Partnership Annually.BMP Annual Totals from September 1 – August 31Trash Cleanups Tons collected Tire Collections Tires collected Recycling Tons collectedStorm Drain Marking Storm drains markedStreet Sweeping Tons collectedVacuuming of Storm Drains Tons collected
The SWTF has been assisting some cities with mapping of urban BMPs. They have developed a database with an associated interactive map that can be viewed here http://rgvlidprogram.com/. The SWTF plans to continue to map BMPs and further develop this database and interactive map. In addition, the SWTF plans to expand this effort to include quantification, characterization, and geolocation of non-structural BMPs and routinely/contingent activities that are known to reduce pollutant loading. This includes studying sediment routinely removed by street sweepers and waste removed by vacuum trucks from storm drains before and after hurricane season to identify the “hot spots” in the city. This information will be used to generate a vacuum truck optimization plan and a mitigation plan based on geolocation.
Illegal DumpingIllegal dumping is a critical issue within the LRGV. The LRGVDC is the state designed agency for solid waste management issues within the region and they develop and administer the Regional Solid Waste Management Plan (RSWMP) and Regional Solid Waste Grant Program. The Arroyo Colorado Partnership will coordinate efforts with the LRGVDC and RSWMP. Ongoing efforts related to addressing illegal dumping include tire buyback programs, sheriffs’ department enforcement, signage for numbers to report dumping, and trash pickup events.
Illegal Dumping PlanObjectives:
Work with cities, counties, and the LRGVDC to coordinate existing illegal dumping efforts to be more efficient and responsive to illegal dumping
Advertise/provide stakeholders with illegal dumping hotline phone numbers available throughout the watershed
Educate the public regarding illegal dumping impacts to the Arroyo Colorado Critical Areas: Rural areas of the watershed where illegal dumping takes placeGoal: Prevent illegal dumping in rural portions of the watershedDescription: Engage local governments to coordinate illegal dumping efforts/activities throughout the watershedPotential Funding Sources: LRGVDC Grant Program, CWA 319
114 | P a g e
Implementation StrategiesParticipation Recommended StrategiesLRGVDC Implement the LRGVDC Regional Solid Waste Management PlanSheriff’s departments
Maintain illegal dumping hotlines where illegal dumping. in Hidalgo, Cameron and Willacy counties can be reported
TCEQ Don’t Mess with Texas Water Program
The Don’t Mess with Texas Water program works to prevent illegal dumping that could contaminate Texas surface waters by working with TxDOT and participating communities to place signs on major highway water crossings notifying drivers of a toll-free number to call to report illegal dumping. TCEQ forwards calls from the toll-free number to the appropriate local enforcement agency that handles complaints of illegal dumping for a participating area. Currently the cities of Harlingen, McAllen, and San Benito are participating in the program.
TBD Inventory of common illegal dump sitesCities/counties in watershed
Install video cameras at common illegal dump sites similar to the city of McAllen’s Eye in the Sky Illegal Dumping program
Cities/counties Tire buyback program based on the city of Pharr’s tire buy back event
WildlifeAs previously stated, the LRGV supports an abundance of neotropical wildlife. This wildlife is economically and ecologically important to the region and beyond. To address potential bacteria and nutrient contributions from wildlife, a suite of practices is available including targeted hunting of exotics, development of wildlife management plans and associations in conjunction with TPWD, and implementation of agricultural and urban BMPs. United States Department of Agriculture (USDA) Animal and Plant Health Inspection Service (USDA APHIS) (2014) has proposed aerial harvesting of the exotic nilgai in the area to help address the cattle fever tick issue. Hunting of exotics on National Wildlife Refuges is also allowed and a priority to help manage nilgai and feral hogs, exotic and invasive species that destroy habitat important to many native wildlife species. On private lands, landowner participation in TPWD’s wildlife management plans, landowner incentive program or wildlife management associations will be encouraged. Implementation of urban stormwater BMPs and conservation plans and WQMPs on agricultural lands will also help address bacteria and nutrient runoff originating from wildlife. Urban stormwater practices such as dry ponds have been found to reduce bacteria by more than 88% and agricultural practices such as filter strips have been found to reduce E. coli by more than 58%. These agricultural and urban BMPs have been described previously and as such will not be described in detail here; however, it can be expected that these practices will positively impact water quality by not only reducing loading arising from agricultural and urban activities but also loading from wildlife.
115 | P a g e

Port of HarlingenThe POH is in the middle of the impaired tidal segment and is considered a critical factor in localized water quality. The POH has made great progress in addressing loading and off-loading spillage of raw materials, such as sugar and fertilizer, into the Arroyo Colorado Turning Basin. The POH designed and constructed a 30,000 sq ft warehouse at a cost of $2.5 million dollars to store these raw materials and keep them from being exposed to the elements and out of the Arroyo Colorado. The POH has also implemented a revised loading schedule and system based on the warehouse and has upgraded all the conveyor systems from the POH tenants’ warehouses to the barges.
Port of Harlingen Constructed WetlandHydrologic channel modification to allow barge traffic causes increased sedimentation due to stream velocity decreases. This sediment contains nutrients that combine with inadvertent fertilizer spills at the port and contribute to low DO concentrations in this reach of the Arroyo Colorado. Establishment of a constructed wetland on approximately 35 acres where dredge spoils are dumped upstream of the POH on the southeastern bank of the Arroyo Colorado will help to improve water quality. The wetland will be designed and built to provide nutrient removal from dredge spoils from the POH turning basin. In addition to improving water quality, this wetland would provide valuable riparian habitat, a public bird watching area and continuous maintenance of the POH turning basin.
Instream MeasuresEngineered instream BMP measures need to be considered due to the physical stream modifications and dredging that occurs every 3-5 years to maintain proper depth for commercial barge traffic to successfully navigate to the POH. Modeling results suggest that non-traditional BMPs should be considered to meet water quality standards for DO in the Tidal segment since natural channel morphology is not attainable. Several critical locations have been identified for these structures (Figure 8.2).
116 | P a g e

Figure 8.2: Proposed instream BMP locations.
Harlingen Aeration StructuresThe Partnership, the city of Harlingen, and the POH propose to install 3 low-head rock or gabion weirs as aeration structures in the Arroyo Colorado to improve DO levels in the tidal segment. Each structure will have a trapezoidal cross section and will extend across the entire channel bottom perpendicular to stream flow. Upstream and downstream faces of the structures will be uniformly sloped from the top to bottom. The total length of the structures along the axis of the channel from the downstream toe to the upstream toe will be 60 ft. The POH has already received a Nationwide 27 permit from the USACE to install the structures. The POH has applied for a license from the IBWC to proceed with the project. The POH plans to begin construction in the spring of 2017. The project is being funded by the POH, the city of Harlingen and Coastal Conservation Association.
Aeration of Zone of ImpairmentMechanical aerators or a bubble curtain are proposed in the POH Turning Basin to improve DO in the zone of impairment. Aerators will provide the stream with DO in the zone of impairment during June-September, when the increased temperatures result in high algal activity and low DO levels. Water body modeling identified critical locations for these aerators and the Partnership proposes to conduct a demonstration project/feasibility study to quantify actual DO improvements from these aerators. The POH will operate the aerators.
117 | P a g e

Llano Grande Lake dredging projectThe Llano Grande Lake is part of the Arroyo Colorado in the floodway between Mercedes and Weslaco. Originally, the lake was 8-10 ft deep and there was an upwelling of water described as a natural spring feeding the lake. The Llano Grande Lake area was a military encampment throughout the 1930s and 40s when the LRGV was starting to be settled. These camps were established at the Llano Grande Lake because of the access to the spring and fresh water in the lake. The groundwater in this area is very shallow, only 5 feet below the surface in some locations, and there are “perched” water tables throughout that provide baseflow to the Arroyo Colorado. This shallow groundwater and spring kept the lake full throughout the year. Later the lake became a huge outdoor recreational area with a boat ramp where people would launch small boats to fish and water ski.
The IBWC stopped dredging the Arroyo in the 1960s, and the lake began to silt in and the boat ramps were damaged. Several attempts to rebuild the boat ramp took place but siltation prohibited boat launching and fishing. Eventually, any attempts to revive the once thriving Llano Grande Lake area were abandoned and residents were no longer able to enjoy this area. This caused the “spring” feeding the lake to be cut off and an associated decline in water quality.
The Arroyo Colorado Habitat Work Group concluded that dredging the lake to its original depth and restoring groundwater flow will improve Arroyo Colorado water quality. Dredging the lake will provide more capacity to the Arroyo, restore a native deep water habitat and may restore access to a groundwater/underground spring. The extra capacity and spring water will create a diluting effect on existing stream pollutants. There have not been any project feasibility studies, so the first step is to determine whether dredging the lake will restore the spring flow and evaluate the potential benefits of the project. This project will preserve a historical lake and spring that provides habitat for birds, wildlife and native plant species. This project will also provide stormwater treatment, recreational areas and environmental education.
118 | P a g e

Flood Abatement BMPs
Flooding is a big issue in the watershed and it creates numerous health concerns. When there is a large storm event or hurricane, flooding can occur across the entire LRGV at the same time. Some portions of the watershed are more prone to flooding due to soil types and low-lying areas. In many cases, the floodwater has no place to go and various pollutants collect in the floodwater creating a perfect environment for diseases, mosquitos and vermin to thrive. The Partnership proposes identifying flood prone areas of the watershed and implementing flood event BMPs that will help alleviate flooding.
Tio Cano LakeThe Tio Cano Lake Bed Regional Stormwater Ecological Enhancement Project will consist of developing improved drainage on 460 acres of agricultural land, colonias and rural homes that are prone to flooding. The properties surrounding the project site are known as Tio Cano Lake. Tio Cano Lake is a natural depression that was once part of a natural wetland system before it was drained and developed for agricultural use and subdivided for homes. All the areas that drain into Tio Cano Lake are agricultural fields, colonias or homes that have OSSFs. Stormwater drains into the lake from seven ditches, flooding homes, septic tanks and drainfields and making roads impassable in times of storm events. This project will consist of using a series of ditches/canals to drain the Tio Cano Lake stormwater into an adjacent 440-acre USFWS managed property that is a protected wetland system and part of the Texas Tropical Trail Birding route. The stormwater on the USFWS property remains in the wetland system until it evaporates naturally and is not discharged into the Arroyo Colorado.
This project will alleviate flooding in the area and provide stormwater detention and treatment thus reducing NPS pollution into the Arroyo Colorado. The project will also provide recreational, economic, and educational opportunities for the Arroyo Colorado watershed.
119 | P a g e

Chapter 9 – Future Scenario AssessmentA SWAT and CE-QUAL-W2 modeling system was used to model future scenarios and determine the water quality results. The SWAT model was used by itself to evaluate bacteria in the Arroyo Colorado Above Tidal segment and to provide the loadings of nutrients, sediment and bacteria to CE-QUAL-W2. The CE-QUAL-W2 model used the loadings from the SWAT model to simulate DO dynamics and fate and transport of bacteria in the Arroyo Colorado Tidal segment (Figure 9.1).
Figure 9.1: Schematic of modeling system.
Modeling ScenariosIt was not possible to model all proposed implementation measures as outlined in Chapter 8. Thus, to assess the impacts of implementation measures, a select subset of key measures was evaluated as described below. Because all management measures were not modeled, results can be considered conservative estimates of the impacts of implementing the management measures identified by the stakeholders in the Arroyo Colorado watershed.
120 | P a g e

Implement Management MeasuresImplementation of key agricultural, WWTF, OSSF, urban, and instream measures identified were evaluated under Scenario 1. Agricultural management included in the model scenario consisted of increasing the cropland under conservation plan by 35,000 acres (i.e. 75% of cropland will be under a conservation plan) and developing conservation plans on 10,000 acres of pasture and 7500 acres of rangeland.
Major WWTFs (Table 9.1) were modeled to discharge wastewater at concentrations of 10 mg/L BOD, 15 mg/L TSS, and 63 cfu/100 mL E. coli by 2020 and then 7 mg/L BOD, 12 mg/L TSS, 3 mg/L NH3-N, and 0-32 cfu/100 mL E. coli by 2027. Small WWTFs were modeled to stay at 20 mg/L BOD and 20 mg/L TSS until their discharge exceeded 1 mgd at which time their discharge was modified to 10 mg/L BOD, 15 mg/L TSS, and 3 mg/L NH3-N. TWDB Water Plan numbers were used to calculate percent increases in WWTF flow. Additionally, planned wastewater reuse in McAllen, Pharr, Harlingen, and San Benito (as described in Chapter 8) was reflected in the scenario modeled.
For OSSFs, 300 failing OSSFs (nearest the Arroyo and its tributaries) were repaired/replaced in the model scenario.
Three instream BMPs/aeration structures in the non-tidal segment were included in the SWAT modeling scenario, one structure in sub-basin 8 with a water fall height of 2.6 ft (0.8 m) and two structures in sub-basin 10 with water fall heights of 1.18 ft (0.36 m) and 1.72 ft (0.52 m).
Increasing urbanization (via conversion of ag land to urban) was modeled along with implementation of key urban stormwater BMPs (i.e. construction of several stormwater detention structures). The primary detention projects modeled include the restoration of Llano Grande Lake in sub-basin 6 and the construction of the Hickery Hill detention facility in sub-basin 8. Additional urban BMPs modeled include:
20% landscaping/LID/GI/Urban Forestry ordinance for new development 10% reduction in pet waste through education and outreach
Implement Management Measures and Advanced Wastewater TreatmentThe implementation of advanced wastewater treatment in conjunction with watershed management measures described in the previous section (Scenario 2) was also assessed. This consisted of reducing total P in wastewater effluent to 0.10 mg/L and total N to 4 mg/L, where >90% of the total P was in the form of PO4-P and >90% of the total N was in the form of ammonia, nitrite and nitrate. Implementation of such a scenario is unlikely; however, it provided helpful insight regarding the levels of watershed implementation that may be necessary to achieve water quality standards.
121 | P a g e

Table 9.1: Overview of major point source facilities scenario modeled.
Facility Name TPDESPermit #
2016 permit flow (mgd) & BOD5/TSS/NH3-N
Obs. 3-yr avg flow (mgd)
SWAT avg. flow (mgd)
Future flow % increase
Future flow (mgd)
Reuse (mgd)
Final WWTP (mgd)
Sub#
Future sub flow
(mgd)
Current sub flow
(mgd)
F/C Ratio
City of Mission WQ0010484-001 (9) 7/15/2 7.30 6.4 22.5 7.84 7.84 2 7.84 6.4 1.23City of McAllen WWF #2 WQ0010633-003 (10) 10/15/2 5.86 7 22 8.54 -1.20 7.34 3 14.29 12.7
City of Hidalgo WQ0011080-001 (1.2) 10/15/3 0.97 0.73 21.5 0.89 0.89
4 5.86 9.45 0.62
Military Hwy WSC (Balli Rd.) WQ0013462-006 (0.51) 20/20/NA 0.16 0.15 14.5 0.17 0.17
City of Pharr WQ0010596-001 (8.0) 7/15/2 4.7 4.6 20.5 5.54 -5.54 0
City of San Juan WQ0011512-001 (4.0) 10/15/3 2.06 2 21.5 2.43 2.43
City of Alamo WQ0013633-001 (2.0) 30/90/NA 0.94 0.67 21.5 0.81 0.81
City of Donna WQ0010504-001 (1.8) 10/15/3 1.42 1.3 20 1.56 1.56
City of Weslaco WQ0010619-005 (2.5) 10/15/3 0.96 0.89 21.5 1.08 1.08 5 1.08 0.89 1.21Military Hwy WSC (Progreso) WQ0013462-001 (0.75) 10/15/3 0.35 0.28 20.5 0.34 0.34 6 0.34 0.28 1.21
City of Mercedes WQ0010347-001 (5) 7/15/2 1.57 1.3 19.5 1.55 1.557 2.01 1.73 1.16
City of La Feria WQ0010697-001/2 (1.25) 10/15/3 0.43 0.43 13.5 0.49 -0.03 0.46
Harlingen Water Works WWF #2 WQ0010490-003 (7.25) 10/15/3 5.44 5.5 14 6.27 -6.27 0.001
10 0.001 7.6 0.00City of San Benito
WQ0010473-002(3.75) 10/15/3 1.56
2.1 13 2.37 -2.37 0
WQ0014454-001 21.5 0 0Military Hwy WSC (Lago) WQ0013462-008 (0.51) 20/20/3 0.18 0.12 21.5 0.15 0.15 11 0.15 0.12 1.25
City of Rio Hondo WQ0010475-002 (0.4) 20/20/NA 0.15 0.14 11.5 0.16 0.16 12 0.16 0.14 1.14
East Rio Hondo WSC WQ0014558-001 (0.08) 10/15/3 0.03 0.022 14.5 0.03 0.03 15 0.03 0.022 1.36
122 | P a g e

Implement Management Measures and Restore Llano Grande Lake Spring Restoration of spring flow from Llano Grande Lake in conjunction with the implementation of watershed management measures described previously (Scenario 3) was also assessed. This consisted of restoring 1,000 gallons per minute (GPM) in spring flow from the lake, adding 1.44 MGD (with zero sediment, N, P, or E. coli) to the main channel in subbasin #6.
Implement Aerators in Zone of ImpairmentThe final scenarios evaluated the implementation of aerators in the tidal segment’s zone of DO impairment (Figure 9.2). Using CE-QUAL-W2, three scenarios were modeled:
operating five aerators from July-August (Scenario 4); operating five aerators from June-September (Scenario 5); and operating five aerators July-August and implement all Scenario 1 measures (Scenario 6).
Figure 9.2: Schematic of modeling system.
123 | P a g e

Impact of Management Measure Implementation on Segment 2202Per SWAT outputs for Scenario 1, implementation of management measures and increased wastewater discharges resulting from population growth will result in reduced E. coli concentrations in the non-tidal segment (2202) meeting state water quality standards. SWAT outputs predict a 65% reduction at the POH (Site 13074; See Figure 11.1 for site location) from the current median of 151 cfu/100 mL to 53 cfu/100 mL (Table 9.2).
SWAT outputs predict slight increases in DO concentrations in the non-tidal segment result from implementation of planned management measures and higher continuous stream flows from the increased wastewater discharges. DO concentrations increased from 7.5 mg/L to 7.7 mg/L in Subbasin 8 at US 77 in SW Harlingen (Site 13079; See Figure 11.1 for site location).
Nonpoint source phosphorus and nitrogen load reductions of approximately 10% and 20%, respectively, are predicted by SWAT. However, due to continued population growth and resulting increased wastewater discharges, SWAT predicts that overall nutrient loadings will increase in the non-tidal segment, despite implementation efforts, if advanced wastewater treatment is not implemented. SWAT estimates that at Site 13079, nitrogen loads will increase 10% and phosphorus loads will increase 34% without advanced treatment of wastewater.
Table 9.2: SWAT output at Subbasin 10 (Site 13074) for select parameters (used by CE-QUAL-W2).
Conditions Flow (cms)
E. coli (MPN/100
mL)
NO2 +NO3
(mg/L)
NH4
(mg/L)PO4
(mg/L)CHLA (µg/L)
CBOD (mg/L)
Existing BaselineAverage 7.23 154.25 4.16 0.26 0.53 63.29 9.58
Median 4.91 151.00 2.90 0.22 0.53 60.75 3.07
Future baselineAverage 8.28 66.07 4.64 0.40 0.60 52.83 13.80
Median 5.16 56.50 3.75 0.32 0.61 55.11 4.28
Scenario 1 (Conservation practices)
Average 7.81 62.79 4.37 0.27 0.52 52.48 11.36
Median 4.96 52.70 3.49 0.22 0.52 54.68 1.75Scenario 2
(Low N/P loads from PS)
Average 7.74 65.02 3.10 0.13 0.02 2.37 11.84
Median 4.69 54.00 2.02 0.10 0.01 1.07 1.66Scenario 3
(Llano Grande Spring Flow - 1000GPM)
Average 8.34 65.81 4.58 0.39 0.59 52.40 13.72
Median 5.22 56.80 3.70 0.31 0.60 54.82 4.23
For Scenario 1, perhaps the most significant benefit regarding the Outlet of Subbasin 10 regards reduction in carbonaceous biochemical oxygen demand (CBOD) from the Future Baseline. While the time-weighted averages (Table 9.2) do not change all that much, the median concentration is much reduced for Scenario 1. The significance is that under non-storm flow conditions the CBOD is significantly reduced going into the Arroyo Colorado Tidal.
124 | P a g e

Impact of Management Measure Implementation on Segment 2201CE-QUAL-W2 is a two-dimensional, longitudinal/vertical, hydrodynamic and water quality model developed by the USACE Waterways Experiment Station and Portland State University (Cole and Wells, 2011). CE-QUAL-W2 (Version 3.7) was used because of its capabilities to predict longitudinal-vertical hydrodynamics and water quality of the tidally-influenced portion of the Arroyo Colorado and to simulate the salt wedge that predominates in this portion of the Arroyo. CE-QUAL-W2 is strictly a hydrodynamic/water quality model and nutrient, sediment, and bacteria loadings are fed to it by SWAT. As such, the model does not provide an evaluation of watershed pollutant sources like SWAT and BST, but rather provides predictive capabilities to assess impacts of management measure implementation on DO and bacteria levels in the Arroyo Colorado Tidal.
While SWAT E. coli results indicate non-impairment for future conditions in the non-tidal segment (2202), CE-QUAL-W2 results in the Arroyo Colorado Tidal show that despite >50% reductions in the zone of impairment, Enterococci criterion (35 MPN/100 mL) are not met in AU 2201_04 and 2201_05 (Table 9.3) with management measure implementation (Scenario 1).
Table 9.3: CE-QUAL-W2 Enterococci geometric mean results for modeled scenarios by AU. (Non-attainment shown in Red font).
Conditions (2003-2007)Zone of Imp. Below Zone of Imp.
2201_05 2201_04 2201_03 2201_02 2201_01Existing baseline 101 82 53 31 21Future baseline 45 39 27 19 15
Future Scenario_1(Conservation practices) 43 37 26 19 15
Future Scenario_2(Low N/P loads from NPS) 44 37 26 18 14
Future Scenario_3(Llano Grande Spring Flow – 1000
GPM)45 39 27 19 19
Future Scenario_4(July- Aug running 5 aerators at
ZOI)
45 39 27 19 15
Future Scenario_5(June- Sept running 5 aerators at
ZOI)
45 39 27 19 15
Future Scenario_6(scenario_1+scenario_4)
43 37 26 19 15
125 | P a g e

Based on the CE-QUAL-W2 model outputs for Scenario 1, implementation of planned management measures result in significant improvements in DO and near attainment (Figure 9.4). Only in AU 2201_05 is the minimum DO criteria not fully attained.
Table 9.4: CE-QUAL-W2 24-hr DO results for modeled scenarios showing the % time each criterion is met.Conditions Criteria
24 Hr. DO by AUZone of Imp. Below Zone of Imp.
(2003-2007) 2201_05 2201_04 2201_03 2201_02 2201_01
Existing baselineAverage (>4mg/L) 97% 96% 97% 98% 99%
Minimum (>3mg/L) 77% 88% 95% 98% 99%
Future baselineAverage (>4mg/L) 96% 95% 95% 97% 98%
Minimum (>3mg/L) 79% 88% 92% 95% 97%Future Scenario_1 Average (>4mg/L) 97% 96% 95% 97% 98%
(Conservation practices) Minimum (>3mg/L) 87% 91% 93% 96% 97%Future Scenario_2 Average (>4mg/L) 98% 97% 96% 97% 98%
(Low N/P loads from PS) Minimum (>3mg/L) 97% 95% 95% 97% 98%Future Scenario_3 Average (>4mg/L) 96% 95% 95% 97% 98%
(Llano Reservoir Spring water 1000GPM) Minimum (>3mg/L) 79% 88% 92% 95% 97%
Future Scenario_4(July- Aug running 5
aerators at ZOI)
Average (>4mg/L) 96% 95% 95% 97% 98%
Minimum (>3mg/L) 88% 91% 92% 95% 97%
Future Scenario_5(June- Sept running 5
aerators at ZOI)
Average (>4mg/L) 96% 95% 95% 97% 98%
Minimum (>3mg/L) 92% 92% 92% 95% 97%
Future Scenario_6(scenario_1+scenario_4)
Average (>4mg/L) 97% 95% 95% 97% 98%
Minimum (>3mg/L) 92% 93% 93% 96% 97%
Table 9.5 and Table 9.2 help explain why Scenario 1 improved DO resulting in compliance with the 24-hr DO minimum criterion everywhere except AU 2101_05. Table 9.2 shows a significant decrease in CBOD entering the Tidal segment; thus, much less oxygen demand occurs during all but storm events. Table 9.5 shows that the actual eutrophication response, as measured by the range in DO over a 24-hr period, changing little between the Future Baseline and Scenario 1. But, average and minimum 24-hr DOs did increase. These two facts can be interpreted that the reduced CBOD from Scenario 1 compared to Future Baseline raised overall DO in the ZOI and this overall increase meant that the 24-hour swings in DO due to photosynthesis and respiration (i.e., eutrophication response) did not cause the 24-hr minimum DO to be “busted” as often.
126 | P a g e

Table 9.5: CE-QUAL-W2 24-hour Dissolved Oxygen results for different scenarios showing average and median values of daily average, minimum and range.
Conditions (2003-2007)
24 Hr. DO (mg/L) by
AU
Zone of Imp. Below Zone of Imp.
2201_05 2201_04 2201_03 2201_02 2201_01
Avg. Med. Avg. Med. Avg. Med Avg. Med. Avg. Med.
Existing Baseline
24hrAvg 7.09 6.92 7.98 7.99 9.05 9.30 9.72 9.94 10.17 10.49
24hrMin. 4.49 4.47 5.54 5.62 7.03 7.31 8.07 8.42 8.53 8.76
24hrRange 2.59 2.51 2.44 2.37 2.01 1.98 1.65 1.61 1.63 1.60
Future Baseline
24hrAvg 7.85 7.90 8.63 8.90 9.30 9.75 9.77 10.13 10.10 10.53
24hrMin. 4.95 5.07 6.06 6.37 7.14 7.57 7.98 8.41 8.38 8.70
24hrRange 2.89 2.79 2.57 2.50 2.16 2.17 1.79 1.77 1.72 1.70
Future Scenario_1 (Conservation
practices)
24hrAvg 8.99 9.26 9.66 10.16 9.93 10.50 10.04 10.43 10.21 10.64
24hrMin. 6.02 6.26 7.08 7.56 7.75 8.26 8.24 8.67 8.49 8.78
24hrRange 2.97 2.86 2.58 2.53 2.18 2.19 1.80 1.77 1.72 1.70
Future Scenario_2 (Low N/P loads from
PS)
24hrAvg 7.49 7.53 7.43 7.59 7.73 7.93 7.97 8.15 8.45 8.63
24hrMin. 7.05 7.31 6.97 7.33 7.27 7.63 7.52 7.83 7.93 8.20
24hrRange 0.45 0.23 0.46 0.25 0.45 0.27 0.46 0.30 0.52 0.37
Future Scenario_3 (Llano Reservoir
Spring water 1000GPM)
24hrAvg 7.87 7.92 8.64 8.91 9.30 9.75 9.77 10.12 10.10 10.53
24hrMin. 4.98 5.10 6.07 6.38 7.14 7.57 7.97 8.41 8.38 8.70
24hrRange 2.89 2.77 2.57 2.50 2.16 2.17 1.79 1.77 1.72 1.70
Future Scenario_4 (July- Aug running 5
aerators at ZOI)
24hrAvg 8.05 8.15 8.97 9.37 9.42 10.01 9.78 10.17 10.11 10.56
24hrMin. 5.46 5.47 6.62 6.98 7.35 7.93 8.04 8.50 8.41 8.74
24hrRange 2.59 2.51 2.35 2.30 2.07 2.06 1.74 1.69 1.69 1.66
Future Scenario_5 (June- Sept running 5
aerators at ZOI)
24hrAvg 8.22 8.30 9.24 9.68 9.51 10.17 9.79 10.21 10.10 10.57
24hrMin. 5.87 5.82 7.08 7.42 7.52 8.19 8.10 8.62 8.44 8.80
24hrRange 2.35 2.32 2.17 2.16 1.99 1.97 1.69 1.64 1.67 1.63
Future Scenario_6 (scenario1+ scenario_4)
24hrAvg 9.27 9.60 10.06 10.67 10.07 10.81 10.06 10.49 10.21 10.66
24hrMin. 6.57 6.73 7.67 8.22 7.98 8.65 8.31 8.77 8.52 8.83
24hrRange 2.70 2.66 2.39 2.38 2.09 2.09 1.75 1.70 1.69 1.66
127 | P a g e

Impact of Advanced Treatment and Management Measures Implementation of advanced wastewater treatment (Scenario 2) had no effect on E. coli concentrations in the non-tidal segment (Table 9.2) nor Enterococci in the tidal segment (Table 9.3) beyond those provided by the management measures identified by stakeholders.
However, SWAT predicts significant reductions (>20 fold) in phosphorus (PO4) and algae (as chlorophyll α or CHLA) with implementation of advanced wastewater treatment (Scenario 2). These reductions resulting from advanced treatment (Table 9.2) in turn are predicted by CE-QUAL-W2 to translate into significant improvements in DO and attainment of water quality standards (Table 9.4).
Impact of Spring Restoration and Management MeasuresRestoration of the Llano Grande Lake spring (Scenario 3) had little effect on E. coli, nutrient, or chlorophyll α concentrations in the non-tidal segment (Table 9.2) or Enterococci (Table 9.3) or DO concentrations (Table 9.4) in the tidal segment beyond those provided by implementation of management measures.
Impact of Implementation of Aerators in Zone of ImpairmentResults from CE-QUAL-W2 indicate installation of aerators in the zone of impairment to be extremely effective. Essentially all aerator implementation scenarios modeled resulted in DO water quality standards attainment (Table 9.4).
Discussion and Conclusions Implementation of key agricultural, WWTF, OSSF, urban, and instream management measures (Scenario 1) and the increased wastewater discharges and landuse changes expected as a result of continued population growth are predicted to result in reduced E. coli concentrations in the non-tidal segment (Segment 2202) allowing that segment to meet state water quality standards. Similarly, SWAT predicts slight increases in DO concentrations in the non-tidal segment resulting from implementation of these planned measures and higher continuous stream flows from the increased wastewater discharges. Further, the planned management measures (Scenario 1) are predicted to result in “near attainment” of the DO criteria in the zone of impairment.
Several options were identified for achieving “full attainment” of the DO criteria in the tidal segment’s zone of impairment. Both implementation of advanced wastewater treatment (Scenario 2) and installation of aerators in the zone of impairment (Scenarios 4-6) resulted in attainment of the DO criteria in the tidal segment.
128 | P a g e

A combination of implementation of the planned management measures identified, voluntary implementation of advanced treatment where possible, and installation of aerators in the zone of impairment should be pursued to restore the recreation and aquatic life uses of the Arroyo Colorado.
Finally, despite greater than 50% reductions in Enterococci, none of the proposed measures resulted in full attainment of recreational use standards throughout the tidal segment according to CE-QUAL-W2. However, it should be noted that because all planned management measures were not modeled, modeling results should be viewed as conservative estimates. For instance, connecting colonias and high density OSSFs areas to WWTFs was not included in the model. Such connection would result in significant reductions in bacteria loading to the Arroyo. It is expected that full implementation of the Arroyo WPP will result in full restoration of the designated uses in the Arroyo Colorado.
129 | P a g e

Chapter 10 – Education and OutreachAn essential element of this WPP is an effective education and outreach campaign. Long-term commitments from stakeholders are needed to accomplish comprehensive improvements in the Arroyo Colorado watershed. The education and outreach component of implementation will focus on keeping the stakeholders informed of project activities, provide information about appropriate management practices, and assist in identifying and forming partnerships to lead the effort.
The Watershed CoordinatorThe watershed coordinator leads efforts to establish and maintain working partnerships with watershed stakeholders and serves as a primary point of contact for WPP implementation. Future roles of the watershed coordinator are maintaining stakeholder support, assisting with identifying and securing needed funds to implement WPP components, coordinating and monitoring efforts to implement the WPP, tracking the WPP success, reporting implementation outcomes, and working to effectively include adaptive management into the long-term WPP implementation process.
Arroyo Colorado PartnershipThe Arroyo Colorado Watershed Partnership (Partnership) is a coalition of organizations and concerned citizens committed to restoring and protecting the aquatic resources of the Arroyo Colorado-LLM Estuarine System.
The Partnership is structured in a way that allows discussion and input from all participants while retaining the ability to make decisions in an organized and timely manner. Members of the Partnership participate in decision-making through work groups that focus on issues affecting the health of the Arroyo Colorado. Work groups report to a steering committee composed of Partnership members with diverse backgrounds and interests. The steering committee receives recommendations from work groups and makes decisions on behalf of the Partnership based on these recommendations.
The Partnership has been in existence for 17 years and grew out of two smaller groups of local stakeholders formed in 1998 as part of the TCEQ’s Total Maximum Daily Load process to address DO impairments. The groups went by the names Arroyo Colorado Total Maximum Daily Load Steering Committee and Science and Technology Advisory Committee. These groups merged to form the present Partnership and develop a WPP for the Arroyo Colorado, which was completed in 2006. WPP implementation began in 2007.
In 2012, the Partnership decided to update the WPP to address the bacteria impairment and to update the WPP through the adaptive management process. Over the course of the 10-year
130 | P a g e

implementation period of the WPP, the Partnership had to address the fact that several Steering Committee members were leaving the group due to changing job positions, health issues and retirement. In an effort to streamline the original organizational structure, the group decided to scale back the number of SC members to 12 and reduce the number of workgroups to 4 by merging some of the work groups together.
The four Work Groups that remained are as follows: Wastewater Infrastructure Agricultural Issues Habitat Restoration Outreach and Education
The new structure of the group was utilized to develop the WPP update. The Partnership hosted a total of 46 meetings between 2012-2016 with participation and input from hundreds of stakeholders. There were 15 steering committee meetings, 11 habitat workgroup meetings, 7 agricultural issues workgroup meetings and 12 Education & Outreach (E&O) work group meetings held. Through these meetings, the Partnership was able to reach a consensus on how to address the impairments, which BMPs to use and which management measures to be included in the WPP update.
Education and Outreach PlanSince completion of the original WPP, the E&O plan has been successfully implemented. It was designed to educate watershed residents including children, officials, and educators about the importance of the Arroyo Colorado and how they can help protect and restore it. E&O efforts have been received with great enthusiasm and have encouraged additional E&O efforts. The following is information on specific programs and activities of the Arroyo Colorado E&O plan.
Website, Monthly UpdatesThe watershed coordinator will continue to host the Partnership website <http://arroyocolorado.org/>, and post updates to the website as necessary. Monthly emails will be distributed to stakeholders to keep them informed on the WPP implementation progress.
Classroom PresentationsThe watershed coordinator provides educational presentations to school districts in the watershed. The Partnership has worked with 17 school districts in the watershed and the UTRGV Coastal Studies Lab to provide environmental education opportunities to children of all ages in the watershed.
Arroyo Colorado Watershed ModelA scaled model of the Arroyo Colorado watershed that illustrates the topography and geography of the watershed is used extensively across the watershed to demonstrate watershed hydrology
131 | P a g e

and how point and NPS pollution move through and influence the Arroyo Colorado. During a presentation, students can locate towns and other landmarks near them and can then simulate pollutants such as fertilizer, leaking oil from cars, improper disposal of household hazardous waste, etc. using drops of food coloring. The model is then sprayed with water to simulate rainfall and runoff. This exercise enables them to visualize how pollution washes off the land and is transported to the Arroyo Colorado and the LLM. This model has been used and displayed at multiple events, festivals, classrooms, workshops and trainings throughout the watershed. The model was such a success that a second model was constructed in 2010. Since 2007, both watershed models have been displayed at 221 events and viewed by over 100,000 watershed residents.
Aquifer ModelAn aquifer model is used to demonstrate surface and groundwater interactions. The model consists of a “cross section” of land within a clear plexiglass frame. The cross section includes a Rio Grande River channel, the Arroyo Colorado, North Floodway, septic tanks, underground storage tanks and water wells. The participants are able to see how groundwater travels underground and how it can be impaired by improper handling and disposal of pollutants.
Earth DayEach year more cities within the watershed are hosting their own Earth Day events. Goals of these Earth Day events are:
Education – To educate the public about the Arroyo Colorado watershed, the LLM, preservation of native habitats, and the importance of clean air, clean water and a clean environment.
Conservation– Teach citizens to become environmentally proactive in their day-to-day lives. Demonstrate how easy and important it is to reduce, reuse, and recycle, as well as to compost and conserve energy, water and other resources.
Habitat Protection – Encourage protection of native habitats, such as seagrasses, by promoting low-to no-impact outdoor activities such as kayaking, windsurfing, birding, fly-fishing, gardening and hiking.
Participation– Facilitate the active engagement of our visitors with local groups, such as the Arroyo Colorado Audubon Society, the South Texas Master Naturalists and Master Gardeners, Valley Proud Environmental Council, the local Farmer’s Market, Sierra Club and Surfrider Foundation.
Lower Rio Grande Valley Development CouncilThe Lower Rio Grande Valley Development Council (LRGVDC) is a critical partner to improving water management in the LRGV. This voluntary association of local governments was created in 1967 to deal with regional planning needs that cross the boundaries and jurisdictions of individual local governments. The LRGVDC accomplishes this through
132 | P a g e

cooperative action within Cameron, Hidalgo and Willacy counties and municipal governments in the region. The LRGVDC provides an effective link between both federal and state government programs and the cities and counties where people are served. The purpose of the LRGVDC is to plan for the unified, far-reaching development of the region, eliminate duplication of services and promote economy and efficiency in government services through coordinated efforts. Services are undertaken in cooperation with member governments, the private sector, and state and federal partners, include promoting regional environmental quality planning. The LRGVDC is leading efforts to develop strategies for long-term water supply alternatives, serving as administrative agent for the Rio Grande Regional Water Planning Group. Since 1975, the LRGVDC has served as the state-designated Areawide Wastewater Management Planning Agency, which works with area communities to coordinate and enhance natural resources in the Rio Grande Valley. LRGVDC recognizes the importance of education and outreach in addressing water quality issues and will be a critical partner in increasing public awareness towards water quality. For more information on the LRGVDC, see their website at http://www.lrgvdc.org/.
Valley Proud Environmental CouncilValley Proud Environmental Council is a nonprofit organization founded in 1990 whose mission is to preserve the natural beauty and environment of the LRGV of Texas and Mexico by promoting education and public awareness projects, including those that encourage proper tree planting and maintenance, solid waste management and responsible behavior by all those who live and visit here. Valley Proud has developed partnerships between grassroots volunteer organizations and the public and private sectors, which support the projects and result in improving the quality of life, enhancing economic development and tourism, and which conserve public and natural resources. Valley Proud coordinates the annual, Valley Wide Trash Bash, monthly trash cleanups, beach cleanups, E&O programs, Arbor Day Events and Rio Reforestation.
Rio ReforestationThe LRGV National Wildlife Refuge participates in many events throughout the year, which are fun, educational and help wildlife. One of the most important events the refuge hosts every year is Rio Reforestation. This popular event draws volunteers from across the Lower Rio Grande Valley who spend a half-day helping plant native trees and shrubs on the refuge. To date, volunteers have planted nearly 200,000 seedlings on nearly 620 acres of the refuge.
Valley Environmental SummitThe Valley Environmental Summit was established in 2009 by Representative Eddie Lucio III in cooperation with the TCEQ. The summit brings together the public, political leaders, neighborhood associations, nonprofits, businesses, students, and others to “identify
133 | P a g e

environmental issues, potential solutions, and promote a synergy between the community and elected officials.”
Arroyo Colorado Curriculum Teacher WorkshopsTWRI and the Partnership were awarded a CWA Section 319 TCEQ grant in 2016 to partner with Region 1 Education Service Center to expand E&O efforts in the watershed. The Partnership in conjunction with Region 1 Education Service Center will host Arroyo Colorado Curriculum Educator workshops. The workshops will provide science teachers with an overview of the Arroyo Colorado watershed, its function, impairments, and how to integrate the Arroyo Colorado curriculum into their lesson plans through “hands on” exercises and experiment
Soil Testing Campaign The soil testing campaign is offered by TWRI in cooperation with the Texas A&M AgriLife Extension Service and TSSWCB to encourage proper nutrient management in both agricultural and urban areas. The Partnership will work with County Extension Agents to provide free soil testing opportunities. The Partnership has been administering the soil testing campaign since 2006, receiving the TCEQ’s Environmental Excellence Award for pollution prevention in 2009.
Educational PSAsThe Partnership developed and aired two educational Public Service Announcement (PSAs) focusing on (1) agricultural production and the soil testing campaign and (2) stormwater runoff and stormwater pollution prevention. These PSAs were aired on local television stations between 2011 and 2013. The PSAs have been posted on the Partnership website arroyocolorado.org.
Roadway SignageThe Partnership obtained a permit from TxDOT to install 22 “Entering the Arroyo Colorado Watershed” and 14 “Crossing the Arroyo Colorado” signs along roadways entering the watershed and crossing the Arroyo Colorado to raise general awareness among watershed residents. Cameron County designed and installed four “Entering the LLM Watershed” and four “Entering the Arroyo Colorado Watershed” signs on major highways throughout the county.
LRGV Stormwater Task ForceOne of the main objectives for the LRGV SWTF is to educate and inform local municipalities by providing the latest training initiatives available for stormwater management. An annual LRGV Stormwater Conference is held at South Padre Island. The conference provides a forum for discussion featuring leading researchers and studies regarding innovative developments in stormwater management. In addition, various workshops and classes are held throughout the year on stormwater topics of interest such as LID practices. The Task Force also engages in various forms of community outreach such as development of municipal outreach programs, promoting
134 | P a g e

the stormwater message, stormwater outreach materials, education for homeowners, and education for businesses.
Storm Drain Markers/StencilingThe LRGV SWTF member cities worked together to install storm drain markers/stencils that read “Drains to the Arroyo Colorado/LLM” on storm drain inlets and manhole covers to educate the public as to where stormwater goes once it enters storm drains. Approximately 8,750 storm drains markers have been installed throughout the watershed. An additional 500 storm drains were stenciled by schools throughout the watershed.
Interpretive Centers / KiosksIn February 2012, two interactive kiosks were placed in the Estero Llano Grande World Birding Center and the Valley Nature Center located in Weslaco. Displays include maps, videos, and educational information regarding the Arroyo Colorado. These kiosks bring awareness of water quality impairments and concerns facing the Arroyo Colorado, where we get our drinking water, and how everyone plays a role in protecting that water. The educational kiosks were developed by the Guadalupe-Blanco River Authority for the Partnership through a TSSWCB grant. The kiosks are updated with current information when needed.
Don’t Mess with Texas Water The Don’t Mess with Texas Water (DMWTW) program works to help prevent illegal dumping that could contaminate surface waters in Texas. Through the program, TxDOT works with participating communities to place signs on major highway water crossings that notify drivers of a toll-free number to call to report illegal dumping. In October of 2012, the first two DMWTW signs were unveiled in Harlingen on the US 77 frontage road overlooking the Arroyo Colorado. Currently the cities of Harlingen, Brownsville, McAllen, and San Benito are participating in the program. Other local governments are encouraged to join the program. For more information, visit the program website: <www.tceq.texas.gov/p2/dont-mess-with-texas-water-a-way-to-report-illegal-dumping>. “Don’t Mess with Texas®” is a registered trademark of TxDOT.
Statewide Programs and CampaignsNumerous agencies provide educational workshops covering a variety of topics. Several workshops discussed below were conducted during WPP implementation and WPP update development. The Partnership will work with program coordinators and the lead agency for each of these workshops to offer them to the stakeholders in the future.
Texas Watershed Steward This program is implemented through a partnership between Texas A&M AgriLife Extension Service and the TSSWCB. The program provides science-based, watershed education to help citizens identify and take action to address local water quality impairments. Texas Watershed
135 | P a g e

Stewards learn about the nature and function of watersheds, potential impairments, and strategies for watershed protection.
Texas Riparian WorkshopThe Texas Riparian Workshop is an educational training offered by TWRI in cooperation with the TSSWCB and other partner agencies and organizations. Training focuses on water quality issues including the key role riparian areas play in helping improve and protect water quality in the area. Topics covered include: the definition of a watershed and riparian area, riparian vegetation ratings, how to photo monitor, and local resources for landowners.
Texas Well Owner Network (TWON) and OSSF Maintenance The TWON program is an educational training offered by the Texas A&M AgriLife Extension Service in cooperation with the TSSWCB and other partner agencies and organizations. The TWON program is for Texas residents who depend on household wells for their drinking water needs and want to become familiar with Texas’ groundwater sources, water quality, water treatment, and well maintenance issues. OSSF maintenance is a one-hour component of the workshop, or can be offered separately as a two-hour workshop.
Lone Star Healthy Streams This program is implemented through a partnership between the Texas A&M AgriLife Extension Service and the TSSWCB. Its goal is the protection of Texas waterways from bacterial contamination originating from livestock operations and feral hogs that may pose health risks to Texas citizens. To achieve this goal, the program's objective is the education of Texas farmers, ranchers, and landowners about proper grazing, feral hog management, and riparian area protection to reduce the levels of bacterial contamination in streams and rivers.
136 | P a g e

Chapter 11 – Water Quality Monitoring PlanWater quality monitoring is critical for tracking progress toward meeting WPP goals and quantifying improvements in the Arroyo Colorado. In addition to ensuring that changes in water quality in the Arroyo Colorado are recognized and documented, water quality will provide the tools necessary to implement the load reduction measures specified in the plan using an adaptive management approach. The information provided by the monitoring efforts described in this section will be used by the Partnership to adjust implementation efforts as needed and to develop subsequent updates to the plan.
Historical MonitoringThe TCEQ and other entities began monitoring water quality in the Arroyo Colorado in 1974. There are 164 documented Surface Water Quality Monitoring (SWQM) stations in the Arroyo Colorado watershed, 36 of which are on the main stem of the Arroyo Colorado. Not all stations are currently active as many were established for special, short-term monitoring projects or have been deactivated for other reasons (changing hydrologic conditions, external influence, safety). Water quality data collected at these sites are stored in the state’s SWQM database and available online. Data in this database provide information used by TCEQ in their biennial state-wide water quality assessments, which use a seven-year moving window of time to ensure that recent water quality is adequately reflected. Assessments are conducted to ensure that water bodies are in compliance with water quality criteria specified in the Texas Surface Water Quality Standards. Additionally, historic data provide a benchmark for evaluating changes in water quality over time and thus will be used to evaluate WPP implementation effectiveness in the future.
Current MonitoringTCEQ and NRA respectively monitor water quality in the Arroyo Colorado under the TCEQ’s Surface Water Quality Monitoring (SWQM) program and Clean Rivers Program (CRP). Through this program, active stations are monitored quarterly and data collection includes field and conventional parameters at a minimum. Selected stations are also monitored for bacteria, flow, toxic compounds, metals and toxicity. A complete list of field and conventional parameters can be found in Table 11.1.
Current monitoring in the Arroyo Colorado Watershed consists of ten routine sites, which are monitored quarterly. Four of the sampling sites are in the Arroyo Colorado Tidal Segment and six sites are in the Arroyo Colorado Above Tidal Segment (Figure 11.1). Table 11.1 shows a summary of the current coordinated monitoring schedule. The NRA monitors three sites in the Above-Tidal segment. The TCEQ Field Office conducts routine monitoring at four sites in the Tidal segment and three sites in the Above-Tidal segment.
137 | P a g e

In May 2014, TCEQ and USGS deployed a continuous water quality monitoring station in the tidal segment at the FM 106 bridge in Rio Hondo. The automated monitoring station collects water quality measurements, including DO, hourly at four depths. Currently no other 24-hour DO data collection, besides the USGS station is being conducted on a routine basis. However, there have been a few special studies that have collected 24-hour DO data.
Figure 11.1: Location of water quality monitoring stations on the Arroyo Colorado currently monitored routinely by the TCEQ and the NRA.
138 | P a g e

Table 11.1: Description of sampling locations, parameters analyzed, sampling frequency and agency currently conducting water quality sampling in the Arroyo Colorado. Sample Location Segment Parameter Frequency Agency13084 – Upper 19 miles at U.S. 281 South Pharr
2202 Conventional 4 TCEQ Region 15Bacteria 4
Flow 4Field 4
13081 – Lower 4 miles – Main Floodway in Llano Grande at FM 1015 South of Weslaco
2202 Conventional 4 TCEQ Region 15Bacteria 4
Field 413080 – At FM 506 South of La Feria
2202 Conventional 4 NRABacteria 4Flow 4Field 4
16445 – At Low Water Crossing at Dilworth Road East of La Feria
2202 Conventional 4 NRABacteria 4Flow 4Field 4
13079 – At US 77 in SW Harlingen 2202 Conventional 4 NRABacteria 4Flow 4Field 4
13074 – 14 miles upstream to 11 miles downstream of FM 1015 at Low Water Bridge at Port of Harlingen
2202 Conventional 4 TCEQ Region 15Bacteria 4
Field 4
13072 – Upper 4 miles – FM 106 Bridge at Rio Hondo
2201 Conventional 4 TCEQ Region 15
USGS/TCEQ
Field 4DO ContinuousTemp ContinuousSpecific Conductance
Continuous
13073 – At Camp Perry North of Rio Hondo
2201 Conventional 4 TCEQ Region 15Field 4
13071 – At Marker 22 (Mile 10) 81 meters upstream from San Vicente Drainage Ditch
2201 Conventional 4 TCEQ Region 15Field 4
13782 – Lower 9 miles near CM 16 at Arroyo City, KM 10.9
2201 Conventional 4 TCEQ Region 15Field 4
(Source: CRP 2016 Coordinated Monitoring Schedule available at http://cms.lcra.org/).
139 | P a g e

Arroyo Colorado Watershed Plan Monitoring PlanFuture monitoring in the watershed is necessary for demonstrating WPP implementation impacts and general improvements in water quality. Generally, two types of monitoring are needed: routine watershed monitoring and implementation effectiveness monitoring.
Routine Watershed MonitoringMonitoring conducted through the SWQM and CRP programs by TCEQ and NRA provides an excellent dataset and basis for evaluating water quality changes and trends over long time periods. Continuing existing data collection at the stations currently monitored is necessary to support future assessments (Figure 11.1). It is expected that TCEQ and NRA will continue to collect data at these stations using existing and future funding resources.
Routine bacteria sample collection is needed in the tidal segment of the water body as no current bacteria monitoring is being conducted. Implementing bacteria sampling is necessary to track changes in bacteria concentrations over time. Maintaining support and funding for 24-hour DO monitoring being conducted in the watershed is also necessary for determining future changes in DO concentrations. At a minimum, funding to continue the current 24-hour DO monitoring conducted by USGS in the watershed will be sought. The Partnership will work to support these additional data collection needs identified in the WPP.
Implementation Effectiveness MonitoringTargeted water quality monitoring is also needed to enable specific implementation effects to be quantified. In many cases, it is extremely difficult or impossible to observe water quality changes instream as a result of small-scale implementation through routine monitoring efforts. Spatially and temporally refined monitoring approaches are needed in these situations to clearly demonstrate the effects of installed management practices. This type of monitoring can take many forms depending on the type of implementation effort being evaluated. Monitoring schemes could include plots, pre/post implementation, upstream/downstream (inflow/outflow for stormwater BMPs), paired watershed, or multiple watersheds can all be used to effectively quantify implementation impacts (USDA NRCS 2003). Specific monitoring efforts should be considered when planning implementation activities to allow for appropriate monitoring selection, implemented at the appropriate time, and carried out for a sufficient duration. Too often, monitoring programs are implemented as an afterthought and destined to produce poor results. Monitoring needs should be considered with all future implementation projects to ensure that BMP effectiveness can be accurately quantified thus allowing larger effects across the watershed to be calculated.
140 | P a g e

Chapter 12 – Measuring SuccessMeasuring the impacts of implementing a WPP on instream water quality is a critical, yet inherently complicated, process due to ever changing conditions in the watershed. Planned water quality monitoring at critical locations will provide needed data to document water quality changes over time and provide data needed to document progress toward achieving water quality goals for the watershed. While improvements in water quality are the preferred measure of success, documenting implementation accomplishments will also be used to measure implementation success. Combined, data on water quality collected over time and implementation accomplishments will facilitate adaptive management by illustrating what recommended measures are working and which measures need modifications.
Water Quality Target Assessment PlanThe ultimate goal of the Partnership and the WPP is to restore measured instream bacteria in segments 2201 and 2202 and DO concentrations in segment 2201 to meet designated water quality standards. In the tidal segment (2201), this target is a geometric mean of 35 cfu/100 mL of enterococci while the target in the non-tidal segment (2202) is a geometric mean of 126 cfu/100 mL of E. coli. Targets based on modeling of expected impacts of implementation are shown in Table 12.1 for E. coli and Enterococci. Table 12.1 demonstrates that by 2023, it is estimated that the non-tidal segment (2202) will not exceed the geometric mean E. coli concentration of 126 cfu/100 mL. Additionally, the tidal assessment unit 2201_03 is estimated to come into compliance with the Enterococci geometric mean of 35 cfu/100 mL by 2023. However, assessment units 2201_04 and 2201_05 do not come into compliance during the 10-yr implementation period. It is projected that these will come into compliance however by 2029 for 2201_04 and 2030 for 2201_05 if implementation continues.
Table 12.1: E. coli* and Enterococci interim targets for evaluating effectiveness based on modeled results AU. (Non-attainment shown in Red font).
Timeframe 2202_01* 2201_05 2201_04 2201_03 2201_02 2201_01
Existing baseline 151 101 82 53 31 212023 104 72 60 40 25 182028 57 43 37 26 19 15
For the DO impairment in the Tidal segment the target is to meet the 24-hour DO minimum standard of 3 mg/L. Targets based on modeling of expected impacts of implementation are shown in Table 12.2 for DO. Table 12.2 demonstrates that by 2023, assessment unit 2201_04 will comply with minimum DO criteria and by 2028, the entire segment will comply with the
141 | P a g e
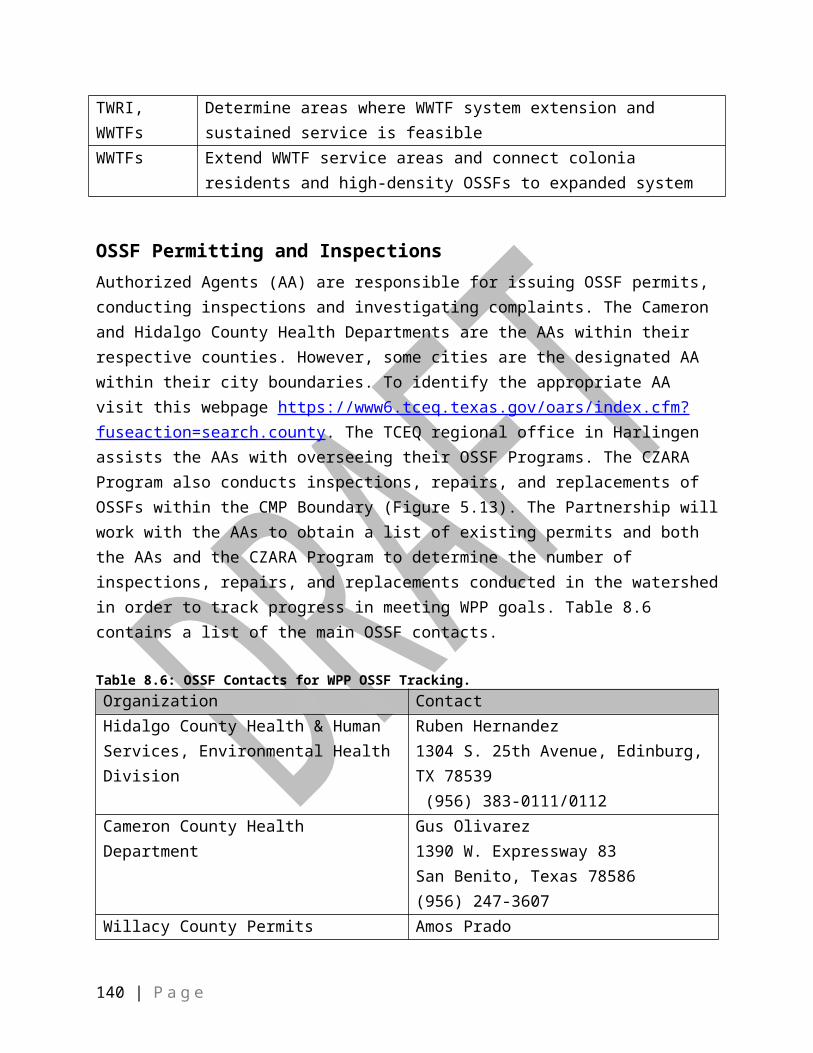
DO criteria due to the implementation of aerators in the zone of impairment and management measures throughout the watershed.
Table 12.2: DO interim targets (% time each criterion is met) for evaluating effectiveness based on modeled results. (Non-attainment shown in Red font).
Timeframe Criteria24 Hr. DO by AU
Zone of Imp. Below Zone of Imp.
2201_05 2201_04 2201_03 2201_02 2201_01
Existing baselineAverage (>4mg/L) 97% 96% 97% 98% 99%
Minimum (>3mg/L) 77% 88% 95% 98% 99%
2023Average (>4mg/L) 97% 96% 96% 98% 99%
Minimum (>3mg/L) 84% 90% 94% 97% 98%
2028Average (>4mg/L) 97% 95% 95% 97% 98%
Minimum (>3mg/L) 92% 93% 93% 96% 97%
While specific interim targets have not been established for nutrients, sampling analysis results for nitrate nitrogen and orthophosphorus from ambient water quality monitoring will also be tracked and reported. The watershed coordinator should pay special attention to developing reporting tools that can effectively convey water quality changes to stakeholders. The environmental indicator for nutrient concerns such as nitrate nitrogen and orthophosphorus will be based on the TCEQ Surface Water Quality Monitoring Procedures, Volume 1: Physical and Chemical Monitoring Methods for Water, Sediment, and Tissue, 2008 (RG-415) (TCEQ 2008d) for assessing streams using narrative criteria for nutrients, which is demonstrating that no more than 20 percent of the values in a seven-year monitoring period exceed the TCEQ screening level.
Data ReviewThe Partnership will primarily use TCEQ’s statewide biennial water quality assessment approach to evaluate WPP implementation. These assessments use moving seven-year geometric means of E. coli and enterococci data collected through the state’s CRP program. The minimum and average DO is also assessed in this report. This assessment is published in the Texas Integrated Report and 303(d) List, which is made readily available online at <http://tceq.texas.gov>. It should be noted that this list incorporates a two-year lag in data reporting. For example, the 2014 303(d) List considers water quality data collected between December 1, 2005 and November 30, 2012. As a result, the 2020 303(d) List is likely to be the first list inclusive of water quality data collected during WPP update implementation. The NRA is the CRP partner for the watershed and collects, manages and delivers this data to TCEQ for inclusion in their Surface Water Quality Monitoring Information System. The TCEQ Regional Office in Harlingen also collects routine data that is included in this database. Data can be acquired from this database and will likely include information not considered in the most recent biennial assessments.
142 | P a g e

The secondary approach will be to assess implementation effectiveness monitoring data to quantify practice specific water quality impacts. Once quantified, results can be extrapolated to the watershed to estimate pollutant loading reductions watershed-wide. This will be especially useful in gauging implementation success and informing adaptive management in the WPP.
Should water quality data not meet the targets or considerable progress not be made in meeting those values, the partnership will discuss the deficiency and the potential need to adjust the WPP and its management recommendations. This discussion will include changes in water quality as compared to implementation and influences on water quality across the watershed.
Interim Measurable MilestonesMilestones are useful for incrementally evaluating the implementation progress of specific management measures recommended in the WPP. Milestones outline a clear tracking method that illustrates progress toward implementing management measures as scheduled. They are simply goals of when a specific practice or measure is targeted for implementation and may be completed sooner or slower than planned in some cases. As needed, adaptive management will be employed to reevaluate the goal and modify plans as needed. At a minimum, implementation progress should be evaluated five years following the start of implementation to document progress and make adjustments to the plan as needed. This will allow ample time for funding to be secured, implementation to progress and data to be collected that will support needed adaptations to the recommended management implementation strategy.
Milestones are separated into short-, mid- and long-term increments. Short-term milestones should be accomplished quickly using existing or available resources during the first three years of WPP implementation. Midterm milestones take more time to complete and likely need additional funds secured before they can be implemented. This is likely to occur within four to six years of beginning to implement the WPP. Long-term milestones are management measures that will take longer to plan, acquire funds and implement. Significant time will be needed to secure funding and begin the implementation process of these measures. This group of milestones will begin to be implemented seven years after WPP implementation has begun.
Interim measurable milestones are identified in the implementation schedule presented in Table 13.1-13.2 in Chapter 13.
143 | P a g e

Chapter 13 – Plan ImplementationWPP implementation focuses on management measure implementation and education and outreach programming. This chapter provides further details on the implementation goals, scheduling, technical and financial assistance needs, and responsible parties for successful implementation of this plan. The implementation schedules presented in table 13.1 (management measure implementation), table 13.2 (education and outreach implementation), and table 13.3 (implementation cost estimates) reflect best estimates for the 10 year implementation period.
Table 13.1. Management measure implementation schedule and responsible parties.
Management Measure Responsible PartyPlanned Implementation Goal
UnitsYear 0-3 Year 4-6 Year 7-10
Agriculture and Livestock Management Measures
WQMPs/RMSNRCS, TSSWCB, SWCD, Producers
90 90 120New/updated WQMP/RMS
SWCD technician (technical assistance)
TSSWCB, NRCS, SWCDs
1SWCD Tech.
(FTEs)WWTF PermitsUpdate remaining 30/90 permit
WWTFs, TCEQ 0 1 0Permits Updated
>1 MGD facilities’ permits updated to 10/15
WWTFs, TCEQ 0 1 0Permits Updated
>1 MGD facilities’ permits updated to 7/12/3
WWTFs, TCEQ 0 0 10Permits Updated
Improve/expand wastewater treatment
WWTFs 5 Facilities
SSOs and InfrastructureReduce SSOs by 5% from FY 2015 total
WWTFs 1% 2% 2% % Reduction
Increase participation in TCEQ SSO initiative
WWTFs and TCEQ
1 1 1WWTFs
participatingOSSF and colonias Management MeasuresOSSF inventory/ database development/ inspection
Counties Plan Develop Complete
OSSFs repaired/ replaced
Counties 50 125 125 OSSF
Households connected to WWTF
WWTFs 50 50 50 Households
144 | P a g e

Habitat Management Measures
Wetland creation Landowners, NRCS, USFWS, TPWD
50 50 50 Acres created
Land protected through purchase or easement
USFWS, TPWD, landowners
50 50 50 Acres
Enhanced Wastewater Treatment & ReuseSan Benito Phase II San Benito, GLO 10 AcresSan Benito Phase III San Benito, GLO 65 AcresPharr Reuse Retention Facility/R.O. program
Pharr 1 Facility
Ramsey Park Harlingen 5 AcresWetland/ponds for dredge spoils
POHDesign wetland
Construct wetland
Stormwater detention Projects Hickery Hill Park Harlingen 46 AcresPalm Valley stormwater pond rehabilitation
Palm Valley 20 Acres
Flood Abatement BMPs
Tio Cano LakeLa Feria, USFWS, TPWD, Cameron County
400 Acres
Urban Stormwater Management Measures
MS4 mapping Cities 1 1 1# of cities mapped
Drainage boundary refinement
TBD PlanConduct
StudyUpdate WPP
Urban forestry-tree census
Cities 1 1 1# of cities
participatingTrees planted 50 50 50 # plantedLandscaping / greenspace ordinances
Cities 2 2 2 # developed
Create urban parks/trails Cities 2 2 2 # createdNew LID ordinances Cities 1 1 1 # developedRecycling programs Cities 1 1 1 # startedPet waste station installation & maintenance
Partnership, Cities 50 50 50 # installed
Video monitoring of illegal dumping
Cities and Counties
10 10 10# of cameras
installedInventory common illegal dump sites
TBD PlanConduct
InventoryUpdate WPP
145 | P a g e

Instream Management Measures
Turning basin aerators POHEval. DO & develop
plan
Install aerators
Evaluate DO levels
# of aerators installed
In-stream aeration structures (non-tidal segment)
POH, city of Harlingen, Partnership
3# of aeration
structures
Llano Grande Lake dredging
City of Mercedes, TPWD, POH, IBWC, USACE
PermittingBegin
Dredging
Technical Assistance Watershed coordinator 1 FTEMonitoring
Routine monitoring NRA, TCEQ 36 36 48Monthly sampling
146 | P a g e

Table 13.2. Education and outreach implementation schedule and responsible party.
Education & Outreach Activity Responsible PartyPlanned Delivery Goal
Year 0-3 Year 4-6 Year 7-10Partnership meetings TWRI 12 12 16Website, monthly updates TWRI 36 36 48Classroom presentations TWRI 3 3 4Earth Day Cities 3 3 4Valley Wide Trash Bash, trash cleanups, beach cleanups, Arbor Day Events, Rio Reforestation
Valley Proud Environmental Council
3 3 4
Valley Environmental Summit TCEQ 3 3 4Arroyo Colorado curriculum teacher workshop
TWRI, Partnership 1
Roadway signage inspection & maintenance
TWRI, TxDOT, Partnership 1 1 1
Storm Drain Markers/Stenciling inspection & maintenance
LRGV SWTF 1 1 1
Educational PSAs TWRI, Partnership 1 1 1Interpretive centers / kiosks WBC, Valley Nature
Center, TWRI, Partnership2 2 2
Don’t Mess with Texas Water TCEQ, TxDOT 1Pet waste awareness Partnership, TWRI 3 3 4
Soil testing campaignTWRI, Extension, TSSWCB
3 3 4
I/I workshops & training ExtensionDevelop
workshop1 1
Texas Watershed Steward Extension 1 1Texas Stream Team training Meadows Center 1 1 1Texas Riparian workshop TWRI, Extension 1 1Texas Well Owners Network Extension 1 1 1OSSF Maintenance workshops Extension 1 1 1Healthy Lawns – Healthy Streams
Extension 1 1 1
BMP / cost share education TWRI, Extension 3 3 4Lone Star Healthy Streams Extension 1 1 1
147 | P a g e

Table 13.3. Management measure responsible parties and costs.
Management MeasureResponsible
PartyImplementation
Goal Unit cost Total Cost
Agriculture and Livestock Management Measures
WQMPs/RMSNRCS, TSSWCB, SWCD, Producers
300 $30,000 ea $9,000,000
WWTF Update remaining 30/90 permit
WWTFs, TCEQ 1 NA NA
>1 MGD facilities’ permits updated to 10/15
WWTFs, TCEQ 1 NA NA
>1 MGD facilities’ permits updated to 7/12/3
WWTFs, TCEQ 10 NA NA
Improve/expand wastewater treatment
WWTFs 5$7,500,000 -
$15,000,000 ea$62,500,000
SSOs and InfrastructureReduce SSOs by 5% from FY 2015 total
WWTFs 5% TBD TBD
Increase participation in TCEQ SSO Initiative
WWTFs and TCEQ
3 NA NA
OSSF and colonias Management MeasuresOSSF inventory/database development/inspection
Counties 1 $42,000/yr $420,000
OSSFs repaired/replaced Counties 300 $7500/ OSSF $2,250,000Households connected to WWTF
WWTFs 150 $2,000 ea $300,000
Habitat Management Measures
Wetland creationLandowners, NRCS, USFWS, TPWD
150 ac$229-$343/ac based on 2017 NRCS cost list
$42,900
Land protected through purchase or easement
USFWS, TPWD, landowners
150 ac $20,000/ac $3,000,000
Enhanced Wastewater Treatment & ReuseSan Benito Phase II San Benito 10 $200,000San Benito Phase III San Benito 65 $200,000Pharr Reuse Retention Facility/R.O. program
Pharr 1 $10,000,000
Ramsey Park Harlingen 5 $400,000Wetland for dredge spoils POH 1 $10,000,000Stormwater detention Projects Hickery Hill Park Harlingen 46 $2,500,000Palm Valley stormwater pond rehabilitation
Palm Valley 20 $2,500,000
148 | P a g e

Management Measure Responsible Party
Implementation Goal
Unit cost Total Cost
Flood Abatement BMPs
Tio Cano LakeLa Feria, USFWS, TPWD, Cameron County
400 $12,000,000
Urban Stormwater Management Measures MS4 mapping Cities 3 TBD TBDDrainage boundary refinement
TBD 1 TBD TBD
Urban forestry-tree census
Cities 3 TBD TBD
Trees planted 150 TBD TBDLandscaping / greenspace ordinances
Cities 6 TBD TBD
Create urban parks/trails Cities 6 TBD TBDNew LID ordinances Cities 3 TBD TBDRecycling programs Cities 3 TBD TBD
Pet waste station installation/maintenance
Partnership, Cities 150$620 ea to
install & $85/yr to maintain
$220,500
Video monitoring of illegal dumping
Cities and Counties
30 $60,000
Inventory common illegal dump sites
TBD 1 TBD TBD
Instream Management Measures
Turning basin aerators POH, Partnership TBD$100K capital +
$50K O&M$150,000
In-stream aeration structures (non-tidal segment)
POH, city of Harlingen, Partnership
3 $120,000
Llano Grande Lake dredging
TBD 1 $30,000,000
Monitoring Routine monitoring NRA, TCEQ 120 $1,000 ea $120,000Education & Outreach
Partnership meetings TWRI 40Included in Watershed
Coordinator Costs
Website, monthly updates TWRI 120Included in Watershed
Coordinator Costs
Classroom presentations TWRI 10Included in Watershed
Coordinator CostsEarth Day Cities 10 NA NA
149 | P a g e

Management Measure Responsible Party
Implementation Goal
Unit cost Total Cost
Valley Wide Trash Bash, trash cleanups, beach cleanups, Arbor Day Events, Rio Reforestation
Valley Proud Environmental Council
10 NA NA
Valley Environmental Summit
TCEQ 10 NA NA
Arroyo Colorado Curriculum Teacher Workshop
TWRI, Partnership 1Included in Watershed
Coordinator Costs
Roadway signage inspection & maintenance
TWRI, TxDOT, Partnership
3 TBD TBD
Storm drain markers/ stenciling inspection & maintenance
LRGV SWTF 3 TBD TBD
Educational PSAs TWRI, Partnership 3 $1,750 ea $5,250
Interpretive centers / kiosks
WBC, Valley Nature Center, TWRI, Partnership
2 NA NA
Don’t Mess with Texas Water
TCEQ, TxDOT 1 $1,000 ea $1,000
Pet waste awareness Partnership, TWRI 10 $3,500/yr $35,000
Soil testing campaignTWRI, Extension, TSSWCB
10 $5,000/yr $50,000
I/I workshops & training Extension 1 $10,000Texas Watershed Steward
Extension 2 NA NA
Texas Stream Team training
Meadows Center 3 $1,000/event $3,000
Texas Riparian workshop TWRI, Extension 2 NA NATexas Well Owners Network
Extension 3 NA NA
OSSF Maintenance workshops
Extension 3 $2,500/event $7,500
Healthy Lawns – Healthy Streams
Extension 3 NA NA
BMP/cost share education
TWRI, Extension, TSSWCB
10 $79,000/yr $790,000
Lone Star Healthy Streams
Extension 1 NA NA
Technical Assistance
150 | P a g e

Management Measure Responsible Party
Implementation Goal
Unit cost Total Cost
SWCD technicianTSSWCB, NRCS, SWCDs
1 FTE $62,000/yr $620,000
Watershed coordinator 1 FTE $92,000/yr $920,000Total Cost $148,425,150
Technical Assistance NeedsSuccessful implementation of the WPP relies on active engagement of local stakeholders and will also require support and assistance from a variety of other sources. The technical expertise, equipment, and manpower required for many management measures are beyond the capacity of the local stakeholders alone. As a result, direct support from one or a combination of several entities will be essential to achieve water quality goals in the watershed. Focused and continued implementation of key restoration measures will require the continuation and/or creation of multiple full-time equivalent positions in the watershed to coordinate and provide technical assistance to stakeholders.
Implementation CoordinationWPP implementation has many moving parts and is best served by a central driving force, typically a watershed coordinator. The watershed coordinator is tasked with ensuring that efforts to implement the WPP as written are underway and are being accomplished. This includes working with responsible parties to secure implementation funds, scheduling implementation, documenting implementation and reporting on implementation progress. The watershed coordinator is also a critical driving force in the delivery of education and outreach throughout the watershed and in relating WPP implementation to water quality. Simply put, the watershed coordinator is at the helm of WPP implementation and is absolutely critical to a WPP’s success. If adaptive management is needed, the watershed coordinator facilitates needed interactions with watershed stakeholder to complete the process. An estimated annual average cost for the 10 year implementation period (including inflation) of $92,000 will be necessary for this position to cover salary, benefits, supplies, and travel expenses.
The Partnership realizes the importance of planning and implementing management at a regional level to ensure that all partners are working together to achieve WPP goals. There are a number of regional and local entities that are involved in the management of risk and natural resources. These organizations are associated with water resource management, flood control and navigation and include drainage districts, irrigation districts, soil and water conservation districts (SWCDs), Rio Grande Regional Water Authority, Lower Rio Grande Valley Development Council, Arroyo Colorado Conservancy, LRGV SWTF, and Coastal Task Force.
151 | P a g e

Expected Load ReductionsExpected E. coli and Enterococcus load reductions (Table 13.4) were estimated using modeling results and comparing current baseline (CB) to future conditions with implementation of identified measures (FS1) minus wastewater treatment plant upgrades. Annual load reductions of 56% for E. coli and 27-55% for Enterococcus are predicted upon full WPP implementation.
Table 13.4: Estimated annual E. coli and Enterococcus load reductions expected upon implementation of the Arroyo Colorado WPP.
Rch SegmentCurrent Baseline (CB) Future with Implementation (FS1) Est. Load
ReductionsFlow(cms)
Bacteria(conc.)
Annualload
Flow(cms)
Bacteria(conc.)
Annualload
10 2202_01 6.9 1541 3.4E+14 7.4 631 1.5E+14 1.9E+1412 2201_04 7.8 822 2.0E+14 8.2 372 9.6E+13 1.1E+1415 2201_02 11.1 312 1.1E+14 11.6 192 7.0E+13 3.9E+131 2201_01 21.3 212 1.4E+14 21.8 152 1.0E+14 3.8E+13
1 E. coli concentrations and loads.2 Enterococcus concentrations and loads.
A slightly different approach was taken with nutrients and sediment due to the projected increases in wastewater discharges as the LRGV population grows. Nutrient and sediment reductions (Table 13.5) were estimated for each reach using SWAT outputs and comparing future baseline (FB) conditions (i.e. future loadings without implementation) to future conditions with implementation of identified measures (FS1). Because WWTF upgrades (many of which are anticipated) were not included in these calculations, but would certainly yield additional improvements, these estimates should be viewed as conservative estimates. It should be further noted that reach outputs in Table 13.5 are not cumulative. Annual sediment loads reductions by reach averaged 7% and ranged from a 19% increase in reach 11 to a 52% reduction in reach 2. Nitrogen load reductions averaged 11% and ranged from a 4% increase in reach 14 to a 26% decrease in reach 9. Phosphorus load reductions averaged 10% and ranged from a 7% increase in reach 14 to a 19% decrease in reach 4.
It should be noted that estimates of load reductions are difficult to determine, and may change over time due to significant changes in land use and pollutant sources. However, these estimates will be used to demonstrate expected improvement toward target water quality goals for the watershed. With active local stakeholder engagement and participation in plan implementation and continued support from cooperating groups and agencies, the activities outlined here will make significant progress toward improving and protecting water quality in the Arroyo Colorado Watershed.
152 | P a g e

Table 13.5: Estimated sediment, TN, and TP load reductions expected upon implementation of the Arroyo Colorado WPP.
RCHSediment (tons/yr) TN (kg/yr) TP (kg/yr)
FB FS1 Reduction FB FS1 Reduction FB FS1 Reduction1 177,900 171,400 6,500 1,809,000 1,459,000 350,000 310,600 261,600 49,0002 8,379 4,018 4,361 202,300 201,400 900 78,870 78,500 3703 12,820 8,503 4,317 428,400 417,300 11,100 149,300 143,400 5,9004 20,960 18,670 2,290 637,300 546,300 91,000 210,700 170,400 40,3005 32,220 29,770 2,450 722,600 632,900 89,700 247,500 208,500 39,0006 39,140 37,010 2,130 835,400 724,900 110,500 244,300 205,700 38,6007 54,020 50,440 3,580 986,200 852,200 134,000 280,200 238,700 41,5008 89,640 79,370 10,270 1,152,000 971,600 180,400 312,100 254,400 57,7009 4,562 4,413 149 10,740 7,976 2,764 2,302 1,978 324
10 104,100 93,670 10,430 1,201,000 1,021,000 180,000 198,200 161,700 36,50011 9,315 11,070 (1,755) 63,870 58,620 5,250 9,913 8,898 1,01512 124,800 115,300 9,500 1,358,000 1,066,000 292,000 318,900 265,400 53,50013 7,944 8,532 (588) 26,350 25,660 690 8,455 8,138 31714 12,370 13,260 (890) 29,640 30,750 (1,110) 9,944 10,600 (656)15 152,200 145,400 6,800 1,624,000 1,316,000 308,000 302,100 253,100 49,00016 12,250 12,550 (300) 9,899 9,595 304 8,890 9,074 (184)17 13,870 13,810 60 28,600 28,130 470 3,781 3,757 24
153 | P a g e

Appendix A: List of AbbreviationsAA Authorized AgentsAPHIS Animal and Plant Health Inspection ServiceAU Assessment UnitsBBEST Grande Basin and Bay Area Expert Science TeamBMP Best Management PracticeBOD Biochemical Oxygen DemandBOD5 5-day Biological Oxygen DemandBPUB Brownsville Public Utilities BoardBST Bacterial Source TrackingCBOD Carbonaceous biochemical oxygen demand CCN Certificate of Convenience and Necessitycfu Colony Forming UnitsCIAP Coastal Impact Assistance Program Cl ChloridesCMP Coastal Management ProgramCRP Clean Rivers ProgramCWA Clean Water ActCZARA Coastal Zone Act Reauthorization AmendmentsDDE DichlorodiphenyldichloroethyleneDO Dissolved OxygenDR Designated RepresentativeE&O Education and OutreachEQIP Environmental Quality Incentives ProgramERHWCS East Rio Hondo Water Supply CorporationERIC-PCR Enterobacterial Repetitive Intergenic Consensus Sequence Polymerase Chain
ReactionFOGG Fat, Oil, Grease and GritFOTG Field Office Technical Guideft² Square FeetGI Green InfrastructureGIS Geographic Information SystemGLO Texas General Land OfficeGPM Gallons per minuteHWWS Harlingen Water Works SystemIBWC International Boundary and Water CommissionI/I Inflow/InfiltrationKg/yr Kilogram per yearkm KilometerLID Low Impact Development
154 | P a g e

LLM Lower Laguna MadreLRGV Lower Rio Grande ValleyLRGVDC Lower Rio Grande Valley Development Councilmg/L Milligrams per Litermgd Million Gallons Per DayMGY Million Gallons per YearMHWSC Military Highway Water Supply CorporationMPN Most probable numberMS4s Municipal Separate Storm SewersNA Not ApplicableNGO Non-governmental OrganizationNH3-N Nitrogen-AmmoniaNPDES National Pollutant Discharge Elimination SystemNPS Nonpoint SourceNRA Nueces River AuthorityNRCS USDA-Natural Resources Conservation ServiceOSSF Onsite Sewage FacilitiesPOH Port of HarlingenPRP Pollutant Reduction Plan (Arroyo Colorado Pollutant Reduction Plan)PSA Public Service AnnouncementRCAP Rural Community Assistance PartnershipRDF Regional Detention FacilitiesRMS Resource Management SystemRSWMP Regional Solid Waste Management PlanSO4 SulfateSRF State Revolving FundSSO Sanitary Sewer OverflowsSTTC South Texas Tree CouncilSWAT Soil and Water Assessment ToolSWCDs Soil and Water Conservation DistrictsSWMP Stormwater Management ProgramSWQM Surface Water Quality MonitoringSWTF Stormwater Task ForceTAC Texas Administrative CodeTAES Texas Agricultural Experiment StationTAMUK Texas A&M University-KingsvilleTBD To be determinedTCEQ Texas Commission on Environmental QualityTDS Total Dissolved SolidsTKN Total Kjeldahl NitrogenTMDL Total Maximum Daily Load
155 | P a g e

TN Total NitrogenTP Total PhosphorusTPDES Texas Pollution Discharge Elimination SystemTPWD Texas Parks and Wildlife DepartmentTSS Total Suspended SolidsTSSWCB Texas State Soil and Water Conservation BoardTWC Texas Water CommissionTWDB Texas Water Development BoardTWRI Texas Water Resources InstituteTxDOT Texas Department of TransportationUAs Urbanized AreasUSACE United States Army Corps of EngineersUSDA United States Department of AgricultureUSEPA United States Environmental Protection AgencyUSFWS United States Fish and Wildlife ServiceUSGS United States Geological SurveyUTB University of Texas at BrownsvilleWBC World Birding CenterWSC Water Supply CorporationWMA Wildlife Management AreasWPP Watershed Protection PlanWQMP Water Quality Management PlanWSC Water Supply CorporationWWF Wastewater facilityWWTF Wastewater Treatment Facility
156 | P a g e

Appendix B: Elements of Successful WPPsUSEPA’s Handbook for Developing Watershed Plans to Restore and Protect Our Waters describes the ‘Element of Successful Watershed Plans’ that must be sufficiently included in the WPP for it to be eligible for implementation funding through the Clean Water Act Section 319(h) grant funding program (2008). These elements do not preclude additional information from being included in a plan.
A. Identification of Cases and Sources of ImpairmentAn identification of the causes and sources or groups of similar sources that will need to be controlled to achieve the load reductions estimated in the water-based plan (and to achieve any other watershed goals identified in the WPP). Sources that need to be controlled should be identified at the significant subcategory level with estimates of the extent to which they are present in the watershed. Information can be based on a watershed inventory, extrapolated from a sub-watershed inventory, aerial photos, GIs data and other sources.
See Chapter 4; Chapter 5; Chapter 6
B. Expected Load ReductionsAn estimate of the load reductions expected for the management measures proposed as part of the watershed plan. Percent reductions can be used in conjunction with a current or known load.
See Chapter 9; Chapter 13
C. Proposed Management MeasuresA description of the management measures that will need to be implemented to achieve the estimated load reductions and an identification (using a map or description) of the critical areas in which those measures will be needed to implement the plan. These are defined as including BMPs and measures needed to institutionalize changes. A critical area should be determined for each combination of source BMP.
See Chapter 7; Chapter 8; Chapter 9
D. Technical and Financial Assistance NeedsAn estimate of the amounts of technical and financial assistance needed, associated costs and/or the sources and authorities that will be relied upon to implement this plan. Authorities include the specific state or local legislation that allows, prohibits or requires an activity.
See Chapter 10; Chapter 13
157 | P a g e

E. Information, Education and Public Participation ComponentAn information/education component that will be used to enhance public understanding of the project and encourage their early and continued participation in selecting, designing and implementing the appropriate NPS management measures.
See Chapter 10; Chapter 13
F. ScheduleA schedule for implementing the NPS management measures identified in the plan that is reasonable expeditious. Specific dates are generally not required.
See Chapter 13
G. MilestonesA description of interim, measurable milestones for determining whether NPS management measures or other control actions are being implemented. Milestones should be tied to the progress of the plan to determine if it is moving in the right direction.
See Chapter 13
H. Load Reduction Evaluation CriteriaA set of criteria that can be used to determine whether loading reductions are being achieved over time and substantial progress is being made towards attaining water quality standards and, if not, the criteria for determining whether the watershed-based plan needs to be revised. The criteria for the plan needing revision should be based on the milestones and water quality changes.
See Chapter 6; Chapter 12; Chapter 13
I. Monitoring ComponentA monitoring component to evaluate the effectiveness of the implementation efforts over time, measured against the evaluation criteria. The monitoring component should include required project-specific needs, the evaluation criteria and local monitoring efforts. It should also be tied to the state water quality monitoring efforts.
See Chapter 11
158 | P a g e

ReferencesAPAI, 2006. Feasibility Study for Habitat Restoration/Modification to Improve Water Quality in the Arroyo Colorado: Strategies to Enhance Both Water Quality and Habitat, prepared in association with CRESPO Consulting Services, Inc. Final Report for Texas Parks and Wildlife Department Project No. 101732, Contract No. 153411. January 18, 2006.
Barrett, M., D. Adams, M. Vargas, and L. Prickett. 2014. Guidance for Sustainable Stormwater Drainage on the Texas Coast, http://txcoastalbmp.org/wp-content/uploads/2014/04/Guidance-for-Sustainable-Stormwater-Drainage-on-the-Texas-Coast_FINAL2.pdf.
Brown, L.F., J.L. Brewton, T.J. Evans, J.H. McGowen, W.A.White, C.G. Groat and W. L. Fisher, 1980. Environmental Geologic Atlas of the Texas Coastal Zone: Brownsville-Harlingen Area. Bureau of Economic Geology, University of Texas. Austin. 140 pp. + maps.
Casarez, E.A., S.D. Pillai, et al. (2007). "Direct comparison of four bacterial source tracking methods and a novel use of composite data sets." J Appl Microbiol 103(2): 350–364.
Cole, T.M. and S.A. Wells. 2011. CE-QUAL-CE-QUAL-W2: A Two-Dimensional, Laterally Average, Hydrodynamic and Water Quality Model, Version 3.7. Instruction Report EL-11-1. U.S. Army Corps of Engineers, Waterways Experiment Station, Vicksburg, MS and Department of Civil and Environmental Engineering, Portland State University, Portland, OR.
Hackland, K. W., 2004, South Texas Nature Guide, RGV Nature Marketing Co-op.
Hathcock, C.R., Perez, C.J., and Barry, R.X., 2012, Physiographic zones of the Lower Rio Grande Valley, Texas: U.S. Fish and Wildlife Service, South Texas Refuge Complex, Alamo, TX.
IBWC, 2003. Hydraulic Model of the Rio Grande and Floodways within the Lower Rio Grande Flood Control Project, June 2003, http://www.ibwc.state.gov/LRGFCPHydModRpt.pdf (accessed 6/5/2005).
Jahrsdoerfer, S.E., and Leslie, D.M., Jr., 1988, Tamaulipan brushland of the Lower Rio Grande Valley of south Texas—Description, human impacts, and management options: U.S. Fish and Wildlife Service Biological Report, v. 88, no. 36, p. 1–63.
McFarland, M. L., M. Kuitu, G. Roberts, N. Dictson, D. Boellstorff, M. Berg, J. Peterson. 2015. Texas Watershed Steward Handbook: A Water Resource Training Curriculum. Texas A&M AgriLife Extension Service Publication SC-035.
159 | P a g e

Olmstead, S. M., 2004. Thirsty colonias: rate regulation and the provision of water service. Land Economic, 80 (1), 136-150.
Reed et al. 2001. Study to Determine the Magnitude of, and Reasons for, Chronically Malfunctioning On-Site Sewage Facility Systems in Texas. Funded by Texas On-Site Research Council.
RCAP (Rural Community Assistance Partnership), 2015. U.S.-Mexico Border Needs Assessment and Support Project: Phase II Assessment Report, https://rcap.org/wp-content/uploads/2016/03/RCAP_Colonias-Phase-II-Assessment-Report_FINAL_web.pdf.
RGRPG (Rio Grande Regional Planning Group), 2016. 2016 Rio Grande Regional Water Plan. http://www.riograndewaterplan.org/waterplan.
Rio Grande, Rio Grande Estuary, and Lower Laguna Madre Basin and Bay Expert Science Team (Lower Rio Grande BBEST). 2012. Environmental Flows Recommendations Report. Final Submission to the Environmental Flows Advisory Group, Rio Grande, Rio Grande Estuary, and Lower Laguna Madre Basin and Bay Stakeholders Committee, and Texas Commission on Environmental Quality.
Shackelford, C. E., E. R. Rozenburg, W. C. Hunter and M. W. Lockwood. 2005. Migration and the Migratory Birds of Texas: Who They Are and Where They Are Going. Texas Parks and Wildlife PWD BK W7000-511 (11/05). Booklet, 34pp.
TCEQ, 2003. Pollutant Loading and Dissolved Oxygen Dynamics in the Tidal Segment of the Arroyo Colorado, Draft Report July 2003, http://arroyocolorado.org/media/2637/pollutantloadingdissolvedoxygendynamics.pdf
TCEQ. 2012. 2012 Texas Integrated Report for Clean Water Act Sections 305(b) and 303(d).
TCEQ. 2014. 2014 Texas Integrated Report for Clean Water Act Sections 305(b) and 303(d).
TPWD (Texas Parks and Wildlife Department), 1997. Texas Wetlands Conservation Plan. Texas Parks and Wildlife Department. Austin, Texas. 64 pp.
TPWD, 2006a. Laguna Madre, Web article by Kyle Spiller and Randy Blankinship http://www.tpwd.state.tx.us/fishboat/fish/didyouknow/lagunamadre.phtml (accessed 12/1/2005).
Texas Demographic Center, 2016. Estimates of the Total Populations of Counties and Places in Texas for July 1, 2014 and January 1, 2015. http://osd.texas.gov/Data/TPEPP/Estimates/.
160 | P a g e

TWC (Texas Water Commission), 1990. Waste Load Evaluation for the Arroyo Colorado in the Nueces-Rio Grande Coastal Basin: Segment 2201 – Arroyo Colorado Tidal, Segment 2202 – Arroyo Colorado Above Tidal. Report No. WLE 90-04. Austin, Texas 162 pp.
TWDB, 2003a. A Groundwater Availability Model of the Gulf Coast Aquifer in the Lower Rio Grande Valley, Texas: Numerical Simulations through 2050 Ali H. Chowdhury Ph.D., P.G. Robert E. Mace, Ph.D., P.G http://www.twdb.state.tx.us/gam/glfc_s/Glfc_s_Oct2003Report.pdf (accessed 8/25/2006).
Traweek, M.S. 1995. Statewide census of exotic big game animals. Fed. Aid in Wildl. Rest. Report W-127-R-3, Project No. 21. Texas Parks and Wildlife Department, Austin, Texas.
USDA APHIS. 2014. Population Reduction of Nilgai in the Boca Chica Beach, Bahia Grande, and Brownsville Navigation District Areas, Cameron County, Texas. Environmental Assessment, June 2014. Available at http://content.govdelivery.com/attachments/USDAAPHIS/2014/07/11/file_attachments/306647/Draft%2BNilgai%2BEA%2BComplete.pdf.
USEPA. 2000. Office of Water. Unified Federal Policy for a Watershed Approach to Federal Land and Resource Management. Federal Register, October 18, 2000, pp. 62565-62572. Available at: http://www.epa .gov/EPA-IMPACT/2000/October/Day-18/i26566.htm .
USEPA, 2002. Onsite Wastewater Treatment Systems Manual Revised 2002.
USEPA, 2005. National Management Measures to Protect and Restore Wetlands and Riparian Areas for the Abatement of Nonpoint Source Pollution. U.S. Environmental Protection Agency, Office of Wetlands, Nonpoint Source Control Branch. July 2005 102 pp. + appendices.
USEPA (2006). Method 1603: Escherichia coli (E. coli) in water by membrane filtration using modified membrane-thermotolerant Escherichia coli agar (Modified mTEC). Washington, DC, Office of Research and Development, Government Printing Office.
USEPA. 2008. Handbook for Developing Watershed Plans to Restore and Protect Our Waters. Washington, D.C.: USEPA Office of Water, Nonpoint Source Control Branch. EPA 841-B-08-002.
USFWS. 1988. Tamaulipan Brushland of the Lower Rio Grande Valley of South Texas: Description, Human Impacts, and Management Options. Biological Report 88(36). November 1988.
161 | P a g e

(USFWS) United States Fish and Wildlife Service), 1997. Lower Rio Grande Valley and Santa Ana National Wildlife Refuges, Interim Comprehensive Management Plan. U.S. Fish and Wildlife Service, Region 2, Albuquerque, New Mexico. 123 pp + maps.
Williams, B.K., Szaro, R.C., Shapiro, C.D. 2009. Adaptive Management: The U.S. Department of the Interior Technical Guide. Washington D.C.: The U.S. Department of the Interior, Adaptive Management Working Group. Available at: http://www.doi.gov/initiatives/AdaptiveManagement/.
World Birding Center. 2016. www.theworldbirdingcenter.com. (accessed 4/19/2016).
162 | P a g e


![[XLS]ccsocialesfil.files.wordpress.com · Web viewARROYO ESPINDOLA SONIA ESPERANZA CHILIQUINGA PORRAS MARIA TERESA ESPINOSA ORTIZ GENNY DEL CONSUELO PACHA SIMBA CARMEN IRENE CORAL](https://static.fdocuments.net/doc/165x107/5adadad37f8b9a52528d6452/xls-viewarroyo-espindola-sonia-esperanza-chiliquinga-porras-maria-teresa-espinosa.jpg)