A Voter’s Eye View 2012Election - Florida State … Voter’s Eye View of the 2012Election Charles...
107
A Voter’s Eye View of the 2012Election Charles Stewart III June 11, 2013
Transcript of A Voter’s Eye View 2012Election - Florida State … Voter’s Eye View of the 2012Election Charles...

A Voter’s Eye View of the 2012Election
Charles Stewart III
June 11, 2013

Outline
• Introduce the data • How we vote• The voter experience• Waiting to vote• Voter confidence

Outline
• Introduce the data • How we vote• The voter experience• Waiting to vote• Voter confidence

BUILDING A QUANTITATIVE SCIENCE OF ELECTION ADMINISTRATION

. . . “the most primitive and neglected branch of our public administration” (V.O. Key, 1949)


• State and local election returns and statistics
• U.S. Census Bureau, Voting and Registration Supplement of the Current Population Survey

• U.S. EAC, Election Administration and Voting Survey

• Survey research• Cooperative Congressional Election Study
• Survey of the Performance of American Elections

SURVEY OF THE PERFORMANCE OF
AMERICAN ELECTIONS BACKGROUND

SURVEY OF THE PERFORMANCE OF
AMERICAN ELECTIONS BACKGROUND
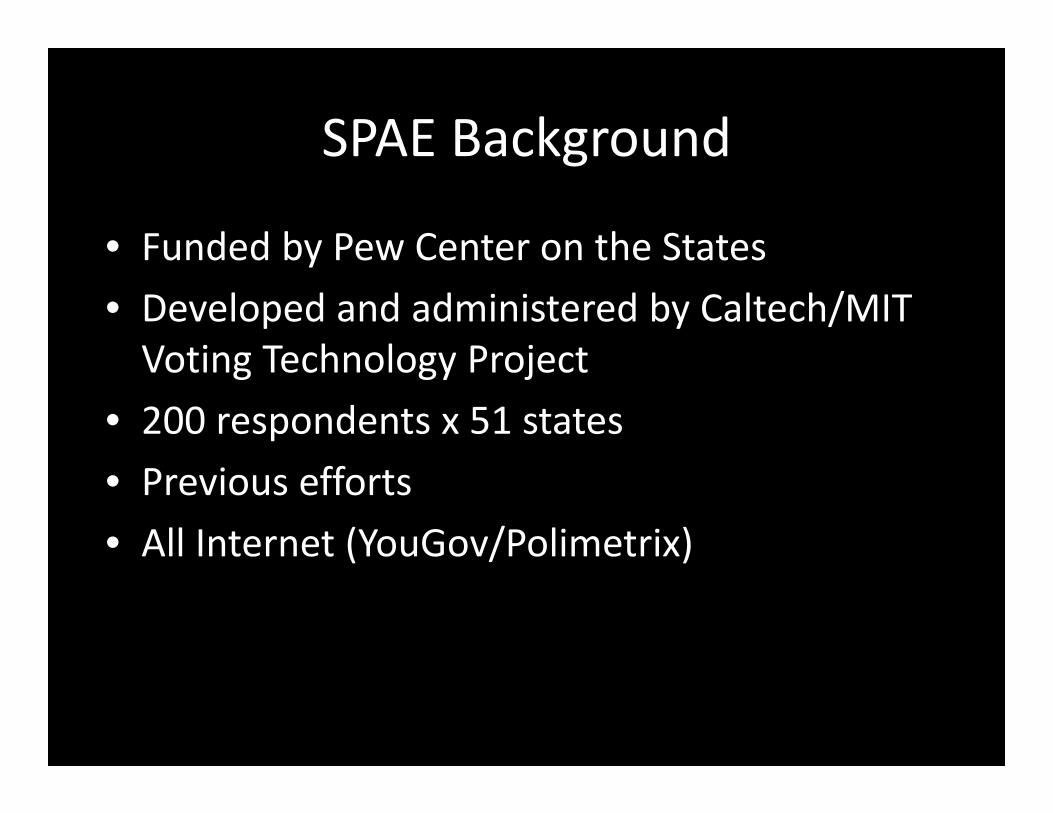
SPAE Background
• Funded by Pew Center on the States• Developed and administered by Caltech/MIT Voting Technology Project
• 200 respondents x 51 states• Previous efforts• All Internet (YouGov/Polimetrix)
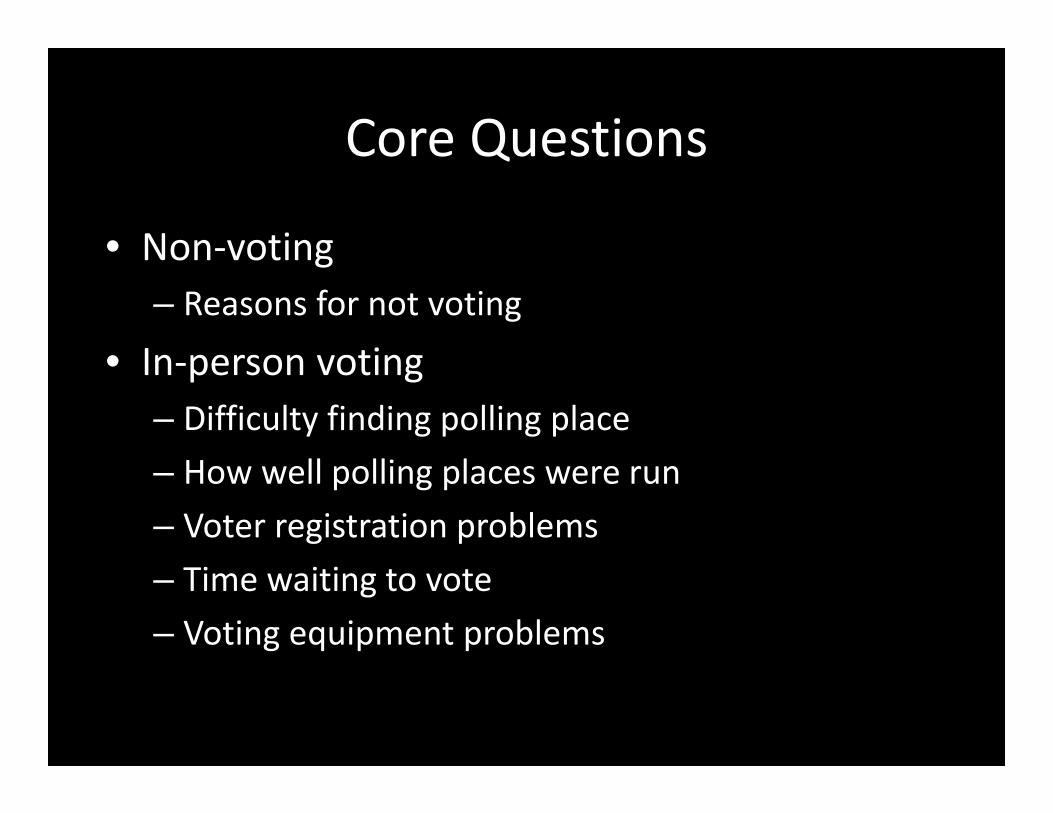
Core Questions
• Non‐voting– Reasons for not voting
• In‐person voting– Difficulty finding polling place– How well polling places were run– Voter registration problems– Time waiting to vote– Voting equipment problems

Core Questions
• Mail/absentee voting– Problems getting mail ballot– Problems following instructions
• All voters– Confidence vote was counted as intended

Non‐core questions
• Time of day voting• Race/age of poll workers• Type of place of in‐person voting• Possession of voter ID

Ability to Link Answers to Voter Characteristics
• Race• Age• Sex• Disability• Length of residence• Income• Party ID• Ideology• Interest in news/public affairs• Geocoding: county and ZIP code

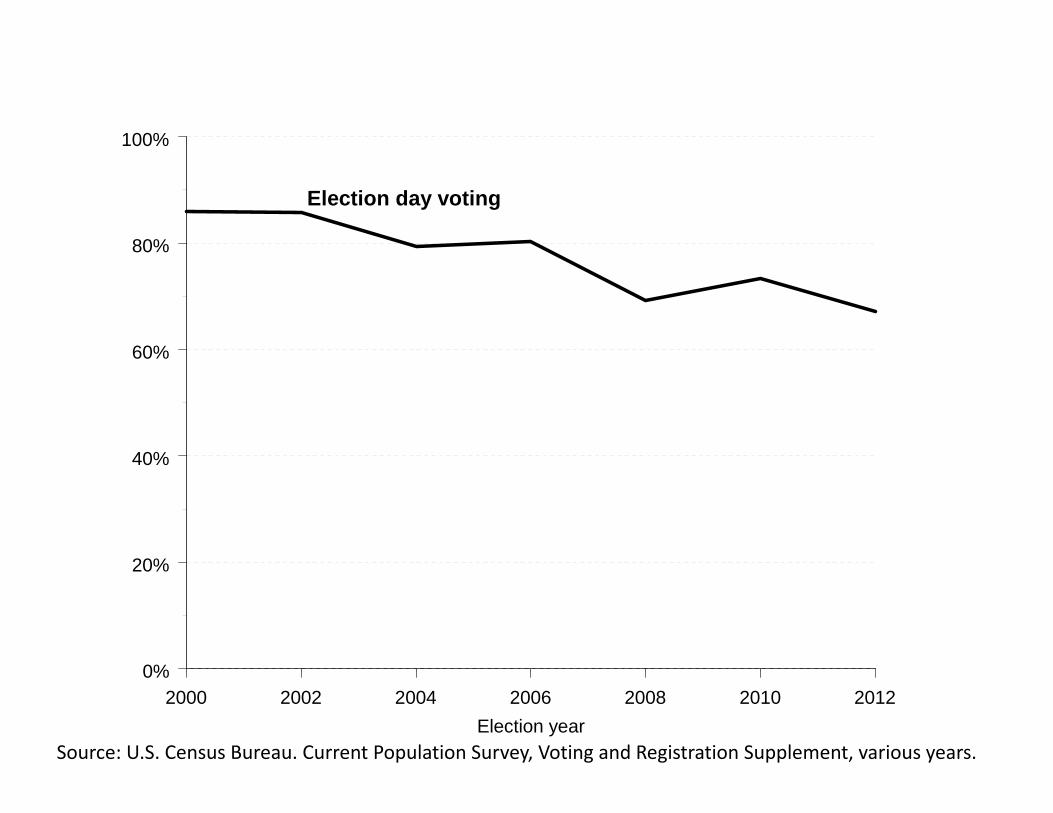
HOW WE VOTE
2000 2002 2004 2006 2008 2010 2012Election year
0%
20%
40%
60%
80%
100%
Election day voting
Source: U.S. Census Bureau. Current Population Survey, Voting and Registration Supplement, various years.

2000 2002 2004 2006 2008 2010 2012Election year
0%
20%
40%
60%
80%
100%
Election day voting
Absentee/mail ballots
Source: U.S. Census Bureau. Current Population Survey, Voting and Registration Supplement, various years.

2000 2002 2004 2006 2008 2010 2012Election year
0%
20%
40%
60%
80%
100%
Election day voting
Early in-person voting
Absentee/mail ballots
Source: U.S. Census Bureau. Current Population Survey, Voting and Registration Supplement, various years.

0
1 0
1
01Mail
Election Day
Early
MENH
VT
MARICTNYNJPAOHIN
IL
MI
WIMN
IA
MO
ND
SDNE
KS
KEMD
DCVA
WV
NC
SCGAFL
KY
TN
ALMS
AR
LAOK
TX
MT
ID
WY
CO
NM
AZ
UT
NV
WA
OR
CA
AKHI
2000
Source: U.S. Census Bureau. Current Population Survey, Voting and Registration Supplement.

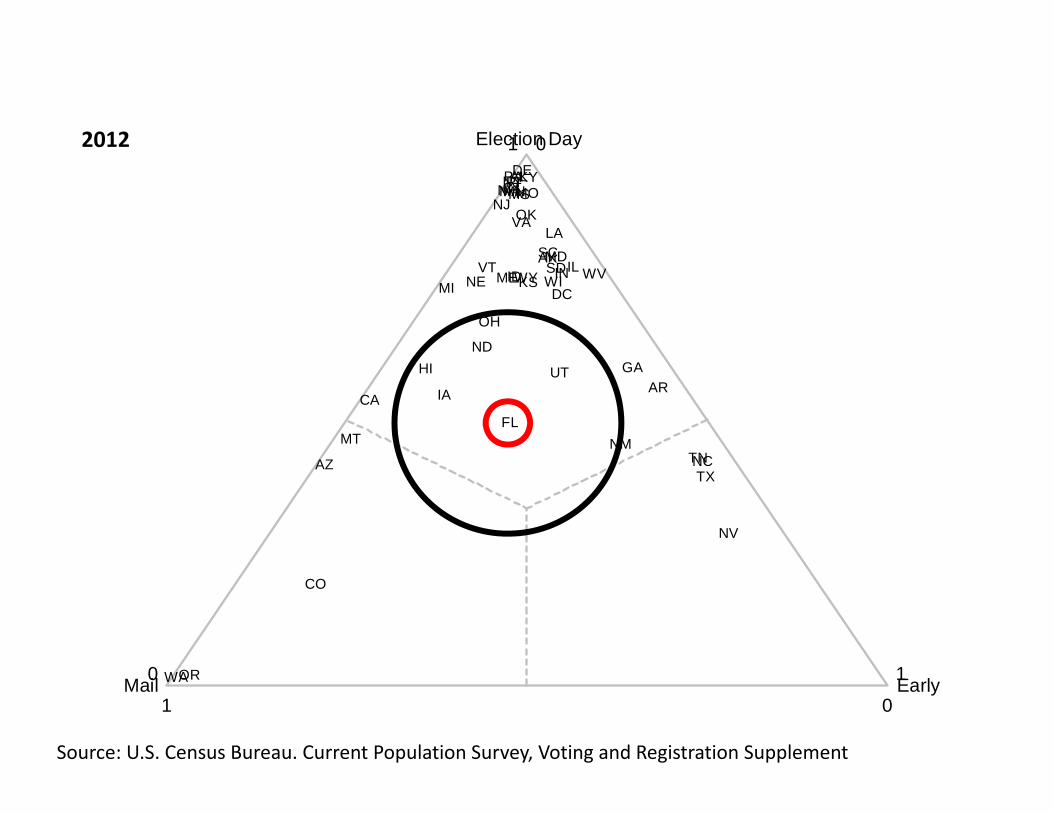
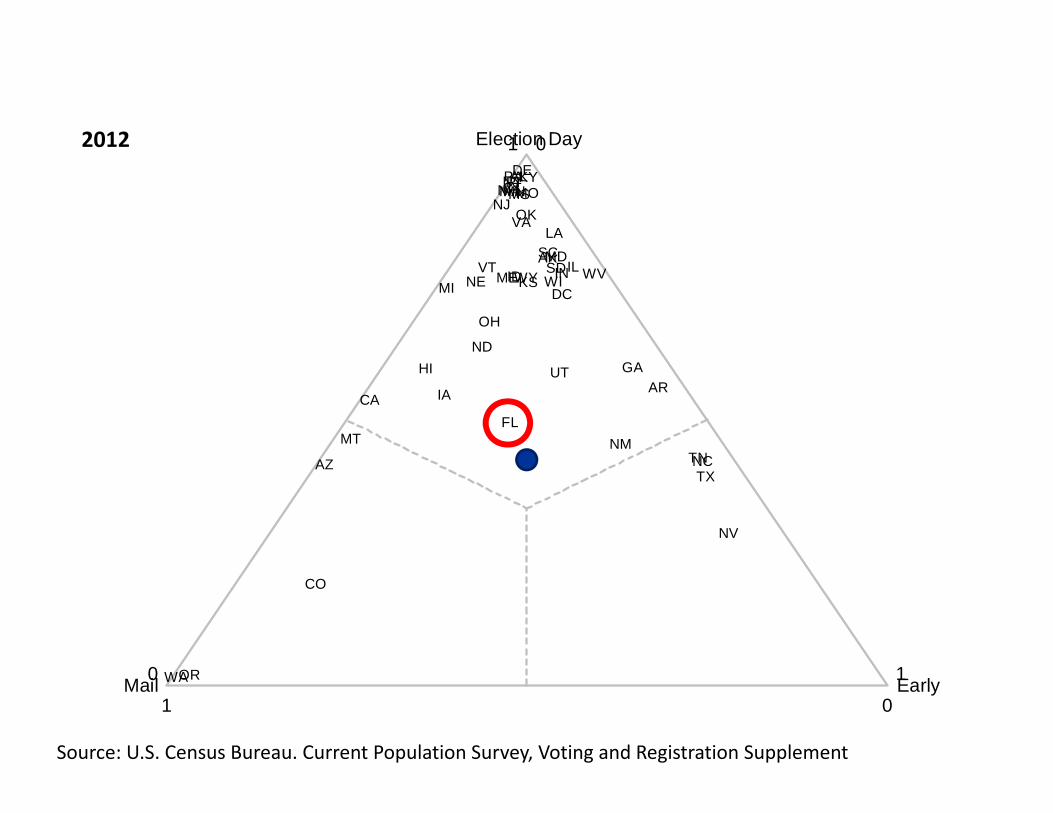
0
1 0
1
01Mail
Election Day
Early
ME
NH
VT
MARICTNYNJ
PA
OH
INILMI WI
MN
IA
MO
ND
SDNE KS
DE
MD
DC
VA
WV
NC
SC
GA
FL
KY
TN
ALMS
AR
LAOK
TX
MT
IDWY
CO
NMAZ
UT
NV
WAOR
CA
AK
HI
2012
Source: U.S. Census Bureau. Current Population Survey, Voting and Registration Supplement

0
1 0
1
01Mail
Election Day
Early
ME
NH
VT
MARICTNYNJ
PA
OH
INILMI WI
MN
IA
MO
ND
SDNE KS
DE
MD
DC
VA
WV
NC
SC
GA
FL
KY
TN
ALMS
AR
LAOK
TX
MT
IDWY
CO
NMAZ
UT
NV
WAOR
CA
AK
HI
2012
Source: U.S. Census Bureau. Current Population Survey, Voting and Registration Supplement
0
1 0
1
01Mail
Election Day
Early
ME
NH
VT
MARICTNYNJ
PA
OH
INILMI WI
MN
IA
MO
ND
SDNE KS
DE
MD
DC
VA
WV
NC
SC
GA
FL
KY
TN
ALMS
AR
LAOK
TX
MT
IDWY
CO
NMAZ
UT
NV
WAOR
CA
AK
HI
2012
Source: U.S. Census Bureau. Current Population Survey, Voting and Registration Supplement
0
1 0
1
01Mail
Election Day
Early
ME
NH
VT
MARICTNYNJ
PA
OH
INILMI WI
MN
IA
MO
ND
SDNE KS
DE
MD
DC
VA
WV
NC
SC
GA
FL
KY
TN
ALMS
AR
LAOK
TX
MT
IDWY
CO
NMAZ
UT
NV
WAOR
CA
AK
HI
2012
Source: U.S. Census Bureau. Current Population Survey, Voting and Registration Supplement

0
1 0
1
01Mail
Election Day
Early
ALA
BAKBAY
BRABRE
BRO CAL
CHA
CIT CLA
CLL CLM
DES
DIX
DUV
ESC
FLA
FRA
GAD
GIL
GLA
GUL
HAMHAR
HEN
HER
HIGHIL
HOL
IND
JAC
JEF
LAF
LAK
LEELEO
LEVLIB
MAD
MAN
MON
DADMRN
MRT NAS
OKA
OKEORA
OSC
PAL
PAS
PIN
POL
PUTSAN
SAR
SEM
STJ
STL
SUM
SUWTAYUNIVOL
WAK
WALWAS
Source: Florida Elections Division, Voter History File, February 2012
2012

VOTER EXPERIENCE

Overall, the experience of voters on Election Day was positive

86% said it was “very easy” to find their polling place
(12% said it was “fairly easy”)

3% said they encountered a registration problem when they went to vote

13 min = avg. wait time to vote
63% said most of this time was waiting to check in

2% said they encountered voting equipment problems

78% said their polling place was run “very well – I didn’t see any problems”
(19% said “okay – I saw some minor problems, but nothing that interfered with people voting")

65% said the performance of polls workers was “excellent”
(28% said “good“)

67% said they were “very confident” that their vote was counted as cast
(26% said “somewhat confident“)

Early voting experience was very similar to that of Election Day

Early voting experience was very similar to that of Election Day
• 83% said it was “very easy” to find their polling place
• 3% said they encountered a registration problem when they went to vote
• 20 min = avg. wait time to vote
– 69% said most of this time was waiting to check in
• 2% said they encountered voting equipment problems
• 80% said their polling place was run “very well”
• 67% said the performance of polls workers was “excellent”
• 65% said they were “very confident” that their vote was counted as cast

Absentee voters also satisfied

2% said they encountered problems receiving their mail ballot

<1% said they encountered problems marking their mail ballot

83% said they found the instructions “very easy” to follow in marking their ballot
(15% said “somewhat easy”)

56% said they were “very confident” that their vote was counted as cast
(Compared to 67% and 65% for Election Day and early voting)

Who Has Problems Voting in Person?

Who Has Problems Voting in Person?
7% of in‐person voters…
‐find it difficult to find the polling place, or‐had a problem with voter registration, or‐had a problem with the voting equipment, or‐encountered a poorly performing poll worker

Who Has Problems Voting in Person?
Age
Younger than 35: 9% had a problem
Older than 60: 4% had a problem
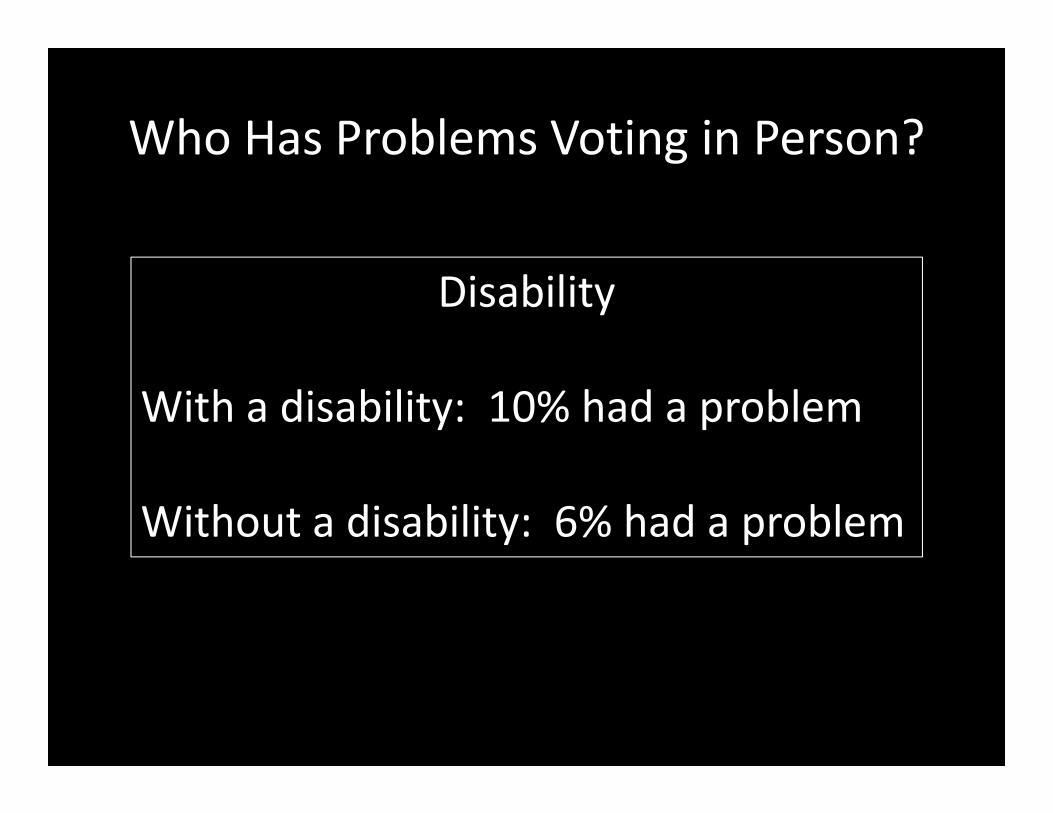
Who Has Problems Voting in Person?
Disability
With a disability: 10% had a problem
Without a disability: 6% had a problem

Who Has Problems Voting in Person?
New residents
Lived in current house…
less than 3 years: 8% had a problem
more than 15 years: 5% had a problem

Who Has Problems Voting in Person?
No differences by…
‐first‐time voter status‐sex‐race‐income‐early vs. election day voter

How Does Florida Compare?

How Does Florida Compare on Election Day?
• Compared to the rest of the nation…– The great majority of voters also had a positive experience
– Finding the polling place as easy and convenient as elsewhere
– the challenges come once voters were in the polling place

How Does Florida Compare on Election Day?
• 82% said it was “very easy” to find their polling place (compared to 86% nationwide)
• 4% said they encountered a registration problem when they went to vote (compared to 3% nationwide)

How Does Florida Compare on Election Day?
• 38* minutes = average time waiting to vote (compared to 13 minutes nationwide)
• 8%* said they encountered a voting equipment problem (compared to 2% nationwide) [they all mention scanners]
• 70%* said their polling place was run “very well” (compared to 78% nationwide)
• 60% said the performance of poll workers was “excellent” (compared to 65% nationwide)
*Outside the 95% confidence interval of the nationwide statistic

How Does Florida Compare on Election Day?
• 44%* said they were “very confident” their vote was counted as cast (compared to 67% nationwide)
*Outside the 95% confidence interval of the nationwide statistic

Early Voting?
• Lines were especially long, compared to the rest of the nation (53 min. vs. 20 min.)
• Early voters were significantly less likely to say early voting polling places were run “very well” (67% vs. 80%)– This is entirely due to the long lines.

• By the way, nationwide (outside of Florida), voters using libraries to vote early took an average of 26 minutes to vote, compared to 15 minutes in all other buildings.

Absentee voting?
• Roughly the same satisfaction as nationwide.

WAITING IN LINE
I’m going to be helped by an additional 50,000 responses from the
Cooperative Congressional Election Study

How Long Did People Wait?
Not at all 37%Less than 10 minutes 31%10‐30 minutes 20%31‐60 minutes 9%More than one hour 3%

How Long Did People Wait?
Not at all 37%Less than 10 minutes 31%10‐30 minutes 20%31‐60 minutes 9%More than one hour 3%

How Long Did People Wait?
Not at all 37%Less than 10 minutes 31%10‐30 minutes 20%31‐60 minutes 9%More than one hour 3%

How Long Did People Wait?
Not at all 37%Less than 10 minutes 31%10‐30 minutes 20%31‐60 minutes 9%More than one hour 3%
Average waiting time for the 3% who waited more than an hour = 129 minutes

How Long Did People Wait?
Not at all 37%Less than 10 minutes 31%10‐30 minutes 20%31‐60 minutes 9%More than one hour 3%
Overall Average = 14 minutes

VTAK
SDWY
MENE
DEIA
NJMN
NMHI
CTCA
MAMS
NVKY
IDWI
COAZ
PAAL
NDOH
UTNH
RIKS
MOWV
MTTX
ILNY
INAR
NCTN
LAGA
OKMI
SCVA
MDDC
FL
order
0
10
20
30
40
Avg.
min
utes
wai
ting
to v
ote

VTAK
SDWY
MENE
DEIA
NJMN
NMHI
CTCA
MAMS
NVKY
IDWI
COAZ
PAAL
NDOH
UTNH
RIKS
MOWV
MTTX
ILNY
INAR
NCTN
LAGA
OKMI
SCVA
MDDC
FL
order
0
10
20
30
40
Avg.
min
utes
wai
ting
to v
ote

Charles Stewart IIIPage 68
1 102.0 3.0 4.0 5.0 6.07.0 20.0 30.0 40.0 50.0
2008
1
10
2.0
3.0
4.0
5.0
6.07.08.09.0
20.0
30.0
40.0
50.020
12
VT
AKSDWYME
NE DE
IA NJMN NMHI
CTCAMA MSNVKYID WI CO AZPAALND OHUTNHRI KS MOWVMT TXILNY INARNCTN
LA GAOKMI
SCVA
MDFL

Charles Stewart IIIPage 69
1 102.0 3.0 4.0 5.0 6.07.0 20.0 30.0 40.0 50.0
2008
1
10
2.0
3.0
4.0
5.0
6.07.08.09.0
20.0
30.0
40.0
50.020
12
VT
AKSDWYME
NE DE
IA NJMN NMHI
CTCAMA MSNVKYID WI CO AZPAALND OHUTNHRI KS MOWVMT TXILNY INARNCTN
LA GAOKMI
SCVA
MDFL

Mean Wait Time by Mode
Election Day 12Early voting 20

Average wait time (min.)
County Pop. density Election Day Early Total1st quartile
(1‐75)8.1 5.1 7.5
2nd quartile(75‐570)
10.7 14.9 11.8
3rd quartile(570‐2739)
17.9 29.4 20.8
4th quartile(2739‐34000)
13.2 30.5 16.2

Average wait time (min.)
White 11.6Black 23.3Hispanic 18.7Asian Amer. 15.4Native Amer. 13.3Mixed 13.6Other 13.3

The Average Waiting Time in Florida:Large Counties

The Average Waiting Time in Florida:Add the smaller panhandle counties

The Average Waiting Time in Florida:add the smaller n. peninsula counties

The Average Waiting Time in Florida:add the smaller s. peninsula counties

The Average Waiting Time in Florida

The Average Waiting Time in Florida: Mode
Nationwide FloridaElection Day 12 33Early voting 20 46

The Average Waiting Time in Florida: Density
ZIP code pop. density Election Day Early Total1st quartile
Rural Jefferson County (1‐700)19 28 23
2nd quartileRural Hillsborough County
(700‐1960)
31 43 37
3rd quartileHomestead(1960‐3820)
28 49 38
4th quartileCentral Miami (3820‐36,832)
41 70 54
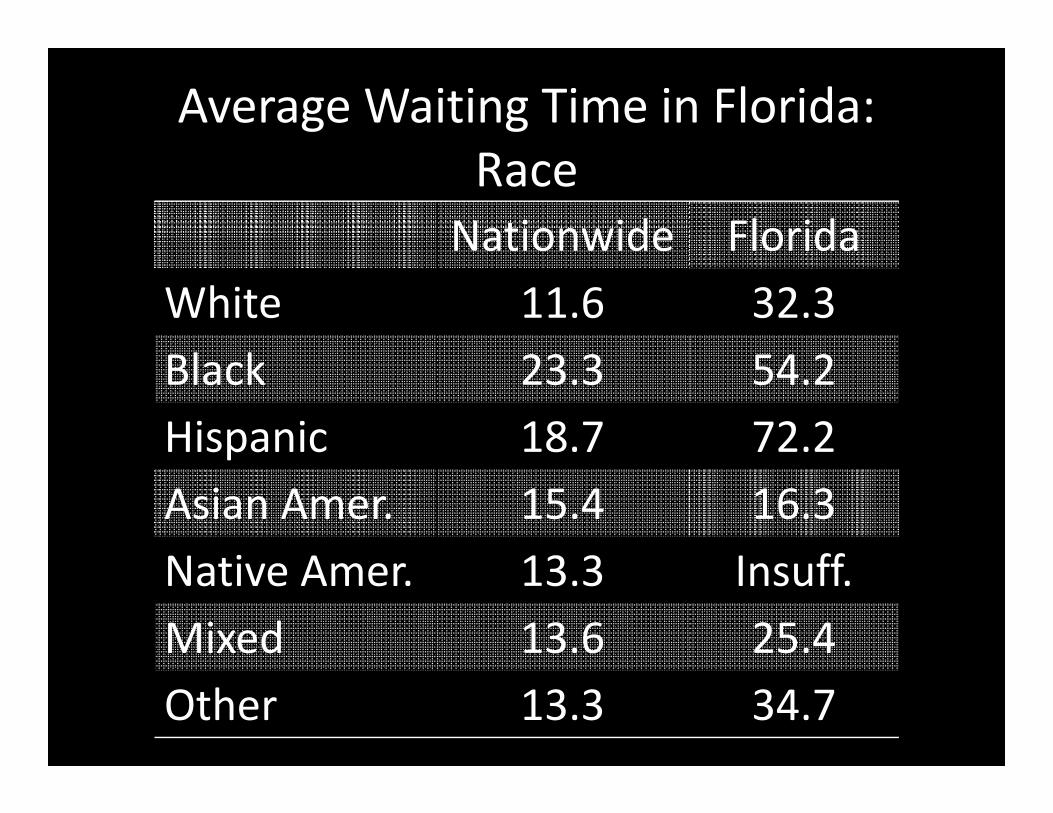
Average Waiting Time in Florida:Race
Nationwide FloridaWhite 11.6 32.3Black 23.3 54.2Hispanic 18.7 72.2Asian Amer. 15.4 16.3Native Amer. 13.3 Insuff.Mixed 13.6 25.4Other 13.3 34.7
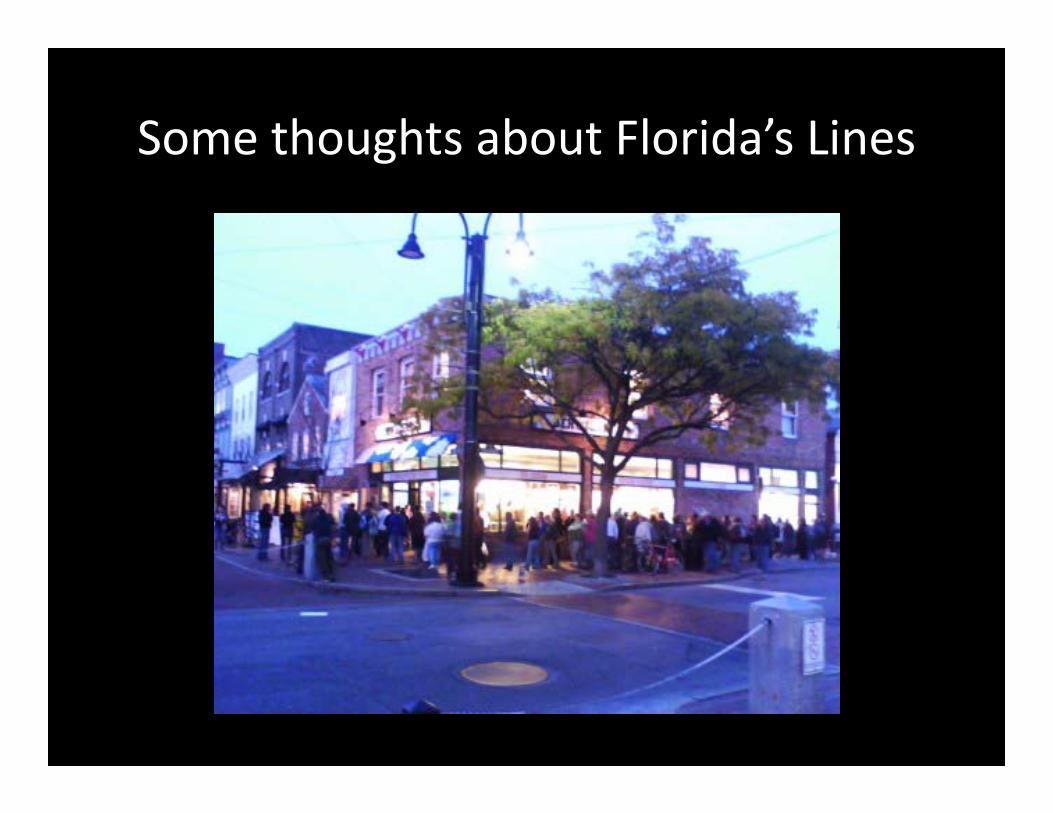
Some thoughts about Florida’s Lines

Within Florida, national patterns hold
• Density• Early voting vs. Election Day Voting• Race

Comparing Florida to the rest of the nation…
• The persistence of long lines from 2008 to 2012 suggests that long lines are not entirelydue to short‐term factors (shortened early voting period, long ballot questions, etc.)
• Florida processes a large number of voters through voting sites, compared to peer states
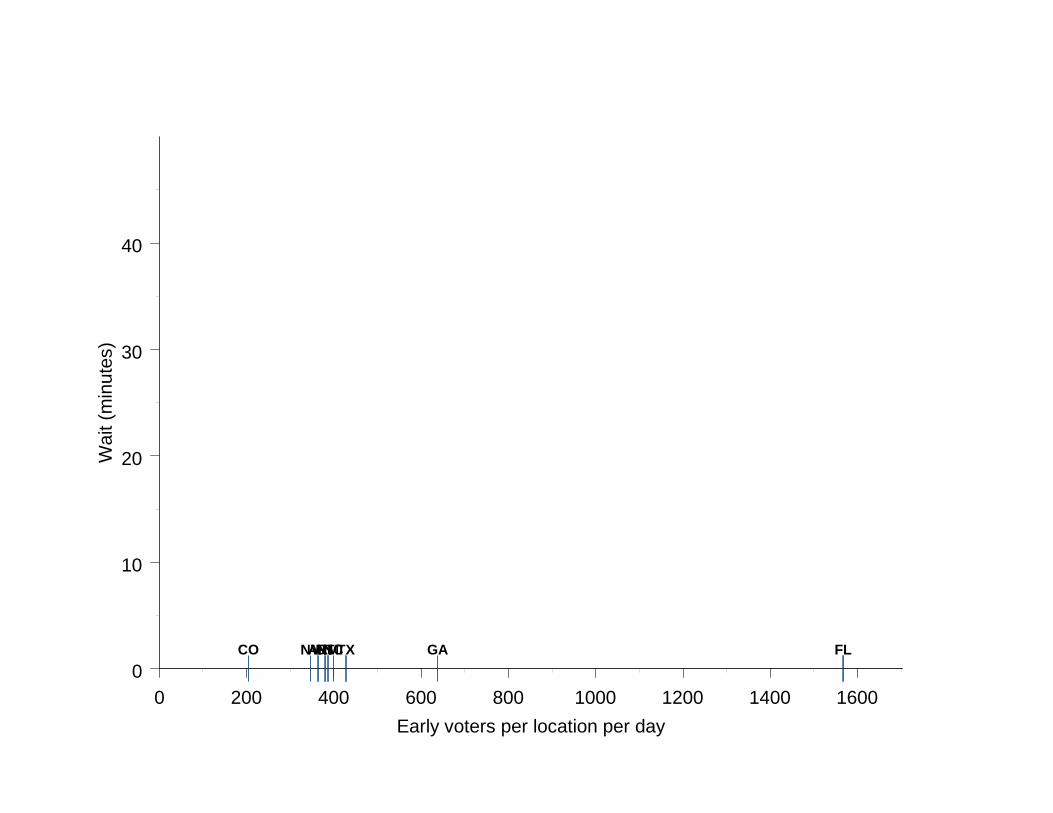
0 200 400 600 800 1000 1200 1400 1600Early voters per location per day
0
10
20
30
40
Wai
t (m
inut
es)
ARCO FLGANCNMNV TXUT

0 200 400 600 800 1000 1200 1400 1600Early voters per location per day
0
10
20
30
40
Wai
t (m
inut
es)
ARCO FLGANCNMNV TXUT

VOTER CONFIDENCE

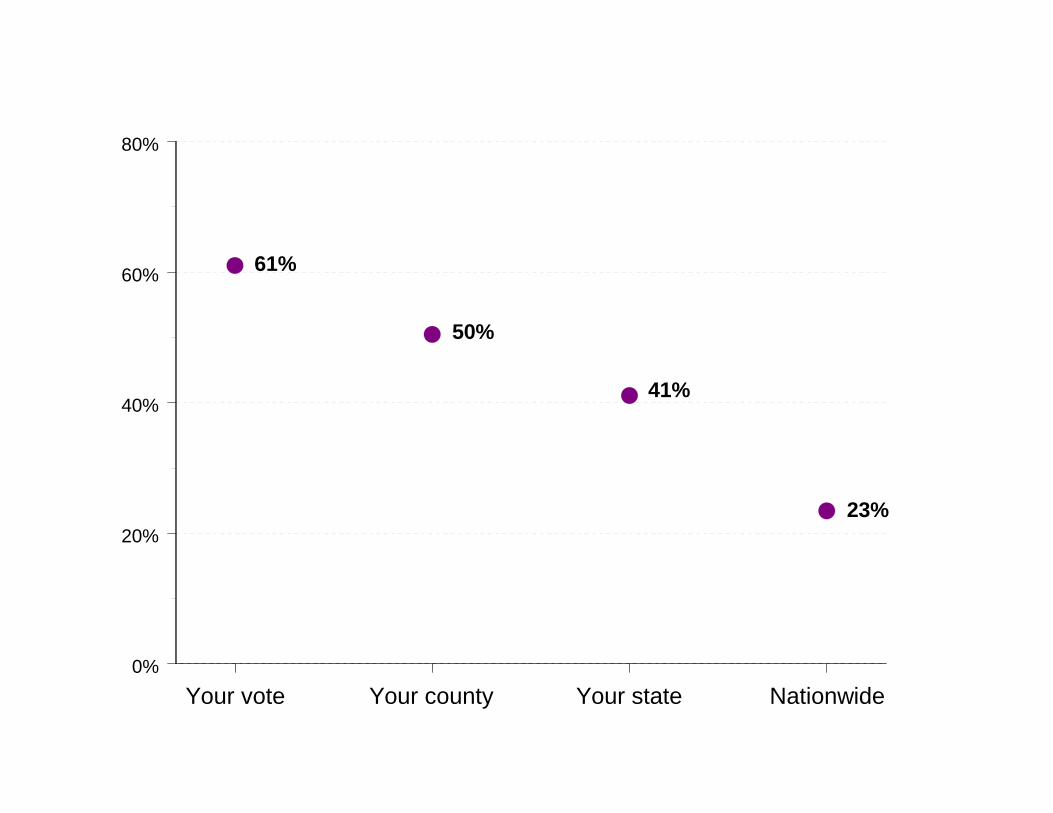
Are you confident that your vote was counted as you intended?

2000 2004 2008 20120%
20%
40%
60%
80%
100%
61%

2000 2004 2008 20120%
20%
40%
60%
80%
100%
61%
69%

2000 2004 2008 20120%
20%
40%
60%
80%
100%
61%
69%70%68%

2000 2004 2008 20120%
20%
40%
60%
80%
100%
76%

2000 2004 2008 20120%
20%
40%
60%
80%
100%
76%

2000 2004 2008 20120%
20%
40%
60%
80%
100%
52%

2000 2004 2008 20120%
20%
40%
60%
80%
100%

Your vote Your county Your state Nationwide0%
20%
40%
60%
80%
Your vote Your county Your state Nationwide0%
20%
40%
60%
80%
61%
23%
41%
50%

Your vote Your county Your state Nationwide0%
20%
40%
60%
80%

2000 2004 2008 20120%
20%
40%
60%
80%
100%

2000 2004 2008 20120%
20%
40%
60%
80%
100%
72%
51%

2000 2004 2008 20120%
20%
40%
60%
80%
100%

2000 2004 2008 20120%
20%
40%
60%
80%
100%

Why the hit to Florida’s voter confidence?
• Polarization of elections nationwide• Polarization of elections in Florida• Battleground state curse• Absentee ballot curse

Conclusions: Nationwide
• Drift away from in‐person voting continues• Experience overall positive in 2012• ID
– Support has sagged– Match between law and practice?

Conclusions: Nationwide
• Lines– Comparable to 2008– State persistence– Differences along density and race important
• Confidence– Dip– Polarization
Conclusions: Florida
• Voting experience overall positive, despite challenges compared to the nation
• Nationwide patterns with lines the same, but shifted up a notch
• Placing Florida’s lines in the national puzzle still a challenge

Conclusions
• Data is our friend

Charles Stewart III
• @cstewartiii
• Election Updates– electionupdates.caltech.edu


![20 17 -18 Voter’s Guide - Okaloosa County · 2 2 017 -18 Voter’s Guide Voter’s Bill of Rights and Responsibilities [Section 101.031(2), Florida Statutes] Each registered voter](https://static.fdocuments.net/doc/165x107/5b62fb527f8b9aec518b594a/20-17-18-voters-guide-okaloosa-county-2-2-017-18-voters-guide-voters.jpg)