
a Visualisation for New Zealand Forestry
13
15 Proceedings of GeoComputation ‘97 & SIRC ‘97 Abstract The New Zealand Resource Management Act emphasises, among other things, the evaluation of the effects of for- estry operations, and the inclusion of those affected into the decision making process. Visual images are a useful method for displaying the effects of planned forestry ac- tivities, and are easily understood by most of the general public.While the creation of fully accurate photo-realistic images is still the domain of super computers, it is possi- ble to come close using data visualisation techniques that have been developed for a desktop computer. The data visualisation techniques reported in this paper focus on the creation of photo-realistic, oblique view im- ages depicting the predicted results of alternative manage- ment activities.A Geographic Information System (GIS) is used to develop a digital terrain model of the scene. Other information from the GIS database, such as forest stand boundaries, is shown on or draped over terrain model. Biophysical models are used to ‘grow’ the trees to be placed in the landscape using software called SmartForest II. Cali- brated analytical images are positioned on the terrain model to match the planned forestry activities. This creates rep- resentations that are sufficiently accurate in all dimensions, and facilitates rendering photo-realistic images. The resulting images have been used in surveys to gauge public prefer- ence of forestry options. Data Visualisation for New Zealand Forestry Brian Orland Professor Landscape Architecture, University of Illinois Imaging Systems Laboratory, 214 Mumford Hall, 1301 West Gregory Drive, Urbana-Champaign, Illinois 61801, USA Terry C. Daniel Professor Psychology and Natural Renewable Resources, University of Arizona Environmental Perception Laboratory, Department of Psychology Tucson, Arizona 85721, USA Alan J. Thorn Scientist, Resource Monitoring Unit New Zealand Forest Research Institute Private Bag 3020, Rotorua, New Zealand Presented at the second annual conference of GeoComputation ‘97 & SIRC ‘97, University of Otago, New Zealand, 26-29 August 1997 Background A successful forest industry based on intensively managed Pinus radiata plantations has been part of the New Zea- land agricultural economy for over 30 years. Currently the 1.5 million hectares of plantation forest is the third major contributor to the New Zealand economy, forest prod- ucts have a market value in excess of $2.6 billion annually and provide employment for twenty eight thousand peo- ple.Typically, management scenarios involve mechanical and/ or chemical site preparation and planting of genetically improved seedlings, followed progressively by thinning and pruning, and then clear-fell harvesting within rotation in- tervals of approximately 20 to 30 years (McLaren, 1993). These same plantations are essential components affect- ing the scenic beauty of the New Zealand landscape, a key contributor to the quality of outdoor recreation experi- ences and to a growing tourism industry. Commercial for- estry practices are encountering increased public objec- tions from tourists, recreation visitors and more sensitive local residents, particularly in areas with high visibility. The responsibilities of the commercial forest industry for visual/aesthetic value protection have been unclear in New Zealand’s past. Nevertheless, forest managers have histori- cally forgone scheduled harvests in some visually sensitive areas or have used techniques such as landscape screening and amenity planting in an effort to mitigate visual effects and maintain desirable public relations (Moore et al., 1991;
Transcript of a Visualisation for New Zealand Forestry
15Proceedings of GeoComputation ‘97 & SIRC ‘97
Abstract
The New Zealand Resource Management Act emphasises,
among other things, the evaluation of the effects of for-
estry operations, and the inclusion of those affected into
the decision making process. Visual images are a useful
method for displaying the effects of planned forestry ac-
tivities, and are easily understood by most of the general
public. While the creation of fully accurate photo-realistic
images is still the domain of super computers, it is possi-
ble to come close using data visualisation techniques that
have been developed for a desktop computer.
The data visualisation techniques reported in this paper
focus on the creation of photo-realistic, oblique view im-
ages depicting the predicted results of alternative manage-
ment activities. A Geographic Information System (GIS) is
used to develop a digital terrain model of the scene. Other
information from the GIS database, such as forest stand
boundaries, is shown on or draped over terrain model.
Biophysical models are used to ‘grow’ the trees to be placed
in the landscape using software called SmartForest II. Cali-
brated analytical images are positioned on the terrain model
to match the planned forestry activities. This creates rep-
resentations that are sufficiently accurate in all dimensions,
and facilitates rendering photo-realistic images. The resulting
images have been used in surveys to gauge public prefer-
ence of forestry options.
Data Visualisation for New Zealand ForestryBrian OrlandProfessor Landscape Architecture,University of IllinoisImaging Systems Laboratory,214 Mumford Hall,1301 West Gregory Drive,Urbana-Champaign,Illinois 61801, USA
Terry C. DanielProfessor Psychology and NaturalRenewable Resources,University of ArizonaEnvironmental Perception Laboratory,Department of PsychologyTucson, Arizona 85721,USA
Alan J. ThornScientist,Resource Monitoring UnitNew Zealand ForestResearch InstitutePrivate Bag 3020, Rotorua,New Zealand
Presented at the second annual conference of GeoComputation ‘97 & SIRC ‘97,University of Otago, New Zealand, 26-29 August 1997
Background
A successful forest industry based on intensively managed
Pinus radiata plantations has been part of the New Zea-
land agricultural economy for over 30 years. Currently the
1.5 million hectares of plantation forest is the third major
contributor to the New Zealand economy, forest prod-
ucts have a market value in excess of $2.6 billion annually
and provide employment for twenty eight thousand peo-
ple. Typically, management scenarios involve mechanical and/
or chemical site preparation and planting of genetically
improved seedlings, followed progressively by thinning and
pruning, and then clear-fell harvesting within rotation in-
tervals of approximately 20 to 30 years (McLaren, 1993).
These same plantations are essential components affect-
ing the scenic beauty of the New Zealand landscape, a key
contributor to the quality of outdoor recreation experi-
ences and to a growing tourism industry. Commercial for-
estry practices are encountering increased public objec-
tions from tourists, recreation visitors and more sensitive
local residents, particularly in areas with high visibility.
The responsibilities of the commercial forest industry for
visual/aesthetic value protection have been unclear in New
Zealand’s past. Nevertheless, forest managers have histori-
cally forgone scheduled harvests in some visually sensitive
areas or have used techniques such as landscape screening
and amenity planting in an effort to mitigate visual effects
and maintain desirable public relations (Moore et al., 1991;
16 Proceedings of GeoComputation ‘97 & SIRC ‘97
Sissons and Conway, 1991). The more recent dedication of
the forest industry in New Zealand to the improvement
of visual environmental quality can be largely attributed as
a response to the Resource Management Act (RMA) (Par-
liament of New Zealand, 1991). Thus, the provision of tools
capable of effectively projecting and assessing the visual
aesthetic consequences of alternative forestry practices is
a challenge for researchers and essential for the modern
forest manager to aid the development of appropriate
policies and practices.
The RMA controls activities such as use, development or
protection of the natural and physical resources of New
Zealand and is based heavily on the investigation of the
‘effects’ of a proposed activity, rather than on prescribing
which activities shall or shall not be allowed. It includes
the ethnic philosophy of Kaitiakitanga - the exercise of
guardianship of the land and, in relation to a resource, in-
cludes the ethic of stewardship based on the nature of the
resource itself. In addition to consideration of ‘effects’,
any mitigation efforts must be communicated clearly among
the forest operator, regulatory authorities and other in-
terested parties. The reasons for public objections to com-
mercial forestry practices are diverse and complex, and
visual impacts are a substantial contributor (Kilvert and
Hartsough, 1993). Abrupt alterations of scenic environmen-
tal settings (Thompson and Weston, 1994) may pose di-
rect threats to tourist and recreation industries, as well as
residents environmental quality expectations. In addition,
visual effects often precipitate public concern for other
potential environmental and cultural impacts.
Generally the public are able to readily identify visual change
in the landscape (Benson and Ullrich, 1981; Kilvert, 1995a;
Kilvert, 1995b; Swaffield, 1994) and visual images are con-
sidered an excellent medium for communicating the ef-
fects of forestry operations to the public (Daniel and Boster,
1976; Daniel et al., 1990; Orland, 1988; Orland, 1992). The
idea of using images calibrated to known resource at-
tributes to derive human values is not a new one. Malm et
al. (1981) used image processing techniques to develop
images of pollution plumes in the Grand Canyon, based on
the output of numerical models of atmospheric disper-
sion that were used to derive human values for the im-
pacts predicted on scenic resources in the canyon. The
study established the effectiveness of computer techniques
but used computing resources beyond the means of typi-
cal natural resource agencies. Specific applications with
forestry relevance include Baker and Rabin’s (1988) study
of the visual effects of limb rust damage on national forest
settings in northern Utah, the Orland et al. (1993) study of
the impacts of insect damage and silvicultural responses
on the scenery of the Dixie National Forest in southern
Utah and Orland, Daniel and Haider’s (1994) application
to the visualisation of forest harvesting in Northern On-
tario.
Although, activities such as forest harvesting have an obvi-
ous visual effect, it has been difficult to accurately calibrate
visual landscapes to known levels of forest attribute or
management activity. Pictures of forest harvesting have been
used as illustrations of practice, rather than as one of the
analytical tools in decision support. As part of an integrated
study of forest harvesting values, a survey instrument was
developed that used an extensive library of images to rep-
resent key variables related to anticipated forestry activi-
ties and the visual quality of the forest setting. The image
set comprised computer scanned photography manipu-
lated to reflect a range of attribute levels representing dif-
ferent management regimes and resulting changes over
time. This report describes the procedures followed to
develop the image sets, the validation procedures used for
calibrating the imagery, details the perceptual survey tech-
niques and presents the public response via an attitude
survey to current and alternative forestry practices.
Method
Public Survey Design Issues
The verbal protocols common in pencil and paper surveys
of public opinion can be generated automatically. Verbal
phrases can be drawn from a look-up-table to fill the re-
quirements of an experimental design and construct the
survey instrument. This process works well with words
17Proceedings of GeoComputation ‘97 & SIRC ‘97
which serve then as abstractions of the kinds of condi-
tions represented by the independent variables in the study.
For instance, the words “Sixty metre buffer strip” stand
for any combination of conditions that can buffer place A
from place B by about sixty metres. The precise configura-
tion or components need not be specified for the reader
to have a mental image of what is intended.
This situation is quite different when using pictures that
immediately make the mental image concrete. The same
sixty metre buffer must be shown as vegetation, or not; as
one species, many, or a mix; as a particular density or tex-
ture; on a realistic surface; and in the context of a sur-
rounding matrix of other forest. The consequence is that,
while a verbal phrase can be used repeatedly as a surro-
gate for a general concept of forest attributes, a picture
implies a specific location and thus cannot stand as a sur-
rogate for multiple situations. Moreover, seeing represen-
tations of the same resource attribute in different con-
texts brings into question the validity of how attributes
are represented. Given our intention to develop visual
protocols to address ranges of resource attributes, it was
essential to address the constraints posed by images early
in the design process.
The study required that a number of attributes would need
to be represented visually but more significant was the
interaction of those attributes in the visual display. Sur-
rounding scenery can be shown as a separate issue but
size of forest cutting operation cannot be separated from
the forest type where it occurs, the shape and location of
the cut, what is left as residual, or the stage of recovery of
the cut. This distinction made it necessary to edit single
images to match specifications from the experimental de-
sign so that the appropriate attributes could be seen con-
currently.
Creating the Visual Instrument
The landscape images chosen to represent forest condi-
tions in this study were taken at roadside locations in the
Golden Downs and Rai Forests in the Nelson, NZ, area.
Locations were chosen in concert with FRI staff and staff
from the Fletcher Challenge company which manages many
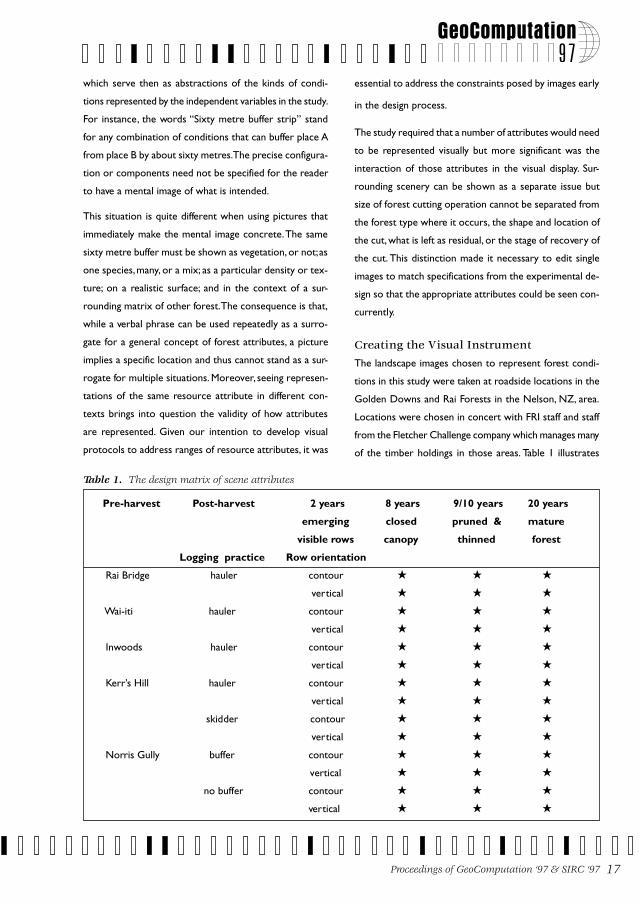
of the timber holdings in those areas. Table 1 illustrates
Pre-harvest Post-harvest 2 years 8 years 9/10 years 20 years
emerging closed pruned & mature
visible rows canopy thinned forest
Logging practice Row orientation
Rai Bridge hauler contour ★ ★ ★
vertical ★ ★ ★
Wai-iti hauler contour ★ ★ ★
vertical ★ ★ ★
Inwoods hauler contour ★ ★ ★
vertical ★ ★ ★
Kerr’s Hill hauler contour ★ ★ ★
vertical ★ ★ ★
skidder contour ★ ★ ★
vertical ★ ★ ★
Norris Gully buffer contour ★ ★ ★
vertical ★ ★ ★
no buffer contour ★ ★ ★
vertical ★ ★ ★
Table 1. The design matrix of scene attributes
18 Proceedings of GeoComputation ‘97 & SIRC ‘97
the image set design with five initial images, four manage-
ment treatments, and five time steps in scenario develop-
ment. Implausible combinations were deliberately excluded
from the set.
Developing the Set of Oblique Views
A first step to image creation was to create a library of
source imagery. Since the roadside view was central to
the study, the image library needed to be taken from a
similar viewpoint. During the spring of 1994 more than
three thousand photos of forest conditions were collected,
around Golden Downs and Rai Forests near Nelson, and
Whakarewarewa Forest at Rotorua.
The camera was a hand-held Nikon 8008 with autofocus
and auto exposure. The majority of photos were taken at
a 50 mm focal length setting. A moderate telephoto lens of
85 mm focal length was used at times for finer detail. The
film was Kodak Ektachrome Elite, a 100 ASA semi-profes-
sional colour film with reasonable speed and good colour
rendition. A polarising filter was used at all times and cam-
era direction of view was held between 15 and 60 degrees
of a line directly opposing sun bearing. These latter two
measures were to maximise colour saturation. Three hun-
dred images were selected from the entire set based on
an appraisal of image quality as well as suitability for filling
the experimental design requirements. These baseline im-
ages were transferred to Photo-CD format by Kodak.
A resolution of 768 x 512 pixels and 24-bit colour depth,
was used for this project, a compromise between quality
needed and the size and concomitant complexity of large
image files. Adobe Photoshop™ software on Apple Macin-
tosh computers was used for image manipulation. Orland
(1988, 1993) has described the evolution of typical uses of
these tools, the basic techniques, and issues of image valid-
ity and utility. All images underwent histogram equalisa-
tion to achieve the best consistent contrast and colouration
throughout the image set as it was clear at the outset that
the study design would necessitate considerable image
editing and the use of an extensive source image library.
Implementation of SmartForest II
The New Zealand forest industry uses sophisticated for-
est management decision support systems (DSS) for
growth and yield predictions, valuation and estate model-
ling. For our study, future forest stand conditions were
predicted using STANDPAK (Whiteside, 1990), a DSS de-
signed to model individual stand growth and yield while
optimising silvicultural management alternatives. Forest
harvesting plans were developed in consultation with for-
est managers. However, despite having carefully developed
harvesting plans and projected future plantation conditions,
to portray that information in a visual medium by con-
structing accurate data driven visualisations is a complex
task.
Using a simple 3-D projection from GIS data does not
adequate display the height of “layers” of trees on the land-
scape so that visibility can be verified, and the thickness of
linear graphical elements is such that boundaries seen at
oblique angles cannot be differentiated. In our study a great
number of attributes need to be represented visually but
equally significant was the interaction of those attributes
in the visual display. For example, the size of a forest cut-
ting operation cannot be separated from the forest type
where it occurs, the shape and location of the cut, what is
left as residual, or the stage of recovery of the cut. This
distinction made it necessary to use a software system to
create schematic analytic visualisations to match specifica-
tions from the experimental design and to verify that the
appropriate attributes could be seen concurrently.
SmartForest II (Orland, 1994) is a landscape visualisation
software package capable of displaying a schematic repre-
sentation of tree density, size and homogeneity of stand
composition in correct visual perspective and was designed
to deal with planning forest landscapes at large scale but
at the same time to be able to develop specific manage-
ment strategies at a small, tree-by-tree scale. Real time
display of viewsheds and the capability to move within the
“scene” data space makes the tool eminently suitable for
landscape planning applications. The software requires a
Silicon Graphics or IBM RS6000 platform and is available
19Proceedings of GeoComputation ‘97 & SIRC ‘97
via the World Wide Web at http://imlab9.landarch.uiuc.edu/
SF/SF.html.
For our application, each of the three component data
sets necessary to drive SmartForest II simulations were
provided by integration of the outputs from other soft-
ware systems. A digital elevation model (DEM) to provide
topographical data for creating the landform features was
generated from elevation data stored as contour cover-
age’s in a GIS, ARC/INFO® (ESRI, 1991). To derive a DEM
involved stepping through a number of processes to con-
vert the data to a grid of data in the USGS DEM format
supported by both ARC/INFO® and SmartForest II. Prob-
lems were encountered in making the final transformation
to the DEM, largely because of the differences in coordi-
nate systems, units, and completeness of metadata in the
NZ records versus the expectations of the ARC/INFO®
software. Work-arounds were developed that involved
manual editing of file headers to ensure an accurate DEM
generation.
SmartForest II uses a Stand File to provide information
about the location of stand boundaries to superimpose
on the DEM, vector files containing data for each of the
landscape management scenarios in our experimental de-
sign were developed using TerraSoft® GIS (PCI, 1996) be-
fore being translated to ARC/INFO® stand boundary
coverages.
As SmartForest II utilises gridded data (where grid cells
are assigned stand identifiers that determine the Tree List
attribute data to be placed at that location) the stand
boundary coverage’s were translated into a grid format,
for each age step to be visualised. Finally, the Tree List Files
(which provide records of the vegetation to place in each
stand cell location) were generated for each age class to
be represented in the visualisations (0, 2, 8, 10, 20 years)
by substitution with STANDPAK model data.
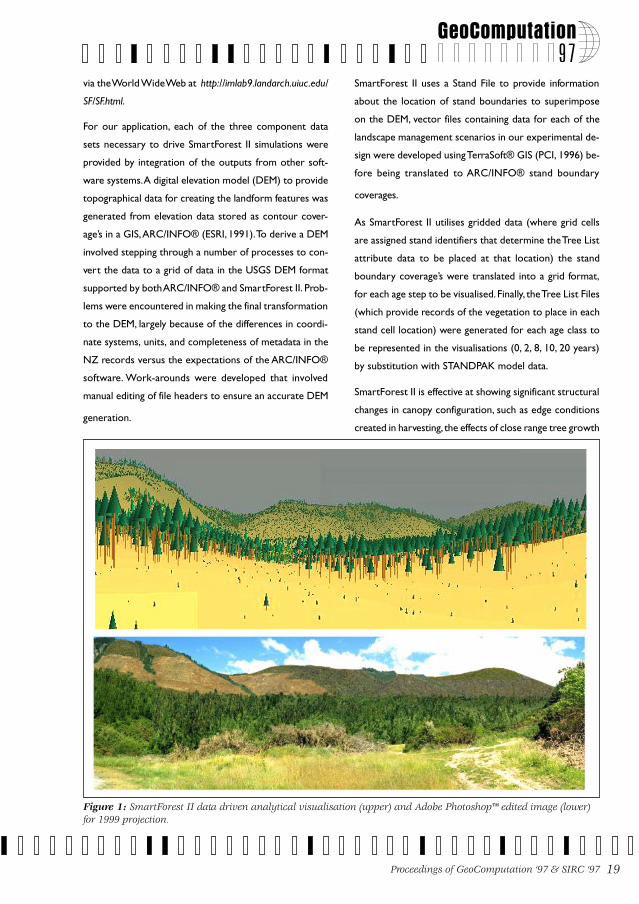
SmartForest II is effective at showing significant structural
changes in canopy configuration, such as edge conditions
created in harvesting, the effects of close range tree growth
Figure 1: SmartForest II data driven analytical visualisation (upper) and Adobe Photoshop™ edited image (lower)for 1999 projection.
20 Proceedings of GeoComputation ‘97 & SIRC ‘97
in buffer plantings on visibility of distant operations, and
through use of false colour to show non-visible character-
istics such as size class, age, species distribution and
silvicultural history. SmartForest II visualisations can be
stepped through a time sequence to generate analytical
simulations for each viewpoint and scenario within the
experimental design (Figure 1). Extensive use was made of
the analytical simulations to guide image editing of the first
sets of photorealistic visualisations. This approach provided
a data driven and defensible linkage to the image product.
Creating Calibrated Images
Once the design issues were resolved, the assembly of the
images was a somewhat mechanical process of taking im-
age portions and combining them to fit the design specifi-
cations. Adobe Photoshop™ image editing software is the
de facto standard for this task. Image editing processes are
time-consuming and expensive and despite the extensive
preparation work, it was difficult to achieve good fit be-
tween image parts. It was also intellectually taxing to syn-
thesise the multiple concurrent demands of the study de-
sign into a single image. However, at this time the realism
achievable by more directly data-driven visualisation tools
is not good enough to support choices involving the ap-
pearance of scenic resources.
At three stages during the evolution of the image set, a
process of intensive review and validation was undertaken.
One-on-one direct expert input
To further verify the shared understanding of forest con-
ditions, the collaborators held an intensive workshop ses-
sion to identify base and guide images for all scenes and to
specify image editing directions for the image editors.
First-round review to verify image
specifications and guidelines
After the first attempt to meet design specifications, all
images were sent to FRI in draft form for review and feed-
back. Printed images were marked with instructions and
returned to the image editors.
Further reviews to verify attribute scaling
As the image sets proceeded to completion it was critical
to determine if they matched the desired attribute scaling,
and if the forest conditions were represented accurately.
Because of the distances between key participants, images
were encoded as compressed JPG files and transmitted
via ftp over the Internet.
The characteristics making the scenes particularly difficult
both to design and construct as a visualisation were that
the scenes represented many different forest areas in an
extensive landscape setting such that stands would be at
different viewer-object distances and orientations. All im-
ages detailed in the design (Table 1) were completed and
successfully included in the attitude survey instrument.
Perceptual Survey
Visualisations of alternative forest plantation management
scenarios were used in a systematic assessment of public
perceptions of the visual consequences of each scenario.
The perceptual assessment was approached in two for-
mats: [1] a paired- comparison format in which overall
visual effects of alternative management plans were repre-
sented across a full rotation for a single stand; and [2] a
single-scene format in which the visual quality of individual
views (each depicting only one stage of the progression
from harvest to re-establishment to final mature growth)
was rated in the context of a sampling of typical New
Zealand plantation forest scenes. The rationale for the two
procedures was that the paired comparison procedure
provides the most sensitive assessment of perceived over-
all differences between the management options repre-
sented, while the single scene procedure more closely ap-
proximates the typical context in which a forest visitor
might encounter the effects of forest management on the
landscape.
The paired comparison survey was presented in an indi-
vidual interview procedure applied to both New Zealand
residents and to samples of foreign visitors. The single scene
assessment was presented to groups of New Zealand resi-
dents and to one small group of foreign visitors.
21Proceedings of GeoComputation ‘97 & SIRC ‘97
Paired-comparison format
Visualisations for each management scenario for each rep-
resented site were laid out as individual colour prints ar-
rayed on single A4 pages of a test “booklet” (photo-al-
bum). For each site-management scenario individual scenes
were arrayed in a sequence from: [i] original condition
(mature forest); [ii] immediately after harvesting; [iii] new
forest (2 years after planting); [iv] young forest (8 years);
[v] after thinning and pruning (10 years); and [vi] back to
mature forest (20 years).
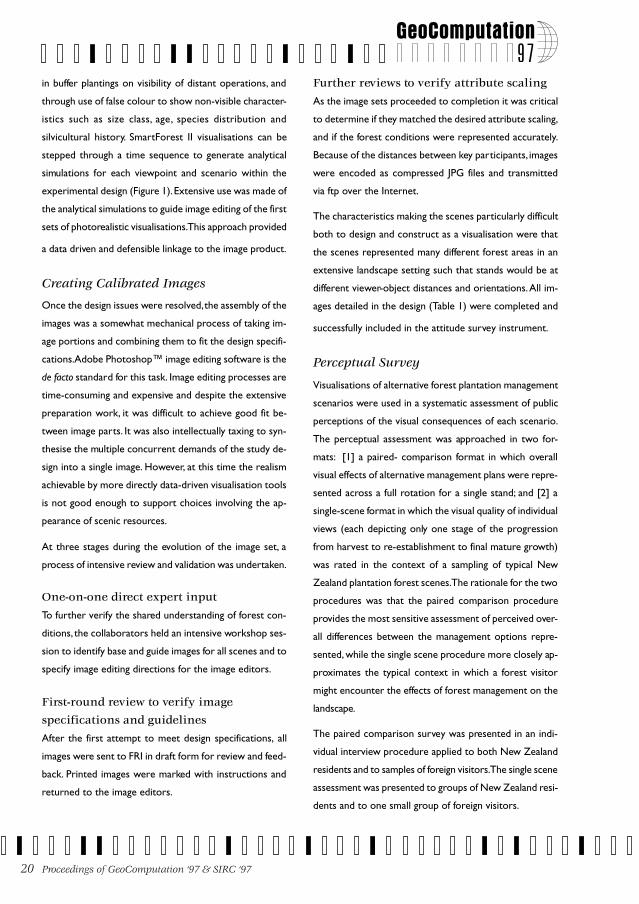
For four of the five forest sites represented (Rai Bridge,
Wai-iti, Inwoods, and Kerr’s Hill) the management plans
compared differed only in whether the re-establishment
of the forest following initial clear-cut harvest was accom-
plished by planting new trees in vertical rows (running up
the slope) or in horizontal rows (following the contours
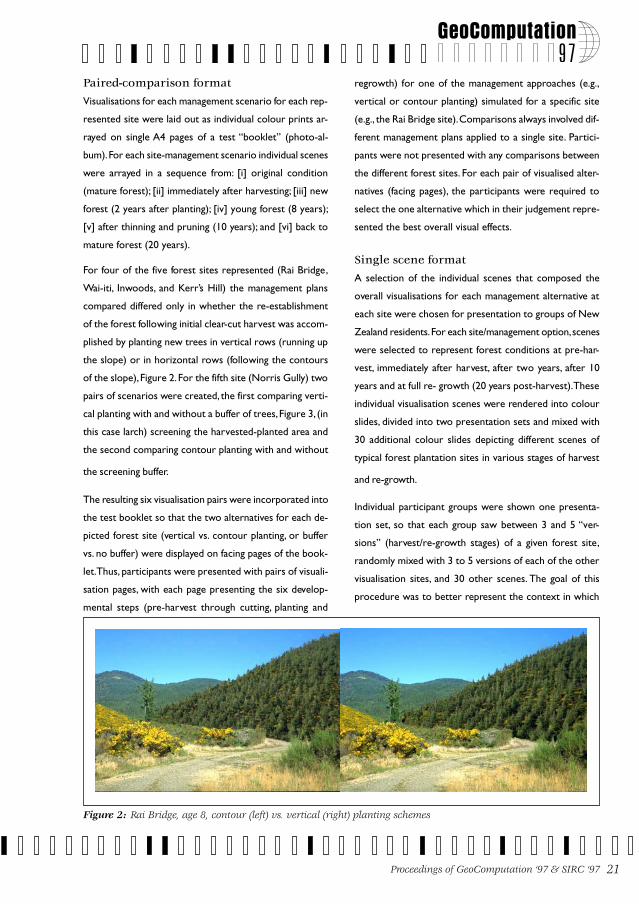
of the slope), Figure 2. For the fifth site (Norris Gully) two
pairs of scenarios were created, the first comparing verti-
cal planting with and without a buffer of trees, Figure 3, (in
this case larch) screening the harvested-planted area and
the second comparing contour planting with and without
the screening buffer.
The resulting six visualisation pairs were incorporated into
the test booklet so that the two alternatives for each de-
picted forest site (vertical vs. contour planting, or buffer
vs. no buffer) were displayed on facing pages of the book-
let. Thus, participants were presented with pairs of visuali-
sation pages, with each page presenting the six develop-
mental steps (pre-harvest through cutting, planting and
regrowth) for one of the management approaches (e.g.,
vertical or contour planting) simulated for a specific site
(e.g., the Rai Bridge site). Comparisons always involved dif-
ferent management plans applied to a single site. Partici-
pants were not presented with any comparisons between
the different forest sites. For each pair of visualised alter-
natives (facing pages), the participants were required to
select the one alternative which in their judgement repre-
sented the best overall visual effects.
Single scene format
A selection of the individual scenes that composed the
overall visualisations for each management alternative at
each site were chosen for presentation to groups of New
Zealand residents. For each site/management option, scenes
were selected to represent forest conditions at pre-har-
vest, immediately after harvest, after two years, after 10
years and at full re- growth (20 years post-harvest). These
individual visualisation scenes were rendered into colour
slides, divided into two presentation sets and mixed with
30 additional colour slides depicting different scenes of
typical forest plantation sites in various stages of harvest
and re-growth.
Individual participant groups were shown one presenta-
tion set, so that each group saw between 3 and 5 “ver-
sions” (harvest/re-growth stages) of a given forest site,
randomly mixed with 3 to 5 versions of each of the other
visualisation sites, and 30 other scenes. The goal of this
procedure was to better represent the context in which
Figure 2: Rai Bridge, age 8, contour (left) vs. vertical (right) planting schemes
22 Proceedings of GeoComputation ‘97 & SIRC ‘97
forest management effects are typically experienced by
forest visitors, e.g., many different sites are encountered,
and each site is in one or another stage of development.
Participants were required to rate each of the 50 scenes
on a ten-point scale that extended from “very low scenic
quality” to “very high scenic quality.”
Participants and procedures
No attempt was made to achieve a formal “representative
random sample” of either New Zealand residents or of
foreign visitors for this perceptual assessment. Rather, a
“convenience sample” procedure was employed, which has
proven adequate in similar previous studies (e.g., Daniel &
Boster, 1976; Malm, et al., 1981). Candidates for the paired-
comparison portions of the survey were intercepted by
two interviewers at highly frequented locations in the re-
gion of the forest sites represented and asked to voluntar-
ily participate. For the individual scene presentations to
groups, an attempt was made to sample a cross-section of
New Zealand resident groups that were a priori expected
to have different perspective’s and values regarding forest
plantation management.
Paired-comparison sample
The paired-comparison assessment was conducted by in-
dividual intercept interviews carried out in the Nelson
Region and in Christchurch on the South Island and in
Rotorua on the North Island of New Zealand. Locations
for the interviews were chosen to provide a target number
of 500 participants, divided between New Zealand resi-
dents and foreign visitors. Interview sites were selected to
maximise exposure to a diverse range of potential par-
ticipants, where there was expected to be a relatively rapid
turnover of people (such as a town center or a visitor
information facility), and where people would be expected
to have time available to complete the survey (such as the
InterIslander Ferry and the airport). Given these criteria, a
number of locations were selected.
The town centre, the Polytechnic, and the Airport loca-
tions were primarily aimed at the local resident popula-
tion. The InterIslander Ferry was chosen as likely to pro-
vide a higher proportion of overseas visitors. Christchurch
and Rotorua locations provided mostly New Zealand resi-
dents who lived outside the immediate area of the study.
Other locations included the town center in Richmond,
several towns near the study area, and nearby recreation
areas.
The interviews were all conducted between 9 and 24 Feb-
ruary, 1996. Interview times were selected to concur with
observed peak time of occupancy which was typically
around midday. The most successful areas in terms of
number of participants were the Nelson Airport and the
InterIslander Ferry, both due to the number of people pass-
ing through and to the relatively large amounts of time
people spend at these locations. Also, people in these ar-
eas were typically seated, which apparently made them
more willing to participate.
The intercept interviews were carried out with the use of
the “booklet” (photo-album) of forest management
visualisations described above. It was found that the most
Figure 3: Norris Gully, age 2, vertical planting, buffer (left) vs. no-buffer (right)
23Proceedings of GeoComputation ‘97 & SIRC ‘97
effective way of interviewing the public was to approach
them as they were waiting and ask them if they would like
to participate. For their ease, the participants were given a
clipboard and pen so they could take all the time required
to study and complete the questionnaire. The question-
naire and answer sheet to the survey were designed to be
as logical and as simple as possible so that it would apply
to the greatest cross section of the public. For each visu-
alisation-pair, participants were required to first choose
the alternative which they judged as presenting the best
overall visual quality, and then to allocate 100 “points” to
indicate how much better the preferred alternative was.
An allocation of 50/50 indicated no perceptible difference—
the participant was simply guessing—and an allocation of
100/0 indicated that there was the maximum possible dif-
ference between the alternatives.
Some of the participants had difficulty understanding the
printed instructions, so that it was necessary for the inter-
viewer to take them verbally through the procedure re-
sulting in more time being devoted to some respondents
than to others. Each interviewer used two or more book-
lets, allowing the participation of more than one person
simultaneously.
Individual-scene group sample
The group presentations complemented the intercept in-
terviews by purposely targeting different sectors of the
overall survey population (e.g., forest industry groups, com-
munity political groups, and environmental interest groups).
Letters were sent out to local interest groups in the Nel-
son area, with the goal of contacting a wide spectrum of
interests related to forest plantation management.
The group presentations were each of about three quar-
ters of an hour in length. Each session comprised a brief
introduction and instructions (postponing discussion of the
objectives of the study) followed by presentation and rat-
ing of the 50 slides. Only after all the ratings had been
completed, was there an explanation of how the
visualisations were produced and the objectives of the
study.
Demographic and other information
Each participant in both the paired-comparison and the
single-scene presentation groups completed a brief ques-
tionnaire about themselves and the nature of their experi-
ences and relationships to the New Zealand forests and
landscape. Resident participants provided information about
place of residence, ethnicity, frequency and contexts of visits
to forest areas, family involvement with forest industry,
and environmental group memberships. Non-residents
provided information about country of residence, number
of visits to New Zealand, purpose of present visit, and
memberships in environmental interest groups.
In addition residents provided an estimate of the “contri-
bution of the pine forests to the quality of the New Zea-
land landscape” by marking a line that extended from “ex-
tremely negative” to “ extremely positive.” Non-residents
indicated three factors (scenery/landscape, food/accom-
modation, people, adventure activities, Maori culture, wild-
life, horticulture, weather/climate) that “made the greatest
positive contribution to quality of your visit” and also
indicated their judgement of the contribution of the “pine
forests to the quality of the New Zealand landscape” us-
ing the same line marking procedure as used by residents.
Results and Discussion
Visualisations
As part of the intent of this project to provide new forest
management tools and to guide forest managers in satisfy-
ing multiple resource objectives it is important to evaluate
the usefulness of the tools used in this case study in rela-
tion to operational forest management practices. Although
the development of the visualisations was successful, the
complex nature of the data and tools utilised for our visu-
alisation process would require customisation, integration
with individual databases and operator training before they
could be used routinely in a production manner.
We recognised that issues of integration and accuracy of
each of the diverse data sources would be critical to achieve
photorealistic, defensible, data driven visualisations. Sev-
24 Proceedings of GeoComputation ‘97 & SIRC ‘97
eral factors contributed to our success in providing
visualisations of future forest conditions on a complex
landform involving a number of individual forest stand com-
ponents, namely: the accuracy of the spatial data, availabil-
ity of well validated forest modelling systems and suitable
landscape visualisation software.
SmartForest II software is a suitable tool for integration
with routine forest management practices, however, all of
the data sources necessary for its operation are not read-
ily available for much of the New Zealand forest estate at
present. Development of photorealistic imagery is time
consuming, expensive and requires skilled operators. The
key for forest managers however, is to realise what is pos-
sible with the increasing use of integrated GPS, digital pho-
tography, computing technologies and to simply start col-
lecting the data.
We recognised a “spin-off” benefit during the image edit-
ing phase where it was necessary to generate a consensus
view among a panel as to the representation of conditions
on the ground. We found that this view may, in fact, be
more valuable information than a precise biological de-
scription. While there is an obvious need to supply the
management process with better information, the collec-
tive judgment of experienced managers is also a valuable
source of data. A possible by-product of such collabora-
tive reviews may be a better grasp of the salient issues and
a better shared understanding within a management group.
This speculation is untested, but based on our interpreta-
tions of observing other review processes.
Perceptual Survey
The primary results of interest were the expressed pref-
erences among the visualised alternative management sce-
narios in the paired comparison interviews and the scenic
quality ratings provided by the groups in the single-scene
assessment. In that context, comparisons were made in
the assessments provided by residents and non-residents,
and among the various sample locations and interest groups
represented. Results for the paired comparison and the
single scene portions of the study are reported separately
below.
Paired-comparison results
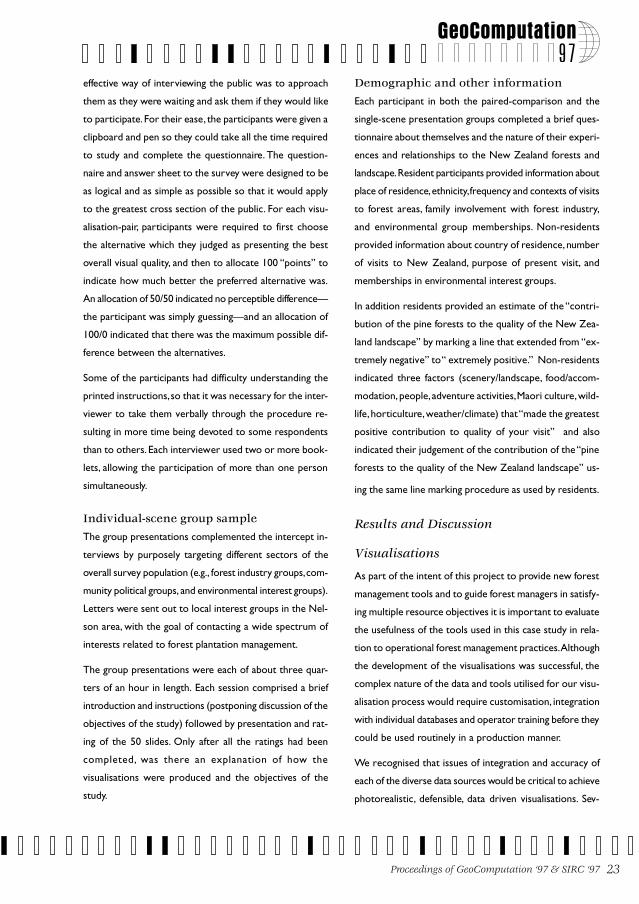
As indicated in Figure 4, participants did not exhibit differ-
ential preferences for the visualisations of vertical planting
as compared to contour planting methods. The Rai Bridge,
Wai-iti, Inwoods and Kerr’s Hill sites all produced average
point allocations for the Vertical option that were very
near (and not significantly different from) 50/50. With re-
gard to the comparisons of buffer vs. no buffer (the Norris
Gully site), the visualisations that retained the buffer of
larch trees screening the harvested area was consistently
and substantially preferred for both the vertical and the
contour planting options represented, with point alloca-
tions averaging 80/20 in favour of buffers in both cases.
Figure 4 also reveals that there was very little (not signifi-
cant) variation among the responses recorded by the par-
ticipants intercepted at the various interview locations.
Similar comparisons also failed to find significant differ-
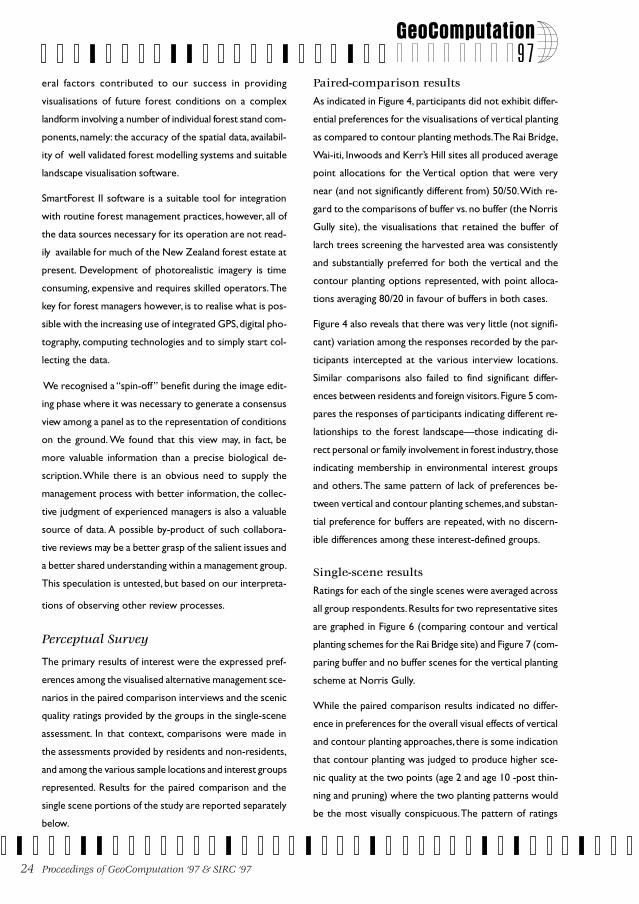
ences between residents and foreign visitors. Figure 5 com-
pares the responses of participants indicating different re-
lationships to the forest landscape—those indicating di-
rect personal or family involvement in forest industry, those
indicating membership in environmental interest groups
and others. The same pattern of lack of preferences be-
tween vertical and contour planting schemes, and substan-
tial preference for buffers are repeated, with no discern-
ible differences among these interest-defined groups.
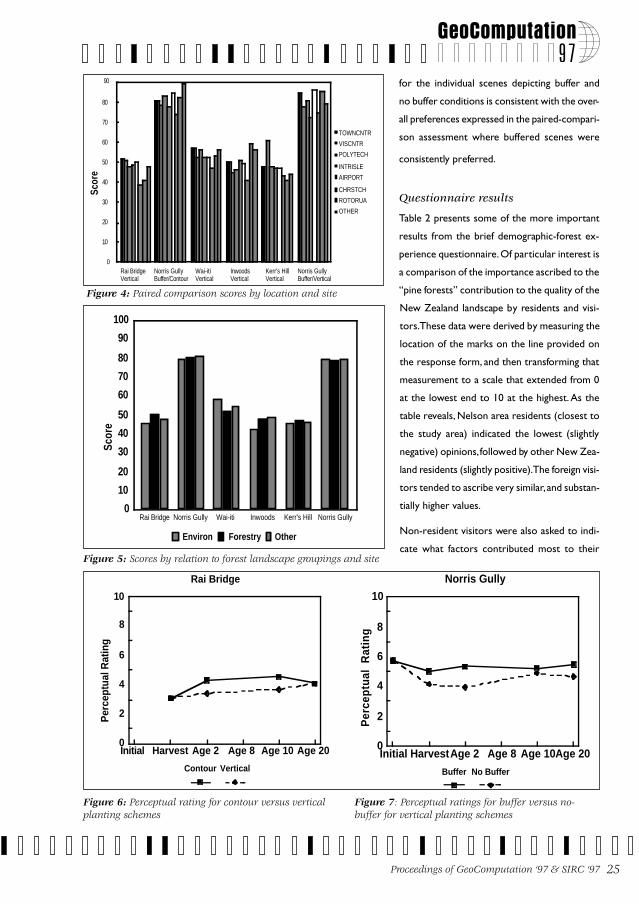
Single-scene results
Ratings for each of the single scenes were averaged across
all group respondents. Results for two representative sites
are graphed in Figure 6 (comparing contour and vertical
planting schemes for the Rai Bridge site) and Figure 7 (com-
paring buffer and no buffer scenes for the vertical planting
scheme at Norris Gully.
While the paired comparison results indicated no differ-
ence in preferences for the overall visual effects of vertical
and contour planting approaches, there is some indication
that contour planting was judged to produce higher sce-
nic quality at the two points (age 2 and age 10 -post thin-
ning and pruning) where the two planting patterns would
be the most visually conspicuous. The pattern of ratings
25Proceedings of GeoComputation ‘97 & SIRC ‘97
for the individual scenes depicting buffer and
no buffer conditions is consistent with the over-
all preferences expressed in the paired-compari-
son assessment where buffered scenes were
consistently preferred.
Questionnaire results
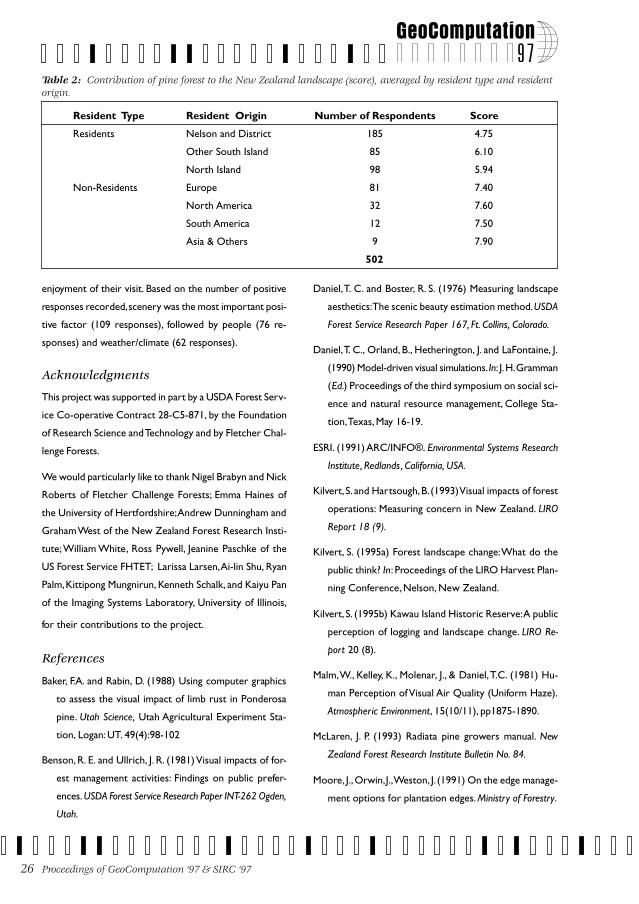
Table 2 presents some of the more important
results from the brief demographic-forest ex-
perience questionnaire. Of particular interest is
a comparison of the importance ascribed to the
“pine forests” contribution to the quality of the
New Zealand landscape by residents and visi-
tors. These data were derived by measuring the
location of the marks on the line provided on
the response form, and then transforming that
measurement to a scale that extended from 0
at the lowest end to 10 at the highest. As the
table reveals, Nelson area residents (closest to
the study area) indicated the lowest (slightly
negative) opinions, followed by other New Zea-
land residents (slightly positive). The foreign visi-
tors tended to ascribe very similar, and substan-
tially higher values.
Non-resident visitors were also asked to indi-
cate what factors contributed most to theirFigure 5: Scores by relation to forest landscape groupings and site
Rai Bridge Norris Gully Wai-iti Inwoods Kerr's Hill Norris Gully0
10
20
30
40
50
60
70
80
90
100
Scor
e
Environ Forestry Other
Figure 7: Perceptual ratings for buffer versus no-buffer for vertical planting schemes
Norris Gully
Initial HarvestAge 2 Age 8 Age 10Age 200
2
4
6
8
10
Per
cept
ual
Rat
ing
Buffer No Buffer
Figure 6: Perceptual rating for contour versus verticalplanting schemes
Rai Bridge
Initial Harvest Age 2 Age 8 Age 10 Age 200
2
4
6
8
10
Per
cept
ual R
atin
g
Contour Vertical
Figure 4: Paired comparison scores by location and site
0
10
20
30
40
50
60
70
90
Rai BridgeVertical
Norris GullyBuffer/Contour
Wai-itiVertical
InwoodsVertical
Kerr's HillVertical
Norris GullyBuffer/Vertical
Scor
e
TOWNCNTR
VISCNTR
POLYTECH
INTRISLE
AIRPORT
CHRSTCH
ROTORUA
OTHER
80
26 Proceedings of GeoComputation ‘97 & SIRC ‘97
enjoyment of their visit. Based on the number of positive
responses recorded, scenery was the most important posi-
tive factor (109 responses), followed by people (76 re-
sponses) and weather/climate (62 responses).
Acknowledgments
This project was supported in part by a USDA Forest Serv-
ice Co-operative Contract 28-C5-871, by the Foundation
of Research Science and Technology and by Fletcher Chal-
lenge Forests.
We would particularly like to thank Nigel Brabyn and Nick
Roberts of Fletcher Challenge Forests; Emma Haines of
the University of Hertfordshire; Andrew Dunningham and
Graham West of the New Zealand Forest Research Insti-
tute; William White, Ross Pywell, Jeanine Paschke of the
US Forest Service FHTET; Larissa Larsen, Ai-lin Shu, Ryan
Palm, Kittipong Mungnirun, Kenneth Schalk, and Kaiyu Pan
of the Imaging Systems Laboratory, University of Illinois,
for their contributions to the project.
References
Baker, F.A. and Rabin, D. (1988) Using computer graphics
to assess the visual impact of limb rust in Ponderosa
pine. Utah Science, Utah Agricultural Experiment Sta-
tion, Logan: UT. 49(4):98-102
Benson, R. E. and Ullrich, J. R. (1981) Visual impacts of for-
est management activities: Findings on public prefer-
ences. USDA Forest Service Research Paper INT-262 Ogden,
Utah.
Resident Type Resident Origin Number of Respondents Score
Residents Nelson and District 185 4.75
Other South Island 85 6.10
North Island 98 5.94
Non-Residents Europe 81 7.40
North America 32 7.60
South America 12 7.50
Asia & Others 9 7.90
502
Table 2: Contribution of pine forest to the New Zealand landscape (score), averaged by resident type and residentorigin.
Daniel, T. C. and Boster, R. S. (1976) Measuring landscape
aesthetics: The scenic beauty estimation method. USDA
Forest Service Research Paper 167, Ft. Collins, Colorado.
Daniel, T. C., Orland, B., Hetherington, J. and LaFontaine, J.
(1990) Model-driven visual simulations. In: J. H. Gramman
(Ed.) Proceedings of the third symposium on social sci-
ence and natural resource management, College Sta-
tion, Texas, May 16-19.
ESRI. (1991) ARC/INFO®. Environmental Systems Research
Institute, Redlands, California, USA.
Kilvert, S. and Hartsough, B. (1993) Visual impacts of forest
operations: Measuring concern in New Zealand. LIRO
Report 18 (9).
Kilvert, S. (1995a) Forest landscape change: What do the
public think? In: Proceedings of the LIRO Harvest Plan-
ning Conference, Nelson, New Zealand.
Kilvert, S. (1995b) Kawau Island Historic Reserve: A public
perception of logging and landscape change. LIRO Re-
port 20 (8).
Malm, W., Kelley, K., Molenar, J., & Daniel, T.C. (1981) Hu-
man Perception of Visual Air Quality (Uniform Haze).
Atmospheric Environment, 15(10/11), pp1875-1890.
McLaren, J. P. (1993) Radiata pine growers manual. New
Zealand Forest Research Institute Bulletin No. 84.
Moore, J., Orwin, J., Weston, J. (1991) On the edge manage-
ment options for plantation edges. Ministry of Forestry.
27Proceedings of GeoComputation ‘97 & SIRC ‘97
Orland, B. (1988) (2nd ed., 1992) Aesthetic preference for
rural landscapes: Some resident and visitor differences.
Ch. 5. In: J. Nasar (Ed.) The visual quality of the environ-
ment: Theory, research and applications. Cambridge. pp.
364-367.
Orland, B. (1992) (Guest Ed.) Data visualization in environ-
mental management. Special Issue Landscape and Urban
Planning 21.
Orland, B. (1993) Synthetic landscapes: a review of video-
imaging applications in environmental perception re-
search, planning, and designs. In: D. Stokols and R. Marans
(Eds.) Environmental Simulation: Research and Policy
Issues. new York: Plenum.
Orland, B. (1994) SmartForest — A 3-D interactive forest
visualization environment. In: Proceedings, Decision
Support 2001 — Resource Technology 94, American
Society for Photogrammetry and Remote Sensing,
Washington, D.C. pp. 181-190.
Orland, B., Daniel, T.C., Hetherington, J. and Paschke, J.L.
(1993) Visualization of Forest Management Issues on the
Dixie National Forest. Final report. US Forest Service
Forest Pest Management — Region 4 and Methods
Application Group (FPM-MAG). 60pp.
Orland, B., Daniel, T. C. and Haider, W. (1994) Calibrated
Images: Landscape Visualisations to Meet Rigorous Ex-
perimental Design Specification. In: Proceedings, Deci-
sion Support 2001 - Resource Technology 94, ASPRS,
Washington, D.C. pp. 919-926
Parliament of New Zealand. (1991) Resource Management
Act 1991.
PCI. (1996) TerraSoft® PCI, Ontario, Canada.
Sissons, D. and Conway, M. (1991) Golden Downs Forest
Clark Valley - A proposal for reducing the visual impact
of timber harvesting. Sissons and Conway Limited. 23 Crop
Place, Richmond, Nelson.
Swaffield, S. R. (1994) Attitudes towards trees: a case study
in the New Zealand high country. NZ Forestry, February,
1994. pp. 25-30.
Thompson, S. and Weston, J. (1994) South Island high coun-
try forest design. Ministry of Forestry.
Whiteside, I.D. (1990) STANDPAK Stand modelling sys-
tem for radiata pine. In: Proceedings IUFRO Symposia
“New approaches to spacing and thinning in plantation
forestry” April 10-14, 1989, Rotorua, New Zealand. Ed:
R. N. James and G. L. Tarlton