A Visual Tool for Analyzing Portfolios, Portfolio Managers & Equity
28
A A V V i i s s u u a a l l T T o o o o l l f f o o r r A A n n a a l l y y z z i i n n g g P P o o r r t t f f o o l l i i o o s s , , P P o o r r t t f f o o l l i i o o M M a a n n a a g g e e r r s s & & E E q q u u i i t t y y I I n n v v e e s s t t m m e e n n t t s s by J J i i m m C C . . O O t t a a r r , , C C F F P P , , B B . . A A . . S S c c . . , , M M . . E E n n g g . . ©1997-2002 Copyright by Otar & Associates -6.0% -4.0% -2.0% 0.0% 2.0% 4.0% 6.0% -6.0% -4.0% -2.0% 0.0% 2.0% 4.0% 6.0%
Transcript of A Visual Tool for Analyzing Portfolios, Portfolio Managers & Equity

AA VViissuuaall TTooooll ffoorr AAnnaallyyzziinngg PPoorrttffoolliiooss,, PPoorrttffoolliioo MMaannaaggeerrss && EEqquuiittyy IInnvveessttmmeennttss
by
JJiimm CC.. OOttaarr,, CCFFPP,, BB..AA..SScc..,, MM.. EEnngg.. ©1997-2002 Copyright by Otar & Associates
-6.0%
-4.0%
-2.0%
0.0%
2.0%
4.0%
6.0%
-6.0% -4.0% -2.0% 0.0% 2.0% 4.0% 6.0%

All tables, projections and calculations in this booklet are for the purpose of illustrating the effects of the fingerprinting technique in portfolio planning and portfolio manager evaluation. They are not intended reflect future values or returns on the
investments.
Important information about each mutual fund is contained in a simplified prospectus.
The simplified prospectus includes information about the fund's investment objective, applicable costs, and how to purchase, exchange or redeem. Please read it carefully and consult your group financial advisor before investing.
As with any investment, there are risks to investing in mutual funds and/or equities. There is no assurance that any fund will achieve its investment objective. The fund value, yield and investment returns will fluctuate with market conditions.
Investors may face a gain or a loss when they sell their units in any fund.
Mutual fund and equity investments are not "deposits" within the meaning of the Canada Deposit Insurance Corporation Act (Canada) and they are not insured under the provisions of that Act or any other legislation.
February 2000

Contents:
BASICS: What is a Fingerprint? --------------------------------------------- 5 How is a Fingerprint Generated? ------------------------------ 13 PORTFOLIO STYLE: Uncovering Portfolio Style ------------------------------------- 16 APPLICATIONS: Selecting Portfolio Managers ---------------------------------- 21 Catching Sector Trends ----------------------------------------- 22 Following the Footsteps ---------------------------------------- 26 Estimating Cost Recovery -------------------------------------- 27


©1999 Cemil Otar Page 5 Fingerprinting
What is a Fingerprint? As investors, we want our portfolios1 or mutual funds to surpass the markets when they rise. And of course, we want them to retain their value when markets fall. However, the current definition of risk and return does not measure this need. The definition of "risk", as it pertains to equity portfolios, does not differentiate between the "good" risk and the "bad" risk. The "good" risk is the volatility of a fund when it is rising and the "bad" risk is when it is falling. A portfolio manager may excel in rising markets and outperform it when the markets are going up. Another portfolio manager may excel in falling markets by playing defensively and losing less than the markets. In the final analysis, both of these managers may outperform the market, because one plays well offensively, and the other plays well defensively. How do we visualize how well the manager is performing? How can we tell if a manager is efficient in rising and/or falling markets? Is it possible to be good in both? 1 For the rest of this text "mutual fund" and "portfolio" is used interchangeably.
Figure 1: Visualizing Portfolio in Rising Markets
Portfolio rising less than the benchmark
Portfolio rising more than the
benchmark

©1999 Cemil Otar Page 6 Fingerprinting
The answer lies in "Fingerprinting" the portfolio. Fingerprinting helps visualize the portfolio's behavior separately both in rising and falling markets. It assists you in evaluating fund excellence. You will benefit from "fingerprinting" whether you are a "buy-and-hold" investor seeking efficient funds or a trader looking for opportunities in different sectors. The fingerprint chart depicts the performance in two dimensions. Rising Markets:
Referring to Figure 1, the vertical scale indicates how well the portfolio is performing in a rising market.
• If the portfolio outperforms the benchmark when the benchmark is rising, then the data point is on the top half of the chart.
• If the portfolio underperforms the benchmark when the benchmark is rising, then the data point is on the bottom half of the chart
The higher the point, the better is the portfolio in outperforming the benchmark.
Falling Markets:
Referring to Figure 2, the horizontal scale indicates how well the portfolio is performing in a falling market.
• If the portfolio outperforms the benchmark when the benchmark is falling, i.e. it loses less than the benchmark, then the data point is on the left hand side of the chart.
• If the portfolio underperforms the benchmark when the benchmark is falling, i.e. it loses more than the benchmark, then the data point is on the right hand side of the chart.
The more to the left is the data point, the better it is outperforming the benchmark.
Figure 2: Visualizing Portfolio in Falling Markets
Portfolio falling less than the benchmark
Portfolio falling more than the
benchmark

©1999 Cemil Otar Page 7 Fingerprinting
There are four possible zones in a fingerprint chart, as shown in Figure 3.
If the data point is in the top left quadrant, then this is an indication of a portfolio outperforming the benchmark when it is both rising and falling.
If the data point is in the bottom right quadrant, then this is an indication of a portfolio underperforming the benchmark when it is both rising and falling.
One of the amazing powers of fingerprinting is that it can pack all this price information into a single point. Next few pages show how a price line is reflected in the fingerprint chart.
Figure 3 Fingerprinting Chart Zones
Fund
risi
ng m
ore
than
mar
kets
Fund outperforms market.
Fund outperforms the market when
the market is going up and
underperforms when market is
going down
Fund
risi
ng le
ss
than
mar
kets
RIS
ING
MA
RK
ET
Fund outperforms the market when
the market is down and
underperforms when market is
going up
Fund under-performs the
market.
FALLING MARKET
Fund falling less than markets
Fund falling more than markets

©1999 Cemil Otar Page 8 Fingerprinting
A special location is the centre point.
If the data point is exactly at the centre, it means then the portfolio is performing exactly same as the benchmark, perhaps an index fund, as shown in Figure 4A and 4B.
Figure 4A: Price-Time Line
Fund performs identical to the benchmark.
Time
$Benchmark & Fund
perform identical
How Price-Time line is represented
on the Fingerprint
chart
Figure 4B Data Point in the Center of the Fingerprint Chart
Fund
risi
ng m
ore
than
mar
kets
.
Fund
risi
ng le
ss
than
mar
kets
RIS
ING
MA
RK
ET
FALLING MARKET
Fund falling less than markets
Fund falling more than markets

©1999 Cemil Otar Page 9 Fingerprinting
Another special point is on the diagonal line.
In the top right quadrant on this diagonal line, the portfolio outperforms the benchmark in rising markets exactly the same amount as it underperforms it when it is falling. The net effect is a portfolio with a higher volatility than the benchmark, but the net growth is exactly the same. See figures 5A and 5B.
Figure 5A: Price-Time Line
$
Time
Fund
Benchmark
How Price-Time line is represented
on the Fingerprint
chart
Figure 5B Data Point on the Diagonal Line
Fund
risi
ng m
ore
than
mar
kets
Fund
risi
ng le
ss
than
mar
kets
RIS
ING
MA
RK
ET
FALLING MARKET
Fund falling less than markets
Fund falling more than markets

©1999 Cemil Otar Page 10 Fingerprinting
In the bottom left quadrant on this diagonal line, the portfolio outperforms the benchmark in falling markets exactly the same amount as it underperforms it when it is rising. Similarly, the net effect is a portfolio with a lower volatility than the benchmark, but the net growth is exactly the same. See figures 6A and 6B.
Figure 6B: Price-Time Line
$ Benchmark
Time
How Price-Time line is represented
on the Fingerprint
chart Fund
Figure 6B Data Point on the Diagonal Line
Fund
risi
ng m
ore
than
mar
kets
Fund
risi
ng le
ss
than
mar
kets
RIS
ING
MA
RK
ET
FALLING MARKET
Fund falling less than markets
Fund falling more than markets

©1999 Cemil Otar Page 11 Fingerprinting
If the portfolio outperforms the benchmark when it is both rising or falling then the data point appears on the top left quadrant as shown in figures 7A and 7B.
Figure 7A: Price-Time Line
$
Time
Benchmark
Fund How Price-Time line is represented
on the Fingerprint
chart
Figure 7B Data Point on the Fingerprint Chart
Fund
risi
ng m
ore
than
mar
kets
Fund
risi
ng le
ss
than
mar
kets
RIS
ING
MA
RK
ET
FALLING MARKET
Fund falling less than markets
Fund falling more than markets
©1999 Cemil Otar Page 12 Fingerprinting
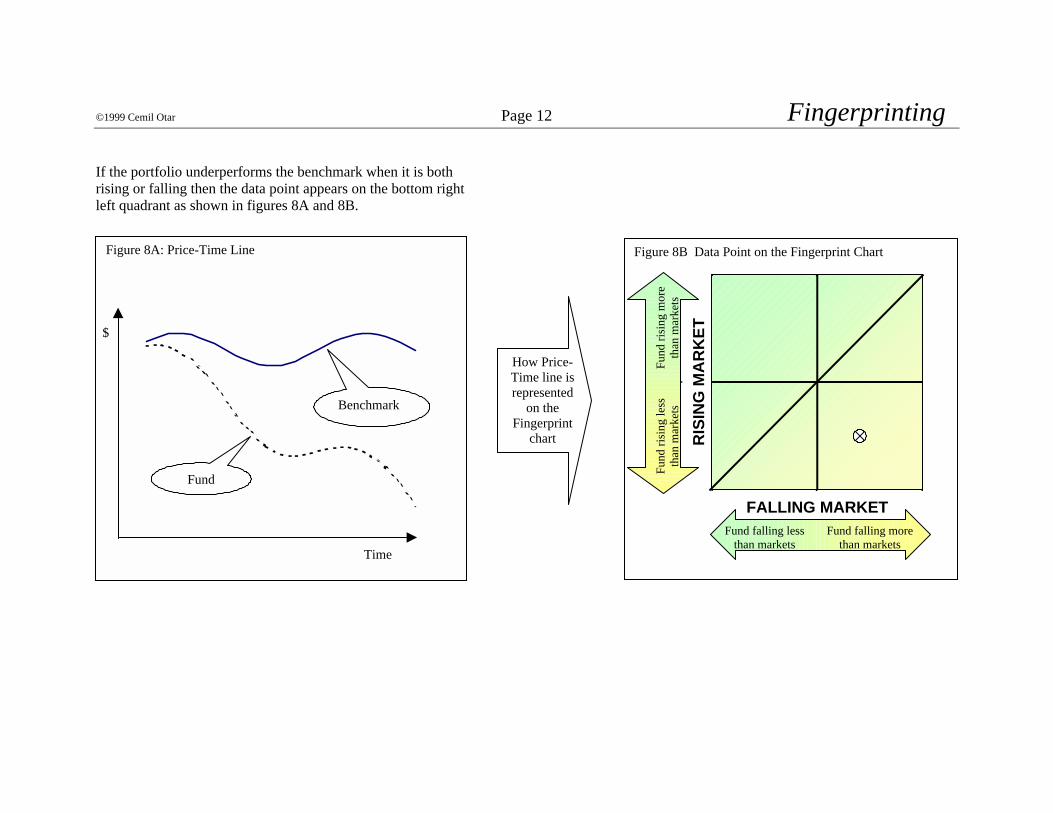
If the portfolio underperforms the benchmark when it is both rising or falling then the data point appears on the bottom right left quadrant as shown in figures 8A and 8B.
Figure 8A: Price-Time Line
$
Time
Benchmark
Fund
How Price-Time line is represented
on the Fingerprint
chart
Figure 8B Data Point on the Fingerprint Chart
Fund
risi
ng m
ore
than
mar
kets
Fund
risi
ng le
ss
than
mar
kets
RIS
ING
MA
RK
ET
FALLING MARKET
Fund falling less than markets
Fund falling more than markets

©1999 Cemil Otar Page 13 Fingerprinting
How is a Fingerprint Generated?
A Fingerprint chart is generated simply by observing the difference in the growth of the portfolio and the benchmark over a time period. To filter out noise, a rolling average of this difference is used.
There is no reference to time dimension in a fingerprint chart. You can keep using the same chart for several years.
Depending for what purpose the fingerprint chart is generated, the input data can be weekly or monthly.
Monthly fingerprinting is helpful in:
• evaluating fund efficiency, • measuring portfolio managers effectiveness and talent, • detecting investment style, • detecting style slip, and • following a trend.
Weekly fingerprinting is helpful in:
• detecting trend changes in market sectors, • detecting trend changes in geographic sectors, and • selecting companies for an investment portfolio.
There are eight steps to complete a monthly fingerprint.
A worked example is shown in Figure 9. In this case, the time period is monthly.
Step 1:
Choose a fund that you want to fingerprint. Then, choose a benchmark, typically TSE300 or S&P500.
Step 2:
Fill out the month and year in Column A, and the monthly growth of the benchmark in column B.
Step 3:
If the benchmark growth (Column B) is a positive number (i.e. up market), write the growth of the fund in column C; otherwise leave Column C blank.
If the benchmark growth (Column B) is a negative number (i.e. down market), write the growth of the fund in column D; otherwise leave Column D blank.
Step 4:
Column E is the difference between the fund growth and the benchmark growth in up markets. If Column C is not blank, then Column E equals Column C minus Column B; otherwise leave Column E blank.
©1999 Cemil Otar Page 14 Fingerprinting
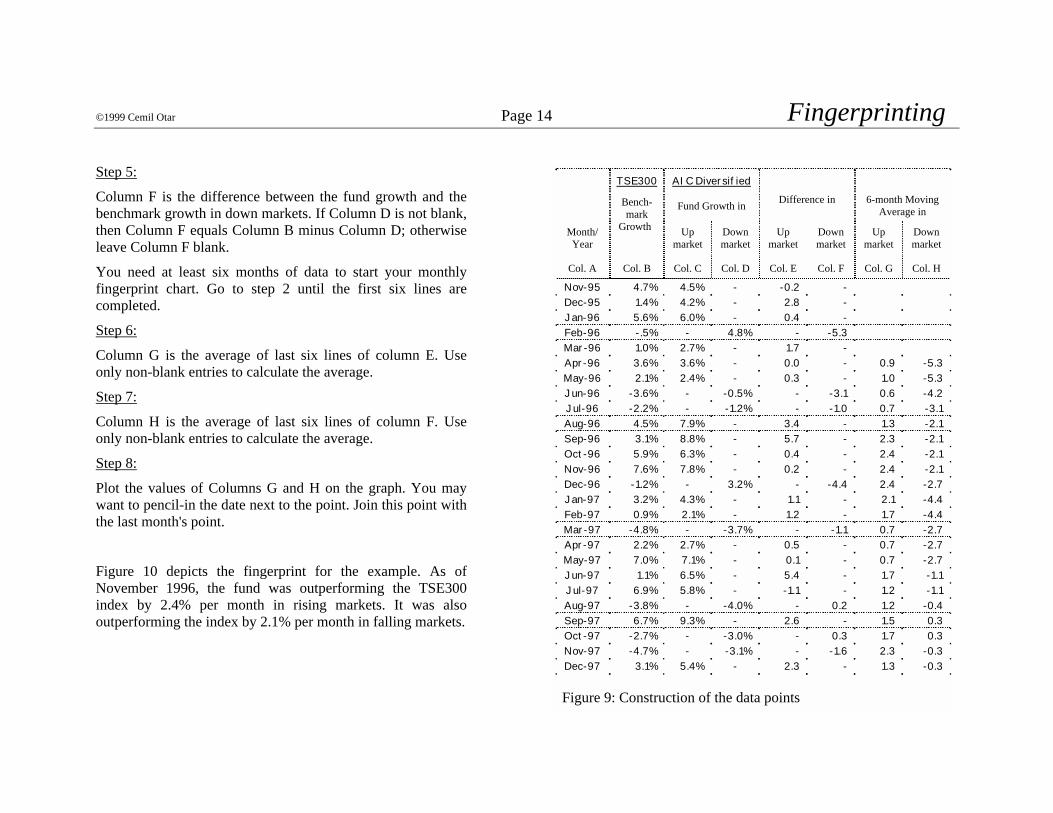
Step 5:
Column F is the difference between the fund growth and the benchmark growth in down markets. If Column D is not blank, then Column F equals Column B minus Column D; otherwise leave Column F blank.
You need at least six months of data to start your monthly fingerprint chart. Go to step 2 until the first six lines are completed.
Step 6:
Column G is the average of last six lines of column E. Use only non-blank entries to calculate the average.
Step 7:
Column H is the average of last six lines of column F. Use only non-blank entries to calculate the average.
Step 8:
Plot the values of Columns G and H on the graph. You may want to pencil-in the date next to the point. Join this point with the last month's point.
Figure 10 depicts the fingerprint for the example. As of November 1996, the fund was outperforming the TSE300 index by 2.4% per month in rising markets. It was also outperforming the index by 2.1% per month in falling markets.
AIC Diversified
Fund Growth in
Difference in
6-month Moving Average in
Month/ Year
TSE300
Bench-mark
Growth Up market
Down market
Up market
Down market
Up market
Down market
Col. A Col. B Col. C Col. D Col. E Col. F Col. G Col. H
Nov-95 4.7% 4.5% - -0.2 - Dec-95 1.4% 4.2% - 2.8 - Jan-96 5.6% 6.0% - 0.4 - Feb-96 -.5% - 4.8% - -5.3 Mar-96 1.0% 2.7% - 1.7 - Apr-96 3.6% 3.6% - 0.0 - 0.9 -5.3 May-96 2.1% 2.4% - 0.3 - 1.0 -5.3 Jun-96 -3.6% - -0.5% - -3.1 0.6 -4.2 Jul-96 -2.2% - -1.2% - -1.0 0.7 -3.1 Aug-96 4.5% 7.9% - 3.4 - 1.3 -2.1 Sep-96 3.1% 8.8% - 5.7 - 2.3 -2.1 Oct-96 5.9% 6.3% - 0.4 - 2.4 -2.1 Nov-96 7.6% 7.8% - 0.2 - 2.4 -2.1 Dec-96 -1.2% - 3.2% - -4.4 2.4 -2.7 Jan-97 3.2% 4.3% - 1.1 - 2.1 -4.4 Feb-97 0.9% 2.1% - 1.2 - 1.7 -4.4 Mar-97 -4.8% - -3.7% - -1.1 0.7 -2.7 Apr-97 2.2% 2.7% - 0.5 - 0.7 -2.7 May-97 7.0% 7.1% - 0.1 - 0.7 -2.7 Jun-97 1.1% 6.5% - 5.4 - 1.7 -1.1 Jul-97 6.9% 5.8% - -1.1 - 1.2 -1.1 Aug-97 -3.8% - -4.0% - 0.2 1.2 -0.4 Sep-97 6.7% 9.3% - 2.6 - 1.5 0.3 Oct-97 -2.7% - -3.0% - 0.3 1.7 0.3 Nov-97 -4.7% - -3.1% - -1.6 2.3 -0.3 Dec-97 3.1% 5.4% - 2.3 - 1.3 -0.3 Figure 9: Construction of the data points

©1999 Cemil Otar Page 15 Fingerprinting
Figure 10: Plotting the data points
-6.0%
-3.0%
0.0%
3.0%
6.0%
-6.0% -3.0% 0.0% 3.0% 6.0%
April 1996
October 1997
October & November 1996
©1999 Cemil Otar Page 16 Fingerprinting
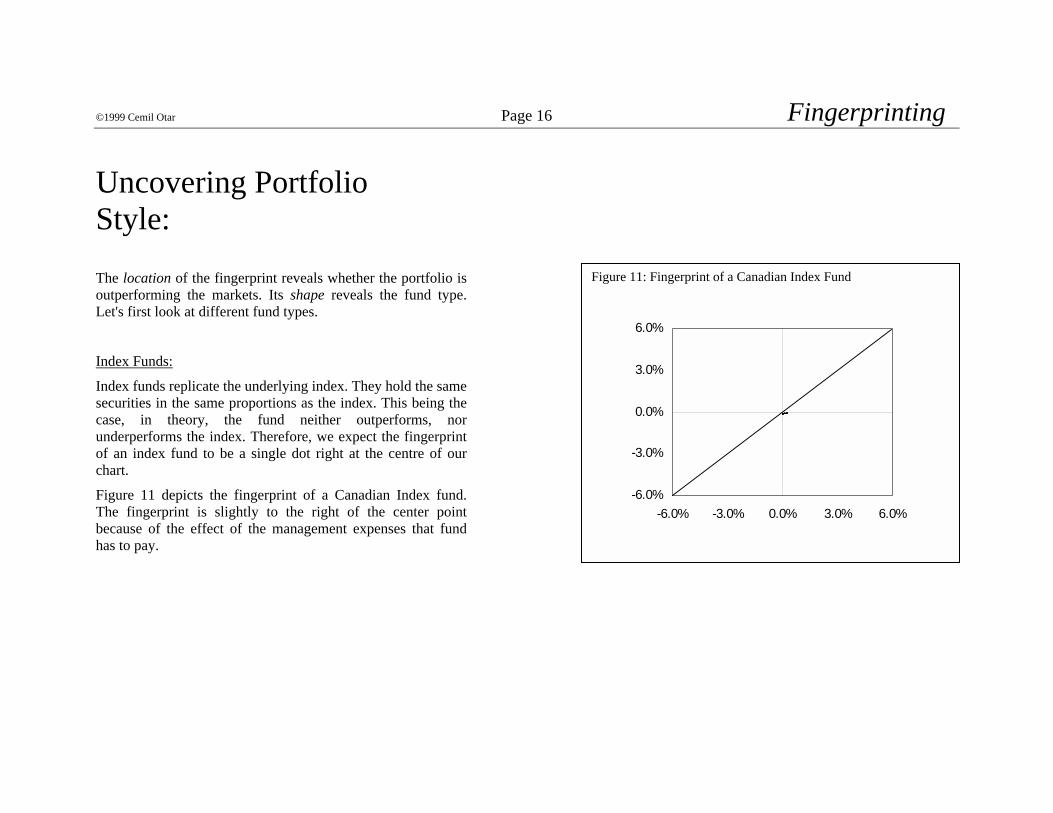
Uncovering Portfolio Style:
The location of the fingerprint reveals whether the portfolio is outperforming the markets. Its shape reveals the fund type. Let's first look at different fund types.
Index Funds:
Index funds replicate the underlying index. They hold the same securities in the same proportions as the index. This being the case, in theory, the fund neither outperforms, nor underperforms the index. Therefore, we expect the fingerprint of an index fund to be a single dot right at the centre of our chart.
Figure 11 depicts the fingerprint of a Canadian Index fund. The fingerprint is slightly to the right of the center point because of the effect of the management expenses that fund has to pay.
Figure 11: Fingerprint of a Canadian Index Fund
-6.0%
-3.0%
0.0%
3.0%
6.0%
-6.0% -3.0% 0.0% 3.0% 6.0%

©1999 Cemil Otar Page 17 Fingerprinting
Closet-Index Funds:
Some fund managers find safety in holding companies in their portfolio that mimic the index.
The managers of these funds, under the guise of actively managing their fund, simulate the benchmark index, while collecting management fees that are more generous than for an index fund.
This strategy protects the manager as well. When the fund follows the markets down, blame the markets. When the fund goes up with the markets, the manager looks good.
The fingerprint of a closet-index fund is not too dissimilar to the fingerprint of an index fund.
Figure 12 depicts the fingerprint of a Canadian equity fund. The stated fund objective is: "the fund invests in Canadian common stocks displaying above average growth potential". Its fingerprint looks more like an index fund.
Figure 12: Fingerprint of a Canadian equity fund
-6.0%
-3.0%
0.0%
3.0%
6.0%
-6.0% -3.0% 0.0% 3.0% 6.0%

©1999 Cemil Otar Page 18 Fingerprinting
Sector Rotators:
This style is also called "top-down". A "top-down" manager overweighs stocks in sectors, which he/she thinks will outperform the market. The rest of the fund's holdings is similar to the underlying index.
One can expect the fingerprint of a successful2 "top-down" fund to be a hybrid of the fingerprint of an index fund and the fingerprint of the overweighed sector.
Figure 13 depicts the fingerprint of the a sector rotator fund. The fingerprint indicates this fund outperformed the TSE300 during most of the study period. The fingerprint covers a larger area than an index fund, indicating swings in the overweighing of different sectors at different times.
2 During the last few years in the Canadian arena, the number of successful sector rotation funds diminished greatly. Later on we will look at ways of using fingerprinting to detect sector trends, so that you can do your own sector rotation.
Figure 13: Fingerprint of a sector rotator fund
-6.0%
-3.0%
0.0%
3.0%
6.0%
-6.0% -3.0% 0.0% 3.0% 6.0%

©1999 Cemil Otar Page 19 Fingerprinting
Growth Funds:
Growth portfolios seek companies that have a high growth of earnings, cash-flow etc. A well-managed growth fund generally resides in the top left quadrant with occasional visits to other quadrants. Their fingerprints usually have bigger swings than any other style3.
Figure 14 depicts the fingerprint of a Canadian growth fund.
3 A small cap portfolio can be more volatile than a growth portfolio. However, I do not consider the small caps a style, but a sector.
Figure 14: Fingerprint of a Canadian growth Fund
-6.0%
-3.0%
0.0%
3.0%
6.0%
-6.0% -3.0% 0.0% 3.0% 6.0%
©1999 Cemil Otar Page 20 Fingerprinting
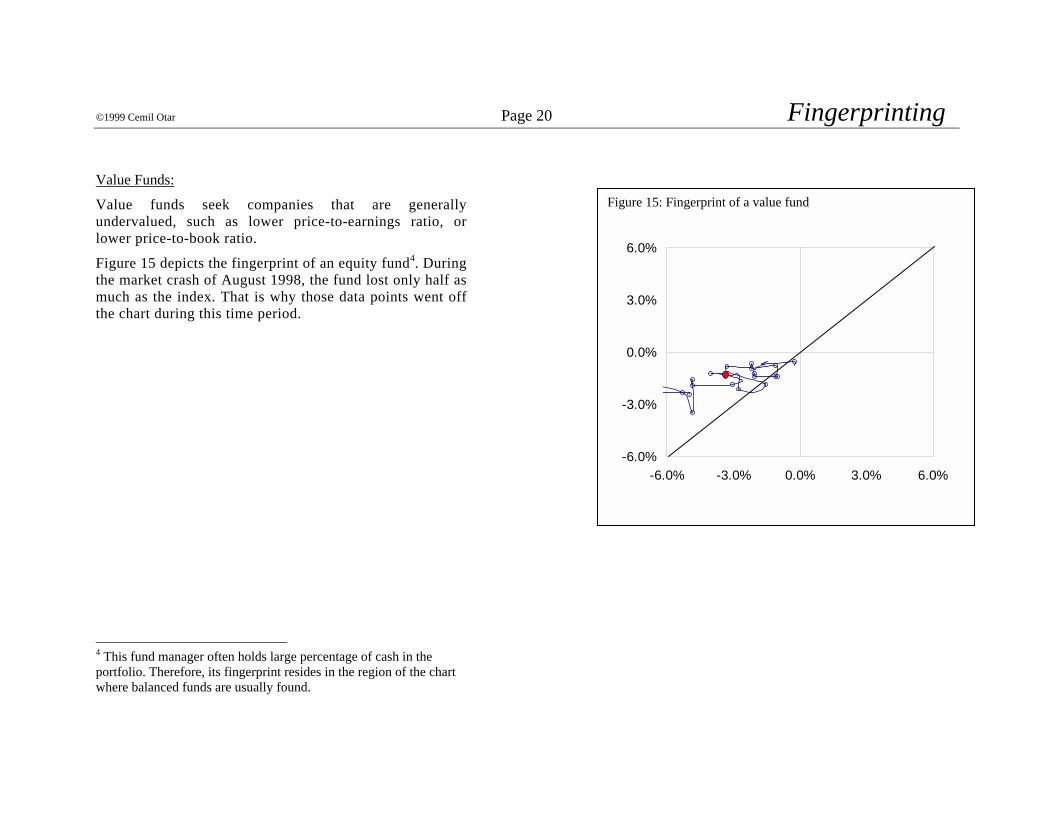
Value Funds:
Value funds seek companies that are generally undervalued, such as lower price-to-earnings ratio, or lower price-to-book ratio.
Figure 15 depicts the fingerprint of an equity fund4. During the market crash of August 1998, the fund lost only half as much as the index. That is why those data points went off the chart during this time period.
4 This fund manager often holds large percentage of cash in the portfolio. Therefore, its fingerprint resides in the region of the chart where balanced funds are usually found.
Figure 15: Fingerprint of a value fund
-6.0%
-3.0%
0.0%
3.0%
6.0%
-6.0% -3.0% 0.0% 3.0% 6.0%
©1999 Cemil Otar Page 21 Fingerprinting
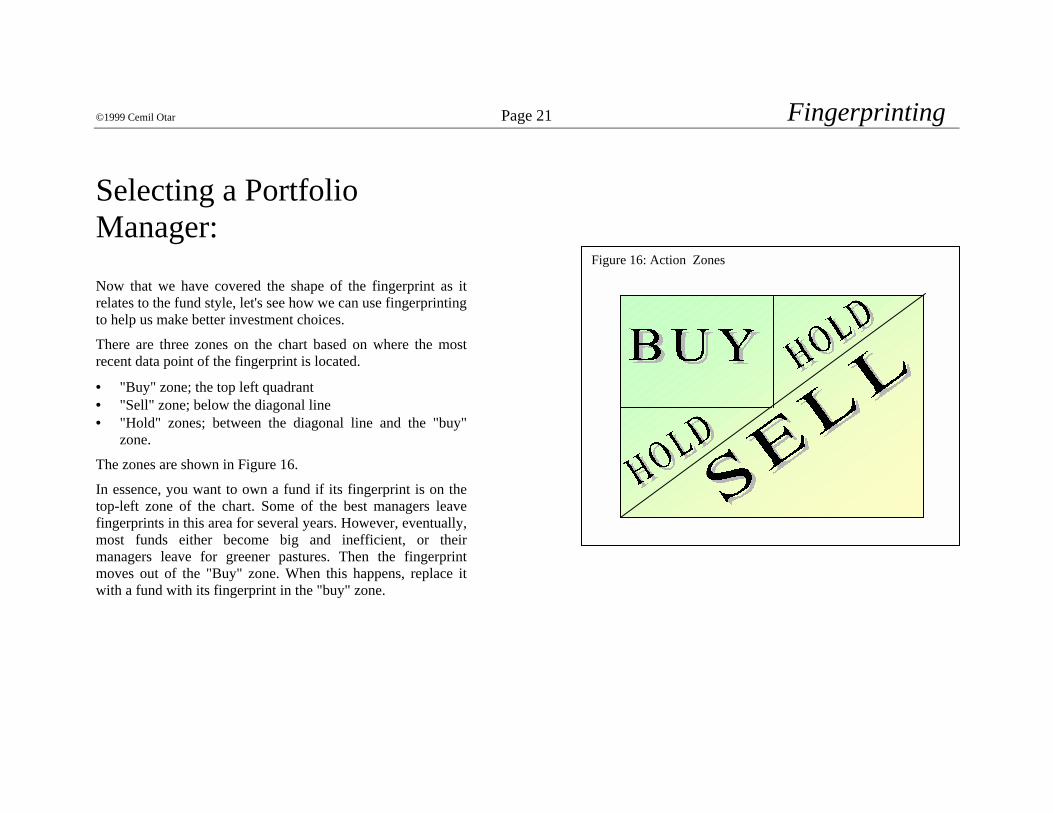
Selecting a Portfolio Manager:
Now that we have covered the shape of the fingerprint as it relates to the fund style, let's see how we can use fingerprinting to help us make better investment choices.
There are three zones on the chart based on where the most recent data point of the fingerprint is located.
• "Buy" zone; the top left quadrant • "Sell" zone; below the diagonal line • "Hold" zones; between the diagonal line and the "buy"
zone.
The zones are shown in Figure 16.
In essence, you want to own a fund if its fingerprint is on the top-left zone of the chart. Some of the best managers leave fingerprints in this area for several years. However, eventually, most funds either become big and inefficient, or their managers leave for greener pastures. Then the fingerprint moves out of the "Buy" zone. When this happens, replace it with a fund with its fingerprint in the "buy" zone.
Figure 16: Action Zones

©1999 Cemil Otar Page 22 Fingerprinting
Catching Sector Trends:
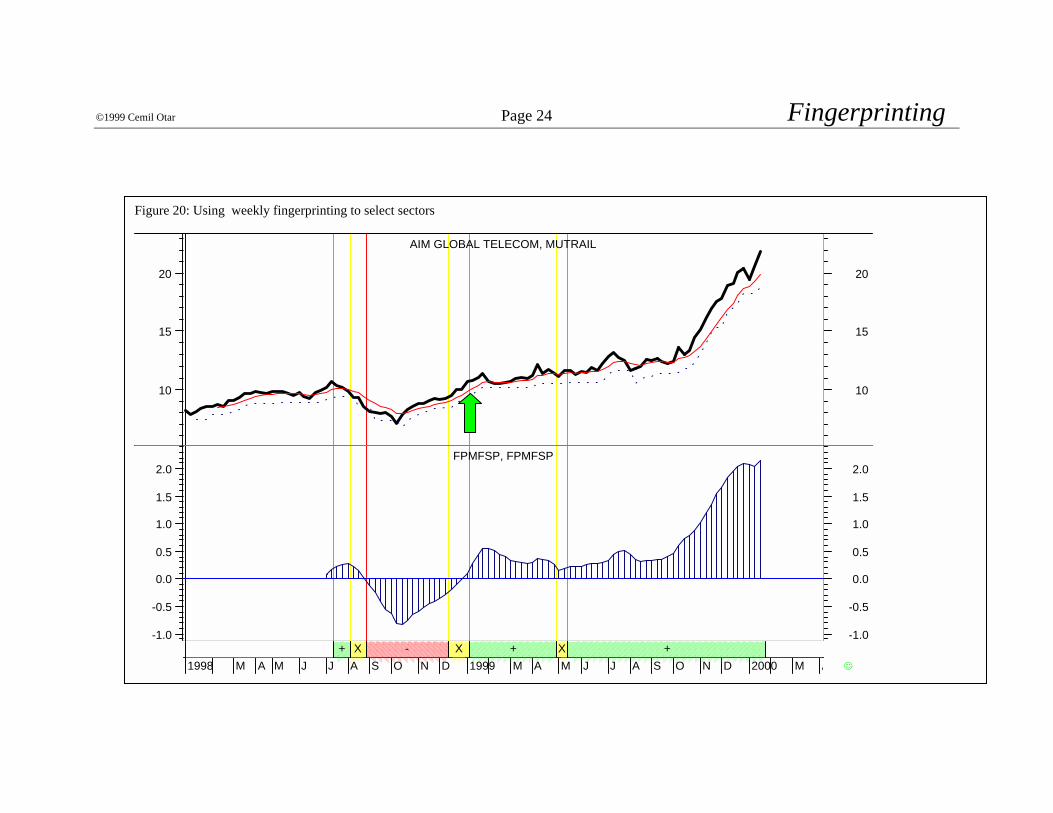
Fingerprinting can be used to catch a sector trend. It can also be used to recognize trends in country specific portfolios.
Weekly data should be used as the time period for trend recognition.
Figure 19 depicts results of using monthly fingerprinting for generating signals in an energy fund (monthly data was used in this case.).
Figure 20 depicts results of using weekly fingerprinting for technology sector fund.
Figure 21 depicts results of using fingerprinting for World Equity Benchmark Shares (WEBS)..

©1999 Cemil Otar Page 23 Fingerprinting
Figure 19: Using monthly fingerprinting to select trends in the Energy Sector, the fund is Green Line Energy fund. TSE300 was used as benchmark .
-10.0%-8.0%
-6.0%-4.0%-2.0%
0.0%2.0%4.0%6.0%
8.0%10.0%
-10.0% -5.0% 0.0% 5.0% 10.0%
April 1996
July 1997
BUY
SELL
©1999 Cemil Otar Page 24 Fingerprinting
Figure 20: Using weekly fingerprinting to select sectors
1998 M A M J J A S O N D 1999 M A M J J A S O N D 2000 M A V������������
+������������������������������������������������������������
+��������������������������������������������������������������������������������������������������������������������������������
+��������������������������������������������������������
-����������������
X����������������
X������������
X-1.0
-0.5
0.0
0.5
1.0
1.5
2.0
-1.0
-0.5
0.0
0.5
1.0
1.5
2.0FPMFSP, FPMFSP
10
15
20
10
15
20
AIM GLOBAL TELECOM, MUTRAIL

©1999 Cemil Otar Page 25 Fingerprinting Figure 21: Using fingerprinting to select World Equity Benchmark Shares (WEBS)
Here, fingerprinting is used in conjunction with World Equity Benchmark Shares, known as WEBS. In this context, the main philosophy of fingerprinting is that U.S.A. is the epicenter of equity investing. Any equity investment outside the U.S.A. is triggered only when a foreign market shows a potential for an upward trend substantially better than S&P500 index. Only then investments are made to such a market through use of WEBS. Historic Performance:
7/3/97 - 10/29/99 % GAIN
Country: Buy & Hold
Finger-print
Value Added
Australia -15.3% 1.3% 16.6% Austria -23.2% -3.5% 19.7% Belgium -14.5% 40.4% 54.9% Canada 0.9% 9.1% 8.2% France 49.0% 35.0% -14.0% Germany 27.5% 30.0% 2.5% Hong Kong -28.1% 44.9% 73.0% Italy 61.7% 71.6% 9.9% Japan 3.5% 14.5% 11.0% Malaysia -54.7% 34.6% 89.3% Mexico -11.4% 8.7% 20.1% Netherlands -2.8% 1.9% 4.7% Singapore -28.2% 38.6% 66.8% Spain 12.1% 39.6% 27.5% Sweden 21.0% 27.1% 6.1% Swiss -2.3% 26.2% 28.5% United Kingdom 15.7% 11.9% -3.8%
AVERAGE 0.7% 25.4% 24.8%
The equity line for the WEBS international equity portfolio is depicted below.
$90,000
$100,000
$110,000
$120,000
$130,000
$140,000
$150,000
$160,000
$170,000
$180,000
06/3
0/19
97
08/0
1/19
97
09/0
5/19
97
10/1
0/19
97
11/1
4/19
97
12/1
9/19
97
01/2
3/19
98
02/2
7/19
98
04/0
3/19
98
05/0
8/19
98
06/1
2/19
98
07/1
7/19
98
08/2
1/19
98
09/2
5/19
98
10/3
0/19
98
12/0
4/19
98
01/0
8/19
99
02/1
2/19
99
03/1
9/19
99
04/2
3/19
99
05/2
8/19
99
07/0
2/19
99
08/0
6/19
99
09/1
0/19
99
10/1
5/19
99
SP500 MSCIWI FP WEBS
FP WEBS Portfolio 63.0%MSCI World 36.3%S&P500 48.6%

©1999 Cemil Otar Page 26 Fingerprinting
Following the Footsteps:
A portfolio manager sometimes loads up stocks in a particular sector. More often than not, an investor is the last one to know that his/her fund manager has overweighed in one sector or another.
Fingerprinting can help to bring the actions of the manager into the open, sometimes within weeks. As you gain experience in recognizing fingerprint patterns, you may figure out what your portfolio manager is doing with your money.
For example in August 1997, a Canadian fund increased its precious metals holdings. Careful observation of its fingerprint shows a similar pattern to a precious metals fund. One might even speculate by prorating the size of the fingerprints, that the fund had about 15% to 20% in precious metals (fund moved 0.9% compared to 5% move in precious metals fund in the same time period). Figure 22 depicts a comparison of these two funds. The yellow parts of the fingerprints are the periods in question.
Following the footsteps does not always work. But, it is another potential use of fingerprinting, albeit speculative.
Figure 22: Pattern similarities may unravel portfolio overweighing.
Trimark Select Canadian
-6.0%
-3.0%
0.0%
3.0%
6.0%
-6.0% -3.0% 0.0% 3.0% 6.0%
G /L Prec ious M eta ls
-20 .0%
-10 .0%
0.0%
10.0%
20.0%
-20 .0% -10 .0% 0.0% 10.0% 20.0%
A precious metals fund
A Canadian fund

©1999 Cemil Otar Page 27 Fingerprinting
Estimating Cost Recovery:
Retail investors who purchase a mutual fund on a deferred sales charge basis (DSC), sometimes want to switch to a different fund.
Fingerprinting can help estimate the opportunity cost of not switching. Then, the investor can compare it to the redemption charges he/she has to pay.
The opportunity cost in rising markets can be estimated simply by taking the difference between the two fingerprints on the vertical scale.
The opportunity cost in falling markets can be estimated simply by taking the difference between the two fingerprints on the horizontal scale.
This estimation assumes that the funds continue to perform in the same manner as they have been performing in their recent past. Be aware that this is not always the case.
Figure 23: Estimating the time to recover the DSC cost when switching from Fund B to Fund A.
-6.0%
-3.0%
0.0%
3.0%
6.0%
-6.0% -3.0% 0.0% 3.0% 6.0%
The most recent data point of Fund A (green) is at 1.0% and -5.7% The most recent data point of Fund B (red) is at -3.0% and 3.0%
Assuming the funds will continue performing similar to their recent history, the opportunity cost in a rising market is 4.0% (1.0% - (-3.0%)), and in falling market is 8.7% (3.0% - (-5.7%))
With this assumption, if the DSC is 6%, then it will take about one and a half months to recover the redemption charges in a rising market. In a falling market, investor will lose 8.7% less than if he had continued to stay in fund B.
Fund A
Fund B
4.0%
8.7%

©1999 Cemil Otar Page 28 Fingerprinting
Jim C. Otar, CFP, B.A.Sc., M.Eng.: Jim completed his B. A. Sc. Degree in Mechanical Engineering at the University of Toronto in 1975. Subsequently, he received his M. Eng. degree at the same university. He completed successfully the Canadian Securities Course, the Canadian Institute of Financial Planning courses and has Level II Life Underwriter License and several other courses. He researches investments by applying his engineering background.
He started investing in 1974. He is the author of "Commission Free Investing - Handbook of Canadian DRIPs and SPPs".
He is also the author of “High Expectations and False Dreams – One Hundred Years of Stock Market History Applied to Retirement Planning”
He is a technical analyst and runs a Canadian mutual funds charting website for subscribers.
Phone: (905) 889-7170 e-mail: [email protected]