A universal chemical potential for sulfur vapours - … · A universal chemical potential for...
12
A universal chemical potential for sulfur vapours † Adam J. Jackson a , Davide Tiana a,‡ and Aron Walsh *a,b The unusual chemistry of sulfur is illustrated by the tendency for catenation. Sulfur forms a range of open and closed S n species in the gas phase, which has led to speculation on the composition of sulfur vapours as a function of temperature and pressure for over a century. Unlike elemental gases such as O 2 and N 2 , there is no widely accepted thermodynamic potential for sulfur. Here we combine a first-principles global structure search for the low energy clusters from S 2 to S 8 with a thermodynamic model for the mixed-allotrope system, including the Gibbs free energy for all gas-phase sulfur on an atomic basis. A strongly pressure-dependent transition from a mixture dominant in S 2 to S 8 is identified. A universal chemical potential function, μ S (T, P), is proposed with wide utility in modelling sulfurisation processes including the formation and annealing of metal chalcogenide semiconductors. 1 Introduction Sulfur is an abundant resource exploited by industry on a scale of tens of millions of tonnes per year. 1 While it may be found in its elemental form, the primary industrial source is hydrogen sulfide, a byproduct of the oil and gas industry. The vast majority of industrial sulfur is converted to sulfuric acid or sulfur dioxide before further use; this may explain the surprising shortage of data in the thermochemical literature regarding the vapour phase of elemental sulfur. Historically, the thermochemistry of sulfur has been studied ex- perimentally and has been understood to be associated with a variable composition for over a century; Lewis and Randall re- marked in 1914 that "no other element is known to occur in as many different forms as sulfur" while studying the free energy of a number of these forms. 2 (Carbon now has a higher number of known allotropes but the majority of these are not naturally- occuring.) However, contemporary reference data for sulfur still does not present a complete picture; the NIST-JANAF Thermo- chemical Tables (1998) give thermochemical data for two solid phases, one liquid phase, the ions S + and S - and eight gas al- lotropes S 1-8 . 3 Of these, only S 2 and S 8 are from spectroscopic data. The allotropes S 3-7 are assumed to exist and are assigned energies following an interpolation scheme suggested by Rau et al. (1966), which also makes use of experimental data for S 6 . 4 That paper rules out the significant presence of tautomers, find- ing little evidence of a tautomer contribution and assuming that they have relatively high energy. The authors generally reserve speculation on the actual structures of the components of their equilibrium model. In recent years considerable attention has turned to metal chalcogenides; II-VI semiconductors such as ZnS, CdS, PbS are a Centre for Sustainable Chemical Technologies and Dept. of Chemistry, University of Bath, Claverton Down, Bath BA2 7AY, UK b Global E 3 Institute and Department of Materials Science and Engineering, Yonsei Uni- versity, Seoul 120-749, Korea ‡ Current: EPFL Valais Wallis, EPFL LSMO, Rue de l’Industrie 17, Case postale 440, CH-1951 Sion, Switzerland † Electronic Supplementary Information (ESI) available: Tabulated free en- ergy and enthalpy data. See DOI: 10.1039/C5SC03088A. Additional data and code available in external repositories with DOIs: 10.5281/zenodo.28536; 10.6084/m9.figshare.151373; 10.6084/m9.figshare.1513833. See Data Access Statement for more information. widely studied in many contexts. 5 Copper indium gallium se- lenides (CIGS) and cadmium telluride (CdTe) are used as the basis for "second-generation" thin-film photovoltaic devices, and have seen a dramatic rise in production. Cu 2 ZnSn(S,Se) 4 (CZTS) and Cu 2 SnS 3 (CTS) devices have so far struggled to match these materials in terms of energy conversion efficiencies, but hold significant long-term promise due to their use of highly abun- dant elements; such availability is a prerequisite for terawatt- scale photovoltaics. 6 As such, thin-film processing in sulfur at- mospheres is of considerable interest, as the inherent safety of industrial processing may be improved by eliminating the use of toxic H 2 S. In addition to chalcogen annealing, which is used to increase grain size, substitute other elements or directly form chalcogenides from elements, high-quality single-crystal samples may be produced using chemical vapour transport of elemental chalogens. 7–9 Previous work on the thermodynamics of such pro- cessing has tended to assume that sulfur adopts one particular gaseous allotrope (either S 2 or S 8 ), but the validity of this as- sumption has not been explored in depth. 10–12 It is undermined however by the model derived by Rau et al., which predicts that no one component makes more than 50% of the gas mixture at temperatures between 800-1100K. 4 Mass spectrometry at a relatively mild 105 ◦ C has observed a se- ries of charged clusters with the form (S 8n ) + . 13 In the mid 1980s, a number of cyclic allotropes had been identified by crystallisa- tion and X-ray diffraction, but this only covered the range n =6 – 20. 14 An ab initio study was carried out for S 2 through to S 13 in an early application of the Car-Parrinello simulated annealing method. 15 Energies were calculated using density-functional the- ory with the local density approximation (LDA). While limited by the inherent difficulties in exploring the entire potential energy surface of the atomic positions, this thorough study generated 21 allotropes, finding a local maximum in the atomisation energy at n = 8. A later (1990) paper used coupled-cluster electronic struc- ture calculations to study the proposed tautomers of S 4 in depth, concluding that the planar structure with C 2v symmetry is lowest in energy, with a trans ( C 2h ) structure also visible in experimen- tal spectra; a more recent ab initio study reached similar con- clusions regarding stability while challenging the spectroscopic assignment of the phases. 16,17 The C 2v structure was ruled out in the simulated annealing study with LDA, although the authors 1
Transcript of A universal chemical potential for sulfur vapours - … · A universal chemical potential for...

A universal chemical potential for sulfur vapours†
Adam J. Jacksona, Davide Tianaa,‡ and Aron Walsh∗a,b
The unusual chemistry of sulfur is illustrated by the tendency for catenation. Sulfur forms a range of open and closed Sn species inthe gas phase, which has led to speculation on the composition of sulfur vapours as a function of temperature and pressure for over acentury. Unlike elemental gases such as O2 and N2, there is no widely accepted thermodynamic potential for sulfur. Here we combinea first-principles global structure search for the low energy clusters from S2 to S8 with a thermodynamic model for the mixed-allotropesystem, including the Gibbs free energy for all gas-phase sulfur on an atomic basis. A strongly pressure-dependent transition from amixture dominant in S2 to S8 is identified. A universal chemical potential function, µS(T,P), is proposed with wide utility in modellingsulfurisation processes including the formation and annealing of metal chalcogenide semiconductors.
1 IntroductionSulfur is an abundant resource exploited by industry on a scaleof tens of millions of tonnes per year.1 While it may be foundin its elemental form, the primary industrial source is hydrogensulfide, a byproduct of the oil and gas industry. The vast majorityof industrial sulfur is converted to sulfuric acid or sulfur dioxidebefore further use; this may explain the surprising shortage ofdata in the thermochemical literature regarding the vapour phaseof elemental sulfur.
Historically, the thermochemistry of sulfur has been studied ex-perimentally and has been understood to be associated with avariable composition for over a century; Lewis and Randall re-marked in 1914 that "no other element is known to occur in asmany different forms as sulfur" while studying the free energyof a number of these forms.2 (Carbon now has a higher numberof known allotropes but the majority of these are not naturally-occuring.) However, contemporary reference data for sulfur stilldoes not present a complete picture; the NIST-JANAF Thermo-chemical Tables (1998) give thermochemical data for two solidphases, one liquid phase, the ions S+ and S- and eight gas al-lotropes S1-8.3 Of these, only S2 and S8 are from spectroscopicdata. The allotropes S3-7 are assumed to exist and are assignedenergies following an interpolation scheme suggested by Rau etal. (1966), which also makes use of experimental data for S6.4
That paper rules out the significant presence of tautomers, find-ing little evidence of a tautomer contribution and assuming thatthey have relatively high energy. The authors generally reservespeculation on the actual structures of the components of theirequilibrium model.
In recent years considerable attention has turned to metalchalcogenides; II-VI semiconductors such as ZnS, CdS, PbS are
aCentre for Sustainable Chemical Technologies and Dept. of Chemistry, University ofBath, Claverton Down, Bath BA2 7AY, UKbGlobal E3 Institute and Department of Materials Science and Engineering, Yonsei Uni-versity, Seoul 120-749, Korea‡ Current: EPFL Valais Wallis, EPFL LSMO, Rue de l’Industrie 17, Case postale 440,CH-1951 Sion, Switzerland† Electronic Supplementary Information (ESI) available: Tabulated free en-ergy and enthalpy data. See DOI: 10.1039/C5SC03088A. Additional dataand code available in external repositories with DOIs: 10.5281/zenodo.28536;10.6084/m9.figshare.151373; 10.6084/m9.figshare.1513833. See Data AccessStatement for more information.
widely studied in many contexts.5 Copper indium gallium se-lenides (CIGS) and cadmium telluride (CdTe) are used as thebasis for "second-generation" thin-film photovoltaic devices, andhave seen a dramatic rise in production. Cu2ZnSn(S,Se)4 (CZTS)and Cu2SnS3 (CTS) devices have so far struggled to match thesematerials in terms of energy conversion efficiencies, but holdsignificant long-term promise due to their use of highly abun-dant elements; such availability is a prerequisite for terawatt-scale photovoltaics.6 As such, thin-film processing in sulfur at-mospheres is of considerable interest, as the inherent safety ofindustrial processing may be improved by eliminating the useof toxic H2S. In addition to chalcogen annealing, which is usedto increase grain size, substitute other elements or directly formchalcogenides from elements, high-quality single-crystal samplesmay be produced using chemical vapour transport of elementalchalogens.7–9 Previous work on the thermodynamics of such pro-cessing has tended to assume that sulfur adopts one particulargaseous allotrope (either S2 or S8), but the validity of this as-sumption has not been explored in depth.10–12 It is underminedhowever by the model derived by Rau et al., which predicts thatno one component makes more than 50% of the gas mixture attemperatures between 800-1100K.4
Mass spectrometry at a relatively mild 105◦C has observed a se-ries of charged clusters with the form (S8n)+.13 In the mid 1980s,a number of cyclic allotropes had been identified by crystallisa-tion and X-ray diffraction, but this only covered the range n = 6– 20.14 An ab initio study was carried out for S2 through to S13
in an early application of the Car-Parrinello simulated annealingmethod.15 Energies were calculated using density-functional the-ory with the local density approximation (LDA). While limited bythe inherent difficulties in exploring the entire potential energysurface of the atomic positions, this thorough study generated 21allotropes, finding a local maximum in the atomisation energy atn = 8. A later (1990) paper used coupled-cluster electronic struc-ture calculations to study the proposed tautomers of S4 in depth,concluding that the planar structure with C2v symmetry is lowestin energy, with a trans (C2h) structure also visible in experimen-tal spectra; a more recent ab initio study reached similar con-clusions regarding stability while challenging the spectroscopicassignment of the phases.16,17 The C2v structure was ruled outin the simulated annealing study with LDA, although the authors
1

noted the experimental evidence for its existence.15 A 2003 re-view by Steudel et al. 18 collects more recent data, including bothexperimental and theoretical studies of vapour-phase allotropes;this review notes the weakness of the widespread assumption thateach size is represented by a single species.18 The work comparesseveral sets of enthalpies relative to S8 that have been obtainedexperimentally; variability is high for the smaller allotropes whilethere is fairly good agreement for the larger allotropes. Stud-ies are generally carried out at a single temperature, such thatthe temperature and pressure dependence of the thermochem-istry must be derived from statistical mechanics and analysis ofvibrational information.
In this study, we develop a set of structures for S2-S8, computetheir Gibbs free energy from first-principles and with empiricalcorrections, and solve the temperature-dependent chemical po-tential to describe the gaseous mixture. The potential functionwill be important for quantitative investigations of defect forma-tion and phase stability in metal sulfide materials.
2 Methods2.1 Density functional theory
Energies and forces of arbitrary clusters of sulfur atoms werecomputed within Kohn-Sham density-functional theory (DFT).19
A range of exchange-correlation functionals were used in thiswork: PBE is a popular and elegant implentation of the Gen-eralised Gradient Approximation (GGA) and PBEsol restoresa periodic exchange contribution leading to improved perfor-mance for solids;20,21 B3LYP∗ is a widely-used "hybrid" func-tional which combines pre-existing gradient corrections with "ex-act" Hartree-Fock exchange; PBE0 is applies similar principles tothe parameter-free PBE functional.23,24 (While PBE is generallypreferred to PBEsol for molecular calculations, PBEsol was in-cluded in this study for its compatibility with other all-electronwork using this functional.)
Calculations for the evolutionary algorithm search used theVienna Ab Initio Simulations Package (VASP) with the PBEexchange-correlation functional and a plane-wave basis set witha 500 eV energy cutoff.25,26 As calculations in VASP employ aperiodic boundary condition, orthorhombic bounding boxes wereemployed with 10 of vacuum between each molecule and its pe-riodic images. Electronic structure iteration used only the Γ-pointof this large cell.
Further calculations used the Fritz Haber Institute ab ini-tio molecular simulations package (FHI-aims) to carry outall-electron DFT calculations with numerically-tabulated basissets.27,28 All calculations were open-shell with S2 adopting itslow-energy triplet spin configuration. The recommended "tight"basis set was employed for initial relaxation and study withPBEsol, which extends the minimal set of occupied orbitals with 6additional functions. This was extended further to the full "tier 2"set of 9 additional functions for calculations with the LDA, PBE0,
∗Note that the implementation of B3LYP in FHI-aims uses a parameterisation of thelocal density contribution based on the Random Phase Approximation in order tomatch values obtained with Gaussian, another quantum chemistry code. 22
and B3LYP functionals.
2.2 Global structure search
Global structure optimisation was carried out with the USPEXpackage, which was originally developed for crystalline systemsand has been adapted for use with clusters.29–31 At this stage,molecules with n > 8 were disregarded, as experimental resultsanticipate high- and low-temperature limits dominated by S2 andS8, respectively. Clusters were generated for S2-8, and refinedwith an evolutionary algorithm to minimise the ground-state en-ergy until a number of seemingly distinct clusters were identifiedby inspection. The atomic positions of these clusters were thenoptimised in FHI-aims calculations with PBEsol, using the BFGSalgorithm to minimise the atomic forces to less than 10-4 eV Å-1
and converge energy to within 10-6 eV. Point groups were as-signed to the structures using Materials Studio version 6.0, a pro-prietary package developed by Accelrys.
2.3 Vibrational frequencies
Vibrational frequencies were calculated within the harmonic ap-proximation by making finite displacements to each atomic po-sition to obtain the local potential wells, and diagonalising theresulting dynamical matrix to obtain the normal modes and theirfrequencies. This is implemented as a script and diagonalisationroutine provided with FHI-aims.
Improved vibrational frequencies may be obtained by apply-ing an empirically-derived scale factor to the vibrational eigen-values computed using DFT; collections of such scale factors havebeen published for large test-sets of molecules.32,33 The use ofthese factors is somewhat problematic when creating a system-atic, transferable set of data but offers an opportunity to cre-ate the most realistic thermochemical model possible. Giventhat the calculations in this work involve a more limited subsetof atomic interactions, we choose to fit a scaling factor to theexperimentally-reported frequencies of S8 and S2.
2.4 Thermochemistry
2.4.1 Thermochemistry of individual gas species.
Thermochemical properties were calculated within the ideal gas,rigid-rotor and harmonic vibration approximations. A set of text-book equations forms the chemical potential µ for a nonlinearmolecule from the ground-state electronic energy E0 given a setof vibrational energies ε, the rotational constant σ , moment ofinertia I
µ = E0 +EZPE +∫ T
0Cv + kBT −T S (1)
2

where
Cv =Cv,trans +Cv,vib +Cv,rot (2)
∫ T
0Cv ≈
32
kB +∑i
εi
exp(εi/kBT )−1+
32
kB (3)
S = Svib +Strans +Srot (4)
= ∑i
[εi/kBT
exp(εi/kBT )−1− ln(1− exp(−εi/kBT ))
](5)
+ kB
ln(
2πmkBTh2
) 32 kBT
Prefp+
52
+ kB
ln√
π ∏i Ii
σ
(8π2kBT
h2
) 32+
32
.(6)
These were applied as implemented in the Atomic Simulation En-vironment (ASE) Python package.34 (Note that the expressionsfor monatomic and linear molecules are slightly different.) Therotational constants σ were assigned from the point groups.
2.4.2 Reference energies.
A number of ab initio methods have been applied. In order tocompare the energies, a reference point is needed. Convention-ally the enthalpy of the ground state is zero; however, in this casethe ground state phase α-sulfur is relatively expensive to com-pute. We therefore use the experimental sublimation enthalpy∆Hsub =
18 HS8 −HSα
to obtain a reference from the calculated en-thalpy of S8:
∆HSx = HSx − xHSα(7)
∆HSx = HSx − x(
HS8
8+HSα
− HS8
8
)(8)
∆HSx = HSx − x(
HS8
8−∆Hsub
)(9)
The preferred experimental value for ∆Hsub is 100.416/8 = 12.552kJ mol−1, from experiments at 298K.3 Note that the physical sys-tem does not in fact sublime at high temperatures, but passesthrough a molten phase. Nonetheless, it is more practical (andperfectly valid) to retain α-S as the reference state over the wholetemperature range studied.
2.4.3 Equilibrium modelling.
The following derivation closely follows the approach and nota-tion of Ref. 35, which describes a generalised "non-stoichiometricmethod" for solving chemical equilibria. This approach is well-established and based on key work in Refs. 36–38.
We attempt to minimise the Gibbs free energy
minG(n) =N
∑i=1
niµi (10)
subject to the mass balance constraint
N
∑i=1
aini = b (11)
where N is the number of unique species i with stoichiometric co-efficient ai; n is the quantity of species i and b is the total numberof sulfur atoms. The classic approach for a constrained optimi-sation is the method of Lagrange multipliers. The Lagrangian isformed
L (n,λ ) =N
∑i=1
niµi +λ
(b−
N
∑i=1
aini
)(12)
and differentiated to form a set of equations definining the equi-librium state.
(∂L
∂ni
)n j 6=i,λ
= µi−aiλ = 0 (13)
and
(∂L
∂λ
)n= b−
N
∑i=1
aini = 0. (14)
The species chemical potential µi calculated as in Section 2.4.1 isa function of both temperature and the partial pressure pi = P ni
nt
where P is the total pressure and the total quantity nt =∑Ni ni. The
temperature dependence is complex and we are willing to solvethe equilibrium at each temperature of interest, so we form atemperature-dependent standard free energy at a reference pres-sure P◦, µ◦i (T ) = µi(T,P◦).
µi(T,P,n) = µ◦i (T )+RT ln
( pi
P◦
)(15)
= µ◦i (T )+RT ln
(ni
nt
PP◦
)(16)
= µ◦i (T )+RT ln
(PP◦
)+RT ln
(ni
nt
)(17)
From here we drop the parenthetical indication that µ◦i is a func-tion of temperature, and define the unit of pressure as the refer-ence pressure, such that P◦ = 1. Substituting (17) into (13), weobtain
µ◦i +RT ln
(ni
ntP)−aiλ = 0 (18)
ln(
ni
ntP)=
aiλ −µ◦iRT
(19)
3

and summing over i
P =N
∑i=1
exp(
aiλ −µ◦iRT
). (20)
The only unknown variable in this expression is λ ; rearrang-ing slightly we form a polynomial which is suitable for solvingby standard numerical methods. The method employed in thiswork is the Levenberg-Marquardt least-squares algorithm, as im-plemented in Scipy.39,40
N
∑i=1
exp(−µ◦i
RT
)[exp(
λ
RT
)]ai
−P = 0 (21)
To recover the composition n, we rearrange (19):
ni =nt
Pexp(
aiλ
RT
)exp(−µ◦i
RT
)(22)
and substitute into the second equilibrium condition (11) to ob-tain
b =nt
P
N
∑i=1
ai exp(
aiλ −µ◦iRT
)(23)
combining (22) and (23) we eliminate nt
ni
b=
exp(
aiλ−µ0RT
)N∑
i=1ai exp
(aiλ−µ0
RT
) (24)
and clean up the notation by denoting exp(
aiλ−µ0RT
)as Φi
ni
b=
ΦiN∑
i=1aiΦi
. (25)
Finally, to obtain the chemical potential of the mixture we notefrom (13) that µi
ai= λ for all i. Therefore
λ = µS, (26)
the normalised chemical potential of sulfur vapour on an atombasis. (A mathematical derivation is given in Appendix A.)
3 Results
3.1 Sulfur allotropes
A variety of candidate structures were generated in the evolu-tionary algorithm study with the PBE functional. The low-energycandidates following geometry optimisation are discussed in thissection.
3.1.1 S2.
Diatomic sulfur has the point group D∞h, in common with otherhomonuclear diatomics. The atoms were initially set 2 Å apart,and relaxed to a bond length of 1.91 Å. Studies with other func-tionals were relaxed either from this distance or from 2 Å. Theresulting bond lengths are given in Table 1.
Table 1 Calculated and experimental bond length r in S2. Experimentalvalue is NIST/JANAF-recommended distance. 3
DFT functional r / Å
PBE 1.911PBEsol 1.903LDA 1.895PBE0 1.884
Expt 1.889
3.1.2 S3.
The evolutionary algorithm process eliminated all but a C2v non-linear chain for S3. This corresponds to "thiozone", which hasa well-characterised structure by rotational spectroscopy (bondlength 1.917(1) Å and angle 117.36(6)◦; the values from optimi-sation with PBE0 in this study are 1.901 Å and 118.2).41 We havealso considered the simple triangular allotrope, which is ∼ 0.5 eVhigher in ground-state energy.
3.1.3 S4.
A range of branched and cyclic structures were generated in theevolutionary algorithm. The structures included in the equilib-rium modelling are shown in Fig. 1. The lowest-energy struc-ture identified was the ‘eclipsed’ C2v chain; this is in agreementwith the high-level theoretical studies in Ref. 16,17. These stud-ies identified a ‘trans’ C2h structure as being likely to exist; thereis some spectroscopic evidence for the viability of this isomer aswell as a branched chain, but we were not able to reproduce sta-ble structures corresponding to these allotropes through geom-etry optimisation.42,43 Various cyclic and tetrahedral candidatestructures yielded a relatively flat puckered ring with D2d symme-try.
3.1.4 S5.
Although a wide range of branched and chain structures weregenerated, the main candidate is the 5-membered ring with Cs
symmetry.
3.1.5 S6.
In addition to a cyclic C2v allotrope, relatively low-energybranched and chain variations were identified. Of considerableinterest is also a structure which may be viewed as a stack of twoS3 cycles, or alternatively as a cluster of S2 diatoms. This appearsto be the D3h "prism" structure identified by by Wong et al. 44 ; thecharacteristic S-S bond lengths from that study were 190.1 and276.2 pm, while the corresponding average distances from opti-misation with the same hybrid XC functional (B3LYP) in this workwere 189.0 and 275.7 pm. It is worth stressing that no explicitdispersion terms were included in any of the electronic structurecalculations.
4

Fig. 1 Predicted low-energy sulfur clusters with symmetry assignment
3.1.6 S7.
The evolutionary algorithm results rapidly provided the same Cs
cyclic structure as that obtained by energy minimisation from aregular polygon. A branched structure, generated early in theprogress of the algorithm, was also selected as an interesting al-ternative to include. This was about 1 eV lower in energy than theother candidates at that stage. Geometry optimisation by force re-laxation yielded a compact structure, also with Cs (mirror-plane)symmetry.
3.1.7 S8.
No evolutionary algorithm study was applied for S8, as its ringstructure is quite well-known. The initial geometry was extractedfrom the crystal structure for the condensed α-S phase used in aprevious study,45 and relaxed to form an isolated D4d ring.
3.1.8 Ground-state energies.
An inspection of the ground-state energies from DFT reveals atrend of smoothly decreasing energy per atom with cluster sizefor the minimum-energy configuration at each size (Fig. 2). Thevariation within the clusters included at each size is of the order10 kJ mol−1 atom−1, which is comparable to the energy differ-ence between neigbouring cluster sizes.
3.2 Vibrational properties
Vibrational frequencies were calculated for all of the allotropeslisted in section 3.1; frequencies for S2 and S8 are listed in Table 2.
Table 2 Calculated and experimental vibrational frequencies for S2 andS8. 3 All frequencies in cm-1.
LDA PBEsol PBE0 PBE0 B3LYP Expt(scaled)
S2 716 713 751 721 714 724
S8 73 73 74 71 74 5673 73 75 72 74 56
136 136 150 144 145 152136 136 150 144 145 152188 187 197 189 191 191188 187 197 189 191 191217 215 223 214 214 218228 228 248 238 242 243248 247 256 246 249 248248 247 256 246 249 248391 382 434 417 381 411418 411 454 436 407 437418 411 454 436 407 437473 467 492 472 455 471473 467 492 472 455 471479 474 493 473 461 475479 474 493 473 461 475486 482 497 477 470 475
3.2.1 Empirical corrections.
Empirical scale factors were determined by fitting the frequenciesto the experimental spectrum for S8. Note that frequencies arelinearly proportional to their corresponding zero-point energiesEZPE = 1
2 hν and hence this may also be seen as fitting to zero-point energy on a per-mode basis. The factors were calculatedfor each functional (Table 3); scaling the frequencies from PBE0by 96% was found to give the best overall fit, and is employed
5

2 3 4 5 6 7 8N / S atoms
0
10
20
30
40
50
60
70
80
E0 N−
E0,
S8
8/k
Jm
ol−
1
S2 (D∞h)S3 (D3h)S3 (C2v)S4 (D2d)S4 (C2v)S5 (Cs)
S6 (D3h)S6 (C1, branched)S6 (C2v)S6 (C1, chain)S7 (Cs)S7 (Cs, branched)
S8 (D4d)
LDAPBEsolB3LYPPBE0S2 [ref.]
Fig. 2 Ground-state energies from DFT of clusters included in study.Energies are relative to the energy for S8 with each functional, andnormalised to the number of atoms. A point is also included fromreference data 3; this is derived from the enthalpies of formation at zerotemperature, based on spectroscopic observations and equilibriumstudies. While the energies from different exchange-correlationfunctionals diverge across the series, the S2 energy from PBE0calculations agrees closely with this reference data.
here as the reference "empirically-corrected" method. Using thisscale factor also gives good agreement (< 4 cm-1 error) with thestretching frequency of S2, which was not used in the fit. (Ta-ble 2) Least-squares fitting was carried out with the Levenberg-Marquardt algorithm as implemented in Scipy.39,40
3.3 Equilibrium model
Equilibrium compositions and free energies were computed as afunction of temperature and pressure for all the data sets com-puted (Fig. 4). There is significant disagreement between thepredictions of the local exchange-correlation functionals LDA andPBEsol and the predicted composition from the hybrid functionalPBE0, both before and after frequency scaling. While the "lower-level" calculations predict a diverse mixture of phases, hybrid DFTstrongly supports the dominance of S8 and S2, at low and hightemperatures respectively. In all cases, this simplicity is strongestat low total pressure. The other phases which are present in anysignificant quantity are the cyclic allotropes where N = 4-7, in therange 600-1000 K.
LDAPBEsol
B3LYP
PBE0
PBE0 (scaled)
Expt0
100
200
300
400
500
Freq
uenc
y/c
m−
1
Fig. 3 Vibrational frequencies of S8 calculated with various DFTfunctionals, compared with recommended experimental values. 3
Table 3 Optimal scale factors for exchange-correlation functionals,fitting to ground-state frequencies of S8
3. Standard deviations s for theleast-squares fit are given over the set of frequencies in units offrequency and their corresponding zero-point energies per sulfur atom.
Functional scale factor s / cm-1 s / eV (ZPE)
LDA 1.0085 11.57 0.00072PBEsol 1.0201 12.39 0.00077PBE0 0.9596 6.41 0.00040B3LYP 1.0332 11.05 0.00068
The corresponding free energies are also plotted in Figure 5;we note that agreement between the methods is much strongerat low temperatures where the mixture is dominated by largermolecules. This may be an artefact of aligning the free energies ofthe S8 atoms; divergence in the energies of the smaller moleculesleads to the disagreement at high temperatures. The other trendof note is the presence of a sharp bend in the µ −T curve, par-ticularly at low pressure, corresponding to the presence of S2
molecules. The point of onset depends on the data source, butthe curve for PBE0 with empirical corrections closely tracks theminimum of the two curves from reference data. This representsa challenge to the formation of a simple parameterised modelfunction, as it suggests the presence of a spike in the secondderivative. Popular parameterisations of thermochemical prop-erties, such as those in the NIST "gold book", employ multipletemperature regions. This is usually viewed as a limitation, as itintroduces non-physical discontinuities; with care, they could bealigned to an apparently physical discontinuity in the function.Taking the PBE0 results with empirical corrections as our pre-ferred model, the free energy of the mixture is plotted with thechemical potentials of its component species on an atomic basis(Fig. 6).
The depression in free energy due to mixing of allotropes andpresence of minor components can be quantified by subtractingthe chemical potential of the mixture from the minimum of the
6

0
1
LDA
101 Pa 105 Pa 107 Pa
0
1
PB
Eso
l
400 800 1200Temperature / K
0
1
PB
E0
(sca
led)
400 800 1200Temperature / K
400 800 1200Temperature / K
S2 (D∞h)S3 (D3h)S3 (C2v)S4 (D2d)
S4 (C2v)S5 (Cs)S6 (D3h)
S6 (C1, branched)S6 (C2v)S6 (C1, chain)
S7 (Cs)S7 (Cs, branched)S8 (D4d)
Fig. 4 Compositions of modelled Sx mixtures over range of equilibrium temperatures and pressures. Results are presented for density functionaltheory with one local (LDA), one semi-local (PBEsol) and one non-local exchange-correlation functional with empirical corrections. Composition isgiven in units of atom fraction. It is expected that the most accurate results are obtained using PBE0 with scaled frequencies.
400 800 1200Temperature / K
−200
−150
−100
−50
0
50
100
µS
/kJ
mol−
1
P = 0.0001 bar
400 800 1200Temperature / K
P = 1.0 bar
400 800 1200Temperature / K
P = 100.0 bar
LDAPBEsol
PBE0 (scaled) S2 (lit.) S8 (lit.)
Fig. 5 Chemical potential of S vapours per mole of atoms, given at several pressures according to range of calculation methods. Data for S2 and S8are also provided from the thermochemical literature. 3 At low pressures, the free energy diverges by more than 50 kJ mol−1 S atoms between the S2and S8 allotropes at high temperatures, while at high pressures there is less variation. Results from hybrid DFT calculations with scaled frequenciesclosely track the minimal value from the literature, while the local and semi-local exchange correlation functionals diverge from this data due toover-estimation of the formation energy of S2.
7

400 800 1200Temperature / K
−200
−150
−100
−50
0
50
µ/k
Jm
ol−
1
101 Pa
400 800 1200Temperature / K
105 Pa
400 800 1200Temperature / K
107 Pa
S2 (D∞h)S3 (D3h)S3 (C2v)S4 (D2d)
S4 (C2v)S5 (Cs)S6 (D3h)S6 (C1, branched)
S6 (C2v)S6 (C1, chain)S7 (Cs)
S7 (Cs, branched)S8 (D4d)
Mixture
Fig. 6 Chemical potential of S vapours over range of T, P, compared with individual allotropes. The equilibrium mixture is lower in energy than anysingle allotrope, but in most T/P regimes lies close to the chemical potential of S2 or S8. Data from vibrational calculations with PBE0 andempirically-corrected frequencies.
8

Table 4 Gibbs free energy of S vapours, tabulated from calculations with PBE0 and empirical corrections, with reference state (H=0) α-sulfur at298.15K. Energies in kJ mol-1, column headers in log10(pressure/Pa). Tables are provided with more values and greater decimal precision in thesupplementary information.
T/K log10(p/Pa)1.00 1.67 2.33 3.00 3.67 4.33 5.00 5.67 6.33 7.00
100 4.73 4.88 5.04 5.20 5.36 5.52 5.68 5.84 6.00 6.16150 2.29 2.53 2.77 3.01 3.25 3.49 3.72 3.96 4.20 4.44200 -0.39 -0.07 0.25 0.57 0.89 1.21 1.53 1.85 2.17 2.49250 -3.27 -2.87 -2.47 -2.08 -1.68 -1.28 -0.88 -0.48 -0.08 0.32300 -6.34 -5.86 -5.39 -4.91 -4.43 -3.95 -3.47 -2.99 -2.51 -2.03350 -9.58 -9.02 -8.46 -7.90 -7.34 -6.78 -6.23 -5.67 -5.11 -4.55400 -12.97 -12.33 -11.69 -11.05 -10.41 -9.77 -9.13 -8.49 -7.85 -7.21450 -16.50 -15.77 -15.05 -14.33 -13.61 -12.89 -12.17 -11.45 -10.73 -10.01500 -20.20 -19.37 -18.56 -17.75 -16.94 -16.14 -15.33 -14.53 -13.73 -12.93550 -24.24 -23.17 -22.22 -21.31 -20.40 -19.51 -18.62 -17.73 -16.85 -15.96600 -29.74 -27.46 -26.12 -25.03 -24.01 -23.01 -22.03 -21.05 -20.08 -19.11650 -37.54 -33.52 -30.62 -29.01 -27.78 -26.65 -25.56 -24.49 -23.42 -22.36700 -45.63 -41.17 -36.83 -33.61 -31.81 -30.45 -29.22 -28.04 -26.87 -25.72750 -53.78 -49.00 -44.23 -39.63 -36.36 -34.48 -33.03 -31.71 -30.43 -29.18800 -61.99 -56.89 -51.79 -46.72 -41.99 -38.90 -37.03 -35.51 -34.10 -32.74850 -70.27 -64.84 -59.43 -54.02 -48.67 -44.06 -41.31 -39.46 -37.88 -36.39900 -78.59 -72.85 -67.11 -61.38 -55.67 -50.16 -46.04 -43.61 -41.79 -40.15950 -86.97 -80.91 -74.85 -68.80 -62.75 -56.78 -51.43 -48.04 -45.84 -44.01
1000 -95.39 -89.01 -82.64 -76.26 -69.90 -63.57 -57.48 -52.84 -50.06 -47.981050 -103.86 -97.17 -90.47 -83.77 -77.09 -70.43 -63.88 -58.14 -54.50 -52.071100 -112.38 -105.36 -98.34 -91.33 -84.32 -77.34 -70.42 -63.91 -59.21 -56.291150 -120.94 -113.60 -106.26 -98.93 -91.60 -84.29 -77.03 -70.00 -64.26 -60.681200 -129.53 -121.88 -114.22 -106.57 -98.92 -91.29 -83.70 -76.25 -69.65 -65.251250 -138.17 -130.19 -122.22 -114.24 -106.28 -98.33 -90.41 -82.60 -75.33 -70.031300 -146.84 -138.54 -130.25 -121.96 -113.67 -105.40 -97.16 -89.01 -81.23 -75.041350 -155.55 -146.93 -138.32 -129.71 -121.10 -112.51 -103.95 -95.46 -87.25 -80.271400 -164.29 -155.36 -146.42 -137.49 -128.57 -119.66 -110.77 -101.95 -93.36 -85.721450 -173.06 -163.81 -154.56 -145.31 -136.07 -126.84 -117.63 -108.49 -99.53 -91.33
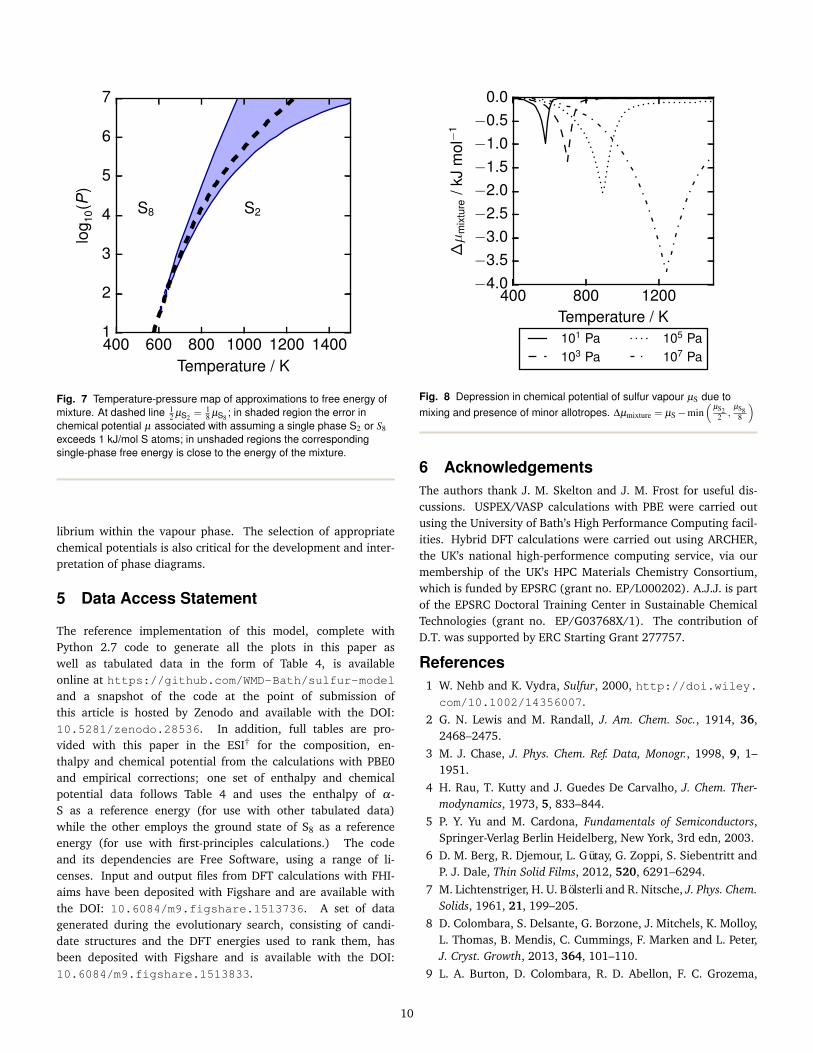
chemical potentials of the majority components S2 and S8. Theresulting plot (Fig. 8) shows that this has an impact ranging fromaround 1–4 kJ mol−1, depending on the pressure.
3.4 Parameterisation
For convenience, a parameterised fit has been generated for thechemical potential of S over the T, P range 400–1500K, 100–107
Pa, incorporating an error function "switch" between S2 and S8
dominated regions and a Gaussian correction for the free energydepression where there is substantial mixing of phases. In SI unitsfor a basis of 1 mol of S atoms, the form of the parameterisationis
µS(T,P) =12
[erfc
(T −Ttr
w
)µS8
8+
(erf(
T −Ttr
w
)+1)
µS2
2
]
−a(P)exp
(− (T −Ttr +b)2
2c2
)(27)
where µS8(T,P) = 7.620×10⁻¹ − 2.457×10⁻³T −4.012×10⁻⁶T 2 + 1.808×10⁻⁹T 3 − 3.810×10⁻¹³T 4, µS2(T,P) =
1.207 − 1.848×10⁻³T − 8.566×10⁻⁷T 2 + 4.001×10⁻¹⁰T 3 −8.654×10⁻¹⁴T 4. Ttr, the transition temperature obtainedby solving 1
2 µS2 = 18 µS8 is approximated by the polyno-
mial Ttr = 5.077×10² + 7.272×101 log10 P − 8.295(log10 P)2 +
1.828(log10 P)3. The height of the Gaussian correctiona(P) = 1.414×10³ − 2.041×10² log10 P + 6.663×101(log10 P)2,and the more arbitrarily assigned width and offset parametersb = 10, c = 80, w = 100.
It is noted that this parameterisation contains many fitting pa-rameters; however, given its physically-motivated form the result-ing function is smooth and well-behaved over the region studied,while the fits to µS2 , µS8 and Ttr have some value in their ownright. The fitting error is plotted in Fig. 9, and while somewhatirregular remains below 1 kJ mol−1.
4 Conclusions
The chemical potential of sulfur vapours has been studied by solv-ing the thermodynamic equilibrium of 14 gas-phase allotropes,including the dominant components S2 and S8. Thermochem-ical data was obtained from first-principles calculations and cor-rected with an empirical scaling factor for the vibrational frequen-cies. The transition between these dominating phases is highlypressure-dependent, and the free energy is further depressed atthe transition temperature by the presence of additional phases,especially at elevated pressures. Selection of an inappropriate gasphase can lead to errors of the order 50 kJ mol−1 atoms, whilethe minor phases contribute free energy of the order 1 kJ mol−1
atoms. The resulting chemical potential data is made availablethrough tabulated data, a parameterised model with error of theorder 0.5 kJ mol−1 atoms and through open-source code; the ref-erence energy is compatible with the NIST-Janaf thermochemicaltables for the solid α-sulfur phase.3 This phase is frequently usedas a reference state for thermodynamic studies of defects and sta-bility in metal chalcogenides; the application of this gas-phasepotential may allow such studies to examine a wide range of re-actions involving sulfur vapours, taking into account the equi-
9
400 600 800 1000 1200 1400Temperature / K
1
2
3
4
5
6
7lo
g 10(P
)
S8 S2
Fig. 7 Temperature-pressure map of approximations to free energy ofmixture. At dashed line 1
2 µS2 =18 µS8 ; in shaded region the error in
chemical potential µ associated with assuming a single phase S2 or S8exceeds 1 kJ/mol S atoms; in unshaded regions the correspondingsingle-phase free energy is close to the energy of the mixture.
librium within the vapour phase. The selection of appropriatechemical potentials is also critical for the development and inter-pretation of phase diagrams.
5 Data Access Statement
The reference implementation of this model, complete withPython 2.7 code to generate all the plots in this paper aswell as tabulated data in the form of Table 4, is availableonline at https://github.com/WMD-Bath/sulfur-modeland a snapshot of the code at the point of submission ofthis article is hosted by Zenodo and available with the DOI:10.5281/zenodo.28536. In addition, full tables are pro-vided with this paper in the ESI† for the composition, en-thalpy and chemical potential from the calculations with PBE0and empirical corrections; one set of enthalpy and chemicalpotential data follows Table 4 and uses the enthalpy of α-S as a reference energy (for use with other tabulated data)while the other employs the ground state of S8 as a referenceenergy (for use with first-principles calculations.) The codeand its dependencies are Free Software, using a range of li-censes. Input and output files from DFT calculations with FHI-aims have been deposited with Figshare and are available withthe DOI: 10.6084/m9.figshare.1513736. A set of datagenerated during the evolutionary search, consisting of candi-date structures and the DFT energies used to rank them, hasbeen deposited with Figshare and is available with the DOI:10.6084/m9.figshare.1513833.
400 800 1200Temperature / K
−4.0−3.5−3.0−2.5−2.0−1.5−1.0−0.5
0.0
∆µ
mix
ture
/kJ
mol−
1
101 Pa103 Pa
105 Pa107 Pa
Fig. 8 Depression in chemical potential of sulfur vapour µS due tomixing and presence of minor allotropes. ∆µmixture = µS−min
(µS2
2 ,µS8
8
)
6 AcknowledgementsThe authors thank J. M. Skelton and J. M. Frost for useful dis-cussions. USPEX/VASP calculations with PBE were carried outusing the University of Bath’s High Performance Computing facil-ities. Hybrid DFT calculations were carried out using ARCHER,the UK’s national high-performence computing service, via ourmembership of the UK’s HPC Materials Chemistry Consortium,which is funded by EPSRC (grant no. EP/L000202). A.J.J. is partof the EPSRC Doctoral Training Center in Sustainable ChemicalTechnologies (grant no. EP/G03768X/1). The contribution ofD.T. was supported by ERC Starting Grant 277757.
References1 W. Nehb and K. Vydra, Sulfur, 2000, http://doi.wiley.com/10.1002/14356007.
2 G. N. Lewis and M. Randall, J. Am. Chem. Soc., 1914, 36,2468–2475.
3 M. J. Chase, J. Phys. Chem. Ref. Data, Monogr., 1998, 9, 1–1951.
4 H. Rau, T. Kutty and J. Guedes De Carvalho, J. Chem. Ther-modynamics, 1973, 5, 833–844.
5 P. Y. Yu and M. Cardona, Fundamentals of Semiconductors,Springer-Verlag Berlin Heidelberg, New York, 3rd edn, 2003.
6 D. M. Berg, R. Djemour, L. Gütay, G. Zoppi, S. Siebentritt andP. J. Dale, Thin Solid Films, 2012, 520, 6291–6294.
7 M. Lichtenstriger, H. U. Bölsterli and R. Nitsche, J. Phys. Chem.Solids, 1961, 21, 199–205.
8 D. Colombara, S. Delsante, G. Borzone, J. Mitchels, K. Molloy,L. Thomas, B. Mendis, C. Cummings, F. Marken and L. Peter,J. Cryst. Growth, 2013, 364, 101–110.
9 L. A. Burton, D. Colombara, R. D. Abellon, F. C. Grozema,
10

400 600 800 1000 1200 1400Temperature / K
1
2
3
4
5
6
7lo
g 10(P
)
-0.8-0
.4
-0.4
0.0
0.0
0.4
0.4
0.8
0.8 1.2
Fig. 9 Error of parameterisation in kJ mol−1. Error is reduced to lessthan 1 kJ mol−1, but is highly non-uniform. Parameterisation isrecommended for convenient application over wide T–P ranges; the fullequilibrium solution is required to correctly capture fine detail.
L. M. Peter, T. J. Savenije, G. Dennler and A. Walsh, Chem.Mater., 2013, 25, 4908–4916.
10 A. J. Jackson and A. Walsh, J. Mater. Chem. A, 2014, 2, 7829.11 V. Kosyak, N. B. Mortazavi Amiri, a. V. Postnikov and M. a.
Scarpulla, J. Appl. Phys., 2013, 114, 124501.12 J. J. Scragg, T. Ericson, T. Kubart, M. Edoff and C. Platzer-
Björkman, Chem. Mater., 2011, 23, 4625–4633.13 T. P. Martin, J. Chem. Phys., 1984, 81, 4426.14 R. Steudel, Studies in Inorganic Chemistry, Elsevier, Amster-
dam, 1984, vol. 5, pp. 3–37.15 D. Hohl, R. O. Jones, R. Car and M. Parrinello, J. Chem. Phys.,
1988, 89, 6823.16 G. E. Quelch, H. F. Schaefer and C. J. Marsden, J. Am. Chem.
Soc., 1990, 112, 8719–8733.17 M. W. Wong and R. Steudel, Chem. Phys. Lett., 2003, 379,
162–169.18 R. Steudel, Y. Stuedel and M. W. Wong, Top. Curr. Chem.,
2003, 117–134.19 W. Kohn and L. Sham, Phys. Rev. A, 1965, 140, 1133–1138.20 J. Perdew, K. Burke and M. Ernzerhof, Phys. Rev. Lett., 1996,
77, 3865–3868.21 J. Perdew, A. Ruzsinszky, G. Csonka, O. Vydrov, G. Scuseria,
L. Constantin, X. Zhou and K. Burke, Phys. Rev. Lett., 2008,100, 136406.
22 R. H. Hertwig and W. Koch, Chem. Phys. Lett., 1997, 268,345–351.
23 A. Becke, J. Chem. Phys., 1993, 98, 5648–5652.24 C. Adamo and V. Barone, J. Chem. Phys., 1999, 110, 6158.25 G. Kresse and J. Furthmüller, Comput. Mater. Sci., 1996, 6,
15–50.
26 G. Kresse and J. Furthmüller, Phys. Rev. B, 1996, 54, 11169–11186.
27 V. Blum, R. Gehrke, F. Hanke, P. Havu, V. Havu, X. Ren,K. Reuter and M. Scheffler, Comput. Phys. Commun., 2009,180, 2175–2196.
28 V. Havu, V. Blum, P. Havu and M. Scheffler, J. Comput. Phys.,2009, 228, 8367–8379.
29 A. R. Oganov and C. W. Glass, J. Chem. Phys., 2006, 124,244704.
30 A. R. Oganov, A. O. Lyakhov and M. Valle, Acc. Chem. Res.,2011, 44, 227–237.
31 A. O. Lyakhov, A. R. Oganov, H. T. Stokes and Q. Zhu, Comput.Phys. Commun., 2013, 184, 1172–1182.
32 J. P. Merrick, D. Moran and L. Radom, J. Phys. Chem. A, 2007,111, 11683–11700.
33 I. M. Alecu, J. Zheng, Y. Zhao and D. G. Truhlar, J. Chem.Theory Comput., 2010, 6, 2872–2887.
34 S. R. Bahn and K. W. Jacobsen, Comput. Sci. Eng., 2002, 4,56–66.
35 W. R. Smith and R. W. Nissen, Chemical Reaction EquilibriumAnalysis: Theory and Algorithms, John Wiley & Sons, NewYork, 1982.
36 S. R. Brinkley, J. Chem. Phys., 1946, 14, 563.37 J. S. R. Brinkley, J. Chem. Phys., 1947, 15, 107–110.38 W. B. White, J. Chem. Phys., 1967, 46, 4171.39 D. W. Marquardt, J. Soc. Indust. Appl. Math., 1963, 11, 431–
441.40 SciPy: Open source scientific tools for Python, 2001, http:
//www.scipy.org/, [Online; accessed 2015-03-06].41 M. C. McCarthy, S. Thorwirth, C. a. Gottlieb and P. Thaddeus,
J. Am. Chem. Soc., 2004, 126, 4096–4097.42 M. S. Boumedien, J. Corset and E. Picquenard, J. Raman Spec-
trosc., 1999, 472, 463–472.43 P. Hassanzadeh and L. Andrews, J. Phys. Chem., 1992, 96,
6579–6585.44 M. W. Wong, Y. Steudel and R. Steudel, J. Chem. Phys, 2004,
121, 5899–5907.45 L. A. Burton and A. Walsh, J. Phys. Chem. C, 2012, 116,
24262–24267.
A Proof that G = λ
We define the molar Gibbs free energy of sulfur atoms in a molec-ular gas mixture as
GS(T,P) =
N∑
i=1niµi
b=
N
∑i=1
ni
bµi (28)
and substitute in (25)
GS(T,P) =N
∑i=1
[µiΦi
∑Nj=1 a jΦ j
]. (29)
11

(Notation the same as Sec. 2.4.3). From (13), µi = aiλ and hence
GS(T,P) =∑
Ni=1 aiλΦi(
∑Nj=1 a jΦ j
) = λ (30)
12