A Trial of Care for CKD: Can-Prevent - Research in Place Trial of Care for CKD: Can-Prevent Barrett...
35
A Trial of Care for CKD: Can-Prevent Barrett B, Garg A, Levin A, Soroka S, Soltys G, Molzahn A, Singer J, Goeree R, Rigatto C, Parfrey P
Transcript of A Trial of Care for CKD: Can-Prevent - Research in Place Trial of Care for CKD: Can-Prevent Barrett...

A Trial of Care for CKD:
Can-Prevent
Barrett B, Garg A, Levin A, Soroka S, Soltys G, Molzahn A, Singer J, Goeree R, Rigatto C, Parfrey P
The Canadian Collaborative Group for the Prevention of Renal and Vascular Endpoints Trial
(CANPREVENT) New Emerging Team is sponsored by:
CIHR-Institute of Nutrition, Metabolism and Diabetes
CIHR-Institute of Circulatory and Respiratory Health
Heart and Stroke Foundation of Canada
Canadian Diabetes Association
Kidney Foundation of Canada
Merck-Frosst Canada
Amgen Canada Inc.
Ortho-Biotech Canada

Background
CKD is common
Increases risk for ESRD and CVD
events
There are evidence based therapies
They are not optimally applies in
routine care
New models of care need to be tested
CAN-PREVENT
RCT of care for CKD as a
chronic illness
Nurse coordinated team v.
usual care
Protocols for evidence
based therapies
Aim to reduce kidney &
CV outcomes

Trial Design
Randomized
Multi-centre
Parallel, 2 group trial
Usual care v. “Intervention Clinic”
Blinded assessment of end-points

Inclusion Criteria
Age 40-75, CrCl 25-60
Stratum 1 : diabetic
Stratum 2 : proteinuria ≥ 1g/L
Stratum 3 : No DM or proteinuria

Exclusion Criteria
No consent
Likely to die < 6 months
Current malignancy, advanced CVD,
transplant
CKD currently treated by immunotherapy
ESRD likely in < 6 months
Current care for CKD or CVD by DM
program
Currently in another interventional trial
Not able to attend for follow-up

Recruitment
Used a lab based case finding strategy:
Electronic search for those with SCr in range
Contact with doctor via lab
Doctor refers patients to study
Mostly (93%) not already referred to
nephrology (to minimize contamination)
474 randomized and followed - mean 704
days

We Did Find & Follow Patients
Randomized N = 474
Intervention
N= 238
Control
N= 236
Withdrew N= 12
Lost to follow up N= 12
Withdrew N= 15
Lost to follow up N= 8
Intervention
Nurse co-ordinated
Protocol guided
Nephrologist supervised
Clinic based
Interventions target CV & kidney disease
These reflect current state of knowledge
Modifed as evidence emerged

Protocols Include (Tier 1)
BP and proteinuria control
RAAS blockade
Lipid therapy
Use of ASA
Beta-blockade post MI & in CHF

Protocols Include (Tier 2)
Anemia Management
Mineral and parathyroid management
Acidosis control
Diabetes control
Smoking cessation

Baseline Characteristics
Intervention % Control %
Diabetes 31.4 32.9
Hx MI 16.7 14.3
Hx CABG 10.7 8.2
HX PTCA 11.2 8.7
Hx CHF
5.6 3.9

Baseline Characteristics 2
Median [IQR]
Intervention Control
eGFR 42.5 [38-46] 42.3 [37-46]
24 hr urine
protein
0.11 [0.07-0.2] 0.12 [0.08-0.22]
BP 128/74 [116/66-140/80] 132/74 [120/68-
144/81]
Hba1c in
diabetics
7% [6.4-7.9] 7.1 [6.3-7.6]
LDL 2.6 [2.1-3.3] 2.7 [2.1-3.5]

Adjudicated Clinical Outcomes
Intervention
N (%)
Control
N (%)
Cardiovascular death 2 (0.8) 2 (0.8)
Other death 5 (2.1) 0 (0.0)
Myocardial infarct 5 (2.1) 4 (1.7)
ACS 1 (0.4) 2 (0.8)
Heart failure 5 (2.1) 8 (3.4)
Stroke 1 (0.4) 1 (0.4)
Amputation of leg 2 (0.8) 2 (0.8)
Dialysis 2 (0.8) 1 (0.4)
Doubled SCr 1 (0.4) 4 (1.7)

Months since baseline
Pro
ba
bility o
f su
rviv
al
Exp. InterventionStd. care
0 12 24 36
0.8
0.9
1
Time To First Clinical Event

Rate of Clinical Outcomes
48 endpoints
Two events each in 5 cases
Three events each in 2 cases
Annual incidence of events:
5.2% (CI 3.8-6.7%)

Impact on Kidney Function
0
5
10
15
20
25
30
35
40
45
50
Bas
elin
e
Mont
h 4
Mont
h 8
Mont
h 12
Mont
h 16
Mont
h 20
Intervention
Control

Blood Pressure Control
Good overall
Intervention v Control SBP
129 v 133 @ baseline
124 v 130 @ 12 mos, p<0.01
123 v 128 @ 24 mos, p=NS
95% CI for the difference -1.1 to
-8.5 mmHg for marginal mean in
GLM adjusting for baseline

Management of SBP > 140
Intervention Control
% SBP > 140 @
baseline
25.8 34.5
In which # BP
meds @ baseline
Av 2.4 Av 2.3
In which # BP
meds @ 12 mo
Av 2.9 Av 2.5
% BP >140 @ 12
mo
15.6 26.1

% on RAAS Blockers
Intervention Control
Baseline (DM) 88 91
Baseline (all) 70 66
12 months all 75 66*
24 months all 78 66*
* p<0.05
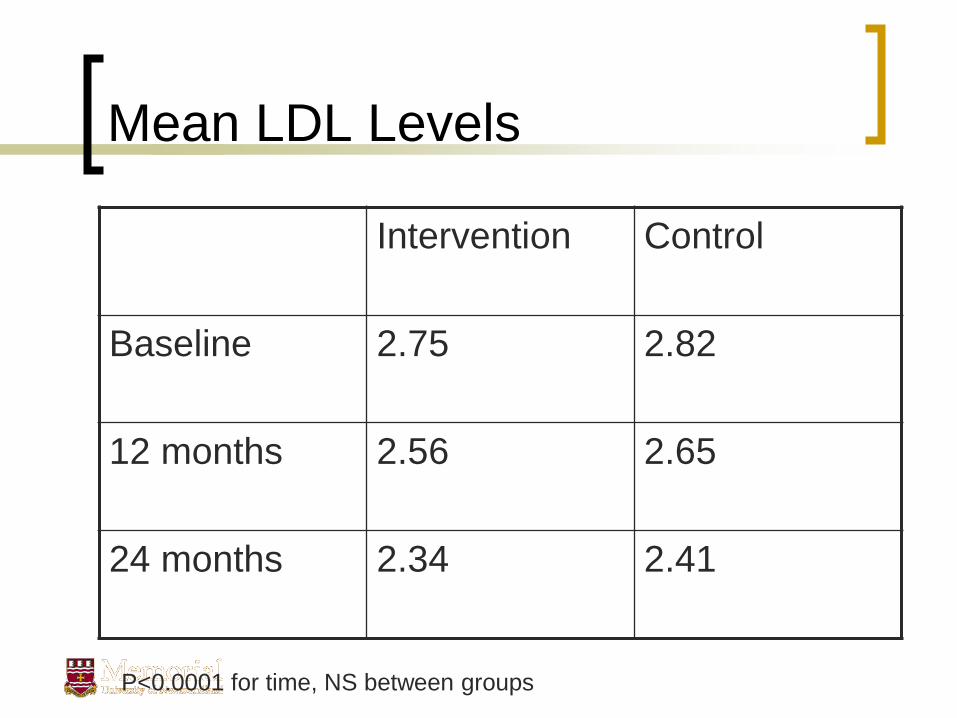
Mean LDL Levels
Intervention Control
Baseline 2.75 2.82
12 months 2.56 2.65
24 months 2.34 2.41
P<0.0001 for time, NS between groups

Impact on Lipid Management
% on statin
among
those with
baseline
LDL > 2.5
mmol/L
Intervention Control
Baseline 39 35
12 mos 65 42*
24 mos 84 51* P<0.001 between groups
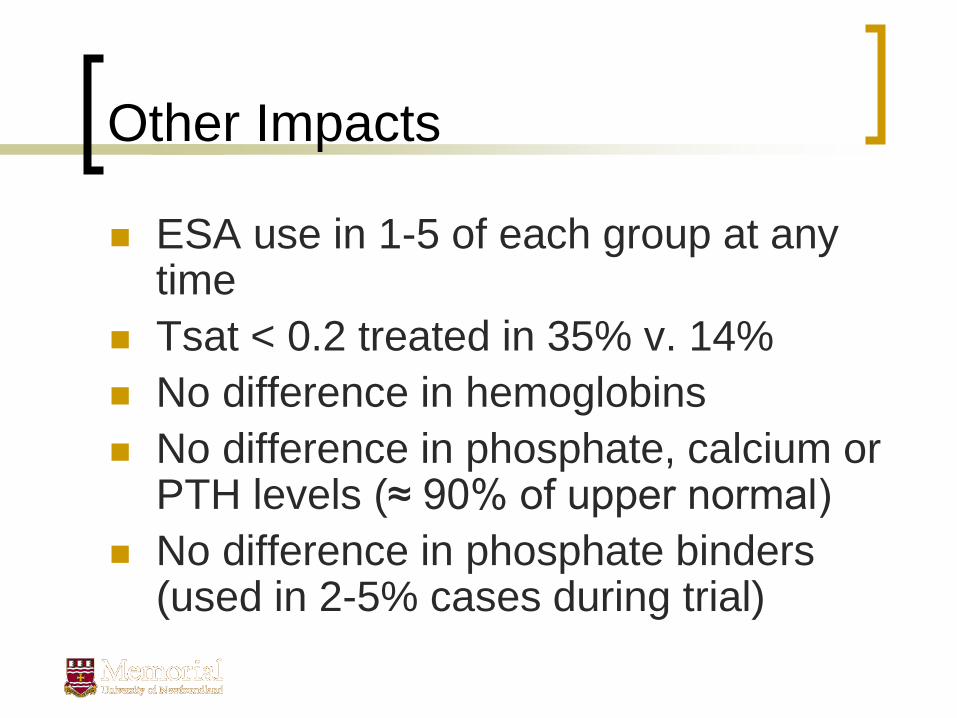
Other Impacts
ESA use in 1-5 of each group at any time
Tsat < 0.2 treated in 35% v. 14%
No difference in hemoglobins
No difference in phosphate, calcium or PTH levels (≈ 90% of upper normal)
No difference in phosphate binders (used in 2-5% cases during trial)

What The Intervenors Did Not Do
Intervention Grp
by 12 months
Controls by 12
months
Δ Hba1c in
diabetics
-0.49%
-0.52%
Mean Hgb if <
110 at baseline
110 (3 on ESA) 108 (0 on ESA)

What The Intervenors Did Not Do
Refer more to dietitians (23% v. 25%
in the first 12 months)
Involve diabetes nurse educators (16%
v. 18% in the first 12 months)
Cost-effectiveness
We monitored all health care
resources used
We measured quality of life by EQ5D
We constructed a cost-utility analysis
Diff in $
Diff in QALYs

Costs – 2 year study patients
Intervention Control
Disease
related costs
(mean)
$4,631 $5,741
All costs
(mean)
$11,739 $14,180

Cost Difference was significant
Trend to higher up front costs in the
intervention group (clinic time etc)
More than offset by less hospitalization
and indirect costs in the intervention
group

Difference in Utility (EQ-5D)
0
0.1
0.2
0.3
0.4
0.5
0.6
0.7
0.8
0.9
1
0 8 16 24Months
Health r
ela
ted q
ualit
y o
f lif
e (
HU
I-3)
Intervention Control
Intervention started lower and rose. Area under
curve greater for Intervention over 2 years - implies
better quality of life

Overall Cost-Utility
-$10,000.00
-$5,000.00
$0.00
$5,000.00
$10,000.00
-0.50 -0.40 -0.30 -0.20 -0.10 0.00 0.10 0.20 0.30 0.40 0.50
Incremental QALYs
Incremental Costs
Lower $, better QALYs
With Intervention in
this quadrant

Conclusions
The largely unreferred population had a low risk of renal progression, but some CV risk
Trial was too small to detect effect on clinical outcomes
No impact on QoL
Intervenors did address BP, RAAS blockade, lipids and iron
Need for and use of ESAs was low
Need and use of phosphate binders was low
Diabetes impact equal to controls

Conclusions 2
There is potential for the model of care to impact clinical outcomes beyond usual care
It was feasible to apply the intervention, but the impact on surrogate outcomes was not consistent
Intervention was cost-effective
The trial did not really test impact on those at risk for kidney disease progression
Further studies may be justified

The Bottom Line
There are people out there with CKD
who may need care aimed at reducing
CV risk, but the nature of the care
should be within the competence of
many physicians
Nephrologists are likely to have little
specific to offer in many of these cases

Thanks
Questions?
Comments?
Criticism?