A transformer-based deep learning approach for classifying ...
29
1 A transformer-based deep learning approach for classifying brain metastases into primary organ sites using clinical whole brain MRI Qing Lyu 1 , Sanjeev V. Namjoshi 2-3 , Emory McTyre 4-6 , Umit Topaloglu 2,3 , Richard Barcus 5,7 , Michael D. Chan 2,4,6 , Christina K. Cramer 2,4,6 , Waldemar Debinski 2-4 , Metin N. Gurcan 2,9 , Glenn J. Lesser 2,4,9 , Hui-Kuan Lin 2,3 , Reginald F. Munden 2,7 , Boris C. Pasche 2-4 , Kiran Kumar Solingapuram Sai 2,4,5,7 , Roy E. Strowd 2,4,9,10 , Stephen B. Tatter 2,4,6,8 , Kounosuke Watabe 2,3 , Wei Zhang 2,3 , *Ge Wang 1 , *Christopher T. Whitlow 2,4-8,10,11 Affiliations: 1 Biomedical Imaging Center, Department of Biomedical Engineering, School of Engineering, Biomedical Imaging Center, Center for Biotechnology and Interdisciplinary Studies, Rensselaer Polytechnic Institute, Troy, NY, USA 2 Comprehensive Cancer Center, Wake Forest School of Medicine, Winston-Salem, NC, USA 3 Department of Cancer Biology, Wake Forest School of Medicine, Winston-Salem, NC, USA 4 Brain Tumor Center of Excellence, Wake Forest School of Medicine, Winston-Salem, NC, USA 5 Radiology Informatics & Image Processing Laboratory, Wake Forest School of Medicine, Winston- Salem, NC, USA 6 Department of Radiation Oncology, Wake Forest School of Medicine, Winston-Salem, NC, USA 7 Department of Radiology, Wake Forest School of Medicine, Winston-Salem, NC, USA 8 Department of Neurosurgery, Wake Forest School of Medicine, Winston-Salem, NC, USA 9 Department of Internal Medicine, Wake Forest School of Medicine, Winston-Salem, NC, USA 10 Department of Neurology, Wake Forest School of Medicine, Winston-Salem, NC, USA 11 Department of Biomedical Engineering, Wake Forest School of Medicine, Winston-Salem, NC, USA Running title: Primary organ site classification of metastatic brain tumors *Corresponding Authors: Ge Wang, PhD, Rensselaer Polytechnic Institute ([email protected]); Christopher T. Whitlow, MD, Wake Forest School of Medicine ([email protected]).
Transcript of A transformer-based deep learning approach for classifying ...

1
A transformer-based deep learning approach for classifying brain metastases
into primary organ sites using clinical whole brain MRI
Qing Lyu1, Sanjeev V. Namjoshi2-3, Emory McTyre4-6, Umit Topaloglu2,3, Richard Barcus5,7,
Michael D. Chan2,4,6, Christina K. Cramer2,4,6, Waldemar Debinski2-4, Metin N. Gurcan2,9, Glenn
J. Lesser2,4,9, Hui-Kuan Lin2,3, Reginald F. Munden2,7, Boris C. Pasche2-4, Kiran Kumar
Solingapuram Sai2,4,5,7, Roy E. Strowd2,4,9,10, Stephen B. Tatter2,4,6,8, Kounosuke Watabe2,3, Wei
Zhang2,3, *Ge Wang1, *Christopher T. Whitlow2,4-8,10,11
Affiliations:
1Biomedical Imaging Center, Department of Biomedical Engineering, School of Engineering, Biomedical Imaging Center, Center for Biotechnology and Interdisciplinary Studies, Rensselaer Polytechnic Institute, Troy, NY, USA
2Comprehensive Cancer Center, Wake Forest School of Medicine, Winston-Salem, NC, USA
3Department of Cancer Biology, Wake Forest School of Medicine, Winston-Salem, NC, USA
4Brain Tumor Center of Excellence, Wake Forest School of Medicine, Winston-Salem, NC, USA
5Radiology Informatics & Image Processing Laboratory, Wake Forest School of Medicine, Winston-Salem, NC, USA
6Department of Radiation Oncology, Wake Forest School of Medicine, Winston-Salem, NC, USA
7Department of Radiology, Wake Forest School of Medicine, Winston-Salem, NC, USA
8Department of Neurosurgery, Wake Forest School of Medicine, Winston-Salem, NC, USA
9Department of Internal Medicine, Wake Forest School of Medicine, Winston-Salem, NC, USA
10Department of Neurology, Wake Forest School of Medicine, Winston-Salem, NC, USA
11Department of Biomedical Engineering, Wake Forest School of Medicine, Winston-Salem, NC, USA
Running title: Primary organ site classification of metastatic brain tumors
*Corresponding Authors: Ge Wang, PhD, Rensselaer Polytechnic Institute ([email protected]);
Christopher T. Whitlow, MD, Wake Forest School of Medicine ([email protected]).

2
Funding: This work was supported in part by the Tumor Imaging and Bioinformatics Shared
Resources under the National Cancer Center Support Grant to the Comprehensive Cancer
Center of Wake Forest University Health Sciences (P30CA012197). QL and GW are supposed
by (R01EB026646, R01CA233888, R01HL151561, R21CA264772, and R01EB031102). CW is
supported by the I. Meschan Distinguished Professorship in Radiology and National Cancer
Institute (P01CA207206 and P30CA012197). WZ is supported by the Hanes and Willis
Professorship in Cancer. Additional support for SVN and WZ were provided by a Fellowship to
WZ from the National Foundation for Cancer Research. BP is supported by the Charles L. Spurr
Professorship Fund. WD is supported by the Tom and Laura Hearn Professorship for Brain
Tumor Center of Excellence, and the National Cancer Institute (P01CA207206 and R01
CA074145).
Conflict of interest: The authors declare no competing interests.
Authorship: Study concept and design: CW, GW, SN. Model training and analysis: QL, SN.
Manuscript preparation: QL, SN, GW, CTW. Provided imaging data and performed data
preprocessing: CW, RB, EM. Provided demographic data: UT. Intellectual input supervision for
the study: CW, GW, WZ. Contributed to technical improvement, biological interpretation, and
manuscript development: All authors.
Word count: 3,061

3
Abstract:
Treatment decisions for brain metastatic disease rely on knowledge of the primary organ site, and
currently made with biopsy and histology. Here we develop a novel deep learning approach for
accurate non-invasive digital histology with whole-brain MRI data. Our IRB-approved single-site
retrospective study was comprised of patients (n=1,399) referred for MRI treatment-planning and
gamma knife radiosurgery over 21 years. Contrast-enhanced T1-weighted and T2-weighted
Fluid-Attenuated Inversion Recovery brain MRI exams (n=1,582) were preprocessed and input to
the proposed deep learning workflow for tumor segmentation, modality transfer, and primary site
classification into one of five classes (lung, breast, melanoma, renal, and others). Ten-fold cross-
validation generated overall AUC of 0.947 [95%CI:0.938,0.955], “lung” class AUC of 0.899
[95%CI:0.884,0.915], “breast” class AUC of 0.990 [95%CI:0.983,0.997], “melanoma” class AUC
of 0.882 [95%CI:0.858,0.906], “renal” class AUC of 0.870 [95%CI:0.823,0.918], and “other” class
AUC of 0.885 [95%CI:0.843,0.949]. These data establish that whole-brain imaging features are
discriminative to allow accurate diagnosis of the primary organ site of malignancy. Our end-to-
end deep radiomic approach has great potential for classifying metastatic tumor types from whole-
brain MRI images. Further refinement may offer an invaluable clinical tool to expedite primary
cancer site identification for precision treatment and improved outcomes.
Keywords: Deep learning, vision transformer, generative adversarial network (GAN), transfer
learning, MRI, brain metastasis, primary organ site, classification
Key points:
1. Proposed an advanced deep learning-based radiomic method to classify brain metastases
by primary organ site cancer.
2. Minimally processed clinically acquired MR images were used, without additional human
intervention.

4
3. Used a cutting-edge transformer-based network for automatic brain metastasis
segmentation, producing high accuracy and robustness on different datasets.
4. Used cycleGAN for modality transfer and data fusion to predict missing modality images,
enabling our method to be effective on incomplete data and facilitating the translation of
our approach.
5. After training, our hybrid network was systematically tested on over 1,000 patients with
excellent classification results.
Importance of study: In approximately 10% of cases, brain metastatic disease is the initial
cancer presentation, and treatment decisions are driven by knowledge of primary organ site
cancer/histologic type, which can require invasive biopsy. In this study, we develop an advanced
deep learning radiomic workflow for accurate and rapid non-invasive imaging-based identification
of the brain metastatic tumor histologic type using conventional T1-weighted contrast enhanced
and T2-weighted-Fluid-Attenuated Inversion Recovery whole brain MR images. The use of
clinically acquired whole-brain MR images and the end-to-end pipeline obviate human
intervention and are physician-friendly. Our results demonstrate excellent diagnostic performance
for classifying metastatic tumor types using whole-brain MR images. Further refinement may offer
an invaluable tool to expedite primary organ site cancer identification for treatment of brain
metastatic disease, as well as improve patient outcomes and survival.

5
Introduction
Approximately 180,000 patients are diagnosed with brain metastases in the US each
year1. These metastases originate from primary organ site cancers across the body, with 67%-
80% originating from lung, breast, or melanoma2,3. Clinical trials routinely assign treatment to
patients with brain metastases based on the number and size of their brain lesions4, often treating
all lesions as equivalent diseases5. It is becoming increasingly recognized that brain metastases
of different histologies have correspondingly different biologic behaviors and therapeutic
responses. For example, it has been known for many years that melanoma brain metastases are
more likely to be hemorrhagic. Breast, lung and melanoma primaries are more likely to yield
multiple brain metastases, while tumors of the gastrointestinal tract are more likely to seed the
posterior fossa6. Such patterns are readily visible on MRI examinations and have been previously
noted in population studies. However, the overall sensitivity and specificity as applied to individual
patients in the context of qualitative imaging evaluation of brain metastases is insufficient for
definitive diagnosis/classification of the primary underlying malignancy. That said, there are also
likely biological differences between brain metastases of various histologic types that have yet to
be discovered and are not evident to physicians via standard qualitative approaches. This is
currently reflected within the highly granular quantitative medical imaging data, which can be
leveraged for sensitive and specific classification into brain metastatic disease histologic types.
Our overall hypothesis is that imaging features of brain metastases are sufficiently discriminative
and may be detected by radiomics at the time of initial evaluation to allow accurate diagnosis of
the primary organ site cancer.
In approximately 10% of cases, brain metastatic disease is the initial cancer presentation7,
and treatment decisions are driven by knowledge of the primary organ site/histologic type. In
these cases, an oncologic workup including cross-sectional imaging of the remainder of the body
may identify the most likely primary organ site. If a primary malignancy site is identified that is
amenable to biopsy, then tissue is often obtained directly from that extracranial site to confirm the

6
histologic diagnosis. If there are no extra-cranial sites amenable to biopsy, and the brain
metastatic disease is in a favorable location, then invasive intracranial tissue sampling may be
necessary for definitive diagnosis. Often, the specific treatment recommended for brain metastatic
disease hinges on knowing the primary organ site of the malignancy, which underscores the
importance and immediate need to develop a non-invasive methodology that can conclusively
identify the primary organ site of brain metastatic disease to facilitate rapid management and
optimize treatment decision.
Deep learning-based radiomics, as an emerging field, uses deep learning-based
algorithms to transfer standard medical images into high-dimensional quantitative features, have
led to new tools capable of recognizing features in medical imaging data that may not be easily
perceived by physicians, such as radiologists8. Radiomic tools have been applied to quantitative
image analysis and expedite the clinical diagnosis of cancer8-10. To date, physicians who use
diagnostic imaging for neuro-oncology evaluation, such as radiologists and oncologists, are
generally unable to determine the primary organ site of cancer from images of brain metastases
alone. However, it is possible to use radiomic tools to identify the primary organ site of brain
metastases by leveraging patterns or features within medical imaging data11. Previously, radiomic
tools utilized dedicated algorithms to extract handcrafted features. As a result, only a limited
number of heuristic features are available. Although such a problem can be alleviated with the
image transform like wavelet transform11, the scope of extracted features is still limited. Deep
learning, as the mainstream of artificial intelligence, is a data-driven approach, holding a great
promise to address this challenge. Recently, deep learning has been widely used in radiomics for
many tasks, such as cancer prognostication and cancer radiotherapy failure rate prediction12,13.
Recently, deep learning has also achieved great success in recognizing primary or metastasis
tumors and classifying metastatic tumors into their origins based on whole-slide histological
images14.

7
We hypothesized that deep learning-based radiomics, or deep radiomics, could identify
the primary organ site cancer associated with a patient’s brain metastatic disease using clinical
MR images. Furthermore, we hypothesized that the classification process could be expedited with
minimal image preprocessing in an automated workflow that requires minimal human
intervention/feature engineering. Here we report a deep radiomic approach for classification of
the primary organ site of brain metastases based on 3D structural MRI T1 and/or T2-weighted-
Fluid-Attenuated Inversion Recovery (T2 FLAIR) images.
Figure 1 shows an overview of our study design. Two large datasets were clinically
collected consisting of 1,399 patients with 1,582 cases respectively. The images with tumor
contours were used for training and validation of our tumor segmentation network. Once trained,
voxel-wise tumor probability maps were generated by the tumor segmentation network. Patients
with both T1-weighted contrast enhanced (T1 CE) and T2 FLAIR were used to train a cycleGAN15
in the weakly supervised learning mode to transfer image modalities between T1 CE and T2
FLAIR. After training, either a T1 CE or T2 FLAIR image can be used to produce the image in the
complementary modality (that is, either the corresponding T2 FLAIR or T1 CE image). Finally, we
used all cases, each case’s modality transferred case, and corresponding tumor probability maps
into our classification network for inferencing the primary organ site of brain metastases. Once
trained, the whole workflow can be implemented in an end-to-end way.
Results
Patient demographic analysis
Two large datasets with a total of 1,399 patients (mean ± SD age, 62.77 ± 11.86 years,
63.57% male) were used. Specifically, for the dataset with tumor contours, there were 148
patients (61.77 ± 11.15 years; 56.85% male); and for the dataset without tumor contours, there
were 1,251 patients (62.85 ± 11.91 years; 59.07% male). Specifically, the “lung” category had

8
801 patients (63.21 ± 11.06 years; 54.93% male), “breast” category had 106 patients (62.23 ±
12.04 years), “melanoma” category had 313 patients (62.80 ± 13.81 years; 72.20% male), “renal”
category had 82 patients (62.47 ± 11.16 years; 85.37% male), and “other” category had 97
patients (59.81 ± 12.25 years; 82.47% male). In the dataset with tumor contours, 54.11%
patients/scans had 1-3 lesions (mean ± SD = 4.79 ± 5.27).
Tumor segmentation
To conduct deep radiomic analysis, it is necessary to label targets and extract their
features. In this study, we adapted a U-Net-shaped network with transformers in the bottleneck
for tumor segmentation. The proposed segmentation network segments brain metastasis tumors
and generates voxel-wise tumor probability maps to guide the proposed classification network to
pay due attention on metastases. The proposed networks were trained on T1 CE and T2 FLAIR
dataset separately. Figure 2e-g compares our proposed method with other brain tumor
segmentation networks. Different from the other methods, our proposed network has two major
merits: 1) high sensitivity on both smaller and larger metastases, 2) high robustness over different
datasets.
For the brain metastasis segmentation, one major challenge is a strong heterogeneity of
tumor sizes. Some small metastasis tumors only account for a few voxels in an MR image, which
can be easily neglected by generic networks since information can be lost during a down-sampling
process. On the other hand, how to precisely segment a large tumor is also difficult because
convolutional neural networks (CNN) tend to focus more on local features. To address this
problem, we proposed a novel network synergizing both convolutional layers and transformers.
In contrast to convolutional layers, transformers focus on global information via a self-attention
mechanism. The combination of locally oriented convolutional layers with transformers with global
awareness guarantees that the proposed network integrates both local and contextual features.
In additional, the skip connections are made between down-sampling and up-sampling blocks to

9
minimize the information loss in the feature extraction process. By this architectural design, our
proposed network has inherent capabilities of segmenting both small (e.g., the tumor pointed by
the yellow arrow in Figure 2g) and large metastasis tumors (e.g., the tumor pointed by the red
arrow in Figure 2g) equally well. Interestingly, in some cases, segmented results could outperform
human labeled results, as the tumor pointed by the green arrow in Figure 2f.
The other major merit of the proposed segmentation network is its robustness and
generalizability over different datasets. When testing on data without tumor contours, the
proposed network behaved quite conservatively to avoid false positive prediction (Figure 2g). This
characteristic is of critical importance in the clinical setting. As MRI images are collected from
scanners manufactured by different manufactures, it is impractical to have every MRI case
collected under the same protocol and techniques. A robust network can tolerate the conditional
differences in the data collection process and generalize well on different datasets.
Modality transfer
In this study, we used both of T1 CE and T2 FLAIR images for tumor classification so that
complementary features could enhance the radiomic analysis. However, as in most medical
imaging projects, it is challenging to collect big data meeting all our requirements. Instead, there
were only 127 patients with both T1 CE and T2 FLAIR scans, and these images were not strictly
paired in terms of the slice position, and were collected at different time points. Given these
issues, we developed a cycleGAN in a weakly supervised way for modality transfer; that is to
generate missing modality images.
In our experiments, 125 patients with both T1 CE and T2 FLAIR cases were randomly
selected for training and the other two patients for validation. Figure 3a shows the workflow for
cycleGAN training. Mutual information was minimized to find the most similar image in the target
modality MRI case to form pairs. Figure 3b shows modality transfer results on both a validation
dataset and two cases without its corresponding modality. It was found that cycleGAN can

10
generate modality transferred results in a style very similar to that of their targets. The generated
modality transferred results were more realistic, showing more details than results from that using
the style transfer method16 as shown in Supplementary Figure 1. We tested cycleGAN on each
patient only with either T1 CE or T2 FLAIR images to generate the missing modality image, which
were used so that our classification network always had T1 CE and T2 FLAIR images as the input.
Five-class classification
Using the proposed tumor segmentation network and cycleGAN, we obtained a set of data
for each MRI scan: the original MRI scan in the either T1 CE or T2 FLAIR contrast mechanism,
its corresponding missing modality data, and voxel-wise tumor probability map. We fed these
images and map to the classification network for predicting the primary organ site of brain
metastases. Figure 4c,e-f show our 10-fold classification results. The overall AUC is 0.947 with
95% confidence interval of 0.938 and 0.955; “lung” class AUC is 0.899 with 95% confidence
interval of 0.884 and 0.915; “breast” class AUC of 0.990 with 95% confidence interval of 0.983
and 0.997, “melanoma” class AUC is 0.882 with 95% confidence interval of 0.858 and 0.906;
“renal” class AUC is 0.870 with 95% confidence interval of 0.823 and 0.918; and “other” class
AUC is 0.885 with 95% confidence interval of 0.843 and 0.949.
To investigate the contribution of adding tumor prediction maps to the performance of the
classification network, we conducted an ablation study without involving tumor prediction maps.
It can be observed in Figure 4d that adding tumor classification maps greatly improved the overall
AUC score by 4.8%. Meanwhile, another ablation study was performed only using T1 CE or T2
FLAIR images. As shown in Figure 4d, removal of either T1 CE or T2 FLAIR images decreased
the overall AUC by 8.7% and 6.0%, respectively.

11
Discussion
Brain metastases are common and often present as the initial presentation of lung,
melanoma, renal, breast, and other cancers17,18. Of those who develop brain metastases, 36%
are diagnosed within 1-month of the initial presentation and 72% are diagnosed within the first
year19. Survival of patients presenting with brain metastatic disease is poor, with a median survival
of 3.7 months and worse particularly for patients with lung cancer20. Factors associated with more
favorable survival for these patients with brain metastatic disease include use of appropriate
systemic therapy for better performance status21. Critical to initiation of optimal systemic therapy
is establishing an accurate diagnosis of the primary organ site. Of particular importance is not
delaying initiation of brain-directed treatment with extensive systemic imaging studies, diagnostic
biopsies, or other methods for primary organ site identification22-24. To this end, our work presents
a deep learning-based radiomic pipeline for easy and conclusive identification of the most
common primary organ sites for brain metastatic disease using clinically acquired T1 CE or T2
FLAIR whole brain MRI images alone, thus opening the door for rapid translation into clinical care.
Owing to the end-to-end nature, the proposed framework is user friendly and can be implemented
within seconds with minimal human intervention. To our best knowledge, this study represents
the first application of deep learning to extract radiomic features for this critically important
classification task, and the cross-validation approach suggests that the results are generalizable.
Our results further demonstrate that the deep learning approach is feasible and could be
improved with a larger image dataset. We achieved the highest accuracy on the “lung” category,
which incorporated the majority (55.82%) of all cases used in this study. Since deep learning is
data-driven, the network can better learn how to extract radiomic features for analysis with more
cases involved in the training process. Within one month after the publication of this paper, we
will open our codes for federated learning, and continuously add more whole-brain MRI cases
into the proposed radiomic pipeline to further improve the classification performance.

12
The inclusion of cycleGAN in the proposed radiomic pipeline relaxes the requirement for
clinical translation. Clinically, it is rare to have a large batch of datasets with each subject scanned
in multiple MRI modalities. A common scenario is that an individual patient is scanned with only
a subset of MR imaging sequences. The use of cycleGAN for modality transfer generates missing
modalities semantically, overcoming the difficulty of data collection and making the proposed
method widely applicable. Meanwhile, more single modality cases can be capitalized via modality
transfer in the training process to improve classification results. As shown in Figure 4d, compared
with using either T1 CE or T2 FLAIR alone, the dual-modality input via modality transfer led to
significantly higher AUC scores.
There are several opportunities for further improvements of our deep learning model. First,
additional medical images from the primary cancer site should be helpful in the proposed radiomic
pipeline, such as lung CT images. We hypothesize that there may be some common or correlated
deep radiomic features between tumors in the primary site and the brain. Adding these additional
images may guide the network to find these common or correlated features for better
classification. While MRI is uncommon in certain body regions, there are already efforts underway
to supplement patient screening in domains currently dominated by radiography and CT25.
Second, with a greater number of images, it will be possible to increase the number of classes
and cover more histological subtypes. Brain metastases originating from different subtypes may
have differential responses to certain targeted treatments and immunotherapies, and a finer-
grained classification scheme may be necessary to elucidate these differences. For example, Lu
et. al. divided metastasis into 18 categories based on 32,537 whole-slide images14. Third, to
obtain more data for deep learning, the partnership or consortium is important among multiple
institutions and hospitals. To address the concern over privacy and ownership of medical data,
one promising solution is federated learning26. Fourth, further iterations of our model will be
needed to diagnose patients with cancer of unknown primary, which may remain unknown until
death in some cases. Hopefully, we will refine our model in the future to further analyze patients

13
with cancer of unknown primary for the true etiology so that optimal therapies can be initiated in
a timely manner. We had initially sought to test our model on cancer of unknown primary;
however, there were too few cases in our cohort (n < 21).
Using deep learning to extract radiomic features has shown a great potential to outperform
manually driven radiomic analyses11,27. For this brain metastasis classification, beyond the
previous manually driven feature-derived results, our approach has produced significantly better
AUC scores in performing multi-class classification (0.947 vs 0.873). Unlike conventional
radiomics relying on limited manually generated features like gray-level co-occurrence and run-
length metrics, deep radiomics does not rely on pre-defined algorithms, instead it learns how to
extract radiomic features by itself. For conventional radiomics, one typical scenario is that if
manually derived features are not adequately extracted, radiomics cannot obtain good results.
Such a problem can be solved by deep radiomics through data-driven learning. Although it is in
principle that deep learning-based radiomics is superior to conventional methods, there is no need
to discard conventional radiomics. A synergistic way is to combine conventional manually derived
feature extraction with deep radiomics. While deep radiomics is automatic and systematic,
manually derived features have clearer meanings and rich semantics. In other words, learned and
handcrafted features may help each other to boost the diagnostic performance.
Last but not the least, deep learning-mediated classification of the primary organ site
cancer associated with brain metastatic disease could improve outcomes in the setting of
healthcare disparities. According to a recent CDC study, 263,054 adult respondents to a survey
in the United States came from rural counties28. These counties generally have less access to
healthcare, with hospitals that may be understaffed and lacking the equipment to perform
specialized diagnostic tests. Such health disparities have resulted in poorer health status and
quality of life, as compared to the general population. Indeed, Renz et al.29 noted that rural location
is a predictor for increased death, as well as compromised whole brain radiation therapy
outcomes for squamous cell carcinoma brain metastases. An algorithm like the one described in

14
this paper, once properly trained and validated, can be deployed online to process images in real-
time as a tool for radiologists and oncologists, to improve workflow and diagnosis. This would
allow lower cost, fewer tests, and faster determination of the primary organ site of brain
metastases, as well as less healthcare disparities. Collectively, our results show the potential of
the deep learning approach that will have a widespread impact on the diagnosis and treatment of
brain metastases to improve healthcare outcomes and quality of life for patients.
Acknowledgements
We would like to thank Nikita Namjoshi and Josh Tan for comments and suggestions. We would
also like to thank Drs. Guangxu Jin and Liang Liu with Wake Forest Baptist Comprehensive
Cancer Center Bioinformatics Shared Resource for their inputs.

15
References
1. Ellis, T.L., Neal, M.T. & Chan, M.D. The role of surgery, radiosurgery and whole brain radiation therapy in the management of patients with metastatic brain tumors. Int J Surg Oncol 2012, 952345 (2012).
2. Nayak, L., Lee, E.Q. & Wen, P.Y. Epidemiology of brain metastases. Curr Oncol Rep 14, 48-54 (2012).
3. Vuong, D.A., Rades, D., Vo, S.Q. & Busse, R. Extracranial metastatic patterns on occurrence of brain metastases. J Neurooncol 105, 83-90 (2011).
4. Devoid, H.M., et al. Recent advances in radiosurgical management of brain metastases. Front Biosci (Schol Ed) 8, 203-214 (2016).
5. Brown, P.D., et al. Effect of Radiosurgery Alone vs Radiosurgery With Whole Brain Radiation Therapy on Cognitive Function in Patients With 1 to 3 Brain Metastases: A Randomized Clinical Trial. JAMA 316, 401-409 (2016).
6. Delattre, J.Y., Krol, G., Thaler, H.T. & Posner, J.B. Distribution of brain metastases. Arch Neurol 45, 741-744 (1988).
7. Waqar, S.N., et al. Brain Metastases at Presentation in Patients With Non-Small Cell Lung Cancer. Am J Clin Oncol 41, 36-40 (2018).
8. Lambin, P., et al. Radiomics: the bridge between medical imaging and personalized medicine. Nature reviews Clinical oncology 14, 749-762 (2017).
9. Fass, L. Imaging and cancer: a review. Mol Oncol 2, 115-152 (2008). 10. Gillies, R.J., Kinahan, P.E. & Hricak, H. Radiomics: Images Are More than Pictures, They Are Data.
Radiology 278, 563-577 (2016). 11. Kniep, H.C., et al. Radiomics of brain MRI: utility in prediction of metastatic tumor type.
Radiology 290, 479-487 (2019). 12. Hosny, A., et al. Deep learning for lung cancer prognostication: a retrospective multi-cohort
radiomics study. PLoS medicine 15, e1002711 (2018). 13. Lou, B., et al. An image-based deep learning framework for individualising radiotherapy dose: a
retrospective analysis of outcome prediction. The Lancet Digital Health 1, e136-e147 (2019). 14. Lu, M.Y., et al. AI-based pathology predicts origins for cancers of unknown primary. Nature 594,
106-110 (2021). 15. Zhu, J.-Y., Park, T., Isola, P. & Efros, A.A. Unpaired image-to-image translation using cycle-
consistent adversarial networks. in Proceedings of the IEEE international conference on computer vision 2223-2232 (2017).
16. Gatys, L.A., Ecker, A.S. & Bethge, M. Image style transfer using convolutional neural networks. in Proceedings of the IEEE conference on computer vision and pattern recognition 2414-2423 (2016).
17. Fox, B.D., Cheung, V.J., Patel, A.J., Suki, D. & Rao, G. Epidemiology of metastatic brain tumors. Neurosurg Clin N Am 22, 1-6, v (2011).
18. Gavrilovic, I.T. & Posner, J.B. Brain metastases: epidemiology and pathophysiology. J Neurooncol 75, 5-14 (2005).
19. Schouten, L.J., Rutten, J., Huveneers, H.A. & Twijnstra, A. Incidence of brain metastases in a cohort of patients with carcinoma of the breast, colon, kidney, and lung and melanoma. Cancer 94, 2698-2705 (2002).
20. Berk, L. & Stevens, B. Outcome of patients with an initial presentation of brain metastases. 32, 133-133 (2014).
21. Ferreira Dos Santos, V.M., et al. Brain metastasis as initial presentation of lung cancer - Impact of prognostic factors on patient survival. 50, PA4232 (2017).

16
22. Polyzoidis, K.S., Miliaras, G. & Pavlidis, N. Brain metastasis of unknown primary: a diagnostic and therapeutic dilemma. Cancer Treat Rev 31, 247-255 (2005).
23. Koc, Z.P., Kara, P.O. & Dagtekin, A. Detection of unknown primary tumor in patients presented with brain metastasis by F-18 fluorodeoxyglucose positron emission tomography/computed tomography. CNS Oncol 7, CNS12 (2018).
24. Han, H.J., et al. Optimal Treatment Decision for Brain Metastases of Unknown Primary Origin: The Role and Timing of Radiosurgery. Brain Tumor Res Treat 4, 107-110 (2016).
25. Biederer, J., et al. MRI of the lung (3/3)-current applications and future perspectives. Insights Imaging 3, 373-386 (2012).
26. Dayan, I., et al. Federated learning for predicting clinical outcomes in patients with COVID-19. Nature Medicine, 1-9 (2021).
27. Ortiz-Ramón, R., Larroza, A., Ruiz-España, S., Arana, E. & Moratal, D. Classifying brain metastases by their primary site of origin using a radiomics approach based on texture analysis: a feasibility study. European radiology 28, 4514-4523 (2018).
28. James, C., et al. Racial/Ethnic Health Disparities Among Rural Adults — United States, 2012–2015. in MMWR Surveill Summ 2017, Vol. 66 1-9 (2017).
29. Renz, P., Hasan, S. & Wegner, R.E. Survival outcomes after whole brain radiotherapy for brain metastases in older adults with newly diagnosed metastatic small cell carcinoma: A national cancer database (NCDB) analysis. J Geriatr Oncol (2019).
30. Lyu, Q., Shan, H. & Wang, G. MRI super-resolution with ensemble learning and complementary priors. IEEE Transactions on Computational Imaging 6, 615-624 (2020).
31. Mao, X., et al. Least squares generative adversarial networks. in Proceedings of the IEEE international conference on computer vision 2794-2802 (2017).
17
Materials and Methods
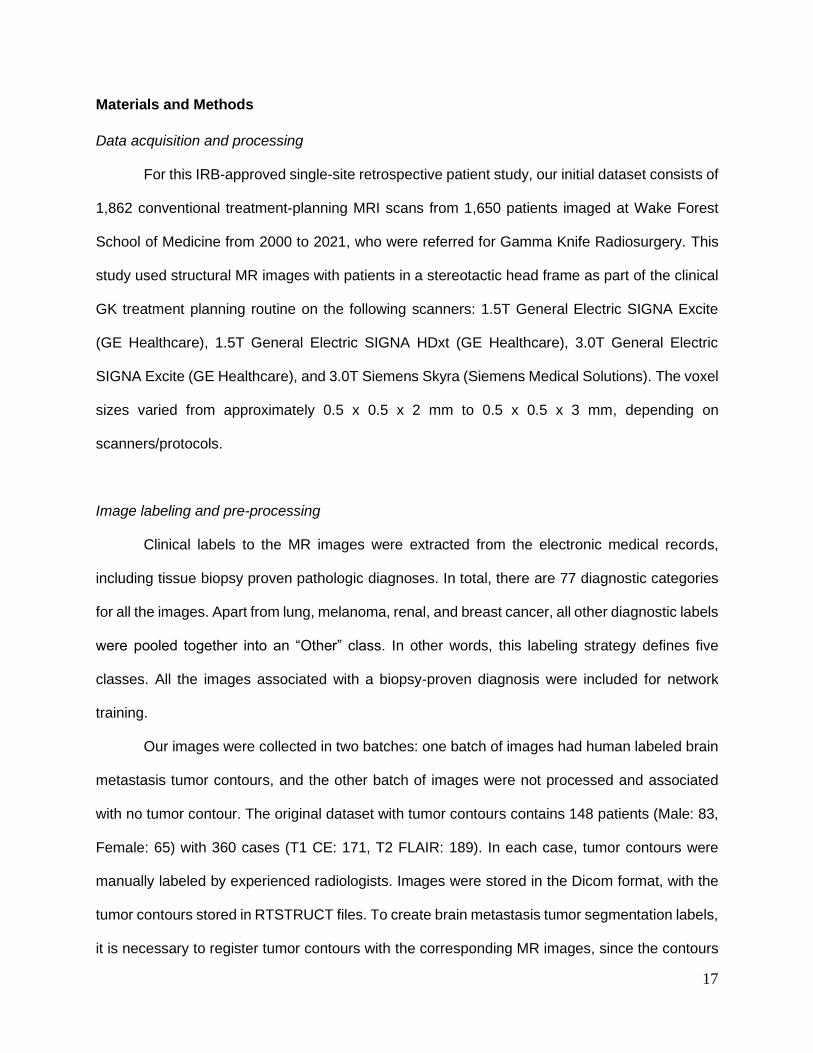
Data acquisition and processing
For this IRB-approved single-site retrospective patient study, our initial dataset consists of
1,862 conventional treatment-planning MRI scans from 1,650 patients imaged at Wake Forest
School of Medicine from 2000 to 2021, who were referred for Gamma Knife Radiosurgery. This
study used structural MR images with patients in a stereotactic head frame as part of the clinical
GK treatment planning routine on the following scanners: 1.5T General Electric SIGNA Excite
(GE Healthcare), 1.5T General Electric SIGNA HDxt (GE Healthcare), 3.0T General Electric
SIGNA Excite (GE Healthcare), and 3.0T Siemens Skyra (Siemens Medical Solutions). The voxel
sizes varied from approximately 0.5 x 0.5 x 2 mm to 0.5 x 0.5 x 3 mm, depending on
scanners/protocols.
Image labeling and pre-processing
Clinical labels to the MR images were extracted from the electronic medical records,
including tissue biopsy proven pathologic diagnoses. In total, there are 77 diagnostic categories
for all the images. Apart from lung, melanoma, renal, and breast cancer, all other diagnostic labels
were pooled together into an “Other” class. In other words, this labeling strategy defines five
classes. All the images associated with a biopsy-proven diagnosis were included for network
training.
Our images were collected in two batches: one batch of images had human labeled brain
metastasis tumor contours, and the other batch of images were not processed and associated
with no tumor contour. The original dataset with tumor contours contains 148 patients (Male: 83,
Female: 65) with 360 cases (T1 CE: 171, T2 FLAIR: 189). In each case, tumor contours were
manually labeled by experienced radiologists. Images were stored in the Dicom format, with the
tumor contours stored in RTSTRUCT files. To create brain metastasis tumor segmentation labels,
it is necessary to register tumor contours with the corresponding MR images, since the contours

18
do not match the tumors well due to some minor technical incompatibilities. Hence, we utilized an
affine transformation to implement tumor contour registration and created tumor masks as the
labels to train our segmentation network. After the registration between the contours and the
tumors, 77 cases were removed due to signal degradation, motion blurring, and other artifacts. In
most of these failure cases, the main reason was the fading or diminishing of metastases after
radiotherapy. There are 1,608 patients (Male: 981, Female: 627) in the dataset without tumor
contours. Each patient was only scanned once. In this dataset, 182 cases were first excluded
because they are neither T1 CE or T2 FLAIR. Then, additional 221 cases were removed because
they failed to cover the whole brain or there were severe image quality issues. After exclusion of
the inappropriate cases, 1,582 cases from 1,399 patients were selected for this study. Among
them, 283 cases (T1 CE: 138, T2 FLAIR: 146) were with tumor labels. For each case, we unified
voxel resolution via linear interpolation and normalized intensity distributions using Advanced
Normalization Tools (ANTs, https://github.com/ANTsX/ANTs).
Training and validation datasets
For tumor segmentation, we only utilized images with tumor contours for network training
and validation. We randomly selected 120 T1 CE cases and 125 T2 FLAIR cases for training. The
other 18 T1 CE cases and 20 T2 FLAIR cases were used for validation. Specifically, the proposed
tumor segmentation network was trained on T1 CE and T2 FLAIR images respectively. After
training, all the cases used in this study were processed to generate the corresponding tumor
probability maps using Softmax.
To perform the modality transfer between T1 CE and T2 FLAIR images, we used 254
cases (T1 CE: 127, T2 FLAIR: 127) from 127 patients to train and validate the modality transfer
network. 250 cases from 125 patients were randomly selected for the training and the other 4
cases from the remaining 2 patients for validation. After training and validation, all the cases were
processed to generate the modality transferred images.

19
For tumor classification, we utilized the 10-fold cross-validation scheme on all the cases
used in this study involved in the training and validation stage. The classification results shown in
this paper are based on the average data of 10 cross-validation runs.
Tumor segmentation network design
In this study, we proposed an advanced network for brain tumor detection by combining
convolutional layers for local feature extraction and transformers for global awareness. The
proposed network is in the U-Net structure. As shown in many other deep learning tasks, adopting
the U-Net demands a reasonable computational cost and delivers reasonable network
performance. The structure of the proposed segmentation network is illustrated in Figure. 2a-d.
The proposed network includes the four components: a down-sampling convolutional
branch, a transformer-based bottleneck, an up-sampling convolutional branch, and skip
connections between the down-sampling and up-sampling branches. The down-sampling branch
contains ten down-sampling blocks. In each down-sampling block, there are two arms, the first
arm has three convolutional layers follower by group normalization and ReLU activation. Down-
sampling happens in the second convolutional layer with a stride of two. The second arm only
has one convolutional layer with a stride of two. Feature maps from the two arms are finally added
together. In the up-sampling branch, there are five up-sampling blocks. Each up-sampling block
contains two convolutional layers followed by group normalization and ReLU activation. An up-
sampling layer is then added to expand the feature maps by a factor of two. There are skip
connections between each pair of down-sampling and up-sample blocks. The bottleneck consists
of twelve identical transformers. Before feeding feature maps to the first transformer encoder,
feature maps are vectorized into a series of 1D tokens. Combining convolutional layers and
transformers ensures that the network would utilize both local and global information. For more
details, please see Supplementary Table 1.

20
The objective function of the proposed segmentation network combines cross-entropy and
Dice loss:
min𝑆
ℒ = 0.5 𝑐𝑟𝑜𝑠𝑠_𝑒𝑛𝑡𝑟𝑜𝑝𝑦 + 0.5 𝐷𝑖𝑐𝑒 (1)
where S is the parameters of the proposed segmentation network.
Modality transfer network design
CycleGAN15 has shown great successes in image style transfer and other tasks. It uses a
generative adversarial mechanism in the training process to let the generator learn the real
distribution of target data. Meanwhile, the adoption of the cycle consistency loss avoids the
contradiction in adversarially generated images, and the resultant cycleGAN network can be
trained in a weakly supervised fashion. We used cycleGAN for modality transfer in this study. The
proposed cycleGAN has two identical generators and two identical discriminators, as shown in
Figure 3a. Generator 1 was designed to transform T1 CE images to T2 FLAIR counterparts, and
Generator 2 was expected to generate T1 CE images from T2 FLAIR counterparts. Discriminators
1 and 2 judge the generated T1 CE or T2 FLAIR images are true or not. The generators and
discriminators are of the same structures as those described in our recent work30
In the training process, mutual information is used to find the most similar slice from the
corresponding modality scan of the same patient so that the network can be trained in a weakly
supervised way. We use the least-square adversarial loss31 in the training process. The objective
function for the two generators is as follows:
min𝐺
ℒ = ℒ𝑎𝑑𝑣 + 𝜆ℒ𝑐𝑦𝑐 (2)
ℒ𝑎𝑑𝑣 = 𝔼𝑥(𝐷1(𝐺1(𝑥)) − 1)2 + 𝔼𝑦(𝐷2(𝐺2(𝑦)) − 1)2 (3)
ℒ𝑐𝑦𝑐 = 𝔼𝑥(𝐺2(𝐺1(𝑥)) − 𝑥)2 + 𝔼𝑦(𝐺1(𝐺2(𝑦)) − 𝑦)2 (4)
where G and D stand for Generator and Discriminator respectively, ℒ𝑎𝑑𝑣 is the adversarial loss,
and ℒ𝑐𝑦𝑐 is the cycle consistency loss. The objective functions of the two generators are:

21
min𝐷1
ℒ = 𝔼𝑥(𝐷1(𝐺1(𝑥)) − 0)2 + 𝔼𝑦(𝐷1(𝑦) − 1)2 (5)
min𝐷2
ℒ = 𝔼𝑦(𝐷2(𝐺2(𝑦)) − 0)2 + 𝔼𝑥(𝐷2(𝑥) − 1)2. (6)
Tumor classification network design
The proposed tumor detection network consists of two identical feature extraction
branches, where the probability maps are gradually down-sampled via 3D maximum pooling and
finally concatenated with the features from the two branches. There is an attention module to
combine the features extracted from T1 CE and T2 FLAIR branches. Then, two fully connected
layers are used to generate the final classification outcome. Each feature extraction branch works
through a 3D convolutional layer and five subsequent down-sampling blocks. The down-sampling
blocks share the same structure as that in the segmentation network. The only difference lies in
that 2D convolutional layers are upgraded to 3D convolutional layers. The attention module
consists of a channel attention branch and a spatial attention branch. In the channel attention
branch, feature maps are first converted into vectors via 3D global averaging, then two fully
connected layers calculate the weight for each channel, and finally feature maps are channel-
wise multiplied by channel weights. In the spatial attention branch, feature maps are first channel-
wise averaged, the weight in each voxel is determined via sigmoid activation, and finally feature
maps are voxel-wise multiplied by weights. The outputs of the channel attention and spatial
attention branches are element-wise added to form new feature maps. The objective function of
the proposed classification network is the weighted cross-entropy. The proposed classification
network are further detailed in Supplementary Table 2.
Implementation details
We used the Adam optimizer to train the segmentation, modality transfer, and
classification networks respectively. For the segmentation network, the batch size was set to 12

22
per GPU. The learning rate was 1e-4. The training stopped when there was no significant (less
than 1%) loss decay for 20 epochs. For the modality transfer network, the batch size was 1 per
GPU. The training continued 50 epochs with a learning rate of 1e-4. For the classification network,
the batch size was set to 3 per GPU. The learning rate was set to 1e-5 in the first 50 epochs and
then divided by a factor of 2 after every 10 epochs. The training stopped when there was no
significant loss decay for 20 epochs. All experiments were conducted on eight Nvidia Tesla V100
GPUs with 32 GB memory.

23
Fig. 1: Proposed deep radiomic workflow and data characteristics. (a) flowchart of data pre-
processing; (b) Statistics of the 1,582 cases collected for this study; (c) Statistics of the 1,399
patients used in this study; and (d) flowchart of the proposed deep learning-based pipeline for
brain metastasis classification, where a pre-processed T1 CE or T2 FLAIR whole-brain MR image
volume is first input a cycleGAN for modality transfer to synthesize the corresponding missing
modality MR image volume, then the pair of the images are analyzed by a tumor segmentation
network to generate voxel-wise tumor probability maps, and finally the original and synthesized
images as well as associated probability maps are fed to a classification network to predict the
origin of brain metastases.

24
Fig. 2: Proposed brain tumor segmentation network. (a) The proposed segmentation network
consisting of the four components: the down-sampling branch, up-sampling branch, transformer
bottleneck, and skip connections for the U-net; (b) and (c) the down-sampling and up-sampling
branches respectively; (d) the transformer used as the bottleneck in the U-net; (e) quantitative
comparison between the proposed segmentation network and three competing brain tumor
segmentation networks; (f) visual comparison of validation results between the proposed
segmentation network and three competing segmentation networks (the two top rows show T1
CE results, while the two bottom rows show T2 FLAIR results); and (g) visual comparison of
results without tumor contour information (the two top rows show T1 CE results, while the two
bottom rows show T2 FLAIR results).

25
Fig. 3: Proposed cycleGAN for modality transfer. (a) The schematic of the cycleGAN
consisting of two generators and two discriminators, where Generator 1 transforms T1 CE to T2
FLAIR, and Generator 2 generates T2 FLAIR from T1 CE. In the training process, mutual
information is used to find the most similar slice from the corresponding modality scan of the same
patient for weakly supervised learning; and (b) representative modality transferred results, where
the first row shows the original T1 CE images, the second row gives the modality transferred T2
FLAIR images from the first row, the third row shows the original T2 FLAIR images, and the fourth
row gives the modality transferred T1 CE images from the third row. The left two columns present
the validation results, and the T2 FLAIR images are the most similar images with the T1 CE
images in the same column. The right two columns present the modality transferred results on
two patients with only one modality, where the top two rows show a subject with T1 CE image
and their corresponding modality transfer result, and the bottom two rows show a subject with T2
FLAIR image and their corresponding modality transfer result.

26
Fig. 4: Proposed brain metastases classification network and its diagnostic performance.
(a) The proposed classification network consisting of two feature extraction branches, where the
probability maps are gradually down-sampled via 3D maximum pooling and concatenated to the
features from the two branches. There is an attention module to combine features extracted from
T1 CE and T2 FLAIR branches. Then, two fully connected layers are used to generate the final
classification outcome; (b) the attention module consisting of a channel attention branch and a
spatial attention branch (in the channel attention branch, feature maps are first converted into
vectors via 3D global averaging, then two fully connected layers calculate the weight for each
channel, and finally feature maps are channel-wise multiplied by channel weights. In the spatial
attention branch, feature maps are first channel-wise averaged, the weight in each voxel is
determined via sigmoid activation, and finally features maps are voxel-wise multiplied by weights.
The outputs of channel-attention and spatial attention branches are element-wise added to form
new feature maps); (c) the 10-fold cross-validation results on five-class classification; (d) the
ablation study results (“With Prob” shows the overall result, “Without Prob” shows the result
without adding probability maps; “T2 FLAIR Only” shows the result only using T2 FLAIR images
for the classification, and “T1 CE Only” shows the result only using T1 CE images for the
classification); (e) the confusion matrix for the five-class classification; (f) the ROC curves; and
(g) the ROC curves in the ablation study.

27
Supplementary Fig 1. Comparison of the cycleGAN and style-transfer network on modality
transfer. The first column shows original T1 CE images, second and third columns show modality
transferred T2 FLAIR results from images in the first row using the cycleGAN and style-transfer
network. The fourth column shows original T2 FLAIR images, fifth and sixth columns show
modality transferred T1 CE results from images in the fourth row using the cycleGAN and style-
transfer network.

28
Supplementary Table 1. Structure of the proposed segmentation network. s: stride. p: padding.
in_ch: input channel, out_ch: output channel.
Down-sampling block Segmentation network
Layer name Structure Layer name Structure
Conv1 1×1, s=1, p=0, in_ch=a,
out_ch=b Conv1
3×3, s=1, p=1, in_ch=1, out_ch=32
Group normalization num=32, ch=b DB1_1 a=32, b=32, c=32, d=2
Conv2 3×3, s=d, p=1, in_ch=b,
out_ch=b DB1_2 a=32, b=32, c=64, d=1
Group normalization num=32, ch=b DB2_1 a=64, b=64, c=64, d=2
Conv3 1×1, s=1, p=0, in_ch=b,
out_ch=c DB2_2 a=64, b=64, c=128, d=1
Group normalization num=32, ch=b DB3_1 a=128, b=128, c=128, d=2
Conv4 1×1, s=d, p=0, in_ch=a,
out_ch=c DB3_2 a=128, b=128, c=256, d=1
Group normalization num=32, ch=b DB4_1 a=256, b=256, c=256, d=2
Up-sampling block DB4_2 a=256, b=256, c=512, d=1
Layer name Structure DB5_1 a=512, b=512, c=512, d=2
Conv1 3×3, s=1, p=1, in_ch=a,
out_ch=b DB5_2 a=512, b=512, c=1024, d=1
Group normalization num=32, ch=b Conv2 3×3, s=1, p=1, in_ch=1024,
out_ch=768
Conv2 3×3, s=d, p=1, in_ch=b,
out_ch=b Transformer × 12 -
Group normalization num=32, ch=b Conv3 3×3, s=1, p=1, in_ch=768,
out_ch=1024
Upsampling scale=2 UB1 a=2048,b=512
Transformer UB2 a=1024,b=256
Name Structure UB3 a=512,b=128
Head 12 UB4 a=256,b=64
Hidden dimension 768 UB5 a=128,b=32
Feed forward fully connected layer 1
in_dim=768, out_dim=768*4 Conv4 3×3, s=1, p=1, in_ch=32,
out_ch=2 Feed forward fully connected layer 2
in_dim=768*4, out_dim=768

29
Supplementary Table 2. Structure of the proposed classification network.
Classification network
Layer name Structure
Conv1 3×3×3, s=2, p=1, in_ch=2, out_ch=32
DB1 a=33, b=32, c=32, d=(2,2,2)
DB2 a=33, b=32, c=64, d=(1,2,2)
DB3 a=65, b=64, c=64, d=(2,2,2)
DB4 a=65, b=64, c=128, d=(1,2,2)
DB5 a=129, b=128, c=128, d=(2,2,2)
Attention module FC1: in_dim=256, out_dim=16 FC2: in_dim=16, out_dim=128
FC1 in_dim=256*8*8*8, out_dim=128
FC1 in_dim=128, out_dim=5