
A transformative force in EHS - The Campbell Institute › wp-content › ...A transformative force...
47
CONTACT INFORMATION Campbell Institute NATIONAL SAFETY COUNCIL CALL (630) 775-2063 WEB thecampbellinstitute.org EMAIL [email protected] 1012 900001825 ©2012 NATIONAL SAFETY COUNCIL A transformative force in EHS THIS LEADING-EDGE KNOWLEDGE IS BROUGHT TO YOU BY THE CAMPBELL INSTITUTE
Transcript of A transformative force in EHS - The Campbell Institute › wp-content › ...A transformative force...

CONTACT INFORMATION
Campbell Institutenational safety council
call (630) 775-2063
web thecampbellinstitute.org
email [email protected] 900001825 ©2012 national safety council
A transformative force in EHS
this leading-edge knowledge is brought to you by the campbell institute

- 1 -
Executive Edge Track NSC Congress & Expo 2009
Executive Edge Session A (Technical Session 25)
Leading-Edge Management: Leading Indicators & Risk
Management
Moderator: Rick Kroon, Intel
Joe Stough, Syntex Management Systems
Glenn Murray, ExxonMobil

Executive Edge Track NSC Congress & Expo 2009
- 2 -
risk management &
leading metrics
“establishing a continuous improvement platform
with process-based leading indicators”
National Safety Council – 2009 Congress & Expo
Executive Edge: Session A
26 October 2009
Joe Stough, Syntex Management Systems, Founder & EVP

Executive Edge Track NSC Congress & Expo 2009
- 3 -
Agenda
The data to find leading indicators
– Risk management and other risk reduction processes
– Objectives of leading indicator initiative
Some key terms and concepts
– What is a leading indicator?
Overview of leading indicator initiative
– Research:
• Finding math-grounded leading indicators
– Implementation:
• Using leading indicator benchmarks on management KPI scorecards
Summation

Executive Edge Track NSC Congress & Expo 2009
- 4 -
Risk Management Risk Reduction Processes
1) hazard
perception
2) hazard
identification/
recognition
3) hazard analysis/
risk assessment
4) risk
mitigation
risk management
risk perception
This Presentation: (A) Researching data per the full lifecycle
(B) Implementing leading indicator KPIs
The Purpose:
Systematically,
Measurably,
Reduce Exposure
to Risk
Risk Management “Continuum” = the full lifecycle of risk reduction processes

Executive Edge Track NSC Congress & Expo 2009
- 5 -
Data per Full Risk Management Continuum
Reduced Iterate Where
Applicable
Sources of
Exposure
Risk Reduction
Process Lifecycle
Event
Data
Hazard Identification /
Recognition
Risk
Matrix Hazard Analysis /
Risk Assessment
Causes /
Findings
Action
Items
Risk Mitigation
A “mature” risk reduction management approach involves the full lifecycle.
But other less mature events also result in risk reduction. And many of those
events are more “frequent” / routine – resulting in more data for measurement.
Proactive
Events H
i Med
Low
No Loss
Exposure to Loss
Reported
Hazard Perception
Researching the data from database software which enables the full risk reduction process lifecycle…

Executive Edge Track NSC Congress & Expo 2009
- 6 -
More Data per Incidents / Near-miss Process
Event
Data
Risk
Matrix
Causes /
Findings
Action
Items
Reported
Reduced Iterate Where
Applicable
Sources of
Exposure
Risk Reduction
Process Lifecycle
Reactive
H
i Me
d Low
No Loss
Exposure to Loss
Data from organizations who
apply a risk matrix to score
risk level of each event
Data on time taken to execute
EACH STEP within the full lifecycle
from “reported” to “closed”
Data from organizations who
assess causes for incidents /
near misses
(map to mgmt system elements)
Data on involvement of leaders to
take accountability for action
Data on timeliness of
action completion
Data on workforce participation in
reporting of incidents / near-misses
Detailed data from incidents
and near miss events

Executive Edge Track NSC Congress & Expo 2009
- 7 -
A Statistically Significant Data Set
Using a common data model for – Incidents, investigations, observations,
audits, action items, etc…
– Worker involvement in above
Millions of records of data – Spanning > 100 countries
– In 24 different languages
Users of IMPACT software – Each company with a central database
of events and actions
Statistically analyzed a “sample” data set – Studied data from over 100 organizational units
• Over 60 with observation data
– Defined over 200 “leading metrics” defined
– Studied correlations to TRIR • Looking for leading metrics which affect Safety outcomes

Executive Edge Track NSC Congress & Expo 2009
- 8 -
Event
Data
Risk
Matrix
Root Cause /
OIMS Elements
Action
Items
Reported
Reduced
Iterate Where
Applicable
Sources of
Exposure
Risk Reduction
Cycle
Full Risk Reduction Process Lifecycle
Event Reporting Metrics: Worker reporting at bottom of pyramid.
Rate and distribution of proactive involvement.
Action Management Metrics: Percent of actions complete on-time.
Risk-weighted on-time completion rate.
Rate and timeliness of past-due action items.
H
i Me
d Low
No Loss
Exposure to Loss
Leadership and Process Metrics: Responsiveness, consistency,
timeliness, and completeness of
each step in the process lifecycle
Research: Process-based Metrics per Full Lifecycle
Defined over 200 metrics and
assessed correlations to TRIR…
Objective: Use data and math to find actionable, process-based leading indicators

Executive Edge Track NSC Congress & Expo 2009
- 9 -
Implementation: Management KPI Scorecard
• Typically calculated as 12 Month rolling or YTD performance metrics.
• Benchmarks per internal or external (IMPACT customer-wide) scores.
Objective: Apply the most relevant, meaningful leading indicators as Key Performance
Indicators (KPIs) for leaders to measure and improve

Executive Edge Track NSC Congress & Expo 2009
- 10 -
Key Terms & Definitions

Executive Edge Track NSC Congress & Expo 2009
- 11 -
Some Key Concepts
Histogram: used to assess “variation” in a metric
Number of organizational units (e.g. sites)
Within a specific range of data (metric scores)
You may be using “leading indicators” but…
– Are they as broadly measurable as TRIR (lagging metrics)?
– Are business leaders held accountable to measure / improve them?
– Are they validated with a statistically significant data set?

Executive Edge Track NSC Congress & Expo 2009
- 12 -
Key Term: “Meaningful” Metrics Y
= L
oss R
ate
s
Top 20% (Best Performers)
Bottom 20% (Worst Performers)
Variation in Lagging Performance
Some good and some bad
NO VARIATION in leading metric
No differentiation of good from bad
VARIATION in leading metric
OPPORTUNITY to improve
Meaningful leading metrics are “actionable” and help answer the question:
“What are the BEST performers doing differently?”
WORST BEST

Executive Edge Track NSC Congress & Expo 2009
- 13 -
Key Terms
Safety leading indicators – Measures that predict safety outcomes and indicate the impact of
human, organizational and other factors on performance
Leading metric – A measure that has potential to be a leading indicator
– Possibly a “component” of a leading indicator
Predictive ability – The ability of a metric to predict a chosen outcome
• Example: FICO score (used in USA credit ratings) is predictive of a
consumer’s likelihood to re-pay loans
– Correlations make it possible to use the value of one variable to
predict the value of another.

Executive Edge Track NSC Congress & Expo 2009
- 14 -
Key Term: Correlation
Definition
– "Co-relation" means essentially the same thing as "co-
incidence" or things occurring together. Used to describe
observed relationship between instances of two events.
• A positive correlation means that as one increases, the other
increases as well.
• A negative correlation means that as one increases, the other
decreases.
Notation
– Correlation does NOT imply causation in any way.
– Strong correlation does warrant further investigation to
determine the “cause”

Executive Edge Track NSC Congress & Expo 2009
- 15 -
Example of a Common Misinterpretation
Example Metric: BBS Observation Quantity – In below example, observation quantity goes up as incidents are reduced…
jan mar may jul sep nov jan mar may jul sep nov
Statistically speaking… – Observations ALONE do NOT “predict” better outcome performance
• When studied across a statistically significant data set (> 30 organizations)
– But a high rate of observations may be evidence of a deeper cause
Observations
Total Recordable Incident Rate (TRIR)
Strong Negative Correlation (R2 = -.96)
But be careful with interpretation

Executive Edge Track NSC Congress & Expo 2009
- 16 -
Consider Other Relevant Factors
Organizations with high observation quantity but…
– Leadership NOT responsive to address issues raised via observations
– Corrective actions per observations NOT completed in a timely manner
– Otherwise a generally poor organizational effort to reduce risks…
Would you expect such organizations to sustain good
Safety performance?
– Probably not
We analyzed the data and found
– High observation participation may be evidence of something good
But does NOT stand alone as a “predictive” leading indicator

Executive Edge Track NSC Congress & Expo 2009
- 17 -
Using a Statistically Significant Data Set
Over 60 organizations with varying observation quantity
– A statistically significant sample (need > 30 organizations)
• If there still exists a strong correlation, then maybe it is a leading indicator
– Organization = business unit with contiguous business leadership
• E.g. a manufacturing site, an area / region of small facilities, etc…
Result: Observation quantity alone did NOT predict TRIR
– Prior slide: correlation of Observations to TRIR for one organization
– For statistically significant sample, the correlation did NOT exist
But it was PART of a broader “reporting culture” metric
– Observations along with near miss reporting, other proactive events
Evidence of a leading indicator
– NOT reporting culture alone but combined with
• Leadership responsiveness and accountability
• Timely completion of action items

Executive Edge Track NSC Congress & Expo 2009
- 18 -
Overview of Leading Indicator Initiative
Research: – Finding math-grounded leading indicators
Implementation: – Iteratively improving with leading indicator benchmarks

Executive Edge Track NSC Congress & Expo 2009
- 19 -
Research a Data Set of Risk Reduction Events
H
i Med
Low
No Loss
Exposure to Loss
Service / Product Quality
Injuries / Illnesses
Releases / Spill
Reliability / Equipment Failure
Asset Damage
Security Incident
Reputation Damage
Other “kinds” of loss events….….
Over 1MM incident / near-misses
Behavioral Safety Observations
QHSE Management System Audits
Risk Profiling / Assessments
Financial Assurance (Audits)
Site-level “Walk-through” Audits
ISO 9000 Certification Assessment
Hazard Identification Programs
Hundreds of other processes….
Millions of findings / “deviations”
Action Items Resulting in Risk Reduction
Millions of Action Items
Centralized Database
Scope: The organization’s collection of ALL events that result in risk reduction…

Executive Edge Track NSC Congress & Expo 2009
- 20 -
Research Findings: For the Best Performers…
Event
Data
Risk
Matrix
Causes /
Findings
Action
Items
Reported
Reduced
Iterate Where
Applicable
Risk
Exposure
Risk Reduction
Cycle
ALL types of workers are engaged in
reporting events – incidents, near
misses, observations, etc…
Front-line Supervisors (or SMEs)
are responsive to reported issues
SMEs are disciplined in
executing processes
Leadership promptly accepts
accountability for actions
All workers are diligent in
completing action items
Interpretation: High-performing organizations engage all levels of the workforce
in a collective effort to reduce risks, minimize operational errors, etc…

Executive Edge Track NSC Congress & Expo 2009
- 21 -
Applying the Findings
An Expected Result
– High-performing organizations engage all levels of the
workforce in a collective effort to reduce risks…
Not Only Believable but also Measurable
– Companies gathering data using common methods can…
• Measure / improve such organizational factors
• Share benchmarks
– Apply leading metrics to management reports
• Select relevant, practical KPIs per unique business landscape
• Create scorecards

Executive Edge Track NSC Congress & Expo 2009
- 22 -
Implement: Designing the KPI Dashboard
Select the metrics most APPLICABLE to your company
– Tied to a current initiative, benchmarks per research, etc.
For each selected metric, establish a KPI measurement scale…
– Scale per external / internal benchmarks or specific discrete scale
Iterate annually to re-apply benchmarks / research findings
Good performance per chosen scale
Poor performance per chosen scale
Executive Edge Track NSC Congress & Expo 2009
- 23 -
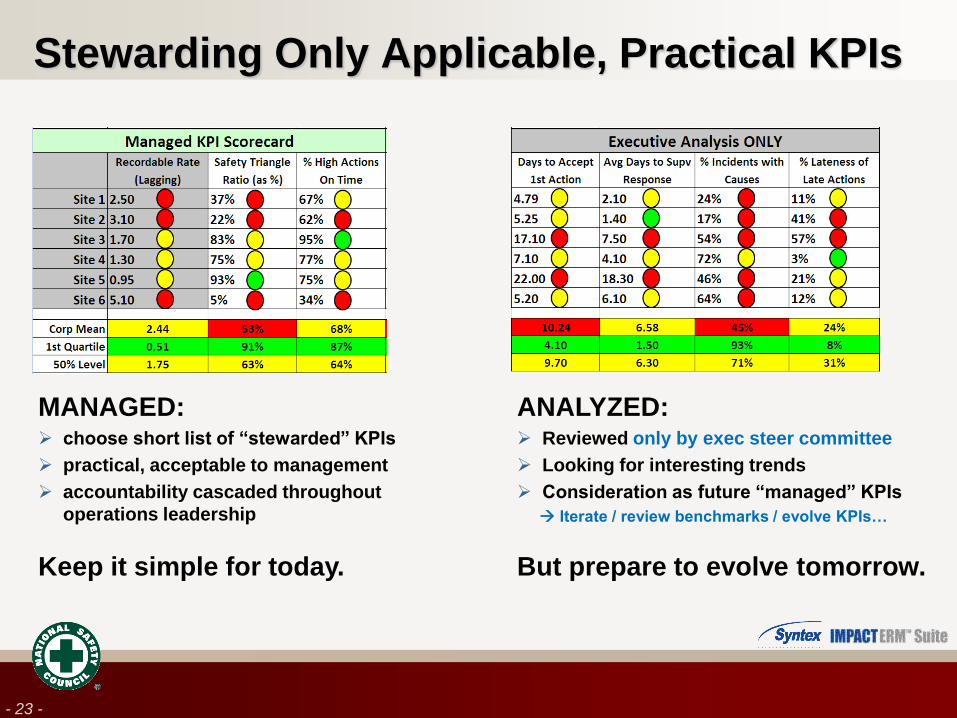
Stewarding Only Applicable, Practical KPIs
MANAGED: choose short list of “stewarded” KPIs
practical, acceptable to management
accountability cascaded throughout
operations leadership
Keep it simple for today.
ANALYZED: Reviewed only by exec steer committee
Looking for interesting trends
Consideration as future “managed” KPIs
Iterate / review benchmarks / evolve KPIs…
But prepare to evolve tomorrow.

Executive Edge Track NSC Congress & Expo 2009
- 24 -
Summation

Executive Edge Track NSC Congress & Expo 2009
- 25 -
Summation
Math-supported factors leading to better performance
– Leading indicators to measure…
• Workforce engagement in event reporting
• Supervisor / organizational responsiveness
• Process discipline (risk assess, mgmt systems, etc.)
• Leadership accountability
• High priority action timeliness
Factors are all “organizational” in nature
– Obviously require leader buy-in to affect
– Establish practical measurements / means to improve
Continuously measure & improve
– Leaders accountable for scorecards of “managed” metrics
– Steering committee to assess trends in advanced metrics
– Iterate periodically (annually) to evolve metrics, continuously improve

Executive Edge Track NSC Congress & Expo 2009
- 26 -
The IMPACT of Proactive Leadership
Actively leading
the organizational
effort to reduce
QHSE risk
Leadership Continuously Monitor & Improve
Workforce engagement, supervisor
responsiveness, process rigor /
discipline, leader accountability,
action item completion timeliness
– Reduced injuries
– Fewer mistakes
– More up-time
– Better productivity
Operations Integrity
Business IMPACT
Thanks!
Joe Stough

- 27 -
Executive Edge Track NSC Congress & Expo 2009
- 27 -
Executive Edge Track NSC Congress & Expo 2009

This presentation includes forward-looking statements. Actual future conditions (including economic conditions, energy demand, and energy supply) could differ
materially due to changes in technology, the development of new supply sources, political events, demographic changes, and other factors discussed herein (and in
Item 1 of ExxonMobil’s latest report on Form 10-K). This material is not to be reproduced without the permission of Exxon Mobil Corporation.
Executive Edge Track NSC Congress & Expo 2009
leading edge management:
risk management &
leading indicators
National Safety Council – 2009 Congress & Expo
Executive Edge: Session A
Technical Session 25
26 October 2009
Glenn Murray, Exxon Mobil Corporation - Safety, Security, Health & Environment
Executive Edge Track NSC Congress & Expo 2009
• effective management of safety, security, health and
environmental risk calls for a systematic approach
• management systems require on-going measurement in
order to determine their effectiveness and to facilitate
continuous improvement – leading (process) and lagging
(results) indicators
• risk management systems (and associated processes,
tools and activities) provide numerous opportunities for
the measurement of leading indicators
introduction
“You can’t manage it if you can’t
measure it . . . “

Executive Edge Track NSC Congress & Expo 2009
• key terms
• risk management
• leading indicators
• risk tolerance
• critical success factors
• review
agenda

Executive Edge Track NSC Congress & Expo 2009
• hazard = potential source of harm
• risk = function of the likelihood of an unwanted incident
combined with the severity of its potential
consequences
• leading versus lagging indicators
– activity or process-oriented
– actionable
– predictive
key terms

Executive Edge Track NSC Congress & Expo 2009
1) hazard
perception
2) hazard
identification/
recognition
3) hazard analysis/
risk assessment
4) risk
mitigation
risk management
risk management
risk perception

Executive Edge Track NSC Congress & Expo 2009
1) hazard
perception
2) hazard
identification/
recognition
3) hazard analysis/
risk assessment
4) risk
mitigation
risk management
risk management
risk perception

Executive Edge Track NSC Congress & Expo 2009
hazard perception
description
• ability to perceive or sense the condition,
situation, or scenario that presents a hazard,
e.g., see it, hear it, feel it
supporting tools, processes & procedures
• training to raise awareness and increase knowledge with respect to human
factors (HF) / ergonomics exposures
• design standards, engineering solutions to address potential HF issues
• operating, maintenance, inspection procedures that reflect HF aspects
potential leading indicators
• HF training completed vs. scheduled; effectiveness of training
• status, progress relative to updates and reviews of design standards and
procedures

Executive Edge Track NSC Congress & Expo 2009
1) hazard
perception
2) hazard
identification/
recognition
3) hazard analysis/
risk assessment
4) risk
mitigation
risk management
risk management
risk perception

Executive Edge Track NSC Congress & Expo 2009
hazard identification/recognition
description
• ability to identify or recognize the condition, situation, or scenario as a
hazard
supporting tools, processes & procedures
• hazard awareness and identification training; job-specific/skills training
• short-service worker programs (e.g., mentoring)
• hazard identification and discovery processes (e.g., job/work
observations, job safety analyses, ‘hazard hunts’)
potential leading indicators
• hazard or skills training completed vs.
scheduled; effectiveness of training
• conduct / quality of job safety analyses,
hazard identification processes

Executive Edge Track NSC Congress & Expo 2009
1) hazard
perception
2) hazard
identification/
recognition
3) hazard analysis/
risk assessment
4) risk
mitigation
risk management
risk management
risk perception

Executive Edge Track NSC Congress & Expo 2009
hazard analysis/risk assessment
description
• ability to assign the appropriate level of risk to a recognized
hazard/scenario
supporting tools, processes & procedures
• risk assessment training
• job safety analysis, task hazard analysis
• process hazard analysis (PHA), hazard and
operability review (HAZOP)
potential leading indicators
• risk assessment training completed vs. scheduled; effectiveness of
training
• conduct of risk assessment activities vs. plan; quality of risk assessment
processes
EA B C D
I
II
III
IV
Probability
Consequence

Executive Edge Track NSC Congress & Expo 2009
1) hazard
perception
2) hazard
identification/
recognition
3) hazard analysis/
risk assessment
4) risk
mitigation
risk management
risk management
risk perception

Executive Edge Track NSC Congress & Expo 2009
risk perception
• risk mitigation (behavior) is influenced by perceived
risk
• based on our experiences and/or knowledge
• making safer choices requires us to understand our
perception of risk
• risk tolerance - acknowledge, recognize, understand it
Executive Edge Track NSC Congress & Expo 2009
risk tolerance
• factors that tend to raise risk tolerance
• overestimating capability and experience
• familiarity
• feeling of control
• role model behaviors
• factors that tend to lower risk tolerance
• perceived seriousness of consequences
• personal experience

Executive Edge Track NSC Congress & Expo 2009
risk mitigation
description
• does the worker/team know how to and/or choose to mitigate the risk?
supporting tools, processes & procedures
• incident investigation and root cause analysis
• training
• job observation programs
• site/organizational culture surveys,
diagnostic tools
potential leading indicators
• findings from incident/near-miss investigation and root cause analysis
• ‘at-risk’ versus ‘safe’ behaviors from job observations
• learnings from culture diagnostics relative to quality of training,
competency assurance, risk tolerance, procedural discipline, etc.
• compliance with site safety rules

Executive Edge Track NSC Congress & Expo 2009
critical success factors
• risk management addressed via an integrated SH&E management
system
• structured, disciplined approach
• leading and lagging metrics woven throughout
• follow-up, closure to ensure action items are addressed and
effective
• evaluation, analysis, sharing . . . leads to learning
• line management ownership and accountability for both process
(leading indicators) and results (lagging indicators)
. . . all dependent upon effective execution . . . leadership

Executive Edge Track NSC Congress & Expo 2009
review
• ‘hazard’ versus ‘risk’
• risk management as a continuum - processes, procedures,
and tools at each step
• leading indicators to evaluate activity levels, quality of
execution
• drive behaviors, actions
• predict performance
• understand risk tolerance
• critical success factors
• integrated SSH&E management systems
• follow-up, closure
• learning
• leadership

Executive Edge Track NSC Congress & Expo 2009
risk management &
leading metrics
This presentation includes forward-looking statements. Actual future conditions (including economic conditions, energy demand, and energy supply) could differ
materially due to changes in technology, the development of new supply sources, political events, demographic changes, and other factors discussed herein (and in
Item 1 of ExxonMobil’s latest report on Form 10-K). This material is not to be reproduced without the permission of Exxon Mobil Corporation.
National Safety Council – 2009 Congress & Expo
Executive Edge: Session A
Technical Session 25
26 October 2009
Glenn Murray, Exxon Mobil Corporation - Safety, Security, Health & Environment

- 46 -
Executive Edge Track NSC Congress & Expo 2009
What’s Next? Return to this room tomorrow 1:30-3:00 for
Executive Edge Session B
World-Class Leadership: Lead with Safety (Technical Session 46)
And Then... Here again 3:30-5:00 for
Executive Edge Session C
Driving EHS Performance: Effective System
Implementation (Technical Session 72)
Workshops on Wednesday morning
Rooms 311E-G (Pre-registered participants)