A TRAINING COURSE IN SAMPLING CONCEPTS … SAMPLING CONCEPTS FOR AGRICULTURAL SURVEYS By ......
90
- - A TRAINING COURSE IN SAMPLING CONCEPTS FOR AGRICULTURAL SURVEYS r-~ STATISTICAL REPORTING ~" SERVICE U.S. DEPARTMENT OF AGRICULTURE SRS NO.21
Transcript of A TRAINING COURSE IN SAMPLING CONCEPTS … SAMPLING CONCEPTS FOR AGRICULTURAL SURVEYS By ......

-
-
A TRAINING COURSEIN SAMPLING CONCEPTS
FOR AGRICULTURAL SURVEYS
r-~ STATISTICAL REPORTING~ " SERVICE
U.S. DEPARTMENTOF AGRICULTURE
SRSNO.21
A TRAINING COURSE. IN
SAMPLING CONCEPTS FOR AGRICULTURAL SURVEYS
By
Harold F. HuddlestonStatistical Reporting Service
USDA
April 1976
(Revised November 19RO)

PREFACE
This set of training materials on conducting agricultural statistical programsis the result of experience in training and consulting with officials of foreigngovernments, and reflects the needs encountered by personnel who have engaged insimilar domestic assignments. The materials describe the sampling considerationscommonly required in collecting current agricultural data and providing evaluationsof agricultural census procedures. The approach used in presenting these materialsis that of a discussion of the concepts followed by a relatively simple illustra-tion. When possible, a real example is presented in wl]ich the participants completea given unit of work. This approach is designed to satisfy the needs of SurveYpersonnel and administrators who will have responsibilities for carrying out sur-veys and who must be familiar with the essential concepts of sampling. Tt isbelieved that the demonstration of the interrelationships between different surveyactivities and alternative uses of information (that is, resources) should also hebeneficial.
One of the main objectives in preparing this module was to provide a fairlvcomplete set of materials for use in foreign training. A short training courseconsisting of 40 to 50 hours along with informal discussions over a period of twoweeks is believed a feasible undertaking. The training materials are divided intofour subsections as follows: (1) an overview of sampl ing, (2) construction ofsampling frames, (3) random selection techniques, and (4) examples of agriculturalsurveys including the preparation of estimates.
It is necessary to emphasize that this training module is not intended to bea self-instruction manual, hut rather an aid to he used hy an instructor eX!lcriencedin sampling principles. Also, it is assumed that the participants in charg~ ofmanaging surveys will obtain additional training in sampling theory and surveydesign.
,Jo-r£: ~ (11q1)~ CJtrhJ£fJ V[~ IOrV AJ) OtsN l T co/-trt1 IN NUI1[ /(OI.{S Co lI..~SE
AA~Tf~(ItL5 -5cA.LH A--S t1ItPS J-.(SI/lV~5 PHOTOS SI/TELLITEr'n })).pittA) [",e. !tJCL(,4i)tJ) /N ..sCl\tJt\1';J) J]oCl.{M[tVT-S pol(CorJCfP,S orJ~Y - Aio ~o/IJ0ER A T,4/1/NING .JJOCl{MEf'JT"
i

ACKNOWLEDGEMENT
The author wishes tu acknowledge the valuable contributions to this publi-cation provided by several members of the Statistic~l ~0porting Service'sResearch Division: Naomi Kl~us, to area frame constru~tion; Burgess Guinn,to the list materials; and P3ul Hopkins, to the d~velupment of the computerprograms. Encouragement to undertake the effort was provided by C. John Fliginger,formerly International Programs Officer for the Statistical Reporting Service.
ii

1.1.11.1.21.1.3
1.2 Survey1.2.11.2.21.2.31.2.4
CONTENTS
Page
CHAPTER 1 - AN OVERVIEW OF SAMPLING1.1 Concepts Underlying the Sampling Procedure 1
Information To Be Obtained 1How Good Is Our Information? 3Use of Information in the Application of Sampling Theory 6
Strategies Based on Auxiliary Information 7Method of Selection 7Method of Estimation Using Auxiliary Information., 9Stratification of Units 10Exercises 1 and 2 11
1.3 Acquisition of the Sampling Frame 121.3.1 Characteristics of Frames 121.3.2 Source Materials for Construction of Sampling Frames 141.3.3 Types of Frames Used in Sampling Work 14
CHAPTER 2 - CONSTRUCTION OF SAMPLING FRAMES2.1 Introduction 16
2.2 Construction of an Area Frame for the Dominican Republic 172.2.1 Stratification Based on Land Use 172.2.2 Construction of Primary Frame Units 212.2.3 Assembling Frame Units for Sampling 23
2.3 Use of Satellite Photograph in Constructing an Area Frame 232.3.1 Stratification of Primary Land Use Features 24
2.4 List Frame Construction 242.4.1 List Frame Development 242.4.2 Steps in Frame Construction Based on Name-Address Lists 252.4.3 Exercises 3 and 4 26
iii

CHAPTER 3 - RANDOMSEt!':,,:T r UN TECHNIl{UES
3.1 Introduction .
Page
63
3.2 Simple
3.2.1
3.2.2
3.3 Random
3.3.1
3.3.2
3.3.3
3.3.4
3.3.5
Rando[') S:ullpling .
Samp 1 LH; '1ith Replacl'ment .
Sampl ing I.Hthout Replacement .
System:lt i.:' Sampling .
UnclusttrC'd Units in the Frame .
Sampl ini' from the Dominican Republic' Frame .["
) .Samr1 ing from a List Frame .
EXer\' iSl 0 .
63
63
65
6666
6871
71
72
CHAPTER 4 - EXMlPLES CiF ,\(~RICULTURAL SURVEYS
4. 1 In trod ue t ion . 77
4.2 Some Design C,msiderations 77
4.2.1 High (l1St of Identifying Elements fur Special Groups 78
4.2.2 High C:,),;t of Information per Unit 79
4.2.3 Unknll\.Jn ('per a tiona 1 Cas t s 79
4.2.4 Use of ]';'ppr Strata 80
4.3 Coffee Sun'l'" in the Dominican Repuhlic 81
4.3.1 Baekg;'lIlltd and Design 81
4.3.2 CalcuLI! jng Estimates and SampLing Errors ..........•...... 84
4. 3 . 3 Pos t S 11n' l 'v Ana 1y s is 85
4.3.4 Exer,' iSt' 7 87
4.4 Tunisian Acrc'ai~l' and Livestock Survey 91
4.4.1 Backt~rolll1d ........................................•....... 91
4.4.2 Calculating Estimates and Samplin\' f·:rrors 94
4 . 4 . 3 Po s t s !Ir v I > V An a 1y s is 9 5
4 . 4 • 4 Exl' rei s e 8 ...••...•....•.•..............••...••.•••.•••... 97
iv

Page
CHAPTER 5 - USE OF SEVERi\L FRAt-lES [N SAMPLI;\lC
5.1 Introduction q~
5.2 Example of Representing a Population in THO FramE's Y9
5.2.1 Population Units Related to Frame A 103
5.2.2 Population Units Related to Frame B 104
5.2.3 Population Units Related to Frames A and B 104
5.2.4 Variance of THo-Frame Estimator. 108
5.2.5 Exercises 9 and 10 108
5.3 THo-Frame Theory 109
5.3.1 Two-Frame Methodology 109
5.3.2 Notation [or T~.;o-Frame Surveys 109
5.3.3 Estimation of Population Totals and I'lL'ilns 111
5.3.4 Determin,Jtion of Fixed Weights (p and q) forOne-Survey Characteristic 114
5.3.5 Assumption of Eq\Iality of 'leans for "Ovcrl<1p" Dc'm,lins .. llh
5.3.6 The Special Case of Frame A \Hth 100 Percent Coverage .. 117
5.3.7 Different Units in Frames With Overlappin~Ch ar act e r i s tic s 1 1 7
5.3.8 Exercises 11,12, ,1l1cl13 118
TRAININC SET III - Materials for Salcedo Province Exercise
TRAININC SET 112 - Stages of Frame Deve]opment
TRAINING SET iJ3 - Materials for Exercises on Two-Frame Surveys
APPENDIX - Machine Processing of Data Using a Computer
v

CHAPTER 1 - AN OVERVIEW OF SAMPLING
1.1 Concepts Underlying the Sampling ProcedureInformation is needed about a group or a universe of objects such as persons,
farms, or firms. We examine only some of the objects and extend our findings tothe whole group. There are four elements in the process: (1) constructing theframe to cover the population of interest, (2) selecting the sample, (3) collectingthe information, and (4) making an inference about the population. These elementscannot generally be considered in isolation from one another. Frame construction,sample selection, data collection, and estimation are all interwoven and each hasan impact on the others.
1.1.1 Information To Be ObtainedThe information to be secured depends on the purpose for which the data
are to be used. However, several basic concepts are required.
A. The universe to be sampled needs to be defined. Are we going to samplepeople, farms, households, etc.? In all cases, we shall be talking abouta finite universe. That is, the group of objects or sampling units con-tained in the universe is limited.
B. For the universe defined, we shall be interested in one or more populationcharacteristics which represent different sets of measurements to be ob-tained. These population characteristics correspond to content items onthe questionnaire or reporting form. For example, for each of the uni-verses mentioned above, we might be interested in the following populationcharacteristics.
Universe of
People
Farms
Households
Population Characteristics
Years of schooling; days withillness
Acres of corn; acres ofwheat; number of cattle
Number of persons in house-hold; or income per household
C. Four common types of estimates are required:(1) The population mean for the characteristic--such as persons per house-
hold.

(2) Population total for characteristic--such as acres of corn.
(3) Population proportion for characteristic--Sl1Ch as persons enrolled inschool divideJ hy total number of persons in population.
(4) Population ratio for two characteristics--s~ch as income spent on foodto value of housing unit, or quintals of maize harvested divided byhectares of maize harvested.
Each of these types of estimates is defined in terms of population quanti-ties. Thus, we refer to them as population "paramet E~rs." We define each ofthese below in mathematical terms where the symbols v. and x. represent measure-
. 1 1
ments of characteristics for an individual unit in a universe of N objects. Insome cases the interest centers on whether the unit has a certain character-istic, in which case, v.(J) indicates the unit has the ch~racteristic and y.(O). 1 1
that it does not.
(1) Population Mean . Y
N~y.
i=llN
yN' Hectares nf Maize per Sampling Unit.
(2) Population Total' Y = NY, Hectares of Haizl' for All Sampling Units.
(3) Population Propo~tion ~ P
N'iy. (1)
i=llNZy. (lor 0)
i=ll
Number of personsenrolled in schoolTotal number of persons
(4) Population Ratio' R YX
NYNlC
y Quintals of Maize HarvestedX' Jlectares of Maize Harvested'
The purpose of sampling is to provide estimates of these parameters based on asample of the units from the universe. The estimatl's obtained from the sampleare referred to as "statistics." The mathematical form used to provide theestimate from the sample is referred to as the "~st imator." Many of the esti-mators look very much like the population parameter, i.e., they are "copies" ofthe parameter. However, modern sampling theory has developed many alternativeestimators whose properties need to be known to avold their indiscriminate use.
2

1.1.2 How Good Is Our Information?A. Sampling Errors
For whatever type of estimate we may be interested in, we hope the"sampling error" will be small. This we measure primarily by the con-centration of the sample estimates around their expected value for ahypothetical population. The expected value is the mean value of all thepossible estimates based on a given estimator and sample size. Thismeasure of concentration is provided by the sampling error of the esti-mator. Actually, it is not necessary to draw all possible samples to geta measure of the extent by which sample estimates differ from the expectedvalue. By using sampling theory, it can be shown that, in simple randomsamples of size n (fixed sample size), the population variance of thesample mean y for selection without replacement is given by
1 (1 _ ~) S2 , where (1 - -Nn) is the finite populationn N y
correction factor,
1 N - 2N-l !: (y i - Y) , and Y
The sampling error of the mean is frequently needed, and is defined asthe positive square root of the variance of the estimate. In addition,the relative sampling error is commonly used and referred to as the co-efficient of variation of y, i.e. eV(Y). Thus, there are several ways ofexpressing the precision of the estimate.
(1) The relative error is:
evey) IV0y
(2) Another way of expressing the precision of our estimate is by use ofconfidence intervals for normally distributed means, such as:
y ± 2 Iv (y )
or y I 3 ,Iv (y) .
The choice of the multiplier 2 or 3 depends on the degree of certaintywith which we desire to make statements about the interval containing the
3

population mean. "·fl,· l' robab i lit i l'S assoc ia t ('d \, [ t h t hl' can f id~nl·e in t L'r-
vals arc called c()I;f;dl'nce coefficients. 1n Illt- ,lisclI::isio!1s in Section L.:',we will use the r;l1lgl' lli" the estimates ratl,(',' ! I,d r the sampling error [or
comparative purposl's. The range is an effici. r,t mvilsun' of vari.-,hi 1 itv
for small samples (n 20), consequently it ~i ~,e s it ~is f act 0 r y f ()r 011 r
purpose and easier- l" obtain.
B. Nonsampling Errors
It is too commonly ac;sumeu that there ~lre I~O 1-' l'l'rl ing l'rrors in thl' data
collected. Actui11Iv. errors of measurement or n'.-';l'onSI'S ar~ almost illwavs
present when in[ornlt ion is collected. The pr(,(,ll'I:1 ie; hmv to form \JsLlful
estimates from thl' sample in tl11' presencl' of ,,,'['h l'rrors. Let lie' stilrt
with a simple modl'I t I' make the ideas clear. ;1 thL' truC' figure' is \',
we will observe or 111l':IS\Jre a quantity y = \, + t 1",liI'n' t' is till' nonsam-
establishments, tIll' '·",peeted valuL" of the sam)":,
pIing error with E(l'l = 0 and V(e) = K.
(the population mV;ill). But the error of t!'.t' ,'!
Lilke a sample of
J:lCill1 \\'111 be E<Y) + E(~)= y
1:1,lte is: V(v) + V(~) which
is larger than th, v,ll"Lmce obtained when 1lC\I';, ,1:;I;t-l'lllL'llts l1r respon,;e erro1'~;
are present.
increased. If, I](l\."":l'r, the errors arL' dL,Jih'I,JI, (Ill tIll' pdrt u! the
respondent, E(e) ,,<:11 not be 0 and the estilJl:lt\ suhjl:'ct to ;j l'ias.
Frequently, larger ,':~tablishments \vill un"l•.r:;;;ll,' till' value of the charac-
teristic we arc irJtt'rt'sted in and the sm31 h'l" I 11f"~ wi 11 also understate the
true v~llue. 1',,") tilt' saml' C'sLlhlishment
,.;ill differ from il1tt lvie\Ver to interviewL'r."ll<"t interviewers have their
cult situ.:Jtion C1111't"'Ilting us. The inflIIL'l1('l" ,r the' interviev.rcTS is
('ommonly control1l'd I,'. using replicated s:1I1]11,' ;!I'd assignin~ c:1('h intcr-
viewer one or mort' c;,lflpling units in each ";1['1]']\ Replicated sampling is
discussed in mort' ,I,,! ai] later. Further. ;In ;11 t. i,,]'t is made to minimize
these errors hy qlrl";! il1nnaire design and ,'llUl'l"1 ;i' t1l training. Thus, \<ll' em
see there arc man'.' kinds of errors involvL'd ,,'lit 11 data arc colll,(,tcd from ;1
Suppose vie viant t (1 estimate the aVE-Llf'l' litH hel of empll1vees of a
universe of busirwss firms by taking a sampl,' "f i'llsiness firms. Somefirms may not knO\v tIll' exact numher of eml']"';"1 '-. 1,<l(1rking on a given date;
4

some may overstate it as a matter of prestige; a few may refuse to give theinformation; in a few cases, the enumerator may record the answer incor-rectly; in processing the data errors will be made; etc. Thus, errors ofvarious types may creep into the results. These errors are present whetheryou take a sample or interview every unit in the universe (census). Thereare also errors arising from unclear definitions either in the question-naire or in the instructions to the enumerators. Also, you may not defineall the terms with mathematical exactitude and so you may not know exactlywhat you want to measure. This brings about errors.
Some of the errors in the data are of the random type; that is, theyaverage to zero over the sample. This is generally the case when theerrors are not deliberate or intentional. Some units will be overstatedand others will be understated, resulting in a net difference near O.There are other errors of a systematic type which are more serious. Thistype of error will not cancel out over the sample, but will persist. Sucherrors are called systematic errors.
C. Sample SizeIt is generally assumed that the larger the sample the more reliable ourinformation will be. Certainly this is true for errors due to samplingand technical biases in the estimator used. However, for most sources ofnonsampling errors the reverse is true: the larger the sample becomes,the nlore likely additional errors are to be present and to be serious.
Sampling technicians are generally fully aware of sampling errors anubiases due to the estimator used, but may be unfamiliar with or unable toassess the impact of nonsampling errors on the survey. Also, the datauser may be unable to evaluate the seriousness of nonsampling errors.Thus, it becomes almost mandatory to either pretest the survey proceduresthe first time it is conducted or to do a postsurvey evaluation to measurethe extent of these errors. Likewise, surveys which are repeated at givenintervals of time may be expected to be subject to additional sources ofnonsampling errors due to longevity. Thus, it is essential to provideresources to keep these various sources of errors in balance. In thetypical sample survey, sampling errors should be the major sources oferror, while in the typical census undertaking nonsampling errors arealmost always the major source of errors. Thus, the choice between a
5

sample and a comp Letl' census is primarily biJsl'd on considerations other
than the level of errors, such as data need,.; ,lnd objectives:
(1) How soon are the data needed?
(2) How much ,1l~t a i I is required for suhuniverses or . ?regIons.
(3) How much money is available?
(4) How lan~l' and what type of organi/at iun is available to manage
the work!
The control of sampling errors requirE's I'r~vious knowledge of param-
eters such as meCln,.;, variances, ranges, ur shq,' of distribution for
population charactcrLstics.
We shall not ('::lmine the use of all th"8l' sources for determining
sample size at this time, but merely point nul onE' way of using knowledge
of the coefficil:'nt of variation. How m,m'y sa"ljlll' units n should be taken
from a universe (1\ '\ units? If previous information indicates what Y and
Sy are, then thL' eve\,) can be used to est im:lt,· j 11,' approximate sample size
required, since
CV(y) [le(1n
Relative Error All'\'w:lhle
where the CV (y) :!Ill! lhe relative error are sl.l t.l'd in the same terms, i. e. ,
either as percent:1Fl's or as decimal fral'liuns.
The purposE' of sample surVL'Y design i:-,; L,\ find ways uf using informa-
tion and sampl inr theory to reduce lhl:' S3mpIl' :~j ze or the errors in the
estimate through the selection technique, l'c;l il:lat ion method, or grouping
the universe units into strata.
1.1. 3 Use of Inforn~~tJ~'El __j.n the Applicatio!l_(~r >';lclJ~_~i__n£.)'heorL
Collecting daLl i~i dependent upon using ~';:1'1'i,1illg theory. However, the
application of sampl iT1i' theory requi res some kIWI>,] c'dgL' of means, variances,
universe size, and ol!ll'r parameters if.:In effieic'nl survey plan is to be
employed. If such kllU\.:1cdge is not availab1c [nIT earlier surveys or censuses,
the plan will almost surely not be as efficient ;1:-'; L'ould be devised with it.
However, valuable inlurmation may exist in tlw f"nn of what is referred to as
"supplementary infon:1al jon," or "auxiliary infonn:ltion." It is not unusual to
find that some information is already availed:>le ;--ur the various units composing
the universe. For l'x;mple: (1) the number of inhahj tants (or farms) in differ-
ent villages may be known from a previous census, Dr (2) geographical areas
6

based on cadastral maps may be determined, or (3) areas by broad categories ofland use may be available from photographs. It is important to make use ofthis information for improving the precision of the estimates. This supple-mentary information about some variable x may be used in a variety of ways,such as:
A. Selection of sampling units with probability proportional to x if informa-tion is available for the individual units, or
B. The available information may be used to form different estimators, suchas:
Reciprocal of probability of selection estimate (requires N)Ratio type estimate,
(1)(2)
(3)
(4)
Difference estimate,Regression estimate,
} (require auxiliary variab1e(s»
c. Stratification of units into groups on the basis of information about x.An attempt is made to make the strata (or groups) internally homogeneousby placing in the same stratum units which appear !Q be similar. For thispurpose it is not necessary that quantitative values of x be available,but only that the units be similar.
1.2 Survey Strategies Based on Auxiliary Information1.2.1 Method of SelectionA. Equal Probability Sampling
(1) The selection of each unit with the same probability constitutes thefundamental method of sample selection. From a universe of N unitsselect one by giving equal probability (~) to all units. Make arecord of the unit selected and return it to the universe. If thisoperation is performed n times, we get a simple random sample of nunits, selected with replacement.
(2) If this procedure is continued till n distinct units are selected butall repetitions are ignored, a simple random sample of n units,selected without replacement is obtained. An alternative procedureis to select the first unit with probability~, the second unit withprobability N:I' the third unit with probability N:2' , thelast unit with probability N 1 1. It can be shown that for either of-n+these schemes of nonreplacement sampling that the probability of a
1specified sample of n units, ignoring order, is(N) •n
7

The esti'TI.ll ion of the sample mean lot' \,ith rL'placement and non-
replacement '-'lTlIpling is the same, but tI,e ,c;jmpling error differs by
the constant cnJ1c:iplier known as the "finite population correction
factor." This f:lctor is (l - fP for wit II II'placement sampling and
(I-E.) f I I'N _or ndnr,.'p acement samp lng. ThL' I nils are selected for both
schemes by use t) I' a random-number tab Ie Ct)f- t ;lining the integers from
1 to N.
B. Unequal Probabilitv or Sampling
Another method which t::J1l often be used to ill'llit'\I' r,n2ater concentr;jtion of
the sample estimates .lround the expected va!lll' I,; to make use of informa-
tion available for a '/ariable x for each of lh,' :-; units. It is nel'essary
that the variabh' x "" positively correlClt('d \,it), the characteristic being
estimated. The folltH"ing example of a univerc;(' of units is given in
table 1 below. The units are selected bv 1IS(' .>1 <l table of random numbers
containing the intt'r.;t'-S from I to X = 250. TIIII', the prob:1bility of
selecting unit 1i'3 is ,l,;reater than that of the I)lller units.
The reciprocil I)' the probability est im"t,l) of the mean based on a
single unit is: y,- 1
inspecting the last
I' ,N for either EP or liEI' ,-;,!mpling. It is clear from1
"l!umn on the right that un( Cjuo.l probability selection,
in this case, leads tn a greater concentration I,f the estimates around the
mean based on samplc~ "f size 1. The ran~t' (If t he estimates [or EP sampling
is 9-67 and for LiEf' ":.2.50-30.00. The expect('d \;due for both methods is
27.0 and ha s the p rop,-' r ty of be ing lInb i:1sed ('\'1'[' t hough the ine! i vi dua 1 un i t
estimates are aVIT] using different scl~-; uf l,robabilities.

Table l--Small universe of 10 firms giving number of employees per firm
. Unequalx = No. employ- Equal " 0
5 : b b"l° :probablilty:ees yrs. ago pro a l lty b d X: : ase on :
Unitlabel
L
Auxiliaryinformation
Probability ofselecting unit
on first draw
: Number:employees::on survey:
date
y.l
Estimate ofpopulation
mean from unit
EP UEP
1 30 1N
.1 30:250 = .120 31 31 25.83
2
3
4
15
60
18
1N
1N
1N
.1
.1
.1
:---12'250
· 60'250
· 18'-- -'250
.060
.240
.072
15
67
20
15
67
20
25.00
27.92
27.78
5
6
7
12
15
10
1N
1N
1N
.1
.1
.1
· 12:250 = .048
· 15:250 - .060
:--1Q -·250 .040
13
18
9
13
18
9
27 .08
30.00
22.50
8 20 1N
.1 :~'250 .080 22 22 27.50
9
10
TotalN = 10 X
45
25
250
1N
1N
1.0
.1
.1
:~-'250 .180
:-.-12 -·250 .100
1.0 y
48
27
270
48
27
26.67
27.00
1.2.2 Method of Estimation Using Auxiliary InformationA. Difference Estimation
The auxiliary information on x is used to estimate the change y - x and thisis added to X, the population mean for the auxiliary variable. Since x andy need not be the same characteristic measured on two different dates, the
9

general form for the difference estimator is n~ [,'Llows:- (x X) ;y = y - K - or for K 1, when x anJ t Tresent the same
characteristic, y = X + (y - x)
where any value of L mny be used (which is detl'ln:ir:.eJ independently of the
survey data) but in diU' example K = 1 since x ;llId V represent the same
characteristic. Fpr ;1Jl estimates obtained from table 1 using the EP method
of selection, E(Y) = .)~'.(), which indicates thL' ,:i! ference estimator is un-
biased, with the Cl1l>',e of the estimates being~!.- L'.
B. Ratio Estimation
Instead of estimating the difference between y :lT1dx we may estimate the
ratio of the means frun the sample and multirlv ic with the known value of
X. The estimator,
y = X ~ is called tl11' "ratio estimator," asslll11ing that x 'I o.x
The estimates are the same as those given in the right-hand column of table 1
when the EP select ion method is used. Since .:111 units were selected with EP,
the average of all estimates is 26.728, which shews that this estimator is
not unbiased. How~ver, the range of the estimatls is 22.50-30.00 which is
the same as for the sample mean using the ,wlE'cticm method of UEP.
C. Regression Estimation
Instead of making use )f the value K (which is independent of the survey) in
the difference estimator, we calculate the regression coefficient b from the
sample and use this in place of K. The estimatll!" is Y = y - b(x - X). How-
ever, we cannot use this estimator for a sample [If size n = 1, but require
n 3. This estimatc'!" is expected to be more pn'cise than the difference
or the ratio estimators, hut it is more cumbersorw to l'alculate. In addi-
tion, only approximate formulas for its bias and variance are known. If
"b" were known or ,1vn i lable for a large sample, the est imates for individual
units could be comput ed. For this small un ivn Sf'. "b" = . 9976, and the
estimates derived using this value give a range (If 23.96-32.08, based on
n = 1.
1.2.3 Stratification of Units
Stratification implies that the units in the llniverse are grouped (or strat-
ified) on the basis at inf ormation about some quant i tative or qualitative vari-
able x. An attempt is millie to make the strata intt.'r:lal1y homogeneous by placing
in the same stratum uniL; which appear to be similar. Then by selecting a
sample of a suitable size from each stratum, it is possible to produce an
10

estimate which has considerably smaller sampling error than that given by asimple random sample from the entire population. The 10 units (table 1) aredivided into two strata of 5 units each, based on the X values. The smallestunits: 2, 4, 5, 6, 7 are placed in the first stratum and the remaining unitsin the second stratum. The range of the estimates based on a simple randomsample of one unit from each stratum is 15.5-43.5. If a simple random sampleof size two is taken from the universe of 10 units, the range is 11-57.5. Theresults of 1.2.1, 1.2.2, and 1.2.3 are summarized in table 2.
1.2.4 Exercises 1 and 2Exercise 1:
Each student is to draw all possible random samples of size 2 from thepopulation of 10 units.
(a) Using EP sampling and the difference and ratio estimators, determinethe range of all possible estimates of the population total for thesetwo estimators.
Exercise 2:Each student is to draw all possible random samples of sizes 1 and 2 from
the population stratified into two strata.(a) Same as a) above.(b) Using UEP sampling and the reciprocal of the probability estimator,
determine the range of all possible estimates of the population total,ignoring the order of selecting the two units (i.e., there are 20possible samples,S x 4, in each stratum).
11

Table 2--Comparison (ll Llnge of estimate:s fur dil-Illlnt sampling strategies
Type of strategy used
Sampling from entire uni '!er~;e: :
Expectedvalue
of mean
l\lIlgc lOf estimates
1
EP - Est i mator 1 , .. :UEP - Estimator 1 :EP Estimator 2 .EP Estimator 3 .EP Estimator 4 .
Sampling from two strat,l:
EP - Estimator 1 , .UEP - Estimator 1. :EP Estimator 2 :EP - Estimator 3 :EP Estimator 4 .
27.Cl27.Cl27.026.12K
3/ 27.0
27.01/1/1/2/
'1- h 722. )- 3(). ()
:2/1 1')» 30. n
:2/~' ~.qr )~.08
ll.Cl - 57.524.62 - 29.311
1/1/
2/24.966 - 30.066
15.:) - 43.51/1/1/2/
1/ To be completed by :;tuj'_'l1ts before next sess [llii
]j The sample is too snaIl to compuU' the slopl' witld'lIt an indl~pcndellt estimate
of "b".]j If the estimates were ,',llculated based entin']v "I sample data, the estim3tur
would be slightly hi~sej.
1.3 Acquisition of the Sampling Frame
A sampling frame is a ml'~lflS of gaining access t (' till IJIliverse we arc interestl'cl
in sampling for factual int"ClrmJtion about one or mUll' !)')i"!]:ltion characteristics. The
sampling frame is composed of units (frame units) Hhil'h m:1V or mav nut be the S."lme as
the units in the universe. (()nseqm'ntly, we have' a bdSi, I'rnblem of developing a
linkage or building a bridr:l' hetween these different t\'lh',", of "units." We call this
linkage the "survey operational rules," which are rcq'!ir",i for a particular survey
based upon a part icular s::lTJ;pJi I1g frame.
Clearly, the most imp' rtal1t step in sZlITlpling is ;ll',!l1iring the frame, since
without it we cannot appl) LI'L' principles of survey l1<-:: il].
1.3.1 Characteri st it'" of Frames
An ideal samplici' t rame is a list of distind, \'h>,:nly defined, mutually
exclusive sampling UIli1 c containing all the l']l'lJItl't: of a specified universe.
12

The individual sampling units may be natural units, artificially constructedunits, or some convenient reporting or working unit. It is not always neces-sary to have a complete listing of individual sampling units. Clusters ofunits may be used provided cluster sizes (the number of individual samplingunits contained in each cluster) are known and procedures developed for anunambiguous definition of the individual sampling units within clusters.
We may characterize sampling frames in terms of their defects. It isimportant that we keep these in mind when constructing and using frames. Char-acterization of frames include the following: (a) A frame is termed inaccurateif the units listed are incorrectly or imprecisely defined or if informationpertaining to the units is inaccurate; (b) a frame is incomplete if any unitsof the population are omitted; (c) a frame contains duplication if some unitsare included more than once; (d) a frame is inadequate when it does not coverall the universe of interest in a particular survey; and (e) a frame is outof date when it no longer reflects the universe, although it may have beenaccurate, complete, and free from duplication at the time of construction.
(a) Inaccuracies in frame definitions of sampling units should be dis-covered during the course of a well-designed survey, and sample datamay be adjusted so that valid inferences result. If control informa-tion is inaccurate, the efficiency of a sample will be reduced, butbias is not necessarily introduced.
(b) Incompleteness in the frame results in the exclusion or omission ofpart of the universe. It wil ~sually not be discovered during a sur-vey. Incompleteness is often m)re seric,llsthan it appears at firstsight, since it is often confined to units possessing some specialcharacteristic, which may be seriously underrepresented in the sample.
(c) Duplication has an opposite effect from incompleteness since theduplicated units have more than one chance of being drawn. However,this will almost always be a tedious operation, since it requires avery careful review of each individual sampling unit.
(d) Inadequacy in the frame will usually be known before surveys areundertaken from the specifications of the frame itself. Inadequacycan and must be dealt with by construction of subsidiary frames foromitted categories or groups.
13
Lists of hl"ds in a city "1' subclivisil\l1;
List of me'TfI"'!:; "f a tr;]c1e assoeiat i"n ~
List \If [d!'::, 1rl1ffi last Cl'IlSUS;
List of piJrl;, ll':lr1ts in goverrm]l'nt ;,rl','I,]II:"
Telephon," (~i t'l ( t orv.
(e) Out-of-date trml'S are likely to he t (HII1,1 in samp] ing situations
where the b,l-;i :-;ampling units may ;11'I'l'I),,'[' disappear from the uni-
verse. The' !'\':-;Illting detl'rincltiol1 IS l',t )'\'l1ll,lv trouhlesome In list
frames but i,-; !lIlt an important [actn)' 1.'1' Irt:! lrames. The only way
to minimize LlIi; defect is to revie\,' tll' )',llTll' and hring it up to date
peri a cli call \' >
1. J.:2 Source Hated a 1 S [,I~~_Con~,,--t_r_~,-t)o!l~a~1l1?1 il" FT,a,m_~,:
Auxiliary inform,ltL)I may soml'times be ~1(,llllir"d in the frame construl,tion.
Frequently the sourcc' m:,t,,'rials l'onLlin valuabll' ill!"rmation wldeh C.1n t1l' llsed.
Examples of source mdtc-ri'1]s [or frame constru, ttl'''l
(a) A map of 1:11,',: ,]['ea based on county mIP:';
(h) Plwtogriphs ,>I Lmd area;
(c) City dirl'\'t,'r\
(d)
(c)
(f)
(g)
(h)
1.3.3 Types of Fram<.,_ ,!"l'd_jE __S_a.!llEU~ll',-Y_oLk
A. Population and l!(l\~:;il"~ Census
Such frames art:> I, ':-' ,I (111] istinr places \,1' ahl\d,' and have to be bruught up
to date in order (,I akt? in the new \'onst [,Iwl ; (, 1 llf the conversion of hui Id-
ing for use as h\l\l,si1i;. The usefulness "r :;'1l'11 Irames is enhanced if :1
sample of areas i:; ,'i,'ll'cted from it at tille t il'l,' lhe census i::; taken, or
the census is t clhr:1 ,led by areas.
B. Town Plans
Street maps \If indi,':dual tm.;rns 11l:]V provid,' ,] : I,itablc access to "crlLdn
universes of int"rt"~f
C. Lists of Villages
Tn countries whl'I'" h,)useholcls are clustered i'l villages, a listing of vil-
lages, may provi ,\0, ,] c;atisfactorv frame oj h"ll:-".'holds.
D. Directories of Es L1h I i shments
Frequently, a business association, census llr licensing of firms can be
used as a fC1me 1,'1' 'l'rtain kinds of businl'~:sl_''',
14

E. Area FramesGenerally, area frames are the most permanent frames, since the land areachanges very slowly in all countries. Two types of source materials arefound useful.(1) Maps showing parcels of land by ownership.(2) Special purpose maps showing roads, elevation, soil types, vegetative
types, etc. In addition, photographs of a country provide anotherimportant source.
15

CtL<\PTE R - CONSTRUCTION UF Si\r'1PL 1~;I: I'I~A'IES
2.1 Introduction
He have discussed some :~(>!llTal concepts useful in ';,11111']ing and the necessity of
a sampling frame in carrying O\l! a surveyor census. \';L' now turn to the task of con-
structing sampling frames.
He will consider construct ~l1n of two types of framL'c;--area and list. The sam-
pling unit in an area frame is ,;ome specific area of Llnd; the sampling unit in a
list frame is usually repn>sI'lltl'd hy a name or addn'so-', ,q both. The major advantage
of an area frame for agriculLur;ll purposes is that it is ('umplete, the entire uni-
verse being contained in tfll' fr;me. A list frame, on tl1l' ,)ther hand, is to some
degree incomplete by the timl' it is assembled, since f;JnlS and firms are continually
being formed and dissolved. Ill]!' of the greatest difficult if'S with either type of
frame is clearly and unamhi,c;\IOII:;ly defining the sampJ in" 11'1 Lts or elements in the
frame. Success is measured in terms of the following l'tJ lr'lcteristics:
1. Accuracy - In an arL'a 'rame, a map with poorl\' lrlWTl features may result
in an inaccurate l1iL'l::-;u-cment of a sampling un it, "r iln unequal d ivisloTl of
sampling units.
2. Freedom from dUp!iC:ltill[] - If units are indl'finitL'Lv delineated in an area
frame, the same arL':J ,night be included in ]1)(1t't'tldll nne sampling lInit.
Duplication in a 11st frame may result from ,111,' ,il'ment being listed twice
with different descriptions (e.g., an agricllltu111 operation listed by the
name of the owner and the name of the farm).
3. Completeness - A list frame is almost never compLC'te because membership of
a group is continual] \' in flux due' to addi t: LOll,; ,md departures. One of the
advantages of an area frame is that it is complete and the completeness can
be verified by inspection of mapping m.:ltf'ri.ds available in a central lo-
cation.
4. Timeliness - Area t ramt'S generally can be con~;t rllcted with minimal or no
field work and remain up to date for a r('lativel,' long period because of
the difficulty anJ expense involved in changing t l'rrilin. In contrast, the
elements in a list frame are hard to keep up t.n datt'.
It is of primary importancC' in constructing sampl in;, frames to define sampling
units which both the interviewer and the respondent can i,lentify. There are many
16

available sources of information which can be used for frames -- soil maps, topo-graphic maps, aerial photography, maps of population density, census enumeration orsupervisor's work areas, etc., for area frames; and census listings, telephonedirectories, brand registrations, membership lists for industrial or commodityorganizations, and so forth, for list frames.
Sampling error can generally be reduced if the frame is stratified. The objectof stratification is to place sampling units into groups which are as alike aspossible within groups and as different as possible between groups. A list framemight be stratified on the basis of income, size of farm, address, etc., dependingon the information available. In an area frame, population density is a commoncriterion. Or, in a frame used to make agricultural estimates, stratification couldbe based on crop or land use. It should be noted that while land-use stratificationis useful for broad categories, it is a highly subjective process which does notlend itself to detailed, specific classification. Also, because frames are expen-sive to construct, they should be general enough to accommodate different types ofsurveys for a number of years even though the immediate needs may be for specializedsurveys.
2.2 Construction of an Area Frame for the Dominican RepublicAs an exercise you will be asked to construct an area frame stratified according
to land use for the Province of Salcedo in the Dominican Republic. You will subse-quently select a sample using this frame. The frame will be constructed in twomajor steps: first, classification of the land according to its use; and second,construction of sampling units. Frequently, it is found in constructing samplingunits that the best use of resources (time and personnel) will indicate that onlyvery large primary frame units should be defined and that these should be classifiedinto strata. Then, only primary units selected in a sample are subdivided intoelementary units. Thus, two types of units are defined for the frame: (1) Primaryframe units (Le., "count units") and (2) elementary frame units (Le., samplingunits). You will be using topographic maps as your primary resource in the con-struction, but the following other materials are also available: aerial photographs,maps of soil type, population density, and vegetation; and agricultural census databy municipalities.
2.2.1 Stratification Based on Land UseFive land use groups were defined for the Dominican Republic and are given
later in this section. All five strata are present in Salcedo Province. Because
17

coffeL' is ;lll iT11!)Ort:lllt 'Illp :mJ thl' first ;-;lIrv.,\ .,
L In d v: h t' r c c , ) fie L' ( ! I ! ' I :]~; l ) (' :!C;j , )) \,1, IS k II' )wn t" In
t-:ltL' ;-;lreltum. Cl'I1L'r,!] I it IS nl1t !ll\;-;sihl,' , r ,I,
dl'tdil fl1r spt'l'iri,' ,I,,' hut ",)] I-l'l' ,IIHi C,I, ,Ill
1lIdikL']V t,) ('h:111i~(' r,]:,:,il\' with tinll'. 'I11l' r,,11'1\,"']"
tLlinini~ Sl't ','I \·litl1 '"I ,11 Y')\I \,'1]1 ,'.,nst n:,'
t" he :1 (,Clffl'" SlIrVl'\',
1,ll1tl'd was put In :1 :';('P;1-
r I!) ] L' t () sIr, I t i Iv i II S \I d1
,I i r I v Pl' nn:lllL'11 t l I', 1 PS dl1 d
It l' r 1: 1l s ' Ire In,'] 1IJ l' d i11
I. '[\.J11hL,mk l 'j'" 1,lphic maps l'llVl'rin!' t h,· I I Illl'l' ,d ~;jl('L'd".
,\ SkL'tl'l1 ooh,'\>.'ill:: the str:.lLI construl'll'rl ]'17..'.
3. Tr::JIlooj':lrcnt ", t'I:1VS shll\,'illl~ "'"Illt iWI! I";tnl,,,tl'd in ]rr'-',
.4 •
l'llnstruction of :1 oo:Il'lI,1il"I' frnl11l'; it is ,I ];I:"t, I
judgmc'nt dV;1i]:lhll'.
Th e m:1t l' r i :11sin i t l'
finishL'd with th,lt d"',,., in 1972. T1IL'rl' is n') "1- 1111i 'jlll' S(,1 uti ()11 t, ) t h l'
',i 11:,',thL' h,',-; t 1',)]; L'" t i ve
fn deliIle:ltilli' ,_1 Lit:l, Iise
t':lsilv identified ,In Ii> rl1ulld 'r It i, ln 0
m:lv mL':I11 illl'llldill!' S"I'll' ',ll1d \.Jhi,'h II'.!V 11,'t ",'1 f,,~'
;-;tr,ltUI11 dcfinitil'll, Iii i,; prl'fcrah!l' t(, d 1'"ul-
,'l1rrl,,'t]V n\' thl' illt, "VII\\'l'1'. Che,'k thL' Il,\,,_T':d
ni:ce the diffl'rl'nt l:il',<I-; I'l' ,'ultllrl'. r",'lds, ,iI",1
the ('tl]c1rs, l'tC.
I" t ] \' tl' t Ill' Lind liS" (1 f
',chi ,,\) (',11l11l1t 11[' id,'ntifiL',i
, ~ I 11 r l ;~ S "~ L) \' (~ll \.,r ill r t·' (' ( 1} '.-
\)(1 Ill) tis, 1] .1 t l' '.',
"Ilt land \lSL' elL'i-illit
kiltlnll'tl'rs (thrll S:d1Ii,j~'I~
,; 111: I 1 ]
,\S :1
Ill1its)
:] n',1 ,; "f 1 ,111,1 ":] Ii,"
f',L'Ill' r, II r! Ill'. ; I'
.:;h"II] d hl' S"]'" r it, ',0
l' ::: t" , ' ( 1n f i) 1'''1 t,) ,1 d i f I' l' 1'-
I , c.;.; t 1]'In f, 1[ Irs 'I' I I r L'
,II ,1r:lIS :lrL' "\1ml'l"lilv
l ii, ' :\ i 1n L' s q ll,' J r L' k ii, lln l' t c r
"11]],[ in,I', (hl'lII :111<11 ,II1L'1eel
L:lrgL' btldil'S pi 1),lt,'r m,'lV Ll' rl'I'Il'Vl,,1 friTI'
lO(1nSilk red as :1 s pl'" i ,I I :; L r,'l t uJI\ i fit,) IISl'1' \1,1t;-; 'I I'
L'llL'l)llntL-rt,J. i\ny \1",li,',,; ,'I \.J:ltL'r th:]t :11'1' ,T.':lt,_,
SIll 1IIJ d h L' l' II t I i IIL'd i i] l i i l' 0( 1\ ,1 r (1t t \]L' St 1-a t IIi I
"l1l1t" llr "sp<'l'1.11 st 1',1111i'1.11
TIll' fcdln\.Jini' SI,']TC; ,slwuld thl'1l hl' l'L'rl"I'!II"
A. ll11t I i 11l' t h l' 11-,1',' 111,'l' b (J un d: I1'v i n b L I' I' .
: t'1111l' Ind m:1V IlL'l',] t" b l'
B. tlutlinl' th,' 'l'iL's. Thesc' :lrl':IS Sh(\I!I,!
st reet p.1t t,' rn, 11,)t just :1 ,')'I1SS 1'<1:1(1\': i 1: I
nlllllldarv in '1',"'11 ,'1nd Sh:ldl' it \,'i th ""11
] 8
,j 1':,'.1'l'll(lllidl
Il'\\' h,)usl's.

C. The province which you are stratifying is an important coffee-producing area. Locate the areas designated "cafe" or "cafe andcacao." Delineate these with a blue line and shade the insideedge of the boundary.
D. Delineate the intensively cultivated areas in purple. These shouldinclude most places where a crop other than coffee is indicated. Onphotographs, these are the areas that would be expected to show alarge proportion of fields. On the topographic maps, these are theareas that have some specific crop indicated or the color code indi-cates it is cropland. More than half the area classified in thisstratum should be labeled with some specific crop on the maps (seethe legend on the map).
E. Consider the remaining areas on the map and distinguish between IIIand IV. The best indications will be the amount of cleared land andthe number of houses. Stratum IV should have a negligible number ofhouses, very little cleared land. It is frequently mountainousareas. Stratum III should be drawn and shaded in green, Stratum IVin orange.
F. After you have finished stratifying, put the maps together and besure that:a. the stratum boundaries are continuous from page to page;b. all areas have been stratified; andc. all outlined areas meet the stratum definitions.
An alternative training set (training set #3) is also included for asituation where aerial photographs are available for stratification. Thesematerials provide a second example which can be completed after trainingset #1 is finished.
19

Stratum Ipurple
Land Use Definitions
l~tensive Agriculture
This stratum is cultivated land. Many of the crops will
ht irrigated. Include tree "("PS, exclusive of coffee,
Stratum IIblue
Stratum IIIgreen
Stratum IVorange
such as bananas, cacao, and pJ~ntain. Other crops will
include rice, sugarcane, mai~l', tobacco, beans, and
pea;1uts.
Coffee and Cacao
Thi-; stratum is land in tn'(' lover, devoted primarily to
the production of coffee and, acao above 100 meters.
Limit this as much as po:;sihlt to land where coffee is
specifically indicated. Tlli~ stratum may include some
Cdew where it is interplantt'cI.
Ext \:'ns i ve Ag~~_~'~:0t ure
[his is a mixture of cropland ,mel cleared land used for
.:;r.l.dng livestock. This is Iii.' most loosely defined
,..;tr.ltum and, in practice, it i" land which fits none of
tIll' other definitions.
~ondgricultural Land
Thi~; is land in natural cover- ,...'bieh supports very little
\1Y no agricultural acti vi tv.
forpst and swamps.
l'bis will include mountains,
Stratum Vyellowochre
UrbanThLs is concentrations of pOj\u]alion ranging from small
rural towns to maior ciUes.
20

2.2.2 Construction of Primary Frame UnitsTo identify all the sampling units in an area frame would be very time-
consuming and therefore expensive. If, however, the number of sampling unitsin the frame is known and the specific area in which they are located is known,then we can avoid splitting the area into individual sampling units. One wayof accomplishing this is by constructing primary frame units. A primary frameunit is a specific area of land containing an assigned number of elementaryframe units (i.e., sampling units). Each primary unit has a given number ofsampling units. The primary frame units are commonly called "count" units,because a count of the number of sampling units is available. The area in eachcount unit is measured and this area is divided by the expected sampling-unitsize to derive the number of sampling units. A tolerance is allowed around theexpected size to permit the use of physical boundaries and allow the number ofsampling units assigned to a count unit to be rounded to a whole number.
When the universe has been completely divided into count units, the countunits measured, and sampling units assigned, a list is made of all the countunits, identifying them by location and number of sampling units. This list isthe frame from which samples are taken. When a sample is selected, only thosecount units containing selected sampling units are split into individual samplingunits. However, it should be pointed out that, if only the total number of countunits in the frame are known rather than the total number of sampling units inthe frame, unbiased estimates can be made by using multistage sampling. This isfrequently the case when sampling units are identified in the field rather thanusing mapping materials, especially maps or photographs which are quite old.
Construct count units for each stratum in Salcedo Province except Stratum V.
A. BoundariesCount-unit boundaries should be physical, permanent boundaries whichcan be identified on the ground, such as roads, rivers, railroads,etc. Draw count-unit boundaries in the color of the stratum, butdo not shade them.
B. SizeTry to keep the count units within the desired size range. However,this is not as important as using a good boundary. The size restric-tion on count units is to make them easier to split at the time of
21

sample selec l i (ll!, but they should be }an!(' ._'nough to accommodate a
larger sampli;lg--Imit size should this hi. JLH-;irable for subsequl'nt
surveys.
StratltrTI S.U. Size c.r Size
I, II 2 km2 P ') , km
2- _4
r II , 4 km2 ) I 4R km
:2lV • 'f -
C. Identificatil)[1
Each count unit is identified by the numh,'! "f the stratum in which it
is located, a e,)llllt-unit number, and its ,'ll"\a. The area is used to
compute the num;ll~r of sampUng units to a';:,ign to the count unit.
1. Number tht' ('(Junt units in 3 serpent in" 1i1shion beginning in the
northeast l ()cner and proceeding frll!11 ,",c:t t(1 west. This is done
in an e f r In-t to standardi;:e and c Ii II: ill" C' an\! bias which might be
introdUced in numbering the count un i 1", 11('\<.'L'ver, the consecut i ve
numbering (If count units with similaYH,riculture is commonly em-
played iI' lOllstructing "paper" stL1ti1.
discussillll. )
(See Section 4.2.4 for
a. Count 'lltits are numhered vJithin ('il('\1 stratum.
count IIIliL numbered 1 for edeh str:ltum.
There is a
b. Put :111 the map pages togethL'r :lIId [wmber the count units
thn'llgllout the province.
2. Using a ~r id (the one all the map:: ,'r iI plastic overlav), estimate
the numlwr 1)[ square kilometers in L 1("1 count unit. In actual
practicL', a planimeter is used to ('hLd in a more accurate measure
Salcedo contains <1]Jpro":i'11ately 420 square kilometers.
22

3. Write the identification of each count unit on the map in thecolor of the stratum.For example: I - 3 - 16This is count unit 3 in Stratum I and it contains 16 squarekilometers.
4. List the count units on the count-unit identification sheets,preferably a separate sheet for each stratum. Include the mappage number, the stratum number, the count-unit number, andthe measurement on these forms.
2.2.3 ~ssemb1ing Frame Units for SamplingAfter the count-unit identification sheets have been made, the count units
can be assembled in whichever way best suits the needs of a particular survey.In the Dominican Republic, there was interest in providing information for five.regions in the country, so count units were grouped by stratum and province ingeographic regions. Grouping could also be based on types of crops grown, sizeof farms in the area, number of crops in a season, etc.
2.3 Use of Satellite Photography in Constructing an Area FrameThe launching of the first Earth Resources Technology Satellite (ERTS) in .July
1972 has provided an additional source of information on land use. Each ERTS (nowcalled LANDSAT) image (or "frame") covers an area of 100 nautical miles by 100nautical miles. The scale of the 9" x 9" photographs is approximately 1:1,000,000.Monthly U.S. and non-U.S. Standard Catalogs and microfilm copies of the pictures are
available showing the areas for which imagery is available along with certain addi-tional information, of which the percentage of cloud cover is most important. Thesecatalogs can be purchased from the U.S. Government Printing Office, Washington, D. C.20402, and the microfilm copies may be ordered through the EROS Data Center, SiouxFalls, South Dakota 47198.
An enlargement for an area covering the Province of Monte Cristi in the DominicanRepublic is included in training set H2. The enlargement is at a scale of approxi-mately 1:250,000. We shall use this enlargement and transfer from the topographic mapthe more important roads, rivers, and other natural features shown on the map forreference purposes. Having transferred the main features identified on the map, weshall proceed to construct the strata for an area sampling frame using the enlargedERTS image. In training set H2 are the transparent overlays showing how the stratifi-cation and frame was constructed in 1972, without the ERTS picture on one map page.
23

, 3. 1
Ohviously, the photl1 illr,'rl'rL'ter's tr,linin!', ,]l1>!
ERTS picture in ordL'! (" tltl the besl illh of ;;lr,, ,I,
n, 'l \! I l' :': I:npi L' ,l f till' ;-,t ,:1 t i j 1-
,';ltion is slwwn in tl 'IniI1i', set Ii':!. Till' 1'1;1t" 1-i", i 1][ IIlJ eel ,'(), rl'S pl 'Ill! l u :
1. r- i~ t f'j(lV int'".
" Transparent «Vl'Il.IV shlH.Jing unl' p()ssii']l' 1 '1Id-\lSl' strilcific:1ti()n.
3. 'lplltl' Crisli.
I-I. Tr:1llspa renl
:.'.4 Lisl FLW1l' Cunstruct1"'I]
111U t \l.' I] 1 v L':-:C 1 \l si v l' S .'1 Jl1p! i J: , 11!1 i t:--; c ()n t .'Ii n i n i' 1 () () I'l' r, I '
','Ilh ,III idl'.'l1 fL11l1l Llrelv
pn,ellllt tlf ,] l)nlgL1J:I "itll 'I ,0 lit I V, tIll' 1 ist ('{lnst i lull'S
)-"Ilil' fClllllws 1,')lil'h is dl',;i "]c,J tll i',ivC' thl' rl';Jell'r SP!l1e
,In' cl1mml1nlv cP111hinl'd tll j, tT "'_~;I~iY_l'L~ l'l1mpll,tl' fl-,jl'lt
,lrL':1 1'Ll111('L'mplllv1ni', nI\I!tlj']t-tLlrne theorv.
'.·ill i l'll l'.'m he used I,.'i th ;In
:.'.4.1

The first and basic phase is identifying the best list source if there are manysources available. This may be extremely critical because the task of mergingseveral lists together is difficult. This "best" list source should provide alist of farm and ranch operators which represents a high proportion of eachprovince's crops or livestock.
The list source should also provide control information for purposes ofstratification. A large list of farm operators without control information isno more efficient than an area sampling frame which is not stratified. The mostimportant piece of information about each list unit is whether or not the "name"has the survey item(s) of interest. It is also important to know the relativesize of each unit with the crop or livestock species. This size can consist of:(1) actual inventory numbers, peak numbers during the year, or marketings duringa period of time; (2) an index created from marc than one data item, or; (3) asize code indicating relative size of operation.
The list frame must provide means to select samples with known probabili-ties. Names on the list have to be associated with an identifiable operatingunit. Also, duplicated names must be removed when developing the list. Ifseveral list sources are to be used, consideration must be given to increasingproblems of duplication removal. The task of identifying duplication in a com-posite list is not an easy one.
Defining operational arrangements (i.e., people and business arrangements)is quite desirable to the extent possible. This is helpful in identifying dupli-cation and in the classification of parcels of land that could be part of severaloperations. Information on corporate or ranch names and names of all associatedpartners is invaluable in applying appropriate procedures necessary for unbiasedmultiple frame estimates.
2.4.2 Steps in Frame Construction Based on Name-Address ListsA. Name and address units are assembled from the available list sources to
make the frame as complete and up to date as possible.
B. Identify and remove duplication of units with the same name andaddress.
C. Determine procedures for associating frame sampling units (i.e., uniquenames and address) and the population units to be surveyed for infor-mation, i.e., farms, households, etc.
25

D. Arrange list [or c;ampling hy :"trata and :Jc',j~~11 each unique frame unit
(each line in the list unit iclcntifi,':!,j'lll ,h,-,ct) a numb<..'r to be used
in random St' 1 <"'lt i, In.
2.4.3 Exercises J and 4
At t he end ()f t h i~; l 11:!Pt e r t he rei s an a] p , ,,11 l i \ llPlputer listing (retvped)
of names, addresses, ~l\J}: i 1 iary information :mct ~;h\,\,' i:i:,', dupl iCiltecl units removed
by cross ing out the nallt'- ;Jddress nn it.
units was reduced to .11,l) Il:IIIH2-address units.
information shown for tal'h name-addrl'ss unit.
Exercise 3:
lhc' ,o[umn headings indicate the
Each student i;.: tll :-:t ructure the list so thl' ! I' ,-1l' ('()nsists of clusters
if no city is provided,based on the city witl1i!; ~tilte (columns 6 i1!ld ?l <>1
the county within statl' (,olumn 3) in placc' of till it v. After the clusters are
formed, record the numh('1 of name-address uni t sin c' wh c IllS ter.
Exercise 4:Each student is to "l"pate an auxiliary vari;JJ;l,'I:.;) for t~ach name-address
unit for use in estim.ltilli, live~~tock bast."d on t11< : v' cotoek auxiliary data in
columns 8, 9, 10.the name-address units i III 0 no more than 12 st IlL I. -C, i lilT the auxil i ary data
could also be used for urwqual prohabilities 01 sel, tion, or for a ratio esti-
mator, it is usually d,'sirahle to rCfjuire thl' ~1\lc:iliJt\' v.l.riahle(s) x. bel
greater than zero. If t1]t'rl' is no dilLl in collllnn:" ;-;, Y, or]() (i.e., a zero),
x, can be set equal t,l 1. If this is done, tl1l'll L II, r:ltil) is uiCfined for eachl
unit and division bv Zl'r,) will be avoid,'d nu milt(, ,-,'h;lt size sample is seleetl'd
later.
Two principle criU'rLa are to be uSt:'d in ,"ll -lllIl'ting the strilta after
ordering the units fru~l s'IlZlllest to largest: citlll'" (I) tIll' total measure of
size for all name-address units should he apprnxinllil'h tht' same for cach
stratum, or (2) the squ~lrL' root of the largest ml·d:~llr,· of size should ht'
divided by the number ld -;trata desired to yield tl< \,'idth of the strata: i.e.
N:lme-address units art' t hVTl pI aCl'dIW =: " largest x. : S.1
the magnitude of the square root of X ••1
in strata based on
26

CHAPTER 3 - RANDOM SELECTION TECHNIQUES
3.1 IntroductionAfter the sampling frame has been constructed, we need to develop techniques for
selecting samples so we may make inference ahout the totality of all units in ourpopulation of interest. In chapter 2 it was indicated that the count units (or ele-mentary frame units for the list frame) could be assembled in whichever way bestsuits the needs of a particular data collection program. We then developed a label-ing of the sampling units in the frame so they could be identified by the integersfrom 1 to N. However, any arbitrariness for the sake of convenience, or specialpurpose in listing of the frame units, may introduce unpredictable biases into theordering scheme. This can only be avoided by proper use of randomization in select-ing a sample. We wish to use a sample selection scheme which can be repeated byanyone who understands the technique being employed, but the units selected shouldin no way depend on the individual making the selection. It is considered goodpractice to record the steps in selection so they may be verified to insur~ tiletechnique is being carried out properly. The selection schemes discussed can beused with any survey design, but the selection methods are most frequently used toachieve one or all of the following objectives: (1) greater efficiency in terms of asmaller sampling error, (2) ease of sUTI@arizing the data prior to making estimates,or (3) to insure proper execution of the sampling procedure by personnel.
3.2 Simple Random SamplingThis implies that the probabilities of selection for all sets of sample units of
size n are equal anJ each unit selected from the frame will have the same expansionfactor N.
3.2.1 Sampling With ReplacementThe universe contains N units and we wish to select n units for the sample.
Let us suppose N = 850, then we develop a rule so that one and only one integerbetween 1 and 850 is associated with a particular unit in the frame. To acllievethe selection of n units, we choose n three-digit numbers from a random numbertable between 1 and 850. If we encounter a number greater than 850, we ignoreit because none of our units have heen laheled with numbers greater than 850.If the same random number is selected more than once, then the unit identifiedby this number must be included in our summary or analysis once for each timethe random number is selected. We illustrate this for n = 10, using the
63

random-number sheet atta.ched at the end of this lh;q,ter. To guard againstdifferent people (or thE same person) always using the same set of randomnumbers, we find a new random starting point in the table each time a sampleor replicate is selected by visualizing the tabll as consisting of a givennumber of pages of C columns (25 per page) of three-digit numbers from 001 to850 and R rows (40 per page) of three-digit num1wrs. We enter the table byfinding a starting column and starting rowan a particular page. One proce-dure by which we select a starting point in the tahle of random numbers is asfollows: On page one of the random-number table, the first one-digit number wasused to select the page, the second two-digit nUl'lberselected the startingcolumn on the page, and the third two-digit number selected the starting row.(In case any of the numbers exceeds the number of pages, ~olumns or rows, thenwe use the first number equal to or less than tlll~maximum pages, columns orrows.) We proceed from the starting point down thlcO column until we have 10
numbers. If we do not obtain 10 random numbers hefore we exhaust all the num-bers in the starting coLumn, we proceed to the top (or bottom) of the nextcolumn to the right (or left) until we obtain tIll'10 numbers.
The following two ~amples of size 10 were sl'lected by this procedure. Thestarting points wer,': (1) page 2, column 08, ro\<:!jD, and (2) page 2, column 21,row 04.
Random Number Selected
-------- - . -------
Sample Number
1 2:
..- -
551 219479 667284 698094 024307 211417 166654 502749 518760 027622 364
:-~ ----
Since a random number (or three-digit integer) can occur any number of times inour table, the probability of selection on any draw is ~, and the probability
N-Iof not being selected N. Thus, the probability of selecting each unit is
64

constant, hence the probability of selecting the n units is
!+!+ +! n= -N N N N( )
Vn terms
10850' or the expansion factor for the 10 units
is 85, and for an individual unit, 850.
3.2.2 Sampling Without ReplacementThe labeling of the universe units is the same as in 3.2.1. To achieve
the selection without replacement, we insist on n distinct random numbers be-tween 1 and N. We proceed as in 3.2.1 except if we encounter a numberpreviously selected, we do not use it (or cross this number out) and simplyproceed to select the next number. The following two samples of size 10 wereselected using this technique. The starting points were: (1) page 2, column 04,row 32, and (2) page 4, column 10, row 19.
Sample Number
Random Number Selected
1
543241442814170601315841110488
2
574360446358027026039188415456
Since a random number cannot occur in our sample more than once, a universeunit cannot be selected more than once. The probabilities of selecting a unitfrom the units available on the successive 10 selections are:
1 1 1 1 1 III 1 1N ' N-l ' N-2 ' N-3 ' N-4 ' N-5 ' N-6 ' N-7 ' N-8 ' N-9
and the probabilities of nonselection are:
N-l N-2 N-3 N-4 N-5 N-6 N-7 N-8 N-9 N-ION ' N-l ' N-2 ' N-3 ' N-4 ' N-5 ' N-6 ' N-7 ' N-8 ' N-9
65

The probability of sel. (~iun for any of the n \Ini t"N-l However, this m,j\ Iwt be immedi,3tely obviou,-;.
Nf b ., h' th. f C 10 1 1O. 0 taInIng tel un I t ()n any a t'le po:.;s i ), I
1 .is ~ and of nonselectlonConsider the probability
,>] ections.
PCi) P(lst draw) l' ( i ) 1-N
P (i) P(2nd draw)-
P(i:2)N-l 1[' ( i I) --- ---~
N N-l :~
P (i) P (3 rd draw) l' ( i J) P(i12) P (j 13) N-l ~J-) 1 1- .' -N ')-1 N-') N
r (i) p(loth dr.:lw)N-i N-2 N-3 N-4
--- --- --N N-l N-2 N-]
N-5 t-;-f} N-7 N-8 N-9 1 1-- -N-4 K r ~;;-() N-7 N-8 N-9 N-.J
Consequently, the prob<i') I 1 i ty of selec ting n un i t;-,
( )----V-------
n terms
nN
The expansion factors 1:,\1 il sample of size ]0 <in> ;'111 same as given earlier:
85 for the set of 10 \lulu, and 850 for an inclividu,il unit.
3.3 Random Systematic_Samp_l.i_Ill~
The extreme populari t\' 'J 1- ~;ystematic samp ling j s cllj(' to convenience in llse and
gains in efficiency which may result from taking <1clVanL,~(~of natural stratification
which may exist in the way til<' frame was assembled. [i1 ~-,h't. the frame should be
assembled (or reassembled) III ,alch a way as to create till most efficient possible
ordering of the units so tll" s<impling intervals will roug\lly correspond to some kind
of strata. However, the sampling intervals should not b, viewed as strata unless
provision is made to obtain unhiased estimates of tliL: sa[llpling error. Rather, it is
proper to view a single sy:-;tc1I1<itic sample based on one random start as a special
kind of cluster. It should bt' noted that in using a single random number to start
the selection process results in only one cluster of units no matter how many times
the sampling interval is addpd La the random start. CDll~;equently, it is not possible
to obtain an unbiased estimate of the sampling error.
3.3.1 Unclustered Gnits in the Frame
In this case, it was possible to directly identify each of the N units in
the universe with a s·:'Le,:red random number. Commonly, places or names of people
66

may be assembled in either an alphabetical order or by political units (orgeographic areas). It is seldom clear for an alphabetical ordering what kind,if any, natural stratification may exist, but some type of stratification mayexist even though it cannot be identified. As a result, it is frequentlyassumed that the ordering is equivalent to a random ordering for purposes ofapproximating the sampling errors by treating the cluster as a simple randomsample of n units. Units listed by political or geographic order can frequentlybe rearranged to create a stratification of the units which will increase theefficiency. Or if information on the magnitude of some characteristic which isrelated to the content of the survey is available, a more efficient stratifi-cation will generally result.
We will consider a small universe to help illustrate the nature of theclusters which are created by systematic sampling. Generally, the clustersformed are much more efficient than the compact or contiguous units which couldbe used to form natural clusters. The clusters formed in systematic samplingare composed of units which may be scattered over the entire universe and hencethese units are less apt to be alike. This results in the variability withinclusters being increased while the variability between clusters is decreased.When all units in a cluster are sampled, no contribution to the sampling erroris made by the variability within clusters. If N = 150 and we are interestedin samples of size 10, the universe will consist of fifteen clusters. Thesampling interval (i) will be 150 ~ 10 = 15 and a random number between 1 and15 will be chosen to select a sample of 10 elementary units, or one cluster.
67

UnitsSelected
By R.N .
Same as R.N.
R.N. + i
R.N. + 2i
R.N. + 3i
R.N. + 4i
R.N. + 5i
R.N. + 6i
R.N. + 7i
R.N. + 8i
R.N. + 9i
Random Numbers (i .e., clusters)....
4 . 5 . 6 . 7 . 8 : l) : 10 :11 :12 '13 .14 '15. . . .
1 2 3 4 5 6 7 ~ 9 10 11 12 13 14 15
16 17 18 19 20 21 22 23 24 25 26 27 28 29 30
31 32 33 34 35 36 37 38 39 40 41 42 43 44 45
46 47 48 49 50 51 52 53 54 55 56 57 58 59 60
61 62 63 64 65 66 67 68 69 70 71 72 73 74 75
76 77 78 79 80 81 82 83 x4 85 86 87 88 89 90
91 92 93 94 95 96 97 98 9q 100 101 102 103 104 105
:106 107 108 109 110 III 112 113 114 115 116 117 118 119 120
:121 122 123 124 125 126 127 12H 129 130 131 132 133 134 135
:136 137 138 139 140 141 142 143 144 145 146 147 148 149 150
Clearly, the sel("ction of only one cluster d.H'S not permit calculation ofthe sampling error. 1n order to insure an unbi~s,.'destimate of the samplingerror in systematic s,mpling, two or more cIus u,r; must be selected. Gener-ally, the selection of two or more clusters of lll~ type in our table arereferred to as replicnted or interpenetrating snmples, because each cluster of10 units is spread over the universe in the sanlt' ,Jay. The use of replicatedsamples is required for estimation of sampling I'rrors and frequently as a meansof evaluating nonsampling errors.
3.3.2 Sampling fror~__tlle Dominican Republic FrameWe will consider several examples using simple random sampling and system-
atic sampling techniques for the Province of Salcedo for which the class hasconstructed a sampling frame with five land use strata.
3.3.2.1 Sele~ti~ a Simple Random Samp1~A. In samp L(~selection, the first stt'P is to decide on the size of
the average segment (the ultimate sampling unit selected forenumeration). In the Dominican Rerub1ic, the sizes were asfollows:
68

Stratum
I, II
III, IV
V
Size
All cities, no matter how small, were considered to have at leastone sampling unit.
B. Sampling units need to be assigned to each count unit. Dividethe area of the count unit by the expected segment size andround the quotient to the nearest whole number to get the numberof sampling units for each count unit. List the sampling unitsfor each count unit. List the sampling units on the count unitidentification sheet in the column marked "S.U." Accumulate atotal of the sampling units for the province in the column marked"CUM."
C. A simple random sample of segments is to be selected fromStratum I. The starting point in the random number table is:page 3, column 5, row 24.
To select a segment:1. From the starting point, pick a random number from 1 to Nh
where Nh is the total number of sampling units in the particu-lar stratum.
2. Determine in which count unit the selected sampling unit falls.On a segment location sheet, record the segment number, thestratum number, the count unit number, and the number of sam-pling units in the count unit. The final column may be usedto record the name of the city for segments in Stratum V orany other pertinent information.
3. Find the selected count unit on the map and divide it intothe assigned number of sampling units using the best availableboundaries. Each sampling unit need not be exactly equal tothe expected size. Size may vary within the tolerance rangestated below (commonly ± 50%):
69

Stratum
r, II
] II, IV
V 1 /4-1,' 'f2km
4. NumlH't' t he sampling units in th,' ('[)unt unit beginning in the
norL!'l',l~;t corner and procel'clin~~ :; ,1 serpentine fashion as
befort'. Select one at rando!]l ,lilt identify it with the segment
numlwl' III red on the map.
\.Je will onlv c'l'llsider sC'lection from StCltiJ!11 r. Each of you might
have arr iveu at ad; j r erent number of samp L ini', '1'1 its (or possibly even
different strata) I',ll Salcedo Pruvince. liUWI' if' r ~ you are to use the frame
you (or your teaml ,,'(lllstructeu. The original frame construction is shm,Tn in
the sketch in tClil1ir" set ill with the fullo,,'ill,' number of sall1p}in~ units:
Stratum I - 89 S.l'., Stratum II - 115 S.U., ';1 r;ltum III - 4 S.U., Stratum
IV - 2 S.U., and :)trdtum V - J S.U. The eX;J'~ll'L' which follows was based on
this frame. HowL'ver, vou wi 11 need to USE' tll<' numbers for the frame you
constructed in tI1LC.'xercise.
A simple Lmd,)lll ~,ample of 5 segments L:~ t" be selected without replace-
ment from the 89 :;. \1. in Stratum I. The "tan ing point in the random num-
ber table was: P,l:,'C' \, column 5, row 25. Thc' 1111 it s selected were: 04, 34,
72, 30, and 44. Tht'~;e are shown by the cjr,'l, c: (Tn the sketch.
Next, we con,dder a systematic sample of 5 units to illustrate the
nature of the "pdpl'r" substrata which can he , rc'ated by the choice of the
number of substrald ,n sampling interval (s"t' c;,_'ction 4.2.4 for discussion).
The purpose of t:l Lo-; IS to illustrate two point s: 0) That a sampling frame
can be modified, ,'itill'r to create additiollal;t ratification or to modify
the number (or si 01') ()f sampling units; ,mJ (') to show one type of paper
substrata based ~~ ~l'ographic proximity. If ~t wished to achieve the
maximum degree of nar:ural stratification, viC '.-]('u1d have 5 "paper" strata
and the sampling interval would be 89/5 '" 17.~. To avoid fractional sam-
pIing intervals illlJ ~() creat'2 5 paper strata ,,'j t h C'qual numbers of sampling
units, we divide,J the largest unit into tHO units or the largest two ad-
joining units into three units. This results ;[1 the strata now containing
90 S.U., that is,S substrata of 18 units or a sampling interval of
70

90/5 = 18. The natural boundaries of these paper strata are shown by thedashed lines and with letters a, b, c, d, and e. A systematic sample of5 S.U. 's is selected, or one cluster out of the 18 possible clusters isselected. Using a random starting point on page 3, column 20, and row 13,the random number obtained between 1 and 18 is 8, which results in unitsnumbered 8, 26, 44, 62, 80 being selected. These units are shown by theX's on the sketch.
However, the usefulness of the stratification or the sampling error ofthe systematic selection can only be shown if two or more replicated samplesof the same type are selected. This is normally a part of the postsurveyanalysis. We have looked at the creation of "paper strata" within the landuse (or primary) strata. The structuring of the sampling units within aprimary stratum to create "paper strata" is done (1) to insure a more repre-sentative distribution (increased efficiency) of the sample as compared withsimple random sampling over the province, (2) to use a simple and conve-nient method of selecting a systematic sample, (3) to provide a basis formeasuring the sampling error of a systematic sample, (4) to provide a post-survey basis for analysis which may suggest a more efficient survey designfor subsequent surveys, (5) to enable assignment of interviewers to repli-cates to reduce the influence of the interviewer on survey results.
It should be pointed out that while the nature of the frame modifica-tion was very minor in this example (from 89 to 90 S.U.) there may arisesituations in which the modification may be more substantial. If, forinstance, the characteristic of interest occurs infrequently, it may bedesirable to increase the sample unit size, say from 2 km2 to 4 km2, somost of the sampling units will have present the characteristic which weare interested.
3.3.3 Exercise 5:Using the sampling frame constructed for Salc~do Province, each student
is to select two replicated systematic samples of size 5 in Stratum I.
3.3.4 Sampling from a List FrameSeveral exercises in sampling from the list frame assembled in chapter 2
will be undertaken by each student. First, a sample of primary units (clusters)based on selecting the first-stage units with probability proportional to thenumber of second-stage units, then selecting a constant or fixed number of
71

secondary units for eaL'h primary unit. The seclH1d l'):L'rcise will consist of
selecting replicated s:l:npl,'s from each of the str~-it i ,.:hich were created in
chapter 2.
3.3.4.1 Sam~-"Sy.l_<:'_ct~~o~Using a Two-Sti]EC'_l'r'l~(t'~~~
Twenty primary 'mits are to be select,'d ii; Lng unequal probabilities
of selection with rCll Lacement based on the numh. r of name-address units in
each city. In tlw a n_'il frame, the count un j t C, \.'llU 1d be analogous to the
cities and the segments would be analogous tu ::Ill' name-address units. For
the second stage in tile selection, choose tv/U ILln1('-address units using sim-
pIe random sampling without replacement. 'I'lli S i1r"lhability of selection
scheme results in eaL'l1name-address unit having the same probability of
selection. \.Jhen lhi-; feature is present, lhl' .-;;lmplc is frequently called a
self-weighting design. The equal probability 01 selection for each name-
P ( i )
address unit results because:
(1) The proh.1hility of selecting an indiv.uual primary unit is:
;--1.1
cH.
i=l 1
wherc· ~1. i c; the number of name-addn :-;;.;units in the i th primary1
unit ;ll1d
c~1. N
i=1 1.
is the tllta1 number of name-address units in the C primary units
in the fralTe.
(2) The pruba11ility of selecting a sC'conchrv unit within a given pri-
mary un j tis:
P . 1 ') 1~l,] =: Mi
Or, thE' 111Honditional probability "j !·;electing any name-address
unit is
P (l j )
3.3.5 Exercise 6:
P(i) . P(j I i)c
Using the strata constructed [or the list frarn~ in chapter 2, each stu-
dent is to select a simple random sample of five name-address units in each
stratum.72

RANDOM SAMPLE NUMBERS - Page 1
Q) •bOrl ~to 0 0
~~~rt r--t93049 79367 00812 41365 0451562865 09576 97207 33739 7834500800 72496 24767 61768 0722864340 02224 48336 14891 7218892168 52692 31224 12185 43065
20494 18813 16242 40257 6640287693 30242 70545 69128 5152805567 05561 82071 07234 6769085166 37189 75671 33879 2741126704 47922 56650 40236 66207- -
01047 81624 77395 62310 4150158183 21952 84098 28913 5573664667 57092 21315 04731 7187727149 13843 09817 09407 8827666232 80293 74502 36925 60184
40500 21406 00571 87320 8168335892 49668 83991 72088 3021054819 26094 51409 21485 9476464224 47909 09994 23750 1735136913 58173 45709 83679 82617- -64254 64745 10614 86371 4324482018 25536 74031 31807 7013328833 44043 96215 21270 5942796879 27659 95463 53847 4092195938 76014 99818 16606 19713
97154 71237 06073 57343 5142878790 17026 59008 28543 1157625034 59325 08844 95774 4932370116 44091 88505 15575 4492 766904 23000 73259 68626 98962
91171 28299 62619 81550 4679874547 13260 79262 55831 8378430448 14154 75795 39465 8235306584 29867 45898 66415 8934968548 86576 14344 75889 04514
49319 50206 22024 56124 5074981034 86779 34622 70859 3304568905 44234 18244 31602 3838888530 72096 44459 31449 9318237227 11302 04667 32526 64712
73
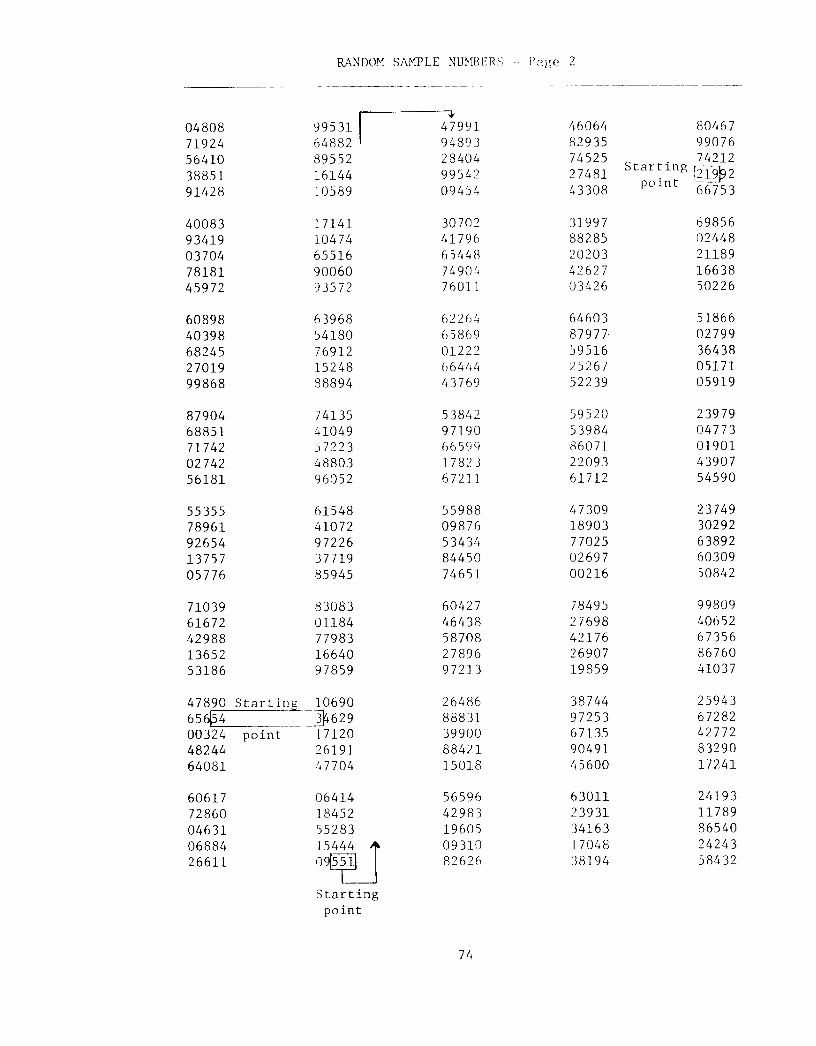
RANDOM SA1'1PLE NU:-'IBEES -- Page 2---- --------~--- - ------ ---- -- ----- -- ------------------
~04808 99531 I 47991 46064 8046771924 64882 94893 82935 9907656410 89552 28404 74525 . 7421238851 16144 99542 27481 Star: lng 1219p291428 10589 09454 43308 pOlnt 66753
40083 17141 30702 31997 6985693419 10474 41796 88285 0244803704 65516 65448 20203 2118978181 90060 74904 42627 1663845972 93572 76011 03426 50226
60898 63968 62264 64603 5186640398 54180 65869 879 77, 0279968245 76912 01222 59516 3643827019 15248 66444 25267 0517199868 88894 43769 52239 05919
87904 74135 53842 59520 2397968851 41049 97190 53984 0477371742 57223 66599 86071 0190102742 48803 17823 22093 4390756181 96052 67211 61712 54590
55355 61548 55988 47309 2374978961 (~1072 09876 18903 3029292654 97226 53434 77025 6389213757 37719 84450 02697 60309as 776 85945 74651 00216 50842
71039 83083 60427 78495 9980961672 01184 46438 27698 4065242988 77983 58708 42176 6735613652 16640 27896 26907 8676053186 97859 97213 19859 41037
47890 Start in.&._10690 26486 38744 2594365$4 ____~629 88831 97253 6728200324 point 17120 39900 67135 4277248244 26191 88421 90491 8329064081 47704 15018 45600 17241
60617 06414 56596 63011 2419372860 18452 42983 23931 1178904631 55283 19605 34163 8654006884
l~09310 17048 24243
26611 a 551 82626 J8194 58432
Startingpoint
74

RANDOM SAMPLE NUMBERS - Page 3
22224 02627 91576 16781 8918424473 42096 76920 88864 5416438582 21871 14672 93362 6798146094 43845 91838 79574 0800391061 31674 73729 99315 16699
00397 56753 53158 71872 6815314328 44708 72952 27048 6788788534 87112 68614 83073 8879497347 87316 73087 77135 7188301366 72976 01868 51667 63279
37106 20523 21584 93712 8365406476 70603 97122 44978 7802881717 48410 94516 154 ~7 8~ 32351583 69788 41758 55004 3099250120 33884 83655 88345 69602
89761 23053 77480 28683 6832488943 66660 11057 98849 2949971685 97247 79368 43710 8036517402 66300 94385 01717 9619152606 39860 92127 42588 93307
66035 07223 76264 29148 6865221565 30786 45403 33782 9342488735 75275 03080 77653 5543050~ Starting 80166 28017 52611 6001280834 point 11317 93109 91857 47904
26872 72927 79021 51571 6882516530 96086 17329 87959 2372784644 00448 86828 50552 8483288620 72894 94716 84622 4977122209 78590 68615 58113 23727
04795 53971 14592 39634 0385554291 56045 61635 32186 8665130654 48543 18339 65024 3338611123 08732 49393 12911 7580356577 51257 83291 12329 17827
58987 02026 42969 59144 8434916851 99197 70476 77113 4632002104 49435 77706 18924 2495754440 07893 31618 35707 6513087681 42543 69847 81848 32034
24337 61634 52574 83649 2872562557 25292 72781 17186 1039302913 03885 58822 82941 4380668706 87619 13846 56197 2715105930 33213 78416 00194 91369
75

RANDOM SAMPLE NillffiERS - F3ge !~
"------
40083 17141 30702 31997 6985693419 10474 41796 88285 0244803704 h5516 65448 20203 2118978181 90060 74904 42627 1663845972 93572 76011 03426 50226
60898 63968 62264 64603 5186640398 54180 65869 87977 0279968245 76912 01222 59516 3643827019 15248 6644l, 25267 0517199868 88894 43769 52239 05919
87904 74135 53842 59520 2397968851 41049 97190 53984 0477371742 57223 6659CJ 86071 0190102742 48803 17823 22093 4390756181 96052 67211 61712 54590
55355 61548 55988 47309 2374978961 41072 0987(, 18903 3029292654 97226 Starting 53434 77025 6389213757 377~ 84j450 02697 6030905776 85945 point 74651 00216 50842
71039 83083 60427 78495 9980961672 01184 46438 27698 4065242988 77983 5870.') 42176 6735613652 16640 27896 26907 8676053186 97859 97213 19859 41037
47890 10690 264 i)r, 38744 2594365654 34629 88831 92 753 6728200324 17120 39900 67135 4277248244 26191 8842] 90491 8329064081 47704 1501.'-: 45600 17241
60617 06414 56596 63011 2419372860 18452 42983 23931 1178904631 55283 19605 34163 8654006884 15444 09310 17048 2424326611 09551 82626 38194 58432
04808 99531 47991 46064 8046771924 64882 94893 82935 9907656410 89552 28404 74525 7421238851 16144 99542 27481 2199291428 10589 09454 43308 66753
76

CHAPTER 4 - EXAMPLES OF AGRICULTURAL SURVEYS
4.1 IntroductionIn this chapter some schemes and techniques previously discussed will be pre-
sented to deal with "typical" problems of agricultural surveys. This will be doneprimarily through the discussion of two actual surveys and an analysis of the surveydata. The estimates and their sampling errors will be presented, based on makingthe computation with a desk-top calculator. The students will also code and punchone of the data sets for analysis with the computer. The listing of the computerprogram is included in the appendix along with the necessary input cards for one ofthe two surveys. However, no lengthy discussion of missing, incomplete, or theediting of data will be attempted in conjunction with the examples, but rather itwill be assumed this function has been completed for each sampling unit prior topreparing the estimates.
4.2 Some Design ConsiderationsThe difference between a statistical investigation and one not statistical is
that with the statistical investigation, we are able, in the end, to evaluate themain sources of uncertainty in the results. The more we know about what is wrongwith a result, the more useful it becomes. It is possible we may learn more fromwhat went wrong in a study than from what went right. Ability to evaluate theuncertainties in a result is not an accident. Only by use of appropriate statis-tical design, which will include statistical controls for the detection of blemishesand blunders in the measurements, interviews, and processing, is it possible toevaluate the possible effects on the results that arise from the chief sources ofnonsampling errors.
Use of a nonprobability sample (one where some element of human judgmentrather than random numbers enter directly into the selection of the sample units)is worth no more than the reputation of the man who prepares the study. The reasonis that there is no way except by his judgment to set limits on the margin of un-certainty of the estimate. Probability samples offer relief from the uncertaintyof the magnitude of sampling variation in a result. "Judgment samples" ignore theproblems of nonresponse and the biases introduced by it, but do eliminate occa-sional high cost and inconvenience of travel.
The first question to ask when a statistical investigation is proposed is:Can you get from any unit in the universe (person, household, farm, business
77

po, t ,Ih Ii sillne[[ t t), nn mat ter how vnu 't'l ,'t it, the inform[ltion that. - ,)
VCll] rL'qu lt~l' , ~"i'sti()n:
l'licit the desired infol::,il ,i'l fr0m (,I/L'r': unit if' I,!" : \ l'rSl, ",auld the comp i I a-
i(l[l (,j results be useful I f the anSWl'l is yes tl i 1:1.' ~',Ll'OIHl question, then a
.; t ,I t i st iCell invest igd ti n', If the answer to either
qlll'~,ti(lll is no, then takl' ;.'cond look: revi se t ll~ "I ;:1 , pr the method, or abandon
efficiency because of
, ,l s pf seek i:lg out d'I'
Thl'~l' :3re ('ssent ia] ly of three
"~"Itijying the elements in the
, " ,.1 ::-; r are cas es , (2) high
(3) the case
: i,,' vclrious operations might
'I' i l' fly.
4 . ..' . 1 i ~i.!.1JL!:.Le_I1~~lts f o~_~ ;1'<"( i, 1,_C..r.2..u.~
" r t a ins p f' cia I g n, I Ii ,-; '11 [', hf- par tic u 1a r 1y d iff i cuI t
A special group may be
"dairy fllrms," ",'ot:, Irms," ]anu ()vinerS w:it:h ,Jf" h,,,r for sale, housl~holds
with Illl1'rnpllJYl'd pl_'L':ll~. dl'alers in fprtilizl'I':-:, l,rsons with certnin diseases,
:ihlt' groul' like: !.lll!' ,,!JI':t!-;, farms, or business
i,Il group is a subgr('u~ Ij sume larger and generally
l'lement:~ in the SUI','I,"J J ,ire n(Jt identified prior
is part (,f the burdI'" ': t.he slIrvcv to seek out and
iii r s 11 i p . Thi 0 :.;(> a r \ j,- ") d u r e , frequently called
,[I'ried put c'an be l'Xl'l'Il.'iI'" 'lIhJ leave very little of
To deal with
s: "j,'P of sampling unit,
l i .1,,<I -i numher of rare elements
'I 1 ! i t 1~: ; III I , r,l';l-;Url'-(,j--> i;'l' intl'l"TT',lf 1"'1, strat ification, doublE'
t .' (".
Ii I
'"~r
I,
!I il)!l O!l lists, est imates
11"'11(;-', innovation {l! more

4.2.2 High Cost of Information per UnitIn many rural communities, growers do not know the actual area planted to
crops, but do know how much seed, or how long (in days or hours) it took themto plant the area. In such situations, it may be necessary to subsample everykth planting and measure the field size with special workers using rules, tapes,or other equipment to determine accurately the area planted. In sampling areasplanted to corn, wheat, rice, or coffee for yield per acre, the cost of deter-mining yield per acre by some objective means (as crop cutting) may be veryexpensive. It may be possible to get the grower's estimate of the yield fora field (or farm) and then count heads (or beans) in the same field and takesample heads to a central point for weighing or threshing. If the grower'syield estimates are correlated with the more expensive determination of theplant characteristic per unit area, this type of double sampling can be veryeffective in reducing costs and providing yield data rigorously defined in termsof weight per unit.
Obtaining data on crop input and other farm expenditures may require com-piling records or very lengthy interviews to verify actual costs. It may be abetter use of survey resources to merely determine the different kinds orcategories of costs incurred for each farm in a large sample. Then in asmaller sample, obtain detailed dollar costs per acre (or per farm) for thecrops or farm characteristics of interest. Such procedures involve two-stagesampling to obtain the data which is too costly to secure for all farms becauseof the length of interview, availability of respondent data, or special train-ing of workers to secure useful data.
4.2.3 Unknown Operational CostsThe cost of performing each of the operations in a survey and of feasible
alternative procedures is seldom known with suitable accuracy, particularly inthe large-scale nonrepetitive surveys. In such cases, the planners frequentlyneed more information on costs and other operational matters, such as clarifi-cation of concepts and definitions involved in data collection. While pilotsurveys cost money and time, which may reduce funds for the survey proper, theycan be viewed as a two-step survey that can lead to more effective use of avail-able funds. Pilot surveys are also an excellent training device and are usefulfor "debugging" procedures. Since many surveys are repeated at various pointsin time (for example, quarterly), the first survey can be viewed as a pilot orsmaller survey which will lead to more efficient surveys in the future. Where
79

possible, it may be pr.tl tical to conduct the pi lut c;urvey on fruit or tree
crops (which remain constant over time) for the fir,;L and smaller survey.
Also, the survey planner will need to consid£'r wl1l'tlH'r to use the same sample
repeatedly or to use independently selected samples for each survey. In
general, a mixture is desirable for most purpose:;, with approximately one-half
of the sample being changed for each survey.
4.2.4 Use of Paper Strata
A technique for l'rc:lting substrata which'ul' n'ferred to as "paper strata"
can be used to increasE:' :-;;lmpling efficiency wit 1l(1\1j !"cqui ring detailed infor-
mation on auxiliary v:lriahles or on variances wllicl, i.s required [or detailed
stratification and optimum sample allocation. It ie' discussed at this point
in the course, since tl1t' paper strata are designed L(1 satisfy the needs of the
data collection system. ~dditionally, they make it possible to employ simple
sample selection procl'dures and summarization met 11".1:, in calculating the esti-
mates and their samplinf! errors, using equal probah;lities of selection.
The paper strata arc assembled from the existillg frame units to reflect
similar crop types (or types of farming) as well ilS microgcographic stratifi-
cation within the prirn:lrv land use strata. Most of the information used for
this task is subjectivc' in nature, being based on "-,'p types by localities,
census data, elevatinll contours and houses on top('~'-aphic maps, and other
local sources of in[o[!l!:ltion useful for agricultuLl surveys. Using this in-
formation, a detailed stratification within the prinary strata is achieved.
If the purpose of thl' '\,lta collection system is tl' "btain household and family
living information, the paper strata might be baslc'd ('[1 factors such as value
or type of housing, pl'rsnnLll income, or ethnic hack.l',round as well as micro-
geographic considerati,'lls. This type of stratifiell ion might be appropriate
even for an agricultural system within an urban Jane: use stratum.
This technique may be used with a previously f ..nished frame or a prelimi-
nLlry listing of units fer a new frame being constrll,ted. It is achieved by
reassembling the listing of primary frame unit~ (anel occasionally subdividing
or modifying primary lrnme units) within a land 1]5(' stratum in a new order so
that "like areas" are I istecl consecutively. Sine!' the stratification is
achieved by a reass('!)'hl\ of existing listing fonls, t hey are called paper
strata. It is convenic'nt to assign the same total number of sampling units to
each paper stratum and t () select the same number n! ~;ilmpling units in each
80

paper stratum within a primary land use stratum. These two features make iteasy to obtain survey tabulations or additional tabulations which may be re-quested for geographic areas.
The number of paper strata within a land use stratum is usually the sameas the number of sampling units per replication in an interpenetrating design.Thus, the sample size (nh) for a land use stratum is a product of the number ofreplications (~) and the number of paper strata (~); that is, nh = ~kh •Since it may be necessary at a later time to reduce the sample size as the pre-cision requirements are changed, it may be desirable to be able to reduce thenumber of paper strata, (i.e., sampling units per replication). Consequently,it is convenient to let the number of paper strata be a multiple of 2 or 4 sothat pairs or groups of four paper strata can be combined if a smaller sampleneeds to be allocated to the land use stratum. Of course, the sample size canalso be changed by increasing or decreasing the number of replications. Thistype of substratification and flexibility in setting number and size of paperstrata is believed to be well suited to the needs of countries making a majormodification in or developing a new data collection system.
4.3 Coffee Survey in the Dominican Republic4.3.1 Background and Design
In 1970 the Secretariat of Agriculture was seeking technical assistance toimplement a system of sampling. At about the same time, the InternationalCoffee Organization in London was seeking to update information on the DominicanRepublic's coffee industry. The urgent Deed of the ICO for special informationand the domestic needs for other regular agricultural data provided sufficientdemand to construct an area sampling frame and conduct a limited agriculturalsurvey. In March 1971, through the efforts of AID, the area sampling frame con-struction was started by SRS personnel in Washington, D. C. under a PASAagreement, using available cartographic materials and aerial photographs. InJanuary 1972 the completed materials and a sample of 160 area segments selectedfor the first survey on coffee were shipped to the Secretariat of Agriculture.In addition, the Statistical Reporting Service was asked by AID to providetechnical assistance in training, conducting, and coordinating a system of agri-cultural data collection through preparation and interpretation of estimates.An SRS individual was assigned to assist in this task for a two-year period.
81

The sampling pl.an f)r the first coffee and (',I"ZJel ~;urvey was a stratified
replicated (or inteqJL!H·rrating) design. Tw() pr;Jl1.ir\' strata were the Inten-
sive Coffee and Cacao :-it riltum and the group o[ l tH' remaining four land use
strata in the area 1 ra,pp. Within t,itch of th('~o' pi ifllr\' strata, 20 e(jllal-size
paper strata were creall"! in Stratum II and Li) e'CjII,tl-size paper strata in the
combined Strata I, fl, III, IV, V. The paper str;!t;] were developed bv listinr;
the frame units by geographic areas within th,~' provinces and across pr(1vinces.
It was generally possibl<o to develop similar l:ln'! Ilc~" areas across boundaries
by making several alt~rn.1.tive or preliminary li~tilgs of the frame units prior
to adopting th£' final piper strata. In addition, five geographic areas were
identifiable in the [.",' ;,rimary strata. Witll in t' It II stratum replicated system-
atic samples of size ,211 md 10 were selected, start ing with a random number in
the first listed pape'l' '- foltum and using nonl'(']'1. ,Ill nt sampling for successive
samples of size 20 dlhi 1'1. Each sc']l'ct",d re'!' II. ,I, t:l'nstitutL'd d cluster of
size 20 (or 10) for "1.1I',.;is purposes, sinn' <...!' Impling unit in the frame is
assigned to one and '"11,' onc clust£:r of SiZl,:.'.(I >r IrJ) within each stratum.
Each cluster so chOSe' 1 ',>ntains one segment fn>m I':;cll paper stratllm which in-
sures representativt',;-,s~ in terms o[ the geogl-dphil and crop type pattern
present in the frame lsonstituted.
The sampling unit size was based on experil'[1,[ In the United States with
modification to accc>mm():l.lte the availability ,>j n.ltural boundaries and expected
number of farms per ~nit :lH'a. In the intensel, II moderately cultivated areas
ample natural bounda!'il'.~ appeared to be avail:lhle' :I'ld the average size of hold-
ing was expected to l,e' small. Consequentlv, iI ';,l::Jplin~ unit which would average
two square kilometers ,va'; chosen. At a latc·r l iTT:I' c'ach sampling unit can be
split in half if eitih'r the postsurvpy analysis "l' . o:-;t consiJerations indicate
a smaller unit of one :~qllare kilometer would hI' <1."o:irable. In the populated
places a sampling unit: or one quarter of a sq\l~re kilometer was used and in the
extensive marginal agri':1I1tural area a unit of f.:,:tr square kil.ometers was used.
Obviously, smaller s,lmpllng units could he ohtain,·,,1 hv subdivision at a later
date. Consequently, th,' size of the sampling \1;]i: (i.e., segment) in Stratum II
was two square kiloml't:er-~; and in the group of 5t r.il.1 (I, III, IV, V) was either
1/4, 2, or 4 square :Zi 1'>I!leters, depending on whi," "f the fotlr land use strata
the sampling unit wa-; !~,' leeted from. However, C;jl II replicate in the group of
strata (I, III, TV, \') '"'':is expected to contain ti1";;jme proportion of 1/4, 2,
or 4 square kilometer 11Il:t:~. The use of thl' f iv,' ,~lrata for later surveys was
82

recommended to permit maximum benefits from stratification and minimum vari-ation in sampling unit size within strata.
The Sampling Frame Configuration and Sample Size forthe Initial Coffee Survey
Strata
II
:Expected S.U. size Total Sample :Number of : Number ofnumber :allocation:replicated: paper strata
Frame Coffee S.U. :(no. S.U.) : samples :(cluster size)survey Nh = nh = mh : = kh
2 km2 2 km2 978 120 6 20: : : : : :---------------------------------------
I 2 km2 3,193
III 4 km22 7,873 40 4 10
3.4 km
IV 4 km2 2,784
V .5 km2 261
:3.3 km2 :15,089 160
Each segment within a stratum was selected with the same probability, whichmakes it possible to do most of the summarization without expanding the data.While the sample size for the noncoffee stratum (I, III, IV, plus V) was believedto be smaller than desirable, it was anticipated that a much larger genera1-purpose survey would be conducted later in the same year. Consequently, asecond estimate for these strata would be available and could be expected tohave a smaller sampling error. The basis for estimating the total tareas ofcoffee and its sampling error squared is given below.
Let
~ij thethe
1/total tareas- of coffee.th. th1 repllcate of the h
reported in the jth segment (S.U.) instratum (values given in table 3)
1/ 15 tareas approximately 1 hectare
83

total _t_a_re_~~of coffee reported in the jth replicate of the hth
stratum (coLumn totals in table 3)
Thi estimated total tareas of coffee for stratum based on ith replicate
j=lXh" "lJ
thestimated average total tareas of coffee for the h stratum
1
~ i=l
Nh total number of segments (S.U.) in stratum (subpopulation)
number of segml.'ntsin cluster in hth stratumthnumber of cl.usters in h stratum
nh ~ . kh = numbl.'rof segments in stratum
and the variance of the estimated total is
i=l
(T - T ) 2hi h--------- ---mh(mh - 1)
4.3.2 Calculating Estl~'l:..tesand Sampling ErrorsA summary of the reported tareas in coffee by sl'gment for three of the
replicates in Stratum II ilnd two replicates in the other stratum are presentedin table 3. The estimate of the total tareas planted to coffee and its samplingerror can be derived, based on two alternative methods of summarizing the surveydata. The two methods produce identical results. The first method is based onworking with unexpanded data by segment, cluster, and stratum given in table 4.The computations with the expanded data are left as an exercise for the student.The estimate and its sampling error for StratuIIIII are given below for system-atically selected replicated samples.
The variance is:179762 + 207992 + 229942
V(~i) = 2
and variance for average replicate
')
(6l,769~ 3) 6,327,946
2,109,315
84

where ~i = the reported total tareas for the replicate (i.e., cluster)
~ the average reported total tareas for all replicates in Stratum II
20,589.67
and the coefficient of variation of ~ is
12,109,315 _ 07054 7 05%20,589.67 - . or. 0
or, using table 1, the expanded replicate total Thi = (48.9)~i
Hence, the estimated total tareas of coffee for the stratum is:
Th = (48.9)~ = 1,006,835.
The variance of Thi is
15,131,447,755
andV(T .)
3 h~ = (48.9)2 . V(~) 5,043,815,121 •
ThereforeCV(T )= 15,043,815,121
h 1,006,835 .0705 or 7.05% .
4.3.3 Postsurvey AnalysisAlthough the survey error has been derived based on the sampling procedure
used, the question of whether there was either a more efficient or equally effi-cient method of selecting the sample can also be answered for several alterna-tive schemes. Consider three methods of selecting a sample of 60 segments fromthe 978 in the stratum: (1) A sample stratified by paper strata; that is, asimple random sample of 3 from each of the 20 paper strata, (2) a simple randomsample of 60 without any paper strata, and (3) the three replicated samplesusing the paper strata to provide or control geographic dispersion of each repli-cate. This estimate and its sampling error were computed in 4.3.2.
Method 1: The postsurvey analysis of expected sampling errors is based on theselection in each paper stratum of independent random samples of size m. Avariance is computed for each paper stratum (rows in tables) from the m segmentsand "pooled" (or averaged) across all paper strata. (See table 5.)
85
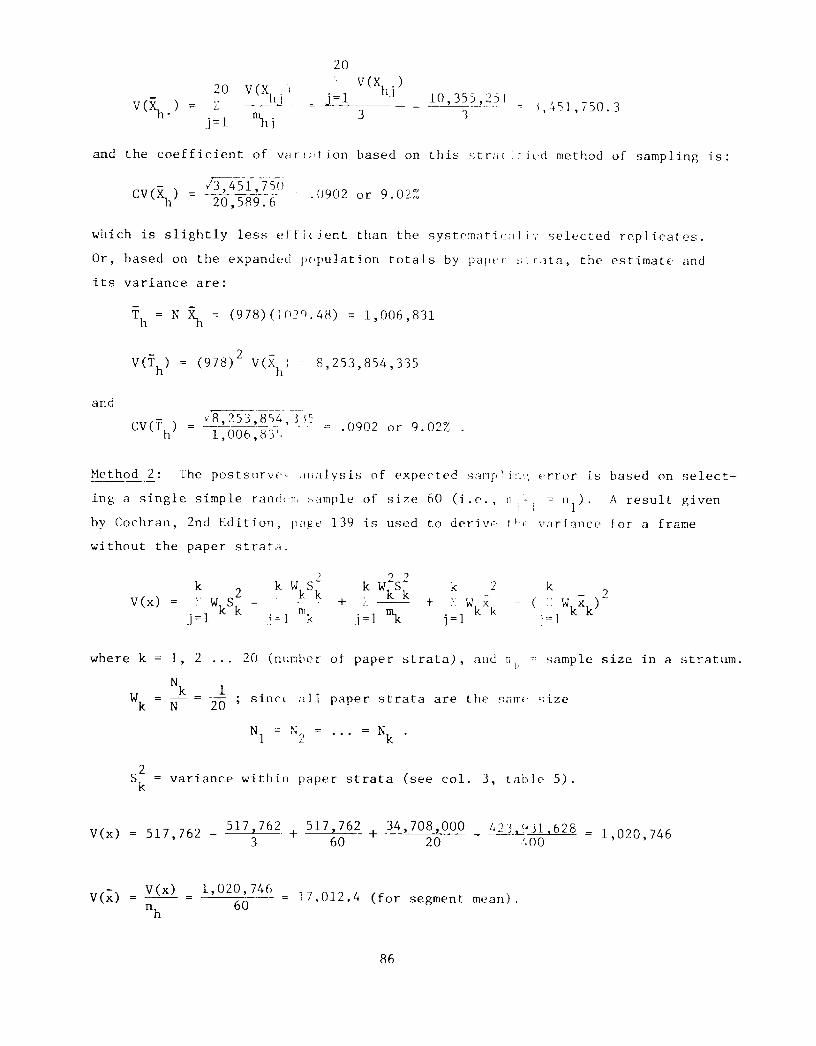
20
j=l
VeX .)_--.lu __
lI)l j
20V (X
h.)
j=l J
3lQ, 35~_.L2.5]
3
and the coefficient of Vilfl;'tion based on this c;tril[ ;til.:d method of sampling is:
CV(~)/3, 451 ,2~J;
20,5R9.6 .0902 or 9. 02.~~
•...,hich is slightly less e! f i c j cnt than the systcrna t i <:;1] i ',' sell'cted replicates.
Or, based on the expanded pc'pulation totals by pa]H'r ~;; rata, the estimatE:· and
its variance are:
- -Th = N 211 = (978)(J()YJ.4R) 1,006,831
and
8,253,854,335
Method 2: The postsurvc'\ ,lliil1ysis of expected sal'lpl in:" error is based on select-
lng a single simple ranc'(,n, :--ample of size 60 (i.e., 11]1'1 ~ n1). A result given
by Cochran, 2nd Edition, pnl'''' 139 is used to derive t!1( variance for a frame
without the paper strata.
k2
k W2S2 2 kk 2 WkSk k
k k - - 2Vex) :- W S + '" -- + . \ Wk xk ( . Wkxk)
. 1 k k TIlk j =1 ~J= j = 1 J= j=l
where k 1, 2 20 (ntanbc r of paper strata) , and II sample size in a stratum.k
Wk
Nk 1 sincl a 11 strata the ,-;ize
20paper are Silm(~
N
2Sk variance within paper strata (see col. 3, t3bte 5).
VeX) 517,762 _ 517,762 + 517,762 + 34,708,0003 60 20
Ij]3_~j)1 ,62E!IOO 1,020,746
1,020,74660 17,012.4 (for segment
86
\mean; .

The population total for a single random sample in Stratum I is:
and
T (978)(1,029.48) 1,006,831
2 -N1
V(x) (978)2 17,012.4 16,272,120,284
CV(T) 116,272,120,2841,006,831 .1275 or 12.75% .
The relative errors for each of the three methods of selection in order ofmagnitude are:
12.75% (for method 2)
9.02% (for method 1)
7.05% (for method 3)
The simple random sample is much less efficient than either the systematicallyselected replicates over paper strata or a sample stratified by paper strata.
4.3.4 Exercise 7:Each student is to compute the expanded estimates for table 4 based on each
segment for the grouped strata and derive the estimated population total for thecountry and its sampling error.
87

Table 3--Reportt'd (areas of coffee by segmelit Gnd subsample
Subsample or Intense coffeereplicate __ --,~~L_.cacaostratum Q:lL _
No. (m) :
Other stratum____0, III, IV, V)
Segment or~er strata No.(k)
123456789
1011121314151617181920
(X- .. )1J
1 2
1010 886j 1;' 65
1HOl 4205L~41) 336
C'OO 701 Jl 7 1071
44() 153730 75
1145 650~)Og 350
1664 77586 2128
146:) 884] ISb 369243~ 2328
:20:' 324137 342
2217 3056() 2351
30 381
Total forreplicated (~i) 17976 20799
Expansion factorfor replicate 978
2048.9
Average replicatetotal (~)
Average expandedtotal forpopulation CT
h)
20,589.67
1,006,834.86
88
4,598,165.25

Table 4--Expanded tareas of coffee by segment and subsample for one stratum
Segment orpaper strata
Intense coffee and cacao stratum
2
Other stratum
1321
Subs ample orreplicate
No. (m) :
123456789
1011121314151617181920
49,389.017,212.888,068.961,027.2
9,780.054,621.321,956.135,697.055,990.524,841.281,369.6
4,205.471,491.857,995.4
118,924.89,877.86,699.3
108,411. 3o
1,467.0
43,325.43,178.5
205,624.516,430.4
3,423.052,371.9
7,481. 73,667.5
31,785.017,115.037,897.5
104,059.243,227.618,044.1
113,839.215,843.616,723.8
149,438.4114,963.9
18,630.9
82,494.321,124.8
231,639.3138,289.2
20,831.4104,254.8
35,648.184,010.238,190.9
8,264.1195.6
18,239.723,961.024,743.492,421.015.207.939,560.159,658.073,350.012,322.8
To
be
completed
by
student
Population total byreplicates (Th) 879,026.4 1,017,071.1 1,124,406.6 :4,913,659.8 4,282,670.7
Average populationtotal (1h) 1,006,834.7 4,598,165.3
89

Table 5--Means and variances of par~r strata for Stratum II
Paper str;lta
123456789
1011121314151617181920
Total all str.ll.l
Average per pcl})"rstratum
Means ofpaper str~ta
1,194.3283.0
3,581,fI1,470.U
232.01,440.(1
443. ~.841. 0858. ~.342. ~:814. ':862.3945.3687.0
2,216.7279.0429.3
2,164.31,283.7
22 1. ()
20,589.b
1,029.'j
90
Variances forpaper strata
185,88437,243
2,447,0561,589,701
32,452359,677
82,965684,103
65,78028,774
690,0601,222,026
239,017191,443
82,7374,489
118,616844,804
1,416,90031,521
10,355,251
517,762

4.4 Tunisian Acreage and Livestock Survey4.4.1 Background
The 1974 Tunisian Acreage and Livestock Enumerative Survey (Base LineStudy) had its start with the Livestock Project initiated by AID in Tunisia,which is aimed at increasing livestock production through an extension program.For their project to be successfully evaluated at its conclusion, AID felt itwould be necessary to obtain additional information concerning the currentagricultural situation in Tunisia. In particular, they needed a study of farm-ers having livestock to obtain certain sociological information on the Tunisianlivestock producer and the characteristics of livestock operations in the fivenorthern gouvernorats. As the study developed, certain other information wasdeemed necessary and thus the following purposes for the survey evolved:
1. Develop a profile of livestock producers determining such items as the levelof education, size of household, amount of hired labor, sources of agricul-tural information, ability to use agricultural information, etc.
2. Determine land use, the extent of crops complementary to livestock activity,availability of forages and grains for feed, and the extent of crops com-petitive to livestock, such as vegetables, fruits, and food grains.
3. Determine livestock base information, including inventories and classifica-tion of cattle and sheep.
4. Examine current practices of livestock producers, including feeding andgrazing practices, housing practices, etc.
In late 1973 the Statistical Reporting Service of the U.S. Department ofAgriculture was contacted by AID and a tentative project developed. A team oftechnical consultants consisting of three SRS employees was assigned to the pro-ject in January 1974. The team's first work in Tunisia occurred in lateJanuary. The bulk of the Tunisian personnel involved in the project was sup-plied by the National Institute of Statistics. They provided a group of ninetechnicians to construct the frame and select the sample and approximately 45people to serve as field enumerators and supervisors. They also provided overallleadership in questionnaire design and conduct of the survey. Other agencies inTunisia provided input in the scope of the survey, questionnaire development andlimited personnel in the actual survey work.
The pretest survey was conducted in early March and provided good results.The actual survey took place in May 1974 with training of field personneloccurring the last week in April.
91

Four land use str'ltl were distinguished for ti](- five northern gouvernorats
of Tunisia. The definit i,ms of the four str:lta Wt'r,-
I. Cultivated - All 1an,1 which has been worked lOr improved in some manner was
included in this c; t fltum. The only except: ion:; :11'(' those areas where vine-
yards or orchards ',.}ere extensive enough [,) be 1']3ced in a separate stratum.
II. Noncultivated - The major component of tills stTutum was the national
forests; it generall,' consists of eithcr \v'O\ldl.md or brush. Mountains
which for the m(Y-;t"Ht have little or no vqllation were included. The
personal knowledg~ of the Tunisian staff cant ributed greatly in each spe-
cific decision cOlll'crning the inclusion of nonl [-rested land in this stratum.
III. Urban - This stratum consists of intensivl'] \' ~'('Plliated areas such as cities
and villages. Each city or village must have an area of 1/4 square kilo-
meter or more to bL included. The topogr.lphic maps which were used for
stratification WlTl unsatisfactory for del jqil :ng the cities and villages
because of their !,;(','jle and age. Contact phnt,-, )'rintf' (scaled 1/12,500 and
1/25,000) were ordt'rcd for each city or vill:H'.l' and used in the stratifi-
cation process. Th.-' latest photographs 'l'.'a i1,'d:Ie for this purpose were
taken in 1962. It W1.S recognized that tl!(, eit"s and villages may have
expanded since the photos were taken. Hm..'evcr, these problems may be
treated on an individual basis whenever t~e\' arise.
IV. Arboriculture - All vine and tree crops specil ically designated on the
topographic maps wen' included in the stratll!!'. It was recognized that these
may have changed; however, it was determilLeJ tktt circumstances did not per-
mit extensive fiell! work to update the maps. Vineyards and orchards which
were known to be cleared were omit ted, but Ill' new plantings were included.
After the preceding land use strata definition:; were developed, the actual
stratification process began. This consisted of segregating the land area on
the maps according to the strata definitions using available physical boundaries
such as roads, trails, streams, field edges when necessary, etc. After all land
area was classified into one of the four strata, cadl stratum was subdivided into
small areas ranging [rom 1/2 to 30 square kilometers, depending on the stratum
definition. Each of thp smaller areas within stratil, referred to as count units,
was planimetered to determine its area. Sampling units were assigned to each of
the count units by dividing the area of the count \Jnit by the desired area of the
sampling unit and rounding the result to the nean'sl whole number. Sampling unit
92

size was approximately 2 square kilometers for Strata I, II, and IV, and 1/16square kilometer for Stratum III.
The count units were then numbered in a serpentine order, starting in theupper right-hand corner of each map page, and a list was prepared showing thenumber of sampling units for each count unit. From this list samples of countunits were selected with probabilities proportional to the number of samplingunits in each. The count units were then subdivided into the assigned numberof sampling units. A sampling unit was then randomly selected from those in theselected count unit. The selected sampling unit was the segment to be used inthe field enumeration. All segments within a stratum had the same probabilityof selection.
At this time enlarged photographs at 1/6,250 or 1/12,500 scale were ordered.Upon receipt of the enlarged photographs the boundaries of the segments weretransferred from the maps to the photographs. In some instances, it was appar-.ent that the segment was too heavily populated for efficient enumeration andtherefore they were again subdivided into equal parts, a random part selectedfor enumeration and the probability of selection adjusted. Maps showing the seg-ment location, the enlarged photograph for each segment, and plastic grids madeto the scale of the photographs were then included in kits for use by the fieldenumerators.
The Sampling Frame Configuration and Sample Size for the Initial Survey
Expected Total Sample Number Number ofnumber allocation replicated paper strataStrata S.U. S.U. (No. S.U.) samples :(1.e. clustersize Nh = nh mh size) = kh
I 2 km2 8,998 270 18 15
II 2 km2 3,826 36 4 9
III 1/16 km2 2,000 35 7 5
IV 2 km2 286 18 6 3
359
93

4.4.2 Calculat ing ES_L__~Il~~~es an~Sampling Errors
A summary of thc' t,xpanded hectares of barley bv segment and stratum are
presented in table 6. The expanded hectares are dl'rived by multiplying the
reported segment dat.! h'/ 600 for Stratum I and ~2() for Stratum II. The figures
600 and 426 represent tilt> total number of frame UIli~s in the paper strata for
the respective land use ~;trata (i.e., primary str,ll.!). The estimate and its
sampling error squarc.] dre derived using the same formulas as given for the
Dominican Republic case.
Table 6--Expanded hee _<Ires of barley by segmenr., replicate and stratum
Segment Stratum I Stratum IIor paper (m)
-~~----
strataReplicate Replicate (m)
No. (k) 1 2 3 1 2------------
1 (~ .. ) : 633.6 4,346.1 1,207.,'\ 932.5 8,206.02 ~J . 0 782.1 0 596.8 03 3,148.2 0 H21. i 2,945.7 04 396.0 891. 0 5l~. ,'" 8,392.5 857.95 0 0 n 0 06 158.4 1,247.4 1, :lS(, .1) 0 07 99.0 0 0 2,890.8 186.58 148.5 277.2 II 2,704.3 167.89 574.2 1,326.6 ·1'7 'J 1,078.5 2,424.5J ~.:.... • ,
10 0 0 ()
11 198.0 0 990.1112 1,178.1 643.5 475 .. :13 693.0 0 57'" "14 1,881.0 2,871.0 613. ,'.'15 1,009.8 831. 6 1,435.J
-- - -- - --
Populationtotal bY,rep-licate (Thi)
10,117.8 13,731.3 8,741. 20,142.1 11,842.7
Average popu-l?tion total(T
h)
10,863.6
.~,213,730.l
13.6%
94
15,992
34,440,020.2
36.6%

4.4.3 Postsurvey AnalysisAs was done for the Dominican Republic, alternative methods of selecting
samples from the frame are considered. In Stratum I there are 15 paper strata,each consisting of 600 sampling units; i.e., 8998 ~ 15 = 599.9. Three segmentswere selected from each paper stratum. Each sampling unit or segment providesan estimate of the total for the paper strata, and each replicate (cluster of15 sample units) provides an estimate of the population total.
Method 1: A variance is computed for each paper stratum from the m segmentsand these variances are added:
15L: V(T
hJ" )
j=l
9,675,283.1
9,675,283.13
3,225,094.4
and the average variance within paper strata for expanded data is:
9,675,283.115 645,018.9 . (See last line, col. 3,
table 5.)
Method 2: The postsurvey analysis of expected sampling error is based onselecting a single simple random sample of size 45:
V(T) +
(Cochran 2nd Ed. p. 139)
9,664,25715
9,664,257 + 9,664,257 + 13,428,74215(3) 152(3) 15
13,428,742152
1,279,406 (the within-stratum variance based on expanded segmentdata and assuming a simple random sample had beenselected)
if unexpanded data had been used inV(x" )~
V(T)
N2i
1,279,405 = 3.553906 (the variance for a sample of6002
size 1
calculating paper strata variances andmeans)
95

n7,~9757 is the variance [or [j sample of size 45or
Vex) 3.55390645
andveT) 2 -N Vex)
Method 3:
2(~.99~) (.0789757) 6.394,]~~ (variance of mean expandedtotal assuming simple ran-dom sample)
VeT) 3 - 1
) 2 ) (~,590.8)2(10,117.8)~ + (13,731.3) + (8,741.7)~ - 3------------------~ -- --------- -------3 - 1
VeT)
13,282, 380 _._')_~2 6,641,190.15 for 1 repLcilte.
2,213,730.05 for mean oj l replicates.
The three variances we y,1 isn to compare based on tlh' t'tree different proposedmethods of sampling are <IS follows:
Hethod 1:
3,225,094 (';l lecting a simple random ~a]:lpleof size 3 in each ofthe 15 paper strata within S~ratum I; i.e.,n = 3 x 15 = 45)
Method 2:
6,394,188 (selecting a simple random ~l1[lph'of size 45 out ofstratum I; i.e., n = 45)
Method 3:
2,213,730 (systematically selecting rhrpl' replicates of size 15klsed on paper strata in StLitum I; i.e. ,n = 15 x 3 = 45)
These results are similar to those for the Dominc<ln Republic. The co-efficient of variation with simple random sampling is approximately twice as
96

large as that of stratified systematic sampling with paper strata; that is,23.2% to 13.3%. In both cases presented in this chapter, the use of equal-size paper strata substantially reduced the variance of the estimates ascompared with simple random sampling without paper strata.
4.4.4 Exercise 8:Using the results in table 6, each student is to compute the estimated
population total and its sampling error.
97

CHAiJ'lTR 5 - USE OF SEVErv\L FR}\'W:-; 11\ SAHPL TNr;
5.1 Introduction
In this ch3pt~'l-, \vl' introduce a genera] Illetil" I()]ogv for "multip]t_'-frame
surveys." Thl' need \Cll!- sl'veral frm~('s oris,-',; ]" "I',l': (]) the individll,ll
frames do not completel'! cover all the units in LIll l,opuliltil,n but collectively
the frames dC1 includ,' I the population units "I interest, or (2) even though
all the units in th,' jl"!luLation C1f interest <In' ',\\jl'rcd hv ;J singlv fLlm~', the
use of several frank" ],',L)S to smaller expectl'! '",:npling errors per dollar
spent. In either e,IS,-', thL' use of sever"l fr:lT,-'; rv:~ults in some units being
included in more th,lll '1\,-' frame. Fc,r the' jl(I!,\l1.]l illn units COmml1[1to '"L'Vl!Ll]
frames, t\vO or morc' ,',.;r :1[',ltors of tl1l' S:lmc' !'::r 1[:' (.,l' :lrc' availahle. nlL'
material covered in {hi:; ,'haptcr dva]s \,'ith th., "t[ll'r:d theun' of utLli:dng
two frames with and Hitll<)llt prior kn()\.,leJgl' ,I,C; L :hv t.':·:tent of their mutu<ll
overlap. The techni'Jll" "f domain l'stimat i'lfl I"; .ll:I1]l1ved. The "overLlp Ilom3in"
provides two estim<l-":~ "f thL' same pZ1Llmet,'r, '''11 n'm t'lch frnmc. Conse-
quently, it is neel':';S,ll',,' tl' tL'st th(' rezlson:lhlel1' s,.; 1)1 the assumptio!1 that
the tWL' samplt.' estilll,l!".'; 'If the paril1llL'tl'r (i .•... , 'iIl1S) ,'lre \:qual; that is,
the hypothesis tlL,L 'hI' estimates (11' the· 1',lr:,:1'( tl'r v,Ilul' arl~ equ31 must be
tested before the ('s' iT:ltes ,'an bl' "p'-'l'led." 1:1 t l!t, event the ilSs11mpti,'n of
equ31ity of the 1';lLH:\,'t •..r is re,je,'ted, the SZI!1~plt' ,!-It:l do not su:.',gl'st \\'hich
frame should hl' usvd I 1 (lhtain the' L'St im:ltl' "f t:l. 111r:lml.c'ter hut do indieatl'
that any t\vO-fr:lrll' ""tirIdtc' for lllL' tntal P'-'11Il] '11 ,q ll()l~S not satislv :]1] the
basic clssumptions. '!'It" d,'cisil,n of \vhieh fr:l;1\1 I' 1,\:-;\, the estim,ltes on must
be based on other Sl ,It i ,;1 Leal considerat ions.
Aside from thl' (Ih'oretical considerations ,,: ,"'Impl ing, multiple-Irame
surveys are m"re di~-'-i,'ult to execute operatjnn,l!l\' and require morv l'ontrllls
to prevent nonsilPlpl ini', l'rrors becoming large'. I'hjl~ is a direct result', in
practice, of the sur':,'\, procedures and struetlln' "t" each fr;J!1w (which nldV con-
sist of different tVlwS of listing or frame unit::); in addition, the ,'lL'm\'nLlrv
reporting units (i.L'., individuals, farm opeLlti1r':.; l'r lime! tracts) themse]vl's
may differ from ont' I-em\..' to another. Thus, "[1,'(-11 j"nally the survey ma\' in-
clude two frames wi t It Ii Iferent types of list in', l'Y' rrarne units, t\·.'L' different
types of elementary units, two different prC1cvdlI1',c; lur associAting the popu];]-
tion of interest with the sampling units, ,me! (Of i,iL'ntifying :111 units in the
population of interest \,}hich are in both fran,es.
98

5.2 Example of Representing a Population in Two FramesA small population of farms is used to illustrate the relationship between
single-frame surveys and the two-frame surveys. A farm weight is shown ex-plicitly for the individual farms in each frame as well as for both framessince there may be a possiblility of duplication of farm units within a frameas well as between frames. The recognition of duplication of farms is criticalin deriving unbiased estimators for both single and two-frame surveys. In allcases, the individual farm weight must be equal to 1.0. This is clear from thefact that, if either a single frame or both frames are completely enumerated,each farm must be included just once and only once, if unbiased estimates areto be obtained. First, the population of interest, i.e., "farms," must bedefined. One definition is as follows: A farm is defined as a unit of landmanaged by one or more individuals to produce one or more agricultural products.If several individuals (i.e., more than one) are involved in managing a farmunit, only the jointly managed land producing agricultural products is part ofa particular farm unit. Other land managed by either one of the individuals orpart of the management group to produce agricultural products will be con-sidered as different or separate farm units. That is, a unique managementgroup exists for each farm unit in the population of interest. Finally, thosecrops or livestock species which will be considered as agricultural productsneed to be defined. However, for our purposes these agricultural products ne~dnot be specifically enumerated but are understood to consist of products in-tended to be consumed as food by people or of products of the land used toproduce food consumed by people. It should be clear that the population ofinterest which is defined will have a direct bearing on the multiple frameprocedures specified.
The population of farms as related to the frame units in the Frame A(i.e., area frame) is shown on page 103. The frame units are area segmentsand each farm is associated with one and only one frame unit by a unique head-quarters rule based on the operator's residence and there is no duplication offarms within the frame. If there is more than one person involved in the manage-ment group, only the "senior" person (or officer) will be considered the operator.Frame A contains all the farms in the population of interest.
The second frame, B, is a name-address list given on page 104 which givesaccess to an unknown portion of the population of farms since the name-addressunits may represent individuals, corporate names, partnership names, persons
99

no longer farming, L'r mlY represent individuals wll\' II' 'vt'r operated J farm but
were erroneously includl'd in the list. A LJrm \.jhj\~1 I,e; jointly opeLlted
(i.e., a management gr,)uf' ()f two or more) may ])1' dUj1i [l<ited through more than
one frame unit if a farmlssociation rule is emplc1v,'c wh ich permits mure than
one member of a managem\'TF group to be an opera10r e,f the farm unit through dif-
ferent name-address units. That is, a farm unit can ':W accl'ssed by different
name-address units in r'r-;l:nt' B, but only one fann unit LS a~;sociJted with each
frame unit. When a L:rm I III it may be associated v,.j t'l ~l'Ver;j I frame un its that
h<1ve different names and Iddresses then provision m\ht be madl' to detect the
number of units duplicallc'd in this way by means (,j th.c· :c;urvey qUlc'stionnaire.
The following is an exampll' of a name-address 1 i st ,'''''It'dure in which both the
name and address are rt',!ui red to define the [raml' lli!i L.
Frame Unit ',lr:n Associated
(1) A Personal Name - Uesidential Address
(2) A Personal Name - Business Address
(3) "Corporate" Name - I\usiness Address
(4) "Corporate" Name - Re~idential Address
A fanl 'mit operated only byindividual listed at address
A farm unit operated only byindividual listed at address
"Corpllr;ll e" farm unit only, andno other farm units of personsat same name-address unit
"Corpl1r:l:e" farm unit only, andn(' other farm units of personsat Si1nlC'name-address uni t
The word "corporate" can hE. replaced by the words p, rt nership, estate, coop-
erative or institution ll' l'over additionLll types of s i tllJtions which may occur.
Where the name portion clf the unit consists of two c,r mor", personal names, thl:'sC
fr3me units will be tn'i~ttd as partnerships. A bnsil1"ss address is ;my address
which does not correspund to a residence.
The illustration be]c',,' nses the prol:edllres fl)r ,hs(\('jaling farm units
with frame units bosed e'n I,nt' set of rules for each f I'ilme for a given definition
of 3 farm (and also for r](\t associating farm units ,>'1':h frame units). For the
duplication within a framl, weights ('v.) are assignc-,l to the frame units for
the ith
farm so they add tl) 1.0 for ea~h farm in the J'()Plllation of interest. Intwo-frame surveys the idt';i of duplication between [1;i!llt'S is handled by partition-
ing the farms into thrEe domains: (a) farms in Framp A only, (b) farms in Frame B
only, and (ab) farms in both frames A and B. In this illustration it is assumed
that there are no farms in Domain (b). In the dl'vLlil['ment of the theory by
Hartley and others, it has been assumed that N\ and N , thl' number of units inL B
the population of intl'n'st for each frame, are k:1O\.;n. Tn dddition, the number
100

such that pIw'A + qIw'B 1i J i J
(b) IW'B = 1.0 where thei J
B refer to the individualf 'h' h h ,thrame unlts w lC tel
of units for the population of interest in each domain, Na, Nb, and Nab' may beassumed to be known. The between-frame duplication is handled by assigningframe weights, p and q for Domain (ab) where p, q > a and p + q = 1, and noframe weights for Domain (a) or (b) because there is no duplication betweenframes.
The combined result of the farm weights (Iw. ) for the single frames, A andi J.
B, and the frame weights (p and q) for Domain (ab) isfor each farm, and for Domain (a), IW'A = 1.0 and for
i Jsubscript i refers to a farm while the subscripts A andframes and the summation is for the ith farm over the j
farm is associated with in each frame.
The farm weights IW'A and IW'B are the result of the procedure for associ-i J i J
ating farms with the frame units and are generally determined from informationobtained on the questionnaire with appropriate checking of questionable name-address units and follow-up inquiry to the farm. TIle frame weights, p and q,can be derived based on several criteria as follows:
(1) Optimum weights which have minimum variance per dollar spent for eachsurvey characteristic;
(2) A single set of weights for all survey characteristics to minimizethe computational problems and to insure that subgroups will add ~otbe group total;
(3) Frame weights derived independently of the survey characteristicsbeing estimated to assure unbiased estimates;
(4) Frame weights constant between successive surveys for the samecharacteristics so that the change in the estimates over time isnot due to different weighting schemes (i.e., assuming the sameframes are used).
The derivation of optimum frame weights will be discussed later, butseveral simple schemes which satisfy criteria (2), (3) and (4) above are giveneven though the efficiencies of the schemes are not known except for special cases.
(1) P and q based on constant sampling fractions:The sampling fraction is fA for Frame A and fB for Frame B. Theframe weights would be
p = where p is the weight for farms in Domain (ab)
101

which are d,:u'~,sedby Frame A, and
q113
-------fA + 1-13
where q is the weiv,ht for farms in Domain (ab)
(2) p and q based [.n frame siz<:,s:The nwnber ()f i rame units is F for FrarT /\ and F for Frame BoThe
A 13corresponding frame weights would be
p
q
FA----- -- and
F + F 'A B
F p,)
F +- FA B
(3) p and q based on constant sample sizes:The sample sizes are nA for Frame A and 03 for Frame Bo Thecorresponding weights would be
°A andp -------n + °BA
q
(4) p and q basted 00 sample sizes, nA and 11B, and cost of data collectionper frame ifilt, CA and CBo
nA-CA
P nA °B- +- .---C CBA
q I - p
102

5.2.1 Population Units Related to Frame AThe following table shows the population of 10 farms accessed by
Frame A and the relationship between the frame units, the farms, andthe farm weights.
Units Accessible from Frame: Individual:Tabulated Value of:Farm Weight:Farm Characteristic
for Frame for Frame UnitUnit (Value x Weight)
FarmNo.
FrameUnit Value of
No. Farm Char-(i. e ...: : acterlstlcsegment): :(Hectares of Wheat):
1
2
3
4
5
6
7
8
9
10
FrameTotal
1
2
2
3
3
4
5
6
7
7
7
10
7
11
20
3
a
9
26
a
14
103
1.0
1.0
1.0
1.0
1.0
1.0
1.0
1.0
1.0
1.0
10
10
7
11
20
3
a
9
26
a
14
100

5.2.2 Populatioll [inits Related to Frame B
The portillO l,t t ~le population llf fnl"m',; HI"'o,sed by the Name-Address
Frame and the reLlticnship between frame lInjt~:, t1lL' Llrms, and the farm
weights is given in ",e following table.
Units Accessible'
FarmNo.
; Tndividt.ll: Tahulated Value of: Farn ..,'.~,i i ht: Farm Characteristic
fpr r r,",': for Frame Unittin it _._:__ C\' al u~W_~~~ __
FrameUnit No.:
(Each Value of:Different: F3rm Char-
Name- ;lct~ristic______ A_d_d_r_e._~sJ__;_u.!_"ctares 0 f \.Jheat) :
i f"lJmFrame
3 1 11 5.5
3 2 11 I i S. 5
(1 . n )
4 3 20 1.0 20
7 4 9 1.0 9
8 ~ 26 1 .0 26..J
9 6 0 1.0 0
No Farm 7 2! : 0 0 0
No Farm 8 2/: 0 0 0:------- ----
Frame8 5 66Total --- -~ ---------------------_ ..~ --
1) Farm No. 3 is a partnership. The name-addn's';l'S of the two individualpartners were included in the list because' the list sources were not awareof the partnership. rile survey quest ionnai re "',"'llld have to detect thepartnership if either I)ne of the frame units was seT l;cted in a sample.
2/ There is no farm ;ls::;ociated with this fr,lme unit because the name---address listing dol':> 'l·'t qualify as a farm based un either the rules ofassociating farms with frame units or the definition of a farm. However,the list source was n,H: aware of this f;Jct; l:onsl'Cjuently, a survey pro-cedure must be used t,) determine this for each frame unit sampled.
5.2.3 Population Uni ts Related to Frames r\ ..'1.T..1.<!Jl
The populatioTl C' F 10 farms is accessed by Fllmes !\ and B. The rela-
tionship between Fr,un" units, farm weights t co [,.'l:UVC duplication and v3lue
of survey characterist j ('s for a two-frame surv,' -'Ire shown in the following
table. Tn this illlls! ;";llion the values of ]' <Inti q are derived from the frame
sizes FA '" 7 and Fl) = t\. That is, p '" 7 :'-8 = ./1/167 and q '" 1 - P '" .5333.
104

Farms Accessible from Area Frame Farms Accessible from List Frame
FarmNo.
FarmDomain (a) Domain (ab) Domain (ab) :Weight
:Frame: I d' 'd 1 T bId I d' 'd 1 T b 1 d:Frame: I d" "d 1 T b 1 d for·.Unl"t:H t : n lVl ua : a u ate :H : n lVl ua : a u ate :U':H : n lVl ua : a u ate: Twec ares ectares . nlt ectares V 1 0
N : f : Farm Wt.,: Value : f :Farm Wt. x: Value N of :Farm Wt. x: a ue .Frameso. 0 (' N f 0 (' f o. (' fWheat : Le., 0.: or Wheat :p, Le. or Wheat :q, 1.e. or
Farms) :Wheat 11 :No. Farms):Wheat II :No. Farms): Wheat 2/:
f-"o\Jl
1
2
3
4
5
6
7
8
9
10
1
2
2
3
3
4
5
6
7
7
1
5
10
7
3
o
14
1.0
1.0
1.0
1.0
1.0
10
7
3
o
14
11
20
9
26
o
o
o
.4667
.4667
.4667
.4667
.4667
o
o
5.1337
9.3340
4.2003
12.1342
o
o
o
12
3
4
5
6
7
8
1111
20
9
26
o
o
o
.26665
.26665
.5333
.5333
.5333
.5333
o
o
2.933152.93315
10.6660
4.7997
13.8658
o
o
a
1.0
1.0
1.0
1.0
1.0
1.0
1.0
1.0
1.0
a
a
7
11 Value x farm weight x q.
FrameTotalII Value x farm weight x p,
5 34 2.3335 30.8022 8 2.6665 35.1978 10

The two-fn:mc estimates for number 0 f" fJrms and hectares of wheat,
if each frame is c:;lmpletely enumerated, arc :is follows by frames:
Survt.')' CharacteristicsFrame and !),)main
Number oi Fi(r1Il.'-: Hectares of Whea t
Frame A - Dom:!in I (a) 5 34
Fro.me A - Dom<lin (ab) :2.3335 30.8022
Frame B - Domain \ (e,b) 2.666=, 35.1978
Framt.' B - Domd J ;1 (b) 0 a- - --- ---'-
Frame A and B 10.0000 100.0000-----~- .
The two-frame c"timator for thl~ total of a .sur'vel' charact<:'ristic can be
written in equat il'n form:
-(1) Y = Fi\ )1 + FA P Y3A + Fj) q l'J[) + FL l'2B
7 v 1 + 7 ( .4 h 6 7) Y 31\ + i3 ( . 5 ) n) ~')g + a
where FA' FE' p, q ',.,rere defined previously :In,!
Yl mean p<' r frame unit i.n Domain (a) ill Frame A
Y3A mean pc r frame unit in Domain (Jb) in Frame A
Y3B mean ilC r frame unit in Domain (ab) in Frame B
Y2B me3n pe t" frame unit in Domain (h) in Frame B.
It should be not-pc! t hat in this estimator tf1<, number of farms in Frame A,
NA, and the numl:H'r "f farms in Frame B, NB
, ilL' not assumed known anc! are
not used in the E'S t imator. We have assumed t h :It only the number of frame
units are known and these are sampled. The twu-frame estimator for the
total of a survey lharacteristic could also be written as follows:
(2) If NA
i.Jl1d NB
were known
y
106

(3) If Na, Nab' and Nb were known
where Yi mean per farm in Domain (a) in Frame A
Y3A mean per farm in Domain (ab) in Frame A
Y3B mean per farm in Domain (ab) in Frame B
Y2B mean per farm in Domain (b) in Frame B
In the example, NA = 10 and NB = 5 while Na = Nab = 5, and Nb = O.
Table 1 below reveals several interesting and unusual results whicharise because of properties of the two frames and the survey characteristics.The range in the estimates of total number of farms and hectares of wheatis somewhat greater for the two-frame survey. This is largely the resultof the list frame not being very efficient for this population of farmswhen the total number of farms is not known in advance. The total numberof frame units sampled is 2 (i.e., n = 1 for each frame) for the two-framesurvey as compared to only 1 for the survey from Frame A.
Table l--Range of Estimates for Population of 10 Farms Based on Samples ofSize 1 from Frame A and Frame B Using Estimator (1)
Survey Characteristic
Total Number of Farms
Mean Total
Frame A Survey
10
Two-Frame Survey
10
Range of Estimates
Total Hectares of Wheat
Mean Total
14 - 7
100
7 14.5333 - 3.266911. 2664
100
Range of Estimates
Number of Estimates
Number of Frame Units
182 - 0
7
1
107
182 195.8658 - 0
56
2
195.8658

5.2.4 Variance l'[ Two-Frame Estimator
The varLmcl' ul the estimatl'd total j"r .. II:H:1Ct .:ristic vf the
population of farn,..:; is given for the first I :it lr:,ator. Independent random
samples of the fran:" Imits, nA and nB, arc' ;.tE'd from each frame. The
sampling of frame units results in a rane!"'1: '''!it,lL' uf farm units being
selected from each f rlme but the sample s1::c ill t('1111Sof number of farm
units is unknown ,It the time of selection. Till,' : i rst l'stimator in
Section 5.2.3 was I),ls,,'d on the number of fraFlc
known and the num')," ,'f farm units,
of this two-frame ~stimator is:
liltS, FA :1I1d FE' being
" i itg unknown. Th(~ varian,,£,
(1) V(Y)\',' v )
7 :Z\I(v ) , Cov(Yl'Y3A), 1 '3A1.'''- + F~p -.---- + f' ( " lp ---~.-
,\ I,ll.. A 11/\ ;\ ' nA
V(y )3B
where the variawes of Yl, YjA, Y3B' v2 II',' ('nmputed as the variance
of a simple r:'I1,','m sample using the dl'lIldiT' 'otals fur each selected
frame uni t.
The covariance ten ;Irises in the varianct' vst i!l1,ltOl' be'cause the frame units
in Frame A are clusti'rs of fann units (i.e. sq:ml'llts). A segment in Frame A
may contain farms in hnth domains (a) dnd Clh). Cons~quently, a correlatinn
or nonzero covariance term may exist between i ;lniS in domains (a) and (ab)
in Frame A. However-, the expected value of thc,-,tatistical correL1tion
between the sample !anns in Frames A and f) L,<-; 7'."U jf independent Lmdom
samples are selectel frum each frame.
5.2.5 Exercises 9 and 10
Exercise 9:
Each student should define a diffE'rent procedure (or rule) for
associating f;lrTTl~ with the units il1 each fLlflle.
Exercise 10:
Each stuclt'nt should define d new agrirl.j ture unit for the
population of int(rest.
108

5.3 Two-Frame TheoryThe technique employed is that of domain estimation which has been set
forth by Hartley and others. The theory has been developed assuming eitherthe number of units in the population of interest is known for both framesor for each domain. In the example in the preceding section, the total numherof farms in each frame was assumed to be unknown, but could have been estimatedfrom the sample.
5.3.1 Two-Frame MethodologyConsider two frames, A and B, and assume that a sample has been
drawn from each frame. The samples may be entirely different in the twoframes but the following assumptions are made:
(1) Every unit in the population of interest belongs to at leastone of the frames.
(2) It is possible to record for each sampled unit in each framewhether or not it belongs to the other frame.
')
This means we can divide the units of the sample into three (2~ - 1)domains.
Domain (a) The unit belongs to Frame A only.
Domain (b) The unit belongs to Frame B only.
Domain (ab) The unit belongs to both frames.
The un its in the population are also conceptually divided into the abovedomains.
5.3.2 Notation for Two-Frame SurveysThere are four different situations concerning our state of
knowledge of the total number of units in the frame, population, andin the domains as well as our ability to allocate prescribed samplesizes to the domains. We consider only cases 1, 2, and 3 in thediscussion. In case 4, the sample sizes in terms of the population ofinterest are random variables since the number of population units ineach frame is unknown. This case was discussed in Section 5.2. Unlessotherwise stated, the type of elementary unit is the same in both frames.
109

[",;1
Numbtc'r Frame Un i t
Population N1l11lb,'[
Sclmpl L' Size'(Popula t i\'ll Un i 1, I
fA
J', \
II,
11"I,
Populat ion ToLll
SamplL' Total
Sample ~lL'an
Cost of Sampl inf! [:1ii t
y yi\ f)
y yA B
v Yg'1\
v "-1\ lJ
C Ci\ I"
,II
Random s:Imples
,,;Wt)) 1 L'S llf n \f'
;;n' d Ll\.Jn from ('a\'h [ram" ;]J),I 11 _] zmd n" ;lrc the sllb-" ) lJ ~l
1'1',' rL'SpL'l't iv\'l\', \.Jhi,,11 ,J 'Illl' thL' ,'v,'rlap Domain
J\l ll'r a ilr b indiczltl'S till It'iI"l' from whit'h thL~ sdmple
(zlb)
,v,lS dL1\vll.
(1.Th,' T" () and
:Klll)\\'ll'd,I.'(' ,11 I'l)pulatil1l1:l'ossibilitv ,,' L:l'd0lumbl'r:, i!1 !1',1Tnains :Szlmplc All",',lli\lllS tll:
zl11d "r,'lll'S nomains L Fr'dlh's-------,------- - -~---- - - -- ---- --_.~ --,-------- - -- - -0: ,N ,:1 ,";, . /\ F F T tis f (', I c; i h Ill,'
:\ B ' I ' I lll' i\' B
;-.JZltUH'
,) fDom,l i ns
Domains Strata
" N I,; '] " F l~. \" r"" "~, ", I' \ ' 1Ji ) ,l :; ,I) 1 D
KI1 'h'll
it is \1,,1 IL),iI11,' tl':alllll'~lt(' .; 11"'i 1l'SiZl'S tel ll,'I.,Jil1;-;
DomZlinspost-strata
Kn"WIl to I [;,m(':-,-._-------~-_. - -_._-----------------~----- -- - --~ -N\,N ,:\ ,,\, .~ b
I E ,I [) ,1
3
4
Onl\' '" ,,'1\'.\ ' -~ 1 '
F I1\ ' ' I,;
KI1' ""11
Sample' "i,--IIn 1y b (' ,I 1 I",
Sampl in,~ !',d,'"
can bl' .1 [ II
Domainsdllma in~,properDomains -
domains inpopulationsof unknown
sizes
110

---------~---",~ -----------
5.3.3 Estimation of Population Totals and MeansIn case 1 the estimation problem is reduced to the standard methodology
for stratified sampling. For cases 2 and 3 two approaches leading toidentical formulas are possible: (a) the theory of domain estimation, or(b) the method of weighted variables. For (h) we introduce the followingattributes to units in the two frames for a survey item denoted by y.:
1
Frame A y~1 {
Yi if ith unit is in Domain (a)
if ith unit is in Domain (ab)ciYi
if .th unit is in Domain (b)C 1
Frame B y~ d'Y. .th1 if unit is in Domain (ab)11 1
d. are numbers which satisfy for each population unit in1
E(c. + d.) = 1.1 1
into two mutually exclusive strata of sizes Na and Nab for Frame A and Nband Nab for Frame B. That is, we have duplicated the Nab units in bothframes. The population total will be equivalent to the single frame total
where c. and1
Domain (ab) Therefore, the two frames are to be converted
of Y. However, the sample estimator of the total and the variance areeasily derived only if c. and d. are constants. That is, c. = p and d. q
1 1 1 1
where p + q = 1 and are determined independently of the parameter beingestimated for unbiasedness. Clearly, the population total is equivalentto the original population since the N = Na + Nab + Nb units are nowNa + (p + q) Nab + Nb and the totals are:
Y Y + Y + Yb ' ora ab
Y~ = Ya + pYa~b + Y~ + Yq ba b
mators of Yab which are combined.
where there are two independent est i-
The standard methodology applicable to the survey designs in Frame Aand Frame B is used to obtain estimates of the two stratum totals forthe variate y~, their variances and variance estimates. Adding the to-
1
tals for both frames, we obtain the total for the population of interest.To obtain estimates of the population mean, Y = Y/N, it is necessary toapply these same formulas to a new variable, called the count variable,
111

~I. to estimat~ tt" l'l'plllatioll si7.e, N, whc"rL ,11, vilriahle lJ. has eitherl l
the value 0 or 1.
The estimat,' (J! the population total giv'-l; :'Y Hartley fur a char-
acteristic when N Nb and Nab are known is:
-Y NaYa + NabPYab + NabqYbil + NbYb
This estimator is ir' the form of a post-stratif,cd s.qmpling estimator. If
the sample is Buffi( iently large and the f.p,l'. factor is not important,
the variance is givLI1 hy
V(y)
)
N~ ~ 2 2+ 02 N p2] + [,j ~ N + N q]ab ab I1
Bb h U ab ab
2 2)where 0a' 0b and" 'lre the within post-str;ltlJII: variances."ab
When Na, Nb, we! Nab are unknown but NA and Nl) are known, an estimator
given by Lund based on the actual subdivisions rand nb"l is:<_,b
NA :-.,; N liB[ ..:~ B q] -y naYa + n P + - nba v + I1bYbn n ab nB " ab rBa \
n v I- nba Ybaab 1bwhere Yab~--- .u - ._~---- The appn';:iI1dlL' variance where
n + TIba,1h
N2 ,
2 NANB;-.;C,
V(Y) A(I
2 'K ,) 2_. It) ,) + () + (1 - I:, (ibnA a unA + SnB ab nB
N2(I~
_.I i.) u. N"- (l . I: ) tA
[Y2 B
[Yb- ] 2+ -------.-- pY
ab] + --- - qYabII a nj)A
112

An alternative approach proposed by Fuller and Burmeister uses amultiple regression type estimator for samples selected from two over-lapping frames. It is assumed that the sampling is such that unbiasedestimators of the item totals and the total number of units in each domainare available. The estimator suggested for the population total of thecontent item is as follows:
Y
When Frame B is complete and Frame A incomplete, we do not have Domain (a),hence the estimator is
whereYB an unbiased estimator of the total constructed from the sample.
in Frame B,
Yab an unbiased estimator of the total of Domain (ab) constructedfrom the sample of Frame A,
Yba an unbiased estimator of the total of Domain (ab) constructedfrom the sample of Frame B,
Nab an unbiased estimator of the number of observational units inDomain (ab) constructed from the sample of Frame A,
Nba an unbiased estimator of Lhe number of observational units inDomain (ab) constructed from the sample of Frame B, and
Nb an unbiased estimator of the number of observational units inDomain (b) constructed from Frame B.
The optimal values of Sl and S2 are given by
-1
113

A consistent estimator of the variance is
V(Y);", A •••.
V(Ya) + V(Yb) + Bl[Cov(Ya,Nab)
" " '" '"+ 82[COV(Ya,Yab) - Cov(Yb,Yba)]
, , ~Cov(Yb, Nb) ]
It is also suggested that if other y characteristics are observed in thesurvey, it may be possible to further decre:lse the variance of the esti-mator by including other unbiased estimat,ir;-;of zero 1) in the regressiontype equation.
5.3.4 Determination of Fixed Weights (p and_ q) for One-SurveyCharac;teristic
The value of p is to be determined independently of the parameterbQing estimated, Y or Y. Assuming a sjmplt~ ,..:ostfunction C = CAnA + CBnEwhere C 1s the total cost of sampling, CA is the cost of an observationtrom Frame A and CB is the cost of an observation from Frame B. Aftersome labor, the optimum value of p was found by Hartley to be one ofthe solutions of:
where
:-md
Once the value of p has been determined, tliL' values of nA and nB can befound from
1~ 2220[(0:(1 - a) + ap 0ab)/CAJ
1
0[(O~(1 - 6) + 6q20~b)/CBJ2
1/ Refers to estimation theory.
114

where 0 would be determined by the budget available. The foregoing der-ivation requires knowledge of the costs, variances, and population domainsizes Na, Nb, and Nab'
An alternative derivation for p (due to Lund), when N is kno\Vll,isn.b
given by the simpler solution for p by the expression
pnAThe ratio, , can be expressed by thenB
iterative system
2and ri+l(r. + ..@.)2(1
1 a
(r. + ..@.)2(11 a
2- a)oa2
S)ob
where r. + r. Limited experience with this method indicates it converges1
rapidly to a value for p (i.e., 2 to 5 iterations). Thus, the optimumvalue for p is the ratio of the expected value of the "overlap domain"size in Frame A with respect to the sum of the expected values of the"overlap domain" in both frames.
When Na, Nb and Nab are unknown, it is necessary to insert unbiasedestimates of these three parameters. The minimization of the varianceexpression at the bottom of page 112 as a function of p, nA and nBsubject to the cost equation specifies the optimum value (PO):
NA(l-a)Y +
NB(l-l3)(Yab - Y )nA a nB b
Po NA(l-a) NB(l-S)[ n + n ] YabA .B
The sample allocation among the two frames can be expressed by aniterative system
115

2 2? r.an
ab1-(1 -!) u~ + --- ~-- --- +a
(r.+ 1:\)22
C~(£) 2 1 11
ri+1-- ----
CA
a p 2 22
(-'\ ~0
( 1 - ,) li' ab+ - --------- +
b Hi ?(r.+(!'::")~
1 1\
Cent'rilly, only ;1 few itlr,lt L''Ilc: are required to obtainnAwhere r = ~nl)
r starting from :t rt',l,;onable "guess" [or r l' nit" estimator and its
variance are not sl'Dsitive to deviations frlwl t-_ (optimum) of 10 percentU
or less. An estil1ut11r of the optimum p (i.p., fir}) fHJm the sample data is:
p
But P is now a function of several sample st:tti~tics which disturbs the
unbiasedness of the estimator. However, the dlc,'ree of bi.:ls is considered
to be negligible.2
the parameter 0a
by Hartley.
/\n alternative estimator of p is avaiJable, but requires2 2
,cab and ub· This is tilL' !i-quadratic solution given
5.3.5 Assumpt ion {)f Equality of Means for "0.Y~:J~omains
In practice, hit' face the problem of poo I i n~', of independent estimates
of the parameter Y lor Y b from different fr<1l11l's. Each estimate isell a
given with its sample size and estimated standel -d error. Can the estimates
be considered as homogeneous? That is, are tllL'? cstilllClting the same
quantity? Let n ~ nl+ ... +n
Kequal the samples ,'orresponding to each frame
and denote by 1T. thE' r3tio n. In. The asvmnt III i ( distribution of1 1 . ~
~ (T.-G.) is N[O,S:(G.)].11-1- 1 1-
116

Consider, H
A 2K n.(T.-8)L 1 1
2S. (T .)1 1
Kn L
A 2TT;(T.-8)1 1
2S. (T.)1 1
where T. is the estimate of the parameter G from the ith frame, and G1
is given by
KLTT.T. K TI.
e 1 1L
1
2.•
2S. (T.) S. (T.)1 1 1 1
H is distributed as X2 with (K-I) degrees of freedom as n~'. IfH > X~ K-I' the equality of the means is rejected and the estimates,should not be pooled.
5.3.6 The Special C?se of Frame A With lOa Percent CoverageIf Frame A is complete (covers all the units in the population)
then NA = N, Nab = NB, Na = NA - NB, Nb a so we are in case 2.Since N = N - N > 0, Frame B must have fewer units than Frame A.a A B
5.3.7 Different Units in Frames With Overlapping CharacteristicsIn this case, the elementary units which make up the frame are
different. Consider a survey in a city to estimate the total costexpended on the laundering of clothes; both private households andcommercial laundries will launder il:ems which we refer to as "clothes."A portion of "clothes" belonging to a household may be sent to a laundryand the rest washed in the home. A commercial laundry handles clothesfrom households and from some "commercial institutionstl which send alltheir laundry out. That is, the characteristic pertaining to theelementary unit is partitioned rather than assigning the unit to eitherdomain (a), (ab), or (b). The three domains are: (1) household clotheslaundered in the home, (2) household clothes laundered in commerciallaundries, and (3) commercial institution clothes laundered in commerciallaundries. The characteristic of interest might be dollars spent orpounds of clothes, or both.
117

lh l' ,'1 (' l; I['S 111 :, I'
1 "
in lhl' IH'IIHc ,I)
. v,.I 1
I ,1\11\ c! r \
, II
""l"1111L'1'cidl instiliit 1"11',
vj" k
q \' i f c I(1t Ill'S, II
i 11 t l1l' I' ,,[ ['I,' t'" '11
The unhiased L's ti nn t t.' of tll l' 1'(11'(11:1ti,'n l ,tl I
N n~A
\' ny it l ,,1\ ,If) .J'> I
v + p. h v, 1 + [1/1--: + q, ,
n1\ l' I a '1111"
,) ')r;; 111\ 7 ;~~ 11V(y) ( I '-) S~ + ( ] ,H) '-
'-
n1\ NA v n I"~J i 'j.i' i !;
and the sample estilll,ltnr of the v,l1'i:llll'l' I:~
'i\"'11 hv
l'llf'\' of \'('1).
5. '3.8 Exercises ll., __J2, and 11
of farm operations ,mJ the list framl' (Fr'I:lll )',) pn1vides access tu <1n un-
known fraction uf the farm OpeL'lt ions. Tlll' n,lllt"S ~;IV0 heen coded hv
replacing the SllTn:lnle of the person, or ;l1'i n, ,.11 n:lme 0 f a ioint opera-
tion, or husinesc; lirrl by the permutatit1n elf Ill'l' letters of the alph3bet.
Eo.ch different ,'r,ll') ing of the three l(>ttc1',; r.'I'Tl'sents a different sur-
name or princip:11 husiness neIme; theIt is, 1\1\( II'; different than I',i\C. The
city name in th" Icldn'ss has likewise be'l'n ""I I)\' ll11mbL'rs from 01 tn qg.
If the city was ("llilt.ed by error, the cod,' j,;'ivcn as 00. The agricul-
tULll land OpeLI! i "liS are ass()['iated wi tll 111'
1] 8
Ir,'a frame I1ni ts ('\n1v

through the land inside the segment. Economic units such as "farms" areassociated with an operator who must reside in one and only one segmentduring the survey period. Agricultural land and economic units areassociated with name and address units (or combinations) for the listframe.
Exercise 11:Each student is to determine units overlapped between frames. From
the listings of respondents for the area frame (Frame A listing) and listframe (Frame B listing), determine the operations which can be accessedby both frames (i.e., overlap domain). After the last page of the list-ings, the operations which were identified as in the overlap domain bythe survey staff are given.
Exercise 12:Each student is to determine duplication within each frame. Using
the listings given for exercise 11, determine which (if any) respondentoperations are duplicated within the area frame and also any duplicationswithin the list frame. The duplications determined by the survey staffduring the survey are given at the end of the listings in exercise 11.
Exercise 13:Each student is to calculate the survey estimates (i.e., totals).
Table 4 shows the survey means, sample sizes, and expansion factors byframes which are used to obtain estimates by domains and the totalpopulation.
(1) Compute the two estimates for the overlap domain. Shouldthese two estimates be pooled and used in either the screen-ing or multiple frame estimator? (See 5.3.5.)
(2) Compute and compare the estimates obtained by using thefollowing three estimators of the total population:
a. Area frame estimator (p = 1, q = 0).
b. Screening estimator (p = 0, q = 1).
c. Multiple frame estimator (use weights given in (3),page 102, based on the number of frame units selectedfor the sample where p, q > 0; p + q = 1).
119