A TMDL Evaluation for Chlorinated Pesticides and PCBs in ...
208
A Total Maximum Daily Load Evaluation for Chlorinated Pesticides and PCBs in the Walla Walla River October 2004 Publication No. 04-03-032 printed on recycled paper
Transcript of A TMDL Evaluation for Chlorinated Pesticides and PCBs in ...

A Total Maximum Daily Load Evaluation for Chlorinated Pesticides and PCBs
in the Walla Walla River
October 2004
Publication No. 04-03-032 printed on recycled paper

This report is available on the Department of Ecology home page on the World Wide Web at http://www.ecy.wa.gov/biblio/0403032.html
For a printed copy of this report, contact:
Department of Ecology Publications Distributions Office Address: PO Box 47600, Olympia WA 98504-7600 E-mail: [email protected] Phone: (360) 407-7472
Refer to Publication Number 04-03-032
Any use of product or firm names in this publication is for descriptive purposes only and does not imply endorsement by the author or the Department of Ecology.
The Department of Ecology is an equal-opportunity agency and does not discriminate on the basis of race, creed, color, disability, age, religion, national origin, sex, marital status, disabled veteran’s status, Vietnam-era veteran’s status, or sexual orientation.
If you have special accommodation needs or require this document in alternative format, please contact Joan LeTourneau at 360-407-6764 (voice) or 711 or 1-800-833-6388 (TTY).

A Total Maximum Daily Load Evaluation for Chlorinated Pesticides and PCBs
in the Walla Walla River
by Art Johnson, Brandee Era-Miller, Randy Coots, and Steve Golding
Environmental Assessment Program Olympia, Washington 98504-7710
October 2004
1998 303(d) listings addressed in this report:
Walla Walla River, Waterbody No. WA-32-1010 4,4’-DDE, 4,4’-DDD, dieldrin, heptachlor epoxide,
hexachlorobenzene, chlordane, and PCB-1260
Publication No. 04-03-032
printed on recycled paper

This page is purposely left blank for duplex printing.

Page i
Table of Contents
Page
List of Figures .................................................................................................................... iii
List of Tables .......................................................................................................................v
Acronyms and Abbreviations ........................................................................................... vii
Abstract .............................................................................................................................. ix
Acknowledgements............................................................................................................ xi
Summary .......................................................................................................................... xiii Background................................................................................................................ xiii Results of Field Study................................................................................................ xiii Water Quality Targets..................................................................................................xv Critical Season and Loading Capacity....................................................................... xvi Load Allocation ........................................................................................................ xvii Compliance Schedule............................................................................................... xviii Safety Margin / Monitoring Plan / Follow-up Work ................................................. xix
Introduction..........................................................................................................................1
Scope of the TMDL .............................................................................................................3 Geographic.....................................................................................................................3 303(d) Listings ...............................................................................................................3 Pollutant Parameters ......................................................................................................3
Basin Description.................................................................................................................4
Historical Pesticide/PCB Data ...........................................................................................11
Applicable Water Quality Standards .................................................................................15 Washington ..................................................................................................................15 Oregon..........................................................................................................................17
Project Description.............................................................................................................19
Design of Field Study ........................................................................................................21 Surface Waters .............................................................................................................21 NPDES Discharges ......................................................................................................27 Fish Tissue ...................................................................................................................29 Summary of Field Work ..............................................................................................34
Methods..............................................................................................................................35 Field Procedures...........................................................................................................35 Laboratory Procedures .................................................................................................37
Calculation Procedures for SPMDs ...................................................................................39
Data Quality .......................................................................................................................41 Laboratory Case Narrative Summary ..........................................................................41 Field Quality Control Samples.....................................................................................42

Page ii
Results of Field Study........................................................................................................45 Surface Water...............................................................................................................45 Fish Tissue ...................................................................................................................73 WWTP Effluents..........................................................................................................80
Numerical Water Quality Targets......................................................................................83 DDT:TSS Correlation ..................................................................................................83 Fish Consumption Rates ..............................................................................................87 TSS Effects on Aquatic Life ........................................................................................87 TSS:Turbidity Correlation ...........................................................................................92 East Little Walla Walla River and Yellowhawk Creek ...............................................94 Target Summary...........................................................................................................95 Applying the Walla Walla Targets ..............................................................................96 Progress on the Yakima River TMDL.........................................................................97 PCBs ............................................................................................................................99
Loading Capacity .............................................................................................................101 Pesticides and PCBs...................................................................................................101 Total Suspended Solids..............................................................................................103
Wasteload and Load Allocations .....................................................................................109 Pesticides/PCBs/Total Suspended Solids ..................................................................109 PCBs in Garrison and Mill Creeks.............................................................................110
Margin of Safety ..............................................................................................................111
Seasonal Variation and Critical Conditions.....................................................................112
Monitoring Plan ...............................................................................................................113
Compliance Schedule.......................................................................................................115
Recommendations for Follow-up Work ..........................................................................116
References........................................................................................................................117
Appendices A. Sampling Site Locations for the Walla Walla Chlorinated Pesticide/PCB TMDL Field Study. B. Biological Data on Walla Walla River Fish Samples. C. Estimated Water Concentration Calculator from SPMD Data. D. Pesticide/PCB Data from the Walla Walla Chlorinated Pesticide/PCB TMDL Field Study. E. Results on Replicate and Split Samples Analyzed for the Walla Walla Chlorinated Pesticide/
PCB Field Study. F. Flow and Conventional Water Quality Data for the Walla Walla Drainage. G. Conventional Data for Final Effluent from the College Place and Walla Walla WWTPs. H. DDE, TSS, and Turbidity Data on Whole Water Samples Collected in the Walla Walla
Drainage, May 2002 – September 2003.
Page iii
List of Figures Page
Figure 1. Walla Walla River Basin ..................................................................................5
Figure 2. Land Use in the Walla Walla Basin, 1986-1996 Data......................................7
Figure 3. Typical Flow Patterns in the Walla Walla Drainage ......................................10
Figure 4. SPMD Device and Deployment Canister .......................................................22
Figure 5. Water Quality Monitoring Sites Where SPMDs Were Deployed ..................23
Figure 6. Historical Flow Patterns in the Walla Walla Drainage ..................................25
Figure 7. Minor Tributaries Where Follow-up Water Sampling Was Done .................26
Figure 8. Location of Walla Walla and College Place WWTPs....................................28
Figure 9. Location of Fish Samples ...............................................................................33
Figure 10. Walla Walla River Flow During the 2002 - 2003 TMDL Study Compared to Historical Averages ................................................................45
Figure 11. Seasonal Patterns of Pesticide/PCB Concentrations in the Mainstem Walla Walla River........................................................................................53
Figure 12. Annual Average Total DDT Concentrations Measured in the Walla Walla Drainage ..................................................................................54
Figure 13. Annual Average Total Chlordane Concentrations Measured in the Walla Walla Drainage ..................................................................................55
Figure 14. Annual Average Dieldrin Concentrations Measured in the Walla Walla Drainage ..................................................................................56
Figure 15. Annual Average Hexachlorobenzene Concentrations Measured in the Walla Walla Drainage ..................................................................................57
Figure 16. Annual Average Heptachlor Epoxide Concentrations Measured in the Walla Walla Drainage ..................................................................................58
Figure 17. Annual Average Estimated Toxaphene Concentrations Measured in the Walla Walla Drainage ..................................................................................59
Figure 18. Annual Average Total PCB Concentrations Measured in the Walla Walla Drainage ..................................................................................60
Figure 19. Simulations of Tributary Impacts on t-DDT Concentrations in the Mainstem Walla Walla River ......................................................................66
Figure 20. Simulation of Tributary Impacts on Heptachlor Epoxide Concentrations in the Mainstem Walla Walla River.............................................................67
Figure 21. Exceedances of Human Health Water Quality Criteria in the Walla Walla Drainage ..................................................................................69

Page iv
List of Figures (cont.)
Page
Figure 22. Exceedances of Aquatic Life Criteria in the Walla Walla Drainage............71
Figure 23. Pesticide/PCB Concentrations in Walla Walla Fish Fillets: Upper vs. Lower River..................................................................................................75
Figure 24. Pesticide/PCB Concentrations in Fillets from Walla Walla River Fish Compared to 303(d) Listing Criteria............................................................78
Figure 25. Relationship Between TSS and 4,4'-DDE in the Mainstem Walla Walla River .............................................................................................................84
Figure 26. Quantile Plot of TSS Data for the Walla Walla Drainage Showing Instances Where 4,4’-DDE Concentrations Exceeded the Human Health Criterion (all data) ........................................................................................85
Figure 27. Quantile Plot of TSS Data for the Walla Walla Drainage Showing Instances Where 4,4’-DDE Concentrations Exceeded the Human Health Criterion (East Little Walla Walla River and Yellowhawk Creek data excluded) ......................................................................................................85
Figure 28. 4,4'-DDE vs. t-DDT in the Walla Walla Drainage.......................................86
Figure 29. Historical Record on TSS Concentrations in the Lower Walla Walla River, Showing Zones of Biological Impairment and Proposed t-DDT-based TSS Targets............................................................................89
Figure 30. Exceedances of the Class A Turbidity Standard in the Walla Walla River .............................................................................................................93
Figure 31. Relationship Between Turbidity and TSS in the Walla Walla Drainage .....93
Figure 32. Relationship Between TSS and 4,4'-DDE in Yellowhawk Creek and the East Little Walla Walla River ................................................................95
Figure 33. Turbidity Improvements in the Mainstem Lower Yakima River.................98
Figure 34. Improvements in 90th Percentile Turbidity in Major Irrigation Returns to the Lower Yakima River..........................................................................98
Figure 35. Seasonal Pattern of TSS Concentrations in the Lower Walla Walla River Showing the Recommended Interim 50 mg/L Water Quality Target ........103

Page v
List of Tables
Page
Table 1. Walla Walla Subbasin (WRIA 32) Toxics Listings...........................................2
Table 2. Summary of Historical Data on Chlorinated Pesticides and PCBs Detected in Walla Walla River Fish ................................................................12
Table 3. Summary of Historical Data on Chlorinated Pesticides Detected in Water Samples from the Walla Walla Drainage..............................................13
Table 4. Summary of Historical Data on Chlorinated Pesticides Detected in Sediment Samples from the Walla Walla Drainage ........................................13
Table 5. Applicable Washington State Water Quality Criteria for Chlorinated Pesticides and PCBs.........................................................................................16
Table 6. Applicable Oregon State Water Quality Criteria for Chlorinated Pesticides and PCBs.........................................................................................18
Table 7. Water Quality Monitoring Sites Where SPMDs Were Deployed in the Walla Walla Drainage During 2002-2003 .......................................................23
Table 8. NPDES Permits in the Walla Walla Basin ......................................................27
Table 9. Fisheries Information for Resident Walla Walla Species................................31
Table 10. Summary of Field Work for the Walla Walla Chlorinated Pesticide/ PCB TMDL Study.........................................................................................34
Table 11. Sample Containers, Preservation, and Holding Times for Water Samples..........................................................................................................36
Table 12. Laboratory Procedures...................................................................................38
Table 13. Monthly Average Pesticide/PCB Concentrations Measured Using SPMDs in the Walla Walla Drainage During 2002-2003 .............................47
Table 14. Annual Average Pesticide/PCB Concentrations Measured Using SPMDs in the Walla Walla Drainage During 2002-2003 .............................49
Table 15. SPMD Monitoring Sites in the Walla Walla Drainage, Ranked from Highest to Lowest Annual Average Pesticide/PCB Concentrations .............51
Table 16. Estimates of Total Pesticide/PCB Concentrations in the Walla Walla Drainage During 2002-2003..........................................................................62
Table 17. Estimates of the Dissolved Fraction (%) of Pesticides and PCBs in the Mainstem Walla Walla River During 2002-2003..........................................64
Table 18. Mean Pesticide/PCB Concentrations in Fillets from Walla Walla River Fish Collected during July - September 2002 ...............................................74
Table 19. Pesticide/PCB Concentrations in Whole Fish Samples from the Walla Walla River Collected during July - September 2002 ........................77

Page vi
List of Tables (cont.)
Page
Table 20. Site Specific Bioaccumulation Factors (BAFs) for Walla Walla River Fish Compared to EPA Bioconcentration Factors (BCFs) Used to Calculate Human Health Water Quality Criteria...........................................79
Table 21. Pesticides and PCBs Detected in Walla Walla WWTP Final Effluent..........80
Table 22. Pesticides and PCBs Detected in College Place WWTP Final Effluent........81
Table 23. Effects of Suspended Sediments on Walla Walla River Salmonids..............91
Table 24. Effects of Suspended Sediments on Aquatic Insects and other Stream Fauna..............................................................................................................91
Table 25. Loading Capacity for Chlorinated Pesticides and PCBs in the Lower Walla Walla River .......................................................................................101
Table 26. PCB Loading Estimates for WWTPs on Garrison and Mill Creeks............102
Table 27. Loading Capacity Estimates for TSS in the Walla Walla River Drainage, January through June ..................................................................105
Table 28. TSS Load Allocations for the Mainstem Walla Walla River, January through June.................................................................................................109
Table 29. Wasteload and Load Allocations for PCBs in Garrison Creek and Mill Creek....................................................................................................110

Page vii
Acronyms and Abbreviations BAF bioaccumulation factor BCF bioconcentration factor CFS cubic feet per second CTUIR Confederated Tribes of the Umatilla Indian Reservation DDD dichlorodiphenyl dichloroethane DDE dichlorodiphenyl dichloroethylene DDT dichlorodiphenyl trichloroethylene DOC dissolved organic carbon EST Environmental Sampling Technologies Ecology Washington State Department of Ecology EPA U.S. Environmental Protection Agency GC-ECD gas chromatography – electron capture detection GC-MS gas chromatography – mass spectrometry GPC gel permeation chromatography GPS global positioning system MGD million gallons per day NPDES National Pollution Discharge Elimination System NTR National Toxics Rule NTU nephelometric turbidity units PCB polychlorinated biphenyl PRC performance reference compound QA/QC quality assurance/quality control RPD relative percent difference SPMD semipermeable membrane device TOC total organic carbon TMDL total maximum daily load TSS total suspended solids WAC Washington Administrative Code WDFW Washington Department of Fish and Wildlife WDOH Washington State Department of Health WWTP wastewater treatment plant USGS U.S. Geological Survey mg/L milligrams per liter (parts per million) ug/L micrograms per liter (parts per billion) ng/L nanograms per liter (parts per trillion) ug/Kg micrograms per kilogram (parts per billion)

Page viii
This page is purposely left blank for duplex printing.

Page ix
Abstract The state of Washington placed the Walla Walla River on the 1996 303(d) list as being water quality limited for 4,4’-DDE, 4,4’-DDD, dieldrin, chlordane, hexachlorobenzene, heptachlor epoxide, and PCB-1260 in edible fish tissue. The U.S. Environmental Protection Agency requires the states to set priorities for cleaning up 303(d) listed waters and to establish a Total Maximum Daily Load (TMDL) for each. A TMDL entails an analysis of how much of a pollutant load a waterbody can assimilate without violating water quality standards. This report presents results of a field study that forms the basis for a TMDL evaluation of these chlorinated pesticides/breakdown products and PCBs in the Walla Walla River drainage. The following TMDL elements are addressed: scope, applicable water quality standards, numerical targets, loading capacity, wasteload and load allocations, margin of safety, seasonal variation, and monitoring plan.

Page x
This page is purposely left blank for duplex printing.

Page xi
Acknowledgements Many people contributed to the successful completion of this project. The authors would like to especially thank the following:
• Joe Joy, Washington State Department of Ecology, Environmental Assessment Program, for his technical advice throughout this project. The present report draws heavily on work he did for the Yakima River Suspended Sediment and DDT TMDL.
• Craig Contour, Jed Volkman, Dave Wolf, Daryl Thompson, Jene Shippentower, and others from the Confederated Tribes of the Umatilla Indian Reservation (CTUIR) for their assistance collecting fish. Terry Shepherd for providing fish consumption information for CTUIR.
• Paul Olson, operations supervisor for the City of Walla Walla Wastewater Treatment Plant, and Bob Jamison, lead operator, and Frank Nicholson, utility engineer, for the City of College Place Wastewater Treatment Plant, for permission to sample their facilities.
• Rick Jones and the Walla Walla Conservation District for help with locating sampling sites and general information on the basin.
• Barbara J. and Larry L. Pierce, Jean Dolling, Shirley Ossipoff, Mrs. Ken Reardon, Mrs. J. Wagner, and other landowners in the Walla Walla basin for permission to sample from their property.
• Roger Trick and Renee Rusler for permission to sample on the Whitman Mission property.
• Glen Mendel, Mike Birely, and others with the Washington Department of Fish and Wildlife for information on basin fisheries and for their assistance collecting fish. John Sneva and Lucinda Morrow for aging the fish samples.
• Terry Spencer, Environmental Sampling and Technologies, for SPMD services.
• Jim Huckins, Waltor Cranor, and David Alvarez for advice on SPMD procedures and data analysis.
• Dave McBride, Washington State Department of Health, for conducting the human health assessment on the fish tissue data.
• Helen Rueda, EPA Region 10, for reviewing the project report.
• Washington State Department of Ecology, Regional Staff:
o David Duncan, Marcie Mangold, Elaine Snouwaert, Victoria Leuba, Jerry Anderson, Pat Hallinan, Sandra Treccani, John Covert, Mimi Wainwright, Carl Nuechterlein, Karin Baldwin, and others in the Eastern Regional Office for advice and assistance on a range of project issues.
o Bill Neve, Eastern Regional Office, Water Master for the Walla Walla River basin, for providing flow data.
o Ryan Andersen and Chris Coffin of the Central Region Office for information and water quality data on the Lower Yakima River Suspended Sediment and DDT TMDL.

Page xii
Acknowledgements (cont.)
• Washington State Department of Ecology, Environmental Assessment Program Staff:
o Myrna Mandjikov, John Weakland, Kelly Donegan, Cheryln Milne, Jessica Daiker, Pamela Covey, Karin Feddersen, Dean Momohara, Jamie Martin, and others at Manchester Environmental Laboratory for analyzing the samples for this project.
o Dale Norton for his advice and support as supervisor throughout the project.
o Nigel Blakley, Paul Anderson, and Morgan Roose for assistance with field work.
o Dave Serdar and Carolyn Lee for helping prepare fish tissue samples.
o The Stream Hydrology Unit for setting up flow monitoring stations.
o Joan LeTourneau for formatting and editing the project report.

Page xiii
Summary
Background In 1996 the Walla Walla River was listed by the state of Washington under Section 303(d) of the federal Clean Water Act for non-attainment of the U.S. Environmental Protection Agency (EPA) human health criteria for 4,4’-DDE, 4,4’-DDD, dieldrin, chlordane, hexachlorobenzene, heptachlor epoxide, and PCB-1260 in edible fish tissue. These chlorinated pesticides/breakdown products and polychlorinated biphenyls (PCBs) are no longer used in the United States, having been banned in the 1970s and 1980s. EPA requires the states to set priorities for cleaning up 303(d) listed waters and to establish a Total Maximum Daily Load (TMDL) for each. A TMDL entails an analysis of how much of a pollutant load a waterbody can assimilate without violating water quality standards. This report presents results of a TMDL evaluation for the above mentioned chemicals in the Walla Walla River drainage. The evaluation is based on a field study where water, fish tissue, and wastewater treatment plant effluents were monitored by the Washington State Department of Ecology from May 2002 through September 2003. The Walla Walla River is located in the southeast corner of Washington and extends 61 miles from its headwaters in Oregon to its confluence with the Columbia River. Approximately two-thirds of the drainage basin and the last 40 miles of the mainstem lie within Washington. The major cities are Walla Walla and College Place, with a combined population of less than 40,000. Dryland and irrigated agriculture are the predominant land uses. Cultivation has been a major cause of soil erosion in the basin, and erosion of agricultural soils is the main route by which chlorinated pesticides reach surface waters.
Results of Field Study Results from water sampling showed the highest average total DDT1, chlordane, and dieldrin concentrations were in Yellowhawk Creek, 3.7, 2.7, and 3.8 ng/L, respectively (parts per trillion, dissolved). Dry Creek had the highest concentrations of hexachlorobenzene and heptachlor epoxide, averaging 1.5 and 0.6 ng/L. Relatively large amounts of toxaphene were detected in Pine Creek, where concentrations up to approximately 40 ng/L were found. Creeks in the urbanized Mill Creek watershed had higher PCB concentrations than those that drained farming areas. The maximum total PCB concentrations, 0.77 – 9.2 ng/L, were measured in Garrison Creek. Lower Mill Creek and Yellowhawk Creek had the second highest PCB levels, 0.54 – 1.1 ng/L. Upper Mill Creek, the upper Walla Walla River at the state line, and the Touchet River consistently had the lowest concentrations of both pesticides and PCBs. Water sampling was done primarily on a quarterly basis: May-June, August-September, and November-December of 2002 and February-March of 2003. In the mainstem Walla Walla
1 DDT + breakdown products DDE and DDD

Page xiv
River, the highest pesticide concentrations always occurred during May-June; the lowest concentrations almost always occurred in November-December. February-March generally saw the second highest levels. The highest PCB concentrations were similarly recorded in May-June and February-March. Runoff in the basin is greatest during January through June, which is the likely reason for higher concentrations during this period. Pesticides and PCBs increased substantially in the Walla Walla mainstem between the Oregon border and middle river (at Detour Road), generally by factors of 2-to-4. Except for toxaphene, concentrations generally decreased in the lower Walla Walla River (below Cummins Bridge). The reduced lower river concentrations are largely attributable to dilution by the Touchet River. The Washington State human health water quality criteria that apply to chlorinated pesticides and PCBs in the Walla Walla River are for a one in one million (10-6) increased lifetime cancer risk from fish consumption. The criteria for total DDT and dieldrin were chronically exceeded in the Walla Walla drainage. The exceedances primarily occurred in and downstream of Yellowhawk Creek. Toxaphene commonly exceeded the criteria in Pine Creek and downstream in the lower Walla Walla River. Total chlordane exceedances were scattered throughout the drainage. There were relatively few exceedances for heptachlor epoxide and fewer yet for hexachlorobenzene, these being mostly restricted to lower parts of the drainage. PCB detection limits in some samples were not low enough to compare to the human health criterion. However, in every instance where PCB concentrations could be unambiguously quantified, the criterion was exceeded. Exceedances of the less restrictive aquatic life criteria were primarily limited to total DDT and were for chronic rather than acute exposure. Except for Yellowhawk Creek, the exceedances were almost entirely restricted to the May-June period. Fish sampling was limited to resident mainstem species, with upper river fish being analyzed separately from lower river fish. Over 120 smallmouth bass, channel catfish, carp, bridgelip suckers, and northern pike minnow were collected for the study. Fillets and a few whole fish samples were analyzed. The Washington State Department of Health is analyzing the data to determine if a fish advisory is warranted. In the fillet samples, DDT compounds were present in the highest concentrations, followed by PCBs/toxaphene, total chlordane, dieldrin, hexachlorobenzene, and heptachlor epoxide, in that order. The relative amounts of these compounds generally mirrored what was found in the mainstem water column. Average concentrations of total DDT in fillets ranged from 30 – 657 ug/Kg (parts per billion, wet weight) depending on the species. Total PCB and toxaphene concentrations averaged 8.9 – 238 ug/Kg and 16 – 56 ug/Kg, respectively. Average total chlordane concentrations were 2.7 – 19 ug/Kg. Dieldrin, hexachlorobenzene, and heptachlor epoxide concentrations were 2.1 ug/Kg or less. The highest pesticide and PCB concentrations were in carp, while the lowest were in smallmouth bass. Upper river fish tended to have higher concentrations of total DDT, total PCBs, total chlordane, and dieldrin, but lower concentrations of toxaphene and hexachlorobenzene, which is consistent with the location of major sources. Whole fish samples had higher concentrations than fillets.
Page xv
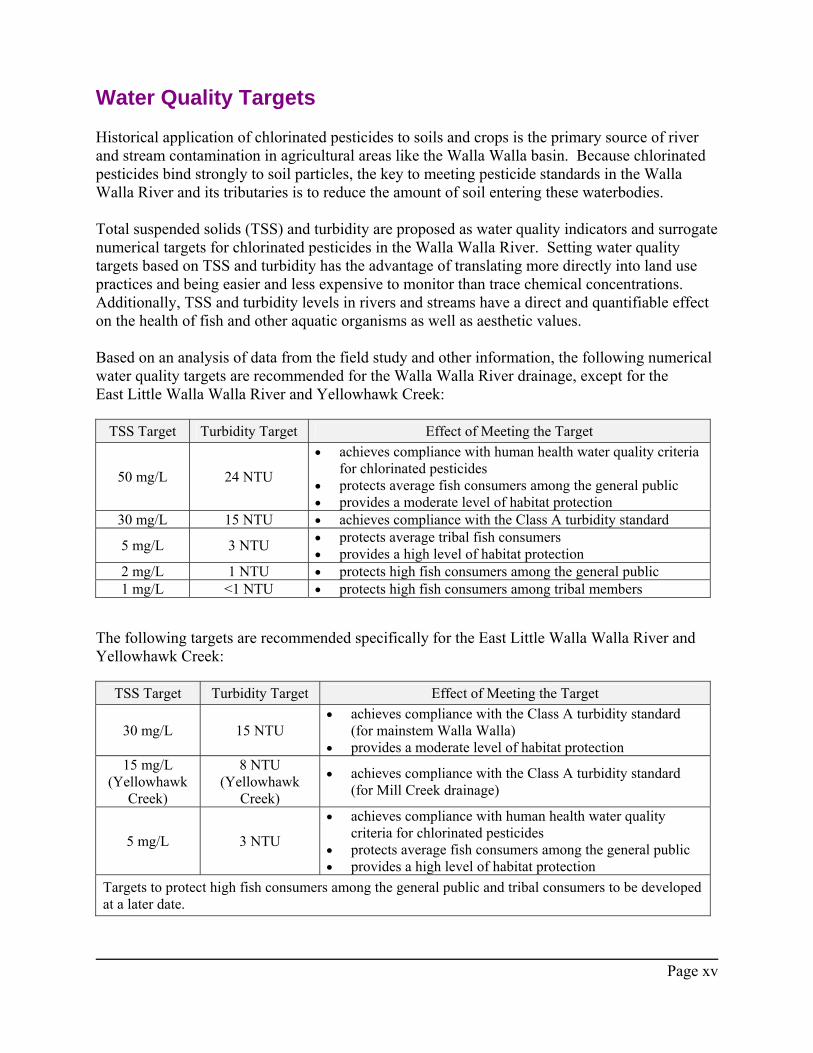
Water Quality Targets Historical application of chlorinated pesticides to soils and crops is the primary source of river and stream contamination in agricultural areas like the Walla Walla basin. Because chlorinated pesticides bind strongly to soil particles, the key to meeting pesticide standards in the Walla Walla River and its tributaries is to reduce the amount of soil entering these waterbodies. Total suspended solids (TSS) and turbidity are proposed as water quality indicators and surrogate numerical targets for chlorinated pesticides in the Walla Walla River. Setting water quality targets based on TSS and turbidity has the advantage of translating more directly into land use practices and being easier and less expensive to monitor than trace chemical concentrations. Additionally, TSS and turbidity levels in rivers and streams have a direct and quantifiable effect on the health of fish and other aquatic organisms as well as aesthetic values. Based on an analysis of data from the field study and other information, the following numerical water quality targets are recommended for the Walla Walla River drainage, except for the East Little Walla Walla River and Yellowhawk Creek:
TSS Target Turbidity Target Effect of Meeting the Target
50 mg/L 24 NTU
• achieves compliance with human health water quality criteriafor chlorinated pesticides
• protects average fish consumers among the general public • provides a moderate level of habitat protection
30 mg/L 15 NTU • achieves compliance with the Class A turbidity standard
5 mg/L 3 NTU • protects average tribal fish consumers • provides a high level of habitat protection
2 mg/L 1 NTU • protects high fish consumers among the general public 1 mg/L <1 NTU • protects high fish consumers among tribal members
The following targets are recommended specifically for the East Little Walla Walla River and Yellowhawk Creek:
TSS Target Turbidity Target Effect of Meeting the Target
30 mg/L 15 NTU • achieves compliance with the Class A turbidity standard
(for mainstem Walla Walla) • provides a moderate level of habitat protection
15 mg/L (Yellowhawk
Creek)
8 NTU (Yellowhawk
Creek)
• achieves compliance with the Class A turbidity standard (for Mill Creek drainage)
5 mg/L 3 NTU
• achieves compliance with human health water quality criteria for chlorinated pesticides
• protects average fish consumers among the general public • provides a high level of habitat protection
Targets to protect high fish consumers among the general public and tribal consumers to be developed at a later date.

Page xvi
Because of the difficulty inherent in measuring low levels of PCBs in surface waters, TSS and turbidity targets could not be derived specifically for PCBs in the Walla Walla River. PCBs also have a strong affinity for soil particles and atmospheric deposition is the likely major source to agricultural land. Therefore, meeting the TSS/turbidity targets in the Walla Walla drainage will reduce PCB concentrations in the river and its tributaries. Improving agricultural practices may not be sufficient to achieve water quality standards for PCBs in the urbanized Mill Creek watershed, and additional steps will likely be required. It is recommended that the water quality targets be applied to the Walla Walla River at the state line and at the mouths of all mainstem tributaries in Washington. A phased approach should be adopted for meeting the targets, starting with the 30 mg/L:15 NTU target in the East Little Walla Walla River and Yellowhawk Creek, and the 50 mg/L:24 NTU target in other parts of the drainage. The targets should be applied directly to all irrigation returns at the point they enter the mainstem or tributaries. The 2 mg/L:1 NTU and 1 mg/L:<1 NTU targets imply exceptional water quality and will be difficult to achieve in an agricultural basin. Because there is substantial uncertainty in the accuracy of these values they should be re-assessed once the more easily achieved targets are met. The goal of any future reassessment of these targets should be to return the river to conditions consistent with treaty rights of the Consolidated Tribes of the Umatilla Indian Reservation. The report includes a brief summary showing the progress that has been achieved in meeting similar water quality targets in the lower Yakima River TMDL.
Critical Season and Loading Capacity The critical season for TSS loading in the Walla Walla drainage was identified by examining the historical lower river data. The record shows the 50 mg/L TSS target is routinely exceeded from January through June but rarely exceeded during July – December. Therefore January – June is considered to be the critical period. This is the same time frame when the highest pesticide and PCB levels occur in the surface waters. Estimated TSS loads during critical season flows were compared to loads at the TSS targets, i.e., the loading capacity. The 90th percentile flow was used to assess loading capacity. At the 90th percentile, TSS concentrations would be expected to exceed loading capacity no more than 10% of the time. Estimates were provided of the reductions in TSS loading needed to meet water quality targets in the mainstem Walla Walla River and tributaries. The load reductions that appear to be needed in the mainstem lower river can be summarized as follows:
Estimates of Loading Reductions Needed in the Mainstem Lower Walla Walla River To Meet Water Quality Targets for TSS
Time Period
@ 50mg/L TSS Target
@ 30 mg/L TSS Target
@ 5 mg/L TSS Target
January - June 74% 84% 97% July - December 0% 20% 86%

Page xvii
The calculations indicate that no load reductions would be needed in Oregon in order for the Walla Walla River to meet either the 50 mg/L or 30 mg/L targets at the state line. TSS reductions on the Oregon side do appear to be called for to meet the 5 mg/L target. Under this scenario, very large TSS reductions would be needed basin-wide in both Washington and Oregon. The report notes results of a recent study of soil erosion in the Walla Walla basin conducted by Economic and Engineering Services Inc. They conclude that “total sediment loading can be reduced by 85% by using no-till practices instead of historical cropping practices involving significant tillage operations.” Thus, the present estimates of TSS load reductions needed to meet the 50 mg/L and 30 mg/L TSS targets appear to be achievable using established agricultural practices. The Walla Walla and College Place wastewater treatment plants (WWTP) were evaluated as sources of chlorinated pesticides, PCBs, and TSS to Mill and Garrison creeks, respectively, where they discharge. The only compounds consistently detected in the final effluents were DDE, chlordane, and PCBs. Without further dilution, total PCB concentrations exceeded the human health criterion at both facilities. However, a comparison of loading estimates suggests that the WWTPs represent less than 10% of the PCB load in the receiving waters and thus are insignificant relative to nonpoint sources and background in these watersheds. TSS concentrations in the effluents are limited through their NPDES permits. Discharge monitoring reports on file with Ecology show these facilities are not significant TSS sources.
Load Allocation A TMDL must identify the total allowed pollutant amount and its components: appropriate wasteload allocations for point sources and load allocations for nonpoint sources and natural background. In this TMDL evaluation, TSS is proposed as a surrogate measure for chlorinated pesticides. Equivalent targets are provided for turbidity. Achieving the TSS/turbidity targets also addresses the PCB listings in the drainage. Because of the existence of both point and nonpoint sources of PCBs in the Mill Creek watershed, specific PCB allocations were proposed for Mill and Garrison creeks. The proposed load allocations for TSS in the upper and lower mainstem Walla Walla River are shown below. These allocations are for the critical January through June period.
TSS Load Allocation (pounds per day) Location @ 50 mg/L TSS @ 30 mg/L TSS @ 5 mg/L TSS Upper Walla Walla River @ Peppers Bridge 120,000 69,000 12,000
Lower Walla Walla River @ Cummins Bridge 450,000 270,000 45,000
As previously discussed, the relationship between pesticides and TSS levels in the river can be expected to change as erosion of agricultural soils is brought under control. For this reason, and because of acknowledged uncertainties in the analysis, TSS load allocations are not proposed for the 2 mg/L and 1 mg/L targets at this time.

Page xviii
This TMDL evaluation did not attempt to differentiate between TSS loading from point sources, nonpoint sources, and background in Oregon. No significant TSS point sources to the Walla Walla River are present or anticipated in Oregon. Therefore wasteload allocations are zero. The entire TSS loading capacity of the Walla Walla River at the state line is allocated to nonpoint sources and background in Oregon. The river’s loading allocation at the state line for the initial 50 mg/L TSS target is 120,000 pounds per day. No significant point sources of TSS are present or anticipated in the Washington portion of the Walla Walla watershed. Wasteload allocations are therefore zero, with the exception of the Walla Walla and College Place WWTPs. Adjustments to the NPDES permits for these WWTPs are not necessary at this time, and TSS allocations should be consistent with permit load limits. This evaluation did not attempt to differentiate between TSS loading from nonpoint sources and background in Washington. Therefore, 100% of the TSS loading capacity is allocated to nonpoint sources and background. The loading allocation of the lower Walla Walla River for the initial 50 mg/L target is 450,000 pounds per day. Nonpoint and background sources in Oregon contribute an unknown part of the TSS load to the East Little Walla Walla River, West Little Walla Walla River, Pine Creek, and Mud Creek via their upper watersheds. Wasteload and load allocations were assigned for PCBs in Garrison Creek and Mill Creek in light of the levels detected in the College Place and Walla Walla WWTP effluents. The WWTP wasteload was calculated as the product of the human health water quality criterion and the NPDES permit limit for the average monthly effluent flow. The remaining loading capacity of these streams was allocated to nonpoint sources. (There is no natural background for PCBs). Wasteload and Load Allocations for PCBs (gm/day)
Garrison Creek
Mill Creek
Wasteload Allocation for WWTP 0.0011 0.0062 Load Allocation for Nonpoint 0.0017 0.023 Loading Capacity 0.0028 0.029
Compliance Schedule In the TMDL process, a flexible schedule is allowed for compliance with water quality targets since nonpoint source implementation is not an exact science. Interim targets are compared to monitoring data at regular intervals after best management practices, education programs, and other parts of the implementation strategy have been initiated. As the targets and data are compared, the progress toward improved water quality conditions is assessed, and adjustments or changes in the TMDL strategy are publicly discussed. The goal is to find practical and effective solutions to eliminate the water pollution problems addressed in the TMDL. A separate TMDL submittal report to EPA will have dates for meeting interim water quality targets, using input from a TMDL advisory group.

Page xix
Safety Margin / Monitoring Plan / Follow-up Work The report concludes with a discussion of safety margins and uncertainties in the TMDL evaluation. A plan is also outlined for TMDL effectiveness monitoring. Finally, follow-up work is suggested in three areas: 1) sediment sampling in the Columbia River backwater in the lower Walla Walla River to assess their potential as a source of pesticides/PCBs to fish, to evaluate ecological risk, and to estimate time to recovery as upstream water quality targets are achieved; 2) source identification for PCBs in the Mill Creek watershed; and 3) sampling to identify toxaphene sources in Pine Creek.

Page xx
This page is purposely left blank for duplex printing.

Page 1
Introduction In 1996 the Walla Walla River was listed by the state of Washington under Section 303(d) of the Clean Water Act for non-attainment of the U.S. Environmental Protection Agency (EPA) human health criteria for 4,4’-DDE, 4,4’-DDD, dieldrin, chlordane, hexachlorobenzene, heptachlor epoxide, and PCB-1260 in edible fish tissue.2 The listings are based on sampling done by the Washington State Department of Ecology (Ecology) in 1993 (Davis et al., 1995). The 1996 303(d) listings were maintained on the 1998 and draft 2002/2004 lists (Table 1). Garrison Creek, a Walla Walla tributary, was also proposed for listing in 2002/2004 due to human health exceedances for DDT compounds and hexachlorobenzene in water samples (White et al., 1998.) These chlorinated pesticides/breakdown products and polychlorinated biphenyls (PCBs) are no longer used in the United States, having been banned in the 1970s and 1980s for ecological concerns. They are now classed as probable human carcinogens by EPA. Detailed profiles including use, regulations, environmental occurrence, and health effects have been prepared by the Agency for Toxic Substances and Disease Registry and are available at http://www.atsdr.cdc.gov/toxpro2.html. EPA requires the states to set priorities for cleaning up 303(d) listed waters and to establish a Total Maximum Daily Load (TMDL) for each. A TMDL entails an analysis of how much of a pollutant load a waterbody can assimilate without violating water quality standards. This report presents results of a field study that monitored levels of the above-mentioned pesticides and PCBs in the Walla Walla drainage during May 2002 through September 2003. The study, conducted by Ecology, forms the basis for a TMDL evaluation in which water quality targets are proposed for meeting human health criteria and addressing other water quality concerns in the Walla Walla River. The report includes the following TMDL elements required by EPA Region 10:
• scope of the TMDL • applicable water quality standards • numerical targets • loading capacity • wasteload and load allocations • margin of safety • seasonal variation • monitoring plan 2 The 1996 and 1998 303(d) listings for fish tissue in the Walla Walla River mistakenly include a heptachlor listing in place of heptachlor epoxide, and 4,4’-DDT was mistakenly entered in place of 4,4’-DDD. The proposed 2002/2004 list for the Walla Walla River has been corrected to include 4,4'-DDD in fish tissue. .

Page 2
Table 1. Walla Walla Subbasin (WRIA 32) Toxics Listings (proposed 2002/2004 list information downloaded 5/13/04).
Waterbody Parameter Medium
Township Range Section
Water Course #/
Grid #
Lower Route
# 1996 List
1998 List
2002/ 2004 List Listing Basis
Walla Walla River (Old ID# WA-32-1010) 4,4'-DDE Tissue
07N 31E 25 QE90PI 4.081 Yes Yes Yes
Davis et al., 1995, excursions beyond the criterion in edible carp tissue near the mouth in 1993.
Walla Walla River (Old ID# WA-32-1010) Chlordane Tissue
07N 31E 25 QE90PI 4.081 Yes Yes Yes
Davis et al., 1995, excursions beyond the criterion in edible carp tissue near the mouth in 1993.
Walla Walla River (Old ID# WA-32-1010) Dieldrin Tissue
07N 31E 25 QE90PI 4.081 Yes Yes Yes
Davis et al., 1995, excursions beyond the criterion in edible carp tissue near the mouth in 1993.
Walla Walla River (Old ID# WA-32-1010)
Heptachlor epoxide Tissue
07N 31E 25 QE90PI 4.081 Yes Yes Yes
Davis et al., 1995, excursions beyond the criterion in edible carp tissue near the mouth in 1993.
Walla Walla River (Old ID# WA-32-1010)
Hexachloro- benzene Tissue
07N 31E 25 QE90PI 4.081 Yes Yes Yes
Davis et al., 1995, excursions beyond the criterion in edible carp tissue near the mouth in 1993.
Walla Walla River (Old ID# WA-32-1010) Total PCBs Tissue
07N 31E 25 QE90PI 4.081 Yes Yes Yes
Davis et al., 1995, excursions beyond the criterion in edible carp tissue near the mouth in 1993.
Walla Walla River 4,4'-DDE Tissue
07N 32E 35 QE90PI 21.03 No No Yes
Hopkins et al., 1985, excursions beyond the criterion in a multiple fish composite of edible tissue collected in 1984.
Garrison Creek Total DDT Water
06N 35E
3 DH35GB 0.66 No No Yes White et al., 1998, excursions beyond the criterion at stations GU2 and GD2 collected in 1996.
Garrison Creek Hexachloro-
benzene Water
06N 35E
3 DH35GB 0.66 No No Yes White et al., 1998, excursions beyond the criterion at stations GU2 and GD2 collected in 1996.

Page 3
Scope of the TMDL
Geographic This TMDL evaluation covers that portion of the Walla Walla River from the Washington-Oregon border at river mile (r.m.) 40.0 to the river’s confluence with the Columbia River, including its Washington tributaries (Water Resource Inventory Area 32).
303(d) Listings This TMDL specifically addresses each of the 303(d) listings in Table 1. Although not one of the contaminants on the 303(d) list, toxaphene is also addressed in this evaluation based on findings from the field study which indicate it to be a significant source of impairment. A turbidity listing has been proposed for the Touchet River in 2002/2004. Although turbidity is factored into the numerical targets proposed in the present report, this study does not constitute a TMDL for turbidity in the Touchet River.
Pollutant Parameters This TMDL is for the following chemicals in the water column and fish tissue:
• 4,4’-DDT • 4,4’-DDE (DDT breakdown product) • 4,4’-DDD (DDT breakdown product) • dieldrin • heptachlor epoxide (heptachlor breakdown product) • hexachlorobenzene • cis and trans chlordane • cis and trans nonachlor (chlordane constituents) • oxychlordane (chlordane breakdown product) • toxaphene • PCBs

Page 4
Basin Description The Walla Walla River is located in the southeast corner of Washington State (Figure 1). The river extends 61 miles from its headwaters in Oregon to its confluence with the Columbia River. The drainage basin covers approximately 1,760 square-miles. Approximately three-quarters (73%) of the drainage and the last 40 miles of the mainstem lie within Washington. In downstream order, the major Washington tributaries are Yellowhawk Creek, Garrison Creek, Mill Creek, Dry Creek, Pine Creek, and the Touchet River. Minor tributaries, also in downstream order, include the East Little Walla Walla River, West Little Walla Walla River, Stone Creek, Mud Creek, and Gardena Creek. Mill Creek flows from Class AA municipal watershed conditions in the Blue Mountains. Most of the city of Walla Walla’s drinking water comes from a 36 square-mile protected portion of upper Mill Creek. Below the waterworks, part of its flow is diverted to Yellowhawk and Garrison creeks from May through October for irrigation purposes. The two major permitted discharges in the basin are the Walla Walla Wastewater Treatment Plant (WWTP) which discharges to Mill Creek at r.m. 5.4 and the College Place WWTP which discharges to Garrison Creek at r.m. 1.0. Yellowhawk, Garrison, and Mill creeks enter the Walla Walla River between r.m. 37.9 and 33.6. The drainage area of the greater Mill Creek watershed is 96 square-miles. Dry Creek flows into the Walla Walla approximately five miles below Mill Creek. It has a 246 square-mile basin with elevations ranging from 4,600 feet in the Blue Mountains to 450 feet at its Walla Walla confluence near Lowden (r.m. 27.2). Dry Creek’s watershed is mainly used for dryland wheat, with only sparse forests in the headwaters. The Pine Creek confluence is approximately 4 miles below Dry Creek (r.m. 23.4). Its watershed is 170 square-miles, the upper portion of which is in Oregon. The Touchet River is the largest Walla Walla tributary. It originates in four forks deep in forested areas of the Blue Mountains at an elevation of 6,000 feet. The Touchet flows through the small towns of Dayton, Waitsburg, and Prescott, reaching the Walla Walla at r.m. 21.6 near the town of Touchet, elevation 469 feet. The basin area is 747 square-miles. Land use from Dayton to the Walla Walla confluence is mostly agricultural. The Walla Walla basin has few urban areas. The major cities are Walla Walla and College Place, with a combined population of less than 40,000. Starting as early as the 1920s the principal form of land use was production of small grains, such as wheat and alfalfa, and row crops (Mapes, 1969). By the 1970s nearly 90% of the Washington portion of the basin had been cultivated. Currently, wheat, alfalfa seed and hay, and peas are the largest percentage of the irrigated crops. Other crops include onions, grapes, apples, asparagus, and barley. Figure 2 shows land use patterns as of the late 1980s/early 1990s.

Figure 1. Walla Walla River Basin.
Page 5

Page 6
This page is purposely left blank for duplex printing.

N
4 0 4 8 Miles
Figure 3. Land Use in the Walla Walla Basin, 1986-1996 data
WashingtonOregon
Rivers and Streams
Orchards/Vineyards/Other
Pasture/Hay
Row Crops
Small Grains
Fallow
Land Use
Figure 2. Land Use in the Walla Walla Basin, 1986-1996 dataPage 7

Page 8
This page is purposely left blank for duplex printing.
Page 9
Cultivation has been a major cause of soil erosion in the Walla Walla basin, and erosion of agricultural soils is the primary route by which chlorinated pesticides reach surface waters. Studies conducted in the 1960s showed yields of suspended sediment were greatest in the highly cultivated Touchet River and Dry Creek drainage basins, which were contributing up to 80% of the total sediment load to the Walla Walla River (Mapes, 1969). Soils in these two drainages consist of well-drained silty loams and very fine sandy loams that are highly susceptible to erosion from runoff. Silt predominates in the suspended sediment transported by basin streams. Within the TMDL study area, bedload is only about 2 – 8% of the suspended load (Mapes, 1969). Sediment deposition in the mainstem occurs primarily in the lower ten miles of the river, due to backwater effects from McNary Dam on the Columbia River. Otherwise, the river bed is mostly gravel and cobble. A recent report by Economic and Engineering Services Inc. has concluded that erosion of fine sediment is a serious problem in the lower Walla Walla basin (EES, 2003). Stream segments with poor salmonid habitat ratings due to sediment or with sediment concentrations listed as a key water quality concern include the Walla Walla River (state line to the mouth), Yellowhawk Creek, Dry Creek, and the Touchet River (Kuttel et al., 2001; Saul et al., 2001). EES identified a number of sources of sediment including road-building and logging activities in the upper reaches of tributaries, recreational vehicle use, and urban runoff. They concluded, however, that “given the predominance of agricultural land use in the watershed, agricultural practices have been identified as the principal source of fine sediment”. The irrigation season in the Walla Walla basin generally extends from mid-April to mid-October. The majority of runoff and erosion occurs from precipitation in winter through early spring, sustained through June by snow melt. Precipitation varies dramatically with elevation. Near the mouth of the river, there is less than 10 inches of rainfall annually. Precipitation increases with elevation to a maximum of over 40 inches annually in the headwaters, most falling as snow. The typical flow pattern in the Walla Walla and its tributaries is illustrated in Figure 3. Groundwater springs supply baseflow to surface waters year-round. Infrequent storm events during the winter months sometimes cause severe flooding from heavy rainfall and rapid snowmelt that contribute the highest concentrations of suspended sediments (Mapes, 1969). Rivers and streams in the basin experience greatly reduced flows in the summer from a combination of reduced supply and diversion for irrigation. The Walla Walla River has gone dry at the Oregon border, and lower Mill and Pine creeks have little or no flow during the late summer. Dewatering has also been a problem in the lower Touchet. Conditions have improved recently as a result of farmers diverting less water in response to bull trout endangered species listings. .

Page 10
0
200
400
600
800
1000
1200
1400
May Jun Jul Aug Sep Oct Nov Dec Jan Feb Mar Apr
Flow
(cfs
)Walla Walla R. Touchet R. Mill Cr.Yellowhawk Cr. Dry Cr.
Figure 3. Typical Flow Patterns in the Walla Walla Drainage (USGS data, 1951-2002).
Some local farmers have already made substantial efforts to improve water quality by migrating to no-till or low-till farming. Much of the dryland acreage in Columbia County (Touchet River watershed) has been converted to no-till, and the soil savings have been excellent (Victoria Leuba, Ecology Eastern Regional Office, personal communication). There has also been a recent push to provide buffers on streams through riparian plantings. The Walla Walla Conservation District enrolled the greatest acreage in the state in 2003 – 2,200 acres all within 180 feet of streams or the equivalent of about 118 stream miles buffered. Additionally, there is ongoing restoration of Garrison Creek riparian areas in Fort Walla Walla funded by the Terry Husseman account and implemented by the City of Walla Walla and the Walla Walla stream team. This is an effort to improve water quality and riparian habitat in the city. The Confederated Tribes of the Umatilla Indian Reservation (CTUIR) maintains treaty protected rights to fish and gather in the Walla Walla basin. CTUIR, in partnership with the Army Corps of Engineers, is in the process of developing the Walla Walla River Basin Feasibility Study. The tribe is committed to restoring salmon populations and the flow necessary to support those populations in the Walla Walla basin. The goal of the Walla Walla River Basin Project, which CTUIR is sponsoring, is to restore streamflows. Low streamflows are a critical limiting factor to salmonid restoration. The Tribe also saw the first returns from adult spring chinook outplantings this year, another aspect of the Tribe’s multi-faceted salmon restoration plan.

Page 11
Historical Pesticide/PCB Data Elevated levels of chlorinated pesticides and PCBs in Walla Walla River fish were first reported by Ecology in Hopkins et al. (1985). The more recent 1992-93 Ecology fish tissue data that resulted in the 1996 303(d) listings for the Walla Walla are summarized in Table 2 and compared to the listing criteria. Each of these samples was a composite formed by pooling tissues from five individual fish. In order for a waterbody to be placed on the 303(d) list, Ecology required at least two single-fish samples or one composite of at least five fish that exceeded human health listing criteria. The 303(d) human health criteria shown in Table 1 are based on EPA bioconcentration factors (BCF3) and water column criteria established under the EPA National Toxics Rule (40 CFR Part 131). For example, the 32 ug/Kg fish tissue criterion for 4,4’-DDE is calculated by converting the water quality criterion of 0.59 ng/L to ug/L (0.00059 ug/L) and multiplying by a BCF of 53,600 L/Kg. Units of ug/Kg and ug/L are equivalent to parts per billion, and ng/L is parts per trillion. Ecology’s 1992-93 fish samples were collected in the lower 15 miles of the Walla Walla River. The analysis included 43 chlorinated pesticides or breakdown products and seven PCB mixtures; only detected compounds are shown in Table 2. Fillets were analyzed from three species – common carp (Cyprinus carpio), steelhead trout (Oncorhynchus mykiss), and white crappie (Pomoxis annularis). The highest pesticide and PCB residues were found in carp, where 303(d) listing criteria were exceeded by a factor of approximately 10 or more for DDE, dieldrin, heptachlor epoxide, hexachlorobenzene, and PCBs. Carp also exceeded the total chlordane criterion. There were modest exceedances of the total DDT (DDT+DDE+DDD), dieldrin, and heptachlor epoxide criteria in steelhead. However, these were returning adults, so it is unknown how much contamination can be attributed to the Walla Walla River. The only criterion exceeded in crappie was for heptachlor epoxide, approximately by a factor of 3. All of these chemicals were also detected in whole-body and egg samples from largescale suckers (Catostomus macrocheilus) collected in the same area.
3 BCF= Ct/Cw, where Ct is the contaminant concentration in tissue (wet weight) and Cw is the concentration in water.

Page 12
Table 2. Summary of Historical Data on Chlorinated Pesticides and PCBs Detected in Walla Walla River Fish (ug/Kg wet weight; parts per billion).
White Common Species: Largescale Sucker Crappie Carp Steelhead 303(d) Tissue: Whole Body Eggs Whole Body Fillet Fillet Fillet Listing
Date: Sep-92 Sep-92 Sep-93 Sep-92 Sep-93 Sep-93 Criteria4,4'-DDT 26 3.6 15 nd nd 4.0 32 4,4'-DDE 425 57 338 17 600 15 32 4,4'-DDD 51 7.2 49 1.7 97 15 45 Total DDT 502 68 402 19 697 34 32 Dieldrin 5.0 nd 4.5 nd 10 4.0 0.65 Heptachlor Epoxide 8.3 2.1 3.5 3.7 8.2 4.0 1.2 Hexachlorobenzene 6.9 2.7 8.8 2.1 20 4.8 6.7 Cis-Chlordane 4.6 0.8 3.0 0.7 8.0 2.0 Trans-Chlordane 4.9 0.7 2.7 0.7 8.5 1.0 Cis-Nonachlor 1.9 nd 2.3 nd 5.0 1.0 Trans-Nonachlor 10 nd 6.4 nd 13 3.0 Oxychlordane 2.0 nd 0.8 nd 1.0 1.0 Total Chlordane 23 1.5 15 1.4 36 8.0 8.3 PCB - 1254 48 10 nd nd nd nd 5.3 PCB - 1260 90 22 122 nd 300 nd 5.3 Total PCBs 138 32 122 nd 300 nd 5.3 DCPA (Dacthal) nd nd nd nd nd 5.0 Ethion nd nd 3.0 nd 2.0 nd DDMU 16 1.9 8.0 nd 15 nd Alpha-BHC 0.5 nd nd nd nd nd 1.7 Gamma-BHC (Lindane) 7.9 2.3 1.0 1.3 1.0 1.0 8.2 From Davis and Johnson (1994), Davis et al. (1995) Note: Values in bold exceed 303(d) criteria for edible tissue nd = not detected

Page 13
Ecology has also analyzed chlorinated pesticides in water and sediment samples from the Walla Walla mainstem and tributaries (Tables 3 and 4). PCBs have only been analyzed in fish. Table 3. Summary of Historical Data on Chlorinated Pesticides Detected in Water Samples from the Walla Walla Drainage (ng/L; parts per trillion).
Pesticides Yellowhawk Garrison Mill Lower Mud Dry Pine Touchet Walla Walla Date Detected Creek Creek Creek Creek Creek Creek River River Ref.
May-92 none na na na na na na na <50 1 Apr-93 none na na na na na na na <50 2 Jun-93 " na na na na na na na <50 2 Aug-93 " <50 na <50 <50 <50 <50 <50 <50 2 Oct-93 " na na na na na na na <50 2 Apr-96 none <50 na <50 <50 <50 <50 <50 <50 3 Jun-96 4,4'-DDT <50 na <50 <50 6 <50 <50 <50 3
" Aldrin 110 na <50 <50 <50 <50 <50 <50 3 Sep-96 t-DDT na 4-8 na na na na na na 4
" HCB na 7-8 na na na na na na 4 Apr-97 none <12 na na <12 <12 <12 na na 5 May-97 " <12 na na <12 <12 <12 na na 5
References: 1 = Davis (1994) 2 = Davis and Johnson (1994) 3 = Johnson (1997a) 4 = White et al. (1998) 5 = Johnson (1997b) na = not analyzed Table 4. Summary of Historical Data on Chlorinated Pesticides Detected in Sediment Samples from the Walla Walla Drainage (ug/Kg dry weight; parts per billion).
Location: Yellowhawk Garrison Mill Lower Mud Dry Pine Touchet Walla Walla Creek Creek Creek Creek Creek Creek River River
Date: Jun-96 Aug-96 Jun-96 Jun-96 Jun-96 Jun-96 Jun-96 Jun-96 4,4'-DDT 3.0 1.2 1.8 1.2 <1.1 1.9 0.69 1.2 4,4'-DDE 2.7 30 3.3 6.6 5.0 4.2 3.1 7.6 4,4'-DDD 0.61 12 0.76 2.5 0.99 0.77 0.83 1.8 Total DDT 6.3 43 5.9 10 6.0 6.9 4.6 10.6 Dieldrin <3.7 nd <4.5 <5.3 <4.3 <3.9 <4.2 <4.6 Heptachlor epoxide <1.2 nd <1.5 <1.8 <1.4 <1.3 <1.4 <1.5 Hexachlorobenzene 0.49 2.7 0.45 0.89 3.7 1.2 1.4 2.0 Chlordane 1.7 46 3.5 <18 3.0 1.5 <14 3.0 Gamma BHC 0.74 nd 0.91 0.89 3.7 0.90 0.56 0.80 TOC (%) 0.30 na 1.5 1.4 0.8 0.60 0.80 9.2 From Johnson (1997a), White et al. (1998) nd = not detected na = not analyzed

Page 14
For the most part, the detection limits achieved in past water samples have only been appropriate for observing gross contamination, and few pesticides have been found. DDT compounds and hexachlorobenzene were detected in two Garrison Creek samples at 4 – 8 ng/L. DDT was detected at 6 ng/L in a Dry Creek sample. A high concentration of aldrin, 110 ng/L, was detected once in Yellowhawk Creek. Aldrin rapidly breaks down to dieldrin. These concentrations exceed both human health and aquatic life criteria. More sensitive methods have been used to analyze sediment samples (Johnson, 1997a; White, 1998). Results showed that DDT compounds, hexachlorobenzene, and chlordane were detectable at most sites, with concentrations ranging from 0.45 – 46 ug/Kg. Dieldrin and heptachlor epoxide were not detected in sediments.

Page 15
Applicable Water Quality Standards
Washington Water quality standards for surface waters of the state of Washington are codified in Chapter 173-201 of the Washington Administrative Code (WAC). Characteristic Uses The Walla Walla is a Class A river. Characteristic uses for Class A waters include, but are not limited to the following (WAC 173-201A-030): (i) Water supply (domestic, industrial, agricultural). (ii) Stock watering. (iii) Fish and shellfish: Salmonid migration, rearing, spawning, and harvesting. Other fish migration, rearing, spawning, and harvesting. Clam, oyster, and mussel rearing, spawning, and harvesting. Crustaceans and other shellfish (crabs, shrimp, crayfish, scallops, etc.) rearing, spawning, and harvesting. (iv) Wildlife habitat. (v) Recreation (primary contact recreation, sport fishing, boating, and aesthetic enjoyment). (vi) Commerce and navigation. Toxic Substances WAC 173-201A-030 states the following with regard to toxic substances: (vii) Toxic, radioactive, or deleterious material concentrations shall be below those which have the potential either singularly or cumulatively to adversely affect characteristic water uses, cause acute or chronic conditions to the most sensitive biota dependent upon those waters, or adversely affect public health, as determined by the department (see WAC 173-201A-040 and 173-201A-050). Toxics substances are further addressed in WAC 173-201A-040 as follows (selected sections): (1) Toxic substances shall not be introduced above natural background levels in waters of the state which have the potential either singularly or cumulatively to adversely affect characteristic water uses, cause acute or chronic toxicity to the most sensitive biota dependent upon those waters, or adversely affect public health, as determined by the department. (2) The department shall employ or require chemical testing, acute and chronic toxicity testing, and biological assessments, as appropriate, to evaluate compliance with subsection (1) of this section and to ensure that aquatic communities and the existing and characteristic beneficial uses of waters are being fully protected.

Page 16
and (5) Concentrations of toxic and other substances with toxic propensities not listed in subsection (3) of this section shall be determined in consideration of USEPA Quality Criteria for Water, 1986, as revised, and other relevant information as appropriate. Human health-based water quality criteria used by the state are contained in 40 CFR 131.36 (known as the National Toxics Rule). (6) Risk-based criteria for carcinogenic substances shall be selected such that the upper-bound excess cancer risk is less than or equal to one in one million. Water Quality Criteria Washington State water quality criteria that apply to 303(d) listed pesticides and PCBs in the Walla Walla drainage are shown in Table 5 (from sections (3) and (5) of WAC 173-201A-040). The human health criteria are for a one in one million (10-6) increased lifetime cancer risk from consumption of water and fish or fish only. A fish consumption rate of 6.5 grams per day and a water consumption rate of 2 liters per day are assumed. These criteria were promulgated on Washington in the EPA National Toxics Rule. Table 5. Applicable Washington State Water Quality Criteria* for Chlorinated Pesticides and PCBs (ng/L; parts per trillion).
Criteria for Protection Criteria for Protection of Aquatic Life of Human Health
Chemical Freshwater Freshwater Water and Fish Fish Acute Chronic Consumption Consumption
4,4'-DDT 0.59 0.59 4,4'-DDE 0.59 0.59 4,4'-DDD 0.83 0.84 DDT (and metabolites) 1,100 1.0 Dieldrin 2,500 1.9 0.14 0.14 Heptachlor 520 3.8 0.21 0.21 Heptachlor epoxide 0.10 0.11 Hexachlorobenzene 0.75 0.77 Chlordane 2,400 4.3 0.57 0.59 Toxaphene 730 0.2 0.73 0.75 PCBs 2,000 14 0.17 0.17 *WAC 173-201A-040

Page 17
Oregon Beneficial uses and water quality standards for the surface waters of the state of Oregon are codified in the Oregon Administrative Rules (OAR) Chapter 340, Division 41. Beneficial Uses Beneficial uses for the Walla Walla River basin are given in OAR 340-041-0682 and shown below:
Beneficial Uses
Walla Walla River Mainstem from Confluence of North and
South Forks to State Line
All Other Basin
Streams 1Public Domestic Water Supply X X 1Private Domestic Water Supply X X Industrial Water Supply X Irrigation X X Livestock Watering X X Anadromous Fish Passage X X Salmonid Fish Rearing X X Salmonid Fish Spawning X X Resident Fish & Aquatic Life X X Wildlife & Hunting X X Fishing X X Boating X X Water Contact Recreation X X Aesthetic Quality X X Hydro Power X
1 With adequate pretreatment (filtration and disinfection) and natural quality to meet drinking water standards.
Toxic Substances OAR 340-041-0685 (part p) states the following with regard to toxic substances: (A) Toxic substances shall not be introduced above natural background levels in the waters of the state in amounts, concentrations, or combinations which may be harmful, may chemically change to harmful forms in the environment, or may accumulate in sediments or bioaccumulate in aquatic life or wildlife to levels that adversely affect public health, safety, or welfare; aquatic life; wildlife; or other designated beneficial uses; (B) Levels of toxic substances shall not exceed the criteria in Table 22 which were based on criteria established by EPA and published in Quality Criteria for Water (1986), unless otherwise noted.

Page 18
Water Quality Criteria Oregon state water quality criteria that apply to 303(d) listed pesticides and PCBs in the Walla Walla River basin are shown in Table 6. Table 6. Applicable Oregon State Water Quality Criteria* for Chlorinated Pesticides and PCBs (ng/L; parts per trillion).
Criteria for Protection Guidance Values for the of Aquatic Life Protection of Human Health Freshwater Freshwater Water and Fish Fish
Chemical Acute Chronic Consumption Consumption 4,4'-DDT 1,100 1.0 0.024 0.024 4,4'-DDE 1,050,000** 4,4'-DDD 60** Dieldrin 2,500 1.9 0.071 0.071 Heptachlor 520 3.8 0.28 0.29 Heptachlor epoxide Hexachlorobenzene 0.72 0.74 Chlordane 2,400 4.3 0.46 0.48 Toxaphene 730 0.2 0.71 0.73 PCBs 2,000 14 0.079 0.079
*OAR 340-041-0685 (part p) **guidance value only

Page 19
Project Description The primary goals of the field study for the Walla Walla River chlorinated pesticide/PCB TMDL were to: 1) quantify water column concentrations and loadings of 303(d) listed pesticides and PCBs in the Walla Walla mainstem, major tributaries, and significant point sources; 2) recommend numerical water quality targets that will result in fish meeting human health standards; and 3) propose load allocations to meet the targets. In pursuit of these goals, sufficient data were obtained to allow an assessment of human health risk from fish consumption, and benchmarks were established to gauge future improvements in water quality. The health risk assessment is being conducted by the Washington State Department of Health (WDOH) Office of Environmental Health Assessments and will be reported separately. Specific objectives of the TMDL field study were as follows: 1. Obtain representative data on water column concentrations of 303(d) listed pesticides, PCBs,
ancillary parameters, and flow in the mainstem and major tributaries.
2. Investigate wastewater treatment plant (WWTP) discharges as potential pesticide/PCB sources to the river.
3. Obtain a reliable estimate of mean pesticide and PCB concentrations in the edible tissues of resident mainstem fish species most frequently consumed.
4. Use the water, effluent, and fish tissue data in conjunction with other information to select appropriate numerical water quality targets for the river.
5. Evaluate the correlation between chlorinated pesticides, total suspended solids (TSS), and turbidity as a possible means of selecting water quality targets.
6. Determine the river’s loading capacity for these constituents and propose wasteload and load allocations for point sources, nonpoint sources, and background.
7. Incorporate the data and analysis into a report that addresses the TMDL elements required by EPA Region 10.
The study area included the mainstem Walla Walla River and its tributaries from the Oregon border to the Columbia River. Tributary sampling was confined to sites at or near their mouths, except for upper Mill Creek and the WWTPs. Fish sampling was limited to resident species. Field work began in May 2002 and was completed in September 2003. The study was conducted by the Ecology Environmental Assessment Program following a Quality Assurance Project Plan prepared by Johnson and Era-Miller (2002).
Page 20
This page is purposely left blank for duplex printing.

Page 21
Design of Field Study
Surface Waters The purpose of the water sampling was to: 1) identify and rank sources of contamination; 2) assess compliance with human health and aquatic life criteria; 3) test for relationships between chlorinated pesticides, TSS, and turbidity; and 4) calculate loadings to and within the river. Semipermeable Membrane Devices Water column concentrations of 303(d) listed pesticides and PCBs in the Walla Walla drainage were poorly known, but expected to be low, especially for those chemicals found at trace levels in fish samples. Reconnaissance sampling conducted in January 2002 confirmed low concentrations of 0.043 – 0.15 ng/L for 4,4’-DDE, dieldrin, and hexachlorobenzene in the lower Walla Walla River and Mill Creek (Johnson and Era-Miller, 2002). In light of the low concentrations, a semipermeable membrane device (SPMD) was used as the primary means of reliably detecting and quantifying all the chemicals of interest. SPMDs are passive samplers that mimic the biological uptake of low solubility organic compounds and can achieve detection limits in the sub-parts per trillion. The device used in the present study was developed by the U.S. Geological Survey (USGS), Columbia Environmental Research Center and is now of standardized design, patented, and commercially available through Environmental Sampling Technologies (EST), St. Joseph, MO (http://www.spmds.com). Details of SPMD theory, construction, and application can be found at http://wwwaux.cerc.cr.usgs.gov/spmd. Each SPMD is composed of a thin-walled, layflat polyethylene tube (91 x 2.5 cm) filled with triolein, the major neutral lipid in fish (Figure 4). When placed in water, dissolved lipophilic organic compounds diffuse through the membrane and are concentrated over time. Deployment times vary but are typically 20 – 30 days. The SPMDs are then extracted and analyzed for the chemicals of interest. A combination of laboratory calibration data and Permeability/Performance Reference Compounds (PRCs) spiked in deployed SPMDs are used in conjunction with field temperature to obtain an estimate of average concentrations. A SPMD will effectively sample 0.5 – 10 liters of water per day, depending on the compound in question. SPMDs provide a time-weighted average concentration for the chemicals of interest and only measure the dissolved and, therefore, readily bioavailable fraction. Studies have shown the results are comparable to other low-level sampling methods such as liquid-liquid extraction and solid-phase extraction (Ellis et al., 1995; Rantalainen et al., 1998). Recent use of SPMDs in Washington State includes studies of chlorinated pesticides and PCBs in the Columbia River and Spokane River (McCarthy and Gale, 1999; EILS, 1995; Hart Crowser, 1995; Anchor Environmental, 2000).

Page 22
Figure 4. SPMD Device and Deployment Canister. http://wwwaux.cerc.cr.usgs.gov/spmd/spmd_overview.htm

Page 23
For the Walla Walla TMDL, SPMDs were deployed at the ten sites listed in Table 7. The locations are shown in Figure 5. Detailed descriptions of the sampling sites are provided in Appendix A. Table 7. Water Quality Monitoring Sites Where SPMDs Were Deployed in the Walla Walla Drainage During 2002-2003.
Mainstem Drainage Area Sampling Site River Mile (sq. miles)
Upper Walla Walla River @ Peppers Bridge 39.6 ~193 Yellowhawk Creek @ Old Milton Highway 37.9 70 Garrison Creek @ Mission Rd. 36.1 ? Upper Mill Creek @ Seven Mile Rd. - - ? Lower Mill Creek @ Mission Rd. 33.6 96 Middle Walla Walla River @ Detour Rd. 32.9 ~328 Dry Creek @ Highway 12 Bridge 27.2 246 Pine Creek @ Sand Pit Rd. 23.4 170 Touchet River @ Highway 12 Bridge 21.6 747 Lower Walla Walla River bw. Cummins Bridge 14.3 1,690
��
����
����
��
����
��
��
�
� ��� � �����
�����������
������������
��������������
��
�� ���
�����
�����
� ��������
����� ��� ��
����
������� ��
����
���������������� �
�����������������
����������
����������
��� �� ������
������
Figure 5. Water Quality Monitoring Sites Where SPMDs Were Deployed.

Page 24
Six tributaries were monitored: Yellowhawk Creek, Garrison Creek, Mill Creek, Dry Creek, Pine Creek, and the Touchet River. These represent over 85% of the river’s drainage area in Washington. They include the major TSS sources (Touchet River and Dry Creek) and the two major urban streams (Mill and Garrison creeks). A sampling site was also located on upper Mill Creek to measure contaminant levels in drainage from forested vs. agricultural land and to establish background water quality for Mill, Yellowhawk, and Garrison creeks. The mainstem was monitored at the Oregon border (@ Peppers Bridge), approximately midway downstream below Mill Creek (@ Detour Road), and in the lower river about one mile below Cummins Bridge. SPMDs were deployed quarterly for approximately one month each, as indicated in Figure 6. The deployments were timed to provide representative data over the range of runoff conditions that normally occur in the drainage. There were two deployments during the 2002 irrigation season, one in the spring and one during summer low flow; one deployment during the rising flows of early winter 2002; and one deployment during the late winter peak flows of 2003. The lower Walla Walla River and Touchet River SPMDs from May-June 2002 became buried in silt and were unusable. The May-June SPMD data in this report are from samplers deployed at the same time the following year. Temperature was monitored continuously during each SPMD deployment. At the beginning, middle, and end of each deployment period, ancillary data were obtained on flow, TSS, turbidity, total organic carbon (TOC), dissolved organic carbon (DOC), and conductivity. Flow data were obtained through Ecology’s Environmental Assessment Program Stream Hydrology Unit, USGS, and other sources or gauged in the field. The SPMD extracts were analyzed for the 303(d) listed pesticides and PCBs. The analysis was expanded to include toxaphene, based on examination of the chromatograms from the initial deployment in May.

0
200
400
600
800
1000
1200
1400
May Jun Jul Aug Sep Oct Nov Dec Jan Feb Mar Apr
Flow
(cfs
)
Walla Walla R. Touchet R. Mill Cr. Yellowhawk Cr. Dry Cr.
Figure 6. Historical Flow Patterns in the Walla Walla Drainage, with Shaded Areas Indicating Periods When SPMD Samplers were Deployed in 2002-2003 (USGS data).
Page 25

Page 26
TSS/Turbidity Correlation The National Research Council (2001) has suggested using statistical regression of a water quality indicator on one or more predictor variables as a simple and useful model for developing TMDLs. This approach has been used successfully in a TMDL for the lower Yakima River (Joy and Patterson, 1997). That study was able to correlate total DDT with TSS and set instream targets for TSS reduction to meet DDT criteria for aquatic life. TSS was, in turn, linked to the state turbidity standard and to fish habitat requirements. Data were obtained to test this relationship in the Walla Walla drainage. Grab samples were periodically collected from the SPMD deployment sites and analyzed for the target pesticides in conjunction with TSS, turbidity, and other ancillary parameters. Low detection limits were achieved by using a new large-volume injection technique (see Methods). No attempt was made to quantify PCB concentrations in the grab samples, since the cost of doing so on surface waters is prohibitive. Follow-up Sampling Several smaller tributaries were not included in the routine water quality monitoring. In order to determine if pesticide concentrations were comparable to the larger tributaries that had been the focus of the study, grab samples were collected from the East Little Walla Walla River, West Little Walla River, Stone Creek, Lower Mud Creek, and Gardena Creek in February 2003 (Figure 7). Because results showed elevated concentrations in some of these streams, periodic grab sampling was continued through September 2003.
�
��
��
����������
������������
��������������
�
� �� � �����
����������
���������������
�����������������
�������� ������� ���� �� �������
��� ���
Figure 7. Minor Tributaries Where Follow-up Water Sampling was Done.

Page 27
NPDES Discharges There are 20 NPDES (National Pollution Discharge Elimination System) permits within the basin (Table 8). Four of these are for WWTPs located in the cities of Walla Walla, College Place, Waitsburg, and Dayton. The remaining 16 permits are for industries, municipalities, and land owners who either discharge directly to one of the treatment plants or whose discharge is land application. Table 8. NPDES Permits in the Walla Walla Basin.
Facility Name Type Size City County Permit No. Columbia Mosquito Control Dist.
aquatic pesticide general permits Burbank Walla Walla WAG992002A
Broetje Orchards fruit packers general permits Prescott Walla Walla WAG437006C College Place WWTP municipal minor Walla Walla Walla Walla WA0020656B Dayton acclimation pond fish general permits Dayton Columbia WAG137004C Dayton WWTP municipal minor Dayton Columbia WA0020729B Koncrete Industries Inc. industrial general permits Walla Walla Walla Walla WAG507028B Koncrete Industries Inc. industrial general permits Walla Walla Walla Walla WAG500026AKonen Rock Crushing Inc. industrial general permits Dayton Columbia WAG507051B Konen Rock Crushing Inc. industrial general permits Dayton Columbia WAG500006ARock Hill Concrete Co. industrial general permits Dayton Columbia WAG507041B Simplot Feeders industrial minor Wallula Walla Walla WA0045420B Transtate Asphalt Co. industrial general permits Walla walla Walla Walla WAG507032B WA DOT sc region ps-0-68 industrial general permits Burbank Walla Walla WAG507062B
WA DOT sc region qs-co-16 industrial general permits Dayton Columbia WAG507094B
Wa DOT sc region qs-o-66 industrial general permits Waitsburg Walla Walla WAG507073B
Waitsburg WWTP municipal minor Waitsburg Walla Walla WA0045551A Walla Walla WWTP municipal major Walla Walla Walla Walla WA0024627C Weidert Farms Inc. - quarry industrial general permits Touchet Walla Walla WAG507111B
Boise Cascade industrial major Walla Walla Walla Walla WA0003697B Camas Gravel Co. industrial general permits Dayton Columbia WAG500054A

Page 28
The Walla Walla and College Place WWTPs were evaluated as possible sources of chlorinated pesticides and PCBs. The Walla Walla plant (9.6 million gallons per day) discharges to Mill Creek and the College Place plant (1.6 mgd) discharges to Garrison Creek (Figure 8).
��
�����������������
�����������
�������������
���������
�
� ��� � ����
����
���
��� ����
��������������
��������
�����������
Figure 8. Location of Walla Walla and College Place WWTPs. The city of Walla Walla is authorized to discharge treated and disinfected effluent to Mill Creek from December 1 through April 30 of each year, subject to the effluent limits and conditions of its NPDES permit. The city is required by a 1927 court order to deliver up to 7.9 mgd of treated and disinfected wastewater to the Gose and Blallock Irrigation Districts from May 1 through November 30. The NPDES permit allows diversion of the effluent to the irrigation districts from April 15 through December 15. The districts can choose to use the effluent or divert it back into Mill Creek. College Place effluent is discharged during May through October into wetlands that feed into Garrison Creek. November through April the effluent is discharged directly to the creek. The other two WWTPs in the basin – Dayton and Waitsburg – are small discharges (< 1 mgd) located over 40 miles up the Touchet River and were considered unlikely to be significant pesticide/PCB contributors to the Walla Walla River. In the opinion of the Ecology Eastern Regional Office, industries and other NPDES facilities in the Walla Walla basin are not

Page 29
significant sources (Pat Hallinan and Jerry Anderson, Ecology Eastern Regional Office, personal communication, 2002). For the TMDL study, composite effluent samples were collected over a two-day period on a quarterly basis from the Walla Walla and College Place WWTPs. The locations of the effluent sampling sites are in Appendix A. Sampling was done near the midpoint of the SPMD deployment period. Each sample was analyzed for chlorinated pesticides, PCBs, TSS, and conductivity. Low detection limits were achieved by using large-volume injection for pesticides and high-resolution GC/MS for individual PCB congeners4.
Fish Tissue The purpose of the fish tissue samples was to: 1) determine the extent to which the pesticides and PCBs detected in 1992-93 continue to exceed 303(d) listing criteria; 2) assess appropriateness of applying EPA human health criteria to the Walla Walla River; and 3) provide data to the WDOH for a human health assessment. Washington Department of Fish & Wildlife (WDFW) biologists in the Walla Walla area were contacted for information on sport and subsistence fishing on the river. Results of these discussions are summarized in Table 9. The resident species most frequently consumed from the Walla Walla River are smallmouth bass (Micropterus dolomieu), channel catfish (Ictalurus punctatus), and carp (Cyprinus carpio). The fish tissue collection for the TMDL focused on these species. Some segments of the local population consume almost any fish they catch (Glen Mendel, WDFW, personal communication). Therefore, two other commonly encountered species, bridgelip suckers (Catostomus columbianus) and northern pike minnow (Ptychocheilus oregonensis; formerly known as northern squawfish) were also collected. WDFW indicated that some crayfish are taken, but studies have shown that crayfish muscle has a low potential to accumulate chlorinated pesticides or PCBs (Serdar et al., 1999; EILS, 1995). 4 PCBs can be analyzed as equivalent concentrations of the commercial mixtures (Aroclors in the U.S., e.g., Aroclor-1260) or through a more sensitive and expensive method for individual compounds, referred to as congeners, of which there are 209 possible. Because of the cost associated with a congener analysis, this study primarily analyzed Aroclor-equivalents.

Page 30
This page is purposely left blank for duplex printing.

Page 31
Table 9. Fisheries Information for Resident Walla Walla Species (notes from discussion with G. Mendel and M. Birely, WDFW).
Species Range Season and locations fished Spawn season Size and bag limits
Smallmouth bass
Several miles downstream of Mill Creek to the Columbia and in Touchet upstream to Dayton
Fished in the late spring/early summer from the mouth of the Touchet to the Columbia.
Spring No minimum size/ 5 per day
Common carp
In the Walla Walla from the mouth of Mill Creek to the Columbia River and a short distance up the Touchet
Fished from April through June in the shallow delta at the mouth of the Walla Walla River (fish caught in the delta are probably resident to the lower part of the Walla Walla River delta). Local fishing places: between Burbank and Wallula (Casey pond).
Spring No minimum size or limit
Channel catfish
From the mouth of the Touchet out to the Columbia
Fished in late spring/early summer (particularly night fishing in the summer) from the mouth of the Touchet out to the Columbia. Local fishing places: at old abandoned highway bridge, below Little Goose Dam and Lion’s Ferry State Park, highway 12 off of Wallula Game Department Road .
Spring/early summer
12” minimum size/ 5 per day
Largescale/Bridgelip suckers
From the state line to the Columbia River and up the Touchet to Dayton
From the state line to the Columbia River and up the Touchet to Dayton; not really fished.
Spring/early summer
No minimum size or limit
Brown/ Black bullheads
From the mouth of the Touchet out to the Columbia, but since they are a reservoir-type fish, adult fish are probably found more often near the mouth of the Walla Walla River
Fished in spring/early summer (and fall?) from the mouth of the Touchet out to the Columbia River. Fished in many of the same local places as channel catfish.
Spring/early summer
No minimum size or limit
White crappie
From the mouth of the Touchet out to the Columbia (mainly near the mouth of the Walla Walla)
Found in low abundance, so aren’t fished for much. A few are caught locally near the old abandoned highway bridge.
Spring/early summer
No minimum size or limit
Crayfish In Mill Creek near city of Walla Walla and in streams throughout the basin with a rocky bottom
Some immigrants have been found fishing for them in Mill Creek. Are found on rocky stream bottoms, probably not too many near the mouth of the Walla Walla (Legal fishery open from May through summer).
unknown 2 pots per day

Page 32
The Confederated Tribes of the Umatilla Indian Reservation (CTUIR) was contacted to determine if the Walla Walla River is an important source of fish for Tribal members. According to CTUIR, there is evidence that the Tribe has eaten the above-mentioned species in the past. There is suspected current use by Tribal members, although there is no written documentation. Use will likely increase once flows are restored and other traditional anadromous species are returned to the river. This is expected to bring Tribal members back to the area more regularly, in which case these other species would be harvested more frequently as well. (Terry Shepard, CTUIR, personal communication). Salmonids that inhabit the Walla Walla drainage include steelhead, spring chinook, and bull trout. These species were not sampled for the TMDL because they are migratory, threatened, and/or endangered. Rainbow trout and whitefish occur in the study area, but legal size rainbow are rare and whitefish density very low (Mendel et al., 2001). Within the mainstem, bass and catfish are primarily found between the mouth of the Walla Walla and the Touchet River. Carp, bridgelip suckers, and pike minnow occur throughout the river. As previously mentioned, the Touchet and nearby Dry Creek transport most of the sediment load discharged from the basin. Inputs of sediments and associated contaminants from these two tributaries, as well as Pine Creek, have the potential to result in substantially different water quality conditions in the lower river. Therefore, separate specimens for chemical analysis were obtained from the upper and lower river, using the Touchet River-Dry Creek reach as an approximate dividing line (Figure 9). Samples close to the confluence with the Columbia River were avoided in an effort to obtain data representative of the Walla Walla River. The reaches where fish sampling was done are described in Appendix A. The fish samples were collected in July and September, 2002. Fillets were analyzed for 303(d) listed pesticides, PCBs (Aroclor-equivalents), and percent lipids. Composite samples were used to obtain a cost efficient estimate of mean chemical concentrations. For a given number of fish to be analyzed as composites, greater statistical power is achieved by increasing the number of replicate composites as opposed to increasing the number of fish per composite (EPA, 2000b). The target sample size was 20 fish of each species from each location, to be analyzed in composites of five fish each. A composite size of five was selected to balance the need for confidence in estimating mean concentrations against the cost of chemical analysis. The CTUIR requested that Ecology include whole fish samples in the TMDL study, as many Tribal members use the entire fish (CTUIR April 2, 2002 board meeting). Therefore, several whole fish composites were included in the analysis.

�
� ��� � ���
�����������
����������������� ����������������� ������ ����
�������������
��������������
����� ����� ���������
�����
�����
�
����� ���������
� �����
���� ���
������� ��
�
���������
���
Figure 9. Location of Fish Samples
Page 33

Page 34
Summary of Field Work The number and timing of field samples collected for this project are summarized in Table 10. Table 10. Summary of Field Work for the Walla Walla Chlorinated Pesticide/PCB TMDL Study.
Sample No. of
Duration Frequency 2002 2003
Type Sites No. Samples M J J A S O N D J F M A M J J A S SPMDs 10 26-28 days quarterly 41 Whole water 4-12 grabs ● ● ● ● ● ● ● ● ● ● ● periodic 88* WWTP effluent 2
2-day composites ● ● ● ●
quarterly 8 Fish tissue 2 2-4 days/reach ● ● - - 29 composites
* 88 pesticide samples; additional conventional water quality samples were also collected

Page 35
Methods
Field Procedures SPMD Samples Deployment and retrieval procedures for semipermeable membrane devices (SPMDs) followed the guidance in Huckins et al. (2000). Standard SPMDs (91 x 2.5 cm membrane containing 1 mL triolein) and the stainless steel canisters (16.5 x 29 cm) and carriers that hold the membranes during deployment were obtained from Environmental Sampling Technologies (EST). The SPMDs were preloaded onto the carriers by EST in a clean-room and shipped in solvent-rinsed metal cans under argon atmosphere. Five SPMDs were used in each canister, with one canister per sampling site. The SPMDs were kept frozen until deployed. On arriving at the sampling site, the cans were pried open, carriers slid into the canisters, and the device anchored and tethered in the stream. The SPMDs were located out of strong currents, situated in such a way as to minimize the potential for vandalism, and placed deep enough to allow for anticipated fluctuations in water level. Because SPMDs are potent air samples, the procedure was done as quickly as possible, typically a minute or less. Field personnel wore nitrile gloves and did not touch the membranes. The SPMDs were deployed for 28 days each, on average. The retrieval procedure was essentially the opposite of deployment. Cans holding the SPMDs were carefully sealed and shipped to EST for extraction. The SPMDs were kept at or near freezing and arrived at EST within 24 hours of retrieval. Chain-of-custody was maintained. An Onset StowAway Tidbit was attached to each canister to monitor temperature. The latitude and longitude of the sampling sites were recorded from a Magellan 320 GPS receiver. Where required, streamflow was measured using a Swoffer Model 2100 meter and top-setting rod. Surface Water Grab Samples At the beginning, middle, and end of each deployment period, grab samples for TOC, DOC, TSS, turbidity, and conductivity were collected at each SPMD site. Pesticide samples were also collected periodically, both from the SPMD sites and other minor tributaries. Multiple grabs with a hand-held glass jar were composited into 1-gallon glass jars with Teflon lid liners, both cleaned to EPA (1990a) QA/QC specifications. Sub-samples from the composite were split into appropriate containers (Table 11). DOC samples were filtered in the field (0.45 micron). The water samples were placed on ice for return to Ecology headquarters, where they were held in a secure cooler for later transport with chain-of-custody record to the Ecology Manchester Environmental Laboratory.

Page 36
Table 11. Sample Containers, Preservation, and Holding Times for Water Samples.
Parameter Container* Preservation Holding Time
Chlorinated pesticides 1 gal. glass; Teflon lid Cool to 4oC 7 days PCBs (congeners) 1 L amber glass; Teflon lid Cool to 4oC 7 days TSS 1 L poly bottle Cool to 4oC 7 days Turbidity 500 mL poly bottle Cool to 4oC 48 hours Conductivity 500 mL poly bottle Cool to 4oC 28 days TOC 125 mL poly bottle HCl to pH<2, 4oC 28 days DOC 125 mL poly bottle Filter, HCl to pH<2, 4oC 28 days *Obtained from Manchester Laboratory or Axys Laboratory (PCB congeners) Effluent Samples Final effluent samples from the Walla Walla and College Place WWTPs were composites collected by hand. Each composite consisted of two separate grabs per day (morning and afternoon) for two days. The composites were split into appropriate containers for chlorinated pesticides, PCB congeners, TSS, and conductivity. Sample containers, preservation, and holding times were as shown in Table 11. Flow data were obtained from WWTP records. The latitude and longitude of the sampling sites were recorded from a Magellan 320 GPS. The effluent samples were placed on ice for return to Ecology headquarters, where they were held in a secure cooler for later transport with chain-of-custody record to Manchester Laboratory. Manchester shipped the congener samples to Axys Laboratory for analysis. Fish Samples Upper river fish were collected during an electrofishing survey of salmonid abundance being conducted by WDFW. Lower river fish were collected with the assistance of CTUIR biologists, using electrofishing and beach seines. Most species have no size limits (see Table 9). Those taken for analysis were judged large enough to be retained for consumption. The latitude and longitude of the sampling sites were recorded from a Magellan 320 GPS. Fish selected for analysis were killed by a blow to the head. Each fish was given a unique identifying number and its length and weight recorded. The fish were individually wrapped in aluminum foil, put in plastic bags, and placed on ice for transport to Ecology headquarters, where the samples were frozen pending preparation of tissue samples.

Page 37
Laboratory Procedures Fish Tissue Fish tissue samples were prepared following the guidance in EPA (2000b). Techniques to minimize potential for sample contamination were used. Persons preparing the samples wore non-talc nitrile gloves and worked on heavy duty aluminum foil or a polyethylene cutting board. The gloves and foil were changed between samples and the cutting board cleaned between samples, as described below. The fish were thawed enough to remove the foil wrapper and rinsed with tap water, then deionized water to remove any adhering debris. The entire fillet from one or both sides of each fish (depending on its size) was removed with stainless steel knives and homogenized in a Kitchen-Aid or Hobart commercial blender. The fillets were skin-off for catfish, and scaled with skin-on for other species, as recommended by EPA (2000b). Whole fish samples were homogenized in the Hobart blender without scaling. The sex of each fish was recorded and hard structures (scales, otoliths, opercles, dorsal, and/or pectoral spines as appropriate for each species) saved for age determination. Five individual fish were used for each composite sample. To the extent possible, the length of the smallest fish in each composite was no less than 75% of the length of the largest fish. The composites were prepared using equal weight aliquots from each fish. The pooled tissues were homogenized to uniform color and consistency, using a minimum of three passes through the blender. The homogenates were placed in 8 oz. glass jars with Teflon lid liners, cleaned to EPA (1990a) QA/QC specifications. Cleaning of resecting instruments, cutting boards, and blender parts was done by washing in tap water with Liquinox detergent, followed by sequential rinses with tap water, de-ionized water, and pesticide-grade acetone. The items were then air dried on aluminum foil in a fume hood before use. The tissue samples were refrozen for shipment with chain-of-custody record to Manchester Laboratory. The samples were stored frozen at Manchester until analyzed. Appendix B contains detailed information on the age, length, and weight of each fish in the composite samples. Fish ages were determined by John Sneva and Lucinda Morrow of WDFW. Chemical Analyses The methods used to analyze samples collected for this study are listed in Table 12. All of the analyses were conducted by Manchester Laboratory, except PCB congeners were analyzed by Axys Analytical Services Ltd. in Sidney, B.C. Some additional details on analyzing the SPMDs are provided below.

Page 38
Table 12. Laboratory Procedures.
Analysis Matrix Sample Prep Method Analytical Method
Chlor. pesticides SPMD dialysis/GPC*, EPA SW-3620/3665 EPA SW-8081/8082PCBs (Aroclor equiv.) SPMD dialysis/GPC*, EPA SW-3620 EPA SW-8082 Chlor. pesticides whole water EPA SW-3510 EPA SW-8081 TSS whole water n/a EPA 160.2 Turbidity whole water n/a SM 2130 TOC, DOC whole water n/a EPA 415.1 Conductivity whole water n/a EPA 120.1 Chlor. pesticides WWTP effluent EPA SW-3510 EPA SW-8081 PCBs (congeners) WWTP effluent EPA 1668A EPA 1668A TSS WWTP effluent n/a EPA 160.2 Conductivity WWTP effluent n/a EPA 120.1 Chlor. pesticides fish tissue EPA SW-3540/3620/3665 EPA SW-8081 PCBs (Aroclor equiv.) fish tissue EPA SW-3540 EPA SW-8082 Percent lipid fish tissue extraction EPA 608.5 Percent solids fish tissue dry @ 105oC SM 2540
*EST SOPs E14, E15, E19, E21, E33, E44, E48 n/a = not applicable The SPMDs were spiked with pesticide/PCB surrogates, extracted (referred to as dialysis), and cleaned up by gel permeation chromatography at EST. The cleaned-up extracts were then analyzed by Manchester Laboratory. The SPMD samples arrived at Manchester as hexane extracts of 4-5 mL volume in heat-sealed ampoules. The extracts were quantitatively transferred to centrifuge tubes, then concentrated under a nitrogen gas stream to approximately 1 mL. Each extract was eluted through a macro Florisil® column: first with 100% hexane which was collected as the 0% Florisil® fraction, followed by a 50% hexane/preserved diethyl ether solution which was collected as the 50% Florisil® fraction. The extracts were then solvent exchanged into iso-octane and concentrated to approximately 1 mL. The 50% fraction was split into two portions. One portion of the 50% fraction and the 0% fraction were treated with concentrated sulfuric acid to remove interferences prior to analysis by dual column GC-ECD (gas chromatography – electron capture detection). The untreated portion of the 50% fraction was analyzed without further treatment. Excess extract was stored at 0oC.

Page 39
Calculation Procedures for SPMDs The sampling rates of standard SPMD membranes have been determined in the laboratory for a variety of organic compounds. Sampling rate varies with temperature, water velocity, and biofouling. Flow generally has a greater impact than either temperature or biofouling. Reliable estimates of average dissolved concentrations for the chemicals of interest require field data on temperature and an adjustment of laboratory-derived sampling rates for the water velocity and biofouling conditions that existed during deployment. For the Walla Walla study, temperature was monitored continuously for each SPMD deployment. The effects of water velocity and biofouling were accounted for by spiking each membrane with Permeability/Performance Reference Compounds (PRCs). PRCs are analytically non-interfering compounds with moderate to relatively high fugacity (escape tendency). The use of PRCs can be viewed as an in situ calibration/recalibration approach, where the rate of PRC loss during exposure is related to target compound uptake. This is accomplished by measuring PRC loss rates during laboratory calibration studies and field exposures. Using these values, an exposure adjustment factor (EAF) is derived. A fundamental assumption of the PRC approach is that PRCs can be used to predict the EAFs of chemicals over a range of octanol-water partition coefficients (Kow
5). Based on recent studies by Huckins et al. (2002), this assumption appears valid, and the difference between measured concentrations of an analyte and the PRC-derived estimates should be within a factor of 2. PCB-4 (2,2’-dichlorobiphenyl) and PCB-29 (2,4,5-trichlorobiphenyl) were used as PRCs for the Walla Walla study. These congeners are not present to any significant extent in commercial PCB mixtures or in environmental samples. The SPMD membranes were spiked with 0.2 ng of each congener prior to being deployed in the field. The spiking was done by EST using a spiking solution provided by Manchester Laboratory. The data on exposure time, temperature, initial and final PRC concentration, and chemical residues in the SPMDs were entered into an Excel spreadsheet calculator developed by David Alvarez, USGS Columbia Environmental Research Center (Appendix C). PCB-29 was used as the PRC for these calculations since its Kow is closer to those of the target compounds. The equations behind this spreadsheet can be found at http://wwwaux.cerc.cr.usgs.gov/spmd/SPMD-Tech_Tutorial.htm. No laboratory calibration data were available for toxaphene. Concentrations were estimated by assuming equilibrium and using an average log Kow of 4.36. The toxaphene concentrations arrived at using this approach should be considered rough estimates.
5 Octanol-water partition coefficient, a measure of a chemical’s tendency to associate with the organic fraction in water

Page 40
This page is purposely left blank for duplex printing.

Page 41
Data Quality
Laboratory Case Narrative Summary Manchester Laboratory prepared written case narratives assessing the quality of the data collected for this project. These reviews include a description of analytical methods and an assessment of holding times, initial and continuing calibration and degradation checks, method blanks, surrogate recoveries, matrix spike recoveries, laboratory control samples, and laboratory duplicates. The reviews and the complete Manchester data reports are available from the author on request. Data quality issues pertinent to the pesticide/PCB analyses are summarized below. No significant problems were encountered in the conventional water quality analyses. The complete pesticide/PCB data set for the SPMD, whole water, effluent, and fish samples, including data qualifiers, is in Appendix D. The data are also available electronically through the Ecology Environmental Information Management System (EIM) at http://www.ecy.wa.gov/ecyhome.html. SPMD Extracts Pesticide peaks in the SPMD extracts were generally large and easily distinguishable, and the data required little qualification. The main toxaphene congeners appeared to elute in both the 0% and 50% Florisil fractions. Because of the analyte split, the overall pattern of toxaphene could not be determined and consequently all of the detections were qualified as estimated values. The dieldrin data for the May-June 2002 deployment were qualified as estimates due to possible losses during the analysis. Except for Garrison, Mill, and Yellowhawk creeks, most of the PCB concentrations were below the reporting limit of 100 ng and therefore qualified as estimates. Surface Water Grabs A number of problems were encountered in attempting to analyze the low levels of dieldrin, hexachlorobenzene, and heptachlor epoxide present in the whole water samples. These included interferences, method blank contamination, poor spike recoveries, and imprecision. There were also some low-level interferences affecting the ability to identify 4,4’-DDT and 4,4’-DDD. Therefore, the use of these data in the present report is limited to 4,4’-DDE. WWTP Effluents Pesticide extracts from the WWTP effluent samples contained high levels of many unknowns that obscured analyte peaks. Due to the severe interferences, all pesticide data were qualified, either at an estimated reporting limit or as an estimated result. The PCB congener data required no special qualification.

Page 42
Fish Tissue All fish tissue results above the reporting limits for cis-nonachlor, toxaphene, and 4,4’-DDT were qualified as estimates. These analytes elute in both the 0% and 50% fractions. For each compound, the concentration of one of the fractions could not be determined due to interferences from other analytes present in the sample. PCB mixtures in the fish tissues most closely resembled Aroclor-1254 and -1260. The results were qualified as estimates due to weathering and/or interferences from other Aroclors or toxaphene.
Field Quality Control Samples Replicates and Splits The results from replicate SPMDs and grab samples provide estimates of the total variability (field + laboratory) associated with the water column and effluent data contained in the present report. Two sets of SPMDs were deployed side-by-side in Yellowhawk Creek during August-September 2002. The concentrations calculated from these samplers agreed within 15% or better for all chemicals except heptachlor epoxide where results differed by 32% (Appendix E). Replicate surface water grabs were taken on one occasion each from the lower Walla Walla River, Pine Creek, and the East Little Walla Walla River (Appendix E). Four pesticide compounds were detected in these samples. Only 4,4’DDE and heptachlor epoxide were quantified in each replicate pair, and concentrations varied by 0 – 7%. Variability greater than 21 – 23% was associated with the detection of 4,4’-DDT and dieldrin. Results for conventional water quality parameters agreed within 20%. Effluent samples were collected from the Walla Walla and College Place WWTPs on two consecutive days to assess short-term variability in pesticide/PCB concentrations. The Walla Walla samples for the second day were analyzed in duplicate (laboratory splits) to obtain estimates of analytical precision. The results (Appendix E), indicate day-to-day variability ranged from >1– > 65% for pesticides and 16 – 27% for PCBs. Similar variability was encountered for pesticides in the split samples. Good analytical precision was indicated for PCBs where the duplicates agreed within 7%. The field variability inherent in fish tissue data was minimized by using composite samples. Estimates of analytical precision were obtained by analyzing laboratory splits (Appendix E). Except for chemicals present in trace amounts, duplicate analyses generally agreed within 30% or better for pesticides and 12% or better for PCBs. The toxaphene analysis was less precise, for reasons previously explained. Poor precision was achieved in the carp fillet composite, even for chemicals present in substantial concentrations. Recovery of pesticide and PCB surrogate spikes were similar, so the imprecision is likely due to a poorly homogenized sample.

Page 43
All results from replicate and split samples were averaged for use in the remainder of this report. Field Blanks Because SPMDs sample vapors while being exposed to air, field blanks were used to assess chemical accumulation during deployment and retrieval. The SPMD field blank consisted of five membranes in an argon-filled stainless steel can. It was opened to the air for the average amount of time it took to open and place the SPMDs in the water. The blank was then resealed and refrozen. It was taken back into the field and opened and closed again to mimic the retrieval process. The blank was prepared, processed, and analyzed the same as deployed SPMDs. There was one field blank for each sampling period. The total time each blank was exposed to air ranged from three to seven minutes. The results from analyzing the SPMD field blanks are in Appendix D. Pesticide concentrations in the blank were subtracted from concentrations measured in deployed SPMDs. Blank concentrations were generally lower than the samples by an order of magnitude or more, except for chlordane. At the time of the survey, the EST laboratory had chronic low-level chlordane contamination. A PCB background was detected in the SPMD field blanks for November-December and February-March, but not for the other deployments. Analysis of laboratory blanks suggested the source was at EST. PCB concentrations less than three times the blank for these two time periods are flagged but not blank corrected. Transfer and bottle blanks for pesticides and PCBs were analyzed for the surface water grabs and the effluent samples. These consisted of sample bottles filled with organic-free water at Manchester and AXYS laboratories. The transfer blank was prepared by pouring the blank water into sample containers while in the field. No significant contamination was evident in any of these samples.

Page 44
This page is purposely left blank for duplex printing.

Page 45
Results of Field Study
Surface Water Flow Conditions Flows in the Walla Walla River during the 2002-03 monitoring period for the chlorinated pesticide/PCB TMDL study are compared to historical averages in Figure 10. The data are for USGS gaging station #14018500 near Touchet (http://waterdata.usgs.gov/nwis/sw). The period of record is 1952 – 2002.
0
500
1000
1500
2000
2500
May Jun Jul Aug Sep Oct Nov Dec Jan Feb Mar Apr
Flow
(cfs
)
Walla Walla R.- Historical Walla Walla R. - 2002-03
Figure 10. Walla Walla River Flow During the 2002 - 2003 TMDL Study Compared to Historical Averages (USGS data). From May through October 2002, river flows were at or slightly above normal, ranging from a monthly average of 817 cubic feet per second (cfs) in May to 13 cfs in August. Historical averages are 721 cfs and 19 cfs, respectively. This time frame included the first two SPMD deployments and associated grab samples of May-June and August-September. Since 2000, three large irrigation districts – two in Oregon, one in Washington – have been bypassing 18 to 28 cfs to maintain flows in the Walla Walla mainstem, as part of an agreement with the U.S. Fish & Wildlife Service. As a result, flows from the Oregon state line down to the Lowden area have been higher than those prior to 2000 (Bill Neve, Ecology Eastern Regional Office, personal communication, 2002).

Page 46
The winter of 2002-03 was unusually dry, followed by a wet spring. Flows in the Walla Walla were lower than normal in November-December 2002 when the third set of SPMDs was deployed, averaging 115 – 845 cfs. For the fourth deployment in February-March, flows averaged around 1,900 cfs which is higher than normal. A possible effect of the atypical winter flows for 2002-2003 is that the November-December data may underestimate typical pesticide/ PCB concentrations in the drainage, while the concentrations measured in February-March could be higher than normal. Dissolved Pesticide/PCB Concentrations Chlorinated pesticide and PCB concentrations measured in the SPMD samples are shown in Table 13. These monthly averages are condensed to annual averages in Table 14. The results are for the dissolved form of the chemical. Flow and conventional water quality data collected in conjunction with the SPMDs are in Appendix F.

Page 47
Table 13. Monthly Average Pesticide/PCB Concentrations Measured Using SPMDs in the Walla Walla Drainage During 2002-2003 [ng/L dissolved; parts per trillion].
Upper Upper Yellow- Garrison Lower Middle Dry Pine Touchet Lower Chemical Mill Cr. Walla Walla hawk Cr. Creek Mill Cr. Walla Walla Creek Creek River Walla Walla
May - June 2002 Sample No. 208091 208090 208089 208088 208086 208085 208083 208084 244011 244010 Total DDT 0.60 1.3 6.5 4.4 2.2 4.3 2.7 5.5 0.46 2.7 Total Chlordane 0.70 1.0 2.4 6.4 2.4 2.0 3.3 2.3 0.23 2.0 Dieldrin 0.45 <0.2 2.0 0.68 0.88 1.3 2.8 0.70 0.07 0.43 Hexachlorobenzene 0.15 0.22 0.57 0.93 0.51 0.68 3.3 0.80 0.21 0.57 Heptachlor Epoxide <0.1 <0.1 0.24 0.18 0.06 0.16 1.9 0.61 0.09 0.30 Toxaphene <0.3 <0.3 ~0.3 <0.3 ~0.57 ~0.57 ~0.51 ~40 ~0.24 ~8.3 Total PCBs <1 <1 1.1 9.2 <1 0.80 0.65 <1 0.21 0.84 August - September 2002 Sample No. 038091 038090 038088/89 038084 038085 038087 038083 038082 038081 038080 Total DDT 0.18 0.43 2.2 2.1 0.91 1.4 0.40 0.60 0.75 0.84 Total Chlordane 0.19 0.31 1.1 2.4 1.2 0.81 0.44 0.29 0.42 0.35 Dieldrin 0.05 0.03 0.64 <0.8 1.2 0.44 0.36 0.26 <0.03 0.19 Hexachlorobenzene 0.10 0.14 0.14 0.38 0.34 0.23 1.4 0.32 0.67 0.34 Heptachlor Epoxide 0.01 0.03 0.06 0.11 0.14 0.14 0.18 0.34 0.12 0.13 Toxaphene <0.3 <0.3 <0.3 ~1.8 <0.3 ~0.62 <0.3 ~1.7 ~0.74 ~0.93 Total PCBs <0.3 <0.7 1.1 3.2 <0.9 <0.5 <0.7 <0.8 0.26 0.26 November - December 2002 Sample No. 078967 078966 078964 078962 078963 078965 078961 078960 078959 078958 Total DDT 0.06 0.17 1.6 0.34 0.71 0.76 0.13 0.51 0.06 0.28 Total Chlordane <0.05 <0.05 5.6 0.35 0.37 0.27 <0.05 <0.05 <0.05 <0.05 Dieldrin 0.04 0.02 12 <0.4 1.1 0.80 0.34 0.19 0.03 0.13 Hexachlorobenzene 0.13 0.12 0.09 0.20 0.42 0.34 0.63 0.07 0.13 0.17 Heptachlor Epoxide 0.04 0.01 0.06 0.04 0.07 0.05 0.13 0.07 0.03 0.03

Page 48
Upper Upper Yellow- Garrison Lower Middle Dry Pine Touchet Lower Chemical Mill Cr. Walla Walla hawk Cr. Creek Mill Cr. Walla Walla Creek Creek River Walla Walla
Toxaphene <0.3 <0.3 ~0.57 <0.3 <0.3 ~0.28 ~0.30 ~5.4 <0.3 ~1.7 Total PCBs 0.11* 0.18* 0.32 0.77 0.54 0.35 0.14* <0.6 0.14* 0.17*
February - March 2003 Sample No. 157510 157509 157507 157504 157505 157508 157503 157502 157501 157500 Total DDT 0.39 0.37 4.6 0.93 1.9 3.3 0.6 1.6 0.40 1.4 Total Chlordane 0.06 <0.05 1.7 0.73 0.32 0.81 0.07 0.30 0.02 0.16 Dieldrin 0.18 <0.04 0.30 <0.4 0.55 0.46 0.32 0.84 0.06 0.21 Hexachlorobenzene 0.10 0.05 0.56 0.46 0.49 0.52 0.62 0.57 0.26 0.34 Heptachlor Epoxide 0.01 <0.02 0.06 0.04 0.03 0.07 0.09 0.38 0.03 0.07 Toxaphene <0.3 <0.3 ~1.6 <0.3 <0.3 ~0.45 ~0.45 ~3.4 <0.3 ~1.9 Total PCBs 0.13* 0.17* <0.5 1.0 0.84 0.67 0.18* <0.8 0.09* <0.6 *Laboratory contamination may have contributed to this result

Page 49
Table 14. Annual Average Pesticide/PCB Concentrations Measured Using SPMDs in the Walla Walla Drainage During 2002-2003 [ng/L dissolved; parts per trillion].
Upper Upper Yellow- Garrison Lower Middle Dry Pine Touchet Lower Chemical Mill Cr. Walla Walla hawk Cr. Creek Mill Cr. Walla Walla Creek Creek River Walla Walla
Total DDT 0.31 0.56 3.7 1.9 1.4 2.4 0.95 2.0 0.42 1.3 Total Chlordane 0.25 0.36 2.7 2.5 1.1 1.0 1.0 0.73 0.18 0.65 Dieldrin 0.18 0.07 3.8 0.57 0.92 0.75 1.0 0.50 0.05 0.24 Hexachlorobenzene 0.12 0.13 0.34 0.49 0.44 0.44 1.5 0.44 0.32 0.36 Heptachlor Epoxide 0.04 0.04 0.10 0.09 0.08 0.11 0.58 0.35 0.07 0.1 Toxaphene <0.3 <0.3 ~0.70 ~0.68 ~0.37 ~0.48 ~0.39 ~13 ~0.39 ~3.2 Total PCBs 0.12* 0.18* 0.86 3.6 0.69 0.61 0.32* nd 0.18* 0.42 Note: Detection limit used to calculate averages, except total PCB averages are measured values only. *Laboratory contamination may have contributed to this result. nd = not detected
Page 50
In these and subsequent tables and figures, t-DDT (total DDT) is the sum of 4,4’-DDT, 4,4’-DDE, and 4,4’-DDD. T-chlordane is the sum of cis and trans chlordane, cis and trans nonachlor, and oxychlordane. T-PCBs is the sum of detected aroclor-equivalents. Heptachlor and 2,4’ isomers of DDT, DDE, and DDD were analyzed for this study but rarely detected or present at low concentrations; these data are in Appendix D. Pesticide concentrations in the Walla Walla drainage generally decreased following the order t-DDT > t-chlordane > dieldrin >hexachlorobenzene > heptachlor epoxide. Toxaphene and PCBs were quantified less consistently than these other compounds, and concentrations were more variable. Upper Mill Creek and the upper Walla Walla River at the state line had the lowest concentrations of both pesticides and PCBs. The Touchet River also had a consistently low level of contamination relative to the Walla Walla River and other tributaries. On average, the highest t-DDT, t-chlordane, and dieldrin concentrations were found in Yellowhawk Creek, 3.7, 2.7, and 3.8 ng/L, respectively. Maximum t-DDT and dieldrin concentrations of 6.5 and 12 ng/L were recorded here. The maximum t-chlordane concentration however was in Garrison Creek at 6.4 ng/L. Dry Creek had the highest concentrations of hexachlorobenzene and heptachlor epoxide, averaging 1.5 and 0.6 ng/L. Large amounts of toxaphene were detected in Pine Creek, where concentrations up to approximately 40 ng/L were found. Toxaphene had not been reported previously in the Walla Walla drainage and was initially not a target compound for the TMDL. As described elsewhere in this report, the toxaphene concentrations determined from the SPMDs are considered to be rough estimates. Creeks in the urbanized Mill Creek watershed had higher PCB concentrations than those that drained farming areas. The maximum t-PCB concentrations, 0.77 – 9.2 ng/L, were measured in Garrison Creek. Lower Mill Creek and Yellowhawk Creek had the second highest PCB levels, 0.54 – 1.1 ng/L, for the two monitoring periods where PCBs were detected in these streams. PCBs could not be quantified in a number of samples due to interferences. Table 15 has a ranked list of the mainstem sampling sites and tributaries ordered from highest to lowest annual average concentrations of pesticides and PCBs.

Page 51
Table 15. SPMD Monitoring Sites in the Walla Walla Drainage, Ranked from Highest to Lowest Annual Average Pesticide/PCB Concentrations.
Rank Total DDT Total Chlordane Dieldrin 1 Yellowhawk Creek Yellowhawk Creek Yellowhawk Creek 2 Middle Walla Walla Garrison Creek Dry Creek 3 Pine Creek Lower Mill Creek Lower Mill Creek
4 Garrison Creek Dry Creek Middle Walla Walla 5 Lower Mill Creek Middle Walla Walla Garrison Creek 6 Lower Walla Walla Pine Creek Pine Creek
7 Dry Creek Lower Walla Walla Lower Walla Walla 8 Upper Walla Walla Upper Walla Walla Upper Mill Creek 9 Touchet River Upper Mill Creek Upper Walla Walla
10 Upper Mill Creek Touchet River Touchet River
Rank Hexachlorobenzene Heptachlor Epoxide Toxaphene 1 Dry Creek Dry Creek Pine Creek 2 Garrison Creek Pine Creek Lower Walla Walla 3 Lower Mill Creek Lower Walla Walla Yellowhawk Creek
4 Middle Walla Walla Middle Walla Walla Garrison Creek 5 Pine Creek Yellowhawk Creek Middle Walla Walla 6 Lower Walla Walla Garrison Creek Touchet River
7 Yellowhawk Creek Lower Mill Creek Dry Creek 8 Touchet River Touchet River Lower Mill Creek 9 Upper Walla Walla Upper Mill Creek Upper Mill Creek
10 Upper Mill Creek Upper Walla Walla Upper Walla Walla
Rank Total PCBs 1 Garrison Creek 2 Yellowhawk Creek 3 Lower Mill Creek
4 Middle Walla Walla 5 Lower Walla Walla 6 Dry Creek
7 Upper Walla Walla/
Touchet River 8 Upper Mill Creek 9 Pine Creek*
*elevated detection limits
Page 52
Temporal and Spatial Patterns Figure 11 plots the pesticide and PCB data for the SPMD monitoring sites in the upper, middle, and lower Walla Walla River. For purposes of illustration, the detection limit was used where a pesticide was not detected. Because interferences resulted in variable detection limits for PCBs, non-detects were not plotted for these compounds. The level of pesticide/PCB contamination in the mainstem showed marked seasonal variation. The highest pesticide concentrations always occurred during May-June; the lowest concentrations almost always occurred in November-December. February-March generally saw the second highest levels concentrations. The May-June peak is likely attributable to the beginning of the irrigation season. Runoff from agricultural land is lowest in November-December, thus minimal concentrations are observed. The highest PCB concentrations were similarly recorded in May-June and February-March. Seasonal fluctuations in pesticide/PCB levels were also pronounced in the tributaries (see Table 13). Again, the May-June period generally saw the highest concentrations, although there were exceptions. Pesticides and PCBs increased substantially in the Walla Walla mainstem between the Oregon border and middle river (Detour Road). On average, concentrations increased by factors of 2-to-4 from the upper to middle river, with an 11-fold increase for dieldrin. Except for toxaphene, concentrations generally decreased in the lower Walla Walla River (below Cummins Bridge). The reduced lower river concentrations are largely attributable to dilution by the Touchet River (see following section). The lower river averaged five times the toxaphene concentrations measured upstream. An appreciation for the overall spatial distribution of contaminant sources within the watershed and their effect on the Walla Walla River can be gained from Figures 12 – 18 which plot the annual average pesticide/PCB concentrations (from Table 14).

Page 53
Upper Rive
r
Middle River
Lower Rive
r0
1
2
3
4
5T-
DD
T
Upper Rive
r
Middle River
Lower Rive
r0.0
0.5
1.0
1.5
2.0
2.5
T-C
hlo r
dane
Upper Rive
r
Middle River
Lower Rive
r0
0
1
Die
ldr in
Upper Rive
r
Middle River
Lower Rive
r0.0
0.1
0.2
0.3
0.4
0.5
0.6
0.7
Hex
ach l
orob
enze
n e
Upper Rive
r
Middle River
Lower Rive
r0.0
0.1
0.2
0.3
0.4
Hep
tac h
lor E
poxid
e
Upper Rive
r
Middle River
Lower Rive
r
1
10
Toxa
phen
e
Upper Rive
r
Middle River
Lower Rive
r0.1
1.0
T-PC
B s
Aug-SeptFeb-MarchMay-JuneNov-Dec
Figure 11. Seasonal Patterns of Pesticide/PCB Concentrations in the Mainstem Walla Walla River (ng/L dissolved).

Figure 12. Annual Average Total DDT Concentrations Measured in the Walla Walla Drainage (ng/L dissolved; parts per trillion).
!(
!(
!( !(
!(!(!(
!(
!(
!(
Dry Creek
Touc
het R
iver
Mill CreekMill Creek
Walla Walla RiverYellowhawk C
reek
Garrison Creek
Walla Walla RiverWashington
OregonPine Creek
0 2.5 51.25Miles
2.4 1.4
3.7
0.56
1.9
1.30.95
2.00.42
0.31
±N
Page 54

Figure 13. Annual Average Total Chlordane Concentrations Measured in the Walla Walla Drainage (ng/L dissolved;parts per trillion).
!(!(
!(!(
!(
!(
!(
!(
!(
!(
Dry Creek
Touc
het R
iver
Mill CreekMill Creek
Walla Walla RiverYellowhawk C
reek
Garrison Creek
Walla Walla RiverWashington
OregonPine Creek
0 2.5 51.25Miles
1.0 1.1
2.7
0.36
2.5
0.651.0
0.730.18
0.25
±N
Page 55

Figure 14. Annual Average Dieldrin Concentrations Measured in the Walla Walla Drainage (ng/L dissolved; parts per trillion).
!(
!(!(!(
!(!(
!(
!(
!(
!(
Dry Creek
Touc
het R
iver
Mill CreekMill Creek
Walla Walla RiverYellowhawk C
reek
Garrison Creek
Walla Walla RiverWashington
OregonPine Creek
0 2.5 51.25Miles
0.75 0.92
3.8
0.07
0.57
0.241.0
0.500.05
0.18
±N
Page 56

Figure 15. Annual Average Hexachlorobenzene Concentrations Measured in the Walla Walla Drainage (ng/L dissolved;parts per trillion).
!(
!(
!(!(
!(
!(
!(
!(
!(
!(
Dry Creek
Touc
het R
iver
Mill CreekMill Creek
Walla Walla RiverYellowhawk C
reek
Garrison Creek
Walla Walla RiverWashington
OregonPine Creek
0 2.5 51.25Miles
0.44 0.44
0.34
0.13
0.49
0.361.5
0.440.32
0.12
±N
Page 57

Figure 16. Annual Average Heptachlor Epoxide Concentrations Measured in the Walla Walla Drainage (ng/L dissolved;parts per trillion).
!(
!(
!(!(
!(!(
!(!(
!(
!(
Dry Creek
Touc
het R
iver
Mill CreekMill Creek
Walla Walla RiverYellowhawk C
reek
Garrison Creek
Walla Walla RiverWashington
OregonPine Creek
0 2.5 51.25Miles
0.11 0.08
0.10
0.04
0.09
0.10.58
0.350.07
0.04
±N
Page 58

Figure 17. Annual Average Estimated Toxaphene Concentrations Measured in the Walla Walla Drainage (ng/L dissolved;parts per trillion).
!(
!(
!(!(
!(
!(
!(!(
!(
!(
Dry Creek
Touc
het R
iver
Mill CreekMill Creek
Walla Walla RiverYellowhawk C
reek
Garrison Creek
Walla Walla RiverWashington
OregonPine Creek
0 2.5 51.25Miles
0.48 0.37
0.70
<0.3
0.68
3.20.39
130.39
<0.3
±N
Page 59

Figure 18. Annual Average Total PCB Concentrations Measured in the Walla Walla Drainage (ng/L dissolved; parts per trillion).*Laboratory contamination may have contributed to this result
!( !(
!(!(!(
!(
!(
!(
!(
!(
Dry Creek
Touc
het R
iver
Mill CreekMill Creek
Walla Walla RiverYellowhawk C
reek
Garrison Creek
Walla Walla RiverWashington
OregonPine Creek
0 2.5 51.25Miles
0.61 0.69
0.86
0.18*
3.6
0.420.32*
ND0.18*
0.12*
±N
Page 60

Page 61
Total Pesticide/PCB Concentrations When chlorinated organic compounds are discharged to surface waters, they partition between dissolved and particulate fractions. Total pesticide/PCB concentrations in the Walla Walla drainage were estimated from the dissolved SPMD data using the equation Cw-tot = Cw (1 + TOC (Koc/Mw)) where Cw is the dissolved concentration, Koc is the organic carbon-water equilibrium partition coefficient, and Mw is the mass of water (Meadows et al., 1998). The TOC data are in Appendix F. Koc was calculated from the Kow values used to determine the dissolved concentrations (Appendix C) and Karickhoff’s (1981) approximation Koc = 0.411Kow. Results of these calculations are shown in Table 16. In most cases, the relative amount of dissolved chemical was consistent from one part of the drainage to another. Table 17 summarizes the dissolved percentages for the mainstem Walla Walla River. Calculations indicate that more than 90% of the toxaphene, heptachlor epoxide, and dieldrin would be expected to be in dissolved form. Hexachlorobenzene would be approximately 70% dissolved. T-DDT and t-chlordane split about equally between dissolved and particulate fractions. Most of the PCBs are associated with particulates.

Page 62
Table 16. Estimates of Total Pesticide/PCB Concentrations in the Walla Walla Drainage During 2002-2003 [ng/L; parts per trillion]. Upper Upper Yellow- Garrison Lower Middle Dry Pine Touchet Lower
Chemical Mill Cr. Walla Walla hawk Cr. Creek Mill Cr. Walla Walla Creek Creek River Walla WallaMay - June 2002 Total DDT 0.90 2.3 12 11 3.9 7.6 11 11 1.0 5.6 Total Chlordane 1.3 1.9 4.3 17 4.0 3.3 10 11 0.45 4.1 Dieldrin 0.47 <0.2 2.1 0.73 0.91 1.4 3.2 0.73 0.07 0.45 Hexachlorobenzene 0.20 0.31 0.85 1.7 0.73 0.96 9.2 1.3 0.34 0.91 Heptachlor Epoxide <0.1 <0.1 0.25 0.19 0.06 0.17 2.1 0.63 0.09 0.31 Toxaphene <0.3 <0.3 ~0.31 <.3 ~0.58 ~0.58 ~0.55 ~41 ~0.24 ~8.5 Total PCBs <3 <3 3.8 45 <3 2.5 6.3 <4 0.83 3.3 August - September 2002 Total DDT 0.24 0.65 3.8 6.4 1.5 2.3 0.72 1.8 1.5 1.9 Total Chlordane 0.28 0.52 1.8 8.3 2.0 1.2 0.83 1.1 0.81 0.92 Dieldrin 0.05 0.03 0.66 <0.9 1.2 0.45 0.37 0.28 <0.03 0.20 Hexachlorobenzene 0.12 0.18 0.19 0.84 0.48 0.29 1.9 0.68 1.0 0.57 Heptachlor Epoxide 0.01 0.03 0.06 0.12 0.14 0.14 0.18 0.36 0.12 0.13 Toxaphene <0.3 <0.3 <0.3 ~1.9 <0.3 ~0.63 <0.3 ~1.8 ~0.75 ~1.0 Total PCBs <0.6 <2 3.1 22 <3 <1 <2 <5 1.0 1.1 November - December 2002 Total DDT 0.10 0.31 2.9 1.2 1.4 1.6 0.39 1.2 0.18 0.63 Total Chlordane <0.3 <0.4 9.4 1.2 0.92 0.60 <0.4 <0.6 <0.5 <0.3 Dieldrin 0.04 0.02 13 <0.4 1.1 0.83 0.36 0.21 0.03 0.13 Hexachlorobenzene 0.18 0.17 0.13 0.45 0.68 0.51 1.1 0.13 0.20 0.27 Heptachlor Epoxide 0.04 0.01 0.06 0.04 0.07 0.05 0.14 0.07 0.03 0.04 Toxaphene <0.3 <0.3 ~0.58 <0.3 <0.3 ~0.29 ~0.31 ~5.6 <0.3 ~1.7 Total PCBs 0.34* 0.50* 1.1 5.7 2.2 1.2 0.66* <3 0.52* 0.70*

Page 63
Upper Upper Yellow- Garrison Lower Middle Dry Pine Touchet Lower Chemical Mill Cr. Walla Walla hawk Cr. Creek Mill Cr. Walla Walla Creek Creek River Walla Walla
February - March 2003 Total DDT 0.58 0.65 10 1.9 3.3 6.3 1.3 3.7 0.89 2.7 Total Chlordane 0.27 <0.2 3.5 1.6 0.78 1.6 0.17 0.74 0.16 0.35 Dieldrin 0.18 <0.04 0.32 <0.4 0.58 0.48 0.33 0.89 0.06 0.22 Hexachlorobenzene 0.14 0.07 0.94 0.73 0.75 0.78 1.0 1.1 0.43 0.54 Heptachlor Epoxide 0.01 <0.02 0.06 0.04 0.03 0.08 0.10 0.4 0.03 0.07 Toxaphene <0.3 <0.3 ~1.7 <0.3 <0.3 ~0.46 ~0.47 ~3.5 <0.3 ~2.0 Total PCBs 0.43* 0.52* <2 4.1 3.0 2.3 0.74* <4 0.37* <2 *Laboratory contamination may have contributed to this result

Page 64
Table 17. Estimates of the Dissolved Fraction (%) of Pesticides and PCBs in the Mainstem Walla Walla River During 2002-2003.
Chemical Mean Minimum Maximum Toxaphene 98 97 99 Heptachlor Epoxide 97 96 98 Dieldrin 96 95 98 Hexachlorobenzene 68 60 80 Total DDT 54 44 65 Total Chlordane 51 38 66 Total PCBs 27 24 33
Similar findings have been reported for other eastern Washington tributaries draining agricultural areas. USGS deployed SPMDs in the Yakima and Wenatchee rivers during 1997 (McCarthy and Gale, 1999). They estimated the dissolved fractions of hexachlorobenzene, DDT compounds, chlordane compounds, and PCB congeners were 63 – 67%, 52 – 66%, 47 – 51%, and <15% of the total, respectively. A higher particulate fraction was estimated for heptachlor epoxide and dieldrin than in the Walla Walla drainage. USGS calculated that 80% of the heptachlor epoxide and 78% of the dieldrin was dissolved. Estimates of the total concentrations were used to simulate the effects of tributary discharges on t-DDT levels in the Walla Walla mainstem, using EPA’s SMPTOX program (http://epa.gov/ceampubl/swater/smptox3/index.htm). For this application, the program was set to calculate water column concentrations through simple dilution, and t-DDT was assumed to act conservatively. The May-June and November-December data were used to represent the periods associated with the highest and lowest impacts on the river. Because of gaps in the flow data, the May-June plot should be considered a semi-quantitative depiction of changes in mainstem concentrations. An average upstream flow of 42 cfs at Peppers Bridge was used, based on Ecology flow monitoring the following spring (http://www.ecy.wa.gov/programs/eap/flow/shu_main.html). Irrigation diversions were not factored in. Results of the t-DDT simulations are shown in Figure 19. For May-June, the main features of note are the large impact of Yellowhawk Creek and the diluting effect of the Touchet River. Garrison and Mill creeks were having a minor influence on the mainstem, while Dry and Pine creeks both cause concentrations to increase. The observed mainstem concentration at Detour Road (+) was higher than can be accounted for by Yellowhawk alone. As described later in this report, grab samples showed the East Little Walla Walla River to be a significant source of DDT compounds to this reach. During November-December, tributaries other than Yellowhawk were having little or no impact on the river, probably reflecting low runoff from fields. Again, the Touchet is seen as a source of dilution water with respect to t-DDT. Observed mainstem concentrations agree fairly closely with simulated concentrations.

Page 65
Other simulations showed a similar picture for t-chlordane and dieldrin. In the case of hexachlorobenzene and heptachlor epoxide, Dry Creek is relatively more important than Yellowhawk Creek. Figure 20 has a May-June plot for heptachlor epoxide. There were too many non-detects to simulate toxaphene or PCB concentrations in the mainstem.

Figure 19. Simulations of Tributary Impacts on t-DDT Concentrations in the Mainstem Walla Walla River (+ are observed mainstem concentrations)
Yel
low
haw
k C
r.
Gar
rison
Cr.
Mill
Cr.
Dry
Cr.
Pine
Cr.
Touc
het R
.
Yel
low
haw
k C
r.
Gar
rison
Cr.
Mill
Cr.
Dry
Cr.
Pine
Cr.
Touc
het R
.
Page 66

Figure 20. Simulation of Tributary Impacts on Heptachlor Epoxide Concentrations in the Mainstem Walla Walla River (+ are observed mainstem concentrations)
Yel
low
haw
k C
r.
Gar
rison
Cr.
Mill
Cr.
Dry
Cr.
Pine
Cr.
Touc
het R
.
Page 67

Page 68
Comparison to Water Quality Standards Figure 21 compares the pesticide and PCB concentrations measured in the Walla Walla drainage with the Washington State human health criteria (see Table 5). The criteria are for a one in one million increased lifetime cancer risk from fish consumption, as previously described. The figure shows the ratio of the dissolved water column concentration divided by the criterion. A value greater than 1.0 exceeds the state standard. For pesticides the detection limit was used to calculate the ratio for non-detects. PCB non-detects and flagged PCB data were not plotted. The dissolved data were used in this comparison because it more accurately reflects the chemical fraction available for uptake by fish (EPA, 2000a). The 0.59 ng/L criterion for DDT and DDE was applied to t-DDT. As seen in Figure 21, the human health criteria for t-DDT and dieldrin were chronically exceeded in the Walla Walla drainage. The exceedances primarily occurred in and downstream of Yellowhawk Creek. Toxaphene commonly exceeded criteria in Pine Creek and downstream in the lower Walla Walla River. T-chlordane exceedances were scattered throughout the drainage. There were relatively few exceedances for heptachlor epoxide and fewer yet for hexachlorobenzene, these being mostly restricted to lower parts of the drainage. PCB detection limits in some samples were not low enough to compare to the human health criterion. However, in every instance where PCB concentrations could be unambiguously quantified the criterion was exceeded. Water quality criteria for protection of aquatic life are less restrictive than human health criteria (see Table 5). Exceedances of the state aquatic life criteria for chronic exposure were primarily limited to t-DDT, with toxaphene also exceeding criteria in Pine Creek and once in the lower Walla Walla River (Figure 22). Dieldrin exceeded aquatic life criteria once each in Yellowhawk Creek and Dry Creek. Except for Yellowhawk Creek, the exceedances were almost entirely restricted to the May-June period (see Table 13). Aquatic life criteria for acute exposure to these pesticides range from 520 ng/L for heptachlor epoxide (from EPA, 2002a) to 2,500 ng/L for dieldrin, and were never exceeded. Neither the chronic nor acute aquatic life standards for PCBs – 14 and 2,000 ng/L – were exceeded. There are currently no Washington State or EPA aquatic life criteria for hexachlorobenzene. In the past, EPA (1993) proposed chronic and acute criteria of 3,680 ng/L and 6,000 ng/L. Various other aquatic life criteria have been suggested, including as low as 6.5 ng/L (Environment Ontario, 1985). None of these hexachlorobenzene criteria were exceeded in the Walla Walla drainage.

Upper Mill
Upper Walla
Yellowhaw
k
Garrison
Lower Mill
Mid Walla Pine Dry
Touchet
Lower Walla
0
2
4
6
8
10
12
T-D
DT
Upper Mill
Upper Walla
Yellowhaw
k
Garrison
Lower Mill
Mid Walla Pine Dry
Touchet
Lower Walla
0
1
10
Die
ldrin
Upper Mill
Upper Walla
Yellowhaw
k
Garrison
Lower Mill
Mid Walla Pine Dry
Touchet
Lower Walla
0
1
10
Toxa
phe n
e
Upper Mill
Upper Walla
Yellowhaw
k
Garrison
Lower Mill
Mid Walla Pine Dry
Touchet
Lower Walla
0
1
10
T-PC
Bs
Figure 21. Exceedances of Human Health Water Quality Criteria in the Walla Walla Drainage (ratios > 1 exceed criteria)
Page 69

Upper Mill
Upper Walla
Yellowhaw
k
Garrison
Lower Mill
Mid Walla Pine Dry
Touchet
Lower Walla
0
2
4
6
8
10
12
T-C
hlor
dan e
Upper Mill
Upper Walla
Yellowhaw
k
Garrison
Lower Mill
Mid Walla Pine Dry
Touchet
Lower Walla
0
1
2
3
4
5
Hex
achl
orob
enze
n e
Upper Mill
Upper Walla
Yellowhaw
k
Garrison
Lower Mill
Mid Walla Pine Dry
Touchet
Lower Walla
0123456789
10
Hep
tach
lor E
poxi
de
Figure 21 (continued).
Page 70

Upper Mill
Upper Walla
Yellowhaw
k
Garrison
Lower Mill
Mid Walla Pine Dry
Touchet
Lower Walla
01234567
T-D
DT
Upper Mill
Upper Walla
Yellowhaw
k
Garrison
Lower Mill
Mid Walla Pine Dry
Touchet
Lower Walla
01234567
Die
ldrin
Upper Mill
Upper Walla
Yellowhaw
k
Garrison
Lower Mill
Mid Walla Pine Dry
Touchet
Lower Walla
0
1
10
Toxa
p hen
e
Upper Mill
Upper Walla
Yellowhaw
k
Garrison
Lower Mill
Mid Walla Pine Dry
Touchet
Lower Walla
0.00.10.20.30.40.50.60.7
T-PC
Bs
Figure 22. Exceedances of Aquatic Life Criteria in the Walla Walla Drainage (ratios > 1 exceed criteria)
Page 71

Upper Mill
Upper Walla
Yellowhaw
k
Garrison
Lower Mill
Mid Walla Pine Dry
Touchet
Lower Walla
0.0
0.5
1.0
1.5
T-C
hlor
dane
Upper Mill
Upper Walla
Yellowhaw
k
Garrison
Lower Mill
Mid Walla Pine Dry
Touchet
Lower Walla
0.0
0.1
0.2
0.3
0.4
0.5
0.6
Hep
tach
lor E
poxi
de
Figure 22 (continued)
Page 72

Page 73
Fish Tissue Pesticide/PCB Concentrations Results from analyzing chlorinated pesticides and PCBs in fillets from Walla Walla River fish are summarized in Table 18. As noted previously, this analysis was limited to resident mainstem species, with upper river fish being analyzed separately from lower river fish. Data on pesticides, PCBs, and other contaminants in migratory fish species that inhabit the Walla Walla River can be found in EPA (2002b) or online at http://yosemite.epa.gov/r10/oea.nsf . Over 120 fish were analyzed for the TMDL study. Each sample typically consisted of pooled tissues from five fish. Limited numbers of catfish and upper river bass and carp were obtained. Because the fish collection effort was fairly intensive, the number of specimens analyzed is considered to reflect the relative abundance of each species at the time the field work was conducted. DDT compounds were present in the highest concentrations in the fillets, followed by PCBs/toxaphene, t-chlordane, dieldrin, hexachlorobenzene, and heptachlor epoxide, in that order. The relative amounts of these compounds generally mirrored what was found in the mainstem water column. The similar chemical profile among species suggests a common exposure history indicative of water quality conditions in the Walla Walla River. Average concentrations of t-DDT ranged from 30 – 657 ug/Kg. T-PCB and toxaphene concentrations averaged 8.9 – 238 ug/Kg and 16 – 56 ug/Kg, respectively. For most species, the average t-DDT concentrations were 105 ug/Kg or less, and the average PCB concentrations 48 ug/Kg or less. Total chlordane concentrations averaged 2.7 – 19 ug/Kg. Dieldrin, hexachlorobenzene, and heptachlor epoxide concentrations were 2.1ug/Kg or less. The highest pesticide/PCB concentrations were in carp, while the lowest were in smallmouth bass. Figure 23 plots the data for each composite fillet sample6. There is qualitative evidence of differences between contaminant levels in upper vs. lower river fish. Bridgelip suckers and northern pike minnow were the only species where large numbers were obtained from both areas. For these species, upper river samples generally had higher concentrations of t-DDT, t-chlordane, dieldrin, and PCBs, but lower concentrations of toxaphene and hexachlorobenzene. These findings are consistent with results from water sampling. Not enough bass or carp were analyzed to draw strong conclusions about upstream/downstream differences. The bass data also suggest generally higher concentrations in the upper river, but the opposite was true of carp. However, only one upper river composite was analyzed for each of these species.
6 In these box-and-whisker plots, the center horizontal line is the median and the edges of the box (hinges) mark the first and third quartiles. The whiskers show the range of values that fall within a 1.5 spread of the hinges. Outside and far outside values are marked as asterisks and circles, respectively.

Page 74
Table 18. Mean Pesticide/PCB Concentrations in Fillets from Walla Walla River Fish Collected during July - September 2002 (ug/Kg wet weight; parts per billion).
Channel Smallmouth Bridgelip Common N. Pike Species Catfish Bass Sucker Carp Minnow
Upper River No. of Individuals 0 2 20 3 20 No. of Composites - - 1 4 1 4 Sample Number 438182 438183-86 438181 438188-91 Mean Age (yr) - - 4 5 11 6 Mean Total Length (mm) - - 320 438 577 372 Mean Weight (gm) - - 543 718 2.397 305 Percent Lipids - - 2.1 2.5 2.0 1.6
Total DDT - - 54 105 46 333 Toxaphene - - 26 16 17 20 Total Chlordane - - 5.5 4.9 5.7 17 Dieldrin - - 0.99 0.70 1.1 1.2 Hexachlorobenzene - - 0.79 0.53 1.1 0.65 Heptachlor Epoxide - - <0.55 <0.51 <0.54 0.56 Total PCBs - - 17 26 35 48 Lower River No. of Individuals 2 20 20 20 10 No. of Composites 1 4 4 4 2 Sample Nos. 438192 438205-08 438193-96 438198-201 438203-04 Mean Age (yr) 11 3 5 12 6 Mean Total Length (mm) 500 273 386 579 256 Mean Weight (gm) 1.101 355 593 2.634 148 Percent Lipids 3.8 0.89 2.2 4.6 1.2
Total DDT 277 30 75 647 59 Toxaphene 58 10 20 56 27 Total Chlordane 9.7 2.7 3.8 19 3.8 Dieldrin 2.1 <0.55 0.59 1.8 <0.55 Hexachlorobenzene 2.2 0.84 1.4 6.6 1.3 Heptachlor Epoxide 0.61 <0.55 <0.55 1.4 <0.55 Total PCBs 56 8.9 14 238 32
The whole fish data are summarized in Table 19. Pesticide and PCB concentrations in whole suckers and pike minnow were typically 2 – 3 times higher than the average concentration found in fillets. For bass, the whole fish sample was 5 – 10 times higher than fillets. This is usually interpreted as reflecting the higher lipid (fat) content in whole fish, chlorinated organic compounds being preferentially soluble in lipid.

BassSucker
Pike Minnow
CarpCatfi
sh0
200
400
600
800
1000
1200T-
DD
T
BassSucker
Pike Minnow
CarpCatfi
sh0
10
20
30
40
50
60
70
Toxa
phen
e
BassSucker
Pike Minnow
CarpCatfi
sh0
10
20
30
40
T-C
hord
ane
BassSucker
Pike Minnow
CarpCatfi
sh0
1
2
3
Diel
drin
BassSucker
Pike Minnow
CarpCatfi
sh0123456789
10
HCB
BassSucker
Pike Minnow
CarpCatfi
sh0.0
0.5
1.0
1.5
2.0
2.5
Hep
tachl
or E
poxi
de
BassSucker
Pike Minnow
CarpCatfi
sh0
100
200
300
400
500
T-PC
Bs
Figure 23. Pesticide/PCB Concentrations in Walla Walla Fish Fillets: Upper vs. Lower River (ug/Kg, wet weight; parts per billion).
kikikik
Upper River
Lower River
Page 75

Page 76
This page is purposely left blank for duplex printing.

Page 77
Table 19. Pesticide/PCB Concentrations in Whole Fish Samples from the Walla Walla River Collected during July - September 2002 (ug/Kg wet weight; parts per billion).
Upper River Lower River Bridgelip N. Pike Bridgelip Smallmouth
Species Sucker Minnow* Sucker Bass* No. of Individuals 5 5 5 5 No. of Composites 1 1 1 1 Sample Number 438187 438210 438197 438209 Mean Age (yr) 5 7 4 3 Mean Total Length (mm) 459 334 404 335 Mean Weight (gm) 718 305 537 490 Percent Lipids 5.5 4.5 4.4 5.3 Total DDT 178 779 192 311 Toxaphene 27 36 36 50 Total Chlordane 8.9 41 6.9 13 Dieldrin 1.5 2.0 0.97 1.6 Hexachlorobenzene 1.4 2.4 3.8 5.8 Heptachlor Epoxide <0.54 0.83 0.77 1.6 Total PCBs 30 137 28 89
*whole body concentrations estimated from separate analysis of carcass and fillets Comparison to 303(d) Criteria The 303(d) listings for the Walla Walla River are based on fish tissue data that are more than 10 years old (1992-93). Figure 24 compares the newer 2002 data with the human health criteria used for listing. In this figure, the upper and lower river data have been combined. The majority of samples from the 2002 collection continue to substantially exceed 303(d) criteria for t-DDT, dieldrin, and PCBs. Toxaphene also greatly exceeds criteria. Toxaphene had not been detected previously in Walla Walla fish because the analyses were not optimized for this pesticide. Three out of five species – pike minnow, carp, and catfish – commonly exceeded for t-chlordane. No samples exceeded for hexachlorobenzene, and only two carp samples exceed for heptachlor epoxide. The fish and water data concur in showing that the Walla Walla River no longer exceeds criteria for hexachlorobenzene. While the fish tissue data provide only marginal evidence in support of a heptachlor epoxide listing, the water data show a number of exceedances. The fish tissue data may indicate some improvement in water quality since 1992-93 or simply reflect the larger, more representative sample size in 2002.

Page 78
BassSucker
Pike Minnow
CarpCatfi
sh0
200
400
600
800
1000
1200
T-D
DT
BassSucker
Pike Minnow
CarpCatfi
sh0
10
20
30
40
50
60
70
Toxa
phe n
e
BassSucker
Pike Minnow
CarpCatfi
sh0
10
20
30
40
T-Ch
o rda
ne
BassSucker
Pike Minnow
CarpCatfi
sh0
1
2
3
Diel
drin
BassSucker
Pike Minnow
CarpCatfi
sh0123456789
10
Hex
achl
orbe
nzen
e
BassSucker
Pike Minnow
CarpCatfi
sh0.0
0.5
1.0
1.5
2.0
2.5
Hep
tach
lor E
poxi
de
BassSucker
Pike Minnow
CarpCatfi
sh0
100
200
300
400
500
T-PC
Bs
Figure 24. Pesticide/PCB Concentrations in Fillets from Walla Walla River Fish Compared to 303(d) Listing Criteria (ug/Kg wet weight: parts per billion; pooled upper and lower river data).
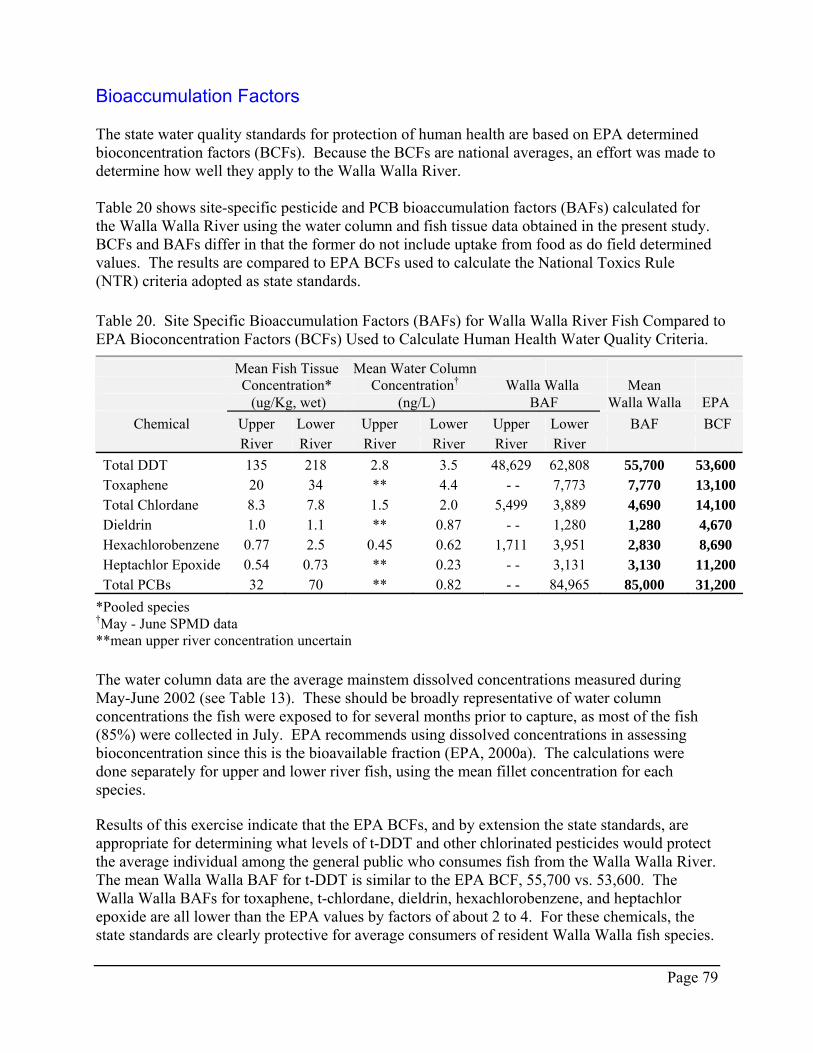
Page 79
Bioaccumulation Factors The state water quality standards for protection of human health are based on EPA determined bioconcentration factors (BCFs). Because the BCFs are national averages, an effort was made to determine how well they apply to the Walla Walla River. Table 20 shows site-specific pesticide and PCB bioaccumulation factors (BAFs) calculated for the Walla Walla River using the water column and fish tissue data obtained in the present study. BCFs and BAFs differ in that the former do not include uptake from food as do field determined values. The results are compared to EPA BCFs used to calculate the National Toxics Rule (NTR) criteria adopted as state standards. Table 20. Site Specific Bioaccumulation Factors (BAFs) for Walla Walla River Fish Compared to EPA Bioconcentration Factors (BCFs) Used to Calculate Human Health Water Quality Criteria.
Mean Fish Tissue Mean Water Column Concentration* Concentration† Walla Walla Mean (ug/Kg, wet) (ng/L) BAF Walla Walla EPA
Chemical Upper Lower Upper Lower Upper Lower BAF BCF River River River River River River
Total DDT 135 218 2.8 3.5 48,629 62,808 55,700 53,600Toxaphene 20 34 ** 4.4 - - 7,773 7,770 13,100Total Chlordane 8.3 7.8 1.5 2.0 5,499 3,889 4,690 14,100Dieldrin 1.0 1.1 ** 0.87 - - 1,280 1,280 4,670 Hexachlorobenzene 0.77 2.5 0.45 0.62 1,711 3,951 2,830 8,690 Heptachlor Epoxide 0.54 0.73 ** 0.23 - - 3,131 3,130 11,200Total PCBs 32 70 ** 0.82 - - 84,965 85,000 31,200
*Pooled species †May - June SPMD data **mean upper river concentration uncertain The water column data are the average mainstem dissolved concentrations measured during May-June 2002 (see Table 13). These should be broadly representative of water column concentrations the fish were exposed to for several months prior to capture, as most of the fish (85%) were collected in July. EPA recommends using dissolved concentrations in assessing bioconcentration since this is the bioavailable fraction (EPA, 2000a). The calculations were done separately for upper and lower river fish, using the mean fillet concentration for each species. Results of this exercise indicate that the EPA BCFs, and by extension the state standards, are appropriate for determining what levels of t-DDT and other chlorinated pesticides would protect the average individual among the general public who consumes fish from the Walla Walla River. The mean Walla Walla BAF for t-DDT is similar to the EPA BCF, 55,700 vs. 53,600. The Walla Walla BAFs for toxaphene, t-chlordane, dieldrin, hexachlorobenzene, and heptachlor epoxide are all lower than the EPA values by factors of about 2 to 4. For these chemicals, the state standards are clearly protective for average consumers of resident Walla Walla fish species.

Page 80
EPA’s BCF for PCBs appears to be too low for the Walla Walla River. Present study results suggest it should be on the order of 85,000 as opposed to 31,200. For superlipophilic chemicals like PCBs, uptake through food has been shown to be a more important pathway than uptake from water (Mackay and Fraser, 2000). As a result, BCFs typically underestimate PCB bioaccumulation (EPA, 2002). It may be appropriate to adjust the PCB human health water quality criterion downward when applied to the Walla Walla River.
WWTP Effluents Results from monitoring chlorinated pesticides and PCBs in final effluents from the Walla Walla WWTP and College Place WWTP are shown in Tables 21 and 22. Data on flow and conventional water quality parameters are in Appendix G. The pesticide extract from the February 2003 College Place samples was lost in a laboratory accident. This effluent was re-sampled for pesticides the following month. Table 21. Pesticides and PCBs Detected in Walla Walla WWTP Final Effluent (ng/L; parts per trillion).
Date: 5/28-30/02 9/10-11/02 12/2-3/02 2/24-25/03 Sample No: 228030,-32,-34 378881 498958 098997
4,4'-DDT <0.091 <0.067 <0.11 <0.093 4,4'-DDE 0.090 0.080 <0.069 0.073 4,4'-DDD <0.065 <0.067 <0.069 <0.066 Dieldrin <1.6 <0.73 <0.079 0.25 Heptachlor <0.065 <0.067 <0.069 <0.066 Heptachlor epoxide <1.6 <0.77 <0.069 <0.066 Hexachlorobenzene <0.094 0.33 <0.085 <0.096 cis-Chlordane 0.18 0.19 0.12 0.12 trans-Chlordane 0.13 0.16 0.10 0.09 cis-Nonachlor <0.065 <0.067 <0.069 <0.066 trans-Nonachlor <0.065 0.087 <0.069 <0.066 Oxychlordane <0.065 <0.067 <0.069 <0.066 Total PCBs 0.88 0.65 0.75 0.87

Page 81
Table 22. Pesticides and PCBs Detected in College Place WWTP Final Effluent (ng/L; parts per trillion).
Date: 5/28-29/02 9/10-11/02 12/2-3/02 2/24-25/03 3/24-25/03 Sample No: 228031,-33 378882 498959 098998 138164
4,4'-DDT <0.092 <0.069 <0.073 la <0.093 4,4'-DDE 0.10 0.10 <0.067 la <0.066 4,4'-DDD <0.066 <0.069 <0.067 la <0.066 Dieldrin <1.6 <0.22 <0.54 la 0.21 Heptachlor <0.066 <0.069 <0.067 la <0.066 Heptachlor epoxide <1.6 <0.14 <0.067 la <0.066 Hexachlorobenzene <0.093 <0.069 <0.17 la 0.15 cis-Chlordane 0.098 0.086 <0.067 la <0.066 trans-Chlordane 0.071 <0.069 0.073 la <0.066 cis-Nonachlor <0.066 <0.069 <0.067 la <0.066 trans-Nonachlor <0.066 <0.069 <0.067 la <0.066 Oxychlordane <0.066 <0.069 <0.067 la <0.066 Total PCBs 2.5 0.92 1.3 0.53 naf la = sample lost in lab accident naf = not analyzed for
The only compounds consistently detected in WWTP effluents were DDE, chlordane, and PCBs. Concentrations ranged from <0.066 – 0.11 ng/L for DDE, <0.066 – 0.20 ng/L for chlordane, and 0.53 – 2.5 ng/L for t-PCBs. Dieldrin was also detected in one or two samples from each plant at concentrations of 0.21 – 0.25 ng/L. The higher PCB and chlordane levels were found in College Place effluent. Only PCBs were detected consistently in both plants, and the levels were not significantly different (Mann-Whitney test, p=0.25). DDE and dieldrin concentrations were similar in each effluent. Without further dilution, the average t-PCB concentration in the College Place and Walla Walla effluents would exceed the human health criterion of 0.17 ng/L by factors of approximately 7 and 5, respectively. The reporting limit in the dieldrin analysis exceeded the dieldrin criterion. In the few instances where dieldrin was detectable, the 0.14 ng/L criterion was slightly exceeded at both plants, but by less than a factor of 2. Effluent concentrations of DDE, chlordane, and the other pesticides analyzed were always within human health criteria.

Page 82
This page is purposely left blank for duplex printing.

Page 83
Numerical Water Quality Targets
DDT:TSS Correlation Historical application of chlorinated pesticides to soils and crops is the primary source of river and stream contamination in agricultural areas like the Walla Walla basin (e.g., Risebrough and Jarman, 1984; Munn and Gruber, 1997). This reservoir of contamination is supplemented by current-day atmospheric deposition to agricultural and non-agricultural land (e.g., Wania and Mackay, 1996). Once applied or air deposited, chlorinated pesticides bind to soil particles. The key to meeting pesticide standards in the Walla Walla River and its tributaries is to reduce the amount of soil entering these waterbodies and maintain low TSS levels in the water column. In this TMDL evaluation, TSS and turbidity are proposed as water quality indicators and surrogate numerical targets for chlorinated pesticides in the Walla Walla River. Setting water quality targets based on TSS and turbidity has the advantage of translating more directly into land use practices and being easier and less expensive to monitor than trace chemical concentrations. Additionally, TSS and turbidity levels in rivers and streams have a direct and quantifiable effect on the health of fish and other aquatic organisms as well as aesthetic values. As noted previously, a similar approach has been used successfully in a pesticide TMDL for the lower Yakima River (Joy and Patterson, 1997). In the present study, pesticide, TSS, and turbidity data were obtained on 88 sets of whole water samples from the Walla Walla drainage. These data were examined to determine how pesticide concentrations vary with TSS and turbidity. The analysis focused on 4,4’-DDE since this was the compound most consistently quantified in the samples. The data have been tabulated in Appendix H. There was a strong positive correlation between DDE and TSS concentrations in all parts of the watershed. Correlation coefficients (R) ranged from 0.6 – 1.0 depending on the waterbody.7 An equation relating TSS to DDE concentrations was developed for the mainstem Walla Walla River using SYSTAT 6.0 (Figure 25). All 22 data pairs were analyzed. Examination of the data using a probability plot showed a log-normal distribution. The data were therefore log transformed and then fitted to the model: log TSS = βo + β1logDDE + ε. The resulting best-fit equation was TSS = 263 x DDE 1.8, with an R2 of 0.73. Solving for the DDE human health criterion of 0.59 ng/L gives a TSS value of 103 mg/L or, rounding to two significant figures, 100 mg/L (parts per million). Therefore, when TSS concentrations are below 100 mg/L in the Walla Walla River, DDE concentrations would be expected to meet the water quality criterion of 0.59 ng/L. 7 The correlation coefficient (R) represents the linear relationship between two variables and ranges from -1 to +1. A value of -1 represents a perfect negative correlation while a value of +1 represents a perfect positive correlation. If the correlation coefficient is squared, then the resulting value, R2 the coefficient of determination, represents the proportion of common variation in the two variables (i.e., the strength or magnitude of the relationship).

Page 84
y = 263x1.8
R2 = 0.73
1
10
100
1000
0.01 0.1 1 10
DDE (ng/L)
TSS
(mg/
L)
Figure 25. Relationship Between TSS and 4,4'-DDE in the Mainstem Walla Walla River. A similar exercise using the combined data from the entire project yielded a weaker R2 of 0.45 and a TSS target of 45 mg/L. Examination of the data in Appendix H shows a target of 45 mg/L TSS would not predict DDE violations. An alternate approach to linear regression was used to confirm that a DDE-based TSS target of 100 mg/L is accurate and reasonable to apply to the watershed as a whole. A quantile plot was made of all the TSS data (Figure 26). TSS samples associated with an exceedance of the DDE criterion were plotted separately from those TSS samples where DDE did not exceed. This figure shows two tributaries – the East Little Walla Walla River and Yellowhawk Creek – where DDE levels are inconsistent with a TSS target of 100 mg/L. All four samples from the East Little Walla Walla River exceeded the DDE criterion at TSS concentrations between 6 - 38 mg/L, much lower than in other samples. DDT compounds, dieldrin, and heptachlor epoxide were all unusually high in this tributary, based on grab samples (Appendix D). DDE concentrations in Yellowhawk Creek were at or close to the criterion at TSS concentrations of 18 – 29 mg/L (0.49 – 0.59 ng/L DDE), and one sample exceeded (0.85 ng/L) at a low TSS concentration of 7 mg/L. Yellowhawk also had the highest t-DDT, t-chlordane, and dieldrin concentrations in the SPMD samples. These results suggest DDT and other chlorinated pesticides were applied in these two watersheds at higher rates or for a longer period of time than elsewhere in the drainage. To more clearly illustrate the 100 mg/L breakpoint for TSS-associated DDE, the data were re-plotted without the East Little Walla Walla and Yellowhawk data (Figure 27). This figure shows that for all other parts of the Walla Walla drainage DDE concentrations begin to exceed the criterion at about 80 mg/L and consistently exceed once TSS levels surpass 100 mg/L. These

1
10
100
1000
TSS
(mg/
L)
0.0 0.1 0.2 0.3 0.4 0.5 0.6 0.7 0.8 0.9 1.0Fraction of Samples
DDE criterion exceededDDE criterion not exceeded
Figure 26. Quantile Plot of TSS Data for the Walla Walla Drainage Showing Instances Where 4,4’-DDE Concentrations Exceeded the Human Health Criterion (all data)
1
10
100
1000
TSS
(mg/
L)
0.0 0.1 0.2 0.3 0.4 0.5 0.6 0.7 0.8 0.9 1.0Fraction of Samples
DDE criterion exceededDDE criterion not exceeded
Figure 27. Quantile Plot of TSS Data for the Walla Walla Drainage Showing Instances Where 4,4’-DDE Concentrations Exceeded the Human Health Criterion (East Little Walla Walla River and Yellowhawk Creek data excluded)
E. Little Walla Walla R. & Yellowhawk Cr.
DDE-based target
DDE-based target
Page 85
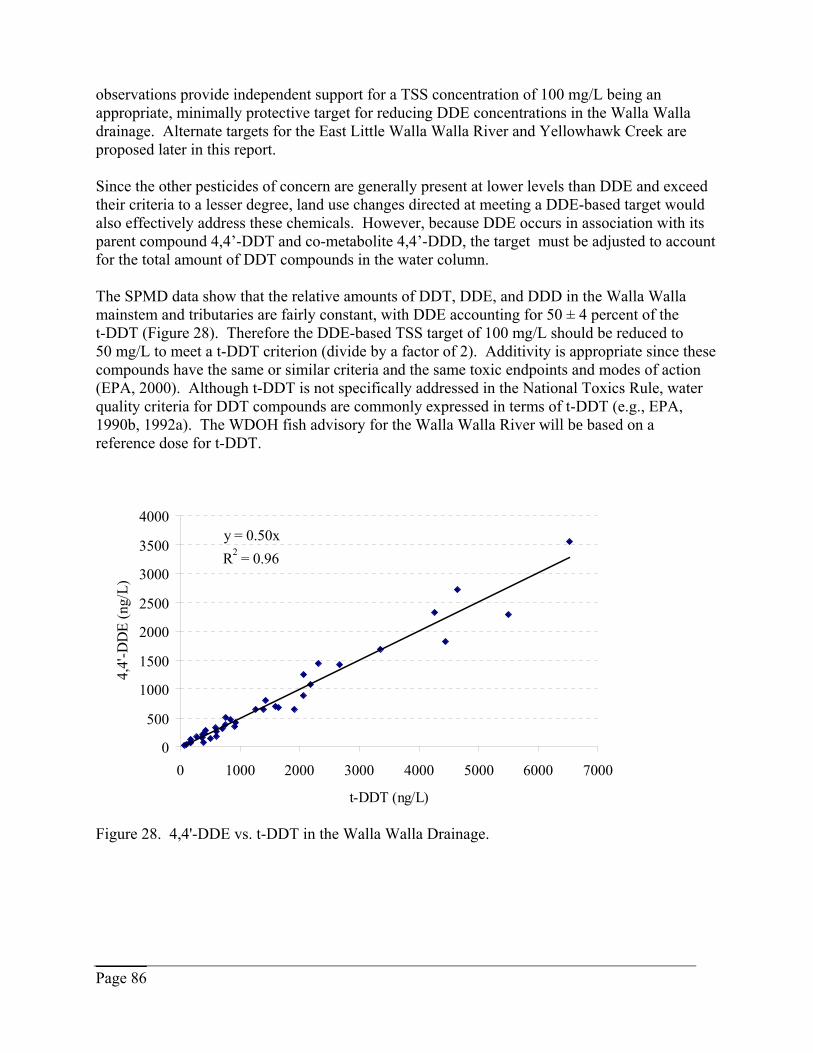
Page 86
observations provide independent support for a TSS concentration of 100 mg/L being an appropriate, minimally protective target for reducing DDE concentrations in the Walla Walla drainage. Alternate targets for the East Little Walla Walla River and Yellowhawk Creek are proposed later in this report. Since the other pesticides of concern are generally present at lower levels than DDE and exceed their criteria to a lesser degree, land use changes directed at meeting a DDE-based target would also effectively address these chemicals. However, because DDE occurs in association with its parent compound 4,4’-DDT and co-metabolite 4,4’-DDD, the target must be adjusted to account for the total amount of DDT compounds in the water column. The SPMD data show that the relative amounts of DDT, DDE, and DDD in the Walla Walla mainstem and tributaries are fairly constant, with DDE accounting for 50 ± 4 percent of the t-DDT (Figure 28). Therefore the DDE-based TSS target of 100 mg/L should be reduced to 50 mg/L to meet a t-DDT criterion (divide by a factor of 2). Additivity is appropriate since these compounds have the same or similar criteria and the same toxic endpoints and modes of action (EPA, 2000). Although t-DDT is not specifically addressed in the National Toxics Rule, water quality criteria for DDT compounds are commonly expressed in terms of t-DDT (e.g., EPA, 1990b, 1992a). The WDOH fish advisory for the Walla Walla River will be based on a reference dose for t-DDT.
y = 0.50xR2 = 0.96
0
500
1000
1500
2000
2500
3000
3500
4000
0 1000 2000 3000 4000 5000 6000 7000
t-DDT (ng/L)
4,4'
-DD
E (n
g/L)
Figure 28. 4,4'-DDE vs. t-DDT in the Walla Walla Drainage.

Page 87
Fish Consumption Rates Washington State’s human health water quality criteria for DDT compounds and other toxics are based on an average lifetime fish consumption rate of 6.5 grams per day8. More restrictive TSS targets would be needed to protect people who consume Walla Walla fish at higher rates. EPA recently conducted a health risk assessment for people eating fish from the Columbia River basin (EPA, 2002c). The following fish consumption rates were used in that work:
Population Fish Consumption Rate (g/day)
General Public – average consumer 7.5 Tribal Members – average consumer 63 General Public – high consumer 142 Tribal Members – high consumer 389
EPA based their ingestion rates for the general public on a national report of fish consumption (EPA, 2002c). Their national rate for the average consumer, 7.5 grams per day, is similar to the rate behind the current state standards. The tribal consumption rates were for Columbia River Intertribal Fish Commission (CRITFC) member tribes – Umatilla Confederated Tribes, Yakama Nation, Warm Springs Tribe, and Nez Perce Tribe – as determined in a CRITFC (1994) fish consumption study. Using the values EPA selected for tribal members and for high consumption individuals from the general public, the following numerical TSS targets are proposed to protect the various groups of people who consume fish from the Walla Walla River:
TSS Target
Estimated Water Column t-DDT Concentration
Population Subgroup Being Protected
50 mg/L 0.59 ng/L (state standard) General Public – average fish consumer 5 mg/L 0.059 ng/L Tribal Members – average fish consumer 2 mg/L 0.024 ng/L General Public – high fish consumer 1 mg/L 0.012 ng/L Tribal Members – high fish consumer
TSS Effects on Aquatic Life There are no Washington State or EPA numeric water quality criteria for TSS. TSS can, however, be addressed through the state narrative criteria which are used to control toxic, radioactive, and deleterious materials, and to maintain aesthetic values (see Applicable Water Quality Standards). The state water quality criteria for Class A waterbodies like the Walla Walla
8 A water consumption rate of 2 liters per day is also assumed, but has little or no effect on the criteria since the chemical dose comes almost entirely from fish.

Page 88
River state that “Water quality of this class shall meet or exceed the requirements for . . . salmonid (and other fish) migration, rearing, spawning (Class A only for salmonids), and harvesting.” EPA has classified impairment of aquatic habitats or organisms due to TSS as follows (Mills et al., 1985):
TSS Concentration
Aquatic Community Impairment
< 10 mg/L Improbable 10 - 100 mg/L Potential
> 100 mg/L Probable
Similar ranges of TSS concentrations have been suggested by the National Academy of Sciences (1973) and endorsed by the American Fisheries Society (1979):
TSS Concentration
Aquatic Community Protection Level
< 25 mg/L High 25 - 80 mg/L Moderate
80 - 400 mg/L Low > 400 mg/L Very Low
These authorities conclude that TSS levels should be at or below 10 – 25 mg/L for healthy aquatic communities and that levels over 100 mg/L result in impairments. Based on the above recommendations, British Columbia established a water quality guideline that induced TSS should not exceed 10 mg/L when background is equal to or less than 100 mg/L (CCREM, 1987). The upper TSS target of 50 mg/L proposed here for chlorinated pesticides in the Walla Walla drainage would convey a moderate level of habitat protection. The TSS target of 5 mg/L would be highly protective. Figure 29 shows the recent historical record on TSS concentrations in the lower Walla Walla River. These data are for the period 1990 – 2003, as reported for Ecology’s ambient monitoring station 32A070 “Walla Walla River near Touchet” (http://www.ecy.wa.gov/programs/eap/ fw_ riv/rv_main.html). The figure shows where the samples fall in relation to the EPA recommendations for aquatic habitat. The proposed human health targets of 50 mg/L and 5 mg/L TSS are also indicated.

10
100
1000
10000
TSS
( mg/
L)
0.0 0.1 0.2 0.3 0.4 0.5 0.6 0.7 0.8 0.9 1.0Fraction of Samples
probable habitat impairment
50 mg/L human health target
potential habitat impairment
5 mg/L human health target
improbable habitat impairment
Figure 29. Recent Record on TSS Concentrations in the Lower Walla Walla River, Showing Zones of Biological Impairment and Proposed t-DDT-based TSS Targets (1990-2003 data).
Page 89

Page 90
The frequency with which the EPA habitat recommendations and proposed human health targets are exceeded by TSS levels in the mainstem lower Walla Walla River can be summarized as follows:
TSS Concentration
Exceedance Frequency in Lower Walla Walla
River (1990-2003) Implication
5 mg/L 98% Increased health risk for the average fish consumer among tribal members
10 mg/L 90% Potential habitat impairment
50 mg/L 46% Increased health risk for the average fish consumer among the general public
100 mg/L 17% Probable habitat impairment
Table 23 has data on the effects of TSS to some salmonid species of interest in the Walla Walla River. Newcombe and MacDonald (1991) emphasize the importance of looking at both concentration and duration of suspended sediment to assess impacts to salmonids and other species. Although larger juvenile and adult salmon can withstand short periods of high turbidity and TSS, they will avoid chronically turbid water (Lloyd et al., 1987; Bjornn and Reiser, 1991). This may be why sport fishing is affected when TSS concentrations persist at low levels over a period of a week or more. However, events of two to four days may disrupt feeding and territorial behavior of some juvenile salmon (Berg, 1982; Bjornn and Reiser, 1991). According to these data, prolonged exposure to TSS concentrations under 100 mg/L can seriously affect salmonid fry health and growth. Spiny-ray fishes appear to be less sensitive than salmonids, although not as much data was found. Buck (1956) compared fish yields among farm ponds with TSS concentrations of <25 mg/L, 25 – 100 mg/L, and >100 mg/L. After two years, the yields were 181, 105, and 33 Kg/hectare, respectively. The critical concentrations for largemouth bass, bluegill, and sunfish were reported to be around 75 – 100 mg/L. Buck reported that young bass were not found in waters with greater than 84 mg/L TSS. Carp, on the other hand, are relatively insensitive to high TSS levels (Gammon, 1970). Macroinvertebrate populations are depressed under chronically elevated TSS conditions. Some data presented by Newcombe and MacDonald (1991) indicate macroinvertebrates experience lethal conditions or avoid habitat when TSS concentrations are as low as 8 mg/L for 60 days (Table 24).
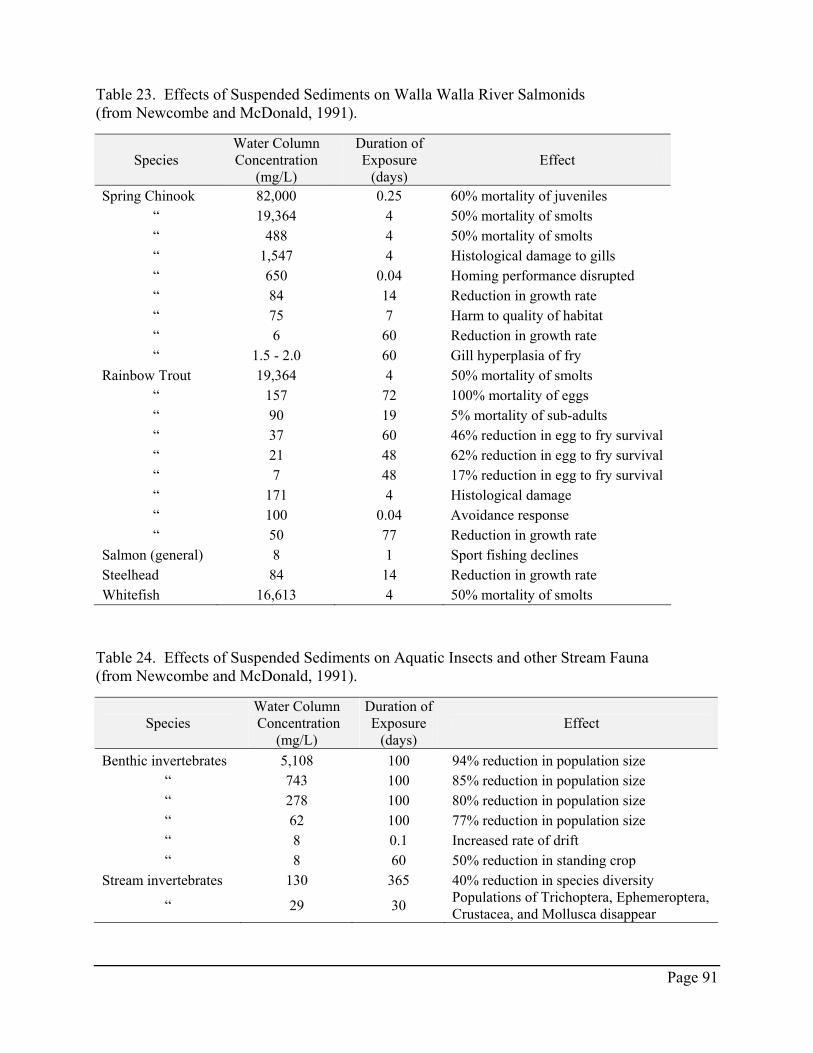
Page 91
Table 23. Effects of Suspended Sediments on Walla Walla River Salmonids (from Newcombe and McDonald, 1991).
Species Water Column Concentration
(mg/L)
Duration of Exposure
(days) Effect
Spring Chinook 82,000 0.25 60% mortality of juveniles “ 19,364 4 50% mortality of smolts “ 488 4 50% mortality of smolts “ 1,547 4 Histological damage to gills “ 650 0.04 Homing performance disrupted “ 84 14 Reduction in growth rate “ 75 7 Harm to quality of habitat “ 6 60 Reduction in growth rate “ 1.5 - 2.0 60 Gill hyperplasia of fry
Rainbow Trout 19,364 4 50% mortality of smolts “ 157 72 100% mortality of eggs “ 90 19 5% mortality of sub-adults “ 37 60 46% reduction in egg to fry survival “ 21 48 62% reduction in egg to fry survival “ 7 48 17% reduction in egg to fry survival “ 171 4 Histological damage “ 100 0.04 Avoidance response “ 50 77 Reduction in growth rate
Salmon (general) 8 1 Sport fishing declines Steelhead 84 14 Reduction in growth rate Whitefish 16,613 4 50% mortality of smolts
Table 24. Effects of Suspended Sediments on Aquatic Insects and other Stream Fauna (from Newcombe and McDonald, 1991).
Species Water Column Concentration
(mg/L)
Duration of Exposure
(days) Effect
Benthic invertebrates 5,108 100 94% reduction in population size “ 743 100 85% reduction in population size “ 278 100 80% reduction in population size “ 62 100 77% reduction in population size “ 8 0.1 Increased rate of drift “ 8 60 50% reduction in standing crop
Stream invertebrates 130 365 40% reduction in species diversity
“ 29 30 Populations of Trichoptera, Ephemeroptera, Crustacea, and Mollusca disappear

Page 92
Lloyd et al. (1987) concluded that a TSS increase of 25 – 100 mg/L will reduce primary productivity in clear water streams by 13 – 50%. A 5 – 25 mg/L increase was associated with a 3 – 13% reduction in primary production.
TSS:Turbidity Correlation Although there are no state standards for TSS, elevated levels of suspended sediment increase turbidity, and turbidity is addressed in the water quality standards. The Washington turbidity criteria are based on the relative change above background. For Class A waters (Chapter 173-201A-030-2 WAC): “Turbidity shall not exceed 5 NTU9 over background turbidity when the background turbidity is 50 NTU or less, or have more than a 10 percent increase in turbidity when the background is more than 50 NTU.” The Washington criteria do not set a maximum acceptable turbidity level based on beneficial use considerations, but they do limit the effect of an identified source on raising the turbidity in the receiving water. Background conditions are further defined in Washington as “. . . the biological, chemical, and physical conditions of the water body, outside the area of influence of the discharge under consideration” except in headwaters where “. . . it may be necessary to use the background conditions of a neighboring or similar watershed . . .” (Chapter 173-201A-020 WAC). There is no long-term record on background turbidities in the Walla Walla River that can be used for a comparison to standards. The historical TSS data however indicate that violations of the Class A turbidity standard are routine in the lower river. The turbidity data obtained for the upper and lower Walla Walla River in the present study are plotted in Figure 30 and compared to the turbidity equivalent to a 5 NTU increase over the upper river. These results show that the river was in violation of 5 NTU allowable increase during most of the winter and spring of 2002-2003 (65% of samples). In light of chronic violations of the turbidity standard and link between turbidity and TSS, a regression equation was developed for these two parameters in the Walla Walla drainage, using the pooled data from Appendix H (Figure 31). The resulting equation was Turbidity = 0.80 x TSS0.87 (R2 = 0.92).
9 nephelometric turbidity units

Page 93
0
10
20
30
40
50
60
70
May-02
May-02
Jun-02
Aug-02
Sep-02
Sep-02
Nov-02
Dec-02
Dec-02
Feb-03
Feb-03
Mar-03
Mar-03
May-03
Turb
idity
(NTU
)Upper River Lower River Allowed Increase
Figure 30. Exceedances of the Class A Turbidity Standard in the Walla Walla River [Walla Walla River @ state line vs. Walla Walla River below Cummins Bridge].
y = 0.80x0.87
R2 = 0.92
0.1
1
10
100
1000
1 10 100 1000
TSS (mg/L)
Turb
idity
(NTU
)
Figure 31. Relationship Between Turbidity and TSS in the Walla Walla Drainage.

Page 94
This equation was used to calculated turbidity levels that correspond to the TSS targets for t-DDT. The results are shown below:
TSS Target
Equivalent Turbidity Target
50 mg/L 24 NTU 5 mg/L 3 NTU 2 mg/L 1 NTU 1 mg/L <1 NTU
The monitoring data show that a water quality target needs to be set for meeting the Class A turbidity standard in the Walla Walla River. The EPA-approved procedure for the lower Yakima River TMDL used the 90th percentile background turbidity as the water quality target (Joy and Patterson, 1997). The 90th percentile is the concentration exceeded by 10% of samples. The 90th percentile value allows for seasonal variability, supports full beneficial use protection under EPA policy (EPA, 1995), and is adequate for background definition under Ecology policy (Ecology, 1994, 1996). Based on the data in Appendix F, the 90th percentile turbidity in the upper Walla Walla River is 10 NTU (15 measurements at state line between 5/02 and 5/03). With the 5 NTU increase over background allowed in the Class A standards, the turbidity target downstream of the state line would be 15 NTU. A turbidity target of 15 NTU equates to 30 mg/L TSS (regression equation). A similar target is obtained by taking the 90th percentile of the more extensive TSS data for this site (29 mg/L, n=31) and applying the regression equation.
East Little Walla Walla River and Yellowhawk Creek As previously shown, more restrictive water quality targets will be needed to meet pesticide standards in the East Little Walla Walla River and Yellowhawk Creek. The same approach can be used that gave the basic 50 mg/L TSS target for other parts of the drainage. A plot of the TSS and DDE data for these two tributaries is shown in Figure 32. The best-fit regression equations were TSS = 20 x DDE1.9 (R2 = 0.88) for the East Little Walla Walla River and TSS = 44 x DDE2.0 (R2 = 0.72) for Yellowhawk Creek. Solving for the 0.59 ng/L DDE criterion and dividing by 2 to account for t-DDT as before, gives TSS concentrations of 4 and 7 mg/L, respectively. These values bracket the 5 mg/L TSS target suggested as a third tier goal for other parts of the drainage. It is therefore proposed that the 5 mg/L: 3 NTU target be applied to the East Little Walla Walla River and Yellowhawk Creek. A 5 mg/L: 3 NTU target for the East Little Walla Walla River and Yellowhawk Creek should protect average fish consumers among the general public. The data collected indicate that TSS/turbidity levels that would meet human health criteria for high fish consumers among the general public and for tribal consumers approach zero for these two waterbodies and so are not proposed as targets at this time. Appropriate targets should ultimately be developed to protect these groups. This effort would best be initiated after some water quality improvements have been realized, at which point the relationship between TSS, turbidity, and trace-level pesticide contamination may be more easily and accurately discerned.

Page 95
A more restrictive target is also needed for Yellowhawk Creek to meet turbidity standards in the Mill Creek drainage. Present survey data show that background turbidity in upper Mill Creek (Seven Mile bridge) ranges from 1 to 5 NTU (n=16). The 90th percentile value is 3 NTU. With the 5 NTU increase allowed in the standards, turbidity in Yellowhawk Creek should be at or below 8 NTU.
y = 20x1.9
R2 = 0.88
y = 44x2.0
R2 = 0.72
1
10
100
1000
0.1 1 10
DDE (ng/L)
TSS
(mg/
L)
E. Little Walla WallaRiverYellowhawk Creek
E. Little Walla WallaRiverYellowhawk Creek
Figure 32. Relationship Between TSS and 4,4'-DDE in Yellowhawk Creek and the East Little Walla Walla River.
Target Summary The following table summarizes the numerical water quality targets recommended for the Walla Walla River drainage; except for the East Little Walla Walla River and Yellowhawk Creek: TSS Target Turbidity Target Effect of Meeting the Target
50 mg/L 24 NTU
• achieves compliance with human health water quality criteria for chlorinated pesticides
• protects average fish consumers among the general public • provides a moderate level of habitat protection
30 mg/L 15 NTU • achieves compliance with the Class A turbidity standard
5 mg/L 3 NTU • protects average tribal fish consumers • provides a high level of habitat protection
2 mg/L 1 NTU • protects high fish consumers among the general public 1 mg/L <1 NTU • protects high fish consumers among tribal members
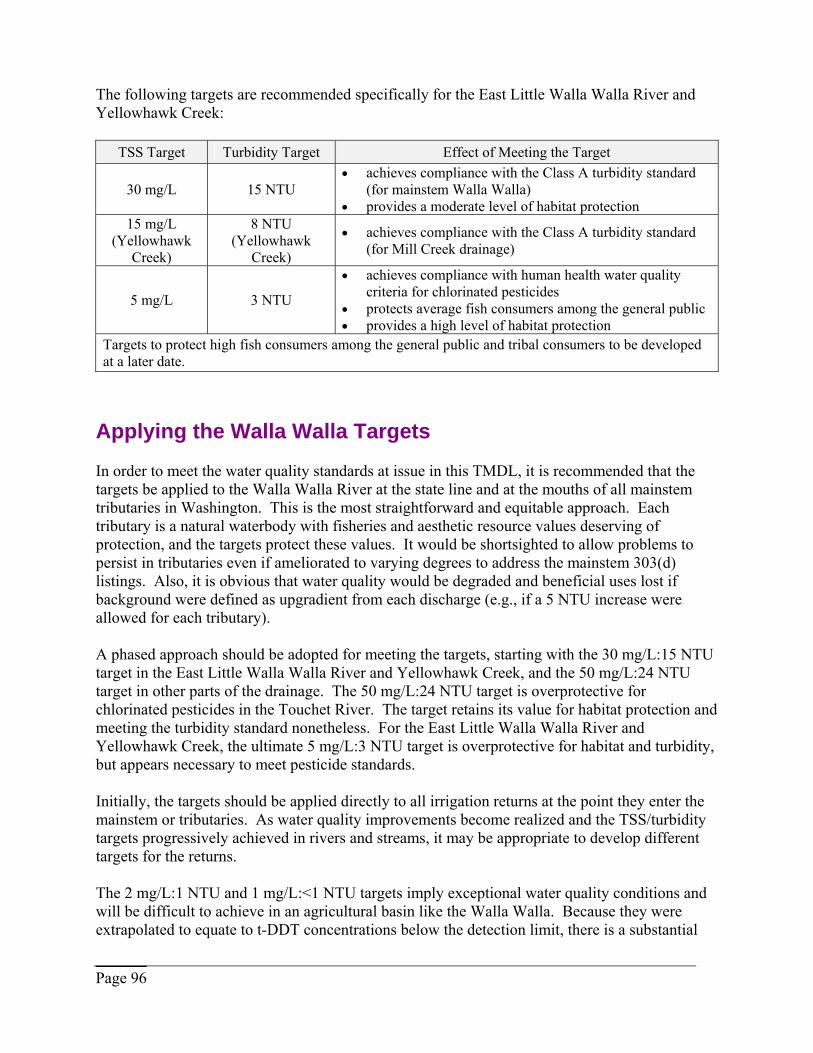
Page 96
The following targets are recommended specifically for the East Little Walla Walla River and Yellowhawk Creek:
TSS Target Turbidity Target Effect of Meeting the Target
30 mg/L 15 NTU • achieves compliance with the Class A turbidity standard
(for mainstem Walla Walla) • provides a moderate level of habitat protection
15 mg/L (Yellowhawk
Creek)
8 NTU (Yellowhawk
Creek)
• achieves compliance with the Class A turbidity standard (for Mill Creek drainage)
5 mg/L 3 NTU
• achieves compliance with human health water quality criteria for chlorinated pesticides
• protects average fish consumers among the general public • provides a high level of habitat protection
Targets to protect high fish consumers among the general public and tribal consumers to be developed at a later date.
Applying the Walla Walla Targets In order to meet the water quality standards at issue in this TMDL, it is recommended that the targets be applied to the Walla Walla River at the state line and at the mouths of all mainstem tributaries in Washington. This is the most straightforward and equitable approach. Each tributary is a natural waterbody with fisheries and aesthetic resource values deserving of protection, and the targets protect these values. It would be shortsighted to allow problems to persist in tributaries even if ameliorated to varying degrees to address the mainstem 303(d) listings. Also, it is obvious that water quality would be degraded and beneficial uses lost if background were defined as upgradient from each discharge (e.g., if a 5 NTU increase were allowed for each tributary). A phased approach should be adopted for meeting the targets, starting with the 30 mg/L:15 NTU target in the East Little Walla Walla River and Yellowhawk Creek, and the 50 mg/L:24 NTU target in other parts of the drainage. The 50 mg/L:24 NTU target is overprotective for chlorinated pesticides in the Touchet River. The target retains its value for habitat protection and meeting the turbidity standard nonetheless. For the East Little Walla Walla River and Yellowhawk Creek, the ultimate 5 mg/L:3 NTU target is overprotective for habitat and turbidity, but appears necessary to meet pesticide standards. Initially, the targets should be applied directly to all irrigation returns at the point they enter the mainstem or tributaries. As water quality improvements become realized and the TSS/turbidity targets progressively achieved in rivers and streams, it may be appropriate to develop different targets for the returns. The 2 mg/L:1 NTU and 1 mg/L:<1 NTU targets imply exceptional water quality conditions and will be difficult to achieve in an agricultural basin like the Walla Walla. Because they were extrapolated to equate to t-DDT concentrations below the detection limit, there is a substantial

Page 97
amount of uncertainty in their accuracy. The appropriateness of these values should be re-assessed once the more easily achieved targets are met. The ultimate goal of any future re-assessment of these targets should be to return the Walla Walla River to conditions consistent with CTUIR treaty rights. In the Yakima River a decrease has been observed in the t-DDT:TSS ratio as sources of erosion are brought under control (Joseph Rinella, USGS, personal communication). This is likely due to DDT degradation over time and that a greater portion of the suspended sediment now comes from non-agricultural sources. A similar phenomenon would be expected to occur in the Walla Walla. If so, the 2 mg/L and 1 mg/L TSS targets may turn out to be unnecessarily low, and the TMDL target for TSS could be increased.
Progress on the Yakima River TMDL The lower Yakima River TMDL set water quality targets for TSS and turbidity similar to those proposed here (Joy and Patterson, 1997). As with the Walla Walla, the concerns were meeting standards for chlorinated pesticides and turbidity, and protecting aquatic habitat. The success achieved in making land use changes to meet the Yakima targets is worth mentioning here. The numerical targets being pursued in the lower Yakima can be summarized as follows:
Year Target Applies To 2003 < 5 NTU increase above background Yakima River mainstem 2003 56 mg/L TSS:25 NTU Mouths of all Yakima tributaries and drains 2008 56 mg/L TSS:25 NTU All points within Yakima tributaries and drains 2013 7 mg/L TSS:4 NTU All Yakima tributaries, drains, and the mainstem
Joy and Patterson (1997) estimated that TSS concentrations in the lower Yakima would need to be reduced between 49 and 53% to meet the 5 NTU goal. In order to achieve the 56 mg/L:25 NTU target for drains and tributaries, they estimated that TSS loading should be reduced 74 – 93% in the major discharges. Reductions of similar scale will be needed in the Walla Walla drainage (see Loading Capacity). Ecology has been conducting effectiveness monitoring for the lower Yakima River TMDL. The results obtained so far indicate the 2003 goals are close to being met. Figures 33 and 34 show some of the data. Anderson (2003) summarized progress in meeting the water quality targets as follows: “Preliminary results show that turbidity has improved in the lower Yakima River considerably. The 90th percentile values, the means, and the number of excursions over 5 NTU between sites have decreased. Also, three out of four of the drains of biggest concern reported 90th percentile turbidities under 25 NTU. Granger Drain was not under 25 NTU, but reported a 90th percentile turbidity of 34. This is nearly an order of magnitude of improvement as the 90th percentile turbidity of Granger Drain was 335 NTU during the 1995 irrigation season.”

Page 98
0
5
10
15
20
25
30
TerraceHeightsBridge
Parker Mabton Euclid Kiona
Turb
idity
(NTU
)
1995 90%tile1995 mean2003 90%tile2003 mean
Figure 33. Turbidity Improvements in the Mainstem Lower Yakima River. [Unpublished data provided by R. Anderson, Ecology Central Regional Office].
0
50
100
150
200
250
300
350
400
Moxee Drain Granger Drain Sulphur Creek Spring Creek
Turb
idity
(NTU
)
19952003
Figure 34. Improvements in 90th Percentile Turbidity in Major Irrigation Returns to the Lower Yakima River [Unpublished data provided by R. Anderson, Ecology Central Regional Office].

Page 99
The Yakima River targets cover approximately the same range of TSS and turbidity values as some of the targets proposed for the Walla Walla River. The Yakima experience suggests that the Walla Walla 50 mg/L:24 NTU and 30 mg/L:15 NTU targets are achievable in the not too distant future.
PCBs Because of the difficulty inherent in measuring low levels of PCBs in surface waters, TSS and turbidity targets could not be derived specifically for PCBs in the Walla Walla River. PCBs also have a strong affinity for soil particles, and atmospheric deposition to soils is and has been an important source. Deposition occurs because PCBs and other persistent organic compounds are volatile enough to evaporate from tropical and subtropical regions and deposit in cooler latitudes (Wania and Mackay, 1996). Meijer et al. (2003), for example, showed that >80% of the soil burden of PCBs in the Northern Hemisphere was derived from atmospheric as opposed to local sources. While air deposition also occurs for chlorinated pesticides, it is a minor source in areas where these chemicals have been applied directly to the land. Meeting the TSS/turbidity targets in the Walla Walla drainage will reduce PCB concentrations in the river and its tributaries. A simple calculation suggests the water quality targets proposed for pesticides would also result in the state human health criterion for PCBs being met: If one assumes PCB concentration is a simple function of TSS levels (Table 17) and taking the average total PCB concentration in the lower river to be 1.5 ng/L (Table 16), then reducing the current median TSS level of 50 mg/L to approximately 5 mg/L would result in water column concentrations in the vicinity of the 0.17 ng/L PCB criterion. Historical uses of PCBs have been associated with urban/industrial applications more than agriculture. SPMD results show there are major PCB sources in urbanized parts of the Walla Walla drainage. It is, therefore, uncertain if the proposed TSS/turbidity targets will have the requisite effectiveness for PCBs in Mill and Garrison creeks. As described at the end of this report, other programs, current and proposed, have the potential to further reduce or eliminate sources of PCBs to the Mill Creek watershed. Periodic monitoring of fish should be conducted in these creeks and in the mainstem Walla Walla to track the anticipated reduction of PCB concentrations in edible fish tissue and assess compliance with standards.

Page 100
This page is purposely left blank for duplex printing.

Page 101
Loading Capacity
Pesticides and PCBs Loading capacity is the maximum amount of a pollutant that can be delivered to a waterbody and still achieve water quality standards. The Walla Walla River is over its loading capacity for chlorinated pesticides, chiefly as a result of excessive erosion of agricultural soils. The river is also over its loading capacity for PCBs from a combination of sources that include but may not be limited to urban/industrial runoff, wastewater treatment plant (WWTP) effluents, soil erosion, and atmospheric deposition. Loading capacity can be calculated by multiplying streamflow by the pollutant water quality standard. EPA recommends using the long-term harmonic mean flow for carcinogens, since the adverse impacts are realized over a lifetime of exposure (EPA, 1991). The harmonic mean is always less than the arithmetic mean and is expressed as Qh = n/∑(1/Qi) where n is the number of recorded flows Qi. Table 25 has estimates of the Walla Walla River’s loading capacity for chlorinated pesticides and PCBs, based on the flow record for the lower river (USGS gage near Touchet, 1951 – 2002). The loading capacity for chlorinated pesticides ranges from 0.012 – 0.070 grams/day. For PCBs the loading capacity is 0.014 grams/day. The previous assessment of bioaccumulation in the Walla Walla River suggests the loading capacity for PCBs may be lower. Table 25. Loading Capacity for Chlorinated Pesticides and PCBs in the Lower Walla Walla River (@ 34 cfs - harmonic mean flow).
Chemical Human Health
Water Quality Criteria (ng/L)
Loading Capacity
(grams/day) 4,4'-DDT 0.59 0.049 4,4'-DDE 0.59 0.049 4,4'-DDD 0.84 0.070 Total DDT 0.59 0.049 Dieldrin 0.14 0.012 Hexachlorobenzene 0.77 0.064 Heptachlor Epoxide 0.59 0.049 Toxaphene 0.75 0.062 Total PCBs 0.17 0.014
The WWTPs that discharge to Garrison and Mill creeks are the only known point sources for the chemicals of concern in this TMDL. Sampling results (see Tables 21 and 22) show that final effluents from the College Place and Walla Walla facilities exceed human health criteria for PCBs but not for pesticides.

Page 102
PCB loadings for the WWTPs and receiving waters were compared to assess what impact these effluents may have on Garrison and Mill creeks (Table 26). The loading capacity of the creeks is approximately 0.0028 and 0.029 grams/day, respectively. Because Garrison Creek is an effluent dominated stream, the long-term mean was used to calculate loading capacity (EPA, 1991). The harmonic mean was used for Mill Creek. Mill Creek’s loading capacity was calculated for the December through April period when effluent is discharged to the creek. There was only a two-year flow record for the lower creek, so the loading capacity estimate may not be representative of long-term average conditions.
Table 26. PCB Loading Estimates for WWTPs on Garrison and Mill Creeks.
College Place
WWTP/ Walla Walla
WWTP/ Garrison Creek Mill Creek
Receiving Water Loading Capacity Mean Flow (cfs)*† 6.7 69 Human Health PCB Criteria (ng/L) 0.17 0.17 Loading Capacity (gm/day) 0.0028 0.029 WWTP Load Average Flow for Maximum Month (mgd) 1.65 9.6 Total PCB Concentration (ng/L) 1.3 0.79 Total PCB Loading (gm/day) 0.0081 0.029 Receiving Water Load Mean Flow (cfs) 6.7 62 Dissolved PCB Concentration (ng/L) 3.5 0.69 Estimated Total PCB Concentration (ng/L) 18 2.7 Total PCB Load (gm/day) 0.30 0.40 WWTP as % of Receiving Water Load 3 7
*Based on historical mean flow for Garrison Creek and harmonic mean flow for Mill Creek †Flow data from: present study; Joy and Swanson (in prep.); White et al. (1998); Mendel et al. (2002); WDFW unpublished data; USGS flow data http://waterdata.usgs.gov/nwis/sw; Ecology flow data http://www.ecy.wa.gov/programs/eap/flow/shu_main.html
Based on the average maximum monthly flow stipulated in the NPDES permits and results of effluent sampling, maximal PCB loads from the College Place and Walla Walla facilities were estimated at 0.0081 and 0.029 grams/day, respectively. Total PCB loads of 0.30 and 0.40 grams/day in Garrison and Mill creeks were estimated from the SPMD results (see Table 16). The current PCB loads in the effluents and receiving waters exceed loading capacity of these streams. A comparison of loading estimates suggests that the WWTPs contribute less than 10%

Page 103
of the receiving water load and thus are insignificant relative to nonpoint sources in these watersheds.
Total Suspended Solids This TMDL evaluation recommends using TSS as a surrogate parameter for chlorinated pesticides in the Walla Walla River. Loading capacities for TSS in the mainstem and tributaries were estimated as follows: Sediment rating curves (TSS vs. flow) and regression equations were developed from the available data. These relationships were used to estimate TSS concentrations and loads during critical times of the year. This approach for load estimation is described in Thomann and Mueller (1987). The critical season for TSS loading was identified by plotting Ecology’s historical lower river data by month (Figure 35). As shown, the interim 50 mg/L TSS target is routinely exceeded from January through June. TSS concentrations also exceed 50 mg/L during July – December, but infrequently. Therefore, for purposes of this TMDL, January – June is considered to be the critical period. This is the same time frame where the SPMD data show the highest pesticide and PCB levels in surface waters.
May Jun JulAug Sep Oct Nov Dec Jan Feb Mar Apr
10
100
1000
10000
TSS
(mg/
L )
Figure 35. Seasonal Pattern of TSS Concentrations in the Lower Walla Walla River Showing the Recommended Interim 50 mg/L Water Quality Target (Ecology 1990-2003 data).
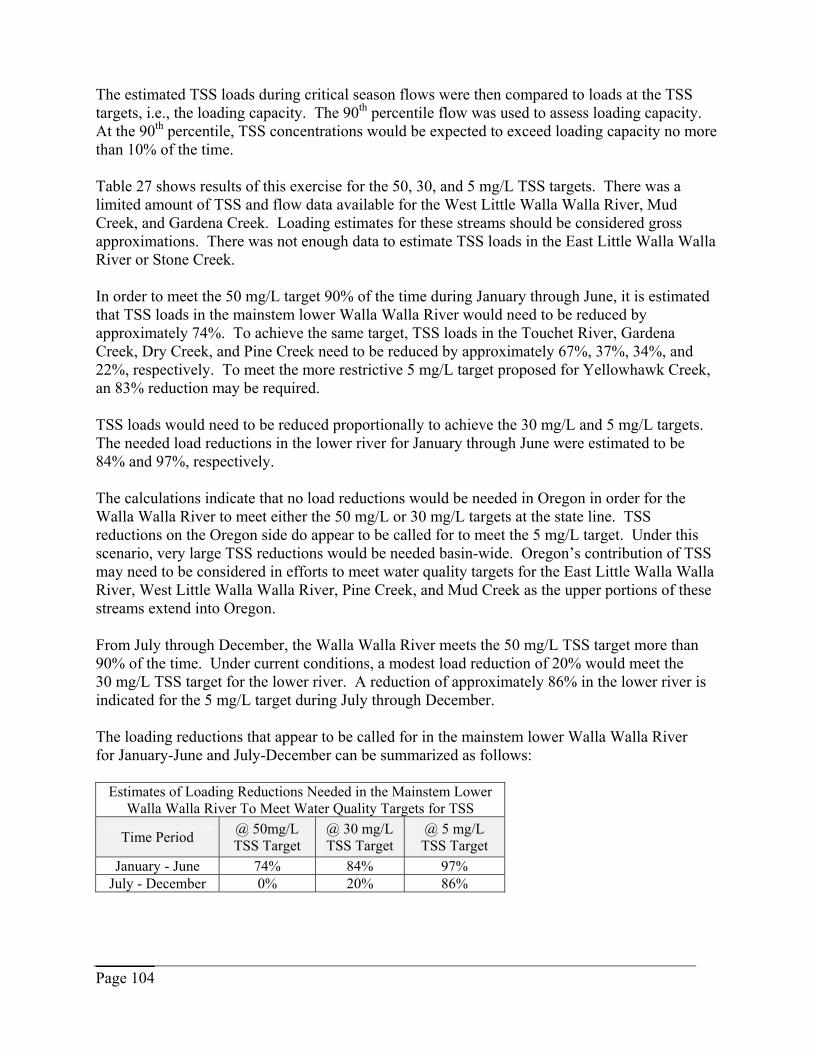
Page 104
The estimated TSS loads during critical season flows were then compared to loads at the TSS targets, i.e., the loading capacity. The 90th percentile flow was used to assess loading capacity. At the 90th percentile, TSS concentrations would be expected to exceed loading capacity no more than 10% of the time. Table 27 shows results of this exercise for the 50, 30, and 5 mg/L TSS targets. There was a limited amount of TSS and flow data available for the West Little Walla Walla River, Mud Creek, and Gardena Creek. Loading estimates for these streams should be considered gross approximations. There was not enough data to estimate TSS loads in the East Little Walla Walla River or Stone Creek. In order to meet the 50 mg/L target 90% of the time during January through June, it is estimated that TSS loads in the mainstem lower Walla Walla River would need to be reduced by approximately 74%. To achieve the same target, TSS loads in the Touchet River, Gardena Creek, Dry Creek, and Pine Creek need to be reduced by approximately 67%, 37%, 34%, and 22%, respectively. To meet the more restrictive 5 mg/L target proposed for Yellowhawk Creek, an 83% reduction may be required. TSS loads would need to be reduced proportionally to achieve the 30 mg/L and 5 mg/L targets. The needed load reductions in the lower river for January through June were estimated to be 84% and 97%, respectively. The calculations indicate that no load reductions would be needed in Oregon in order for the Walla Walla River to meet either the 50 mg/L or 30 mg/L targets at the state line. TSS reductions on the Oregon side do appear to be called for to meet the 5 mg/L target. Under this scenario, very large TSS reductions would be needed basin-wide. Oregon’s contribution of TSS may need to be considered in efforts to meet water quality targets for the East Little Walla Walla River, West Little Walla Walla River, Pine Creek, and Mud Creek as the upper portions of these streams extend into Oregon. From July through December, the Walla Walla River meets the 50 mg/L TSS target more than 90% of the time. Under current conditions, a modest load reduction of 20% would meet the 30 mg/L TSS target for the lower river. A reduction of approximately 86% in the lower river is indicated for the 5 mg/L target during July through December. The loading reductions that appear to be called for in the mainstem lower Walla Walla River for January-June and July-December can be summarized as follows:
Estimates of Loading Reductions Needed in the Mainstem Lower Walla Walla River To Meet Water Quality Targets for TSS
Time Period @ 50mg/L TSS Target
@ 30 mg/L TSS Target
@ 5 mg/L TSS Target
January - June 74% 84% 97% July - December 0% 20% 86%

Page 105
Table 27. Loading Capacity Estimates for TSS in the Walla Walla River Drainage, January through June. 90th Percentile Conditions vs. 50 mg/L Target Loading Percent Flow TSS TSS Load Capacity Reduction Waterbody (cfs) (mg/L) (lbs/day) (lbs/day) Needed Walla Walla R. @ Peppers Bridge 426 19 43,708 115,020 0 Yellowhawk Creek 94 29 14,720 25,380 0 East Little Walla Walla River * * * * * Stone Creek * * * * * Garrison Creek 16 40 3,456 4,320 0 West Little Walla Walla River 5.8 13 407 1,566 0 Mill Creek 177 8 7,646 47,790 0 Dry Creek 72 76 29,549 19,440 34 Mud Creek 6 14 454 1,620 0 Pine Creek 61 64 21,082 16,470 22 Touchet River 750 153 619,650 202,500 67 Gardena Creek 8 79 3,413 2,160 37 Lower Walla Walla River 1,660 193 1,730,052 448,200 74 90th Percentile Conditions vs. 30 mg/L Target Loading Percent Flow TSS TSS Load Capacity Reduction Waterbody (cfs) (mg/L) (lbs/day) (lbs/day) Needed Walla Walla R. @ Peppers Bridge 426 19 43,708 69,012 0 Yellowhawk Creek 94 29 14,720 15,228 0 East Little Walla Walla River * * * * * Stone Creek * * * * * Garrison Creek 16 40 3,456 2,592 25 West Little Walla Walla River 5.8 13 407 940 0 Mill Creek 177 8 7,646 28,674 0 Dry Creek 72 76 29,549 11,664 61 Mud Creek 6 14 454 972 0 Pine Creek 61 64 21,082 9,882 53 Touchet River 750 153 619,650 121,500 80 Gardena Creek 8 79 3,413 1,296 62 Lower Walla Walla River 1,660 193 1,730,052 268,920 84

Page 106
Table 27 (continued). TSS Loading Capacity, January through June. 90th Percentile Conditions vs. 5 mg/L Target Loading Percent Flow TSS TSS Load Capacity ReductionWaterbody (cfs) (mg/L) (lbs/day) (lbs/day) Needed Walla Walla R. @ Peppers Bridge 426 19 43,708 11,502 74 Yellowhawk Creek 94 29 14,720 2,538 83 East Little Walla Walla River * * * * * Stone Creek * * * * * Garrison Creek 16 40 3,456 432 88 West Little Walla Walla River 5.8 13 407 157 62 Mill Creek 177 8 7,646 4,779 38 Dry Creek 72 76 29,549 1,944 93 Mud Creek 6 14 454 162 64 Pine Creek 61 64 21,082 1,647 92 Touchet River 750 153 619,650 20,250 97 Gardena Creek 8 79 3,413 216 94 Lower Walla Walla River 1,660 193 1,730,052 44,820 97
* insufficient data Sources of flow and TSS data: Appendix F; Joy and Swanson (in prep.); White et al. (1998); Mendel et al. (2002); WDFW unpublished data; USGS flow data http://waterdata.usgs.gov/nwis/sw; Ecology flow data http://www.ecy.wa.gov/programs/eap/flow/shu_main.html; Oregon Water Resources flow data http://www.wrd.state.or.us/index.shtml
Economic and Engineering Services Inc. recently modeled erosion and sediment yields in the Walla Walla basin (EES, 2003). This work was done for the Watershed Plan being developed by the WRIA 32 Watershed Planning Unit, with Walla Walla County serving as lead agency. The modeling effort (SWAT) focused on one subbasin each in the Dry Creek and Touchet River watersheds. These two areas were considered to represent the majority of the watershed and account for land management practices common to the Walla Walla basin. EES concluded that “total sediment loading can be reduced by 85% by using no-till practices instead of historical cropping practices involving significant tillage operations.” Thus, the present estimates of TSS load reductions needed to meet the 50 mg/L and 30 mg/L TSS targets appear to be achievable using established agricultural practices. NPDES permits limit the amount of TSS that can be discharged by the College Place (permit #WA-002065-6) and Walla Walla (#WA-002442-7) WWTPs. The current limits state that the average monthly effluent concentrations for TSS “shall not exceed 15 mg/L or 15 percent of the respective monthly average influent concentrations, whichever is more stringent”. Discharge monitoring reports on file with Ecology show that the Walla Walla and College Place WWTPs are insignificant sources of TSS to the receiving waters. Monthly average TSS concentrations in the Walla Walla effluent ranged from 0.6 – 1.5 mg/L over the past two years.

Page 107
College Place experienced periodic upsets during 2002. However, since February 2003, monthly TSS has averaged 0.1 – 4.4 mg/L. The city is developing an operations and maintenance program to prevent unexpected breakdowns or operator mistakes at College Place, and it is expected to continue to operate efficiently (Jerry Anderson, Ecology Eastern Regional Office, personal communication, 2004).

Page 108
This page is purposely left blank for duplex printing.

Page 109
Wasteload and Load Allocations A TMDL must identify the total allowed pollutant amount and its components: appropriate wasteload allocations for point sources and load allocations for nonpoint sources and natural background. The following allocations are proposed for the Walla Walla River drainage:
Pesticides/PCBs/Total Suspended Solids In this TMDL evaluation, TSS is proposed as a surrogate measure for chlorinated pesticides. Equivalent targets are provided for turbidity. Achieving the TSS and turbidity targets also addresses the PCB listings in the drainage. Because of the existence of both point and nonpoint sources of PCBs in the Mill Creek watershed, specific PCB allocations are proposed for Mill and Garrison creeks later in this section of the report. The proposed load allocations for TSS in the upper and lower mainstem Walla Walla River are shown in Table 28. These allocations are for the critical January through June period and come directly from the loading capacities calculated in Table 27 (rounded to 2 significant figures). The loading capacities shown for tributaries in Table 27 are provided for information and planning purposes only and are not allocated loads. As previously discussed, the relationship between pesticides and TSS levels in the river can be expected to change as erosion of agricultural soils is brought under control. For this reason, and because of acknowledged uncertainties in the analysis, TSS load allocations are not proposed for the 2 mg/L and 1 mg/L targets at this time. Table 28. TSS Load Allocations for the Mainstem Walla Walla River, January through June.
Load Allocation (lbs/day) @ 50 mg/L @ 30 mg/L @ 5 mg/L Location TSS Target TSS Target TSS Target
Upper Walla Walla R. @ Peppers Bridge 120,000 69,000 12,000 Lower Walla Walla R. @ Cummins Bridge 450,000 270,000 45,000
TSS Allocation for Oregon This TMDL evaluation did not attempt to differentiate between TSS loading from point sources, nonpoint sources, and background in Oregon. No significant TSS point sources to the Walla Walla River are present or anticipated in Oregon. Therefore wasteload allocations are zero. The entire TSS loading capacity of the Walla Walla River at the state line is allocated to nonpoint sources and background in Oregon. The river’s load allocation at the state line for the initial 50 mg/L TSS target is 120,000 pounds per day.

Page 110
TSS Allocation for Washington No significant point sources of TSS are present or anticipated in the Washington portion of the Walla Walla watershed. Wasteload allocations are therefore zero, with the exception of the Walla Walla and College Place WWTPs. Adjustments to the NPDES permits for these WWTPs are not necessary at this time, and TSS allocations should be consistent with permit load limits. This TMDL evaluation did not attempt to differentiate between TSS loading from nonpoint sources and background in Washington. Therefore, 100% of the TSS loading capacity is allocated to nonpoint sources and background. The load allocation for the lower Walla Walla River for the initial 50 mg/L target is 450,000 pounds per day. Nonpoint and background sources in Oregon contribute an unknown part of the TSS load to the East Little Walla Walla River, West Little Walla Walla River, Pine Creek, and Mud Creek via their upper watersheds.
PCBs in Garrison and Mill Creeks A TMDL must allocate a wasteload to each point source discharging the pollutants of concern unless it can be shown the discharge does not cause or contribute to exceedances of water quality standards. Therefore wasteload and load allocations were assigned for PCBs in Garrison Creek and Mill Creek in light of the concentrations detected in the College Place and Walla Walla WWTP effluents. Chlorinated pesticides were not found to exceed standards in these discharges. Table 29 shows the proposed PCB allocations. The WWTP wasteload allocation was calculated as the product of the human health water quality criterion and the NPDES permit limit for the average monthly effluent flow. The wasteload allocation for the College Place WWTP is therefore 0.0011 grams/day, and for the Walla Walla WWTP it is 0.0062 grams/day. The difference between the loading capacity of the receiving water (Table 26) and the wasteload was assigned as the load allocation for nonpoint sources. (There is no natural background for PCBs.) The load allocations for Garrison and Mill creeks are therefore 0.0017 and 0.023 grams/day, respectively. The WWTP wasteload allocations for PCBs represent approximately 40% and 20% of the loading capacity of Garrison and Mill creeks, respectively. Table 29. Wasteload and Load Allocations for PCBs in Garrison Creek and Mill Creek (gm/day).
Garrison
Creek Mill
Creek Wasteload Allocation for WWTP 0.0011 0.0062 Load Allocation for Nonpoint 0.0017 0.023 Loading Capacity 0.0028 0.029

Page 111
Margin of Safety A margin of safety is required in a TMDL to account for uncertainty in understanding the relationship between pollutant discharges and water quality impacts. This TMDL evaluation incorporates several procedures and assumptions that confer a safety margin:
• Two methods were used to derive the TSS concentration on which the water quality targets were based, thereby increasing confidence in the appropriateness of the targets.
• The additive effects from the combined concentrations of DDT, DDE, and DDD were accounted for by basing the water quality targets on t-DDT.
• A t-DDT target provides a wider margin of safety for other chlorinated pesticides, since these are generally present at lower concentrations relative to criteria.
• The 90th percentile statistic was used in developing the turbidity target and assessing loading capacity. This approach implicitly allocates 10% of the load to natural generation of suspended sediment and turbidity.
• The recommended approach of applying the water quality targets directly to tributaries and drains gives a wider margin of safety than requiring only the minimal water quality improvements needed to meet standards in the mainstem.
• A phased approach for implementing the targets is proposed; the ultimate targets are conservative.
Several sources of uncertainty could not be resolved with the information currently available:
• Because of difficulties in analyzing trace amounts of PCBs in surface water and a lack of information on sources, it is uncertain exactly how the decrease in PCB concentrations will track with the proposed water quality targets and at what point in the cleanup process standards will be achieved.
• As already described, there is uncertainty in the accuracy of the 2 mg/L:1 NTU and 1 mg/L:<1 NTU water quality targets, and the appropriateness of these values should be reassessed once the more easily achieved targets are met.
• Due to limited data, there is substantial uncertainty in the accuracy of the TSS loading capacities and loading reductions estimated for several tributaries, previously identified.
• Due to limited flow data for lower Mill Creek, the wasteload and load allocations for PCBs may not be representative of average conditions.
• Because estimated toxaphene concentrations exceeded t-DDT in Pine Creek, meeting water quality targets for TSS in this creek may not result in toxaphene meeting standards. Source investigation is recommended.
Finally, this study did not investigate the bottom sediments in the Columbia River backwater formed in the lower 10 miles of the Walla Walla River by McNary Dam. This area is a likely sink for chlorinated pesticides and PCBs associated with particulates transported by the Walla Walla River and a potential source of contamination to fish. Sediment recovery will occur as upstream water quality targets are met, but the time for recovery is unknown.

Page 112
Seasonal Variation and Critical Conditions A TMDL must describe the method used to account for seasonal variations and critical conditions. Both of these issues were previously addressed, most importantly: • Seasonal patterns of contamination were identified through the use of SPMDs deployed
on a quarterly basis, including associated grab samples. • Harmonic mean flow was used to calculate loading capacity estimates for pesticides and
PCBs. • The critical season for TSS loading was identified by plotting the historical ambient
monitoring data for by month. • The 90th percentile statistic was used in deriving the turbidity target and in estimates of
loading capacity, which allows for seasonal variability.

Page 113
Monitoring Plan A TMDL must include monitoring to measure achievement of targets and water quality standards. An outline of a monitoring plan for the Walla Walla chlorinated pesticide/PCB TMDL is provided below. The goal of monitoring would be to determine if land use changes are effective in reducing TSS loading to the Walla Walla River and bringing the river into compliance with standards. Objectives should include: 1) obtaining accurate and representative data on TSS and turbidity in the mainstem Walla Walla River and major tributary sources of TSS; 2) using the data to assess progress toward meeting water quality targets for these parameters; 3) re-surveying fish and the water column to verify that human health standards for chlorinated pesticides and PCBs are being met; 4) re-assessing the accuracy of the 2 mg/L:1 NTU and 1 mg/L:<1 NTU targets for the mainstem, and 5) developing water quality targets to protect high fish consumers in the East Little Walla Walla River and in Yellowhawk Creek. It is suggested that water quality monitoring begin with collecting one year of baseline data on TSS and turbidity at the ten sites listed below. Sampling should be conducted at least twice weekly, similar to what is being done for effectiveness monitoring in the Yakima TMDL. In order to obtain representative and comparable data, depth integrating sampling procedures should be used. Streamflow should be measured. The following sampling sites are suggested for TMDL effectiveness monitoring:
1. Walla Walla River @ state line 2. Yellowhawk Creek 3. East Little Walla Walla River 4. Garrison Creek 5. Mill Creek 6. Dry Creek 7. Pine Creek 8. Touchet River 9. Gardena Creek 10. Lower Walla Walla River @ Cummins Bridge Once significant land use changes are deemed to have occurred, twice-weekly samples would be again collected from January through June, the critical period for TSS loading. The pre- and post-data for January-June would be tested for significant differences and the 90th percentile values compared to the numerical targets. January-June monitoring would continue on a yearly or less frequent basis, depending on results of the comparisons and pace at which land use changes proceed in the watershed. Monitoring in July-December would be phased in as appropriate to assess progress in meeting the more restrictive targets.
Page 114
As the water quality targets for TSS and turbidity are progressively achieved, chlorinated pesticides and PCBs should be periodically analyzed in resident mainstem fish species and the water column. PCBs should also be analyzed in fish samples from Mill and Garrison creeks. Sample size for fish should be appropriate for making a statistical comparison with criteria used to assess compliance with human health standards and WDOH should be consulted on the sampling design. Water column sampling and analysis should employ low-level techniques. Water samples should be focused on the mainstem and include the East Little Walla Walla River and Yellowhawk Creek. TSS and turbidity samples should be collected in conjunction with the pesticide sampling. A Quality Assurance (QA) Project Plan should be prepared for whatever monitoring is conducted. The QA Project Plan should follow Ecology guidelines (Lombard and Kirchmer, 2004) paying particular attention to consistency in sampling and analytical methods.

Page 115
Compliance Schedule In the TMDL process, a flexible schedule is allowed for compliance with water quality targets since nonpoint source implementation is not an exact science. Interim targets are compared to monitoring data at regular intervals after best management practices, education programs, and other parts of the implementation strategy have been initiated. As the targets and data are compared, the progress toward improved water quality conditions is assessed, and adjustments or changes in the TMDL strategy are publicly discussed. The goal is to find practical and effective solutions to eliminate the water pollution problems addressed in the TMDL. A Summary Implementation Strategy (SIS) is developed in the TMDL submittal report to EPA. In the SIS, dates for meeting the interim targets are stated. In addition, effectiveness monitoring is mentioned, which occurs five years after the Detailed Implementation Plan is complete. In both the SIS and the Detailed Implementation Plan, the advisory group may include a more detailed compliance schedule.

Page 116
Recommendations for Follow-up Work As of result of this TMDL study, the following recommendations are made: • Chlorinated pesticides and PCBs should be analyzed in sediment samples from the
Columbia River backwater in the lower Walla Walla River and an assessment made of potential for uptake of these chemicals by fish and of ecological risk. The rate of sediment deposition should be measured and results used to predict time to recovery under various cleanup scenarios for the upstream watershed.
• An effort should be made to determine if there are remediable PCB sources in the Mill Creek
watershed. More intensive sampling of Mill and Garrison creeks may help determine if and where localized sources exist. The stormwater systems should be sampled for PCBs. Other potential sources in the watershed include agricultural, food processing, chemical, scrap, and waste sites.
• The City of Walla Walla is currently implementing a program throughout the city to identify
and reduce or eliminate sources of pollutants, including PCBs. This program, in conjunction with recent and future treatment upgrades at the wastewater treatment plant (WWTP), will remove identified pollutants from the discharge. The city also will be delegated the EPA Pretreatment Program by the Department of Ecology that will give the city the tools to establish additional industrial and commercial effluent limits when discharging into the city sewer system. The local program also will allow the city to issue a permit to the dischargers with these effluent limitations and with compliance authority. The City of College Place, being a smaller community, will be assisted by Ecology to identify possible sources of pollutants. Through special conditions in the city’s discharge permit, the city is required to identify and gather effluent data on local dischargers to the sewer system. These data will be analyzed by the city and Ecology for possible pollutants that may affect the treatment ability of the WWTP or exceed effluent requirements required by the TMDL.
• Sampling should be conducted to locate toxaphene sources in the Pine Creek drainage.
Because of the analytical challenges presented by toxaphene, some kind of pre-concentration technique may be required to obtain useful data.

Page 117
References Anchor Environmental. 2000. Transmittal of August 2000 Spokane River Lipid Bag Data. Letter from Clay Patmont, Anchor Environmental to John Roland, Washington State Dept. Ecology, Olympia, WA. Anderson, R. 2003 (draft). Lower Yakima River Suspended Sediment and DDT TMDL Effectiveness Monitoring. Notes to Tom Tebb, Washington State Dept. Ecology, Yakima, WA. Berg, L. 1982. The effect of exposure to short-term pulses of suspended sediment on the behavior of juvenile salmonids. Pages 177-196 in: G.F. Hartman et al. (eds.). Proceedings of the Carnation Creek workshop: A Ten Year Review. Department of Fisheries and Oceans, Pacific Biological Station, Nanaimo, Canada. Bjornn, T. and D. Reiser. 1991. Habitat requirements of salmonids in streams. Pages 83-139 in: W.R. Meehan (ed.): Influences of Forest and Rangeland Management on Salmonid Fishes and their Habitats, American Fisheries Society, Bethesda, MD. Buck, D.H. 1956. Effects of Turbidity on Fish and Fishing. Trans. N. Amer. Wildl. Conf. 21:249-261. CCREM. 1987. Canadian Water Quality Guidelines. Canadian Council of Resource and Environment Ministers, Ottawa, Ontario. CRITFC. 1994. A Fish Consumption Survey of the Umatilla, Nez Perce, Yakama, and Warm Springs Tribes of the Columbia River Basin. Tech. Rept. 94-3. Columbia River Inter-Tribal Fish Commission, Portland, OR. Davis, D. 1994. Washington State Pesticide Monitoring Program: Reconnaissance Sampling of Fish Tissue and Sediments (1992). Washington State Dept. Ecology, Olympia, WA. Pub. No. 94-194. Davis, D. and A. Johnson. 1994. Washington State Pesticide Monitoring Program: 1993 Surface Water Sampling Report. Washington State Dept. Ecology, Olympia, WA. Pub. No. 94-164. Davis, D., A. Johnson, and D. Serdar. 1995. Washington State Pesticide Monitoring Program: 1993 Fish Tissue Sampling Report. Washington State Dept. Ecology, Olympia, WA. Pub. No. 95-356. Ecology. 2002. Water Quality Program Permit Writer’s Manual. Washington State Dept. Ecology, Olympia, WA. Pub. No. 92-109. http://www.ecy.wa.gov/biblio/92109.html Ecology. 1996. Total Maximum Daily Load Guidelines. Washington State Dept. Ecology, Olympia, WA. Pub. No. 97-315. http://www.ecy.wa.gov/biblio/97315.html

Page 118
EES. 2003. Technical Memorandum WRIA 32 – Water Quality Task 1 – Erosion and Sediment Modeling for the Walla Walla Basin. Final Draft Report, June 2003, Economic and Engineering Services Inc., Kennewick, WA. EILS. 1995. Department of Ecology 1994-94 Investigation of PCBs in the Spokane River. Environmental Investigations and Laboratory Services Program, Washington State Dept. Ecology, Olympia, WA. Pub. No. 95-310. http://www.ecy.wa.gov/biblio/95310.html Ellis, G.S., J.N. Huckins, C.E. Rostad, C.J. Schmitt, J.D. Petty, and P. MacCarthy. 1995. Evaluation of Lipid-Containing Semipermeable Membrane Devices (SPMDs) for Monitoring Organochlorine Contaminants in the Upper Mississippi River. Environ. Toxicol. Chem. 14:1875-1884. Environment Ontario. 1985. Information Alert: Pesticides from National Agricultural Chemicals Association. Hazardous Contaminants Branch, Toronto, Ontario. EPA. 1990a. Specifications and Guidance for Obtaining Contaminant-Free Sample Containers. OSWER Directive #93240.0-05. EPA. 1990b. Quality Criteria for Water – 1989. Criteria and Standards Division, Office of Water Regulations and Standards, Washington, D.C. EPA. 1991. Technical Support Document for Water Quality-based Toxics Control. EPA/505/2-90-001. EPA. 1992a. Great Lakes Water Quality Initiative. Water Quality Branch, EPA Region V, Chicago, IL. EPA. 1992b. National Study of Chemical Residues in Fish, Vol. II. Office of Science and Technology. EPA-823-R-92-008b. EPA. 1993. Water Quality Criteria Summary. Health and Ecological Criteria Division. Office of Science and Technology, Washington, D.C. 3 pp. EPA. 1995. Guidelines for Preparation of the 1996 State Water Quality Assessment (305(b) reports). EPA-841B-95-001. EPA. 2000a. Methodology for Deriving Ambient Water Quality Criteria for the Protection of Human Health. EPA/822/B-98/005. EPA. 2000b. Guidance for Assessing Chemical Contaminant Data for Use in Fish Advisories. Vol. 1, Fish Sampling and Analysis. Office of Water. EPA-823-B-00-007. EPA. 2000c. Estimated Per Capita Fish Consumption in the United States. EPA-821-R-00-025. EPA. 2002a. National Recommended Water Quality Criteria: 2002. EPA-822-R-02-047.
Page 119
EPA. 2002b. Columbia River Basin Fish Contaminant Survey, 1996-1998. EPA Region 10, Seattle, WA. EPA-910/R-02-006. Gammon, J.R. 1970. The Effect of Inorganic Sediment on Stream Biota. EPA Water Pollution Control Research Series 18050 DW C12/70, Washington, D.C. Hart Crowser. 1995. Final Report, Supplemental 1994 Spokane River PCB Investigations Kaiser Aluminum and Chemical Corporation, Trentwood Works Spokane, Washington. Report J-2644-44. Hopkins, B.S., D.K. Clark, M. Schlender, and M. Stinson. 1985. Basic Water Monitoring Program: Fish Tissue and Sediment Sampling for 1984. Washington State Dept. Ecology, Olympia, WA. Pub. No. 85-7. Huckins, J.N., J.D. Petty, H.F. Prest, R.C. Clark, D.A. Alvarez, C.E. Orazio, J.A. Lebo, W.L. Cranor, and B.T. Johnson. 2000. A Guide to the Use of Semipermeable Membrane Devices (SPMDs) as Samplers of Waterborne Hydrophobic Organic Contaminants. USGS Columbia Environmental Research Center, Columbia, MO. Huckins, J.N., J.D. Petty, J.A. Lebo, F.V. Almeida, K. Booij, D. Alvarez, W. Cranor, R. Clark, and B. Mogensen. 2002. Development of the Permeability/Performance Reference Compound Approach for In Situ Calibration of Semipermeable Membrane Devices. Environ. Sci. Tech. 36(1):85-91. Johnson, A. 1997a. Pesticides Detected in the Walla Walla Drainage, April and June 1996. Memorandum to C. Nuechterlein, D. Knight, and J. Jacobson. Washington State Dept. Ecology, Olympia, WA. Pub. No. 97-e03. Johnson, A. 1997b. Results from Additional Pesticide Sampling in the Walla Walla Drainage, April and May 1997. Memorandum to C. Nuechterlein, D. Knight, and J. Jacobson. Washington State Dept. Ecology, Olympia, WA. Pub. No. 97-e06. Johnson, A. and B. Era-Miller. 2002. Total Maximum Daily Load Technical Study: Chlorinated Pesticides and PCBs in the Walla Walla River - Quality Assurance Project Plan. Washington State Dept. Ecology, Olympia, WA. Pub. No. 02-03-068. http://www.ecy.wa.gov/biblio/0203068.html Joy, J. and B. Patterson. 1997. A Suspended Sediment and DDT Total Maximum Daily Load Evaluation Report for the Yakima River. Washington State Dept. Ecology, Olympia, WA. Pub. No. 97-321. Joy, J. and T. Swanson. (in prep.) Walla Walla River Basin Fecal Coliform Bacteria, Dissolved Oxygen, and pH Total Maximum Daily Load Study. Washington State Dept. Ecology, Olympia, WA. Karickhoff, S.W. 1981. Semi-empirical Estimation of Sorption of Hydrophobic Pollutants on Natural Sediments and Soils. Chemosphere 10(8):833-846.

Page 120
Kuttel, M. et al. 2001. Salmonid Habitat Limiting Factors Report, WRIA 32. Washington Conservation Commission. Lloyd, D.S. 1985. Turbidity in Freshwater Habitats of Alaska: A Review of Published and Unpublished Literature Relevant to the Use of Turbidity as a Water Quality Standard. Habitat Division, Alaska Dept. Fish. Game, Juneau, AK. Rep. No. 85-1. Lloyd, D.S., J. Koenings, and J. LaPerriere. 1987. Effects of Turbidity in Fresh Waters of Alaska. N. Am. J. Fish. Manag. 7: 18-33. Lombard, S. and C. Kirchmer. 2004. Guidelines for Preparing Quality Assurance Project Plans for Environmental Studies. Washington State Dept. Ecology, Olympia, WA. Pub. No. 04-03-030. http://www.ecy.wa.gov/biblio/0403030.html Mackay, D. and A. Fraser. 2000. Bioaccumulation of Persistent Organic Chemicals: Mechanisms and Models. Environ. Pollut. 110:375-391. Mapes, B.E. 1969. Sediment Transport by Streams in the Walla Walla River Basin, July 1962 – June 1965. U.S. Geological Survey, Water Supply Paper 1868. McCarthy, K.A. and R.W. Gale. 1999. Investigation of the Distribution of Organochlorine and Polycyclic Aromatic Hydrocarbon Compounds in the Lower Columbia River Using Semipermeable Membrane Devices. U.S. Geological Survey, Water-Resources Investigation Report 99-4051. Meadows, J.C., K.R. Echols, J.N. Huckins, F.A. Borsuk, R.F. Carline, and D.E. Tillitt. 1998. Estimation of Uptake Rates for PCB Congeners Accumulated by Semipermeable Membrane Devices and Brown Trout (Salmo trutta). Environ. Sci. Tech. 32:1847-1852. Meijer, S.N., W.A. Ockenden, A. Sweetman, K. Breivik, J.O. Grimalt, and K.C. Jones. 2003. Global Distribution and Budget of PCBs and HCB in Background Surface Soils: Implications for Sources and Environmental Processes. Environ. Sci. Technol. 37(4): 667-671. Mendel, G, D. Karl, and T. Coyle. 2001. Assessment of Salmonids and Their Habitat Conditions in the Walla Walla River Basin of Washington: 2001 Annual Report. Washington Dept. Fish and Wildlife, Dayton, WA. Mendel, G., J. Trump, and D. Karl. 2002. Assessment of Salmonids and Their Habitat Conditions in the Walla Walla River Basin within Washington; 2001-2002 Annual Report. Project No. 1998-02000, 142 electronic pages, (BPA Report DOE/BP-00004616-1). Mills, W.B., D.B. Porcella, M.J. Ungs, S.A. Gherini, and K.V. Summers. 1985. Water Quality Assessment: A Screening Procedure for Toxic and Conventional Pollutants in Surface and Ground Water. EPA/600/6-85/002a.

Page 121
Munn, M.D. and S.J. Gruber. 1997. The Relationship Between Land Use and Organochlorine Compounds in Streambed Sediment and Fish in the Central Columbia Plateau, Washington and Idaho, USA: Environ. Toxicol. Chem. 16(9)1877 - 1887. National Research Council. 2001. Assessing the TMDL Approach to Water Quality Management. Water Science and Technology Advisory Board. National Academy Press, Washington, D.C. Newcomb, C.P. and D.D. McDonald. 1991. Effects of Suspended Sediments on Aquatic Ecosystems. N. Am. J. Fish. Manag. 11:72-82. Rantalainen, A.L., M.G. Ikonomou, and I.H. Rogers. 1998. Lipid-Containing Semipermeable Membrane Devices (SPMDs) as Concentrators of Toxic Chemicals in the Lower Fraser River, British Columbia. Chemosphere 37;1119-1138. Risebrough, R.W. and W.M. Jarman. 1984. DDT Compounds in Soils and Water Particulates of the Salinas Valley. A report to the State Water Resources Control Board, Sacramento, CA. Saul, D., C. Rabe, A. Davidson, and D. Rollins (Ecopacific). 2001. Draft Walla Walla Subbasin Summary. Prepared for the Northwest Power Planning Council. Serdar, D., D. Davis, and J. Hirsch. 1999. Lake Whatcom Watershed Cooperative Drinking Water Project: Results of 1998 Water, Sediment, and Fish Tissue Sampling. Washington State Dept. Ecology, Olympia, WA. Pub. No. 99-337. http://www.ecy.wa.gov/biblio/99337.html Thomann, R.V. and J.A. Mueller. 1987. Principles of Surface Water Quality Modeling and Control. Harper & Rowe Pub., New York. Wania, F. and D. Mackay. 1996. Tracking the Distribution of Persistent Organic Contaminants. Environ. Sci. Technol. 30(9):390-396A. White, J., E. Rashin, E. Nocon, and J. Summers. 1998. Garrison Creek Use-Based Receiving Water Study. Washington State Dept. Ecology, Olympia, WA. Pub. No. 98-302.

Page 122
This page is purposely left blank for duplex printing.
Appendices
A. Sampling Site Locations for the Walla Walla Chlorinated Pesticide/PCB TMDL Field Study.
B. Biological Data on Walla Walla River Fish Samples.
C. Estimated Water Concentration Calculator from SPMD Data.
D. Pesticide/PCB Data from the Walla Walla Chlorinated Pesticide/PCB TMDL Field Study.
E. Results on Replicate and Split Samples Analyzed for the Walla Walla Chlorinated Pesticide/PCB Field Study.
F. Flow and Conventional Water Quality Data for the Walla Walla Drainage.
G. Conventional Data for Final Effluent from the College Place and Walla Walla WWTPs
H. DDE, TSS, and Turbidity Data on Whole Water Samples Collected in the Walla Walla Drainage, May 2002 - September 2003.

App 2
This page is purposely left blank for duplex printing.

App 3
Appendix A
Sampling Site Locations for the Walla Walla Chlorinated Pesticide/PCB TMDL Field Study

App 4
This page is purposely left blank for duplex printing.

App 5
Appendix A. Sampling Site Locations for the Walla Walla Chlorinated Pesticide/PCB TMDL Field Study.
Site Name Location Description Latitude North
(NAD83) Longitude
West (NAD83) Major Tributaries
Upper Mill Creek At the 7 Mile Road crossing - Creek Mile 14.8 46.081 118.189
Upper Walla Walla River At the Pepper Road crossing - River Mile 39.6 46.003 118.383
Yellowhawk Creek At the Old Milton Hwy crossing - Creek Mile 1.1 46.024 118.384
Garrison Creek At the Mission Road crossing - Creek Mile 0.5 46.028 118.428
Lower Mill Creek On Whitman Mission Refuge property at the railroad crossing - Creek Mile 0.7 46.044 118.464
Middle Walla Walla River At the Detour Road crossing - River Mile 32.8 46.043 118.490
Dry Creek At the Highway 12 crossing - Creek Mile 0.5 46.057 118.590
Pine Creek At the Sand Pit Road crossing - Creek Mile 1.4 46.028 118.632
Touchet River At Highway 12 crossing - River Mile 0.5 46.042 118.683
Lower Walla Walla River At the old irrigation station off of Byrnes Road - River Mile 14.3 46.052 118.758
Minor Tributaries
East Little Walla Walla R. At a road crossing off of Beet Road - River Mile 0.7 46.013 118.412
Stone Creek At mouth near the Mojonnier Road crossing of the Walla Walla River - Creek Mile 0.0 46.024 118.426
West Little Walla Walla R. At the Stovall Road crossing - River Mile 0.8 46.034 118.472
Mud Creek At the Borgen Road crossing - Creek Mile 0.5 46.042 118.615
Gardena Creek At the Nelson Road crossing - Creek Mile 1.1 46.017 118.721 WWTPs
Walla Walla WWTP Final effluent from outfall box 46.065 118.376
College Place WWTP Final effluent from the outfall of Lagoon 3 46.031 118.419 Fishing Sites
Lower Walla Walla River From Pierce's RV Park Property (River Mile 9.5) to River Mile 20.0 46.067 118.826
Upper Walla Walla River From Dry Creek (River Mile 27.2) to Yellowhawk Creek (River Mile 38.1) 46.051 118.594
Note: Latitude/longitude for fish collection are downstream end of reach.

App 6
This page is purposely left blank for duplex printing.

App 7
Appendix B
Biological Data on Walla Walla River Fish Samples

App 8
This page is purposely left blank for duplex printing.

App 9
Appendix B. Biological Data on Walla Walla River Fish Samples.
Collection Date
Sample ID*
Sample No. Species
Fork** or Total Length (mm)
Total Weight
(g) Tissue Type†
Fillet Weight
(g) Sex Age 7/17/02 UPCARP-1 438181 Carp 520 2350 S fillet 300 F 10 7/17/02 UPCARP-1 438181 Carp 547 2966 S fillet 475 M 17 7/18/02 UPCARP-1 438181 Carp 475 1876 S fillet 290 M 7 7/17/02 UPSMBS-1 438182 SMBS 396 897 S fillet n/a F 5 7/18/02 UPSMBS-1 438182 SMBS 220 189 S fillet 86 M 2 7/17/02 UPBLS-1 438183 BLS 432 877 S fillet 173 F 8 7/17/02 UPBLS-1 438183 BLS 405 723 S fillet 138 F 5 7/17/02 UPBLS-1 438183 BLS 443 974 S fillet 200 F 5 7/17/02 UPBLS-1 438183 BLS 450 809 S fillet 168 M 6 7/17/02 UPBLS-1 438183 BLS 447 824 S fillet 180 M 6 7/17/02 UPBLS-2 438184 BLS 405 704 S fillet 133 F 4 7/18/02 UPBLS-2 438184 BLS 370 552 S fillet 119 M 4 7/17/02 UPBLS-2 438184 BLS 420 797 S fillet 146 F 8 7/17/02 UPBLS-2 438184 BLS 310 396 S fillet 63 Ind 4 7/17/02 UPBLS-2 438184 BLS 350 442 S fillet 81 M 5 7/17/02 UPBLS-3 438185 BLS 353 469 S fillet 95 Ind 3 7/18/02 UPBLS-3 438185 BLS 348 397 S fillet 83 F 4 7/17/02 UPBLS-3 438185 BLS 432 740 S fillet 140 F 5 7/17/02 UPBLS-3 438185 BLS 448 824 S fillet 159 Ind 7 7/17/02 UPBLS-3 438185 BLS 428 1005 S fillet 172 M 7 7/17/02 UPBLS-4 438186 BLS 452 850 S fillet 148 F 5 7/17/02 UPBLS-4 438186 BLS 460 962 S fillet 160 F 6 7/17/02 UPBLS-4 438186 BLS 408 742 S fillet 138 F 5 7/17/02 UPBLS-4 438186 BLS 382 651 S fillet 130 M 5 7/17/02 UPBLS-4 438186 BLS 395 620 S fillet 94 Ind 4 7/17/02 UPBLS-5 438187 BLS 395 558 Whole n/a F 4 7/17/02 UPBLS-5 438187 BLS 498 1013 Whole n/a F 10 7/17/02 UPBLS-5 438187 BLS 455 938 Whole n/a Ind 5 7/17/02 UPBLS-5 438187 BLS 374 651 Whole n/a F 3 7/17/02 UPBLS-5 438187 BLS 410 676 Whole n/a M 5 7/17/02 UPNPM-1 438188 NPM 288 291 S fillet 50 M 5 7/17/02 UPNPM-1 438188 NPM 277 210 S fillet 41 F 5 7/17/02 UPNPM-1 438188 NPM 253 172 S fillet 33 F 6 7/17/02 UPNPM-1 438188 NPM 252 159 S fillet 32 F 6 7/17/02 UPNPM-1 438188 NPM 253 179 S fillet 30 M 4 7/17/02 UPNPM-2 438189 NPM 260 165 S fillet 47 F 5 7/17/02 UPNPM-2 438189 NPM 228 149 S fillet 58 M 4 7/17/02 UPNPM-2 438189 NPM 240 155 S fillet 50 M 5 7/17/02 UPNPM-2 438189 NPM 232 138 S fillet 43 M 6

App 10
Collection Date
Sample ID*
Sample No. Species
Fork** or Total Length (mm)
Total Weight
(g) Tissue Type†
Fillet Weight
(g) Sex Age 7/17/02 UPNPM-2 438189 NPM 397 536 S fillet 109 F 8 7/17/02 UPNPM-3 438190 NPM 298 262 S fillet 50 F 9 7/17/02 UPNPM-3 438190 NPM 230 125 S fillet 45 M 6 7/17/02 UPNPM-3 438190 NPM 298 254 S fillet 46 M 7 7/18/02 UPNPM-3 438190 NPM 358 512 S fillet 86 M 9 7/17/02 UPNPM-3 438190 NPM 303 287 S fillet 48 M 7 7/17/02 UPNPM-4F 438191 NPM 320 383 S fillet 48 M 9 7/17/02 UPNPM-4F 438191 NPM 302 327 S fillet 48 F 7 7/17/02 UPNPM-4F 438191 NPM 250 174 S fillet 41 F 4 7/17/02 UPNPM-4F 438191 NPM 280 234 S fillet 54 M 5 7/17/02 UPNPM-4F 438191 NPM 350 407 S fillet 57 F 8 7/17/02 UPNPM-4C 438210 NPM 320 383 carcass n/a 9 7/17/02 UPNPM-4C 438210 NPM 302 327 carcass n/a 7 7/17/02 UPNPM-4C 438210 NPM 250 174 carcass n/a 4 7/17/02 UPNPM-4C 438210 NPM 280 234 carcass n/a 5 7/17/02 UPNPM-4C 438210 NPM 350 407 carcass n/a 8 7/29/02 LWRCAT-1 438192 CHCAT 525 1259 NS fillet 142 F 10 7/31/02 LWRCAT-1 438192 CHCAT 475 942 NS fillet 114 M 11 7/31/02 LWRBLS-1 438193 BLS 336 356 S fillet 73 Ind 4 7/29/02 LWRBLS-1 438193 BLS 374 532 S fillet 94 F 5 7/29/02 LWRBLS-1 438193 BLS 303 241 S fillet 98 Ind 3 7/29/02 LWRBLS-1 438193 BLS 482 1054 S fillet 161 F 6 7/29/02 LWRBLS-1 438193 BLS 492 1121 S fillet 188 M 6 7/29/02 LWRBLS-2 438194 BLS 441 489 S fillet 131 M 5 7/29/02 LWRBLS-2 438194 BLS 290 279 S fillet 95 Ind 4 7/30/02 LWRBLS-2 438194 BLS 419 743 S fillet 145 M 5 7/31/02 LWRBLS-2 438194 BLS 485 1165 S fillet 180 F 12 7/29/02 LWRBLS-2 438194 BLS 512 1270 S fillet 191 F 13 7/29/02 LWRBLS-3 438195 BLS 320 324 S fillet 69 Ind 3 7/30/02 LWRBLS-3 438195 BLS 294 251 S fillet 54 Ind 5 7/29/02 LWRBLS-3 438195 BLS 430 675 S fillet 125 M 5 7/29/02 LWRBLS-3 438195 BLS 408 633 S fillet 127 F 8 7/29/02 LWRBLS-3 438195 BLS 306 258 S fillet 51 M 2 7/29/02 LWRBLS-4 438196 BLS 469 825 S fillet 139 F 6 7/31/02 LWRBLS-4 438196 BLS 364 453 S fillet 89 M 5 7/30/02 LWRBLS-4 438196 BLS 310 301 S fillet 99 Ind 3 7/29/02 LWRBLS-4 438196 BLS 336 450 S fillet 102 Ind 4 7/29/02 LWRBLS-4 438196 BLS 357 447 S fillet 82 M 4 7/29/02 LWRBLS-5 438197 BLS 423 742 Whole n/a M 6 7/30/02 LWRBLS-5 438197 BLS 283 201 Whole n/a Ind 2 7/29/02 LWRBLS-5 438197 BLS 450 761 Whole n/a F 6 7/31/02 LWRBLS-5 438197 BLS 381 565 Whole n/a M 3 7/31/02 LWRBLS-5 438197 BLS 345 414 Whole n/a F 3

App 11
Collection Date
Sample ID*
Sample No. Species
Fork** or Total Length (mm)
Total Weight
(g) Tissue Type†
Fillet Weight
(g) Sex Age 9/10/02 LWRCARP-1 438198 Carp 610 2953 S fillet 338 M 12 7/29/02 LWRCARP-1 438198 Carp 610 2752 S fillet 277 M 14 7/29/02 LWRCARP-1 438198 Carp 584 2307 S fillet 292 M 19 9/10/02 LWRCARP-1 438198 Carp 590 2592 S fillet 261 M 10 9/10/02 LWRCARP-1 438198 Carp 570 2360 S fillet 246 F 15 9/10/02 LWRCARP-2 438199 Carp 606 3181 S fillet 336 F 9 7/29/02 LWRCARP-2 438199 Carp 580 2726 S fillet 274 F 10 7/29/02 LWRCARP-2 438199 Carp 544 1875 S fillet 268 M 10 7/29/02 LWRCARP-2 438199 Carp 482 1938 S fillet 174 M 5 7/29/02 LWRCARP-2 438199 Carp 540 1946 S fillet 210 M 11 9/10/02 LWRCARP-3 438200 Carp 602 2962 S fillet 279 M 13 9/10/02 LWRCARP-3 438200 Carp 590 2393 S fillet 270 F 10 7/29/02 LWRCARP-3 438200 Carp 585 2675 S fillet 267 M 12 9/10/02 LWRCARP-3 438200 Carp 606 3796 S fillet 331 F 13 7/29/02 LWRCARP-3 438200 Carp 585 2482 S fillet 251 M 14 7/29/02 LWRCARP-4 438201 Carp 570 2189 S fillet 229 M 9 7/29/02 LWRCARP-4 438201 Carp 438 1551 S fillet 169 M 10 7/29/02 LWRCARP-4 438201 Carp 568 2543 S fillet 240 F 13 9/10/02 LWRCARP-4 438201 Carp 705 4322 S fillet 458 F 13 9/10/02 LWRCARP-4 438201 Carp 608 3136 S fillet 360 F 11 9/11/02 LWRNPM-1 438203 NPM 310 237 S fillet 53 F 7 7/31/02 LWRNPM-1 438203 NPM 266 149 S fillet 32 M 5 7/30/02 LWRNPM-1 438203 NPM 203 80 S fillet 24 M 4 9/11/02 LWRNPM-1 438203 NPM 310 269 S fillet 37 F 7 7/29/02 LWRNPM-1 438203 NPM 234 100 S fillet 28 Ind 5 7/29/02 LWRNPM-2 438204 NPM 223 96 S fillet 33 Ind 5 9/11/02 LWRNPM-2 438204 NPM 285 188 S fillet 54 F 6 7/31/02 LWRNPM-2 438204 NPM 235 104 S fillet 37 Ind 6 7/29/02 LWRNPM-2 438204 NPM 229 100 S fillet 35 F 5 9/11/02 LWRNPM-2 438204 NPM 260 153 S fillet 41 M 6 7/29/02 LWRSMBS-1 438205 SMBS 200 97 S fillet 38 Ind 2 7/29/02 LWRSMBS-1 438205 SMBS 197 106 S fillet 36 Ind 2 7/31/02 LWRSMBS-1 438205 SMBS 442 1158 S fillet 204 F 6 7/29/02 LWRSMBS-1 438205 SMBS 183 79 S fillet 28 Ind 2 7/29/02 LWRSMBS-1 438205 SMBS 180 72 S fillet 21 Ind 2 9/11/02 LWRSMBS-2 438206 SMBS 240 182 S fillet 32 M 2 7/31/02 LWRSMBS-2 438206 SMBS 309 399 S fillet 70 Ind 3 9/11/02 LWRSMBS-2 438206 SMBS 370 708 S fillet 107 M 4 7/29/02 LWRSMBS-2 438206 SMBS 313 412 S fillet 75 M 3 7/30/02 LWRSMBS-2 438206 SMBS 382 750 S fillet 114 F 4 9/11/02 LWRSMBS-2C 438209 SMBS 240 182 Carcass n/a M 2 7/31/02 LWRSMBS-2C 438209 SMBS 309 399 Carcass n/a Ind 3 9/11/02 LWRSMBS-2C 438209 SMBS 370 708 Carcass n/a M 4 7/29/02 LWRSMBS-2C 438209 SMBS 313 412 Carcass n/a M 3

App 12
Collection Date
Sample ID*
Sample No. Species
Fork** or Total Length (mm)
Total Weight
(g) Tissue Type†
Fillet Weight
(g) Sex Age 7/30/02 LWRSMBS-2C 438209 SMBS 382 750 Carcass n/a F 4 7/31/02 LWRSMBS-3 438207 SMBS 223 132 S fillet 40 M 2 7/29/02 LWRSMBS-3 438207 SMBS 267 278 S fillet 52 M 3 7/31/02 LWRSMBS-3 438207 SMBS 205 109 S fillet 36 Ind 2 9/11/02 LWRSMBS-3 438207 SMBS 220 135 S fillet 47 Ind 2 7/31/02 LWRSMBS-3 438207 SMBS 375 829 S fillet 135 M 5 7/30/02 LWRSMBS-4 438208 SMBS 354 607 S fillet 101 F 4 7/31/02 LWRSMBS-4 438208 SMBS 223 154 S fillet 49 Ind 2 7/31/02 LWRSMBS-4 438208 SMBS 211 122 S fillet 38 Ind 1 7/31/02 LWRSMBS-4 438208 SMBS 358 677 S fillet 125 M 4 7/31/02 LWRSMBS-4 438208 SMBS 204 102 S fillet 37 Ind 2
*UP designates an upper river sample; LWR designates a lower river sample **Upper river fish are fork length. Total length can be estimated from fork length using the formulas: Small mouth bass - TL = FK x 1.04 Northern pike minnow - TL = FK x 1.114 Carp - TL = 10(0.999xlogFK)+0.053 Bridgelip sucker - TL = 10(1.022xlogFK)-0.025 †S=skin on NS = no skin

App 13
Appendix C
Estimated Water Concentration Calculator from SPMD Data

App 14
This page is purposely left blank for duplex printing.

App 15
Appendix C. Estimated Water Concentration Calculator from SPMD Data (D. Alvarez, USGS, modified). Enter a temperature value (10, 18, or 26) in °C which most closely approximates the actual exposure water temperature. Temperature (°C) = 10 Exposure Time (d) = 28.8 Mass of SPMD (g) = 22.5 (NOTE: a standard 81 cm SPMD has a mass of 4.5 g) Volume of Lipid (L) = 0.005 Volume of Membrane (L) = 0.0185 Volume of SPMD (L) = 0 (NOTE: a standard 81 cm SPMD has lipid volume of 0.001L, membrane volume of 0.0037L, and a total volume of 0.0047L.) If a PRC was used, the ke-PRC can be calculated by ke-PRC = [ln(CSPMDo/CSPMD)]/t. ke-PRC (d-1) = 0.0091 The ke-cal value is the laboratory calibration value for the native PRC analog. ke-cal (d-1) = 0.013 (NOTE: the ke-cal for D10-Phenanthrene is 0.021 d-1) Project Name: Yellowhawk Creek 208089 May-June 02
Compound Log Kow KSPMD Laboratory
Rs PRC corrected
Rs Theoretical Total
Analyte Water Conc. Used
( L/d ) ( L/d ) t1/2 ( ng/SPMD ) ( pg/L ) Hexachlorobenzene 5.71 1.45E+05 2.6 1.8 1305.4 30 573.9 linear Heptachlor 5.19 6.72E+04 3.6 2.5 435.6 < 5 < 69.1 linear Heptachlor Epoxide 4.51 2.00E+04 2.9 2.0 161.2 14 240.1 linear p,p'-DDE 6.14 2.50E+05 5.5 3.8 1061.3 392 3546.8 linear o,p'-DDE 5.56 1.18E+05 3.3 2.3 834.1 < 24 < 361.7 linear p,p'-DDD 5.75 1.54E+05 3.1 2.2 1155.6 85 1363.8 linear o,p'-DDD 6.08 2.33E+05 3.3 2.3 1648.3 17 256.2 linear p,p'-DDT 5.47 1.04E+05 3.2 2.2 754.7 103 1607.2 linear o,p'-DDT 5.59 1.23E+05 2.2 1.5 1305.8 24 535.8 linear Dieldrin 4.60 2.38E+04 1.8 1.3 309.0 72 1989.6 linear Oxychlordane 5.48 1.05E+05 2.9 2.0 845.1 5.2 89.2 linear trans-Chlordane 5.38 9.05E+04 3.5 2.4 603.1 63 888.2 linear trans-Nonachlor 6.35 3.16E+05 3.6 2.5 2049.3 36 501.5 linear cis-Chlordane 5.38 9.05E+04 3.8 2.7 555.5 52 680.6 linear cis-Nonachlor 6.20 2.68E+05 2.8 2.0 2233.4 15 266.5 linear Total PCB 6.40 3.33E+05 4.8 3.4 1620.4 110 1139.9 linear

App 16
This page is purposely left blank for duplex printing.

App 17
Appendix D
Pesticide/PCB Data from the Walla Walla Chlorinated Pesticide/PCB TMDL Field Study

App 18
This page is purposely left blank for duplex printing.
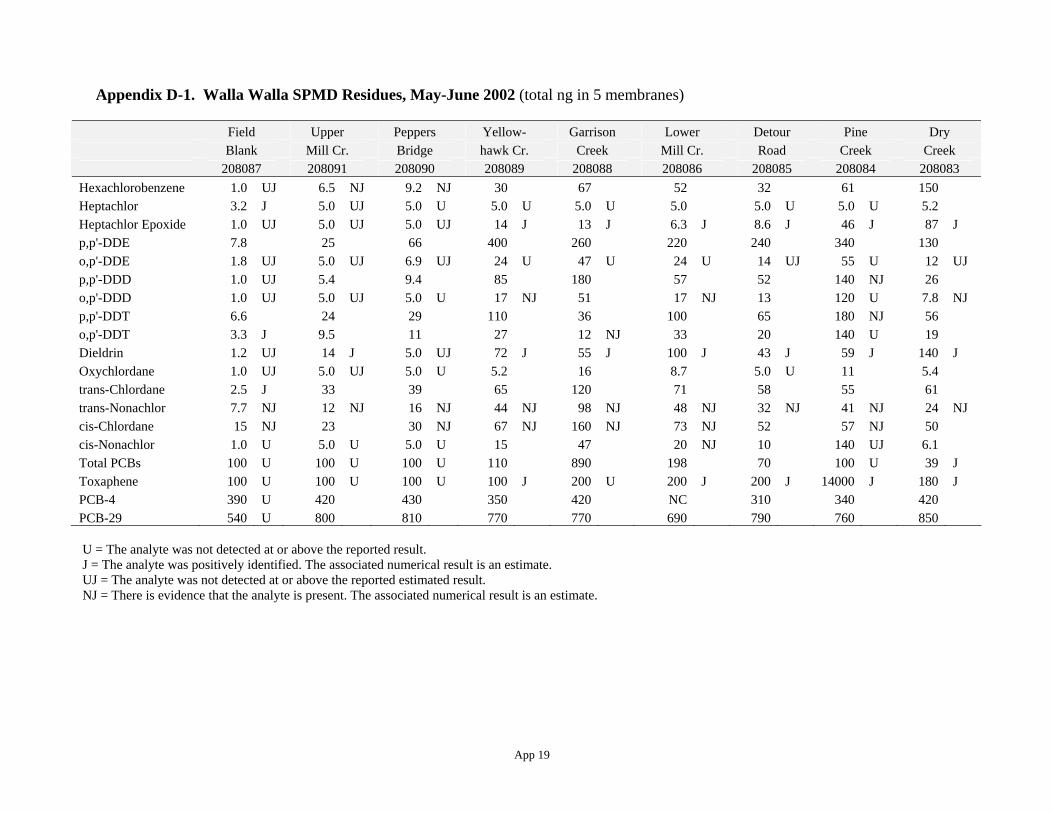
App 19
Appendix D-1. Walla Walla SPMD Residues, May-June 2002 (total ng in 5 membranes)
Field Upper Peppers Yellow- Garrison Lower Detour Pine Dry Blank Mill Cr. Bridge hawk Cr. Creek Mill Cr. Road Creek Creek 208087 208091 208090 208089 208088 208086 208085 208084 208083
Hexachlorobenzene 1.0 UJ 6.5 NJ 9.2 NJ 30 67 52 32 61 150 Heptachlor 3.2 J 5.0 UJ 5.0 U 5.0 U 5.0 U 5.0 5.0 U 5.0 U 5.2 Heptachlor Epoxide 1.0 UJ 5.0 UJ 5.0 UJ 14 J 13 J 6.3 J 8.6 J 46 J 87 J p,p'-DDE 7.8 25 66 400 260 220 240 340 130 o,p'-DDE 1.8 UJ 5.0 UJ 6.9 UJ 24 U 47 U 24 U 14 UJ 55 U 12 UJ p,p'-DDD 1.0 UJ 5.4 9.4 85 180 57 52 140 NJ 26 o,p'-DDD 1.0 UJ 5.0 UJ 5.0 U 17 NJ 51 17 NJ 13 120 U 7.8 NJ p,p'-DDT 6.6 24 29 110 36 100 65 180 NJ 56 o,p'-DDT 3.3 J 9.5 11 27 12 NJ 33 20 140 U 19 Dieldrin 1.2 UJ 14 J 5.0 UJ 72 J 55 J 100 J 43 J 59 J 140 J Oxychlordane 1.0 UJ 5.0 UJ 5.0 U 5.2 16 8.7 5.0 U 11 5.4 trans-Chlordane 2.5 J 33 39 65 120 71 58 55 61 trans-Nonachlor 7.7 NJ 12 NJ 16 NJ 44 NJ 98 NJ 48 NJ 32 NJ 41 NJ 24 NJ cis-Chlordane 15 NJ 23 30 NJ 67 NJ 160 NJ 73 NJ 52 57 NJ 50 cis-Nonachlor 1.0 U 5.0 U 5.0 U 15 47 20 NJ 10 140 UJ 6.1 Total PCBs 100 U 100 U 100 U 110 890 198 70 100 U 39 J Toxaphene 100 U 100 U 100 U 100 J 200 U 200 J 200 J 14000 J 180 J PCB-4 390 U 420 430 350 420 NC 310 340 420 PCB-29 540 U 800 810 770 770 690 790 760 850
U = The analyte was not detected at or above the reported result. J = The analyte was positively identified. The associated numerical result is an estimate. UJ = The analyte was not detected at or above the reported estimated result. NJ = There is evidence that the analyte is present. The associated numerical result is an estimate.

App 20
Appendix D-2. Walla Walla SPMD Residues, August-September 2002 (total ng in 5 membranes)
Field Blank
038086
Upper Mill Cr. 038091
Peppers Bridge 038090
Yellow- hawk Cr. 038088
Yellow- hawk rep. 038089
Garrison Creek
038084
Lower Mill Cr. 038085
Detour Road
038087
Pine Creek
038082
Dry Creek
038083
Touchet River
038081
Lower Walla
038080 Hexachlorobenzene 5.0 U 26 15 23 28 54 27 32 30 140 92 38 Heptachlor 3.0 J 5.6 3.9 J 4.1 J 4.4 J 3.1 4.5 J 3.1 J 3.5 J 4.3 J 8.7 5.4 Heptachlor Epoxide 5.0 U 3.6 J 2.8 J 11 9.2 16 11 20 32 18 16 14 p,p'-DDE 11 46 70 470 J 470 250 65 229 58 58 110 110 o,p'-DDE 2.5 J 4.7 J 5.5 17 20 29 8.2 7.5 NJ 5.0 U 4.5 J 6.8 5.6 p,p'-DDD 2.0 J 14 9.3 100 110 170 35 76 26 14 38 37 o,p'-DDD 5.0 U 5.0 U <5.0 U 26 30 65 10 NJ 24 NJ 17 NJ 5.0 U 7.2 NJ 11 NJ p,p'-DDT 9.7 37 22 86 95 22 30 39 25 18 37 23 o,p'-DDT 4.8 J 9.4 8.8 16 18 7.0 10 11 7.6 7.2 11 11 Dieldrin 3.0 J 17 6.1 130 130 130 U 110 72 30 NJ 44 5.0 U 27 Oxychlordane 5.0 U 5.0 U 5.0 U 5.4 5.9 14 3.2 J 7.9 5.0 U 5.0 U 5.0 U 5.0 U trans-Chlordane 27 43 NJ 37 61 67 96 NJ 51 NJ 50 36 41 47 NJ 40 trans-Nonachlor 9.8 18 17 50 58 89 26 34 14 19 19 17 cis-Chlordane 22 37 31 71 79 130 51 50 31 33 38 33 cis-Nonachlor 1.2 J 3.1 J 2.1 J 15 16 28 U 6.4 NJ 9.0 5.0 U 3.8 J 3.2 J 5.0 U Total PCBs 100 U 100 U 100 U 230 300 610 100 U 100 U 100 U 100 U 48 NJ 39 NJ Toxaphene 100 U 100 U 100 U 100 U 100 U 650 J 100 U 220 J 610 J 100 U 260 J 330 J PCB-4 540 170 330 330 260 310 480 270 410 340 220 340 PCB-29 670 380 680 550 500 600 750 600 710 690 610 670
U = The analyte was not detected at or above the reported result. J = The analyte was positively identified. The associated numerical result is an estimate. UJ = The analyte was not detected at or above the reported estimated result. NJ = There is evidence that the analyte is present. The associated numerical result is an estimate.

App 21
Appendix D-3. Walla Walla SPMD Residues, November-December 2002 (total ng in 5 membranes)
Field Blank
078968
Upper Mill Cr. 078967
Peppers Bridge 078966
Yellow- hawk Cr. 078964
Garrison Creek
078962
Lower Mill Cr. 078963
Detour Road
078965
Pine Creek
078960
Dry Creek
078961
Touchet River
078959
Lower Walla
078958 Hexachlorobenzene 5.0 UJ 14 J 10 J 13 J 29 39 J 30 J 6.2 60 J 11 J 23 Heptachlor 3.4 J 2.8 J 3.4 J 6.6 5.0 U 3.8 J 3.0 J 2.3 J 2.2 J 3.0 J 3.2 J Heptachlor Epoxide 5.0 UJ 5.0 U 1.2 J 9.8 5.0 U 6.9 5.1 7.2 14 2.9 J 5.3 p,p'-DDE 15 20 37 240 64 75 110 43 31 21 63 o,p'-DDE 3.1 J 2.2 J 2.7 J 24 12 7.2 5.6 1.3 NJ 2.3 J 2.1 J 3.0 NJ p,p'-DDD 1.3 J 3.4 J 4.5 J 46 33 23 17 21 6.6 3.5 J 15 o,p'-DDD 5.0 UJ 5.0 U 4.5 16 NJ 13 NJ 6.2 NJ 7.4 NJ 15 1.1 NJ 5.0 U 4.2 NJ p,p'-DDT 12 15 13 130 7.8 NJ 35 24 33 9.8 7.5 18 o,p'-DDT 6.8 5.6 5.0 20 4.1 J 13 7.2 14 3.8 J 3.9 J 7.4 Dieldrin 2.7 J 5.9 3.8 J 1300 E 40 U 70 52 15 25 4.6 J 15 Oxychlordane 5.0 UJ 5.0 U 5.0 U 4.2 J 5.0 U 4.0 J 3.1 J 5.0 U 1.4 J 5.0 U 5.0 U trans-Chlordane 24 NJ 23 NJ 17 490 36 NJ 34 28 19 22 17 24 trans-Nonachlor 8.9 9.0 7.5 210 27 25 21 5.9 NJ 9.0 7.0 8.5 cis-Chlordane 20 19 14 460 41 37 28 16 17 13 21 cis-Nonachlor 1.1 J 1.2 J 5.0 U 62 12 NJ 5.0 U 5.4 5.0 U 1.7 J 5.0 U 5.0 U Total PCBs 33 J 22 J 26 J 89 NJ 210 92 NJ 57 J 100 U 25 J 21 J 43 J Toxaphene 100 UJ 100 U 100 U 200 J 100 U 110 J 100 U 1900 J 100 U 100 U 600 J PCB-4 660 320 380 360 300 650 480 510 440 360 480 PCB-29 750 580 670 470 480 630 640 630 620 660 500
U = The analyte was not detected at or above the reported result. J = The analyte was positively identified. The associated numerical result is an estimate. UJ = The analyte was not detected at or above the reported estimated result. NJ = There is evidence that the analyte is present. The associated numerical result is an estimate. E = The concentration exceeds the known calibration range.

App 22
Appendix D-4. Walla Walla SPMD Residues, February-March 2002 (total ng in 5 membranes)
Field Blank
157506
Upper Mill Cr. 157510
Peppers Bridge 157509
Yellow- hawk Cr. 157507
Garrison Creek
157504
Lower Mill Cr. 157505
Detour Road
157508
Pine Creek
157502
Dry Creek
157503
Touchet River
157501
Lower Walla
157500 Hexachlorobenzene 5.0 U 9.2 9.4 J 63 50 38 27 39 72 43 34 Heptachlor 3.9 J 4.2 J 2.7 J 6.1 5.0 UJ 3.8 J 5.4 2.8 J 2.8 J 2.7 J 2.3 J Heptachlor Epoxide 5.0 U 1.4 J 5.0 U 7.4 4.9 J 2.9 J 4.3 J 29 12 5.9 7.5 p,p'-DDE 13 29 94 J 660 J 110 120 200 110 94 93 150 o,p'-DDE 2.8 J 2.6 J 3 J 19 NJ 14 8.9 8.6 4.3 J 4.8 4.4 J 6.7 p,p'-DDD 1.6 J 5.0 9.6 38 53 31 31 5.0 U 16 18 28 o,p'-DDD 5.0 U 5 U 2.7 J 9.4 NJ 20 11 8.4 27 4.7 J 5.1 6.9 NJ p,p'-DDT 11 44 42 J 240 26 100 87 88 33 29 73 o,p'-DDT 6.7 11 10 J 73 9.0 29 17 26 NJ 12 9.5 23 Dieldrin 2.4 J 14 2.5 J 26 31 UJ 32 19 42 28 8.8 17 Oxychlordane 5.0 U 5.0 U 5.0 U 4.2 J 5.5 1.6 J 5.0 U 5.0 U 2.2 J 5.0 U 1.6 J trans-Chlordane 24 30 14 110 43 28 NJ 44 33 26 27 29 trans-Nonachlor 10 11 6.6 76 43 26 24 12 NJ 14 11 17 cis-Chlordane 21 22 11 J 120 58 29 40 32 22 22 27 cis-Nonachlor 1.2 J 5.0 U 5.0 U 11 13 J 5.1 J 5.9 5.0 U 2.4 J 2.1 J 3.3 J Total PCBs 29 J 23 J 24 J 100 U 210 120 65 J 100 U 39 NJ 27 J 100 U Toxaphene 100 U 100 U 100 U 580 J 100 UJ 100 U 300 J 1200 J 160 J 100 U 680 J PCB-4 590 J 390 190 300 J 470 320 J 450 500 J 410 J 320 J 380 J PCB-29 840 620 390 570 580 680 770 710 560 440 610
U = The analyte was not detected at or above the reported result. J = The analyte was positively identified. The associated numerical result is an estimate. UJ = The analyte was not detected at or above the reported estimated result. NJ = There is evidence that the analyte is present. The associated numerical result is an estimate.
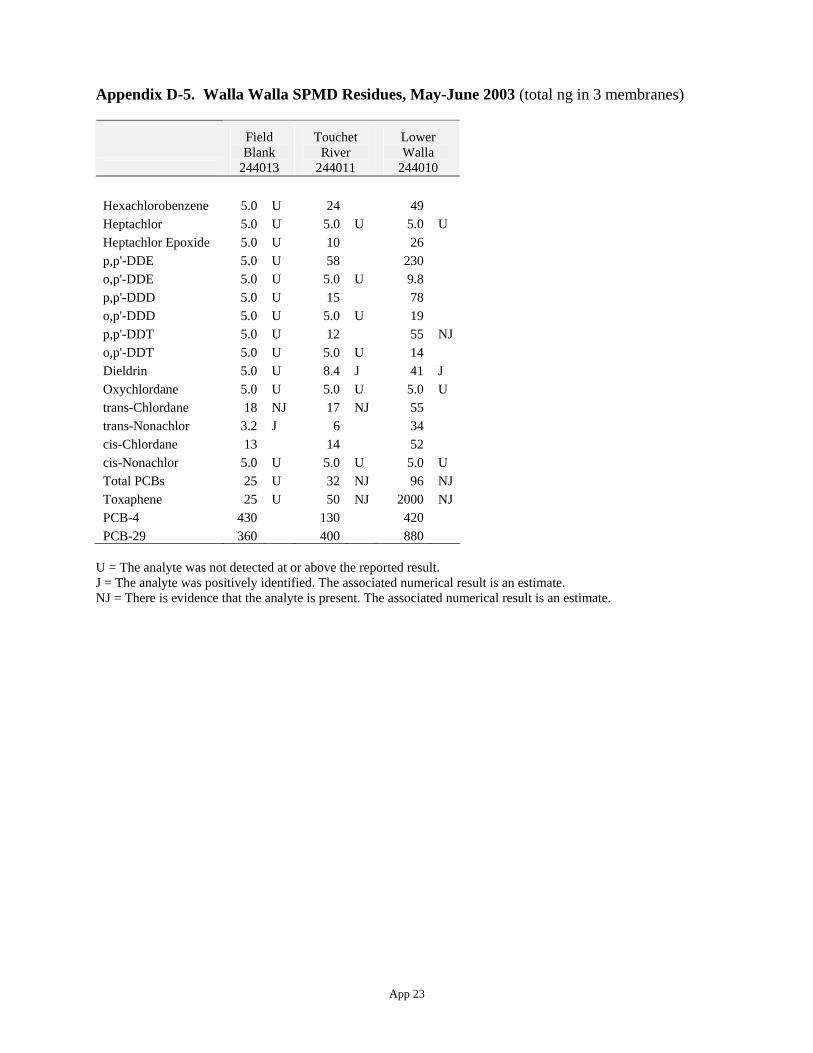
App 23
Appendix D-5. Walla Walla SPMD Residues, May-June 2003 (total ng in 3 membranes)
Field Blank
244013
Touchet River
244011
Lower Walla
244010 Hexachlorobenzene 5.0 U 24 49 Heptachlor 5.0 U 5.0 U 5.0 U Heptachlor Epoxide 5.0 U 10 26 p,p'-DDE 5.0 U 58 230 o,p'-DDE 5.0 U 5.0 U 9.8 p,p'-DDD 5.0 U 15 78 o,p'-DDD 5.0 U 5.0 U 19 p,p'-DDT 5.0 U 12 55 NJ o,p'-DDT 5.0 U 5.0 U 14 Dieldrin 5.0 U 8.4 J 41 J Oxychlordane 5.0 U 5.0 U 5.0 U trans-Chlordane 18 NJ 17 NJ 55 trans-Nonachlor 3.2 J 6 34 cis-Chlordane 13 14 52 cis-Nonachlor 5.0 U 5.0 U 5.0 U Total PCBs 25 U 32 NJ 96 NJ Toxaphene 25 U 50 NJ 2000 NJ PCB-4 430 130 420 PCB-29 360 400 880
U = The analyte was not detected at or above the reported result. J = The analyte was positively identified. The associated numerical result is an estimate. NJ = There is evidence that the analyte is present. The associated numerical result is an estimate.

App 24
Appendix D-6. Mean Temperatures and Exposure Times for Walla Walla SPMDs May-June 2002 Aug.-Sept. 2002 Nov.-Dec. 2002 Temp (oC) Time (days) Temp (oC) Time (days) Temp (oC) Time (days) Yellowhawk Creek 13.7 28.8 17.7 25.9 5.8 28.0 Dry Creek 16.4 28.0 14.9 26.0 8.1 27.0 Garrison Creek 16.1 28.8 19.0 25.9 9.4 28.0 Lower Walla Walla 15.8 * ** 26.0 5.5 26.9 Lower Mill Creek 15.1 29.6 18.7 25.1 8.2 27.0 Peppers Bridge 11.0 28.6 17.6 25.9 6.0 28.0 Pine Creek 17.1 29.0 18.0 26.0 5.1 26.9 Touchet River 16.8 * 20.8 26.0 4.6 26.9 Upper Mill Creek 11.1 29.3 16.1 26.0 5.5 28.0 Detour Road 13.4 29.7 18.3 25.1 7.1 27.1 Feb.-March 2003 May-June 2003 Temp (oC) Time (days) Temp (oC) Time (days) Yellowhawk Creek 5.6 24.8 - - - - Dry Creek 5.3 23.2 - - - - Garrison Creek 8.6 24.8 - - - - Lower Walla Walla 5.7 24.0 - - - - Lower Mill Creek 6.3 23.3 - - - - Peppers Bridge 5.4 24.8 - - - - Pine Creek 5.5 23.0 - - - - Touchet River 5.3 23.1 19.5 24.9 Upper Mill Creek 4.8 24.0 - - - - Detour Road 6.0 24.0 16.5 24.9 *Sampler silted over and unusable **Tidbit lost

App 25
Appendix D-7. Pesticide/PCB Data for the Final Effluents from the College Place and Walla Walla WWTPs (ng/L).
WWTP Name Date Parameter Result qualifier Sample ID College Place 5/29/02 Total PCBs 2.3 2228031 College Place 5/29/02 2,4'-DDD 0.066 UJ 3258031 College Place 5/29/02 2,4'-DDE 0.066 UJ 3258031 College Place 5/29/02 2,4'-DDT 0.066 UJ 3258031 College Place 5/29/02 4,4'-DDD 0.066 UJ 3258031 College Place 5/29/02 4,4'-DDE 0.11 J 3258031 College Place 5/29/02 4,4'-DDT 0.092 UJ 3258031 College Place 5/29/02 Cis-Chlordane (Alpha-Chlordane) 0.13 J 3258031 College Place 5/29/02 Cis-Nonachlor 0.066 UJ 3258031 College Place 5/29/02 Dieldrin 0.066 NC 3258031 College Place 5/29/02 Heptachlor 0.066 UJ 3258031 College Place 5/29/02 Heptachlor Epoxide 0.066 NC 3258031 College Place 5/29/02 Hexachlorobenzene 0.095 UJ 3258031 College Place 5/29/02 Oxychlordane 0.066 UJ 3258031 College Place 5/29/02 Trans-Chlordane (Gamma) 0.089 NJ 3258031 College Place 5/29/02 Trans-Nonachlor 0.12 NJ 3258031 College Place 5/30/02 Total PCBs 2.67 2228033 College Place 5/30/02 2,4'-DDD 0.066 UJ 3258033 College Place 5/30/02 2,4'-DDE 0.066 UJ 3258033 College Place 5/30/02 2,4'-DDT 0.066 UJ 3258033 College Place 5/30/02 4,4'-DDD 0.066 UJ 3258033 College Place 5/30/02 4,4'-DDE 0.1 J 3258033 College Place 5/30/02 4,4'-DDT 0.093 UJ 3258033 College Place 5/30/02 Cis-Chlordane (Alpha-Chlordane) 0.086 NJ 3258033 College Place 5/30/02 Cis-Nonachlor 0.066 UJ 3258033 College Place 5/30/02 Dieldrin 0.066 NC 3258033 College Place 5/30/02 Heptachlor 0.066 UJ 3258033 College Place 5/30/02 Heptachlor Epoxide 0.066 NC 3258033 College Place 5/30/02 Hexachlorobenzene 0.096 UJ 3258033 College Place 5/30/02 Oxychlordane 0.066 UJ 3258033 College Place 5/30/02 Trans-Chlordane (Gamma) 0.076 J 3258033 College Place 5/30/02 Trans-Nonachlor 0.13 UJ 3258033 College Place 9/11/02 2,4'-DDD 0.069 UJ 2378882 College Place 9/11/02 2,4'-DDE 0.069 UJ 2378882 College Place 9/11/02 2,4'-DDT 0.069 UJ 2378882 College Place 9/11/02 4,4'-DDD 0.069 UJ 2378882 College Place 9/11/02 4,4'-DDE 0.1 J 2378882 College Place 9/11/02 4,4'-DDT 0.069 UJ 2378882 College Place 9/11/02 Cis-Chlordane (Alpha-Chlordane) 0.086 J 2378882 College Place 9/11/02 Cis-Nonachlor 0.069 UJ 2378882 College Place 9/11/02 Dieldrin 0.22 UJ 2378882 College Place 9/11/02 Heptachlor 0.069 UJ 2378882 College Place 9/11/02 Heptachlor Epoxide 0.14 UJ 2378882

App 26
WWTP Name Date Parameter Result qualifier Sample ID College Place 9/11/02 Hexachlorobenzene 0.069 UJ 2378882 College Place 9/11/02 Oxychlordane 0.069 UJ 2378882 College Place 9/11/02 Total PCBs 0.925 2378882 College Place 9/11/02 Trans-Chlordane (Gamma) 0.069 UJ 2378882 College Place 9/11/02 Trans-Nonachlor 0.069 UJ 2378882 College Place 12/2/02 2,4'-DDD 0.067 U 2498959 College Place 12/2/02 2,4'-DDE 0.067 U 2498959 College Place 12/2/02 2,4'-DDT 0.067 U 2498959 College Place 12/2/02 4,4'-DDD 0.067 U 2498959 College Place 12/2/02 4,4'-DDE 0.067 U 2498959 College Place 12/2/02 4,4'-DDT 0.073 UJ 2498959 College Place 12/2/02 Cis-Chlordane (Alpha-Chlordane) 0.067 U 2498959 College Place 12/2/02 Cis-Nonachlor 0.067 U 2498959 College Place 12/2/02 Dieldrin 0.54 UJ 2498959 College Place 12/2/02 Heptachlor 0.067 U 2498959 College Place 12/2/02 Heptachlor Epoxide 0.64 UJ 2498959 College Place 12/2/02 Hexachlorobenzene 0.17 UJ 2498959 College Place 12/2/02 Oxychlordane 0.067 U 2498959 College Place 12/2/02 Total PCBs 1.29 2498959 College Place 12/2/02 Trans-Chlordane (Gamma) 0.073 2498959 College Place 12/2/02 Trans-Nonachlor 0.067 U 2498959 College Place 2/24/03 Dieldrin 0.21 J 3098998 College Place 2/24/03 Heptachlor Epoxide 0.066 UJ 3098998 College Place 2/24/03 Total PCBs 0.527 3098998 College Place 3/24/03 2,4'-DDD 0.066 UJ 3138164 College Place 3/24/03 2,4'-DDE 0.066 UJ 3138164 College Place 3/24/03 2,4'-DDT 0.066 UJ 3138164 College Place 3/24/03 4,4'-DDD 0.066 UJ 3138164 College Place 3/24/03 4,4'-DDE 0.066 UJ 3138164 College Place 3/24/03 4,4'-DDT 0.093 UJ 3138164 College Place 3/24/03 Cis-Chlordane (Alpha-Chlordane) 0.066 UJ 3138164 College Place 3/24/03 Cis-Nonachlor 0.066 UJ 3138164 College Place 3/24/03 Dieldrin 0.21 J 3138164 College Place 3/24/03 Heptachlor 0.066 UJ 3138164 College Place 3/24/03 Heptachlor Epoxide 0.066 UJ 3138164 College Place 3/24/03 Hexachlorobenzene 0.15 NJ 3138164 College Place 3/24/03 Oxychlordane 0.066 UJ 3138164 College Place 3/24/03 Trans-Chlordane (Gamma) 0.066 UJ 3138164 College Place 3/24/03 Trans-Nonachlor 0.066 UJ 3138164 Walla Walla 5/29/02 Total PCBs 1.01 2228030 Walla Walla 5/29/02 Total PCBs 0.791 2228034 Walla Walla 5/29/02 2,4'-DDD 0.065 UJ 3258030 Walla Walla 5/29/02 2,4'-DDE 0.065 UJ 3258030 Walla Walla 5/29/02 2,4'-DDT 0.065 UJ 3258030 Walla Walla 5/29/02 4,4'-DDD 0.065 UJ 3258030 Walla Walla 5/29/02 4,4'-DDE 0.11 J 3258030

App 27
WWTP Name Date Parameter Result qualifier Sample ID Walla Walla 5/29/02 4,4'-DDT 0.091 UJ 3258030 Walla Walla 5/29/02 Cis-Chlordane (Alpha-Chlordane) 0.2 J 3258030 Walla Walla 5/29/02 Cis-Nonachlor 0.14 UJ 3258030 Walla Walla 5/29/02 Heptachlor 0.065 UJ 3258030 Walla Walla 5/29/02 Hexachlorobenzene 0.094 UJ 3258030 Walla Walla 5/29/02 Oxychlordane 0.065 UJ 3258030 Walla Walla 5/29/02 Trans-Chlordane (Gamma) 0.17 J 3258030 Walla Walla 5/29/02 Trans-Nonachlor 0.065 UJ 3258030 Walla Walla 5/29/02 2,4'-DDD 0.068 UJ 3258034 Walla Walla 5/29/02 2,4'-DDE 0.068 UJ 3258034 Walla Walla 5/29/02 2,4'-DDT 0.068 UJ 3258034 Walla Walla 5/29/02 4,4'-DDD 0.068 UJ 3258034 Walla Walla 5/29/02 4,4'-DDE 0.068 UJ 3258034 Walla Walla 5/29/02 4,4'-DDT 0.095 UJ 3258034 Walla Walla 5/29/02 Cis-Chlordane (Alpha-Chlordane) 0.15 J 3258034 Walla Walla 5/29/02 Cis-Nonachlor 0.068 UJ 3258034 Walla Walla 5/29/02 Dieldrin 0.068 NC 3258034 Walla Walla 5/29/02 Heptachlor 0.068 UJ 3258034 Walla Walla 5/29/02 Heptachlor Epoxide 0.068 NC 3258034 Walla Walla 5/29/02 Hexachlorobenzene 0.098 UJ 3258034 Walla Walla 5/29/02 Oxychlordane 0.068 UJ 3258034 Walla Walla 5/29/02 Trans-Chlordane (Gamma) 0.078 J 3258034 Walla Walla 5/29/02 Trans-Nonachlor 0.16 NJ 3258034 Walla Walla 5/30/02 Total PCBs 0.743 2228032 Walla Walla 5/30/02 2,4'-DDD 0.065 UJ 3258032 Walla Walla 5/30/02 2,4'-DDE 0.065 UJ 3258032 Walla Walla 5/30/02 2,4'-DDT 0.065 UJ 3258032 Walla Walla 5/30/02 4,4'-DDD 0.065 UJ 3258032 Walla Walla 5/30/02 4,4'-DDE 0.075 J 3258032 Walla Walla 5/30/02 4,4'-DDT 0.091 UJ 3258032 Walla Walla 5/30/02 Cis-Chlordane (Alpha-Chlordane) 0.17 J 3258032 Walla Walla 5/30/02 Cis-Nonachlor 0.075 UJ 3258032 Walla Walla 5/30/02 Dieldrin 0.065 NC 3258032 Walla Walla 5/30/02 Heptachlor 0.065 UJ 3258032 Walla Walla 5/30/02 Heptachlor Epoxide 0.065 NC 3258032 Walla Walla 5/30/02 Hexachlorobenzene 0.094 UJ 3258032 Walla Walla 5/30/02 Oxychlordane 0.065 UJ 3258032 Walla Walla 5/30/02 Trans-Chlordane (Gamma) 0.12 J 3258032 Walla Walla 5/30/02 Trans-Nonachlor 0.17 NJ 3258032 Walla Walla 9/11/02 2,4'-DDD 0.067 UJ 2378881 Walla Walla 9/11/02 2,4'-DDE 0.067 UJ 2378881 Walla Walla 9/11/02 2,4'-DDT 0.067 UJ 2378881 Walla Walla 9/11/02 4,4'-DDD 0.067 UJ 2378881 Walla Walla 9/11/02 4,4'-DDE 0.08 J 2378881 Walla Walla 9/11/02 4,4'-DDT 0.067 UJ 2378881 Walla Walla 9/11/02 Cis-Chlordane (Alpha-Chlordane) 0.19 J 2378881

App 28
WWTP Name Date Parameter Result qualifier Sample ID Walla Walla 9/11/02 Cis-Nonachlor 0.067 UJ 2378881 Walla Walla 9/11/02 Dibutylchlorendate 0 NC 2378881 Walla Walla 9/11/02 Dieldrin 0.73 UJ 2378881 Walla Walla 9/11/02 Heptachlor 0.067 UJ 2378881 Walla Walla 9/11/02 Heptachlor Epoxide 0.77 UJ 2378881 Walla Walla 9/11/02 Hexachlorobenzene 0.33 J 2378881 Walla Walla 9/11/02 Oxychlordane 0.067 UJ 2378881 Walla Walla 9/11/02 Total PCBs 0.647 2378881 Walla Walla 9/11/02 Trans-Chlordane (Gamma) 0.16 J 2378881 Walla Walla 9/11/02 Trans-Nonachlor 0.087 J 2378881 Walla Walla 12/2/02 2,4'-DDD 0.069 U 2498958 Walla Walla 12/2/02 2,4'-DDE 0.069 U 2498958 Walla Walla 12/2/02 2,4'-DDT 0.069 U 2498958 Walla Walla 12/2/02 4,4'-DDD 0.069 U 2498958 Walla Walla 12/2/02 4,4'-DDE 0.069 U 2498958 Walla Walla 12/2/02 4,4'-DDT 0.11 UJ 2498958 Walla Walla 12/2/02 Cis-Chlordane (Alpha-Chlordane) 0.12 2498958 Walla Walla 12/2/02 Cis-Nonachlor 0.069 U 2498958 Walla Walla 12/2/02 Dieldrin 0.79 UJ 2498958 Walla Walla 12/2/02 Heptachlor 0.069 U 2498958 Walla Walla 12/2/02 Heptachlor Epoxide 0.069 U 2498958 Walla Walla 12/2/02 Hexachlorobenzene 0.085 UJ 2498958 Walla Walla 12/2/02 Oxychlordane 0.069 U 2498958 Walla Walla 12/2/02 Total PCBs 0.748 2498958 Walla Walla 12/2/02 Trans-Chlordane (Gamma) 0.1 2498958 Walla Walla 12/2/02 Trans-Nonachlor 0.069 U 2498958 Walla Walla 2/24/03 2,4'-DDD 0.066 UJ 3098997 Walla Walla 2/24/03 2,4'-DDE 0.066 UJ 3098997 Walla Walla 2/24/03 2,4'-DDT 0.066 UJ 3098997 Walla Walla 2/24/03 4,4'-DDD 0.066 UJ 3098997 Walla Walla 2/24/03 4,4'-DDE 0.073 J 3098997 Walla Walla 2/24/03 4,4'-DDT 0.093 UJ 3098997 Walla Walla 2/24/03 Cis-Chlordane (Alpha-Chlordane) 0.12 J 3098997 Walla Walla 2/24/03 Cis-Nonachlor 0.066 UJ 3098997 Walla Walla 2/24/03 Dieldrin 0.25 J 3098997 Walla Walla 2/24/03 Heptachlor 0.066 UJ 3098997 Walla Walla 2/24/03 Heptachlor Epoxide 0.066 UJ 3098997 Walla Walla 2/24/03 Hexachlorobenzene 0.096 UJ 3098997 Walla Walla 2/24/03 Oxychlordane 0.066 UJ 3098997 Walla Walla 2/24/03 Total PCBs 0.87 3098997 Walla Walla 2/24/03 Trans-Chlordane (Gamma) 0.086 J 3098997 Walla Walla 2/24/03 Trans-Nonachlor 0.066 UJ 3098997
Note: Ecology's Environmental Information System (EIM) contains the complete PCB aroclor and congener data. U = The analyte was not detected at or above the reported result. J = The analyte was positively identified. The associated numerical result is an estimate. UJ = The analyte was not detected at or above the reported estimated result. NC = Not calculated. NJ = There is evidence that the analyte is present. The associated numerical result is an estimate.

Appendix D-8. Whole Water Pesticide Data for the Walla Walla Drainage.
Site NameSample
No. Date
Upper Mill Creek 2228158 5/29/02 -- -- -- 0.065 U 0.065 U 0.1 UJ 0.065 U 0.065 U 0.065 UJ 0.065 U 0.16 UJ 0.065 UJ 0.16 U 0.16 U 0.065 UUpper Mill Creek 2368890 9/4/02 0.069 U 0.069 U 0.069 U 0.069 U 0.069 U 0.069 U 0.069 U 0.069 U 0.069 U 0.069 U 0.069 UJ 0.069 UJ 0.069 U 0.069 U 0.069 U
Peppers Bridge 2228159 5/29/02 -- -- -- 0.066 U 0.14 0.15 NJ 0.066 U 0.066 U 0.069 UJ 0.066 U 0.16 UJ 0.066 UJ 0.16 U 0.16 U 0.066 UPeppers Bridge 2368885 9/4/02 0.069 U 0.069 U 0.069 U 0.069 U 0.069 U 0.069 U 0.069 U 0.069 U 0.069 U 0.069 U 0.069 UJ 0.069 UJ 0.069 U 0.069 U 0.069 UPeppers Bridge 3058975 1/30/03 0.067 UJ 0.067 UJ 0.1 UJ 0.12 J 1.2 0.55 0.067 UJ 0.067 UJ 0.067 UJ 0.067 UJ 0.067 UJ 0.18 NJ 0.067 UJ 0.067 UJ 0.067 UJPeppers Bridge 3098985 2/25/03 0.067 UJ 0.067 UJ 0.067 UJ 0.067 UJ 0.093 J 0.093 UJ 0.067 UJ 0.067 UJ 0.38 0.067 UJ 0.067 UJ 0.097 UJ 0.067 UJ 0.067 UJ 0.067 UJPeppers Bridge 3138155 3/24/03 0.067 UJ 0.067 UJ 0.067 UJ 0.067 UJ 0.33 0.21 J 0.067 UJ 0.067 UJ 0.11 UJ 0.067 UJ 0.067 UJ 0.097 UJ 0.067 UJ 0.067 UJ 0.067 UJPeppers Bridge 3208155 5/15/03 0.061 UJ 0.061 UJ 0.061 UJ 0.061 UJ 0.098 J 0.085 UJ 0.061 UJ 0.061 UJ 0.061 UJ 0.061 UJ 0.061 UJ 0.089 UJ 0.061 UJ 0.061 UJ 0.061 UJ
Yellowhawk Creek 2228165 5/29/02 -- -- -- 0.14 NJ 0.59 0.26 NJ 0.067 U 0.067 U 0.12 UJ 0.067 U 0.17 UJ 0.067 UJ 0.17 U 0.17 U 0.067 UYellowhawk Creek 2348856 8/22/02 0.063 U 0.063 U 0.063 U 0.24 0.85 0.22 0.12 0.063 U 0.17 UJ 0.063 UJ 0.063 UJ 0.063 UJ 0.063 U 0.089 0.063 UYellowhawk Creek 2368887 9/4/02 0.068 U 0.068 U 0.068 U 0.12 0.41 0.085 0.068 U 0.068 U 0.12 UJ 0.068 U 0.068 UJ 0.068 UJ 0.068 U 0.068 U 0.068 UYellowhawk Creek 2478949 11/19/02 0.064 U 0.064 U 0.064 U 0.09 0.37 0.16 UJ 0.064 U 0.064 U 0.12 0.064 U 0.064 U 0.064 U 0.064 U 0.064 U 0.064 UYellowhawk Creek 2518966 12/17/02 0.069 U 0.069 U 0.069 U 0.087 0.39 0.12 UJ 0.069 U 0.069 U 0.19 0.069 U 0.069 U 0.069 U 0.069 U 0.069 U 0.069 UYellowhawk Creek 3058976 1/30/03 0.077 J 0.097 NJ 0.4 0.33 J 3.8 1.6 0.97 0.16 NJ 4.4 0.067 UJ 0.23 J 0.28 NJ 0.067 UJ 0.81 0.69 NJYellowhawk Creek 3098987 2/25/03 0.069 UJ 0.069 UJ 0.069 UJ 0.069 UJ 0.58 0.28 J 0.14 J 0.069 UJ 0.13 J 0.069 UJ 0.072 NJ 0.1 UJ 0.069 UJ 0.093 J 0.072 NJYellowhawk Creek 3138156 3/24/03 0.067 UJ 0.067 UJ 0.067 UJ 0.067 UJ 0.46 0.29 J 0.3 J 0.067 UJ 0.087 J 0.067 UJ 0.067 UJ 0.097 UJ 0.067 UJ 0.25 J 0.1 NJYellowhawk Creek 3208156 5/15/03 0.063 UJ 0.063 UJ 0.063 UJ 0.069 J 0.49 0.2 J 0.1 NJ 0.063 UJ 0.063 UJ 0.063 UJ 0.063 UJ 0.091 UJ 0.063 UJ 0.069 J 0.063 UJ
Garrison Creek 2228160 5/29/02 -- -- -- 0.19 NJ 0.37 0.065 UJ 0.26 NJ 0.065 UJ -- 0.065 UJ -- 0.065 UJ 0.065 UJ 0.13 NJ 0.11 NJGarrison Creek 2368888 9/4/02 0.068 U 0.068 U 0.068 U 0.14 0.23 0.068 U 0.12 0.068 U 0.33 0.068 U 0.37 UJ 0.068 UJ 0.068 U 0.081 0.071Garrison Creek 3058977 1/30/03 0.066 UJ 0.066 UJ 0.066 UJ 0.086 J 0.24 J 0.093 UJ 0.093 NJ 0.066 UJ 0.12 UJ 0.066 UJ 0.066 UJ 0.096 UJ 0.066 UJ 0.066 UJ 0.16 UJGarrison Creek 3098988 2/25/03 0.067 UJ 0.067 UJ 0.067 UJ 0.11 J 0.31 J 0.093 UJ 0.1 NJ 0.067 UJ 0.11 J 0.067 UJ 0.067 UJ 0.093 UJ 0.067 UJ 0.083 J 0.067 UJGarrison Creek 3138157 3/24/03 0.067 UJ 0.067 UJ 0.067 UJ 0.15 J 0.4 0.13 J 0.15 NJ 0.067 UJ 0.09 J 0.067 UJ 0.067 UJ 0.1 NJ 0.067 UJ 0.093 J 0.13 NJ
Lower Mill Creek 2228157 5/29/02 -- -- -- 0.067 U 0.13 0.15 NJ 0.067 U 0.067 U 0.16 UJ 0.067 U 0.17 UJ 0.067 UJ 0.17 U 0.17 U 0.067 ULower Mill Creek 2368889 9/3/02 0.067 U 0.067 U 0.067 U 0.07 UJ 0.13 0.067 U 0.067 U 0.067 U 0.26 0.067 U 0.067 UJ 0.067 UJ 0.067 U 0.067 U 0.067 ULower Mill Creek 3058978 1/30/03 0.066 UJ 0.066 UJ 0.12 UJ 0.19 J 0.79 0.68 0.089 NJ 0.066 UJ 0.22 J 0.066 UJ 0.066 UJ 0.11 NJ 0.066 UJ 0.079 J 0.096 UJLower Mill Creek 3098989 2/25/03 0.067 UJ 0.067 UJ 0.067 UJ 0.067 UJ 0.09 J 0.093 UJ 0.067 UJ 0.067 UJ 0.1 NJ 0.067 UJ 0.067 UJ 0.097 UJ 0.067 UJ 0.067 UJ 0.067 UJLower Mill Creek 3138158 3/25/03 0.067 UJ 0.067 UJ 0.067 UJ 0.067 UJ 0.077 J 0.093 J 0.067 UJ 0.067 UJ 0.067 UJ 0.067 UJ 0.067 UJ 0.097 UJ 0.067 UJ 0.067 UJ 0.067 UJLower Mill Creek 3208158 5/14/03 0.061 UJ 0.061 UJ 0.061 UJ 0.085 NJ 0.097 J 0.12 J 0.061 UJ 0.061 UJ 0.097 J 0.061 UJ 0.061 UJ 0.088 UJ 0.061 UJ 0.064 J 0.061 UJ
Detour Road 2228156 5/30/02 -- -- -- 0.067 U 0.22 0.11 NJ 0.067 U 0.067 U 0.1 UJ 0.067 U 0.17 UJ 0.067 UJ 0.17 U 0.17 U 0.067 UDetour Road 2368891 9/4/02 0.068 U 0.068 U 0.068 U 0.11 0.27 0.092 0.068 U 0.068 U 0.1 UJ 0.068 U 0.068 UJ 0.068 UJ 0.068 U 0.068 U 0.068 UDetour Road 3058980 1/30/03 0.066 J 0.093 J 0.21 UJ 0.33 2.1 1.5 0.15 NJ 0.066 J 0.3 J 0.066 UJ 0.083 J 0.22 NJ 0.066 UJ 0.13 J 0.14 UJDetour Road 3098991 2/26/03 0.067 UJ 0.067 UJ 0.067 UJ 0.067 UJ 0.19 J 0.093 UJ 0.067 UJ 0.067 UJ 0.067 UJ 0.067 UJ 0.067 UJ 0.097 UJ 0.067 UJ 0.067 UJ 0.067 UJDetour Road 3138159 3/25/03 0.069 UJ 0.069 UJ 0.069 UJ 0.069 UJ 0.25 J 0.17 J 0.069 UJ 0.069 UJ 0.069 UJ 0.069 UJ 0.069 UJ 0.1 UJ 0.069 UJ 0.069 UJ 0.069 UJDetour Road 3208160 5/14/03 0.063 UJ 0.063 UJ 0.063 UJ 0.063 UJ 0.15 J 0.097 J 0.063 UJ 0.063 UJ 0.063 UJ 0.063 UJ 0.063 UJ 0.091 UJ 0.063 UJ 0.063 UJ 0.063 UJ
Dry Creek 2228161 5/29/02 -- -- -- 0.26 NJ 1.7 J 1.8 J 0.067 UJ 0.067 UJ 0.93 NJ 0.067 UJ 0.75 J 0.067 UJ 0.17 UJ 0.17 UJ 0.067 UJDry Creek 2348861 8/21/02 0.068 U 0.068 U 0.068 U 0.068 U 0.081 0.068 U 0.068 U 0.068 U 0.14 UJ 0.068 UJ 0.068 UJ 0.068 UJ 0.068 U 0.068 U 0.068 UDry Creek 2368892 9/3/02 0.071 U 0.071 U 0.071 U 0.071 U 0.071 U 0.071 U 0.071 U 0.071 U 0.075 UJ 0.071 U 0.071 UJ 0.083 UJ 0.071 U 0.071 U 0.071 UDry Creek 2478954 11/19/02 0.065 U 0.065 U 0.065 U 0.065 U 0.065 U 0.065 U 0.065 U 0.065 U 0.065 U 0.065 U 0.065 U 0.088 0.065 U 0.065 U 0.065 UDry Creek 2518971 12/16/02 0.071 U 0.071 U 0.071 U 0.071 U 0.071 U 0.071 U 0.071 U 0.071 U 0.2 0.071 U 0.11 UJ 0.071 U 0.071 U 0.071 U 0.071 UDry Creek 3058981 1/30/03 0.067 UJ 0.083 J 0.083 UJ 0.12 J 0.77 0.26 J 0.067 UJ 0.067 UJ 0.28 J 0.067 UJ 0.26 J 0.54 NJ 0.067 UJ 0.067 UJ 0.077 UJDry Creek 3098992 2/26/03 0.069 UJ 0.069 UJ 0.069 UJ 0.069 UJ 0.18 J 0.097 UJ 0.069 UJ 0.069 UJ 0.069 UJ 0.069 UJ 0.069 UJ 0.1 UJ 0.069 UJ 0.069 UJ 0.069 UJDry Creek 3138160 3/25/03 0.069 UJ 0.069 UJ 0.069 UJ 0.069 UJ 0.29 J 0.14 J 0.069 UJ 0.069 UJ 0.13 J 0.069 UJ 0.12 J 0.23 NJ 0.069 UJ 0.069 UJ 0.069 UJDry Creek 3208161 5/14/03 0.063 UJ 0.063 UJ 0.063 UJ 0.072 NJ 0.12 J 0.13 UJ 0.063 UJ 0.063 UJ 0.12 J 0.063 UJ 0.12 J 0.094 J 0.063 UJ 0.063 UJ 0.063 UJ
Pine Creek 2228155 5/30/02 -- -- -- 0.2 J 0.26 0.17 NJ 0.067 U 0.067 U 0.11 UJ 0.067 U 0.22 J 0.067 UJ 0.17 U 0.17 U 0.067 UPine Creek 2348862 8/21/02 0.067 U 0.067 U 0.067 U 0.073 UJ 0.15 NJ 0.067 U 0.067 U 0.067 U 0.17 UJ 0.067 UJ 0.19 J 0.067 UJ 0.067 U 0.067 U 0.067 UPine Creek 2368893 9/3/02 0.067 UJ 0.067 UJ 0.067 UJ 0.067 UJ 0.13 J 0.067 UJ 0.067 UJ 0.067 UJ 0.47 UJ 0.067 UJ 0.53 UJ 0.067 UJ 0.067 UJ 0.067 UJ 0.067 UJPine Creek 2478955 11/19/02 0.1 UJ 0.067 U 0.067 U 0.12 0.3 0.25 UJ 0.067 U 0.067 U 0.14 0.067 U 0.093 UJ 0.067 U 0.067 U 0.067 U 0.067 UPine Creek 2498955 12/2/02 0.18 UJ 0.063 U 0.14 UJ 0.19 0.3 0.35 UJ 0.063 U 0.063 U 0.13 UJ 0.063 U 0.063 U 0.12 UJ 0.063 U 0.063 U 0.063 UPine Creek 2518972 12/16/02 0.1 0.069 U 0.076 0.17 0.39 0.27 0.069 U 0.069 U 0.2 UJ 0.069 U 0.069 U 0.069 U 0.069 U 0.069 U 0.069 UPine Creek 3058982 1/30/03 0.45 0.21 NJ 0.61 0.75 4.1 10 0.32 J 0.15 NJ 1.4 0.067 UJ 1.5 J 1.8 J 0.083 NJ 0.43 0.35
2,4'
-DD
D
2,4'
-DD
E
2,4'
-DD
T
4,4'
-DD
D
4,4'
-DD
E
4,4'
-DD
T
Cis-
Chl
orda
ne
(Alp
ha-
Chl
orda
ne)
Cis-
Non
achl
or
Oxy
chlo
rdan
e
Tran
s-C
hlor
dane
(G
amm
a)
Tran
s-N
onac
hlor
Die
ldrin
Hep
tach
lor
Hep
tach
lor
Epox
ide
Hex
achl
oro-
benz
ene

Site NameSample
No. Date 2,4'
-DD
D
2,4'
-DD
E
2,4'
-DD
T
4,4'
-DD
D
4,4'
-DD
E
4,4'
-DD
T
Cis-
Chl
orda
ne
(Alp
ha-
Chl
orda
ne)
Cis-
Non
achl
or
Oxy
chlo
rdan
e
Tran
s-C
hlor
dane
(G
amm
a)
Tran
s-N
onac
hlor
Die
ldrin
Hep
tach
lor
Hep
tach
lor
Epox
ide
Hex
achl
oro-
benz
ene
Pine Creek 3098993 2/24/03 0.067 UJ 0.067 UJ 0.067 UJ 0.067 UJ 0.15 J 0.093 UJ 0.067 UJ 0.067 UJ 0.083 J 0.067 UJ 0.11 J 0.097 UJ 0.067 UJ 0.067 UJ 0.067 UJPine Creek 3098994 2/24/03 0.066 UJ 0.066 UJ 0.066 UJ 0.066 UJ 0.14 J 0.093 UJ 0.066 UJ 0.066 UJ 0.066 UJ 0.066 UJ 0.09 J 0.096 UJ 0.066 UJ 0.066 UJ 0.066 UJPine Creek 3138161 3/25/03 0.069 UJ 0.069 UJ 0.069 UJ 0.069 UJ 0.2 J 0.13 J 0.069 UJ 0.069 UJ 0.069 UJ 0.069 UJ 0.097 J 0.1 UJ 0.069 UJ 0.069 UJ 0.069 UJPine Creek 3208162 5/14/03 0.11 UJ 0.063 UJ 0.078 UJ 0.078 J 0.29 J 0.12 J 0.063 UJ 0.063 UJ 0.063 UJ 0.063 UJ 0.072 NJ 0.091 UJ 0.063 UJ 0.063 UJ 0.063 UJ
Touchet River 2228163 5/30/02 -- -- -- 0.067 U 0.14 0.067 U 0.067 U 0.067 U 0.07 UJ 0.067 U 0.033 J 0.067 UJ 0.17 U 0.17 U 0.067 UTouchet River 2248088 6/12/02 -- -- -- 0.092 UJ 0.066 UJ 0.066 UJ 0.066 UJ 0.066 UJ 0.16 UJ 0.066 UJ 0.039 J 0.066 UJ 0.16 UJ 0.16 UJ 0.066 UJTouchet River 2348863 8/21/02 0.064 U 0.064 U 0.064 U 0.064 U 0.077 0.064 U 0.064 U 0.064 U 0.1 UJ 0.064 UJ 0.064 UJ 0.064 UJ 0.064 U 0.064 U 0.064 UTouchet River 2368894 9/3/02 0.067 U 0.067 U 0.067 U 0.067 U 0.11 0.067 U 0.067 U 0.067 U 0.067 U 0.067 U 0.07 UJ 0.067 UJ 0.067 U 0.067 U 0.067 UTouchet River 2478956 11/19/02 0.067 U 0.067 U 0.067 U 0.067 U 0.067 U 0.073 UJ 0.067 U 0.067 U 0.067 U 0.067 U 0.067 U 0.067 U 0.067 U 0.067 U 0.067 UTouchet River 2518973 12/16/02 0.069 U 0.069 U 0.069 U 0.069 U 0.069 U 0.069 U 0.069 U 0.069 U 0.091 UJ 0.069 U 0.069 U 0.069 U 0.069 U 0.069 U 0.069 UTouchet River 3058983 1/30/03 0.067 UJ 0.067 UJ 0.067 UJ 0.067 UJ 0.12 J 0.093 UJ 0.067 UJ 0.067 UJ 0.067 UJ 0.067 UJ 0.067 UJ 0.097 UJ 0.067 UJ 0.067 UJ 0.067 UJTouchet River 3098995 2/24/03 0.067 UJ 0.067 UJ 0.067 UJ 0.067 UJ 0.21 J 0.093 UJ 0.067 UJ 0.067 UJ 0.067 UJ 0.067 UJ 0.067 UJ 0.097 UJ 0.067 UJ 0.067 UJ 0.067 UJTouchet River 3138162 3/24/03 0.069 UJ 0.069 UJ 0.069 UJ 0.069 UJ 0.41 0.12 J 0.069 UJ 0.069 UJ 0.069 UJ 0.069 UJ 0.069 UJ 0.16 NJ 0.069 UJ 0.069 UJ 0.069 UJTouchet River 3208163 5/14/03 0.062 UJ 0.062 UJ 0.062 UJ 0.062 UJ 0.071 J 0.087 UJ 0.062 UJ 0.062 UJ 0.062 UJ 0.062 UJ 0.062 UJ 0.09 UJ 0.062 UJ 0.062 UJ 0.062 UJ
Lower Walla Walla 2228167 5/30/02 -- -- -- 0.063 U 0.28 0.16 UJ 0.063 U 0.063 U 0.063 UJ 0.063 U 0.038 J 0.063 UJ 0.16 U 0.16 U 0.063 ULower Walla Walla 2228168 5/30/02 -- -- -- 0.063 UJ 0.28 J 0.13 NJ 0.063 UJ 0.063 UJ 0.12 UJ 0.063 UJ 0.041 J 0.063 UJ 0.16 UJ 0.16 UJ 0.063 UJLower Walla Walla 2248090 6/12/02 -- -- -- 0.069 NJ 0.18 0.079 UJ 0.063 UJ 0.063 UJ 0.16 UJ 0.063 UJ 0.044 J 0.063 UJ 0.16 UJ 0.16 UJ 0.063 ULower Walla Walla 2348864 8/21/02 0.065 U 0.065 U 0.065 U 0.075 UJ 0.19 0.065 U 0.065 U 0.065 U 0.13 UJ 0.065 UJ 0.068 UJ 0.065 UJ 0.065 U 0.065 U 0.065 ULower Walla Walla 2368895 9/3/02 0.067 U 0.067 U 0.067 U 0.13 0.31 0.067 U 0.067 U 0.067 U 0.08 0.067 U 0.11 UJ 0.067 UJ 0.067 U 0.067 U 0.067 ULower Walla Walla 2478957 11/19/02 0.066 U 0.066 U 0.066 U 0.066 U 0.15 0.1 UJ 0.066 U 0.066 U 0.069 UJ 0.066 U 0.066 U 0.066 U 0.066 U 0.066 U 0.066 ULower Walla Walla 2518974 12/16/02 0.067 U 0.067 U 0.067 U 0.067 0.21 0.097 UJ 0.067 U 0.067 U 0.11 0.067 U 0.067 U 0.067 U 0.067 U 0.067 U 0.067 ULower Walla Walla 3058984 1/30/03 0.066 UJ 0.066 UJ 0.11 UJ 0.13 J 1.2 0.65 0.066 UJ 0.066 UJ 0.3 J 0.066 UJ 0.12 J 0.18 NJ 0.066 UJ 0.066 UJ 0.066 UJLower Walla Walla 3098996 2/24/03 0.069 UJ 0.069 UJ 0.069 UJ 0.069 UJ 0.28 J 0.1 J 0.069 UJ 0.069 UJ 0.076 J 0.069 UJ 0.069 UJ 0.1 UJ 0.069 UJ 0.069 UJ 0.069 UJLower Walla Walla 3138163 3/24/03 0.069 UJ 0.069 UJ 0.069 UJ 0.069 UJ 0.41 0.18 J 0.069 UJ 0.069 UJ 0.069 UJ 0.069 UJ 0.069 UJ 0.11 NJ 0.069 UJ 0.069 UJ 0.069 UJLower Walla Walla 3208164 5/14/03 0.065 UJ 0.065 UJ 0.065 UJ 0.077 UJ 0.24 J 0.097 UJ 0.065 UJ 0.065 UJ 0.065 UJ 0.065 UJ 0.065 UJ 0.094 UJ 0.065 UJ 0.065 UJ 0.065 UJ
E. Little Walla Walla 3099001 2/25/03 0.11 J 0.069 UJ 0.069 UJ 0.66 1.5 0.29 J 0.069 UJ 0.069 UJ 0.21 J 0.069 UJ 0.13 J 0.1 UJ 0.069 UJ 0.086 J 0.069 UJE. Little Walla Walla 3208157 5/15/03 0.11 NJ 0.063 UJ 0.063 UJ 0.38 1.2 0.48 0.069 J 0.063 UJ 0.19 J 0.063 UJ 0.11 J 0.091 UJ 0.063 UJ 0.12 J 0.063 UJE. Little Walla Walla 3208167 5/15/03 0.095 J 0.063 UJ 0.063 UJ 0.38 1.1 0.18 J 0.063 UJ 0.063 UJ 0.18 J 0.063 UJ 0.11 J 0.092 UJ 0.063 UJ 0.098 J 0.063 UJE. Little Walla Walla 3248276 6/9/03 0.066 J 0.063 UJ 0.063 UJ 0.34 J 0.88 0.17 J 0.063 UJ 0.063 UJ 0.23 J 0.063 UJ 0.17 J 0.091 UJ 0.063 UJ 0.063 UJ 0.063 UJE. Little Walla Walla 3368757 9/3/03 0.064 UJ 0.064 UJ 0.064 UJ 0.31 J 0.6 0.09 UJ 0.064 UJ 0.064 UJ 0.16 J 0.064 UJ 0.064 UJ 0.093 UJ 0.064 UJ 0.064 UJ 0.064 UJ
Stone Creek 3099000 2/25/03 0.069 UJ 0.069 UJ 0.069 UJ 0.069 UJ 0.069 UJ 0.097 UJ 0.069 UJ 0.069 UJ 0.069 UJ 0.069 UJ 0.069 UJ 0.1 UJ 0.069 UJ 0.069 UJ 0.069 UJStone Creek 3208159 5/15/03 0.063 UJ 0.063 UJ 0.063 UJ 0.063 UJ 0.063 UJ 0.088 UJ 0.063 UJ 0.063 UJ 0.063 UJ 0.063 UJ 0.063 UJ 0.091 UJ 0.063 UJ 0.063 UJ 0.063 UJ
W. Little Walla Walla 3099002 2/25/03 0.069 UJ 0.069 UJ 0.069 UJ 0.069 UJ 0.36 0.11 J 0.069 UJ 0.069 UJ 0.069 UJ 0.069 UJ 0.11 J 0.1 UJ 0.069 UJ 0.069 UJ 0.069 UJW. Little Walla Walla 3208168 5/15/03 0.062 UJ 0.062 UJ 0.062 UJ 0.062 UJ 0.36 0.087 UJ 0.062 UJ 0.062 UJ 0.062 UJ 0.062 UJ 0.16 NJ 0.09 UJ 0.062 UJ 0.062 UJ 0.062 UJW. Little Walla Walla 3248277 6/9/03 0.063 UJ 0.063 UJ 0.063 UJ 0.11 J 0.29 J 0.088 UJ 0.063 UJ 0.063 UJ 0.063 UJ 0.063 UJ 0.069 NJ 0.091 UJ 0.063 UJ 0.063 UJ 0.063 UJ
Mud Creek 3098999 2/26/03 0.079 NJ 0.071 UJ 0.071 UJ 0.071 UJ 0.71 0.1 UJ 0.071 UJ 0.071 UJ 0.071 UJ 0.071 UJ 0.071 UJ 0.1 UJ 0.071 UJ 0.071 UJ 0.071 UJMud Creek 3208165 5/14/03 0.077 UJ 0.065 UJ 0.065 UJ 0.13 J 0.34 0.09 UJ 0.065 UJ 0.065 UJ 0.081 NJ 0.065 UJ 0.065 UJ 0.094 UJ 0.065 UJ 0.065 UJ 0.065 UJMud Creek 3248274 6/9/03 0.063 UJ 0.063 UJ 0.063 UJ 0.097 J 0.18 J 0.088 UJ 0.063 UJ 0.063 UJ 0.063 UJ 0.063 UJ 0.063 UJ 0.091 UJ 0.063 UJ 0.063 UJ 0.063 UJMud Creek 3368755 9/3/03 0.061 UJ 0.061 UJ 0.061 UJ 0.11 J 0.21 J 0.085 UJ 0.061 UJ 0.061 UJ 0.061 UJ 0.061 UJ 0.061 UJ 0.089 UJ 0.061 UJ 0.061 UJ 0.061 UJ
Gardena Creek 3208166 5/14/03 0.21 UJ 0.063 UJ 0.19 NJ 0.34 J 1.3 0.51 NJ 0.063 UJ 0.063 UJ 0.084 J 0.063 UJ 0.063 UJ 0.094 J 0.063 UJ 0.063 UJ 0.063 UJGardena Creek 3248275 6/9/03 0.31 UJ 0.063 UJ 0.063 UJ 0.27 J 0.49 J 0.23 J 0.063 UJ 0.063 UJ 0.14 J 0.063 UJ 0.094 NJ 0.091 UJ 0.063 UJ 0.063 UJ 0.063 UJ
U = The analyte was not detected at or above the reported result.J = The analyte was positively identified. The associated numerical result is an estimate.UJ = The analyte was not detected at or above the reported estimated result.NJ = There is evidence that the analyte is present. The associated numerical result is an estimate.

Appendix D-9. Pesticide/PCB Data on Walla Walla River Fish Samples Collected in 2002 [ug/Kg, weight wet; detection limit used to calculate total concentrations]
Upper Walla Walla River Samples Collected July 17-18, 2002
Sample ID UPCARP-1 UPSMBS-1 UPBLS-1 UPBLS-2 UPBLS-3 UPBLS-4Sample No. 438181 438182 438183 438184 438185 438186Species Common Smallmouth Bridgelip Bridgelip Bridgelip Bridgelip
Carp Bass Sucker Sucker Sucker SuckerTissue fillet fillet fillet fillet fillet filletLipids (%) 2.0 2.1 3.1 1.9 2.6 2.6
4,4'-DDT 0.79 J 1.4 J 6.5 J 6.6 J 3.7 J 5.6 J4,4'-DDE 35 48 110 100 56 1004,4'-DDD 10 4.8 16 5.8 5.3 4.8Total DDT 46 54 133 112 65 110
2,4'-DDT 0.54 U 0.55 U 0.48 NJ 0.68 0.51 U 0.43 U2,4'-DDE 0.54 UJ 0.55 UJ 0.91 J 0.51 UJ 0.51 UJ 0.57 NJ2,4'-DDD 1.3 0.55 U 2.4 0.73 0.71 0.59
Dieldrin 1.1 0.99 0.80 0.51 0.74 0.75
Heptachlor 0.54 UJ 0.55 UJ 0.46 UJ 0.51 UJ 0.51 UJ 0.43 UJHeptachlor Epoxide 0.54 U 0.55 U 0.46 U 0.51 U 0.51 U 0.43 U
Hexachlorobenzene 1.1 J 0.79 J 0.65 0.51 U 0.51 U 0.43 U
cis-Chlordane 1.5 0.86 1.2 0.76 0.77 NJ 0.83 NJtrans-Chlordane 0.85 0.55 U 0.58 NJ 0.51 U 0.51 U 0.43 Ucis-Nonachlor 1.1 J 0.91 J 1.2 J 0.58 J 0.62 J 0.80 Jtrans-Nonachlor 1.7 2.4 2.6 NJ 2.0 1.5 2.5Oxychlordane 0.54 U 0.77 0.61 0.51 U 0.51 U 0.47Total Chlordane 5.7 5.5 6.2 4.4 3.9 5.0
Toxaphene 17 J 26 J 20 J 12 J 19 J 12 J
PCB-1254 18 NJ 12 18 15 10 31PCB-1260 17 4.6 J 12 5.7 4.9 8.8Total PCBs 35 17 30 21 15 40
Table D-9 page 1

Upper Walla Walla River Samples Collected July 17-18, 2002
Sample ID UPBLS-5 UPNPM-1 UPNPM-2 UPNPM-3 UPNPM-4F UPNPM-4CSample No. 438187 438188 438189 438190 438191 438210Species Bridgelip N. Pike N. Pike N. Pike N. Pike N. Pike
Sucker Minnow Minnow Minnow Minnow MinnowTissue whole fillet fillet fillet fillet carcassLipids (%) 5.5 1.5 1.7 1.7 1.5 5.0
4,4'-DDT 6.6 J 0.54 UJ 0.57 J 0.47 UJ 0.55 U 0.51 UJ4,4'-DDE 160 340 J 260 410 250 8304,4'-DDD 11 12 18 28 11 34Total DDT 178 353 279 438 262 865
2,4'-DDT 0.65 NJ 0.67 NJ 0.99 NJ 0.74 NJ 0.55 U 3.12,4'-DDE 0.87 NJ 1.0 NJ 1.4 NJ 1.8 NJ 0.86 NJ 7.2 NJ2,4'-DDD 1.5 1.1 NJ 1.4 2.2 1.0 3.4
Dieldrin 1.5 1.3 1.6 1.0 0.80 2.1 J
Heptachlor 0.54 UJ 0.54 UJ 0.55 UJ 0.47 UJ 0.55 UJ 0.52 UJHeptachlor Epoxide 0.54 U 0.67 NJ 0.55 U 0.47 U 0.55 U 0.88
Hexachlorobenzene 1.4 J 0.54 UJ 0.63 J 0.87 J 0.55 U 2.7
cis-Chlordane 1.7 2.9 NJ 2.7 NJ 2.6 NJ 1.9 NJ 5.8 NJtrans-Chlordane 1.0 1.6 1.5 1.4 NJ 0.96 NJ 2.5cis-Nonachlor 1.1 J 3.4 J 3.3 J 3.1 J 2.1 J 6.0 Jtrans-Nonachlor 4.2 11 J 9.4 9.6 7.6 30Oxychlordane 0.92 0.61 0.76 0.72 0.57 1.7Total Chlordane 8.9 20 18 17 13 46
Toxaphene 27 J 26 J 20 J 17 J 18 J 39 J
PCB-1254 19 NJ 50 NJ 26 NJ 38 NJ 20 J 120 NJPCB-1260 11 15 15 19 9.5 J 34 NJTotal PCBs 30 65 41 57 30 154
Table D-9 page 2

L
Lower Walla Walla River Samples Collected July 29-31 and Sept. 10-11, 2002
Sample ID WRCAT-1 LWRCAT-1 LWBLS-1 LWBLS-2 LWBLS-3 LWBLS-4Sample No. 438192 duplicate 438193 438194 438195 438196Species Channel Channel Bridgelip Bridgelip Bridgelip Bridgelip
Catfish Catfish Sucker Sucker Sucker SuckerTissue fillet fillet fillet fillet fillet filletLipids (%) 4.2 3.5 2.5 3.5 1.5 1.4
4,4'-DDT 8.3 J 5.5 J 1.7 J 4.4 J 1.5 J 2.1 J4,4'-DDE 220 280 47 110 42 684,4'-DDD 23 17 4.5 6.7 4.2 6.6Total DDT 251 303 53 121 48 77
2,4'-DDT 0.55 U 0.54 U 0.55 U 0.40 U 0.49 U 0.52 U2,4'-DDE 0.82 NJ 1.4 NJ 0.55 UJ 0.55 NJ 0.49 UJ 0.62 J2,4'-DDD 1.2 0.82 0.58 0.94 0.62 0.81
Dieldrin 2.0 2.2 0.55 U 0.78 0.49 U 0.55
Heptachlor 0.55 UJ 0.54 UJ 0.55 UJ 0.40 UJ 0.49 UJ 0.52 UJHeptachlor Epoxide 0.68 NJ 0.54 U 0.55 U 0.65 NJ 0.49 U 0.52 U
Hexachlorobenzene 2.5 1.9 1.1 J 1.7 1.1 J 1.8 J
cis-Chlordane 2.4 1.3 0.55 U 0.80 NJ 0.49 U 0.68trans-Chlordane 1.9 1.1 0.55 U 0.44 NJ 0.49 U 0.52 Ucis-Nonachlor 1.7 J 0.96 NJ 0.55 UJ 0.69 J 0.49 U 0.60 Jtrans-Nonachlor 3.9 4.5 1.1 J 2.5 0.98 UJ 1.7 JOxychlordane 1.1 0.54 U 0.55 U 0.62 0.49 U 0.52 UTotal Chlordane 11 8.4 3.3 5.1 2.9 4.0
Toxaphene 72 J 44 J 13 J 27 J 16 J 23 J
PCB-1254 29 NJ 30 NJ 7.7 13 NJ 5.4 9.9PCB-1260 24 30 3.6 J 9.5 3.1 J 5.6Total PCBs 53 60 11 23 8.5 16
Table D-9 page 3

Lower Walla Walla River Samples Collected July 29-31 and Sept. 10-11, 2002
Sample ID LWBLS-5 LWBLS-5 LWRCARP-1 LWRCARP-1 LWRCARP-2 LWRCARP-3Sample No. 438197 duplicate 438198 duplicate 438199 438200Species Bridgelip Bridgelip Common Common Common Common
Sucker Sucker Carp Carp Carp CarpTissue whole whole fillet fillet fillet filletLipids (%) 4.4 4.5 3.3 3.4 2.4 7.0
4,4'-DDT 2.1 J 4.8 J 1.0 J 1.1 J 0.74 J 0.81 J4,4'-DDE 170 190 420 760 300 9304,4'-DDD 5.4 11 40 100 21 91Total DDT 178 206 461 861 322 1022
2,4'-DDT 0.80 NJ 0.86 NJ 1.1 NJ 1.4 NJ 1.1 NJ 3.3 NJ2,4'-DDE 1.4 J 1.5 J 5.4 J 7.5 J 1.8 NJ 12 NJ2,4'-DDD 0.66 1.5 3.8 4.8 2.9 0.94
Dieldrin 1.0 J 0.94 J 1.2 1.4 1.1 2.9
Heptachlor 0.44 UJ 0.48 UJ 0.54 UJ 0.55 UJ 0.55 UJ 0.49 UJHeptachlor Epoxide 0.44 UJ 1.1 NJ 1.1 NJ 1.4 NJ 0.86 NJ 2.1
Hexachlorobenzene 3.4 J 4.2 5.3 J 6.4 5.4 J 9.5
cis-Chlordane 0.52 1.2 2.4 3.2 1.8 4.8trans-Chlordane 0.44 UJ 0.76 1.5 2.1 1.5 3.9cis-Nonachlor 0.46 J 1.2 J 2.3 J 3.2 J 1.8 J 4.5 Jtrans-Nonachlor 3.7 J 4.2 0.73 11 4.9 16Oxychlordane 0.44 UJ 0.88 0.77 1.0 0.70 1.5Total Chlordane 5.6 8.2 7.7 21 11 31
Toxaphene 26 J 47 J 49 J 53 J 46 J 65 J
PCB-1254 16 NJ 18 NJ 74 NJ 130 29 140 JPCB-1260 11 11 120 220 39 270Total PCBs 27 29 194 350 68 410
Table D-9 page 4

L
Lower Walla Walla River Samples Collected July 29-31 and Sept. 10-11, 2002
Sample ID WRCARP-4 LWRNPM-1 LWRNPM-2 LWRSMB-1 LWRSMB-2F LWRSMB-2FSample No. 438201 438203 438204 438205 438206 duplicateSpecies Common N. Pike N. Pike Smallmouth Smallmouth Smallmouth
Carp Minnow Minnow Bass Bass BassTissue fillet fillet fillet fillet fillet filletLipids (%) 5.6 1.3 1.0 0.89 0.78 0.92
4,4'-DDT 1.4 J 0.54 U 0.55 U 0.55 U 0.53 J 0.58 J4,4'-DDE 530 48 64 26 31 314,4'-DDD 50 2.1 2.5 1.6 2.0 2.8Total DDT 581 51 67 28 34 34
2,4'-DDT 3.2 NJ 0.54 UJ 1.1 UJ 0.55 U 0.50 U 0.51 U2,4'-DDE 6.6 J 0.54 UJ 0.55 UJ 0.55 UJ 0.50 UJ 0.51 UJ2,4'-DDD 6.8 0.54 U 0.55 U 0.55 U 0.50 U 0.51 U
Dieldrin 1.9 0.54 U 0.55 U 0.55 U 0.50 U 0.51 U
Heptachlor 0.51 UJ 0.54 UJ 0.55 UJ 0.55 UJ 0.50 UJ 0.51 UJHeptachlor Epoxide 1.3 NJ 0.54 U 0.55 U 0.55 U 0.50 U 0.51 U
Hexachlorobenzene 5.7 1.2 1.3 J 0.92 0.90 0.90
cis-Chlordane 3.5 0.54 U 0.55 U 0.55 U 0.50 U 0.51 Utrans-Chlordane 2.4 0.54 U 0.55 U 0.55 U 0.50 U 0.51 Ucis-Nonachlor 3.2 J 0.54 U 0.55 U 0.55 U 0.50 U 0.51 Utrans-Nonachlor 8.7 1.4 1.8 0.69 0.79 0.78Oxychlordane 0.95 0.54 U 0.55 U 0.55 U 0.50 U 0.51 UTotal Chlordane 19 3.6 4.0 2.9 2.8 2.8
Toxaphene 60 J 15 J 39 J 9.9 J 7.7 J 8.6 J
PCB-1254 80 7.4 6.2 NJ 3.4 J 5.7 5.7PCB-1260 120 6.5 NJ 44 NJ 5.5 U 2.8 J 2.8 JTotal PCBs 200 14 50 8.9 8.5 8.5
Table D-9 page 5

L
S
Lower Walla Walla River Samples Collected July 29-31 and Sept. 10-11, 2002
Sample ID WRSMB-3 LWRSMB-4 LWRSMB-2CSample No. 438207 438208 438209Species mallmouth Smallmouth Smallmouth
Bass Bass BassTissue fillet fillet carcassLipids (%) 0.97 0.83 6.2
4,4'-DDT 0.55 J 0.51 U 2.0 J4,4'-DDE 25 26 3404,4'-DDD 1.7 2.6 24Total DDT 27 29 366
2,4'-DDT 0.46 U 0.51 U 1.9 NJ2,4'-DDE 0.46 UJ 0.54 J 4.1 NJ2,4'-DDD 0.46 U 0.51 U 3.3
Dieldrin 0.46 U 0.51 U 1.8 NJ
Heptachlor 0.46 UJ 0.51 UJ 0.51 UJHeptachlor Epoxide 0.46 U 0.51 U 1.8
Hexachlorobenzene 0.84 0.70 6.8 J
cis-Chlordane 0.46 U 0.51 U 1.4 NJtrans-Chlordane 0.46 U 0.51 U 0.64cis-Nonachlor 0.46 U 0.51 U 2.2 Jtrans-Nonachlor 0.66 0.64 8.5Oxychlordane 0.46 U 0.51 U 1.9Total Chlordane 2.5 2.7 15
Toxaphene 13 J 9.5 J 58 J
PCB-1254 3.2 J 7.8 68 NJPCB-1260 4.6 U 2.6 J 36Total PCBs 7.8 10 104
U = The analyte was not detected at or above the reported result.J = The analyte was positively identified. The associated numerical result is an estimate.UJ = The analyte was not detected at or above the reported estimated result.NJ = There is evidence that the analyte is present. The associated numerical result is an estimate.
Table D-9 page 6

App 37
Appendix E
Results on Replicate and Split Samples Analyzed for the Walla Walla Chlorinated Pesticide/PCB Field Study

App 38
This page is purposely left blank for duplex printing.
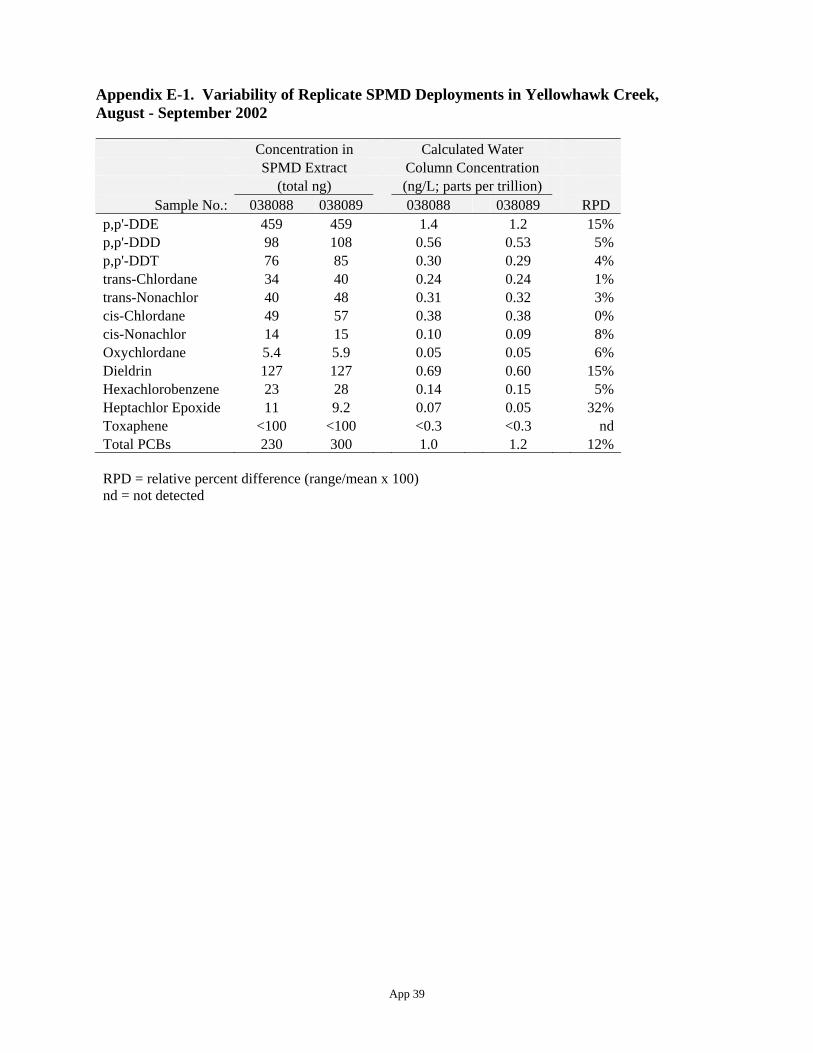
App 39
Appendix E-1. Variability of Replicate SPMD Deployments in Yellowhawk Creek, August - September 2002 Concentration in Calculated Water SPMD Extract Column Concentration (total ng) (ng/L; parts per trillion)
Sample No.: 038088 038089 038088 038089 RPD p,p'-DDE 459 459 1.4 1.2 15% p,p'-DDD 98 108 0.56 0.53 5% p,p'-DDT 76 85 0.30 0.29 4% trans-Chlordane 34 40 0.24 0.24 1% trans-Nonachlor 40 48 0.31 0.32 3% cis-Chlordane 49 57 0.38 0.38 0% cis-Nonachlor 14 15 0.10 0.09 8% Oxychlordane 5.4 5.9 0.05 0.05 6% Dieldrin 127 127 0.69 0.60 15% Hexachlorobenzene 23 28 0.14 0.15 5% Heptachlor Epoxide 11 9.2 0.07 0.05 32% Toxaphene <100 <100 <0.3 <0.3 nd Total PCBs 230 300 1.0 1.2 12% RPD = relative percent difference (range/mean x 100) nd = not detected

App 40
Appendix E-2. Variability of Replicate Water Samples
Location/Date/Parameter Sample Number /
Result RPD Lower Walla Walla R. 5/30/02 228167 228168 4,4'-DDE (ng/L) 0.28 0.28 0%4,4'-DDT (ng/L) <0.16 0.13 >21%Heptachlor epoxide (ng/L) 0.038 0.041 8%TSS (mg/L) 66 66 0%Turbidity (NTU) 18 20 11%TOC (mg/L) 2.4 2.2 9%DOC (mg/L) 1.9 2.3 19%Conductivity (umhos/cm) 87.7 87.5 0% Pine Creek 2/24/03 098993 098994 4,4'-DDE (ng/L) 0.15 0.14 7%Dieldrin (ng/L) 0.083 <0.066 >23%Heptachlor epoxide (ng/L) 0.11 0.09 20%TSS (mg/L) 41 34 19%Turbidity (NTU) 21 20 5%TOC (mg/L) 3.6 3.7 3%DOC (mg/L) 3.9 3.8 3%Conductivity (umhos/cm) 164 163 1% East Little Walla Walla R. 5/15/03 208167 208157 4,4'-DDE (ng/L) 1.1 1.2 9%4,4'-DDD (ng/L) 0.38 0.38 0%4,4'-DDT (ng/L) 0.18 0.48 91%Dieldrin (ng/L) 0.18 0.19 5%Heptachlor epoxide (ng/L) 0.11 0.11 0%Trans-chlordane (ng/L) 0.098 0.12 20%Cis-chlordane (ng/L) <0.063 0.069 >9%TSS (mg/L) 29 29 0%Turbidity (NTU) 13 11 17%TOC (mg/L) 1.4 1.3 7%DOC (mg/L) <1.0 <1.0 ndConductivity (umhos/cm) 97.2 97.3 0% nd = not detected

App 41
Appendix E-3. Variability of Pesticide/PCB Concentrations in Replicate Effluent Samples (ng/L; parts per trillion)
Facility: Walla Walla WWTP College Place WWTP Date: 5/28-29/02 5/29-30/02 5/28-29/02 5/29-30/02
Sample No.: 228030 228032/34* RPD 228031 228033 RPD 4,4'-DDT <0.091 <0.095 nd <0.092 0.093 >1% 4,4'-DDE 0.11 0.072 42% 0.11 0.10 10% 4,4'-DDD 0.065 <0.068 >5% <0.066 <0.066 nd Dieldrin <1.6 <1.7 nd <1.6 <1.7 nd Heptachlor epoxide <1.6 <1.7 nd <1.6 <1.7 nd Hexachlorobenzene <0.094 <0.098 nd <0.095 0.093 >2% cis-Chlordane 0.20 0.16 22% 0.13 <0.066 >65% trans-Chlordane 0.17 0.099 53% <0.066 0.076 nd cis-Nonachlor <0.14 <0.068 nd <0.066 <0.066 nd trans-Nonachlor <0.065 <0.068 nd <0.066 <0.066 nd Oxychlordane <0.065 <0.068 nd <0.066 <0.066 nd Total PCBs 1.0 0.76 27% 2.3 2.7 16% Note: Pesticide reporting limits and concentrations are estimated values (see Data Quality) *Mean of duplicate (split) samples RPD = relative percent difference (range/mean x 100) nd = not detected

App 42
Appendix E-4. Precision of Pesticide/PCB Analyses on Duplicate (Split) Effluent Samples (ng/L; parts per trillion)
Facility: Walla Walla WWTP Date: 5/29-30/02 5/29-30/02
Sample No: 228032 228034 RPD 4,4'-DDT <0.091 <0.095 nd 4,4'-DDE 0.075 <0.068 >10% 4,4'-DDD <0.065 <0.068 nd Dieldrin <1.6 <1.7 nd Heptachlor epoxide <1.6 <1.7 nd Hexachlorobenzene <0.094 <0.098 nd cis-Chlordane 0.17 0.15 13% trans-Chlordane 0.12 0.078 42% cis-Nonachlor <0.065 <0.068 nd trans-Nonachlor <0.065 <0.068 nd Oxychlordane <0.065 <0.068 nd Total PCBs 0.74 0.79 7% Note: Pesticide reporting limits and concentrations are estimated values (see Data Quality) RPD = relative percent difference (range/mean x 100) nd = not detected

App 43
Appendix E-5. Precision of Pesticide/PCB Analyses on Duplicate (Split) Fish Tissue Samples (ug/Kg wet weight; parts per billion)
Species / Tissue: Channel Catfish / Fillet Smallmouth Bass / Fillet Sample No.: 438192 duplicate RPD 438206 duplicate RPD
Lipids (%) 4.2 3.5 19% 0.78 0.92 16% 4,4'-DDT 8.3 5.5 41% 0.53 0.58 9% 4,4'-DDE 220 280 24% 31 31 0% 4,4'-DDD 23 17 30% 2.0 2.8 33% Dieldrin 2.0 2.2 10% <0.50 <0.51 nd Heptachlor Epoxide 0.68 <0.54 >23% 0.50 <0.51 >2% Hexachlorobenzene 2.5 1.9 27% 0.90 0.90 0% cis-Chlordane 2.4 1.3 59% <0.50 <0.51 nd trans-Chlordane 1.9 1.1 53% <0.50 <0.51 nd cis-Nonachlor 1.7 0.96 56% <0.50 <0.51 nd trans-Nonachlor 3.9 4.5 14% 0.79 0.78 1% Oxychlordane 1.1 <0.54 >68% <0.50 <0.51 nd Toxaphene 72 44 48% 7.7 8.6 11% Total PCBs 53 60 12% 8.5 8.5 0%
Species / Tissue: Bridgelip Sucker / Whole Common Carp / Fillet Sample No.: 438197 duplicate RPD 438198 duplicate RPD
Lipids (%) 4.4 4.5 2% 3.3 3.4 1% 4,4'-DDT 2.1 4.8 78% 1.0 1.1 10% 4,4'-DDE 170 190 11% 420 760 58% 4,4'-DDD 5.4 11 68% 40 100 86% Dieldrin 1.0 0.94 6% 1.2 1.4 15% Heptachlor Epoxide <0.44 1.1 >86% 1.1 1.4 24% Hexachlorobenzene 3.4 4.2 21% 5.3 6.4 19% cis-Chlordane 0.52 1.2 79% 2.4 3.2 29% trans-Chlordane <0.44 0.76 >53% 1.5 2.1 33% cis-Nonachlor 0.46 1.2 89% 2.3 3.2 33% trans-Nonachlor 3.7 4.2 13% 0.73 11 175% Oxychlordane <0.44 0.88 67% 0.77 1.0 26% Toxaphene 26 47 58% 49 53 8% Total PCBs 27 29 7% 194 350 57% RPD = relative percent difference (range/mean x 100) nd = not detected

App 44
This page is purposely left blank for duplex printing.

App 45
Appendix F
Flow and Conventional Water Quality Data for the Walla Walla Drainage

App 46
This page is purposely left blank for duplex printing.

App 47
Appendix F. Flow and Conventional Water Quality Data for the Walla Walla Drainage.
Site Name Sample
No. Date Time Conductivity (umhos/cm)
DOC (mg/L)
Flow* (cfs)
Temperature (C°)
TOC (mg/L)
TSS (mg/L)
Turbidity (NTU)
Upper Mill Creek 2208108 5/14/02 8:30 58.8 1.5 -- 7.8 1.6 1 1.6 J Upper Mill Creek 2228158 5/29/02 8:50 52.5 1.6 -- 9.8 2 5 2.7 Upper Mill Creek 2248080 6/11/02 18:10 66.1 1.5 -- 15.8 1.7 2 1.4 Upper Mill Creek 2348859 8/22/02 8:30 88.1 1 U -- 14.4 1 U 1 1.2 Upper Mill Creek 2368890 9/4/02 9:30 87.3 1 U -- 13.6 1 U 2 0.9 Upper Mill Creek 2388907 9/17/02 7:15 87.5 1 U -- 13 1.3 4 1.5 J Upper Mill Creek 2478952 11/19/02 8:30 84.6 1.1 -- 7.5 1.4 2 0.7 J Upper Mill Creek 2498952 12/2/02 12:15 84.4 1.3 -- 2.8 1.3 1 0.5 Upper Mill Creek 2518969 12/17/02 7:50 79.6 2.8 -- 3.5 3.4 3 2.2 Upper Mill Creek 3078989 2/11/03 8:20 67.5 2.4 -- 2 2.8 2 3.5 Upper Mill Creek 3098990 2/25/03 15:05 62.5 2.3 -- 3.8 2.2 3 5 Upper Mill Creek 3108989 3/7/03 8:05 67.7 1.6 -- 4.3 1.7 3 3.2 J Peppers Bridge 2208109 5/14/02 10:30 51.3 1.7 -- 8.9 1.9 2 2.1 J Peppers Bridge 2228159 5/29/02 11:00 44.3 1.9 -- 12.2 2.4 29 6.2 Peppers Bridge 2248081 6/11/02 16:10 61.2 1.6 -- 16.6 1.9 4 1.4 Peppers Bridge 2348854 8/22/02 9:25 109 1 U -- 16.3 1 U 2 1.5 Peppers Bridge 2368885 9/4/02 10:20 111 1 U -- 15.7 1 U 4 1.3 Peppers Bridge 2388902 9/17/02 7:30 106 1.3 -- 14.7 1.5 4 1.8 Peppers Bridge 2478947 11/19/02 9:30 104 1.2 15 9 1.3 2 0.8 J Peppers Bridge 2498947 12/2/02 8:30 88.3 1.7 48 3 1.5 3 1.3 Peppers Bridge 2518964 12/17/02 8:30 81.2 2.5 82 4 2.4 4 1.7 Peppers Bridge 3058975 1/30/03 14:15 52.4 -- 1127 7.2 -- 585 290 J Peppers Bridge 3078985 2/10/03 15:00 69.8 2.3 297 6.5 2.6 9 4.3 Peppers Bridge 3098985 2/25/03 8:04 68.4 2.1 276 1.2 2.1 4 3.3 Peppers Bridge 3108985 3/7/03 8:45 72.9 1.3 186 5 1.4 4 1.8 J Peppers Bridge 3138155 3/24/03 16:15 53.7 -- 530 8.2 -- 32 13 Peppers Bridge 3208155 5/15/03 8:15 60 1.2 205 9.6 1.1 5 2.8

App 48
Site Name Sample
No. Date Time Conductivity (umhos/cm)
DOC (mg/L)
Flow* (cfs)
Temperature (C°)
TOC (mg/L)
TSS (mg/L)
Turbidity (NTU)
Yellowhawk Creek 2208110 5/14/02 11:30 113 1.8 54.4 10.4 2 6 4.8 Yellowhawk Creek 2228164 5/29/02 13:15 109 2 50.7 16 2.2 19 8.2 Yellowhawk Creek 2228165 5/29/02 14:30 112 1.8 -- 15.2 2.2 18 8.3 Yellowhawk Creek 2248082 6/11/02 15:40 126 2.1 45.3 15.2 2.6 19 7.2 Yellowhawk Creek 2348855 8/22/02 10:10 130 1.1 18.5 16.7 1.3 8 4.7 Yellowhawk Creek 2348856 8/22/02 10:45 132 1.2 -- 16.8 1.1 7 4.1 Yellowhawk Creek 2368886 9/4/02 11:00 127 1.2 17.03 15.2 1.2 5 3 Yellowhawk Creek 2368887 9/4/02 12:00 129 1.2 -- 15.4 1.3 5 3 Yellowhawk Creek 2388903 9/17/02 8:45 129 2.3 13.1 15.1 2.7 21 7.8 Yellowhawk Creek 2478948 11/19/02 10:00 125 1.6 21.9 8.8 1.7 5 1.5 J Yellowhawk Creek 2478949 11/19/02 10:30 126 1.6 -- 9 1.6 2 1.4 J Yellowhawk Creek 2498948 12/2/02 9:00 128 1.7 -- 2.6 2 5 2.2 Yellowhawk Creek 2518965 12/17/02 9:00 126 3.2 -- 4.2 3.5 6 2.9 Yellowhawk Creek 2518966 12/17/02 9:20 128 3.1 -- 4.3 3.7 5 2.8 Yellowhawk Creek 3058976 1/30/03 14:30 78.3 -- -- 8.3 -- 777 400 Yellowhawk Creek 3078986 2/10/03 15:30 144 3.1 -- 6.8 3.9 66 25 Yellowhawk Creek 3098986 2/25/03 8:45 124 2.6 -- 0.6 3.1 29 13 Yellowhawk Creek 3098987 2/25/03 9:15 128 2.8 -- 0.7 3.1 25 15 Yellowhawk Creek 3108986 3/7/03 9:10 152 1.8 -- 5.5 2.7 23 9.6 J Yellowhawk Creek 3138156 3/24/03 16:30 101 -- -- 9.7 -- 33 17 Yellowhawk Creek 3208156 5/15/03 8:30 103 1.7 -- 10.5 2.3 29 14 Garrison Creek 2208111 5/14/02 12:45 190 3.1 3.4 14.4 3.7 9 5 Garrison Creek 2228160 5/29/02 16:15 248 4 3.9 21.5 4.3 25 8.6 Garrison Creek 2248084 6/11/02 16:45 210 2.9 2.8 19.9 3.5 18 6.7 Garrison Creek 2348857 8/22/02 11:25 524 4.9 0.1 18.7 4.9 1 1.5 Garrison Creek 2368888 9/4/02 12:20 508 5.4 0.27 18 5.1 1 1.7 Garrison Creek 2388905 9/17/02 9:20 524 6.7 0.06 17.1 7.2 1 U 1.5 Garrison Creek 2478950 11/19/02 10:45 375 5.8 1.62 11.9 5.5 6 3.5 J Garrison Creek 2498950 12/2/02 9:30 281 3.9 2.5 5.9 4.2 13 5.1

App 49
Site Name Sample
No. Date Time Conductivity (umhos/cm)
DOC (mg/L)
Flow* (cfs)
Temperature (C°)
TOC (mg/L)
TSS (mg/L)
Turbidity (NTU)
Garrison Creek 2518967 12/17/02 9:35 291 5.7 1.83 9 8.6 28 11 Garrison Creek 3058977 1/30/03 14:50 194 -- -- 10.2 -- 18 10 J Garrison Creek 3078987 2/10/03 16:10 263 2.9 7.16 10 3.4 13 4.9 Garrison Creek 3098988 2/25/03 10:15 258 2.3 5.44 5.5 2.4 30 14 Garrison Creek 3108987 3/7/03 9:35 257 2.1 5.56 8.6 2.6 24 J 9.1 J Garrison Creek 3138157 3/24/03 17:00 264 -- 8.14 13 -- 23 8.8 Lower Mill Creek 2208107 5/13/02 17:30 116 1.9 99.6 15.3 2.5 3 1.8 J Lower Mill Creek 2228157 5/29/02 17:30 89.1 1.9 -- 18.1 2 7 3.2 Lower Mill Creek 2248085 6/11/02 17:20 136 1.8 -- 19.6 1.8 2 1.2 Lower Mill Creek 2348858 8/22/02 13:15 434 2.1 0.11 19.2 2 1 1.1 Lower Mill Creek 2368889 9/3/02 18:30 423 2.1 0.5 20.1 2 1 U 0.5 U Lower Mill Creek 2388906 9/16/02 16:35 425 1.6 0.82 18 2.1 1 U 0.5 U Lower Mill Creek 2478951 11/19/02 11:40 306 2.1 15.56 10.8 2.1 1 U 0.5 U Lower Mill Creek 2498951 12/2/02 10:45 325 2.3 13.49 5.6 2.6 1 U 0.5 U Lower Mill Creek 2518968 12/16/02 15:40 170 3.6 -- 9.1 4.1 3 1.8 Lower Mill Creek 3058978 1/30/03 15:10 61.3 -- -- 8 -- 465 230 J Lower Mill Creek 3078988 2/11/03 9:35 130 2.6 -- 3.7 3.1 4 4.4 Lower Mill Creek 3098989 2/25/03 17:00 102 2.4 -- 4.9 2.3 4 5.4 Lower Mill Creek 3108988 3/6/03 16:45 131 1.9 -- 7.3 2 2 2.4 J Lower Mill Creek 3138158 3/25/03 7:50 83.3 -- -- 6.9 -- 7 5.8 Lower Mill Creek 3208158 5/14/03 16:45 94.3 1.9 -- 16.4 1.8 7 3.3 Detour Road 2208106 5/13/02 15:45 93.2 1.8 -- 13.8 2.1 4 4.2 J Detour Road 2228156 5/30/02 7:30 70.4 1.6 -- 12.1 2.1 32 9.7 Detour Road 2248083 6/12/02 9:20 122 1.6 -- 15.3 1.9 6 2 Detour Road 2348860 8/22/02 14:20 138 1.3 -- 20.3 1.2 3 2.1 Detour Road 2368891 9/4/02 13:15 144 1.3 34.52 17.5 1.5 3 1.9 Detour Road 2388908 9/16/02 16:10 133 1 -- 17.2 1.4 4 1.8 Detour Road 2478953 11/19/02 12:30 221 2.4 -- 10.2 2.3 1 0.7 Detour Road 2498953 12/2/02 11:30 210 2.5 -- 4.2 2 1 0.9

App 50
Site Name Sample
No. Date Time Conductivity (umhos/cm)
DOC (mg/L)
Flow* (cfs)
Temperature (C°)
TOC (mg/L)
TSS (mg/L)
Turbidity (NTU)
Detour Road 2518970 12/16/02 13:07 150 3 -- 8.6 3.2 9 3.4 Detour Road 3058980 1/30/03 15:20 64.6 -- -- 7.8 -- 785 350 J Detour Road 3078990 2/10/03 16:55 121 3 -- 6.8 3.3 17 7.6 Detour Road 3098991 2/26/03 11:15 107 2 -- 3.6 2.1 6 5.7 Detour Road 3108990 3/6/03 16:10 123 1.5 -- 7.3 1.8 18 4.5 J Detour Road 3138159 3/25/03 8:30 80.2 -- -- 6.9 -- 28 13 Detour Road 3208160 5/14/03 17:30 97.5 1.6 -- 16.2 2.4 11 5.3 Detour Road 3228271 5/30/03 12:24 140 1.2 -- 16.9 1.3 6 2 J Detour Road 3248271 6/9/03 13:15 189 1.7 -- 22.4 1.9 4 2.2 Dry Creek 2208112 5/14/02 14:30 271 3.2 14.9 15.8 3.3 5 4.6 Dry Creek 2228161 5/29/02 19:15 265 4.3 11.6 20.2 19 250 550 Dry Creek 2248086 6/12/02 11:15 377 2.5 7.2 17.3 2.8 18 14 Dry Creek 2348861 8/21/02 16:15 637 1.8 0.29 15.9 1.7 1 2.1 Dry Creek 2368892 9/3/02 17:15 621 1.7 0.26 15.6 1.9 1 1.3 Dry Creek 2388909 9/16/02 15:20 650 1.8 0.98 14.8 2 2 1.7 Dry Creek 2478954 11/19/02 13:10 614 2.8 0.71 12 2.7 1 U 1.4 Dry Creek 2498954 12/2/02 16:00 612 4 1.29 -- 2.9 2 1.9 Dry Creek 2518971 12/16/02 14:34 423 4.8 -- 9.2 5.1 4 J 4.4 Dry Creek 3058981 1/30/03 16:55 135 -- -- -- -- 583 310 J Dry Creek 3078991 2/11/03 10:30 255 3.9 31.59 E 2.9 3.8 41 25 Dry Creek 3098992 2/26/03 9:10 197 2.8 -- 0.9 2.7 50 28 Dry Creek 3108991 3/6/03 15:45 254 2.4 -- 7 2.6 28 18 J Dry Creek 3138160 3/25/03 9:10 161 -- -- 8.4 -- 84 37 Dry Creek 3208161 5/14/03 16:05 231 2.5 -- 17 3 18 10 Pine Creek 2208105 5/13/02 14:00 201 2.6 15.1 15.7 2.6 6 7.2 J Pine Creek 2228155 5/30/02 10:00 330 3.4 5 19.7 4.2 12 11 Pine Creek 2248087 6/12/02 11:45 224 2.3 15.5 18.4 2.6 12 9.2 Pine Creek 2348862 8/21/02 15:00 1770 4.8 0.1 21.7 4.9 6 5.4 Pine Creek 2368893 9/3/02 16:15 1840 5.5 0.02 21.3 6 11 3.1

App 51
Site Name Sample
No. Date Time Conductivity (umhos/cm)
DOC (mg/L)
Flow* (cfs)
Temperature (C°)
TOC (mg/L)
TSS (mg/L)
Turbidity (NTU)
Pine Creek 2388910 9/16/02 14:15 1800 5.1 -- 17.9 5.6 9 9.2 Pine Creek 2478955 11/19/02 16:20 256 2.9 3.02 8.4 2.9 2 2.9 Pine Creek 2498955 12/2/02 14:45 266 4.7 13.8 -- 4 26 14 Pine Creek 2518972 12/16/02 13:30 174 3.9 20.37 8.6 7 145 J 140 Pine Creek 3058982 1/30/03 16:35 130 -- -- -- -- 3700 2400 J Pine Creek 3078992 2/11/03 11:20 236 4.6 37.02 4.3 4.2 27 17 Pine Creek 3098993 2/24/03 16:20 164 3.9 57.54 2.8 3.6 41 21 J Pine Creek 3098994 2/24/03 16:20 163 3.8 -- -- 3.7 34 20 J Pine Creek 3108992 3/6/03 14:50 243 3.5 31.22 7.1 4.4 419 J 160 J Pine Creek 3138161 3/25/03 9:50 135 -- 97.89 E 8.1 -- 55 27 Pine Creek 3208162 5/14/03 15:15 179 2.6 26.9 E 17.7 4.3 14 11 Touchet River 2208113 5/14/02 16:00 85 3 -- 16.7 3.3 27 6.6 Touchet River 2228162 5/30/02 13:00 68.6 2.5 -- 17.8 2.6 28 10 Touchet River 2228163 5/30/02 14:05 69.9 2.4 -- 18.9 2.8 42 12 Touchet River 2248088 6/12/02 12:25 88.6 2 -- 19.6 2.2 11 5.1 Touchet River 2348863 8/21/02 14:15 179 2.6 -- 19.9 2.5 4 2.8 Touchet River 2368894 9/3/02 15:00 174 2.7 -- 20.5 2.9 8 3.3 Touchet River 2388911 9/16/02 14:05 169 2.2 -- 17.2 2.4 1 1.3 Touchet River 2478956 11/19/02 15:45 119 2.2 86 8.6 2.2 2 1.7 Touchet River 2498956 12/2/02 14:00 118 1.9 58 -- 1.9 2 1.3 Touchet River 2518973 12/16/02 13:00 106 2.6 116 8.5 3.7 9 J 5.2 Touchet River 3058983 1/30/03 16:15 78.7 -- 546 6.8 -- 102 32 J Touchet River 3078993 2/11/03 12:40 105 3.2 286 4.1 3.4 84 29 Touchet River 3098995 2/24/03 15:15 85.1 2.9 500 3.8 3.3 99 33 J Touchet River 3108993 3/6/03 14:10 107 2.1 247 7 2.2 33 15 J Touchet River 3138162 3/24/03 14:40 77.1 -- 813 8.9 -- 187 72 Touchet River 3208163 5/14/03 13:50 98.1 1.8 216 17.7 3.1 15 6.3 Touchet River 3228272 5/30/03 11:30 106 1.6 133 20.5 1.8 13 3.2 J Touchet River 3248272 6/9/03 12:45 128 2.4 49 23.5 2.2 28 7.7

App 52
Site Name Sample
No. Date Time Conductivity (umhos/cm)
DOC (mg/L)
Flow* (cfs)
Temperature (C°)
TOC (mg/L)
TSS (mg/L)
Turbidity (NTU)
Lower Walla Walla 2208114 5/14/02 17:15 117 2.8 -- 14.4 2.9 29 8.8 Lower Walla Walla 2228166 5/30/02 15:25 88.1 2.2 -- 17 2.7 87 22 Lower Walla Walla 2228167 5/30/02 16:25 87.7 1.9 -- 17.3 2.4 66 18 Lower Walla Walla 2228168 5/30/02 16:25 87.5 2.3 -- 2.2 66 20 Lower Walla Walla 2248089 6/11/02 12:15 140 2.5 -- 18.1 2.8 19 7.6 Lower Walla Walla 2248090 6/12/02 13:00 146 1.8 -- 20.9 1.9 7 4.7 Lower Walla Walla 2348864 8/21/02 13:30 608 2.8 -- 21.1 2.9 2 2 Lower Walla Walla 2368895 9/3/02 14:00 498 3.1 -- 20.2 3.5 12 5.7 Lower Walla Walla 2388912 9/16/02 13:30 358 2.6 -- 17.5 3 2 2.4 Lower Walla Walla 2478957 11/19/02 14:20 257 2.8 -- 9 2.9 9 4.6 Lower Walla Walla 2498957 12/3/02 9:15 252 2.5 -- -- 2.3 3 2.5 Lower Walla Walla 2518974 12/16/02 12:30 170 3.2 -- 8.9 3.7 17 J 11 J Lower Walla Walla 3058984 1/30/03 16:00 93.1 -- -- 7.5 -- 405 210 J Lower Walla Walla 3078994 2/10/03 13:15 144 3.1 -- 5.2 3.1 93 27 Lower Walla Walla 3098996 2/24/03 14:15 109 3.8 -- 3.8 2.9 82 28 J Lower Walla Walla 3108994 3/6/03 13:40 155 1.9 -- 7 2 46 14 J Lower Walla Walla 3138163 3/24/03 13:50 86.2 -- -- 7.8 -- 190 J 63 Lower Walla Walla 3208164 5/14/03 13:10 126 2.2 -- 16 5 36 10 Lower Walla Walla 3228273 5/30/03 11:20 173 1.6 -- 21.3 1.9 21 7.1 J Lower Walla Walla 3248273 6/9/03 12:15 303 2.2 -- 21.3 2.5 18 7.6 E. Little Walla Walla 3099001 2/25/03 12:15 108 1.2 15.41 7.3 1 U 38 15 E. Little Walla Walla 3208167 5/15/03 9:50 97.2 1 U 12.3 E 10.7 1.4 29 13 E. Little Walla Walla 3208157 5/15/03 9:50 97.3 1 U -- -- 1.3 29 11 E. Little Walla Walla 3228276 5/30/03 13:00 94.9 1 U 2.1 E 13.3 1.2 40 J 13 J E. Little Walla Walla 3248276 6/9/03 14:55 93 1.3 1.8 E 19.3 1.8 24 9 E. Little Walla Walla 3368757 9/3/03 13:25 98.5 1.9 10 E 16.1 1.5 6 2.2 Stone Creek 3099000 2/25/03 11:05 406 3.4 2.74 4.9 3.6 1 0.9 Stone Creek 3208159 5/15/03 9:20 387 2.6 2 E 13.8 2.6 2 1.2 Stone Creek 3228278 5/30/03 12:50 416 2.6 0.8 E 16.5 3.2 4 1.4 J

App 53
Site Name Sample
No. Date Time Conductivity (umhos/cm)
DOC (mg/L)
Flow* (cfs)
Temperature (C°)
TOC (mg/L)
TSS (mg/L)
Turbidity (NTU)
W. Little Walla Walla 3099002 2/25/03 15:40 261 1.8 5.48 6.7 1.7 15 9.1 W. Little Walla Walla 3208168 5/15/03 10:00 203 1.7 5 E 13.7 2.1 8 5.6 W. Little Walla Walla 3228277 5/30/03 12:35 261 2.5 1.25 E 17.8 3.1 7 3.5 J W. Little Walla Walla 3248277 6/9/03 15:20 265 3.4 1.15 E 23.4 3.6 7 4.2 Mud Creek 3098999 2/26/03 10:00 695 3.6 0.65 0.9 3.9 88 45 Mud Creek 3208165 5/14/03 15:45 379 5 1.2 E 22.2 5.3 9 6.2 Mud Creek 3228274 5/30/03 13:30 356 3.7 2 E 19.8 4.3 5 4.1 J Mud Creek 3248274 6/9/03 15:40 346 5.4 0.8 E 27.2 5.5 3 2.4 Mud Creek 3368755 9/3/03 12:30 270 3.6 0.91 19.2 3.2 5 4 Gardena Creek 3208166 5/14/03 14:45 85.2 1.7 9.6 E 20.5 2.2 80 32 Gardena Creek 3228275 5/30/03 11:55 92 1.1 4 E 18.2 1.7 77 J 28 J Gardena Creek 3248275 6/9/03 16:10 136 2.4 0.7 E 27.3 2.7 13 11 * = Flow data from present study and Ecology's Stream Hydrology Unit E = The reported result is an estimate. J = The analyte was positively identified. The associated numerical result is an estimate. U = The analyte was not detected at or above the reported result.

App 54
This page is purposely left blank for duplex printing.

App 55
Appendix G
Conventional Data for Final Effluent from the College Place and Walla Walla WWTPs

App 56
This page is purposely left blank for duplex printing.

App 57
Appendix G. Conventional Data for Final Effluent from the College Place and Walla Walla WWTPs.
Facility Date Parameter Result qualifier Unit Sample ID College Place 5/29/02 Flow* 1.096 MGD – College Place 5/29/02 Conductivity 404 umhos/cm 2228031 College Place 5/29/02 Total Suspended Solids 17 mg/L 2228031 College Place 5/30/02 Conductivity 423 umhos/cm 2228033 College Place 5/30/02 Total Suspended Solids 20 mg/L 2228033 College Place 9/10/02 Flow 0.80 MGD – College Place 9/11/02 Conductivity 516 umhos/cm 2378882 College Place 9/11/02 Total Organic Carbon 6.1 mg/L 2378882 College Place 9/11/02 Total Suspended Solids 8 J mg/L 2378882 College Place 12/2/02 Flow 0.893 MGD – College Place 12/2/02 Conductivity 370 umhos/cm 2498959 College Place 12/2/02 Total Suspended Solids 6 mg/L 2498959 College Place 2/24/03 Flow 1.269 MGD – College Place 2/24/03 Conductivity 397 umhos/cm 3098998 College Place 2/24/03 Total Suspended Solids 1 mg/L 3098998 College Place 3/24/03 Conductivity 409 umhos/cm 3138164 College Place 3/24/03 Total Suspended Solids 1 mg/L 3138164 College Place 3/24/03 Turbidity 2.9 NTU 3138164 Walla Walla 5/29/02 Flow 4.989 MGD – Walla Walla 5/29/02 Conductivity 372 umhos/cm 2228030 Walla Walla 5/29/02 Conductivity 366 umhos/cm 2228034 Walla Walla 5/29/02 Total Suspended Solids 1 U mg/L 2228030 Walla Walla 5/29/02 Total Suspended Solids 1 U mg/L 2228034 Walla Walla 5/30/02 Conductivity 384 umhos/cm 2228032 Walla Walla 5/30/02 Total Suspended Solids 1 U mg/L 2228032 Walla Walla 9/10/02 Flow 3.95 MGD – Walla Walla 9/11/02 Conductivity 393 umhos/cm 2378881 Walla Walla 9/11/02 Total Organic Carbon 4.3 mg/L 2378881 Walla Walla 9/11/02 Total Suspended Solids 1 U mg/L 2378881 Walla Walla 12/2/02 Flow 4.661 MGD – Walla Walla 12/2/02 Conductivity 305 umhos/cm 2498958 Walla Walla 12/2/02 Total Suspended Solids 1 U mg/L 2498958 Walla Walla 2/24/03 Flow 6.362 MGD – Walla Walla 2/24/03 Conductivity 302 umhos/cm 3098997 Walla Walla 2/24/03 Total Suspended Solids 1 U mg/L 3098997
* = Daily averages as reported by the WWTPs. U = The analyte was not detected at or above the reported result. J = The analyte was positively identified. The associated numerical result is an estimate.

App 58
This page is purposely left blank for duplex printing.

App 59
Appendix H
DDE, TSS, and Turbidity Data on Whole Water Samples Collected in the Walla Walla Drainage
May 2002 - September 2003

App 60
This page is purposely left blank for duplex printing.

App 61
Appendix H. DDE, TSS, and Turbidity Data on Whole Water Samples Collected in the Walla Walla Drainage, May 2002 - September 2003. 4,4'-DDE TSS Turbidity
Location Date Sample No. (ng/L) (mg/L) (NTU) Upper Walla Walla R. @ Peppers Bridge 5/29/2002 2228159 0.14 29 6.2 Upper Walla Walla R. @ Peppers Bridge 9/4/2002 2368885 <0.069 4 1.3 Upper Walla Walla R. @ Peppers Bridge 1/30/2003 3058975 1.2 585 290 Upper Walla Walla R. @ Peppers Bridge 2/25/2003 3098985 0.093 4 3.3 Upper Walla Walla R. @ Peppers Bridge 3/24/2003 3138155 0.33 32 13 Upper Walla Walla R. @ Peppers Bridge 5/15/2003 3208155 0.098 5 2.8 Yellowhawk Creek 5/15/2003 2208110 0.49 29 4.8 Yellowhawk Creek 5/29/2002 2228164 0.59 18 8.2 Yellowhawk Creek 8/22/2002 2348855 0.85 7 4.7 Yellowhawk Creek 9/4/2002 2368886 0.41 5 3 Yellowhawk Creek 11/19/2002 2478948 0.37 2 1.5 Yellowhawk Creek 12/17/2002 2518965 0.39 5 2.9 Yellowhawk Creek 1/30/2003 3058976 3.8 777 400 Yellowhawk Creek 2/25/2003 3098987 0.58 25 15 Yellowhawk Creek 3/24/2003 3138156 0.46 33 17 East Little Walla Walla River 2/25/2003 3099001 1.5 38 15 East Little Walla Walla River 5/15/2003 3208157 1.2 29 12 East Little Walla Walla River 6/9/2003 3248276 0.88 24 9 East Little Walla Walla River 9/3/2003 3368757 0.6 6 2.2 Stone Creek 2/25/2003 3099000 <0.069 <1 0.9 Stone Creek 5/15/2003 3208159 <0.063 <2 1.2 Garrison Creek 5/29/2002 2228160 0.37 25 8.6 Garrison Creek 9/4/2002 2368888 0.23 1 1.7 Garrison Creek 1/30/2003 3058977 0.24 18 10 Garrison Creek 2/25/2003 3098988 0.31 30 14 Garrison Creek 3/24/2003 3138157 0.4 23 8.8 West Little Walla Walla River 2/25/2003 3099002 0.36 15 9.1 West Little Walla Walla River 5/15/2003 3208168 0.36 8 5.6 West Little Walla Walla River 6/9/2003 3248277 0.29 7 4.2 Upper Mill Creek 5/29/2002 2228158 <0.065 5 2.7 Upper Mill Creek 9/4/2002 2368890 <0.069 2 0.9 Mill Creek @ Mouth 5/29/2002 2228157 0.13 7 3.2 Mill Creek @ Mouth 9/3/2002 2368889 0.13 <1 <0.5 Mill Creek @ Mouth 1/30/2003 3058978 0.79 465 230 Mill Creek @ Mouth 2/25/2003 3098989 0.09 4 5.4 Mill Creek @ Mouth 3/25/2003 3138158 0.077 7 5.8 Mill Creek @ Mouth 5/14/2003 3208158 0.097 7 3.3 Middle Walla Walla R. @ Detour Rd 5/30/2002 2228156 0.22 32 9.7 Middle Walla Walla R. @ Detour Rd 9/4/2002 2368891 0.27 3 1.9 Middle Walla Walla R. @ Detour Rd 1/30/2003 3058980 2.1 785 350 Middle Walla Walla R. @ Detour Rd 2/26/2003 3098991 0.19 6 5.7 Middle Walla Walla R. @ Detour Rd 3/25/2003 3138159 0.25 28 13 Middle Walla Walla R. @ Detour Rd 5/14/2003 3208160 0.15 11 5.3
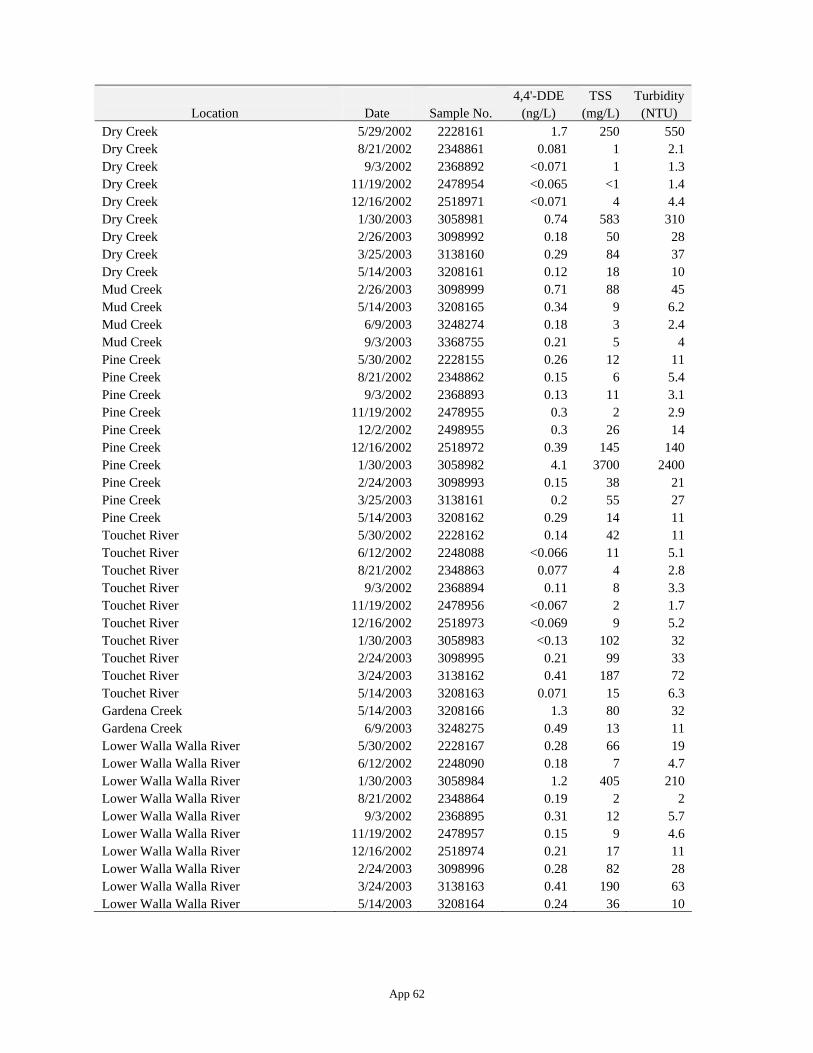
App 62
4,4'-DDE TSS Turbidity Location Date Sample No. (ng/L) (mg/L) (NTU)
Dry Creek 5/29/2002 2228161 1.7 250 550 Dry Creek 8/21/2002 2348861 0.081 1 2.1 Dry Creek 9/3/2002 2368892 <0.071 1 1.3 Dry Creek 11/19/2002 2478954 <0.065 <1 1.4 Dry Creek 12/16/2002 2518971 <0.071 4 4.4 Dry Creek 1/30/2003 3058981 0.74 583 310 Dry Creek 2/26/2003 3098992 0.18 50 28 Dry Creek 3/25/2003 3138160 0.29 84 37 Dry Creek 5/14/2003 3208161 0.12 18 10 Mud Creek 2/26/2003 3098999 0.71 88 45 Mud Creek 5/14/2003 3208165 0.34 9 6.2 Mud Creek 6/9/2003 3248274 0.18 3 2.4 Mud Creek 9/3/2003 3368755 0.21 5 4 Pine Creek 5/30/2002 2228155 0.26 12 11 Pine Creek 8/21/2002 2348862 0.15 6 5.4 Pine Creek 9/3/2002 2368893 0.13 11 3.1 Pine Creek 11/19/2002 2478955 0.3 2 2.9 Pine Creek 12/2/2002 2498955 0.3 26 14 Pine Creek 12/16/2002 2518972 0.39 145 140 Pine Creek 1/30/2003 3058982 4.1 3700 2400 Pine Creek 2/24/2003 3098993 0.15 38 21 Pine Creek 3/25/2003 3138161 0.2 55 27 Pine Creek 5/14/2003 3208162 0.29 14 11 Touchet River 5/30/2002 2228162 0.14 42 11 Touchet River 6/12/2002 2248088 <0.066 11 5.1 Touchet River 8/21/2002 2348863 0.077 4 2.8 Touchet River 9/3/2002 2368894 0.11 8 3.3 Touchet River 11/19/2002 2478956 <0.067 2 1.7 Touchet River 12/16/2002 2518973 <0.069 9 5.2 Touchet River 1/30/2003 3058983 <0.13 102 32 Touchet River 2/24/2003 3098995 0.21 99 33 Touchet River 3/24/2003 3138162 0.41 187 72 Touchet River 5/14/2003 3208163 0.071 15 6.3 Gardena Creek 5/14/2003 3208166 1.3 80 32 Gardena Creek 6/9/2003 3248275 0.49 13 11 Lower Walla Walla River 5/30/2002 2228167 0.28 66 19 Lower Walla Walla River 6/12/2002 2248090 0.18 7 4.7 Lower Walla Walla River 1/30/2003 3058984 1.2 405 210 Lower Walla Walla River 8/21/2002 2348864 0.19 2 2 Lower Walla Walla River 9/3/2002 2368895 0.31 12 5.7 Lower Walla Walla River 11/19/2002 2478957 0.15 9 4.6 Lower Walla Walla River 12/16/2002 2518974 0.21 17 11 Lower Walla Walla River 2/24/2003 3098996 0.28 82 28 Lower Walla Walla River 3/24/2003 3138163 0.41 190 63 Lower Walla Walla River 5/14/2003 3208164 0.24 36 10