A Thermodynamic Model for the Solubility of Barite and Celestite
23
Ž . Chemical Geology 153 1999 187–209 A thermodynamic model for the solubility of barite and celestite in electrolyte solutions and seawater to 2008C and to 1 kbar Christophe Monnin ) CNRS r UniÕersite Paul Sabatier, Laboratoire de Geochimie, 38 rue des Trente-Six Ponts, 31400 Toulouse, France ´ ´ Received 24 December 1997; accepted 17 September 1998 Abstract This paper describes a model for barite and celestite solubilities in the Na–K–Ca–Mg–Ba–Sr–Cl–SO –H O system to 4 2 2008C and to 1 kbar. It is based on Pitzer’s ion interaction model for the thermodynamic properties of the aqueous phase and on values of the solubility products of the solids revised in this work. It is shown how barite and celestite solubilities in electrolyte solutions can be accurately predicted as a function of temperature and pressure from previously determined Ž . Pitzer’s parameters. The equilibrium constant for the BaSO aq ion pair dissociation reaction is calculated from recently 4 reported barite solubility in Na SO solutions from 0 to 808C. Pressure corrections are evaluated through partial molal 2 4 volume calculations and are partially validated by comparing model predictions to measured barite and celestite solubilities in pure water to 1 kbar and in NaCl solutions to 500 bars. The model is then used to investigate the tendency of ion pairing of Ca, Sr and Ba with sulfate in seawater. Finally, the activity coefficient of aqueous barium sulfate in seawater is calculated for temperature, pressure and salinity values found in the ocean and compared to published values. q 1999 Elsevier Science B.V. All rights reserved. Keywords: Aqueous solutions; Barium sulfate; Strontium sulfate; Activity coefficients; Seawater; Thermodynamic properties 1. Introduction The question of an eventual control of the barium concentration in seawater by an equilibrium with Ž . solid barium sulfate barite can be addressed through the calculation of the activity coefficient of aqueous BaSO as well as the barite solubility product at 4 oceanic conditions. This has been done by Church Ž . and Wolgemuth 1972 who used an aqueous solu- tion model based on the ion pairing phenomenology along with stability constants of aqueous species available at that time. This water–rock interaction ) Fax: q33-561520544; E-mail:[email protected] problem can be reconsidered in light of the recent development of thermodynamic models of aqueous electrolyte solutions based on Pitzer’s ion interaction approach, along with the wealth of data on Ba distribution in the oceans. Pitzer’s formalism has allowed the construction of accurate solubility mod- els for systems including the major species of natural Ž . waters see Weare, 1987; Pitzer, 1991, for reviews . Ž . After the landmark paper of Harvie et al. 1984 for the Na–K–Ca–Mg–H–Cl–SO –HCO –CO –CO – 4 3 3 2 H O system at 258C and 1 bar, efforts were made at 2 extending such models to elevated temperatures ŽPabalan and Pitzer, 1987; Greenberg and Moller, . Ž 1989, among others and pressures Monnin, 1989, 0009-2541r99r$ - see front matter q 1999 Elsevier Science B.V. All rights reserved. Ž . PII: S0009-2541 98 00171-5
Transcript of A Thermodynamic Model for the Solubility of Barite and Celestite

Ž .Chemical Geology 153 1999 187–209
A thermodynamic model for the solubility of barite and celestite
in electrolyte solutions and seawater to 2008C and to 1 kbar
Christophe Monnin )
CNRSrUniÕersite Paul Sabatier, Laboratoire de Geochimie, 38 rue des Trente-Six Ponts, 31400 Toulouse, France´ ´
Received 24 December 1997; accepted 17 September 1998
Abstract
This paper describes a model for barite and celestite solubilities in the Na–K–Ca–Mg–Ba–Sr–Cl–SO –H O system to4 2
2008C and to 1 kbar. It is based on Pitzer’s ion interaction model for the thermodynamic properties of the aqueous phase and
on values of the solubility products of the solids revised in this work. It is shown how barite and celestite solubilities in
electrolyte solutions can be accurately predicted as a function of temperature and pressure from previously determinedŽ .Pitzer’s parameters. The equilibrium constant for the BaSO aq ion pair dissociation reaction is calculated from recently4
reported barite solubility in Na SO solutions from 0 to 808C. Pressure corrections are evaluated through partial molal2 4
volume calculations and are partially validated by comparing model predictions to measured barite and celestite solubilities
in pure water to 1 kbar and in NaCl solutions to 500 bars. The model is then used to investigate the tendency of ion pairing
of Ca, Sr and Ba with sulfate in seawater. Finally, the activity coefficient of aqueous barium sulfate in seawater is calculated
for temperature, pressure and salinity values found in the ocean and compared to published values. q 1999 Elsevier Science
B.V. All rights reserved.
Keywords: Aqueous solutions; Barium sulfate; Strontium sulfate; Activity coefficients; Seawater; Thermodynamic properties
1. Introduction
The question of an eventual control of the barium
concentration in seawater by an equilibrium withŽ .solid barium sulfate barite can be addressed through
the calculation of the activity coefficient of aqueous
BaSO as well as the barite solubility product at4
oceanic conditions. This has been done by ChurchŽ .and Wolgemuth 1972 who used an aqueous solu-
tion model based on the ion pairing phenomenology
along with stability constants of aqueous species
available at that time. This water–rock interaction
)
Fax: q33-561520544; E-mail:[email protected]
problem can be reconsidered in light of the recent
development of thermodynamic models of aqueous
electrolyte solutions based on Pitzer’s ion interaction
approach, along with the wealth of data on Ba
distribution in the oceans. Pitzer’s formalism has
allowed the construction of accurate solubility mod-
els for systems including the major species of naturalŽ .waters see Weare, 1987; Pitzer, 1991, for reviews .
Ž .After the landmark paper of Harvie et al. 1984 for
the Na–K–Ca–Mg–H–Cl–SO –HCO –CO –CO –4 3 3 2
H O system at 258C and 1 bar, efforts were made at2
extending such models to elevated temperaturesŽPabalan and Pitzer, 1987; Greenberg and Moller,
. Ž1989, among others and pressures Monnin, 1989,
0009-2541r99r$ - see front matter q 1999 Elsevier Science B.V. All rights reserved.Ž .PII: S0009-2541 98 00171-5

( )C. MonninrChemical Geology 153 1999 187–209188
.1990 and to other species of geochemical signifi-Ž .cance see Pitzer, 1991 . Pitzer’s ion interaction
approach is semi-empirical, as are most aqueous
solution models of practical interest. It allows the
mathematical representation of the properties of sim-Žple systems binary and ternary with a common ion
.solutions up to high concentrations through the
evaluation of empirical parameters from experimen-
tal data. From this representation the thermodynamic
properties of highly complex solutions like seawater
can be predicted. The accuracy of the calculations is
then established by extensive comparisons between
model predictions and independent experimental dataŽ .Weare, 1987 .
The present paper follows the procedure outlined
above to show that barite and celestite solubilities in
chloride solutions can be accurately predicted in
large temperature and composition ranges using
available Pitzer’s parameters describing interactions
between aqueous Na, K, Ca, Mg, Ba, Sr and chlo-
ride, and those for interactions between aqueous Na,
K, Ca, Mg and sulfate. Interactions between aqueous
barium and sulfate are accounted for by an explicit0Ž .equilibrium between the free ions and the BaSO aq4
ion pair. The enthalpy and entropy of the dissocia-
tion reaction of this aqueous complex is calculatedŽ .from the data of Jiang 1996 on barite solubility in
sodium sulfate solutions. No such data for celestite
solubility in sodium sulfate solutions is available
outside 258C. An evaluation of the ion pairing ten-
dency for alkaline earth sulfates in sulfate rich solu-
tions like seawater nevertheless allows one to esti-0Ž .mate the contribution of the SrSO aq ion pair to4
celestite solubility at temperatures other than 258C.
Pressure effects are evaluated following the methodsŽ .published by Monnin 1989, 1990 . Finally, the pre-
Ž .dicted BaSO aq activity coefficient in seawater is4
compared to values given by Church and WolgemuthŽ . Ž .1972 and by Falkner Kenisson et al. 1993 .
2. Thermodynamic properties of the Na–K–Ca–
Mg–Ba–Sr–Cl–SO –H O system to 2008C and 14 2
kbar
Due to the low solubilities of barite and celestite,
BaSO –H O and SrSO –H O binary solutions can-4 2 4 2
not be studied as a function of Ba or Sr molality.
Ž . Ž .Instead, in order to derive BaSO aq and SrSO aq4 4
thermodynamic properties, one has to use barite and
celestite solubility measurements in more complex
systems, the simplest of which are ternary common
ion systems. Barite and celestite solubility measure-
ments at 258C were compiled and critically evaluatedŽ .by Monnin and Galinier 1988 . Experimental data at
other temperatures and pressures for NaCl, KCl,
CaCl , and MgCl binary aqueous solutions and2 2
Žsome of their mixtures Templeton, 1960; Lucchesi
and Whitney, 1962; Uchameyshvili et al., 1966;
Strubel, 1966; Puchelt, 1967; Strubel, 1967; Mac-¨ ¨Donald and North, 1974; Blount, 1977; Jacques and
Bourland, 1983; Vetter et al., 1983; Reardon and.Amstrong, 1987; Schulien, 1987 have allowed the
development of several high temperature–high pres-Žsure solubility models Blount, 1977; Jacques and
Bourland, 1983; Langmuir and Melchior, 1984;
Reardon and Amstrong, 1987; Moller, 1988; Raju.and Atkinson, 1988, 1989; Yuan and Todd, 1991 .
All of these models are fits of measured solubilities,Žbased either on empirical expressions Jacques and
.Bourland, 1983 , the Debye–Huckel equation for¨Ž .aqueous species activity coefficients Blount, 1977 ,Žor, more recently, Pitzer’s formalism Langmuir and
Melchior, 1984; Reardon and Amstrong, 1987;
Moller, 1988; Raju and Atkinson, 1988, 1989; Yuan.and Todd, 1991 . Several of these models are limited
Žto NaCl solutions Moller, 1988; Raju and Atkinson,.1988, 1989; Yuan and Todd, 1991 . On the contrary,
the present study takes into account the chlorides and
sulfates of the main seawater cations and validates
the model by thorough comparison between model
predictions and measured solubilities.
2.1. Ba–SO and Sr–SO interactions4 4
Ž .Felmy et al. 1990 studied the Na–Ba–SO –H O4 2
and Na–Sr–SO –H O systems at 258C up to 0.014 2
mol Na SO rkg H O. These authors found that2 4 2
celestite solubility in sodium sulfate solutions can be
accurately calculated to moderate sulfate concentra-Ž .tions 0.01 molrkg H O within the standard Pitzer2
Žapproach complete dissociation of the aqueous so-.lutes with Sr–SO interaction parameters assumed4
equal to those for Ca–SO . Conversely, in the Na–4
Ba–SO –H O system, they showed that a solution4 2

( )C. MonninrChemical Geology 153 1999 187–209 189
0Ž .model which includes the BaSO aq ion pair is4
somewhat superior to a strong electrolyte model in
reproducing experimental barite solubilities to 0.01Ž .mol Na SO rkg H O Felmy et al., 1990 .2 4 20Ž . 0Ž .The effect of BaSO aq or SrSO aq ion pair4 4
formation on barite or celestite solubilities can be
illustrated as follows. The dissolution of a solid
alkaline earth sulfate can be written as:
MSO s zM2q aq qSO2y aq 1Ž . Ž . Ž . Ž .4 4
Ž .The equilibrium constant of reaction 1 is the solu-
bility product of the solid. If the model used to
calculate aqueous species activity coefficients is aŽstrong electrolyte model i.e., based on the hypothe-
.sis of complete dissociation of the aqueous solutes ,
then the solubility product is given by:
K sm 2q Pm 2y Pg 2q Pg 2y 2Ž .sp M Žaq . SO Žaq . M Žaq . SO Žaq .4 4
where m is the molality and g the activity coeffi-
cient of the designated aqueous species. In a strong
electrolyte model, activity coefficients can be gener-
ated from numerous models, including the classic
Debye–Huckel theory or Pitzer’s ion interaction ap-¨Ž .proach in its original formulation Pitzer, 1991 .
For aqueous solutes exhibiting strong association,
the complete dissociation hypothesis is no longer
valid. The explicit definition of one or more aqueous
complexes is more efficient for calculating the ther-
modynamic properties of associating electrolytes.Ž . Ž . Ž . ŽPitzer 1991 p. 93 and Weare 1987 p. 148 et
.seq. provide discussions of the limit between strong
and weak electrolytes. When expressed within theŽ . Ž .ion pairing or weak electrolyte formalism, Eq. 2
becomes:
K sm 2q Pm 2y Pg 2q Pg 2ysp M Žaq . ,F SO Žaq . ,F M Žaq . ,F SO Žaq . ,F4 4
3Ž .
where the subscript F designates free ions, i.e., the
part of the total solute concentration not involved in
wany complex or ion pair see Johnson and Pytckow-Ž .icz 1979 , among other authors, for a full descrip-
xtion of this approach . Equilibrium between an ion
pair and an aqueous cation and sulfate can be written
as:
MSO0 aq zM2q aq qSO2y aq 4Ž . Ž . Ž . Ž .4 4
where K stands for the equilibrium constant forip
Ž .reaction 4 :
K ip
m 2q Pm 2y Pg 2q Pg 2yM Žaq . ,F SO Žaq . ,F M Žaq . ,F SO Žaq . ,F4 4s
0 0m PgMSO Žaq . MSO Žaq .4 4
5Ž .
Ž . Ž .Combining Eqs. 3 and 5 leads to:
K 1sp0m s P 6Ž .MSO Žaq .4
0K gip MSO Žaq .4
Ž .Eq. 6 demonstrates that the ion pair concentration
is proportional to the ratio of the mineral solubility
product to the ion pair dissociation constant. Assum-
ing that activity coefficients for neutral species are
close to unity, this ratio can be taken as an estimate
of the ion pair concentration in saturated solutions.
Table 1 compares this ratio for the Ca, Ba and Sr
sulfates, to the solubility of their anhydrous saltsŽ .anhydrite, celestite and barite either in pure water
or in dilute sodium sulfate solution. Aqueous com-
plex stability constants were taken from the literature
and are given in Table 1. It must be emphasized that,
in the present approach, interaction of the element M
in solution with sulfate is accounted for by the0Ž .MSO aq ion pair. Interactions with other aqueous4
anions are accounted for by interaction parameters in
the activity coefficient expressions in Pitzer’s for-
malism. Such an approach has been termed ‘a hybridŽ .model’ by Whitfield 1975 .
Table 1
An estimate of the cation–sulfate ion pair concentration for Ca, Sr and Ba. See text
Salt Log K Log K K rK Solubility in Solubility insp ip sp ip
pure water 0.01 MŽ .molrkg H O Na SO2 2 4
Ž . Ž . Ž . Ž .CaSO anhydrite y4.32 a y1.65 a 0.002 0.015 a 0.010 a4y5 y4Ž . Ž . Ž . Ž .SrSO celestite y6.62 b y1.86 c 1.7=10 0.0012 b 2.0=10 c4y8 y5 y7Ž . Ž . Ž . Ž .BaSO barite y10.05 b y2.72 c 4.7=10 1.0=10 b 1.0=10 c4
Ž . Ž . Ž . Ž . Ž .a Moller 1988 ; b Monnin and Galinier 1988 ; c Felmy et al., 1990.

( )C. MonninrChemical Geology 153 1999 187–209190
The data listed in Table 1 indicate that the less
soluble the salt, the stronger the common ion effect.
The addition of 0.01 mol of sulfate to the solution
has almost no effect on anhydrite solubility com-
pared to pure water, but it lowers barite solubility by
two orders of magnitude. Estimates of calcium sul-
fate ion pair formation indicates that this complex
accounts for less than 10% of total dissolved calcium
in pure water or sodium sulfate solutions at equilib-
rium with anhydrite. Consequently, it is possible to
treat this salt at 258C, either as fully dissociatedŽ . ŽHarvie et al., 1984 or as a weak electrolyte Moller,
.1988 , with comparable accuracy. At higher tempera-
tures where ion pairing is enhanced, the inclusion of0Ž . Ž .the CaSO aq complex is necessary Moller, 1988 .4
Strontium sulfate ion pair formation is negligible
in pure water at equilibrium with celestite, but it
accounts for about 10% of total strontium in celestiteŽ .saturated Na SO solutions Table 1 . As shown by2 4
Ž .Felmy et al. 1990 , the thermodynamic properties of
strontium sulfate can be equally well calculated byŽassuming total dissociation ion interaction ap-
. Žproach or assuming aqueous complex formation ion.pairing phenomenology . Reardon and Amstrong
Ž . Ž .1987 and Monnin and Galinier 1988 also calcu-
lated celestite solubilities in seawater assuming total
dissociation which are in close agreement with the
corresponding experimental values reported by Cul-Ž .berson et al. 1978 . Moreover, the Reardon and
Ž .Amstrong 1987 model unambiguously shows that
celestite crystals observed in deep-sea carbonate sed-
iments of DSDP Leg 90 are at equilibrium with poreŽ .waters Baker and Bloomer, 1988 .
Barium sulfate ion pair concentration is negligibleŽ .in barite saturated pure water Table 1 . In 0.01 M
sodium sulfate, however, about 50% of the total0Ž .barium in solution is present as the BaSO aq aque-4
Ž .ous complex, when Felmy et al. 1990 value of the
ion pair stability constant is retained. In this case,
ionic association must be explicitly taken into ac-
count and aqueous barium sulfate has to be treated as
a weak electrolyte.
As can be seen on solubility diagrams reported byŽ . Ž .Harvie et al. 1984 or Monnin and Galinier 1988 ,
there is a marked increase in anhydrite, barite and
celestite solubility with increasing aqueous chlorideŽ .concentration salting-in effect at 258C. As shown
above, ion pair formation is negligible in barite and
celestite saturated pure water. This is also true in
chloride bearing solutions. Consequently, as notedŽ .by Monnin and Galinier 1988 and Reardon and
Ž .Amstrong 1987 at 258C, calculated barite or ce-
lestite solubilities in chloride solutions are insensi-
tive to the Ba–SO or Sr–SO Pitzer interaction4 4
parameters. In models based on the ion pairing phe-
nomenology, calculated barite or celestite solubilities
in chloride solutions are insensitive to the ion pair0Ž . 0Ž .stability constant values for BaSO aq or SrSO aq .4 4
Ž .For example, Moller 1988 calculated barite solubil-
ity in NaCl solutions to 2508C at P 1 by assumingsat0Ž .that the BaSO aq stability constant is equal to that4
0Ž . Ž .for CaSO aq at these temperatures. Moller 19884
showed that the calculated barite solubilities are
sensitive to the Na–Ba interaction parameter. Con-
versely, because calculated barite and celestite solu-
bilities in chloride solutions are insensitive to Pitzer’s
parameters for Ba or Sr interactions with aqueousw 0Ž . 0Ž .sulfate or equivalently to BaSO aq or SrSO aq4 4
xstability constants , these parameters cannot be un-
ambiguously obtained from fits of solubility data in
chloride solutions.
2.2. Binary interaction parameters for aqueous Na,
K, Ca and Mg chlorides and sulfates at high temper-
ature
The full high temperature model of the Na–K–
Ca–Cl–SO –H O system of Greenberg and Moller4 2
Ž .1989 has been adopted in this work. These authors
provide empirical expressions for the temperature
variation of binary interaction parameters for the
aqueous sodium, potassium, and calcium sulfates and
chlorides. Binary interaction parameters for MgCl -2Ž . Ž .aq and MgSO aq were taken from Pabalan and4
Ž . Ž .Pitzer 1987 . Those for SrCl aq were taken from2
Ž . Ž .Phutela et al. 1987 and those for BaCl aq were2
Ž .taken from Monnin 1995 . Alternate ion interaction
models exist for some of these salts. For example,Ž .Holmes et al. 1994 proposed a description of
Ž .CaCl aq thermodynamic properties valid to 526 K2
and 400 bars based on a regression of calorimetric
1P refers to a pressure of 1 bar if temperature is belowsat
1008C, and to pressures corresponding to the liquid vapor–equi-
librium of H O at higher temperatures.2

( )C. MonninrChemical Geology 153 1999 187–209 191
and volumetric data using Pitzer’s equations. Such
new expressions do extend the range of application
of ion interaction models to higher temperatures,
pressures andror molalities. In the present work, the
internally consistent model of Greenberg and MollerŽ .1989 for the Na–K–Ca–Cl–SO –H O system and4 2
Ž .the MgCl model of Pabalan and Pitzer 1987 were2
sufficient to study the available barite and celestite
solubility data.
2.3. Ternary interaction parameters
Ternary interaction parameters for the Na–K–
Ca–Cl–SO –H O system are from Greenberg and4 2
Ž .Moller 1989 . Note that the Pabalan–Pitzer modelŽfor the Na–K–Mg–Cl–SO –H O system Pabalan4 2
.and Pitzer, 1987 is not compatible with the Green-
berg–Moller model for the Na–K–Ca–Cl–SO –H O4 2
system. It follows that the Greenberg and MollerŽ .1989 model cannot be directly merged with the
Ž .Pabalan and Pitzer 1987 model to build a high
temperature model for concentrated solutions in the
six-ion Na–K–Ca–Mg–Cl–SO –H O system.4 2
Among their differences, they use different expres-
sions to describe the temperature dependence of
Na–Cl and Na–SO interaction parameters. Al-4
though these two expressions are of comparable
accuracies in calculating the thermodynamic proper-
ties and mineral solubilities in the Na SO –H O and2 4 2
NaCl–H O systems to high temperature, they lead to2
different values of ternary Cl–SO and Na–Cl–SO4 4
interaction parameters in the Na–Cl–SO –H O sys-4 2
tem. Inconsistent parameter sets can lead to a signifi-
cant accuracy deterioration in solubility calculationsŽat high concentrations see, for example, Fig. 1 in
Ž .the paper of Greenberg and Moller 1989 or Fig. 2.in the paper of Monnin, 1995 .
Ž .Reardon and Amstrong 1987 calculated ternary
mixing parameters u and c from emfNa,Sr Na,Sr,Cl
Ž .data Lanier, 1965 for the Na–Sr–Cl–H O system2
Ž .at 258C. Monnin 1995 studied the solubility of
solid BaCl P2H O in NaCl, KCl, and CaCl solu-2 2 2
tions, to generate the corresponding Pitzer’s ternary
mixing parameters involving the interaction of aque-
ous Ba with either Na, K or Ca.
A large number of ternary mixing parameters are
still unknown. Calculated activity coefficients are
likely insensitive to mixing parameters representing
M–Ba–SO , Ba–SO –X, M–Sr–SO or Sr–SO –X4 4 4 4
Ž .interactions M being a cation and X an anion due
to the limitation of barium or strontium concentra-
tions to low values. Missing parameters are set to
zero in the present work, although in some instancesŽ .see, for example, BaSO in KCl solutions they can4
be adjusted to the data in order to correct for the
discrepancies between calculated and experimental
solubilities. Such corrections are sensitive only for
concentrations above 1 M or so and, in many cases,
they lead to meaningless parameter values that can-
not be recommended. As such the present model is
limited to moderately concentrated solutions and is
suited for seawater, but should be used with caution
for brines.
2.4. Pressure effects
The effect of pressure on aqueous activity coeffi-
cients can be obtained through calculation of partialŽmolal volumes within Pitzer’s formalism Monnin,
.1989, 1990 . Expressions for the partial molal vol-
umes and compressibilities of aqueous solutes inŽ .complex mixtures are given by Monnin 1989, 1990
along with expressions of the corresponding Debye–
Huckel slopes. Compressibility has only a second¨order effect which is negligible at moderate pres-
Ž .sures Millero, 1979; Monnin, 1990 . Because no
compressibility data is available for BaCl solutions,2
no estimate of compressibility effects have been
included in this work. One can refer to MonninŽ .1990 for a discussion of the contribution of com-
pressibility to the thermodynamic properties of aque-
ous electrolytes.
First derivatives of Pitzer’s interaction parameters
with respect to pressure are given by Phutela et al.Ž . Ž . Ž . 21987 for SrCl aq and by Monnin 1990 for2
Ž . Ž . Ž .NaCl aq , Na SO aq and CaCl aq . Puchalska and2 4 2
Ž .Atkinson 1991 give the temperature variation ofŽ .the standard molal volume of BaCl aq while tem-2
perature and pressure dependent expressions of the
BaCl interaction parameters are reported by2
Ž .Manohar et al. 1994 .
2Note that the a parameter in Table 1 in the paper of Monnin1
Ž . q2 y21990 should be 8.525003=10 instead of 8.525003=10 .

( )C. MonninrChemical Geology 153 1999 187–209192
3. Barite and celestite solubility products
The variation of the solubility product with pres-
sure is given by:
0D VrlnK T ,P s lnK T ,P y PyPŽ . Ž . Ž .sp sp 0 0
RT
7Ž .
0where D V stands for the standard molal volume ofr
the dissolution reaction.Ž .The solubility product, K T ,P at temperaturesp 0
T and reference pressure P can be obtained from0
the standard heat capacity of the dissolution reaction.
When this heat capacity is constant over the investi-Ž .gated temperature range, then K T ,P is given by:sp 0
ClnK T ,P sAqB lnTq 8Ž . Ž .sp 0
T
with
D S0 D C 0r r pw xAs y 1q lnT0
R R0D Cr p
9Ž .BsR
0 0D H T D Cr 0 r pCsy q
R R
where D S0, D H 0 and D C 0 respectively refer tor r r p
the standard entropy, enthalpy and heat capacity of
the dissolution reaction. R is the gas constant and T0Ž .the reference temperature 298.15 K .
3.1. Celestite
The celestite solubility product was determined byŽ .Reardon and Amstrong 1987 from their own pure
water celestite solubility measurements from 10 to
908C. Their 258C value is in close agreement withŽ .those of Monnin and Galinier 1988 and Felmy et
Ž . Ž .al. 1990 . Reardon and Amstrong 1987 repre-
sented K values as a function of temperature usingsp
four- and five-parameter expressions which both im-
ply a temperature dependent heat capacity of the
dissolution reaction. Their K values can be fittedsp
with the same accuracy using the three-parameterŽ .Eq. 8
lnK T ,P s224.069y35.9422 lnTŽ .sp 0
y10302.32rT 10Ž .
Žsuggesting that the original interpretation Reardon.and Amstrong, 1987 was an overfit. Such overfits
may lead to poor values to the solubility products
when extrapolated outside the range of the fittedŽ . Ž . 0data. Eqs. 9 and 10 lead to D S sy138.5"0.5r
Jrmol, D H 0sy3.44"0.12 kJrmol and D C 0sr r p
y298.8"0.3 Jrmol Ky1.
The standard molal volume of the celestite disso-
lution reaction is:
0 0 0D V sV SrSO ,aq yV SrSO ,s 11Ž . Ž . Ž .r 4 4
0Ž .The standard volume of celestite V SrSO ,s is43 Ž46.25 cm rmol at 258C and 1 bar Robie et al.,
.1979 and is considered to be constant over the
temperature and pressure ranges investigated in this
study. The standard molal volume of aqueous stron-
tium sulfate is calculated at T and P from those ofsat
Ž .sodium sulfate and sodium chloride Monnin, 1990Ž .and of strontium chloride Phutela et al., 1987 at the
same temperature and pressure using the additivity
rule which is expressed by:
0 0 0V SrSO ,aq sV SrCl ,aq qV Na SO ,aqŽ . Ž . Ž .4 2 2 4
0y2V NaCl,aq 12Ž . Ž .0where V is the standard molal volume of the
designated aqueous electrolyte.
3.2. Barite
The barite solubility product at P is calculatedsat
from pure water barite solubilities measured byŽ .Blount 1977 to 2508C and fit to the following
equation:
15806.30lnK T ,P s275.053y43.014 lnTyŽ .sp sat
T
13Ž .
from which the following thermodynamic quantities
are retrieved: D S0sy108.5"1.5 Jrmol, D H 0r r
s24.755"0.35 kJrmol and D C 0sy357.2"0.8r p
Jrmol Ky1. The uncertainties attached to these val-
ues are based on an uncertainty on K of 1% atsp
298.15 K and of 10% at other temperatures.

( )C. MonninrChemical Geology 153 1999 187–209 193
The standard volume of the barite dissolution
reaction can be calculated from:
0 0 0DV sV BaCl ,aq qV Na SO ,aqŽ . Ž .r 2 2 4
0 0y2V NaCl,aq yV BaSO ,s 14Ž . Ž . Ž .4
0 3Ž . Žwhere V BaSO ,s s52.1 cm rmol Robie et al.,4
.1979 . The standard molal volume of aqueous bar-
ium chloride is given by Puchalska and AtkinsonŽ .1991 .
4. Calculated barite and celestite solubilities in
electrolyte solutions versus experimental data
4.1. Barite and celestite solubilities in pure water at
high pressure
Pure water celestite solubilities were measured at
2, 22 and 358C to 1000 bars by MacDonald andŽ . Ž .North 1974 . Blount 1977 reported pure water
barite solubility to 2508C and to 1 kbar. A close
agreement between the predicted and measured val-
ues can be seen in Fig. 1. It must be emphasized that
the only data used in model construction is pure
water barite solubility at P to get the barite solubil-sat
ity product. The curves in Fig. 1 are model predic-
tions. Keeping in mind that no Ba–SO or Sr–SO4 4
interaction parameters or association constants are
included in the model, Pitzer’s expression for the
activity coefficient reduces to a simple Debye–
Huckel term. The close correspondence between the¨symbols and the curves in Fig. 1 demonstrates that
this simple Debye–Huckel term is sufficient to accu-¨rately calculate pure water barite and celestite solu-
bilities. These results confirm the analysis that was
carried out above from the results reported in Table
1.
4.2. The Na SO –BaSO –H O system2 4 4 2
Barite solubility in sodium sulfate solutions to
0.008 mol SO rkg H O is reported by Felmy et al.4 2
Ž . Ž .1990 at 258C and Jiang 1996 from 0 to 808C.Ž .Unfortunately, Felmy et al. 1990 reported their data
only as plots. Fig. 2 compares measured barite solu-Ž . Ž .bilities black squares of Jiang 1996 at 0, 40 and
808C, to those calculated when only Na–SO interac-4
Fig. 1. The solubility of barite and celestite vs. pressure at variousŽ .temperatures. The experimental data for celestite filled circles is
Ž .from MacDonald and North 1974 . The calculated and experi-
mental celestite solubilities at 22 and 358C are vertically offset by
0.001 molrkg H O for clarity. The experimental data for barite2
Ž . Ž .filled squares is from Blount 1977 . The experimental barite
solubility at 248C is represented by open squares and the calcu-
lated solubility at this temperature by a dashed curve to avoid
overlap with the results at 1898C.
Ž .tions are taken into account dashed curves , i.e.,
when Ba–SO interactions are neglected. The calcu-4
lated solubilities are lower that the measured values,Ž .indicating that the calculated BaSO aq activity co-4
efficient is overestimated. As ion association tends to0Ž .lower activity coefficients, a BaSO aq ion pair4
may account for the difference between calculated
and measured barite solubilities. The difference be-

( )C. MonninrChemical Geology 153 1999 187–209194
Fig. 2. Barite solubility in sodium sulfate solutions. The experi-Ž . Ž .mental data filled squares is from Jiang 1996 . The dashed
curve is calculated without the barium sulfate ion pair and the
plain curve includes this aqueous complex.
tween calculated and measured barium concentration
in sodium sulfate solutions is reported in Fig. 3 for a
temperature of 808C. One can see in Fig. 3 that, inŽ .accordance with Eq. 6 , this difference is constant
for sodium concentrations above 0.0025 molrkg
H O. Therefore, it provides an estimate of the20Ž . 0Ž .BaSO aq ion pair concentration. If the BaSO aq4 4
0Ž .activity coefficient is taken equal to unity, BaSO aq4
ion pair dissociation constant values can be calcu-Ž .lated from Eq. 6 and the experimental data of Jiang
Ž .1996 . These values are reported in Fig. 4 and fit to:
383.6770lnK sy6.5032q 15Ž .BaSO4 T
The enthalpy and entropy of the BaSO0 ion pair4
dissociation reaction are D H 0sy3.190"0.039r
kJrmol and D S0sy54.07"0.13 Jrmol. Ther0Ž .decimal logarithm of the BaSO aq stability con-4
Ž .stant calculated from Eq. 15 is y2.26 at 258C,
Fig. 3. Difference between measured barite solubility in sodium
sulfate solutions at 808C and solubility calculated without the0Ž .BaSO aq ion pair vs. the sodium molality.4
which falls within the range of literature valuesŽ .compiled by Felmy et al. 1990 . Felmy et al.’s value
0Ž .for the BaSO aq stability constant lead to a degree4
Ž .of BaSO association of 50% at 258C Table 14
while it is only about 15% with the value determined
in the present work. It only slightly increases to0Ž .about 20% at 808C. Adjusting the BaSO aq aque-4
ous complex stability constant to the data is enough
to bring calculated barite solubilities in good agree-Ž .ment with the measurements plain curves in Fig. 2
Ž .of Jiang 1996 . Note that, with this new value of the0Ž .BaSO aq stability constant, the logarithms of the4
0Ž .Fig. 4. The decimal logarithm of the BaSO aq ion pair dissocia-4
tion constant vs. temperature.
( )C. MonninrChemical Geology 153 1999 187–209 195
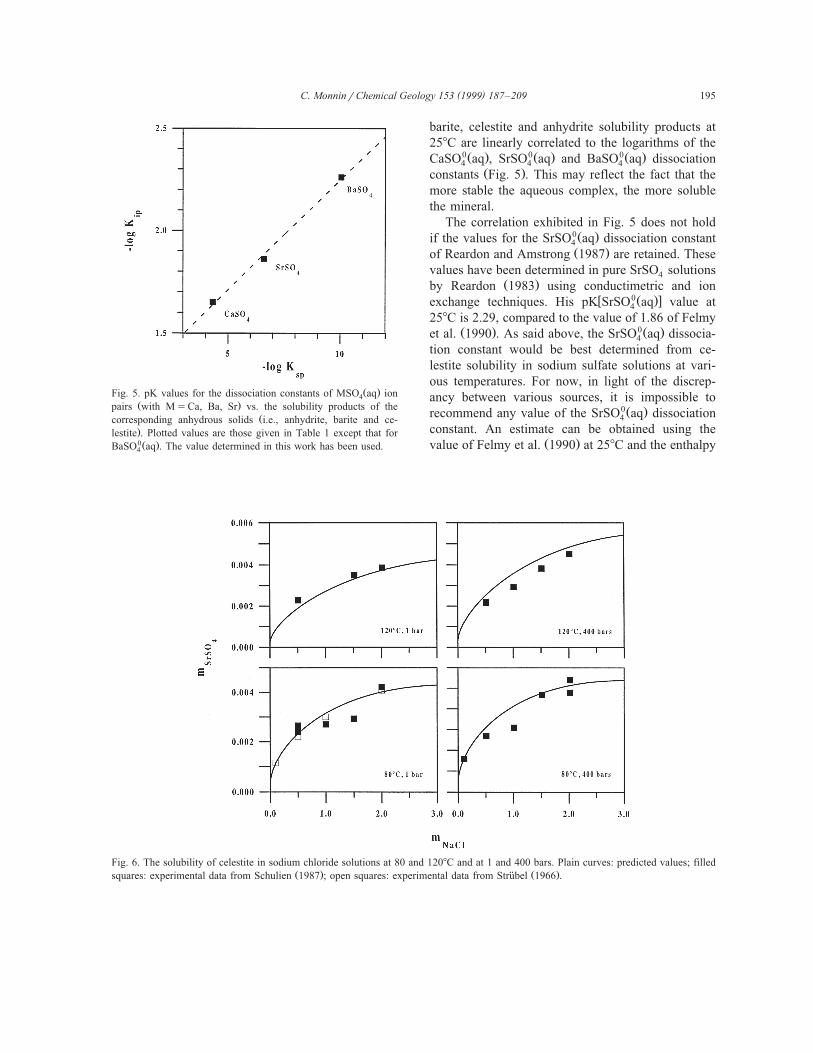
Ž .Fig. 5. pK values for the dissociation constants of MSO aq ion4
Ž .pairs with MsCa, Ba, Sr vs. the solubility products of theŽcorresponding anhydrous solids i.e., anhydrite, barite and ce-
.lestite . Plotted values are those given in Table 1 except that for0Ž .BaSO aq . The value determined in this work has been used.4
barite, celestite and anhydrite solubility products at
258C are linearly correlated to the logarithms of the0Ž . 0Ž . 0Ž .CaSO aq , SrSO aq and BaSO aq dissociation4 4 4
Ž .constants Fig. 5 . This may reflect the fact that the
more stable the aqueous complex, the more soluble
the mineral.
The correlation exhibited in Fig. 5 does not hold0Ž .if the values for the SrSO aq dissociation constant4
Ž .of Reardon and Amstrong 1987 are retained. These
values have been determined in pure SrSO solutions4
Ž .by Reardon 1983 using conductimetric and ionw 0Ž .xexchange techniques. His pK SrSO aq value at4
258C is 2.29, compared to the value of 1.86 of FelmyŽ . 0Ž .et al. 1990 . As said above, the SrSO aq dissocia-4
tion constant would be best determined from ce-
lestite solubility in sodium sulfate solutions at vari-
ous temperatures. For now, in light of the discrep-
ancy between various sources, it is impossible to0Ž .recommend any value of the SrSO aq dissociation4
constant. An estimate can be obtained using theŽ .value of Felmy et al. 1990 at 258C and the enthalpy
Fig. 6. The solubility of celestite in sodium chloride solutions at 80 and 1208C and at 1 and 400 bars. Plain curves: predicted values; filledŽ . Ž .squares: experimental data from Schulien 1987 ; open squares: experimental data from Strubel 1966 .¨

( )C. MonninrChemical Geology 153 1999 187–209196
Ž . 0Ž .of Reardon 1983 for the SrSO aq dissociation4
Ž .reaction 8.7 kJrmol at 258C .
4.3. The NaCl–SrSO –H O system4 2
There is a large body of data for this system.Ž .Reardon and Amstrong 1987 studied celestite solu-
bility in sodium chloride solutions from 10 to 908C
using their own experimental data and those ofŽ .Strubel 1966 . The measurements of Jacques and¨Ž .Bourland 1983 are consistent with these data in the
region of overlap. Celestite solubilities predicted by
the present model are in close agreement with the
experimental values, as well as with the calculationsŽ .of Reardon and Amstrong 1987 . We here illustrate
results for some data not used by Reardon andŽ .Amstrong 1987 .
Celestite solubility measurements reported byŽ .Schulien 1987 in solutions up to 2 M NaCl at 80
and 1208 and at 1 and 400 bars are shown in Fig. 6.
It is assumed in this study that Schulien reported his
data using the molality scale. Adoption of this as-
sumption renders these data consistent with the dataŽ . Žof Strubel 1966 in the region of overlap 808C; Fig.¨
.6 . Our predicted solubilities are in good agreementŽ .with the measured solubilities of Strubel 1966 and¨
Ž . Ž .Schulien 1987 Fig. 6 as well as with other data,Ž .reported by Jacques and Bourland 1983 at pres-
sures up to 200 bars and temperatures to 1498C that
are not included in Fig. 6.Ž .Vetter et al. 1983 reported a large body of
celestite solubility data in NaCl, CaCl and MgCl2 2
solutions and their mixtures at 25, 75, 95 and 1258C.
Solubility was measured using a radioactive tracer
technique using90Sr. Some of the results were
cross-checked using35S instead of
90Sr, but the two
methods lead to solubility values differing by as
much as 30%. Our calculations are in agreement
with the35S measurements, which is consistent with
Ž .the results of Monnin and Galinier 1988 at 258C.Ž .Lucchesi and Whitney 1962 reported solubility
data at 08C. Similar to the 258C results of MonninŽ .and Galinier 1988 , calculated solubilities at 08C are
higher than the measured values by a factor of aboutŽthree for the highest NaCl concentration 5.6 molrkg
.H O . Despite the fact that measurements below2
258C are of great importance for oceanographic stud-
ies, these data are not given further consideration in
this work.
Note that celestite solubility can be accurately
calculated assuming that mixing parameters involv-Žing Na–Sr and Na–Sr–Cl interactions at 258C Re-
.ardon and Amstrong, 1987 do not vary with temper-
ature and can be used up to 1508C.
4.4. The MgCl –SrSO –H O system2 4 2
Data for this system is reported by Vetter et al.Ž .1983 at 75, 95 and 1258C at P and magnesiumsat
Ž .chloride concentrations up to 0.5 M Fig. 7 . Note
the discrepancy between the celestite solubility mea-
sured with35S and that obtained with
90Sr.
Fig. 7. The solubility of celestite in magnesium chloride solutions
at 75, 95 and 1258C and 1 bar or water vapor saturation pressure.35 Ž .Open squares: measured values using S Vetter et al., 1983 ;90 Ž .filled squares: measured values using Sr Vetter et al., 1983 ;
plain curves: solubility calculated using u and cCl ,SO Mg,Cl,SO4 4
Ž .from Pabalan and Pitzer 1987 ; dashed curves: solubility calcu-Ž .lated using u and c from Moller 1988 .Cl ,SO Mg,Cl,SO4 4

( )C. MonninrChemical Geology 153 1999 187–209 197
The aqueous solution model for this system is
built from the binary interaction parameters ofŽ .Phutela et al. 1987 for SrCl and of Pabalan and2
Ž .Pitzer 1987 for MgCl and MgSO . To maintain2 4
model consistency, Pitzer’s mixing parameters in-
volving Cl–SO and Mg–Cl–SO interactions4 4
Ž .u and c are also taken from PabalanClSO MgClSO4 4
Ž .and Pitzer 1987 . Ternary interaction parameters
involving Sr are set to zero. As seen in Fig. 7,
predicted solubility agrees closely with the35S ex-
perimental data at 758C, but departs increasingly
from the measured values as temperature increases.
Solubility calculated using u and c takenClSO MgClSO4 4
Ž .from Moller 1988 are also plotted in Fig. 7. These
results deviate from those obtained with the Pa-
balan–Pitzer ternary parameters; the difference in-
creases with increasing magnesium chloride concen-
tration. This difference is as large as the data scatter
at 0.5 M MgCl . This result demonstrates the need2
to maintain model consistency. As emphasized above
it is not possible to build a high temperature Na–K–
Ca–Mg–Cl–SO –H O model for concentrated solu-4 2
tions by combining Moller’s and Pitzer and Pabalan’s
models without refitting some parameters. Celestite
solubility in moderately concentrated magnesium
chloride solutions can nevertheless be satisfactorily
calculated up to 1008C by setting u and cMg,Sr Mg,Sr,Cl
equal to zero.
4.5. The CaCl –SrSO –H O system2 4 2
Ž .Vetter et al. 1983 give data for this system at
75, 95 and 1258C at P . It can be seen in Fig. 8 thatsat
celestite solubility is satisfactorily predicted by set-
ting the mixing parameters u and c equalCa,Sr Ca,Sr,Cl
to zero. When the calcium concentration of celestite
saturated solutions increases, the solid calcium sul-
fate stability field is reached. At 258C, gypsum can
form in solutions having a calcium molality aboveŽ .0.75 molrkg H O Monnin and Galinier, 1988 . At2
higher temperatures, anhydrite is the stable solid
calcium sulfate phase. Its solubility decreases with
temperature. We find that anhydrite is saturated in
celestite saturated solutions when the calcium con-
centration is equal to 0.5 molrkg H O at 758C, 0.242
molrkg H O at 958C, and 0.06 molrkg H O at2 2
Ž .1258C Fig. 8 .
Ž .Fig. 8. The solubility of celestite expressed as strontium molality
in calcium chloride solutions at 75, 95 and 1258C and 1 bar or
water vapor saturation pressure. Open squares: measured values35 Ž .using S Vetter et al., 1983 ; filled squares: measured values90 Ž .using Sr Vetter et al., 1983 ; plain curves: celestite solubility
calculated taking into account anhydrite precipitation; dashed
curves: celestite solubility calculated for the sole equilibrium with
celestite.
When anhydrite precipitates, the calcium and the
sulfate concentrations are lowered, which increases
the strontium content of the solution. It can be seen
in Fig. 8 that calculated solubilities closely match the
experimental data when anhydrite formation is not
taken into account. This suggests that anhydrite did
not precipitate in the experiments of Vetter et al.Ž .1983 , although its stability field was reached.
4.6. The NaCl–MgCl –SrSO –H O, NaCl–CaCl –2 4 2 2
SrSO –H O, CaCl –MgCl –SrSO –H O and4 2 2 2 4 2
NaCl–CaCl –MgCl –SrSO –H O systems2 2 4 2
Data for these complex systems are from Vetter etŽ .al. 1983 . In general our calculated celestite solubili-

( )C. MonninrChemical Geology 153 1999 187–209198
Fig. 9. Barite solubility in sodium chloride solutions at 50, 80 and
1008C. The curves represent calculated values. Experimental data:Ž . Ž .open squares: Templeton 1960 ; filled squares: Schulien 1987 ;
Ž . Ž .filled circles: Strubel 1967 ; open diamonds: Blount 1977 : open¨Ž . Ž .circles: Uchameyshvili et al. 1966 ; plusses: Puchelt 1967 .
ties agree with the35S data, but are about 25%
higher than the90Sr data, as found for other simpler
systems. In addition, data for calcium containing
systems were found to be supersaturated with respect
to anhydrite at 1258C.
4.7. The Nacl–BaSO –H O system4 2
Numerous experimental solubility data are avail-
able in this system. Barite solubility has been mea-Ž .sured at 1 bar by Strubel 1967 at 108C intervals¨
from 20 to 1008C in solutions containing up to 2 MŽ .NaCl. Puchelt 1967 reports barite solubilities at
508C as a function of NaCl concentration up to haliteŽ .saturation. Templeton 1960 reports smoothed solu-
Ž .bility data to 958C and to 5 M NaCl. Schulien 1987
measured barite solubility in solutions containing up
to 2 M NaCl at 80, 100, and 1208C and at pressuresŽ .of 1, 200, and 400 bars. Blount 1977 reports data
up to 2508C, 500 bars and 4 M NaCl. UchameyshviliŽ .et al. 1966 give barite solubilities up to 3708C at
P and sodium chloride concentrations up to 2 M.sat
Ž .Strubel 1967 reports data for a single 2 M NaCl¨solution, but to 6008C.
It can be seen in Fig. 9 that the data of TempletonŽ . Ž . Ž .1960 , Puchelt 1967 and Strubel 1967 at 508C¨are consistent, and predicted barite solubilities are
within experimental uncertainty. Model predictions
are in full agreement with Templeton’s data at 808C,
but are up to 10% higher than the experimentalŽ . Ž .values of Blount 1977 and Strubel 1967 in the 1¨
to 3 M NaCl concentration range at 1008C. It can
Fig. 10. Barite solubility in sodium chloride solutions at 150, 200
and 2508C and water vapor saturation pressure. The dashed curves
represent solubility values calculated with u s0.0. The plainNa,Ba
curves are calculated with u equal to 0.02 at 1508C, 0.05 atNa,Ba
2008C and 0.12 at 2508C. Experimental data: filled circles: Strubel¨Ž . Ž .1967 ; open diamonds: Blount 1977 : filled squares:
Ž .Uchameyshvili et al. 1966 .

( )C. MonninrChemical Geology 153 1999 187–209 199
also be seen in Fig. 9 that the data of SchulienŽ .1987 is inconsistent with Templeton’s results at
808C and with other reported solubilities at 1008C.
We also found that calculated barite solubilities are
systematically higher than Schulien’s measurements
at 80, 100 and 1208C and at 1, 200 and 400 bars.
Experimental data reported for temperatures above
1008C and at P are shown in Fig. 10. Data re-sat
Ž .ported by Blount 1977 and by Uchameyshvili et al.Ž .1966 are in agreement in the region of overlap.
Strubel’s datum agrees with these data at 1508C, but¨not at 2008C and 2508C. Barite solubilities calculated
with u equal to zero and c equal toNa,Ba Na,Ba,Cl
Ž .0.0128 Monnin, 1995 , which are depicted by the
dashed curve in Fig. 10, are higher than the experi-
mental data, with a discrepancy increasing with tem-Ž .perature. As shown by Moller 1988 , calculated
solubilities can be brought into agreement with the
experimental data by adjusting only u . ThisNa,Ba
leads to u values equal to 0.02 at 1508C, to 0.05Na,Ba
at 2008C and 0.12 at 2508C. These values are large
relative to characteristic Pitzer’s mixing parameter
values describing interaction between univalent andŽ .divalent cations Pitzer, 1991 . Consequently they
should only be used for interpolating between these
experimental data. Note that the model with uNa,BaŽ .s0 and c s0.0128 Monnin, 1995 can ac-Na,Ba,Cl
curately predict barite solubility to moderate NaCl
concentrations even at 2508C, despite the fact that
these parameters are based on regression of low
temperature data.
Barite solubilities in NaCl bearing solutions atŽ .500 bars up to 2508C reported by Blount 1977 are
depicted in Fig. 11. Barite solubilities at 1508C and
500 bars calculated using a 1 bar barium sulfate
activity coefficient are substantially above Blount’sŽ .data. The pressure effect on BaSO aq activity coef-4
ficient can be calculated by integration of its partial
molal volume that can be obtained by additivity fromŽ . Ž . Ž .the NaCl aq , Na SO aq , and BaCl aq partial2 4 2
Žmolal volumes. All the needed parameters first
derivatives of Pitzer’s parameters with respect to
Fig. 11. Barite solubility in sodium chloride solutions at 150, 200 and 2508C and 500 bars. The dashed curve labeled A is calculated with
the barium sulfate activity coefficient calculated at water vapor saturation pressure instead of 500 bars. The dashed curve labeled C isŽ .calculated with Pitzer’s parameters for the volumetric properties of BaCl given by Manohar et al. 1994 . The dashed curves labeled B are2
Ž .calculated with Pitzer’s parameters for the volumetric properties of BaCl equal to those for CaCl Monnin, 1990 at the same temperature.2 2
Ž .The plain curves are calculated with the values of u adjusted to the experimental data at P see Fig. 10 and text . The filled squaresNa,Ba sat
Ž .are the experimental data of Blount 1977 .

( )C. MonninrChemical Geology 153 1999 187–209200
. Ž .pressure are taken from Monnin 1990 except thoseŽ .for BaCl which are from Manohar et al. 1994 .2
The barite solubility calculated assuming u s0Na,Ba
is in close agreement with the experimental data up
to 3 M NaCl, but deviates at higher NaCl molalities.
It must be kept in mind that the BaCl volumetric2
Ž .parameters of Manohar et al. 1994 have been deter-
mined from density measurements up to 1408C and
that the results depicted in Fig. 11 already represent
extrapolations outside the range of validity of these
parameters. When the same calculation is carried outŽ .using CaCl volume parameters Monnin, 1990 in2
place of those for BaCl , the discrepancy at high2
NaCl molalities disappears and barite solubility is
predicted at 1508 and 500 bars with the same accu-
racy as at 1508C and P . When u is set tosat Na,Ba
0.02, the agreement between predicted and measured
values is very good. It thus appears that the pressure
effect on barium sulfate activity coefficients at ele-Ž .vated temperatures above 1508C can be accounted
for by using CaCl volumetric properties as a proxy2
for those of BaCl . The plain curves at 200 and2
2508C and 500 bars in Fig. 11 are calculated assum-
ing this pressure correction and by adopting uNa,Bavalues determined from the P data. It can again besat
seen that barite solubility is accurately predicted at
2508C and 500 bars up to 3 M NaCl.
4.8. The KCl–BaSO –H O system4 2
Barite solubilities in this system are reported byŽ .Puchelt 1967 at 508C up to 5 mol KClrkg H O. It2
can be seen in Fig. 12 that these data are consistent
with a u parameter value of 0.04, but use ofK,Ba
u s0 leads to a discrepancy no greater thanK,Ba
about 15% at the highest KCl concentration. Fitting
u to the barite solubility data lead to meaninglessK,Ba
parameters, especially if one keeps in mind that itŽ .was found Monnin, 1995 that the solubility of
BaCl P2H O in potassium chloride solutions below2 2
1008C can be accurately calculated with u s0.K,Ba
Moreover, barite solubilities calculated assuming
u s0 have been found in rough agreement withK,Ba
the scattered data reported by Uchameyshvili et al.Ž .1966 for a solution containing 0.25 mol KClrkg
H O between 100 and 2508C.2
Fig. 12. Barite solubility in potassium chloride solutions at 508C.Ž .The filled squares represent measurements of Puchelt 1967 . The
dashed curve is calculated with u equal to zero and the plainK,Ba
curve with u s0.04.K,Ba
4.9. The MgCl –BaSO –H O system2 4 2
Barite solubilities in MgCl solutions were mea-2
Ž .sured by Puchelt 1967 at 508C. Similar results are
found for 508C as were found for 258C by MonninŽ .and Galinier 1988 : the calculated value is in close
agreement with the experimental data up to 0.5 mol
MgCl rkg H O, but lower at higher concentrations.2 2
Ž .Data reported by Uchameyshvili et al. 1966 for
a 0.083 mol MgCl rkg H O solution up to 2308C2 2
show that barite solubility increases with tempera-
ture. The present model predicts this tendency, but
the agreement between measured and calculated val-
ues is only rough.
4.10. The CaCl –BaSO –H O system2 4 2
Barite solubilities calculated at 508C are in closeŽ .agreement with the data of Puchelt 1967 at concen-
trations up to about 1 molrkg H O, but depart for2
experimental data at higher concentrations, similarlyŽto what was observed for KCl solutions see Fig.
.11 .Ž .Uchameyshvili et al. 1966 measured barite solu-
bility in solutions containing 0.165 and 0.5 mol
CaCl rkg H O to 2408C. They observed anhydrite2 2
formation at temperatures above 2308C. As can be

( )C. MonninrChemical Geology 153 1999 187–209 201
seen in Fig. 13, calculated barite solubilities are
higher than measured values by a factor of 2 at
1008C and by about 25% at 2008C. The anhydrite
stability field is reached when temperature increasesŽ .at constant calcium molality Fig. 13 or when the
calcium content of the solution is increased at con-
stant temperature. It can be seen in Fig. 13 that the
aqueous phase becomes anhydrite-saturated at about
2108C for a solution containing 0.165 mol CaCl rkg2
H O and at 1658C for a solution containing 0.5 mol2
CaCl rkg H O. At 2308C when anhydrite precipi-2 2
tates from barite saturated solutions, aqueous sulfate
content decreases and barium concentration in-
creases. This has been experimentally observed byŽ .Uchameyshvili et al. 1966 . The dashed curves in
Fig. 13 represent calculated barium molality for equi-Žlibrium with barite alone anhydrite is prevented
Fig. 13. Barite solubility in calcium chloride solutions vs. temper-Ž .ature. The experimental data filled squares is from Uchameyshvili
Ž .et al. 1966 . The plain curves are calculated allowing anhydrite to
form. The dashed curves are calculated for equilibrium with bariteŽ .alone anhydrite remains supersaturated .
.from precipitating , while the upper part of the plain
curves is calculated for a solution at equilibrium with
both barite and anhydrite. Note that the calculations
at 2308C require extrapolation of some model param-
eters, including the interaction parameters for bariumŽchloride beyond their 2008C validity limit Monnin,
.1995 . It is nevertheless evident in Fig. 13 that
calculated values are in better agreement with exper-
imental data if the absence of anhydrite is assumed.
This type of agreement was also found for celestiteŽ .see Fig. 10 .
5. Discussion
The experimental data reported in Figs. 1–13
show that the solubility of barite and celestite in
aqueous solutions containing alkali and alkaline earth
chlorides increases with the chloride content of the
solution, at least to 2508C. This salting-in effect is
due to a lowering of the aqueous barium or strontium
activity coefficient when the ionic strength of theŽ . Ž .solution increases. BaSO aq and SrSO aq activity4 4
coefficients in chloride solutions can be calculated
by taking into account the sole binary interactions
between aqueous barium or strontium, chloride and
the other cations. The interactions between aqueousŽ . Žstrontium or barium and aqueous sulfate which are
usually taken into account either as interaction pa-
rameters in Pitzer’s formalism or as ion pair stability.constants can be neglected in this case. In the
present work, Ba–SO interactions have been evalu-4
ated from barite solubility data in sodium sulfate
solutions by determining the aqueous barium sulfate
ion pair stability constant as a function of tempera-
ture. The determination of the variation of this stabil-
ity constant with respect to pressure requires new
experimental data. It is nevertheless very likely that
this variation, which is neglected in the present
model, has only a minor effect on calculated barite
solubilities at high pressure in sulfate-rich systems.
The present model treats aqueous barium sulfate as a
weakly associated electrolyte in solution and its de-Ž .gree of association less than 20% up to 808C , only
slightly varies with temperature. The results reported
in Table 1 indicate that aqueous strontium sulfate is
an even stronger electrolyte than barium sulfate. Due
to the lack of celestite solubility data in sodium
sulfate solutions at various temperatures, the stability
( )C. MonninrChemical Geology 153 1999 187–209202
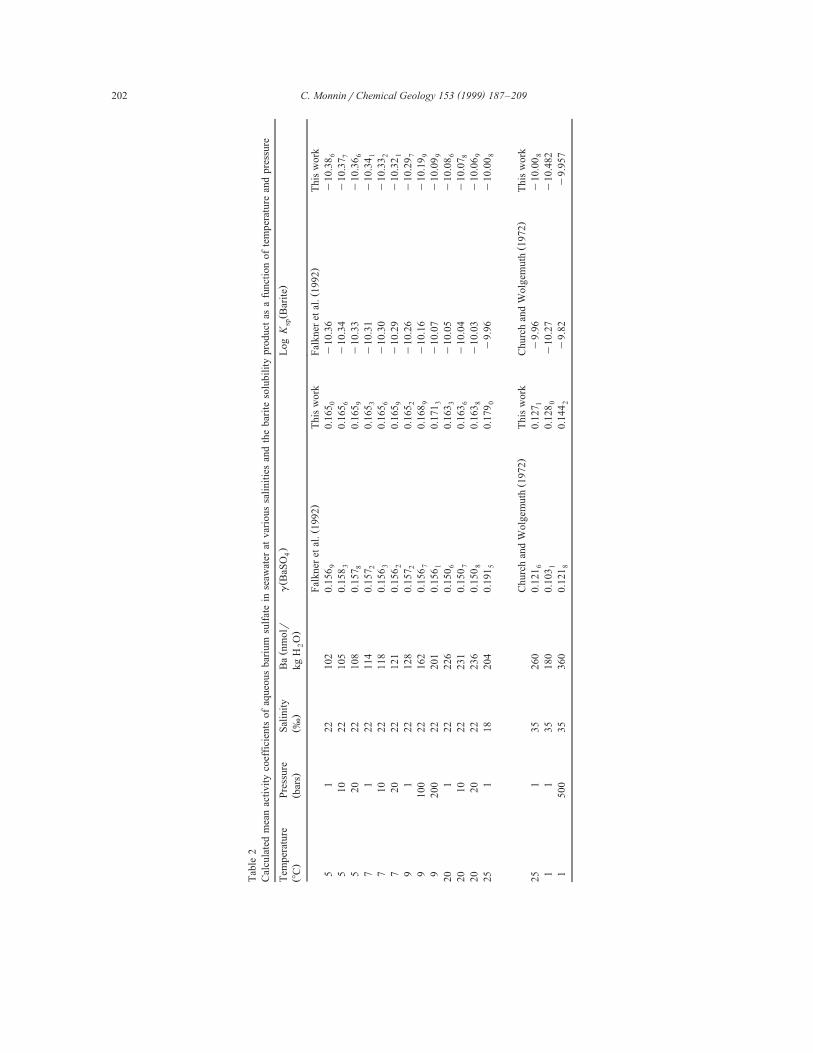
Table2
Calculatedmeanactivitycoefficientsofaqueousbariumsulfateinseawateratvarioussalinitiesandthebaritesolubilityproductasafunctionoftemperatureandpressure
ŽŽ
.Ž
.Temperature
Pressure
Salinity
Banmolr
gBaSO
LogK
Barite
4sp
Ž.
Ž.
Ž.
.8C
bars
‰kgHO2
Ž.
Ž.
Falkneretal.1992
Thiswork
Falkneretal.1992
Thiswork
51
22
102
0.156
0.165
y10.36
y10.38
90
6
510
22
105
0.158
0.165
y10.34
y10.37
36
7
520
22
108
0.157
0.165
y10.33
y10.36
89
6
71
22
114
0.157
0.165
y10.31
y10.34
23
1
710
22
118
0.156
0.165
y10.30
y10.33
36
2
720
22
121
0.156
0.165
y10.29
y10.32
29
1
91
22
128
0.157
0.165
y10.26
y10.29
22
7
9100
22
162
0.156
0.168
y10.16
y10.19
79
9
9200
22
201
0.156
0.171
y10.07
y10.09
13
9
20
122
226
0.150
0.163
y10.05
y10.08
63
6
20
10
22
231
0.150
0.163
y10.04
y10.07
76
8
20
20
22
236
0.150
0.163
y10.03
y10.06
88
9
25
118
204
0.191
0.179
y9.96
y10.00
50
8
Ž.
Ž.
ChurchandWolgemuth1972
Thiswork
ChurchandWolgemuth1972
Thiswork
25
135
260
0.121
0.127
y9.96
y10.00
61
8
11
35
180
0.103
0.128
y10.27
y10.482
10
1500
35
360
0.121
0.144
y9.82
y9.957
82

( )C. MonninrChemical Geology 153 1999 187–209 203
constant of the SrSO0 ion pair cannot be determined40Ž .as accurately as that of BaSO aq . Provisional val-4
ues can be obtained using the value of Felmy et al.Ž . Ž .1990 at 258C and the enthalpy of Reardon 1983
0Ž .for the SrSO aq dissociation reaction.4
Only a few Pitzer’s mixing parameters involving
interactions between aqueous barium or strontium
and other cations are available for now. Missing
parameters are best determined from data on ternary
systems that do not exist at present. As such the
present model is limited to moderately concentrated
solutions, although it is difficult to give a quantita-
tive meaning to ‘moderately’. For example, barite
solubility in NaCl solutions can be accurately pre-
dicted to high concentrations at temperatures belowŽ .1008C Fig. 9 , but not above without fitting addi-
Ž .tional parameters Figs. 10 and 11 .
Pressure effects on the thermodynamic properties
of aqueous strontium and barium can be calculated
using the equations for the volumetric properties ofŽ . Ž . Ž .SrCl aq Phutela et al., 1987 and of BaCl aq2 2
Ž .Manohar et al., 1994 along with those for otherŽ .salts Monnin, 1990 in order to compute partial
molal volumes. The derived pressure effect brings
calculated celestite and barite solubilities either inŽ .pure water to 1 kbar Fig. 1 or in NaCl solutions to
Ž .500 bars Figs. 6 and 11 in good agreement with
measured values.
In the present model, due to the fact that most of
the mixing parameters are taken equal to zero, the
barite and celestite solubilities are almost exclusively
calculated from Pitzer’s binary parameters for simple
salts like NaCl, BaCl , SrCl , etc. Expressions giv-2 2
ing these binary parameters as a function of tempera-
ture have been shown to be valid to 08C, allowing
calculations to be carried out for oceanic conditions.
These expressions are summarized in Appendix A.
We can compare predicted activity coefficients ofŽ .BaSO aq in seawater to the results of Church and4
Ž .Wolgemuth 1972 and of Falkner Kenisson et al.Ž . Ž1993 . In Table 2 we report the total or stochiomet-
.ric mean activity coefficient of aqueous barium
sulfate calculated from the distribution of species
and the activity coefficients of the free ions with the
following relationship:
m 2q Pm 2y Pg 2Ba Žaq . ,t SO Žaq . ,t BaSO Žaq . ,t4 4
sm 2q Pm 2y Pg 2Ba Žaq . ,F SO Žaq . ,F BaSO Žaq . ,F4 4
ŽThe subscript t indicates the total concentration or.activity coefficient of the designated species. One
Ž .can see Table 2 that our results for the barite
solubility product are close to those of FalknerŽ .Kenisson et al. 1993 , but our values of the
Ž .BaSO aq activity coefficient are higher by about4
6% than those of Falkner et al. In agreement with
Falkner et al., we find that the variation of the
barium sulfate activity coefficient in seawater in the
moderate temperature and pressure range considered
here is slight, but that a salinity change from 18 to
22‰ has a noticeable effect. Although our value at
258C and 1 bar is close to that of Church andŽ .Wolgemuth 1972 , it is markedly different for 18C,
1 bar and for 18C, 500 bars. We also find that the
barite solubility product determined in this work is in
close agreement with values given by Falkner Kenis-Ž .son et al. 1993 at all temperatures and pressures
where comparison is possible. It is within 10% of
Church and Wolgemuth value at 258C and 1 bar, but
our value is smaller by almost a factor 2 at 18C, 1
bar and by about 40% at 18C, 500 bars. We have
used the present model to calculate the barite satura-
tion state of the world’s ocean. The results areŽ .presented elsewhere Monnin et al., submitted .
Acknowledgements
I am grateful to Roberto Pabalan and an anony-
mous reviewer for their careful and insightful re-
views of the present paper.
Appendix A
The MX activity coefficient and its partial molal
volume at T and P are obtained by calculatingsat
Pitzer’s interaction parameters and the Debye–
Huckel slopes at these conditions. The expressions of¨the various thermodynamic properties of aqueous
Žsolutions activity coefficients, partial molal vol-.umes, activity of water, etc. for simple systems and
for multicomponent mixtures within Pitzer’s formal-Žism are given in many papers see Harvie et al.,
( )C. MonninrChemical Geology 153 1999 187–209204
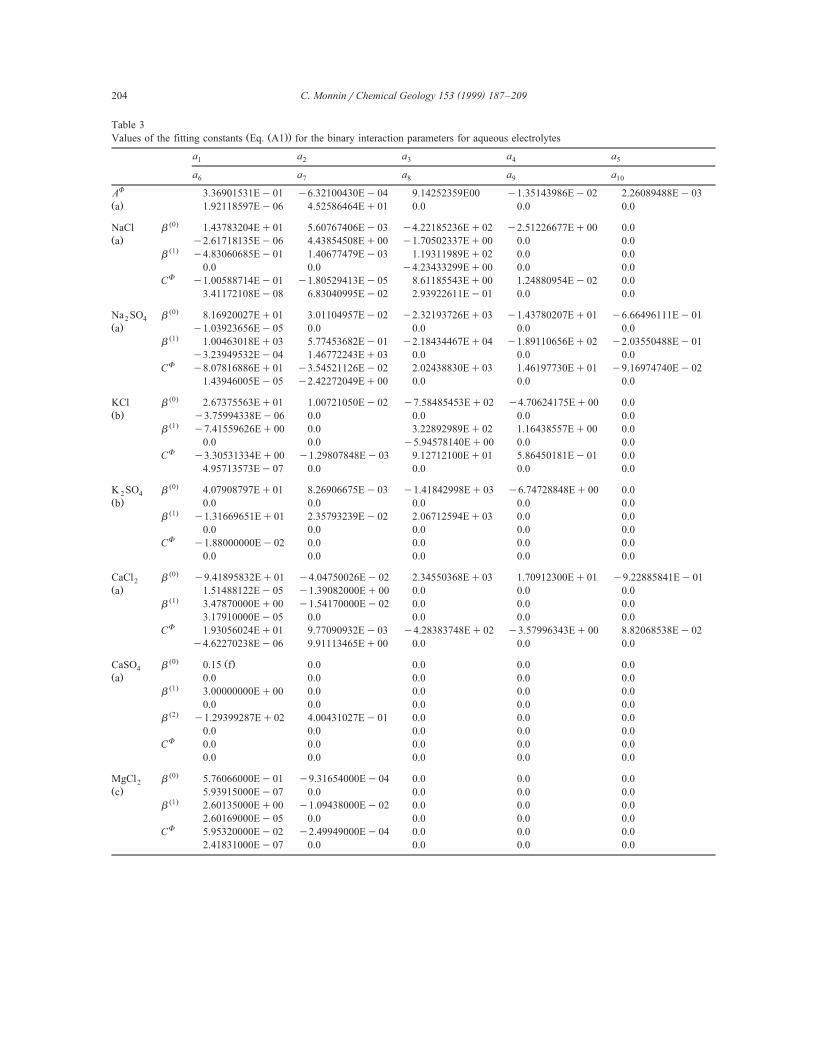
Table 3Ž Ž ..Values of the fitting constants Eq. A1 for the binary interaction parameters for aqueous electrolytes
a a a a a1 2 3 4 5
a a a a a6 7 8 9 10
FA 3.36901531Ey01 y6.32100430Ey04 9.14252359E00 y1.35143986Ey02 2.26089488Ey03Ž .a 1.92118597Ey06 4.52586464Eq01 0.0 0.0 0.0
Ž0.NaCl b 1.43783204Eq01 5.60767406Ey03 y4.22185236Eq02 y2.51226677Eq00 0.0Ž .a y2.61718135Ey06 4.43854508Eq00 y1.70502337Eq00 0.0 0.0
Ž1.b y4.83060685Ey01 1.40677479Ey03 1.19311989Eq02 0.0 0.0
0.0 0.0 y4.23433299Eq00 0.0 0.0FC y1.00588714Ey01 y1.80529413Ey05 8.61185543Eq00 1.24880954Ey02 0.0
3.41172108Ey08 6.83040995Ey02 2.93922611Ey01 0.0 0.0
Ž0.Na SO b 8.16920027Eq01 3.01104957Ey02 y2.32193726Eq03 y1.43780207Eq01 y6.66496111Ey012 4
Ž .a y1.03923656Ey05 0.0 0.0 0.0 0.0Ž1.b 1.00463018Eq03 5.77453682Ey01 y2.18434467Eq04 y1.89110656Eq02 y2.03550488Ey01
y3.23949532Ey04 1.46772243Eq03 0.0 0.0 0.0FC y8.07816886Eq01 y3.54521126Ey02 2.02438830Eq03 1.46197730Eq01 y9.16974740Ey02
1.43946005Ey05 y2.42272049Eq00 0.0 0.0 0.0
KCl b Ž0. 2.67375563Eq01 1.00721050Ey02 y7.58485453Eq02 y4.70624175Eq00 0.0Ž .b y3.75994338Ey06 0.0 0.0 0.0 0.0
Ž1.b y7.41559626Eq00 0.0 3.22892989Eq02 1.16438557Eq00 0.0
0.0 0.0 y5.94578140Eq00 0.0 0.0FC y3.30531334Eq00 y1.29807848Ey03 9.12712100Eq01 5.86450181Ey01 0.0
4.95713573Ey07 0.0 0.0 0.0 0.0
Ž0.K SO b 4.07908797Eq01 8.26906675Ey03 y1.41842998Eq03 y6.74728848Eq00 0.02 4
Ž .b 0.0 0.0 0.0 0.0 0.0Ž1.b y1.31669651Eq01 2.35793239Ey02 2.06712594Eq03 0.0 0.0
0.0 0.0 0.0 0.0 0.0FC y1.88000000Ey02 0.0 0.0 0.0 0.0
0.0 0.0 0.0 0.0 0.0
Ž0.CaCl b y9.41895832Eq01 y4.04750026Ey02 2.34550368Eq03 1.70912300Eq01 y9.22885841Ey012
Ž .a 1.51488122Ey05 y1.39082000Eq00 0.0 0.0 0.0Ž1.b 3.47870000Eq00 y1.54170000Ey02 0.0 0.0 0.0
3.17910000Ey05 0.0 0.0 0.0 0.0FC 1.93056024Eq01 9.77090932Ey03 y4.28383748Eq02 y3.57996343Eq00 8.82068538Ey02
y4.62270238Ey06 9.91113465Eq00 0.0 0.0 0.0
Ž0. Ž .CaSO b 0.15 f 0.0 0.0 0.0 0.04
Ž .a 0.0 0.0 0.0 0.0 0.0Ž1.b 3.00000000Eq00 0.0 0.0 0.0 0.0
0.0 0.0 0.0 0.0 0.0Ž2.b y1.29399287Eq02 4.00431027Ey01 0.0 0.0 0.0
0.0 0.0 0.0 0.0 0.0FC 0.0 0.0 0.0 0.0 0.0
0.0 0.0 0.0 0.0 0.0
Ž0.MgCl b 5.76066000Ey01 y9.31654000Ey04 0.0 0.0 0.02
Ž .c 5.93915000Ey07 0.0 0.0 0.0 0.0Ž1.b 2.60135000Eq00 y1.09438000Ey02 0.0 0.0 0.0
2.60169000Ey05 0.0 0.0 0.0 0.0FC 5.95320000Ey02 y2.49949000Ey04 0.0 0.0 0.0
2.41831000Ey07 0.0 0.0 0.0 0.0

( )C. MonninrChemical Geology 153 1999 187–209 205
Ž .Table 3 continued
a a a a a1 2 3 4 5
a a a a a6 7 8 9 10
Ž0.MgSO b 9.39251515Eq01 y5.14100000Ey01 y6.84801984Eq03 0.0 0.04
Ž .c 1.41316667Ey03 0.0 0.0 y1.94722500Ey06 1.07875000Ey09Ž1.b 5.28624842Eq02 y1.47980000Ey01 y5.78048532Eq03 0.0 0.0
1.57606667Ey04 0.0 0.0 0.0 0.0Ž2.b 1.06150006Eq03 y6.88200000Eq00 y6.78768888Eq04 0.0 0.0
2.02016667Ey02 0.0 0.0 y2.30350000Ey05 0.0FC y3.71761334Eq01 2.10820004Ey01 2.62610734Eq03 0.0 0.0
y5.95440002Ey04 0.0 0.0 8.36666686Ey07 y4.6872000Ey10
Ž0.SrCl b 4.42847700Eq00 y1.09557500Ey02 y5.12215000Eq02 0.0 0.02
Ž .d 9.44275000Ey06 0.0 0.0 0.0 0.0Ž1.b 1.14437700Eq01 y3.36065000Ey02 y1.06459300Eq03 0.0 0.0
4.24357000Ey05 0.0 0.0 0.0 0.0FC y1.54490900Ey02 0.0 4.51223000Eq00 0.0 0.0
0.0 0.0 0.0 0.0 0.0
Ž0.BaCl b 3.43831400Eq01 6.37500000Ey04 y1.33653000Eq03 y5.30213100Eq00 0.02
Ž .e 4.60872500Ey06 0.0 0.0 0.0 0.0Ž1.b y1.04230500Eq02 3.22500000Ey03 4.37411000Eq03 1.58751700Eq01 0.0
y6.77403000Ey06 0.0 0.0 0.0 0.0FC y2.41201200Eq01 y1.53700000Ey04 7.87197800Eq02 3.90395300Eq00 0.0
y1.10262000Ey05 0.0 0.0 8.76150800Ey09 0.0
Ž . Ž . Ž . Ž . Ž . Ž . Ž . Ž . Ž . Ž . Ž .a Moller 1988 ; b Greenberg and Moller 1989 ; c Pabalan and Pitzer 1987 ; d Phutela et al. 1987 ; e Monnin 1995 ; f note thatŽ0.Ž . Ž .the b CaSO parameter is reported as 0.015 by Greenberg and Moller 1989 . This seems to be an error although these authors refer to4
Ž . Ž .the paper of Moller 1988 . When used instead of 0.15, this value 0.015 leads to noticeable discrepancies in the calculation of the
thermodynamic properties of aqueous calcium ion.
1984; Pabalan and Pitzer, 1987; Weare, 1987; Moller,
1988; Greenberg and Moller, 1989; Monnin, 1989,.1990; Pitzer, 1991, among others . Pabalan and Pitzer
Ž . Ž . Ž .1987 , Phutela et al. 1987 , Moller 1988 , Green-Ž . Ž .berg and Moller 1989 and Monnin 1995 have
used different empirical functions describing the
variation of Pitzer’s parameters with respect to tem-
perature. For computational ease, these functions can
be recast into the following ten parameter expression
using simple algebraic transformations:
a a3 5 2X T sa qa Tq qa lnTq qa TŽ . 1 2 4 6T Ty263
a a7 8 3 4q q qa T qa T9 10680yT Ty227
A1Ž .
Ž . Ž0.with X T being either Pitzer’s parameters b ,
b Ž1., b Ž2., CF, Q orC or their first derivatives with
respect to pressure noted b Ž0.,v, b Ž1.,v, b Ž2.,v, CF ,v,
v v Ž .Q orC . The a constants in Eq. A1 are given ini
Table 3 for Pitzer’s interaction parameters for pure
electrolytes and in Table 4 for the ternary parame-
ters. These constants for the standard partial molal
volumes of the aqueous solutes and for the interac-
tion parameters for their volumetric properties are
reported in Table 5.Ž .Moller 1988 established the following expres-
sion for the variation with temperature of AF, the
Debye–Huckel slope for the activity coefficient:¨
AFs3.36901531=10y1y6.32100430=10y4T
q9.14252359rTy1.35143986
=10y2 lnTq2.26089488=10y3r Ty263Ž .
q1.92118597=10y6T 2q4.52586464
=101r 680yTŽ .

( )C. MonninrChemical Geology 153 1999 187–209206
Table4
ŽŽ
..FittingconstantsEq.A1forPitzer’sternaryinteractionparameters
aa
aa
aa
12
34
56
Ž.
Ž.
uCl,SO
25–150a
0.07
0.0
0.0
0.0
0.0
0.0
4
Ž.
Ž.
uCl,SO
150–250a
5.67983244Eq1
y1.63021206Ey1
y1.8747982Eq4
5.70511185
8.900099309Eq2
9.2144343Ey5
4
Ž.
Ž.
cNa,Cl,SO
25–150a
y0.009
0.0
0.0
0.0
0.0
0.0
4
Ž.
Ž.
cNa,Cl,SO
150–250a
y3.29811409Eq2
y4.42410302Ey2
1.62957351Eq4
5.16258079Eq1
y3.53341751Eq2
0.0
4
Ž.Ž.
cK,Cl,SO
ay2.12481475Ey1
2.4869833Ey4
3.7561961Eq1
0.0
0.0
0.0
4
Ž.Ž.
cCa,Cl,SO
ay0.018
0.0
0.0
0.0
0.0
0.0
4
Ž.Ž.
cMg,Cl,SO
by1.174Ey1
0.0
32.63
0.0
0.0
0.0
4
Ž.Ž.
uNa,K
ay5.02312111Ey2
0.0
1.40213141Eq1
0.0
0.0
0.0
Ž.Ž.
cNa,K,Cla
1.34211308Ey2
0.0
y5.10212917
0.0
0.0
0.0
Ž.
Ž.
cNa,K,SO
0–150Ca
3.4811517Ey2
0.0
y8.21656777
0.0
0.0
0.0
4
Ž.
Ž.
cNa,K,SO
150–250Ca
6.56482122y2
0.0
y2.12621122Eq1
0.0
0.0
0.0
4
Ž.Ž.
uNa,Caa
0.05
0.0
0.0
0.0
0.0
0.0
Ž.Ž.
cNa,Ca,Cla
y0.003
0.0
0.0
0.0
0.0
0.0
Ž.Ž.
cNa,Ca,SO
ay0.012
0.0
0.0
0.0
0.0
0.0
4
Ž.Ž.
uNa,Mgb
0.07
0.0
0.0
0.0
0.0
0.0
Ž.Ž.
cNa,Mg,Clb
1.99Ey2
0.0
y9.51
0.0
0.0
0.0
Ž.Ž.
uNa,Src
0.051
0.0
0.0
0.0
0.0
0.0
Ž.Ž.
cNa,Sr,Clc
y0.0021
0.0
0.0
0.0
0.0
0.0
Ž.Ž.
cNa,Ba,Cld
0.0128
0.0
0.0
0.0
0.0
0.0
Ž.Ž.
uK,Caa
0.1156
0.0
0.0
0.0
0.0
0.0
Ž.Ž.
cK,Ca,Cla
4.76278977Ey2
0.0
y2.70770507Eq1
0.0
0.0
0.0
Ž.Ž.
cK,Ca,SO
a0.0
0.0
0.0
0.0
0.0
0.0
4
Ž.Ž.
uK,Mgb
0.0
0.0
0.0
0.0
0.0
0.0
Ž.Ž.
cK,Mg,Clb
2.586Ey2
0.0
y14.27
0.0
0.0
0.0
Ž.
Ž.Ž.
Ž.Ž.
Ž.Ž.
Ž.
aGreenbergandMoller1989;bPabalanandPitzer1987;cReardonandAmstrong1987;dMonnin1995.Allotherparametersareequaltozero.

( )C. MonninrChemical Geology 153 1999 187–209 207
Table 5
Fitting coefficients for the interaction parameters for the partial molal volumes and for the standard partial molal volumes of aqueousŽ Ž ..electrolytes Eq. A1
a a a a a1 2 3 4 5
a a a a a6 7 8 9 10
0Ž .NaCl a V 8.520003Ey02 y3.581619 y7.515469Eq04 0.0 0.0
7.234513Ey03 0.0 y3.007338Eq02 y5.839699Ey06 0.0Ž0.,vb 5.3699517Ey05 y2.6538013Ey07 0.0 0.0 0.0
8.6255554Ey10 y2.682931Ey02 2.2020163Ey03 0.0 0.0Ž1.,vb 3.200188Ey3 y1.092875Ey06 y8.373935Ey01 0.0 0.0
y7.1016610Ey9 0.0 4.901041Ey02 0.0 0.0F ,vC 1.145144Ey05 y4.527545Ey08 0.0 0.0 0.0
4.34633Ey11 2.595239Ey04 y2.165713Ey04 0.0 0.0
0Ž .Na SO b V 1.281259Eq03 y3.292342 y1.231424Eq05 0.0 0.02 4
4.267199Ey03 y9.132116Eq04 1.067946Eq3 0.0 0.0Ž0.,vb 5.3088Ey05 4.33707Ey6 1.42266Ey01 y2.70953Ey04 0.0
y3.262413Ey09 0.0 4.51986Ey03 0.0 0.0Ž1.,vb 3.200188Ey03 y1.092875Ey06 y8.373935Ey01 0.0 0.0
y7.1016610Ey09 0.0 4.901041Ey02 0.0 0.0F ,vC y2.7186409Ey04 1.84544081Ey6 7.1598902Ey02 0.0 0.0
y7.10166104Ey09 0.0 y4.1886382Ey03 0.0 0.0
0Ž .CaCl b V 4.175000Eq01 4.121094Ey01 0.0 0.0 0.02
y2.841949Ey4 y4.35200Eq04 y5.54500Eq02 0.0 0.0Ž0.,vb y9.949027Ey05 4.549863Ey7 0.0 0.0 0.0
y3.008955Ey10 y1.201352Ey2 2.501298Ey3 0.0 0.0F ,vC 2.34138Ey5 y1.405386Ey7 0.0 0.0 0.0
2.97171Ey10 0.0 y1.7478264Ey4 y2.146539Ey13 0.0
0Ž .MgCl c V y1.798135Eq03 1.719652Eq01 0.0 0.0 0.02
y5.421483Ey02 0.0 0.0 5.6747Ey05 0.0Ž0.,vb y5.4648Ey04 2.6088Ey06 0.0 0.0 0.0
y3.2424Ey09 0.0 5.116Ey03 0.0 0.0F ,vC 2.2968216Ey05 7.121304Ey080.0 0.0 0.0 0.0
1.8013521Ey07 0.0 y2.131572Ey04 0.0 0.0
0Ž .SrCl d V y1.22812Eq03 4.2668 1.19602Eq5 0.0 0.02
y4.80302Ey03 0.0 0.0 0.0 0.0Ž0.,vb y2.14925Ey04 0.0 7.65753Ey02 0.0 0.0
0.0 0.0 0.0 0.0 0.0Ž1.,vb y7.54375Ey05 0.0 0.0 0.0 0.0
0.0 0.0 0.0 0.0 0.0F ,vC 0.0 0.0 0.0 0.0 0.0
0.0 0.0 0.0 0.0 0.0
0 Ž .BaCl V e y1.553467Eq02 6.3836Ey01 0.0 0.0 0.02
y1.7000Ey02 0.0 0.0 0.0 0.0Ž0.,v Ž .b f 8.670239Ey5 y4.977946Ey7 0.0 0.0 0.0
5.583802Ey10 0.0 2.154935Ey3 0.0 0.0Ž1.,v Ž .b f 0.0 0.0 0.0 0.0 0.0
0.0 0.0 0.0 0.0 0.0F ,v Ž .C f y8.240557Ey5 2.433938Ey7 0.0 0.0 0.0
0.0 0.0 7.142877Ey4 0.0 0.0
Ž . Ž . Ž . Ž . Ž . Ž . Ž . Ž . Ž . Ž . Ž .a Rogers and Pitzer 1982 ; b Monnin 1990 ; c Monnin 1989 ; d Phutela et al. 1987 ; e Puchalska and Atkinson 1991 ; fŽ .Manohar et al. 1994 . Note that the CaCl parameters can be used in place of these. See text.2

( )C. MonninrChemical Geology 153 1999 187–209208
The Debye–Huckel slope for the partial molal¨v Ž .volume, A , is given by Monnin 1990 as a function
of temperature: from 0 to 1008C,
Avs8.106377y1.256008=101Tq7.760276
=10y4T 2y2.098163=10y6T 3q2.25777
=10y9T 4
from 100 to 3008C:
Avs3.849971=102y6.982754Tq3.877068
=10y2T 2y1.11381=10y4T 3q1.589736
=10y7T 4y9.395266=10y11T 5q6.469241
=10q4r 680yTŽ .
When necessary, concentration scale conversions
have been carried out using the VOPO programŽ .Monnin, 1994 .
References
Baker, P.A., Bloomer, S.H., 1988. The origin of celestite in
deep-sea carbonate sediments. Geochim. Cosmochim. Acta 52,
335–339.
Blount, C.W., 1977. Barite solubilities and thermodynamic quanti-
ties up to 3008C and 1400 bars. Am. Min. 62, 942–957.
Church, T.M., Wolgemuth, K., 1972. Marine barite saturation.
Earth Planet. Sci. Lett. 15, 35–44.
Culberson, C.H., Latham, G., Bates, R.G., 1978. Solubilities and
activity coefficients of calcium and strontium sulfates in syn-
thetic seawater at 0.5 and 258C. J. Phys. Chem. 82, 2693–2699.
Falkner Kenisson, K., Klinkhammer, G.P., Bowers, T.S., Todd,
J.F., Lewis, B.L., Landing, W.M., Edmond, J.M., 1993. The
behavior of barium in anoxic marine waters. Geochim. Cos-
mochim. Acta 57, 537–554.
Felmy, A.R., Rai, D., Amonette, J.E., 1990. The solubility of
barite and celestite in sodium sulfate: evaluation of thermody-Ž .namic data. J. Sol. Chem. 19 2 , 175–185.
Greenberg, J.P., Moller, N., 1989. The prediction of mineral
solubilities in natural waters: a chemical equilibrium model for
the system to high concentration from 0 to 2508C. Geochim.
Cosmochim. Acta 53, 2503–2518.
Harvie, C., Moller, N., Weare, J.H., 1984. The prediction of
mineral solubilities in natural waters: the system to high ionic
strengths at 258C. Geochim. Cosmochim. Acta 48, 723–751.
Holmes, H.F., Busey, R.H., Simonson, J.M., Mesmer, R.E., 1994.Ž .CaCl aq at elevated temperatures. Enthalpies of dilution,2
isopiestic molalities and thermodynamic properties. J. Chem.
Therm. 26, 271–298.
Jacques, D.F., Bourland, B.I., 1983. A study of the solubility of
strontium sulfate. Soc. Am. Pet. Eng. J. 4, 292–300.
Jiang, C., 1996. Solubility and solubility constant of barium
sulfate in aqueous sodium sulfate solutions between 0 andŽ .808C. J. Sol. Chem. 25 1 , 105–111.
Johnson, K.S., Pytckowicz, R.M., 1979. Ion association and activ-
ity coefficients in electrolyte solutions. In: Pytckowicz, R.M.
Ž .Ed. , Activity Coefficients in Electrolyte Solutions, Vol. II.
CRC Press, pp. 63–152.
Lanier, R.D., 1965. Activity coefficients of sodium chloride in
aqueous three-component solutions by cation-sensitive elec-
trodes. J. Phys. Chem. 69, 3992–3998.
Langmuir, D., Melchior, D., 1984. The geochemistry of Ca, Sr,
Ba and Ra sulfates in some deep brines from the Palo Duro
Basin, Texas. Geochim. Cosmochim. Acta 49, 2423–2432.
Lucchesi, P.J., Whitney, E.D., 1962. Solubility of strontium sul-
fate in water and aqueous solutions of hydrogen chloride,
sodium chloride, sulfuric acid and sodium sulfate by the
radiotracer method. J. Appl. Chem 12, 277–279.
MacDonald, R.W., North, N.A., 1974. The effect of pressure on
the solubility of CaCO , CaF and SrSO in water. Can. J.3 2 4
Chem. 52, 3181–3186.
Manohar, S., Puchalska, D., Atkinson, G., 1994. Pressure–
volume–temperature properties of aqueous mixed electrolyte
solutions: NaClqBaCl from 25 to 1408C. J. Chem. Eng.2
Data 39, 150–154.
Millero, F.J., 1979. Effects of temperature and pressure on activityŽ .coefficients. In: Pytckowicz, R.M. Ed. , Activity Coefficients
in Electrolyte Solutions, Vol. II. CRC Press, pp. 63–152.
Moller, N., 1988. The prediction of mineral solubilities in natural
waters: a chemical equilibrium model for the system to high
temperature and concentration. Geochim. Cosmochim. Acta
52, 821–837.
Monnin, C., 1989. An ion interaction model for the volumetric
properties of natural waters: density of the solution and partial
molal volumes of electrolytes to high concentration at 258C.
Geochim. Cosmochim. Acta 53, 1177–1188.
Monnin, C., 1990. The influence of pressure on the activity
coefficients of the solutes and on the solubility of minerals in
the system Na–Ca–Cl–SO –H O to 2008C and 1 kbar, and to4 2
high NaCl concentration. Geochim. Cosmochim. Acta 54,
3265–3282.
Monnin, C., 1994. Density calculation and concentration scaleŽ .conversions for natural waters. Comp. Geosci. 20 10 , 1435–
1445.
Monnin, C., 1995. Thermodynamic properties of the Na–K–Ca–
Ba–Cl–H O system to 473.15 K and solubility of barium2
chloride hydrates. J. Chem. Eng. Data 40, 828–832.
Monnin, C., Galinier, C., 1988. The solubility of celestite and
barite in electrolyte solutions and natural waters at 258C: a
thermodynamic study. Chem. Geol. 71, 283–296.
Monnin, C., Jeandel, C., Dehairs, F., Cattaldo, T., submitted. The
barite saturation state of the world’s ocean. Mar. Chem.
Pabalan, Pitzer, 1987. Thermodynamics of concentrated elec-
trolyte mixtures and the prediction of mineral solubilities to
high temperature for mixtures in the system Na–K–Mg–Cl–
SO –H O. Geochim. Cosmochim. Acta 51, 2429–2443.4 2
Pitzer, K.S., 1991. Ion interaction approach: theory and dataŽ .correlation. In: Pitzer, K.S. Ed. , Activity coefficients in
Electrolyte Solutions, 2nd edn. CRC Press, pp. 75–155.
Phutela, R.C., Pitzer, K.S., Saluja, P.P.S., 1987. Thermodynamics
of aqueous magnesium chloride, calcium chloride and stron-
tium chloride at elevated temperatures. J. Chem. Eng. Data 32,
76–80.

( )C. MonninrChemical Geology 153 1999 187–209 209
Puchalska, D., Atkinson, G., 1991. Densities and apparent molal
volumes of aqueous BaCl solutions from 15 to 1408C and2
from 1 to 200 bars. J. Chem. Eng. Data 36, 449–452.
Puchelt, H., 1967. Zur Geochemie des Bariums in Exogenem
Zyklus. Springer, Heidelberg, 205 pp.
Raju, K.U.G., Atkinson, G., 1988. Thermodynamics of scaleŽ .mineral solubilities: 1. BaSO s in H O and aqueous NaCl. J.4 2
Ž .Chem. Eng. Data 33 s , 490–495.
Raju, K.U.G., Atkinson, G., 1989. Thermodynamics of scaleŽ .mineral solubilities: 2. SrSO s in aqueous NaCl. J. Chem.4
Ž .Eng. Data 34 s , 361–364.
Reardon, E.J., 1983. Determination of SrSO0 ion pair using4
conductimetric and ion exchange techniques. Geochim. Cos-
mochim. Acta 47, 1917–1922.Ž .Reardon, E.J., Amstrong, D.K., 1987. Celestite SrSO solubil-4Žs .
ity in water, seawater and NaCl solutions. Geochim. Cos-
mochim. Acta 51, 63–72.
Robie, R.A., Hemingway, B.S., Fisher, J.R., 1979. Thermody-
namic properties of minerals and related substances and 298.15
K and 1 bar pressure and at higher temperatures. USGS
Bulletin 1452.
Schulien, S., 1987. High temperaturerhigh pressure solubility
measurements in the systems BaSO –NaCl–H O and4 2
SrSO –NaCl–H O in connection with scale studies. SPE4 2
Special Publications 16,264, pp. 233–246.
Strubel, G., 1966. Die hydrothermale Loslichkeit von Colestin in¨ ¨ ¨
System SrSO –NaCl–H O. Neues Jahr. Miner. Monatsh.,4 2
99–107.
Strubel, G., 1967. Zur Kenntnis und genetischen Bedeutung des¨Systems BaSO –NaCl–H O. Neues Jahr. Miner. Monatsh.,4 2
223–234.
Templeton, C.C., 1960. Solubility of barium sulfate in sodium
chloride solutions from 25 to 958C. J. Chem. Eng. Data,
514–516.
Uchameyshvili, N.Y., Malinin, S.D., Khitarov, N.I., 1966. Solu-
bility of barite in concentrated chloride solutions of some
metals at elevated temperatures in relation to problems of the
genesis of barite deposits. Geochem. Int. 10, 951–963.
Vetter, O.J.G, Vanderbroek, I., Nayberg, J., 1983. SrSO : the4
basic solubility data. Int. Symp. on Oilfield and Geothermal
Chemistry, Denver, CO, June 1–3, 1983. Am. Soc. Pet. Eng.,
271–281.
Weare, J., 1987. Models of mineral solubility in concentrated
brines with application to field observation. In: Carmichael,Ž .I.S.E., Eugster, H.P. Eds. , Thermodynamic Modeling of
Geological Material: Minerals, Fluids and Melts. Rev. Miner.
17, pp. 143–174, Miner. Soc. Am., 499 pp.
Whitfield, M., 1975. The extension of chemical models for seawa-
ter to include trace components at 258C and 1 atm. pressure.
Geochim. Cosmochim. Acta 39, 1545–1557.
Yuan, M.D., Todd, A.C., 1991. Prediction of sulfate scaling
tendencies in oilfield operations. SPE Prod. Eng., 63–72.