A Theory of Bank Resolution: Political Economics and
40
A Theory of Bank Resolution: Political Economics and Technological Change Robert DeYoung** University of Kansas Lawrence, KS 66045 Jack Reidhill* Federal Deposit Insurance Corporation Washington, DC 20219 THIS DRAFT: May 18, 2008 Abstract: The policy tradeoff between protecting liquidity and imposing market discipline when resolving failed banks is well recognized, but it is seldom formally modeled. We develop a simple theoretical framework in which the bank resolution authority prefers protecting uninsured creditors (providing liquidity) to imposing losses on uninsured creditors (imposing discipline) at the margin. The authority is constrained in its choices by existing laws, institutions, technologies, economic circumstances, and bank size, and we demonstrate how changes in these conditions can alter the authority’s behavior. Our analysis illustrates how a combination of increased resolution authority coupled with reduced decision-making latitude helped mitigate the liquidity-discipline tradeoff at large U.S. bank failures during the 1980s and 1990s. The findings of our analysis may be especially prescriptive outside of the U.S., where weak bankruptcy laws and inefficient information systems will not support such socially efficient outcomes, leading to blanket guarantees at failed banks that render their deposit insurance systems superfluous. JEL codes: G21, G28 Key words: bank failure, deposit insurance, failed bank resolution * The views expressed in this paper are those of the authors and do not necessarily reflect positions held by the Federal Deposit Insurance Corporation. The authors thank Ken Jones, George Kaufman, Paul Kupiec, Rose Kushmeider and Carlos Ramirez for their insights and suggestions. ** DeYoung is the corresponding author: University of Kansas School of Business, Department of Finance, Summerfield Hall, 1300 Sunnyside Avenue, Lawrence, KS 66045, [email protected] .
Transcript of A Theory of Bank Resolution: Political Economics and

A Theory of Bank Resolution: Political Economics and Technological Change
Robert DeYoung** University of Kansas Lawrence, KS 66045
Jack Reidhill*
Federal Deposit Insurance Corporation Washington, DC 20219
THIS DRAFT: May 18, 2008
Abstract: The policy tradeoff between protecting liquidity and imposing market discipline when resolving failed banks is well recognized, but it is seldom formally modeled. We develop a simple theoretical framework in which the bank resolution authority prefers protecting uninsured creditors (providing liquidity) to imposing losses on uninsured creditors (imposing discipline) at the margin. The authority is constrained in its choices by existing laws, institutions, technologies, economic circumstances, and bank size, and we demonstrate how changes in these conditions can alter the authority’s behavior. Our analysis illustrates how a combination of increased resolution authority coupled with reduced decision-making latitude helped mitigate the liquidity-discipline tradeoff at large U.S. bank failures during the 1980s and 1990s. The findings of our analysis may be especially prescriptive outside of the U.S., where weak bankruptcy laws and inefficient information systems will not support such socially efficient outcomes, leading to blanket guarantees at failed banks that render their deposit insurance systems superfluous. JEL codes: G21, G28 Key words: bank failure, deposit insurance, failed bank resolution * The views expressed in this paper are those of the authors and do not necessarily reflect positions held by the Federal Deposit Insurance Corporation. The authors thank Ken Jones, George Kaufman, Paul Kupiec, Rose Kushmeider and Carlos Ramirez for their insights and suggestions. ** DeYoung is the corresponding author: University of Kansas School of Business, Department of Finance, Summerfield Hall, 1300 Sunnyside Avenue, Lawrence, KS 66045, [email protected].

1. Introduction
Commercial banks play a special role in our economy. Banks provide funds to businesses that
are unable to access credit in public markets—as a result, a large portion of bank assets are difficult to
value and hence are illiquid. And as the central institution in our payments system, banks provide
liquidity to depositors through demandable deposit accounts—as a result, a large portion of bank
liabilities are unstable. This combination of risky, illiquid assets financed by highly liquid debt makes
banks financially fragile and susceptible to depositor runs which, in some circumstances, can lead to
credit shortages and disruptions to payments. Depending on the size of the bank involved, these
phenomena can have deleterious effects (i.e., contagions) on other banks and on the economy at large.1
Repeated banking panics in the United States during the nineteenth and early twentieth centuries
led law makers there to insure a large portion of banks’ deposit funding. By shielding small depositors
from losses if their bank failed, deposit insurance reduced the incentives for depositors to run and
precipitate insolvency at their banks. To ensure that payments to and from depositors are not disrupted
should a bank become insolvent, U.S. banks are not subject to the same lengthy bankruptcy proceedings
as non-bank corporations, but rather are resolved using special rules established Congress and
implemented by the Federal Deposit Insurance Corporation (FDIC).
Like all regulatory solutions to market failure, deposit insurance protections and bank resolution
procedures are second-best arrangements that result in incentive incompatibilities. Both bank depositors
and bank managers have incentives to chase higher returns without fully bearing the associated downside
risks. Knowing (or suspecting) that their deposits are protected from loss, insured (and to a lesser extent,
uninsured) depositors have little incentive to monitor the financial condition of their banks, keeping their
funds deposited at troubled banks and often earning above-market interest rates in the process. Because
they hold a deposit insurance put option, managers of troubled banks face incentives to “gamble for
resurrection” by paying above-market rates for deposits and investing those funds in risky loans. In both
1 Hoggarth and Saporta (2001) estimate that the economic costs of a systemic bank failure event could run as high as 15% to 20% of a nation’s GDP.
1

cases, these behaviors are enabled by the reduction in market discipline engendered by the presence of
deposit insurance regulation, and the costs of these behaviors are ultimately borne by society in the form
of higher overall costs of deposit insurance, such as higher deposit insurance premiums for well-run banks
or taxpayer bailouts of failed depository institutions and insolvent insurance funds.
As a first principle, we observe that regulatory authorities have ex ante preferences for bailing out
uninsured depositors rather than imposing losses upon them.2 Government deposit insurers strongly
identify with their mission of protecting insured depositors, and when administratively possible, this
culture can easily err on the side of protecting uninsured depositors as well. This predilection may be
exacerbated in certain circumstances—such as during economic crises and/or when a large bank becomes
insolvent—when political pressure arises to protect all depositors. Kane and Klingebiel (2004) offer a
consistent though more cynical assessment: Regulators exhibit a bias toward bailing out all depositors
because they do not want to be blamed (rightly or wrongly) for the bank failure by disgruntled
(unprotected) depositors. Regardless of regulator motive, bailing out uninsured depositors reduces
deposit market discipline: it reinforces the incentives for depositors to lend to risky banks, and it enhances
the value of the deposit insurance put option.
The degree to which the failed bank resolution process imposes discipline on depositors rests not
only on whether depositors get paid or bailed out, but also on how quickly regulators pay or bail out
depositors. Slight delays in paying insured depositors may have positive market discipline effects by
imposing costs on insured depositors who decided to provide funds to risky banks; if authorities can
credibly commit to such a practice, depositors will have incentives to monitor the banks and demand
higher rates on funds they deposit in risky banks. But long delays in paying depositors may create
political pressures to speed up payments—in the end, this can create an environment in which all
depositors are protected, squashing attempts to hold even uninsured depositors responsible for their own
actions and making regulatory forbearance (i.e., keeping an insolvent bank open in hopes that it will
recover) even more likely. Moreover, as recently witnessed at Northern Rock, long delays in taking
2 When we refer to uninsured depositors we generally mean both uninsured depositors and general creditors.
2

action to resolve troubled banks can raise uncertainty among depositors that the bank’s condition is
deteriorating unchecked, precipitating depositor runs on the bank.
Much has been written about the incentives facing deposit insurers, the impact of these incentives
on efficient failed bank resolution policy, and policy prescriptions for mitigating socially inefficient
regulatory behavior that results from these incentives.3 For example, Kane (1995) characterizes the
relationship between the deposit insurer, taxpayer, and depositor as a surety bond. He shows how the
current legal and regulatory arrangements represent an incomplete market that creates incentives for
regulators to practice forbearance—even under the so-called “prompt corrective action” (PCA) features
introduced by the Federal Deposit Insurance Corporation Improvement Act (FDICIA) of 1991. Kaufman
and Seelig (2002) and Kaufman (2003) propose a combination of quick access to insured deposit funds
and a partial “advance” dividend payment to uninsured depositors (based on a first approximation of the
value of the failed bank’s assets) in order to maintain financial liquidity while still imposing at least a
modicum of discipline on depositors. A continuing line of policy proposals in this same vein is provided
by Kaufman (2004), Mayes (2004), Kaufman and Eisenbeis (2005), and Harrison, Anderson, and
Twaddle (2007). Much earlier, Rosengren and Simon (1992) suggested that transferable put options—
whereby banks purchasing loans from a failed bank could return those loans to the FDIC in the case of
future default—would reduce failed bank resolution costs by increasing the marketability of failed bank
assets.
In this paper, we argue that the tradeoff between maintaining financial liquidity and encouraging
deposit markets to impose discipline on banks and depositors is the central defining feature of bank
resolution authority behavior. Importantly, we also argue that this fundamental tradeoff and its attendant
economic implications grow more intense (a) for large bank resolution and (b) in countries with legal
institutions that are inadequate or inappropriate for resolving failed banks. There has been only
incomplete discussion to date regarding the nature or necessity of this tradeoff and how this tradeoff is
3 A related line of inquiry concerns the incentives of the “lender of last resort” (the central bank) when faced with a bank that is illiquid but not (yet) insolvent. See Freixas and Parigi (2008) for a recent survey of these issues.
3

influenced by technological advance, regulatory constraints, legal institutions, and political pressure, as
well as by the preferences of the resolution authority. To facilitate a more complete discussion, we
present a simple theoretical framework in which to consider these effects. In our model, the resolution
authority has a strong preference for providing liquidity and a weak preference for enhancing discipline;
maximizes its utility by choosing among resolution strategies that provide greater (lesser) amounts of
liquidity in exchange for lesser (greater) amounts of discipline; and is constrained in its choices by
available resolution technologies and existing government policies. While this a highly stylized
framework, we believe it will help focus the discussion of failed bank resolution policy on the underlying
liquidity-discipline tradeoff and its consequences, as well as provide a first platform for theoreticians to
study these issues more analytically and more formally than we do here.
The paper proceeds as follows. Section 2 provides a short review of the fundamental economics
of liquidity provision and market discipline in failed bank resolutions. We highlight two extreme
episodes from the U.S. experience: the pre-FDIC years in which failure resolution policy stressed market
discipline with little concern for liquidity provision, and the thrift crisis of the 1980s-1990s in which
failure resolution policy stressed liquidity provision with little concern for market discipline. In Section 3
we discuss two technologies—one a production technology, the other a legal technology—that determine
the efficiency with which failed banks are resolved. First, we introduce the concept of “insurance
determination,” an often arcane procedure by which the resolution authority identifies which deposits are
insured and which deposits are un-insured. Second, we compare the special bank resolution powers
possessed by the FDIC (and a limited set of non-U.S. bank regulators) to the standard bankruptcy
processes used in many other countries. Improvements in either of these technologies allow resolution
authorities to enhance market discipline without restricting liquidity. In Section 4 we present our simple
theoretical framework of failed bank resolution policy. (In a detailed Appendix, we use this framework to
illustrate 75 years of bank resolution policies in the U.S.) In Section 5 we conclude, summarize, and
briefly discuss the implications of our analysis for bank resolution in the U.S., in other developed
economies, and in developing nations.
4

2. The Resolution Conflict: Liquidity versus Discipline
Academic experts and banking authorities tend to have different appetites for imposing losses on
uninsured bank creditors. Academics are especially cognizant of moral hazard. They advocate strict
adherence to ex ante rules that encourage market discipline, quickly closing and resolving troubled
financial institutions and imposing appropriate losses on uninsured creditors. Banking authorities, and
central bankers in particular, are well aware of moral hazard’s corrosive effects but weight more heavily
the macroeconomic damage caused by the illiquidity that results from closing banks and imposing losses
on the uninsured depositors and creditors. To some extent, these differing points of view stem from the
long-term view enjoyed by academics versus the short-term pragmatism often required of banking
authorities.
While bank resolution authorities are implicitly charged with making decisions that maximize the
welfare of society at large, the actual strategies they select can also reflect their own more narrow
objectives and preferences. Whether or not this rises to the level of a serious principle-agent problem is
the subject of some debate (Kane 1990, Mishkin 1992). As we discuss below, divergence between the
actions of the FDIC and the objectives of the U.S. Congress has more than once elicited legislative
changes proscribing the decision-making latitude of the deposit insurer.
Because most of the academic attention to these issues has focused of the U.S. experience, and
because the U.S. has the longest history of deposit insurance and failed bank resolution policy, we will
couch much of our discussion in terms of the FDIC. The FDIC has used a wide variety of resolution
techniques during its 75 year history. Some of these techniques have only recently become available to
the FDIC via new laws or improved technologies, while others are no longer available or have fallen into
disuse over time. Table 1 provides a brief definition of each of the major resolution techniques used by
the FDIC over time, displaying them in rank order based on the degree to which they preserve liquidity.
Because there is a roughly inverse (though not necessarily monotonic) relationship between protecting
liquidity and enhancing market discipline among these techniques, the figure also illustrates the economic
5

tradeoffs facing policymakers. As political, economic, legal, and technological conditions have shifted
over time, the FDIC’s preferred resolution choices—or the choices imposed upon it by Congress—have
switched between and among these various techniques.
Although most of the commentary on bank resolution policy focuses on banks’ deposit liabilities,
some authors have found that much of the economic damage caused by bank failures is transmitted
through banks’ lending channel. Bernanke (1983), Calomiris and Mason (2003), and Ramírez (2007)
have observed that the loss of banking relationship by borrowers caused significant economic damage
after bank failures in the 20s and 30s. Ashcraft (2005) examined the closure of a large (solvent) affiliate
in a regional bank holding company in Texas in the 1990s, and found that curtailed lending activity after
the closure was associated with a decline in local GDP.
The degree of borrower liquidity and depositor liquidity associated with each resolution technique
tend to be correlated. For example, if a receivership liquidates a failed banks’ loans and other assets only
gradually over time, then some depositors will not have full access to their funds until the receiver sells
enough assets to cover their deposits, and some borrowers will have to delay further draw-downs of their
lines of credit until the receiver sells their existing loan to another bank. In a similar vein, if a bank is
liquidated both borrowers and lenders will need to establish new banking relationships. Hence, the rank
ordering in Table 1 captures both depositor and borrower liquidity.
The details of these various resolution techniques, as well as the historical episodes during which
they were applied, are discussed at length in the Appendix to this paper. A full menu of alternative
resolution strategies would theoretically allow the resolution authority to make marginal tradeoffs
between providing additional depositor/borrower liquidity and enhancing market discipline. Before
advancing to our theoretical framework in which such marginal tradeoffs are possible, we first compare
and contrast two discretely different and polar opposite resolution approaches from U.S. history. At one
extreme is a strategy of liquidating failed banks without any special depositor protections. At the other
extreme is a strategy of complete regulatory forbearance that keeps liquid but insolvent banks operating.
6

2a. U.S. bank failures prior to the FDIC: Stressing discipline over liquidity. Prior to the
establishment of the FDIC in 1933, bank failures were typically resolved in a manner analogous to
chapter 7 bankruptcies of non-bank corporations. Insolvent banks were closed and a receiver was named
to manage the resolution, usually the state banking authority for state chartered banks or the Office of the
Comptroller of the Currency (OCC) for national banks. The receiver was responsible for liquidating the
assets of the failed bank and repaying the depositors and other creditors of the bank. This process could
take many years, during which depositors and other liability holders of the failed bank lost access to their
funds. Anari, Kolari and Mason (2005) showed that depositors and other creditors of national banks that
failed in 1929 received only 66.12 percent of their funds; only about 20% of this amount (13.22 cents on
the dollar) were returned during the first year, approximately double that amount was returned during the
second year, and declining amounts were returned each year after that. The average liquidation period
was about four years. Borrowers also faced potentially large costs, having to establish new banking
relationships, pay off their loan from the closed bank, and losing the liquidity associated with any deposit
accounts they may have held at the closed bank.
Today, in a time when failed banks are closed in orderly fashion and most bank deposits are
protected by insurance, it is easy to underestimate the frequency and depth of economy-wide financial
crises occurred in the U.S. in the pre-FDIC era. Financial crises and widespread banking panics occurred
at least eight times between 1819 and 1929—in 1819, 1837, 1848, 1873, 1893, 1907, 1921, and 1929-
1933 (Kindleberger, 1978). During these crises, reduced liquidity was the primary concern of all of the
interested groups, especially so in the banking and financial center of New York City. Amid the
uncertainty, nervous depositors faced incentives to withdraw their funds from banks and trust companies
to preserve their liquidity. Banks responded by building up their reserves in order to withstand demands
by depositors, thus depriving borrowers of needed funds. Whenever borrowers and/or depositors were
denied funds by their banks, the banking panics intensified and spread.
A number of articles commented on the breadth and depth of the damage caused by the Panic of
1907. Andrew (1908) focused on the hoarding of cash by both banks and individuals during the panic:
7

“The strong institutions thus made it more difficult for the weak, for what is hoarded in
the vaults of one bank under such circumstances is virtually taken out of another. In accumulating these abnormal reserves, the hoarding banks were largely responsible for the existence of a currency premium in New York; they contributed seriously to the general collapse of credit; and by reducing their accommodation for their customers they even made conditions worse than they need have been in their particular localities.”
Noyes (1908) documented some of the real economic damages:
“…iron production (in December 1908) in the United States is 28 per cent below the corresponding month in the active year 1906, the Steel Corporation’s output is less than 60 per cent. Of capacity, and general trade does not average three-fourths of normal volume.”
And Horace White (1908), a well known macro-economist of the day, stated:
“Something must be done to put an end to the periodical suspensions of the banks. The
greatest evil attending them is the bad education they give. They tend to deaden the sense of commercial honor. Every such suspension is a license to every financial institution to scale it’s debts or postpone the payment of them. They assume the right to pay or not to pay according to their convenience. Some banks in such cases pay their own debts and those of their weaker neighbors also. Others refuse to pay even when they are able to. Each is a law unto itself for the time being, and the time indefinite.
“While the chaos continues the banks assume the right to pay their obligations with something which is not money. They pay with a rubber stamp, which is elastic in a double sense. Sometimes it is worth 100 cents, sometimes 90 or any price between…
“When the banks thus repudiate their obligations their depositors can hardly do otherwise. Frequently they are compelled to pay their workmen with stamped cardboard, which the latter force upon retail shopkeepers and street peddlers at a loss to both payer and payees. All things are done in disregard of law and defiance of it.”
For the banks and trusts that were closed but proved to be solvent, the 1907 Panic was relatively
short-lived. Knickerbocker Trust, the first trust company on which depositors ran during the Panic, failed
on October 22, 1907 but resumed business on March 26, 1908; the Hamilton Bank failed on October 24,
1907 but resumed business even faster, on January 20, 1908. Outright bank failures had deeper economic
impacts, especially if the banks were liquidated, causing significant delays for payments to depositors and
other creditors. A number of studies focusing on the 1920’s and early 1930’s have shown that bank
failures by themselves, even if unaccompanied by extended financial panics, had negative effects on the
economy (e.g., Bernanke 1983, Calomiris and Mason, 2003, Ramirez, 2007). The collapse of commodity
8

prices in 1920-21 and the long agricultural recession followed were accompanied by a large number of
bank failures. In all, over 10,000 banks failed during the 1920s, and it is worth noting that the instability
of the banking system during that decade occurred despite the creation of the Federal Reserve in 1913.
2b. The savings and loan crisis: Stressing liquidity over discipline. The creation of FDIC and
the introduction of federal deposit insurance eliminated or at least mitigated many of the ill effects of
bank failures. Insured depositors were made whole immediately after failed banks were closed, and the
certainty with which this liquidity was provided defused bank runs, the biggest catalyst for the banking
panics of the past century. Only a handful of banks failed annually during the half century following the
Great Depression, and none of these failures were associated with a banking panic. Given the apparent
success of this new regulatory regime, and remembering the severe macroeconomic effects of past
banking panics, it wouldn’t be surprising if going forward banking authorities leaned toward resolution
policies that stressed the maintenance of depositor liquidity, as opposed to policies that relied on the
market to discipline banks and their depositors.
Nonetheless, the manner in which deposit insurance and bank resolution were implemented
created incentives for moral hazard behavior among depositors and bank management, and incentives for
laxity on the part of bank supervisors. Knowing that their funds are protected (up to some legal limit),
depositors and other creditors will continue to lend to troubled banks, even when the bank’s condition is
known. Similarly, businesses that borrow from troubled banks have less reason to seek new sources of
funds, knowing that in the case of bank failure a seamless resolution process will most likely prevent their
credit access from being badly disrupted. Managers of troubled banks are likely to make increasingly
risky loans, knowing that the entire upside risk of the loans accrues to the bank while a large portion of
the downside risk of the loans will be absorbed by the insurance fund. And knowing that the
responsibility for monitoring banks’ financial condition has passed largely from bank depositors to bank
supervisors (i.e., less reliance on market discipline), bank insolvencies are interpreted by some as
evidence of supervisory failure, creating incentives for banking authorities to keep insolvent institutions
open and operating in the short-run.
9

Nonetheless, the term moral hazard was rarely heard in conjunction with deposit insurance during
the first fifty years of the FDIC’s existence. The regulatory forbearance practiced by U.S. bank regulators
during the thrift debacle of the 1980’s would change that. Mishkin (2006) points out:
“The good news of having a government safety net is that it can prevent bank panics as it
has since the establishment of the FDIC in the 1930s. The bad news is that it creates moral hazard incentives for banks to take on greater risk. When a depositor is fully protected, she knows that she will not suffer losses if a bank fails and thus, has little incentive to monitor the bank’s activities and withdraw funds if the bank is taking on too much risk. Without this discipline from depositors, banks know that they can engage in risky activities with impunity, and this can increase the probability of bank failures.”
In the late 1970’s inflation and interest rates increased dramatically and unexpectedly. Inflation
surged from 5.75 percent in 1975 to 11.22 percent in 1979, and 3-month treasury rates increased from 4.6
percent in January 1977 to 15.5 percent in March 1980.4 The deleterious effects of these trends on U.S.
thrift institutions are well known. These firms financed portfolios of long-term, fixed-rate mortgage loans
with short-run deposit liabilities, and the sudden spike in rates generated massive operating losses as the
rates thrifts had to pay for deposits that substantially exceeded the rates they were receiving on their
loans. Tangible capital in the thrift industry fell from $32 billion in 1980 to just $4 billion in 1982. On
an accounting basis, at least 415 thrifts reporting negative tangible capital at the end of 1982, and it is
roundly believed that a much larger number of thrifts were insolvent on a market value basis. Despite
this, the Federal Home Loan Bank Board (the main supervisory agency of thrift institutions at the time)
closed only a small portion of these thrifts: only 103 thrifts insured by the Federal Savings and Loan
Insurance Corporation (FSLIC) were declared officially insolvent and closed between 1980 and 1982, and
only 131 additional closures were performed between 1983 and 1985.
In the most extreme cases of supervisory forbearance, authorities actually provided financial
assistance to thrifts without removing thrift management and without a pledge of additional support from
4 These data are taken from the Federal Reserve H15 table.
10

thrift owners.5 As Kane (1989, 1995) has argued, allowing these “zombie” thrifts to operate, virtually
without any safeguards, permitted thrift managers to gamble for resurrection by making risky loans with
big financial upsides. With neither market discipline nor regulatory discipline in place, already troubled
thrifts continued to hemorrhage and fell deeper into insolvency. Moreover, when these thrifts were
finally declared insolvent and were closed, the most common resolution method protected both the
insured and the uninsured creditors, and in addition guaranteed the thrift or banking institution that
acquired the remaining assets against loss. Ultimately, these extreme supervisory and resolution
practices, motivated initially by a desire to maintain liquidity, cost $153 billion in resolution costs, with
the U.S. taxpayers paying about $125 billion of this (Curry and Shibut 2000).
The main policy response to this episode—which included a string of failures by commercial
banks in the years that followed—came in the form of the Federal Deposit Insurance Corporation
Improvement Act (FDICIA) of 1991. FDICIA constrained the decision-making latitude available to bank
supervisors and resolution authorities, tilting failure resolution policy away from protecting the liquidity
of uninsured creditors and toward imposing discipline on both uninsured creditors and bank management.
Among other changes, the law set a series of stricter minimum capital levels for banks and thrifts,
required supervisors to intervene at troubled institutions as they fell below these minimum thresholds,
mandated that the FDIC resolve banks in the “least costly” manner (as opposed to, say, the manner that
maximized liquidity), required supervisors to examine banks and thrifts more frequently for safety and
soundness, and took an initial step toward risk-based deposit insurance by setting premiums according to
banks’ capital levels and examination ratings.
3. Practical Considerations: Insurance Determinations and Bankruptcy Practices
Most banks that fail are small, and in recent years the FDIC has made both insured depositors
whole and imposed losses on uninsured depositors in these banks. The payouts to uninsured depositors
5 The assistance came in the form of regulatory accounting adjustments that allowed thrifts to carry nonperforming loans at artificially high values, thus inflating their accounting capital and making the thrift “book solvent.”
11

do not always occur immediately, and the resulting delay in access to even a portion of their funds may
cause considerable illiquidity and financial distress for some of these creditors, and perhaps even cause
some disruption to the local economy. But these social costs are at least partially offset by the increased
discipline that arises from the signals they send to uninsured depositors in other small banks, who stand to
suffer similar illiquidity costs should their banks become insolvent. Moreover, because these banks are
small, any local disruptions are unlikely to spillover to the regional or national economies. From the
perspectives of both academics and banking authorities, then, this approach to resolving small bank
failures appears to be efficient, as moral hazard incentives are reduced and financial stability is
unthreatened.
However, these efficient outcomes become more difficult to maintain as the size of a failed bank
increases. We characterize these difficulties as “scale diseconomies of resolution,” and these
inefficiencies are due largely to the manual processes that are used by the resolution authority to identify
uninsured depositors and creditors (FDIC 2005). To fully understand these scale diseconomies and how
they may influence the strategic choices of bank resolution authorities, we must first understand the nuts
and bolts of an arcane process known as the “insurance determination.”
The bank closure process in the U.S. begins when the relevant chartering authority (the OCC for
federally chartered banks, or the relevant state banking authority for state-chartered banks) revokes a
bank’s operating charter. The chartering authority then names the FDIC as the receiver of the failed
bank—that is, the FDIC dismisses top management and takes over control of the bank. Unlike the
previous managers, the FDIC represents the interests of the depositors rather than the interests of the
owners. Immediately after taking control, the FDIC begins the insurance determination process, the
details of which are displayed in Table 2.
The normal procedure is to close the bank on a Friday afternoon just prior to the end of the
business day, and the insurance determination is performed over the weekend. The objective is to
determine how many of the bank’s deposits are insured, how many of the deposits are uninsured, and to
whom these deposits are owed. The verification of multi-owner accounts (e.g., joint accounts, trust
12

accounts) can be a largely manual process, typically working from depositor signature cards and other
paper records which may be located at the main bank office or at any of the bank’s branch offices. If time
permits to complete this process, by Monday morning the insured depositors have full access to their
funds either (a) at the acquiring bank if the failed bank is being resolved through a purchase and
assumption (P&A) transaction or (b) by a direct payout from the FDIC if the failed bank is being resolved
through a payout and liquidation of the failed bank’s assets.
In contrast, uninsured depositors are issued a receivership certificate that represents their claim.
As time passes and FDIC is able to more accurately determine the total losses of the failed bank, partial
“dividends” are paid to the uninsured depositors. On the one hand, this process provides uninsured
depositors with some degree of liquidity; on the other hand, by imposing appropriate delays and in some
cases losses on uninsured depositors, this process imposes market discipline ex post and reduces moral
hazard incentives among depositors at other banks. Bank borrowers are also dealt a degree of discipline
because their banking relationships are disrupted: they may temporarily lose access to any remaining
balance in their lines of credit, they may lose access to a portion of any compensating deposit balances
that are part of the loan contract, and they will incur the informational and administrative costs of re-
establishing a credit relationship at a new bank. In a P&A transaction, borrowers retain credit in the
short-run but must re-establish their banking relationship with new loan officers at the acquiring bank. In
a liquidation transaction, the loans are retained and eventually sold by the receiver (the FDIC), dissolving
the existing banking relationship and forcing borrowers to establish entirely new financial relationships
with other banks.
It is important to note that the FDIC would not be able to provide depositors such timely access to
liquidity without special legal authority to take over insolvent banks and act as receiver. This is very
different from the regular bankruptcy procedures used to resolve insolvent non-banks. First of all,
bankruptcy laws protect the owners of insolvent firms from their creditors—in contrast, as receiver the
FDIC steps in on the behalf of creditors (depositors) and the owners never regain control of the firm. The
fact that the firm files for bankruptcy, while it is the regulator that files for receivership, is an important
13

and telling distinction. Second, bankruptcy proceedings typically take weeks or months to conclude—in
contrast, as receiver that FDIC can act fast, generally over a weekend, to provide depositors with access to
(most of) their funds. The FDIC has broad discretion to sell the bank’s assets, and can embark on such
sales and other actions without waiting for a reorganization plan to be developed and approved by a
bankruptcy judge. As discussed above in section 2a, the illiquidity created by dragging out the resolution
of an insolvent bank over weeks or months can disrupt the payments system, with potentially serious
macroeconomic consequences. Without the legal authority to take over failed banks, bank resolution
authorities must instead rely on regular bankruptcy procedures, under which the benefits of deposit
market discipline become very expensive in terms of lost liquidity. In countries in which insolvent banks
must be resolved in the regular bankruptcy courts, regulators will have strong incentives to subsidize
financially troubled banks rather than closing them.
As the FDIC attempts to resolve increasingly larger failed banks, completing the insurance
determination over a single weekend becomes operationally difficult due to the sheer number of accounts
involved and the manual, multi-site processes necessary to complete the task. Moreover, temporarily
freezing the funds of insured or uninsured depositors exacerbates illiquidity, with potentially large
macroeconomic consequences. Table 3 illustrates the potential scope of this problem. To date, the
largest FDIC insurance determination was First City Houston in 1992 with 322,983 separate deposit
accounts; in contrast, Bank of America currently has over 50,000,000 separate deposit accounts. The
disruption of such a large number of liquidity arrangements—on both sides of the balance sheet—could
have significant macroeconomic effects. Given current information and resolutions technologies, as
banks get larger, the benefits from a policy that includes market discipline become more expensive in
terms of lost depositor and borrower illiquidity. Technological innovations and new regulations that
allow banking authorities to process information more quickly could improve or potentially eliminate this
tradeoff. Otherwise, in order to protect insured depositors from loss and pay dividends to uninsured
14

depositors sufficient to avoid economy-wide illiquidity effects, the large bank resolution process must
shield uninsured depositors from losses.6
4. A Theoretical Framework
At this point it is useful to model more formally the short-run liquidity versus long-run market
discipline tradeoff facing the resolution authority. We provide a simple, one-period framework with an
exogenous bank insolvency and a resolution authority responsible for resolving the insolvency. The
authority selects a resolution strategy that provides a combination of liquidity and market discipline that
maximizes its own utility, which as discussed above need not be consistent with maximizing social
welfare. The authority is constrained in its choices by the resolution methods or “technologies” available
to it, as well as by constraints placed upon it by other governmental bodies. We write down the following
simple constrained maximization problem:
maximize U(LQ,MD) (1) RM
subject to: RM ≤ T(technology, legal institutions, bank size)
RM ≤ G(political conditions, economic conditions, banking conditions)
The authority chooses a resolution methodology RM that maximizes its own utility U, which is increasing
in both liquidity LQ and market discipline MD, and does not necessarily correspond to social welfare.
Every available RM consists of a non-negative bundle of LQ and MD. The authority’s choice set of
possible RMs is defined by T, a technological constraint that tightens or loosens in sensible ways with
changes in information technology, communications technology, legal institutions, and the size of the
insolvent bank that needs to be resolved. The authority’s set of RM choices may also be limited by G, a
6 We note that there is an important difference between an uninsured depositor dividend based on perfected asset estimates and the “advance dividend” to uninsured depositors proposed by Kaufman (2003) and Kaufman and Seelig (2002) that is based on a conservative estimate of the value of the failed bank in cases in which the resolution authority lacks the time, information, or other resources necessary to complete a full insurance determination. Nevertheless, the goal of both policies is to reduce economy-wide illiquidity effects while avoiding a full bail-out of uninsured depositors.
15

governmentally imposed constraint that tightens or loosens with political conditions (e.g., pressures
created by poor resolution authority performance, the amount of taxpayer or insurance funds available to
pay off insured and/or uninsured creditors), the current state of the economy, or the number and/or size of
insolvent banks. (In our analysis that follows, we illustrate movements in both T and G that correspond
with these arguments, motivated by historical episodes.)
We illustrate the basic workings of this model within the confines of a unit square in Figures 1
through 5. The unit square is defined on the vertical axis by liquidity provision LQ and on the horizontal
axis by market discipline provision MD. The extreme top of the vertical axis represents 100% liquidity
provision, that is, zero loss of depositor or borrower liquidity during the resolution.7 The extreme end of
the horizontal axis represents 100% provision of market discipline—that is, both deposit insurance and
bank liabilities are efficiently priced with regard to default risk, and neither depositors nor bank
management faces moral hazard incentives. (It may be useful to think of market discipline MD as the
unit square complement of the incentives for moral hazard behavior MH, or MD = 1 – MH.) The upper
right-hand corner of the unit square marks the social optimum, where the resolution causes no loss of
liquidity and the resolution creates no incentives or rewards for moral hazard behavior on the part of
depositors. This optimum is unlikely to obtain, however, chiefly because existing bank resolution
technologies (T) constrain the authority and force it to tradeoff between protecting depositor liquidity and
encouraging depositor market discipline. Indeed, this social optimum need not obtain even in the absence
of a technological constraint, if the preferences of the resolution authority diverge from those of society
(i.e., a principle-agent problem).
The technological constraint T is the upper bound of the resolution technologies available to the
resolution authority. The slope of this line—i.e., the marginal rate of transformation (MRT)—represents
7 Zero loss of depositor liquidity guarantees depositors full and immediate access to all short-term funding (e.g., transactions deposits, time deposits that mature in the short-run). Zero loss of borrower liquidity guarantees borrowers full and immediate access to their lines of credit. Depositors who have provided long-term funding (e.g., time deposits that do not mature in the short-run) have no expectation of liquidity regardless of the solvency of the bank. We abstract from the liquidity of bondholders and shareholders in publicly traded banking companies, who may suffer liquidity losses if they have to sell their securities at less than fair value in the during the resolution process.
16

the policy tradeoff available to the authority, the amount of liquidity that must be sacrificed in exchange
for a given increase in market discipline, i.e., the liquidity price of market discipline. This tradeoff can
improve with the introduction of improved information technologies or legal frameworks that increase the
efficiency of the failed bank resolution process. Alternatively, this tradeoff can worsen if the insolvent
bank is so large that resolving it quickly stresses the limitations of the available resolution technologies.
We anchor the upper end of T at 100% liquidity and 0% market discipline because resolution
technologies with these qualities do exist—for example, open bank assistance—and have been used by
U.S. regulators in the recent past.8 While the dashed line T illustrates a continuous tradeoff, this tradeoff
is discontinuous in practice: Authorities face a finite set of technologically efficient resolution methods
that are arrayed along T. Authorities also have access to technologically inefficient resolution methods
and tradeoffs, represented here by TINEFF .
The resolution authority has a positive preference for both liquidity and market discipline, as
illustrated by the downward-sloping indifference curves in the figures. The slopes of these indifference
curves—i.e., the marginal rate of substitution (MRS)—represent the policy tradeoff preferred by the
authority, the amount of liquidity willingly exchanged for a given amount of market discipline. We
presume that the authority has a strong preference for resolution outcomes that provide short-run
liquidity, and only a weaker preference for resolution outcomes that enhance long-run market discipline.9
Preferences such as these are plausible if, as discussed in previous sections above, (a) bank regulators
and/or the government identify strongly with depositors, (b) bank supervisors wish to conceal the extent
to which the financial condition of a bank or the banking system has deteriorated, (c) economic
8 Theoretically, we could have anchored the technology constraint at the other extreme, where liquidity provision is 0% and market discipline is 100%, that is, a “no-deposit-insurance” bank resolution regime. Given that deposit insurance is permanent part of the modern bank regulatory regime in the U.S. and most other developed economies, we choose not to follow this path. 9 For simplicity, the indifference curves in Figures 1-5 are drawn with relatively preference-neutral shapes. A strong preference for liquidity provision over discipline enhancement would, all else equal, be represented by relatively flat indifference curves (low MRS), i.e., a regulator willing to give up some liquidity only in exchange for a large amount of discipline. As illustrated at length in the Appendix, the resolution choices made by FDIC during the post-deposit insurance era have been largely consistent with a strong preference for liquidity over discipline.
17

authorities feel that a large liquidity shock would harm the macro-economy, or (d) bank regulators wish to
pursue a quiet life.
Given these constraints and preferences, a utility-maximizing equilibrium (which may or may not
be the welfare-maximizing equilibrium) occurs when the resolution authority chooses some bundle (MD,
LQ) that lies on T and for which the MRT is approximately equal to its own MRS.10 Figure 1 illustrates
our base case, in which the authority maximizes its utility by choosing the purchase and assumption (PA)
resolution technique over both open bank assistance (OBA) and asset liquidation and payout of insured
depositors (AL). PA is an interior solution that provides more discipline (and less liquidity) than OBA,
but more liquidity (and less discipline) than AL.
The next two figures illustrate how the equilibrium can change with advances in information
technology and/or the introduction of a new resolution method. Figure 2 shows a general improvement in
failed bank resolution technology (from T to T') that results in unambiguous improvements in both social
welfare and resolution authority utility: DP' provides more liquidity and more discipline than DP.
Improved information technology could increase the speed of the insurance determination process
(increasing liquidity by giving insured depositors faster access to their funds) while improved financial
technology could increase the accuracy of the asset valuation process (enhancing discipline by imposing
partial losses on uninsured depositors more quickly and more accurately). Of course, improvements in
resolution technologies need not result in a parallel shift in T as illustrated here.
Figure 3 shows that the introduction of a new resolution technique—in this case, a bridge bank
(BB) method. Liquidity is preserved by transferring all insured and uninsured creditors to a newly
created, but temporary, bank. Market discipline is improved (relative to open bank assistance) by
imposing losses on stock holders and bond holders, although all uninsured depositors are made whole.11
Because this innovation locally reduces the market-discipline price of liquidity (i.e., a steeper slope for
the upper segment of T), the resolution authority will choose BB over DP in equilibrium. Hence, this
10 We use the term “approximately” because the technology constraint T is discontinuous. 11 These losses are typically imposed on shareholders at the holding company level.
18

innovation is an unambiguous utility improvement for a resolution authority that favors liquidity over
discipline: less discipline on uninsured depositors than the DP method in exchange for more liquidity, and
more discipline than the OBA method without any loss of liquidity. But the innovation does not
necessarily improve social welfare. Relative to OBA society is clearly better off because some losses are
imposed, but relative to DP moral hazard incentives have increased.
As discussed above, resolving large bank failures presents special problems. Providing discipline
in such cases requires the authority to impose losses on large numbers of depositors, and the resulting
reduction in liquidity can have deleterious macro-economic effects. In other words, the liquidity price of
discipline increases. This is illustrated in Figure 4 as an inward rotation of the technological constraint to
T''. With liquidity so dear, the authority foregoes discipline entirely and uses open-bank assistance
(OBA) to resolve the failing bank—essentially, the deposit insurance fund is used to prop up the failing
banking franchise. Conveniently, Figure 4 also illustrates the policy equilibrium that occurs if the
resolution authority does not have receivership authority and instead must close insolvent banks via the
regular bankruptcy process. Bankruptcy is a slow process that protects (at least temporarily) the insolvent
bank from (at least some of) its creditors, and as such will deny a large number of depositors short-run
access to their funds. Facing a legal/technological constraint like T'' that makes imposing discipline
expensive, the resolution authority will instead provide some package of open bank assistance that keeps
the bank open and avoids the bankruptcy-induced illiquidity.
In either of these cases, supporting the open bank assistance policy equilibrium illustrated in
Figure 4 will eventually require direct taxpayer finance (if there is no deposit insurance fund) or indirect
taxpayer finance (to replenish an exhausted deposit insurance fund). To protect taxpayers from such an
outcome, government might constrain the resolution authority to some maximum amount of liquidity
provision (e.g., stricter limits on deposit insurance coverage, or a law that mandates least-cost resolution
methods) in order to prevent expensive taxpayer funded bailouts of the deposit insurance system. The
government constraint G in Figure 5 limits that amount of liquidity that the authority can provide, forcing
19

it to a “low cost” resolution approach (LC) that provides a non-zero amount of discipline.12 Note that LC
lies on a lower indifference curve for the authority, but (at least in the minds of the government) it
provides more social welfare than OBA. In severe circumstances—e.g., when the insolvent bank is so
large that restricting liquidity to its depositors, borrowers, and other counterparties could cause a systemic
economic event—the government might relax the constraint G and allow the resolution authority to
choose its more preferred high-liquidity resolution method OBA.
5. Conclusions, Implications, and Looking Forward
Scholars and policymakers have an implicit understanding of the economic tradeoff facing the
bank resolution authority. On the one hand, protecting the uninsured depositors, other creditors, and even
the owners of insolvent banks can be beneficial in the short-run because it preserves liquidity in financial
markets. But on the other hand, such policies can squelch market discipline and exacerbate moral hazard
incentives that lead to increased risk-taking and potentially more widespread episodes of bank failures in
the long-run. In this paper we state this tradeoff more formally and more explicitly. We develop a simple
theoretical framework in which bank resolution authorities prefer protecting uninsured depositors
(providing liquidity) to imposing losses on uninsured depositors (imposing discipline) at the margin. The
resolution authority is constrained in its choices by existing resolution technologies, and we demonstrate
how changes in laws and economic circumstances can alter the authority’s behavior. Technological
advances and improved resolution strategies partially mitigate the underlying conflict between providing
liquidity and imposing market discipline, leading to more efficient social outcomes.
We acknowledge that our model is quite simple, and that this simplicity limits the richness of our
analysis. We do not explicitly specify the utility function, the technology constraint, or the government
constraint, which limits us to a graphical equilibrium solution and precludes more formal comparative
static analysis. Although we do discuss how the government action might be taken to constrain the
12 In our framework, government-imposed constraints on the resolution authority could take other forms as well. For example, explicit deposit insurance mandates a minimum amount of liquidity protection. (Such a constraint would have to lie below the level of the government constraint illustrated in Figure 5.)
20

largess of the resolution authority, our model lacks a two-period framework needed to more thoroughly
investigate the implications such an action. More generally, a multi-period framework would allow
strategies chosen by the resolution authority today to affect the behavior of depositors, banks, or
government in the future (and vice versa). For example, how would strict actions by the authority
(attempting to establish a credible threat by imposing large losses on uninsured depositors) or lax actions
by the regulator (attempting to have a quiet life by making all creditors whole) affect the amount of
uninsured creditors found in insolvent banks in the future? And our assumption that the resolution
authority has the latitude to maximize its own utility is a debatable one—the legislature, which can have
a very different set of preferences, may be the body that makes the liquidity-discipline decisions and then
imposes them on the resolution authority. We hope that the first steps we have taken here will entice
economic theorists to investigate these and other extensions.
Despite its limitations, the model presented here does capture the essential nature of failed bank
resolution and the inherent tradeoff that exists between liquidity provision and market discipline. In the
Appendix to this paper, we use the model to illustrate the long history of failed bank resolution policies in
the United States—in which the introduction of deposit insurance, a series of innovations in resolution
methods, changes in congressional oversight of the resolution authority, and advances in information
technology have gradually but substantially increased the efficiency of the failed bank resolution process.
Of course, challenging resolution scenarios still exist, both within and outside the U.S.
The most important is the high-stakes policy problem of resolving large failed banks. At one
extreme, if a deposit insurance system cannot provide liquidity quickly or within a reasonable time frame,
then there is really no limit to deposit insurance, blanket deposit guarantees, and the negative moral
hazard consequences that logically follow. This was the situation for large insolvent U.S. banks resolved
during the 1980s—banks that were only one-tenth the size of today’s largest banking companies—and it
continues to be the situation in many places outside the U.S. for failed banks of all sizes. The recent
nationalization of Northern Rock by the British Treasury provides an important example.
21

At the other extreme, if a deposit insurance system can provide insured depositors at a large failed
bank access to 100% of their funds on the next business day, and also give uninsured depositors and
creditors access to a substantial portion of their projected claims the next business day (for example, with
an advance dividend), then the liquidity battle is won and the short-run social costs of imposing market
discipline are greatly reduced. The latter policy requires improved information systems at banks,
appropriate operating incentives for regulators, and strong legal frameworks that recognize the
idiosyncrasies of banking companies. Without such policies there will always be some institutions that
are “too-big-to-resolve.” The U.S. has made some important headway in these directions, although the
same cannot be said for other nations (OECD 2002).13 Along these lines, we note that the systemic
threats posed by large insolvent financial institutions are no longer limited to commercial banks. The
recent bailout of investors at Bear Stearns by the U.S. Federal Reserve was clearly a too-big-to-resolve
scenario, motivated by the potential for widespread disruptions in financial markets if the investment
bank defaulted on its commitments to counterparties in securities and derivatives markets.
Our analysis also suggests that the observed preference by some countries for bailing out failed
banks may simply be the logical outcome of operating within legal and/or technological systems that
provide no other solutions for maintaining liquidity during bank failures. For example, a country’s
bankruptcy laws may not allow for unilateral revocation of a banking license or gaining prompt control of
the failed bank. In addition, if the deposit insurer does not have the resources or systems to provide
liquidity by promptly paying insured depositors, then authorities have little incentive to enhance market
discipline by imposing losses on the uninsured depositors. Countries that operate under these conditions
are likely to issue blanket guarantees and/or forebear when their moderate-sized or large banks fail,
essentially rendering their deposit insurance systems superfluous.
13 The FDIC has proposed that certain large banks maintain their records and systems in such a way that, if the bank failed, the FDIC could determine all depositor insurance status over the closing weekend, and provide for uninsured depositors and creditors having access to a portion of their funds on the next business day. The FDIC would then create a bridge bank that assumes all of the insured depositors and the projected portion of uninsured liabilities and “purchases” the assets of the failed bank (which presumably would be of a value equal to the assumed liabilities). The bridge bank would operate normally until a resolution was affected.
22

References
Anari, Ali, James Kolari, Joseph Mason, Bank Asset Liquidation and the Propagation of the U.S. Great Depression.” Journal of Money, Credit and Banking, Vol 37, No. 4 (August 2005) pp. 753-773
Andrew, A. Piatt, “Hoarding in the Panic of 1907.” The Quarterly Journal of Economics, Vol. 22, No. 2,
(Feb., 1908), pp. 290-299. Ashcraft, Adam B. “Are Bank Really Special? New Evidence from the FDIC-induced Failure of Healthy
Banks,” The American Economic Review, Vol. 95, No. 5 (Dec., 2005), pp. 1712-1730 Bernanke, Ben S. “Nonmonetary Effects of the Financial Crisis in the Propagation of the Great
Depression.” The American Economic Review, Vol. 73, No. 3 (June 1983) pp. 257-276. Calomiris, Charles; Joseph R. Mason. “Consequences of Bank Distress during the Great Depression.”
The American Economic Review, Vol 93, No. 3 (Jun., 2003) pp. 937-947. Curry, Timothy; Lynn Shibut. “The Cost of the Savings and Loan Crisis: Truth and Consequences.”
FDIC Banking Review, vol. 13, no. 3. FDIC 2000, pp. 26-35. Federal Deposit Insurance Corporation, The First Fifty Years, Washington, DC (1984). Federal Deposit Insurance Corporation, Annual Report, Washington, DC (1944). Federal Deposit Insurance Corporation, Managing the Crisis: The FDIC and RTC Experience,
(Washington, DC, FDIC, 1998) Federal Deposit Insurance Corporation, Large-Bank Deposit Insurance Determination Modernization
Proposal. 12 CFR Chapter III. Washington, DC (2005).
Freixas, Xavier and Bruno M. Parigi, “Lender of last resort and bank closure policies,” in Oxford Handbook of Banking, forthcoming 2008.
Hoggarth, G., Jack Reidhill, and P. Sinclair. “Resolution of banking crises: A review.” Bank of England Financial Stability Report, 2003: 109-123.
Horvitz, Paul M., “Failures of Large Banks: Implications For Banking Supervision and Deposit Insurance,” Journal of Financial and Quantitative Analysis, Vol. 10, No. 4, 1975 Proceedings (Nov. 1975) pp. 589-601.
Kane, Edward J. “The High Cost of Incompletely Funding the FSLIC Shortage of Explicit
Capital.”Journal of Economic Perspectives, vol. 3, no. 4, Fall 1989, pp.31-47. Kane, Edward J. “Principal Agent Problem in S&L Salvage.” Journal of Finance, July 1990, pp. 755-764. Kane, Edward J. “Three paradigms for the role of capitalization requirements in insured financial
institutions.” Journal of Banking & Finance, 1995, vol. 19, issue 3-4, pp. 431-459 Kane, Edward J., and D. Klingebiel. “Alternatives to blanket guarantees for containing a systemic
crisis.” Journal of Financial Stability 1: 31-63.
23

Kaufman, George G., "Depositor Liquidity and Loss-Sharing in Bank Failure Resolutions" (March 21, 2003). FRB Chicago Working Paper No. 2003-02.
Kaufman, George G. “Bank regulation and foreign-owned banks.” Reserve Bank of New Zealand
Bulletin 67(2): 65-74. Kaufman, George G. and Robert Eisenbeis. Bank crisis resolution and foreign-owned banks.” Federal
Reserve Bank of Atlanta Economic Review 2005(Q4): 27-41. Kaufman, George G.and Steven Seelig A. “Post Resolution Treatment of Depositors atFailed Banks:
Implications for the Severity of Banking Crisis, Systemic Risk, and Too Big to Fail.” Economic Perspective 2Q/2002, pp. 27-41.
Kindleberger, Charles P. (2000) Manias, Panics and Crashes: A History of Financial Crisis New York,
New York, Wiley Investment Classics. Mayes, David. “Who pays for bank insolvency?” Journal of International Money and Finance
2004(23):515-551. Mishkin, Frederik s. “An Evaluation of the Treasury Plan for Banking Reform” The Journal of Economic
Perspectives, vol. 6, no.1, Winter, 1992) pp. 133-153. Mishin, Frederick S. “How big a Problem is Too big To Fail? A Review of Gary Stern and Ron
Feldman’s Too Big to Fail: the Hazard of Bank Bailouts.” Journal of Economic Literature, Vol. XLIV (Dec., 2006) pp. 988-1004.
Noyes, Alexander D. “A Year After the Panic of 1907.” The Quarterly Journal of Economic, Vol. 23,
No.2. (Feb., 1909) pp. 185-212. OECD. “Experience with the resolution of weak financial institutions in the OECD area.” Financial
Markets Trends 82: 107-146. Persons, Warren M. The Crisis of 1920 in the United States. The American Economic Review, Vol. 12,
No. 1, Supplement, papers and proceedings of the Thirty-fourth Annual Meeting of the American Economic Association. (Mar., 1922), pp. 5-19.
Rameriz, Carlos D. “What Can History Tell Us about the Consequences of Bank Failures.” FDIC
Banking Review forthcoming (2007). Rosengren, Eric S.and Katerina Simons “Failed Bank Resolution and the Collateral Crunch:The
Advantages of Adopting Transferable Puts.” Federal Reserve Bank of Boston, Working Paper No. 92-5, 1992.
White, Horace; Joseph French Johnson, “Central Bank: Discussion.” American Economic Association
Quarterly, 3rd Series, Vol. 10, No. 1, papers and Discussion of the Twenty-First Annual Meeting. Atlantic City, N.J. December 28-31, 1908. (Apr. 1909), pp. 270-375.
Wicker, Elmus. Banking Panics of the Gilded Age. Cambridge, U.K. Cambridge University Press, pp 95.
24

Table 1
A list of failed bank resolution techniques, in order by the amount of liquidity preserved.
Resolution Technique A short description of each
resolution technique
Open bank assistance Cash or in-kind assistance provided to
bank, bank owners remain intact
Forbearance
Allowing insolvent or undercapitalized bank to continue to operate, often with old management intact. No cash or in-
kind assistance is provided.
Bridge bank
A temporary National Bank created with FDIC in control. Assets and most liabilities of failed bank transferred to
new bank. Old ownership, holding company creditors, and management
are severed from bank.
Purchase and assumption Acquirer of failed bank purchases
designated assets from the failed bank and assumes the liabilities.
Partial payout
Acquirers of failed bank may only wish to bid on a sub-set of the failed
banks deposits. Remaining depositors paid directly by FDIC.
Most liquidity preserved
Least liquidity preserved Asset liquidation
Failed bank assets are liquidated by the FDIC or its designees. Depositor
coverage is limited to the proceeds of the sale.
25

Table 2
FDIC Insurance Determination Process
1. Collect data on all deposit accounts, using manual data entry for official items, as needed.
2. Group accounts together, based on name, address, and tax ID (SSN) number.
3. Accounts in groups with balances at or below $100,000 are released.
4. Accounts in groups with aggregate balances above $100,000 are reviewed by agent.
– The agent must collect all relevant account information that can be used to determine the account owner(s) and, if necessary, beneficiaries.
– This step might include pulling the account holder’s signature card that would detail the above information.
– The agent then determines the insurance category.
5. Holds are then calculated. They may reflect uninsured balances estimated on the basis of the electronic records, but might also reflect the need for additional documentation.
6. Holds are manually input into the bank’s system.
7. When the bank reopens there are meetings with depositors who have funds held back.
Necessary documentation is collected, including:
– Affidavits from depositors related to kinship requirements for trust accounts.
– Trust documents.
8. After considering the additional documentation, holds are then adjusted, receivership certificates created, and funds are released as needed.
26
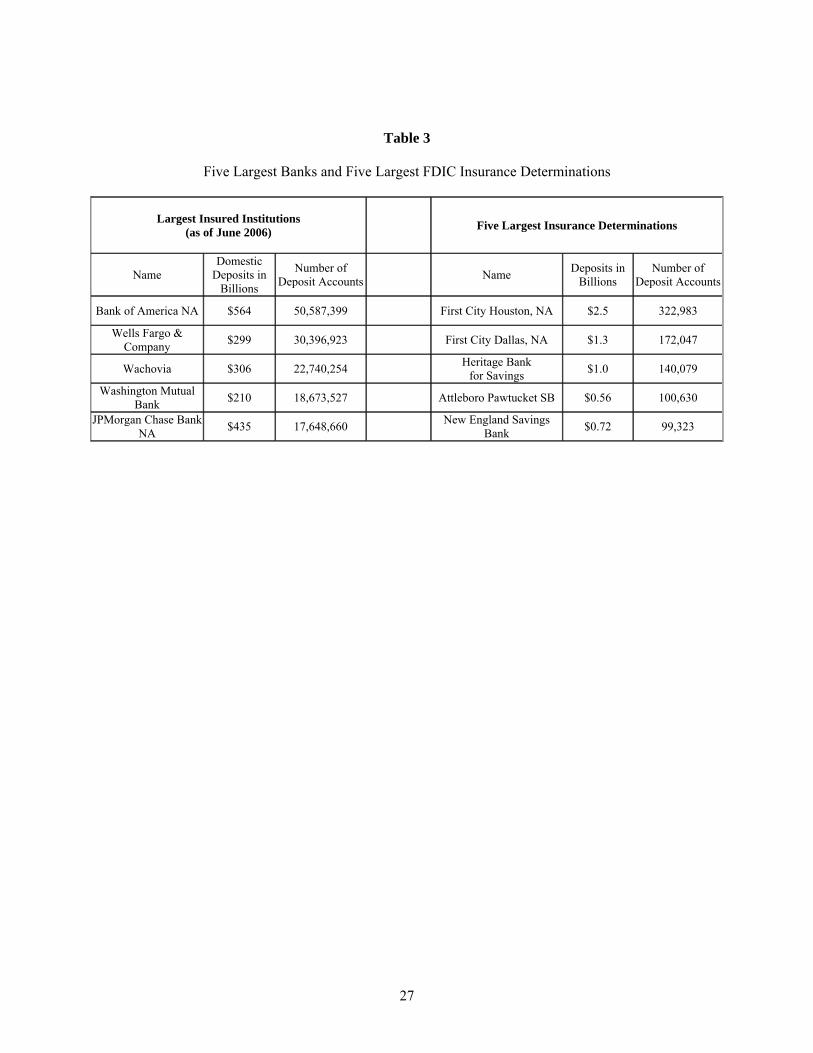
Table 3
Five Largest Banks and Five Largest FDIC Insurance Determinations
Largest Insured Institutions
(as of June 2006)
Five Largest Insurance Determinations
Name Domestic
Deposits in Billions
Number of Deposit Accounts
Name Deposits in
Billions Number of
Deposit Accounts
Bank of America NA $564 50,587,399 First City Houston, NA $2.5 322,983
Wells Fargo & Company
$299 30,396,923 First City Dallas, NA $1.3 172,047
Wachovia $306 22,740,254 Heritage Bank
for Savings $1.0 140,079
Washington Mutual Bank
$210 18,673,527 Attleboro Pawtucket SB $0.56 100,630
JPMorgan Chase Bank NA
$435 17,648,660 New England Savings
Bank $0.72 99,323
27

0% MD 100%
100%
0%
LQ
Figure 1OBA
AL
DP
TTINEFF
0% MD 100%
100%
0%
LQ
Figure 2
T'
DP
DP'
OBA
AL
T
28

0% MD 100%
100%
0%
LQ
Figure 3
DP
BBOBA
AL
T
0% MD 100%
100%
0%
LQ
Figure 4
DP
T''
OBA
AL
T
29

0% MD 100%
100%
0%
LQ
Figure 5
DP
G
OBA
LCAL
TBIGT
30

Appendix A liquidity versus discipline analysis of FDIC resolution practices, 1933-1992
Failed banks have not always been resolved in the same way in the United States. The existing
laws, regulations, and technologies have sometimes constrained the actions of the resolution authorities (the FDIC, the FSLIC, and the RTC), and economic and political circumstances have sometimes dictated the actions of the resolution authorities. As these conditions evolved over time, resolution authorities developed a variety of strategies for paying insured depositors and for disposing of failed bank assets. These strategies developed sporadically, with much of the innovation occurring during the banking and thrift crises of the 1980s and 1990s, and especially in response to the idiosyncrasies of the large bank failures during those years. New techniques were developed that improved the authorities’ ability to maintain liquidity for borrowers while still carrying out an insurance determination. In this section and the section that follows, we provide a brief historical review that illustrates how changes in laws, technologies, and political pressures have affected the tradeoffs between liquidity provision and market discipline made by the resolution authorities.
Deposit Insurance National Banks 1933-1935. The 1933 Act that created the FDIC did not empower the FDIC to make direct payouts to insured depositors. Instead, the Act authorized the chartering of Deposit Insurance National Banks (DINBs), newly chartered national banks controlled by the FDIC, to help facilitate the payment of the insured depositors of closed banks. The FDIC could inject funds into the DINB to pay insured depositor claims, but (with one exception) for no other purpose.
The DINBs were quite restricted in their operations. They were chartered without capital and were, as liquidating entities, generally prohibited from accepting new deposits or issuing new loans. If the FDIC determined that a DINB was providing essential banking services to a community it could accept new deposits, but those deposits were required to be demand deposits (no interest paid), invested in cash or U.S. Government securities, or deposited with the Federal Reserve. In the months following the passage of the 1933 Act, but prior to the 1935 Banking Act that established a permanent deposit insurance fund, 24 insured banks were closed and their insured deposits paid out through a DINB.14
In terms of our theoretical framework, the DINB resolution approach represents an inefficient technology. Even if the FDIC wanted to inject enough funds into the DINB to cover uninsured creditors depositors—which was contrary to the spirit of the law—less than 100% liquidity would have been maintained in the local market because DINBs could not issue new loans and generally did not accept new deposits. Hence, the DINB technology is characterized by the constraint TINEFF in Figure 1. As applied by the FDIC between 1933 and 1935, DINB resolutions are located somewhere on the interior of this constraint, because discipline was imposed on the uninsured depositors.
Direct Payouts and Purchase and Assumptions 1935-1950. The Banking Act of 1935 gave the
FDIC the authority to directly pay off depositors. Moreover, the agency now had a choice in resolution methods: it could either payoff depositors directly (a payout) or it could arrange for an existing bank to purchase the failed bank and assume its deposit liabilities (a purchase and assumption, or P&A). In payouts only insured deposit were protected and the closed bank’s loans were liquidated over time, with the FDIC and uninsured creditors sharing the proceeds. In P&As all of failed bank’s uninsured depositors and creditors could potentially be protected—it is important to realize that the acquiring bank(s) might wish to bid on only a portion of the failed bank—with the depositors that were acquired by the healthy bank having immediate access to their funds.
14 If the FDIC determined that it was in the community’s best interest to establish a new bank after the insured bank was closed, the local community could raise the required capital through a stock subscription and a de novo charter would be issued. This new bank could purchase only the failed bank’s buildings and furniture, fixtures and equipment. Of the 24 original DINBs, only two new banks were subsequently formed.
31

The different outcomes in a payout and a P&A can be shown in Table A1. In this simple example the failed bank had $100 in deposits, of which $95 was insured, and $92 in market value assets. Therefore, there is an $8 loss ($100 in deposits minus $92 in assets) that needs to be shared between the FDIC and the uninsured depositors. In the U.S. the FDIC and uninsured depositors (but not unsecured creditors) have the same priority rights to the proceeds of the receivership. The FDIC receives 95% of the proceeds and the uninsured depositors 5%. When all $92 worth of assets have been sold the FDIC will receive $87.4 for a loss of $7.6 and the uninsured depositors will receive $4.6, for a loss of $0.40. Prior to 1966 if the FDIC used a P&A to resolve a failed bank all of the deposits, insured and uninsured, would be “assumed” by the acquiring institution and FDIC would absorb the entire loss. Using the same example as before, the bank would have the same deposits with the same distribution of losses, the assets would still be worth $92 resulting in a $8 loss to distribute. However, as all of the deposits were passed to acquirer the FDIC would be left with the entire $8 loss.
As can be seen in Table 4, in 1935 payouts were preferred by the agency with 24 out of 25 transactions being payouts. But the share of failed banks resolved through P&As began rising in 1936, and by 1940 the majority of resolutions were P&As. Although there is no official acknowledgement of a change in policy during this period, there was clearly a change in FDIC preference away from payouts and toward P&As. In 1944 the agency finally did acknowledge this shift toward increased liquidity, claiming that P&As were the most efficient resolution method and that “the community does not suffer the economic dislocations which inevitably follow a bank suspension” (FDIC 1944).
In the context of our theoretical framework, the 1935 Act gave the FDIC access to a more efficient resolution technology, illustrated in Figure 1 by the shift from TINEFF to T. The act also permitted the agency to make tradeoffs along T, either imposing more discipline by choosing a payout that protected only insured depositors (DP), or providing more liquidity by arranging a P&A that protected at least some of the uninsured depositors. The P&A would be located on the edge of the technology set T somewhere in-between DP and OBA, depending on how much of the failed bank that was acquired in the P&A transaction. In addition, the FDIC’s more frequent use of P&As indicates that the agency’s preferences had changed. Although only one set of indifference curves is illustrated in the figures, the FDIC was now willing to exchange less liquidity to enforce a given amount of market discipline (i.e., the MRS declined), and this change in preferences resulted in a new equilibrium on T somewhere between DP and OBA.
Payouts Return 1951-1966. During a confirmation hearing for a FDIC Director in 1951, Senator
William Fulbright challenged the FDIC’s resolution policy, arguing that the agency’s reliance on P&As had extended deposit insurance beyond what Congress intended. Subsequent to the hearing, the FDIC informed the Committee that it would develop a cost test to determine when a P&A would be less costly than liquidating the bank and directly paying depositors with the proceeds. The cost test would not be formalized for over a decade, but this episode was the first acknowledgement that liquidity-enhancing resolutions are costly (although the cost of reduced market discipline was not explicitly mentioned). In any case, the FDIC’s resolution choices soon swung back toward payouts: There were 36 bank failures between 1955 and 1965, and the FDIC used P&As to resolve only six of these banks.
This shift in resolution choices shows that the actions, and perhaps even the preferences, of the resolution authority can be influenced by the preferences or edicts of the legislature. We can illustrate this policy shift two different ways in our theoretical framework. The pressure from the legislature could have changed the actual preferences of the resolution authority, increasing the MRS of the FDIC and moving back toward the equilibrium illustrated in Figure 1. Alternatively, the preferences of the FDIC may have remained unchanged, but it felt bound to behave according to the preferences of the legislature; this can be illustrated as an implicit governmental constraint on liquidity provision, similar to the one illustrated in Figure 5.
P&As and bidding generate premiums. In 1966 FDIC received its first explicit “premium” in a
purchase and assumption transaction, and soon afterward the agency established a formal “cost test”
32

based in part on the size of these premiums. In a P&A resolution, the premium is the difference between the deposit liabilities (insured plus uninsured) of the failed bank assumed by the acquiring bank and amount of the failed bank’s assets that the acquiring bank purchases in exchange for assuming those liabilities. Returning to Table A1, assume that several healthy banks are bidding against each other to acquire the failed bank from the FDIC. The winning bank will be the one that asks the FDIC to include the lowest amount of assets and cash. If the winning (lowest) bid is $98 of assets, then the P&A premium is $2 and FDIC has to provide the $92 in market value assets and $6 cash to complete the transaction. This is $1.6 less costly to the FDIC than the $7.6 it would have cost the FDIC to pay off the uninsured depositors.15 Thus, the cost test: If the premium bid is larger than the cost of protecting the uninsured creditors, then a P&A resolution is justified. Note that all uninsured depositors are paid in full.
By creating a justification for using purchase and assumption mergers—indeed, P&A transactions once again became the dominant form of failed bank resolution, until the early 1980’s—the cost test effectively allowed the FDIC to provide greater amounts of liquidity when resolving failed banks. In terms of our theoretical framework, the successful implementation of the cost test is best characterized as increased freedom for the resolution authority, that is, a relaxation or removal of the governmental constraint G.
By the late 1980’s the P&A resolution method was married to the payout to create the “P&A with Insured Deposit Transfer (IDT)”. This allowed FDIC to continue to use the P&A structure and to pass only insured deposits to the acquirer, forcing the uninsured depositors to share in failed bank’s losses. Returning to our example failed bank in Table A1, the winning acquirer has still bid $98, leaving $6 in losses to shared by the FDIC and the uninsured in this example. FDIC absorbs 95% of the $6 loss, or $5.70 and the uninsured depositors absorb $0.30. With this resolution method, social welfare is clearly increased over a straight payout or the standard P&A. In the payout the total loss was $8.00, and while insured depositor liquidity was maintained, the uninsured depositors may have a long wait for their share of the proceeds from asset sales and the failed bank borrowers would have had to develop entirely new banking relationships. In the standard P&A, liquidity was maintained for both the borrower and depositors, but FDIC bore all of the losses and market discipline suffered. With the P&A w/IDT there is improvement in all areas. The resolution is cheaper since bidding produced an explicit price, market discipline was enhanced by imposing losses on the uninsured depositors and both depositor and borrower liquidity was maintained by using the P&A structure.
Resolution of large banks. At this point in our story (roughly, the mid-1970s), it is important to
note that the process of making insurance determinations at failed banks had not materially changed since the creation of FDIC in 1933. Bank examiners had to review hard copies of depositor records by-hand, and this manual process placed a practical upper limit on the size of a bank that the FDIC could resolve using a direct payout. This was an immaterial concern prior to 1973, because until then failed banks were small enough to allow insurance determinations to be completed over the course of a weekend using manual methods. The largest payout involved just $67 million in deposits after the failure of Sharpstown State Bank in Houston in 1971, while the largest P&A involved just $93 million in deposits after the failure of Public Bank in Detroit in 1966.
The situation changed dramatically in 1973 with the failure of United States National Bank (USNB) in San Diego, which had $932 million in deposits. The next year Franklin National Bank in New York City failed, with $1.45 billion in deposits and $3.6 billion in assets. Given the size of these banks, using a P&A was the only practical resolution alternative to give insured depositors full and immediate access to their accounts.16 Paul Horvitz (1975), the FDIC’s Director of Research at the time, commented
15 For simplicity, this example ignores FDIC administrative costs, which are accounted for in an actual premium calculation. 16 For both USNB and Franklin National, the FDIC determined that the P&A approach was also less expensive than the payout approach (FDIC, 1984).
33

on the pressures the agency faced to resolve large failed banks in a manner that maximized liquidity, rather than minimizing costs and/or imposing market discipline on depositors:
It must be stressed that this pressure, while perhaps selfishly motivated, is not necessarily
counter to the general public interest. Failure of a large bank, with losses to many depositors, may have substantial undesirable repercussions. The damage to general public confidence may be very serious. Just how serious we cannot tell at this point, since we have always avoided such failures up to now. It may be wise public policy to continue to avoid testing the stability of public confidence in the banking system in this way.
Nevertheless, the desire to avoid losses to depositors in a large bank failure does create a
real problem of public policy. It is not clear that these considerations are appropriate under the Federal Deposit Insurance Act Horvitz concluded that broader social issues are involved in large bank failures and that
“minimizing costs to the deposit insurance fund seems particularly inappropriate.” Moreover, he suggested that the institutional and legal frameworks for resolving failed banks are designed for small bank failures, and that new arrangements were necessary for efficiently and effectively resolving failures of larger banks. The FDIC grappled with these issues over the next two decades, as increasingly larger banks failed.
First Pennsylvania. In 1980 the problems that Horvitz identified in 1975 came directly into
play, when First Pennsylvania Bank, the second largest bank in Pennsylvania, failed with $5 billion in deposits and $8 billion in assets.17 The FDIC at the time lacked the legal authority to sell a bank across state lines; Mellon Bank of Pittsburgh was the only bank in Pennsylvania of sufficient size to absorb First Pennsylvania, but FDIC did want to create such a large market concentration in the state.18 The agency also felt that closing the bank and paying off depositors would destroy financially important borrower-lender relationships and cause harm to the regional economy. These two considerations left the agency with only one choice, and that was to provide open bank assistance to First Pennsylvania.
In this transaction, the FDIC and First Pennsylvania arranged a $325 million note, which the bank eventually repaid in full. This transaction signaled the agency’s reluctance to close large banks, even ones with assets far in excess of deposits, in order to maintain liquidity and to avoid potentially disrupting financial markets (FDIC 1984). For large banks, a 100% preference for liquidity seemed to exist, corresponding with point OBA in Figure 4.
Penn Square. The collapse of Penn Square Bank in Oklahoma City in 1982 marked the FDIC’s
last use of its DINB authority, and also signaled the FDIC’s willingness (in certain circumstances) to impose losses on uninsured depositors. Penn Square had grown rapidly through aggressive lending in the energy sector, and many of these loans stopped performing and had to be written off when oil and natural gas prices declined sharply in the early 1980s. As the bank’s insolvency approached, the FDIC met with the Federal Reserve (Fed) and the Office of the Comptroller of the Currency (OCC) to discuss resolution strategies.
17 First Pennsylvania failed due to its exposure to interest rate risk, and as such this episode was a harbinger of the coming crisis in the savings and loan (S&L) industry. We will not discuss the resolution practices in the S&L industry here, as supervisory forbearance and complete protection of all liability holders was the order of the day for insolvent S&Ls up until 1989, when the Financial Institutions Reform, Recovery and Enforcement Act (FIRREA) passed. 18 This restriction ended in 1982, when the Garn-St Germain Act allowed the FDIC to seek out-of-state bidders in emergency situations.
34

The Fed and the OCC urged the FDIC to sell the bank through a P&A transaction or to provide open bank assistance. But the FDIC favored a depositor payout for financial reasons: almost 60 percent of Penn Square’s $470 million of deposits were uninsured, and fully protecting these creditors by keeping the bank open (OBA or P&A) would be prohibitively expensive. The FDIC chose the DINB structure to administer the payout for logistical reasons: it would permit the thousands of depositors at Penn Square access to their funds without having to spend hours standing in line waiting for a payment check. The DINB existed for three months, the time necessary to liquidate Penn Square’s assets and make payouts to its depositors.
At the time Penn Square was the largest payout in FDIC history, and it stands in marked contrast to the FDIC’s usual practice—both before and after Penn Square—of fully protecting uninsured creditors in large bank failures. Under the special circumstances surrounding Penn Square, at least, the FDIC was willing to impose market discipline on uninsured deposits. As discussed above, however, using a DINB structure to impose this discipline was inefficient (see Figure 1) and this choice likely reflected the cost concerns of the FDIC at the time.
Continental Illinois. In 1984 the FDIC, working together with other bank regulators, put
together a complex plan to rescue the Continental Illinois National Bank and Trust Company, at the time the seventh largest bank in the U.S. Continental was a large money center bank located in Chicago, Illinois, a “unit banking” state that prohibited its banks from operating multiple banking offices outside of its headquarters city. This regulation limited Continental’s ability to raise core deposits, and in order to grow it became increasingly dependent on the Eurodollar market for funding. These short-term funds made Continental vulnerable to high-speed electronic bank runs, and a bank run started on May 9, 1984. The FDIC, OCC, and the Fed stepped in eight days later on May 17. Given the economic and financial importance of Continental, the regulators announced a blanket guarantee that all creditors of the bank would be protected (Horvitz seems to have foreseen this type of problem almost a decade earlier).
Setting up a P&A resolution was simply not feasible, because potential acquirers would not be able to perform their due diligence fast enough on such a large and complex bank. The FDIC instead negotiated an extremely complex package of open bank assistance. Continental was re-capitalized with large amounts of “non-common stock” that substantially diluted the ownership share of the existing stockholders—as a result, some small amount of market discipline was imposed despite the fact that all uninsured creditors were made whole. (In terms of our theoretical framework, this resolution might best be described as a small improvement in technology that allows increased discipline without giving up liquidity, similar to the shift shown in Figure 3. However, because the discipline affected only the shareholders and not the uninsured creditors, the equilibrium would be located only slightly to the right of OBA.) This re-capitalization eventually cost the FDIC $1.1 billion.
The banking agencies’ handling of Continental Illinois was driven by a desire to maintain liquidity and prevent contagion but it also created heated debate. Continental’s assets exceeded its total deposits (insured and uninsured) by well over $10 billion, so closing and liquidating the bank would have been a zero cost resolution for the FDIC. Due to the blanket guarantee, creditors to the bank’s holding company were protected, extending the safety net beyond the insured institution. Perhaps worst of all, the pronouncement that some banks were “too-big-to fail” created the impression that there was an official policy of never imposing losses creditors in large bank failures.
First RepublicBank. In 1987, the Competitive Equality Banking Act (CEBA) gave the FDIC
the authority to “bridge” the time between failure and resolution with temporary “bridge bank” that would provide access to existing deposit accounts and honor the failed bank’s existing loans and loan commitments to creditworthy customers. The FDIC’s first use of this new authority on a large failed bank was in the spring of 1988, when First RepublicBank (First Republic) of Texas failed. At the time of
35

failure, First Republic was the fourteenth largest bank holding company in the U.S., with approximately $33.4 billion in assets in 40 separate bank affiliates. It remains the largest bank failure in FDIC history.19
The FDIC used a combination of open bank assistance, bridge bank, and P&A resolution techniques in serial order. First Republic’s holding company asked for FDIC assistance on March 16; the FDIC responded the next day with a pledge of interim assistance to the 40 troubled affiliate banks, but did not extend assistance to the holding company. The FDIC then marketed the banks, with a bid from North Carolina National Bank (NCNB, now Bank of America) accepted as the winner on July 28. On July 29 the FDIC created a bridge bank (the entity which NCNB would eventually acquire) containing all of the assets, deposits, and “certain other non-deposit liabilities from the failed banks.” The creation of this bridge bank (a) effectively wiped out $1.2 billion in debt and preferred stock claims on the new bank and (b) simplified the resolution process by turning a 40-bank holding company into a single bank.
The bridge bank authority can be seen as a new resolution technology that allowed the FDIC to provide liquidity to all of the depositors and creditors of the 40 FDIC-insured banks, while narrowing the safety net to exclude the creditors of the parent holding company. The equilibrium at BB shown in Figure 3 provides a fair representation.
MCorp. The failure of MCorp in 1989—or more exactly, the insolvency of 20 of its 25 banking
affiliates—marked a turning point in the treatment of large bank creditors. The failure was the third largest in FDIC history and the second most costly. But the resolution was noteworthy not just for its size: it was the first time that the FDIC was able to perform an insurance determination in a large bank failure, and it was also the first time the FDIC used its bridge bank authority as the first step in a large bank resolution, without providing any interim open bank assistance.
In October 1988, the Federal Reserve issued a cease and desist order for the holding company to support its failing banks. MCorp refused to downstream any money and submitted a formal proposal to FDIC for open bank assistance. Because the FDIC needed time to study this proposal, it entered into a “standstill” agreement with MCorp that prevented institutional creditors from filing bankruptcy petitions. However, in March of 1989 three smaller creditors filed petitions, with forced MCorp to file for bankruptcy and eventually forced the OCC to declare 20 of MCorp’s banks (holding $16 billion of assets) to be insolvent. The FDIC immediately created a bridge bank to facilitate the closings of these 20 banks. It then announced a two-month deadline for entertaining P&A bids—the two months providing it with the necessary time to perform an insurance determination—with Bank One the eventual winning bidder.
Bank of New England. The FDIC’s role in the failure of the Bank of New England (BNE) in
1991 caused a backlash in Congress, and may have led to the new legislation (FDICIA) that constrained the FDIC’s freedom in resolving future failed banks. On Friday January 4, 1991, BNE Corp. announced a fourth quarter loss of $450 million that rendered it insolvent, and two days later the OCC closed both Bank of New England and Connecticut Bank and Trust—two of the three banking affiliates of BNE Corp.—and appointed the FDIC as receiver. Invoking its cross guarantee authority, the FDIC ordered the third banking affiliate, Maine National Bank, to make payments that rendered it insolvent as well. The FDIC then created three bridge banks, which reopened for business on Monday. At the urging of the Federal Reserve and the Treasury Department, the FDIC protected all of depositors in these three banks (FDIC 1998). All of the deposits, as well as most other liabilities including qualified financial contracts, were transferred to the new banks and were fully protected (although non-subordinated creditors of the holding company were not protected and shared losses pro rata with the FDIC). In the P&A auction that followed, Fleet/Norstar Financial Group was chosen as the winning bidder and the sale was completed in September.
19 First Republic was formed in June 1987—just nine months before it failed—by a merger of two large Texas bank holding companies, RepublicBank Corporation and InterFirst Corporation. Both of these companies had been experiencing problems in the depressed Texas market.
36

In the aftermath of the BNE resolution there was considerable criticism of the FDIC for protecting all of the depositors and most creditors, with many critics invoking the familiar claim of “too-big-to-fail.” Many complained that uninsured depositors had losses imposed on them only at small failed banks, while those in large banks were protected. This perception encouraged the framers of FDICIA to include passages that restricted the FDIC’s discretionary ability to protect uninsured creditors of failed banks. This was accomplished by requiring the FDIC to choose the least costly method of resolving failed insured institutions rather than being able to choose any resolution method as long as it was less costly than liquidation (FDIC 1998).20 In effect, Congress was making the argument that providing full liquidity is not free—the FDIC was spending taxpayers’ money when they chose to protect uninsured creditors—and by doing so the FDIC was wasting important opportunities to impose discipline in financial markets.
As already discussed, our theoretical framework captures restrictions such as these with the governmental constraint G. However, by the 1990s the FDIC had access to bridge bank authority and other technological improvements. Hence, to the extent that FDICIA’s least cost rule constrains the resolution choices of the FDIC, it does so along a higher technological constraint than those included in Figure 5.
First City. The consequences of FDICIA’s least cost test were apparent in the First City
resolution in 1992. First City was one of the few banks that FDIC had to provide with assistance twice. In 1987 the $11 billion Texas banking organization was approaching insolvency due to large losses in its energy, agriculture and real estate loan portfolios. The FDIC developed an open bank assistance package in conjunction with an infusion of capital from an investment group. Although the recapitalized bank was profitable for a time, it ultimately made another series of financial mistakes. By early 1992, four of the largest banks in the holding company were no longer meeting their minimum capital requirements, setting off FDICIA’s prompt corrective action (PCA) triggers. Later in the year the OCC and the Texas banking commissioner closed the two largest banks in the holding company, after which the FDIC invoked its cross-guarantee authority, rendering the remaining 18 banks in the organization insolvent.
It was at this point that the least cost changes introduced in FDICIA affected how FDIC resolved the failure. After the 20 banks were closed, each was placed in a separate bridge bank, which allowed the FDIC to analyze the losses of each bank independently. The FDIC estimated that only four of the banks had losses, and in these four cases uninsured deposits were not passed to the bridge banks, but were left in the receivership where they shared in the FDIC’s loss. All depositors in the remaining 16 better capitalized banks were passed to their bridge banks.
First City was the last large banking organization to fail from the banking crisis of the 1980s and 1990s—just in time to show how FDICIA’s least cost test effectively forced the FDIC away from its preferred full-liquidity approach to failed bank resolution. The First City resolution also set the precedent for less than 100% protection of uninsured depositors in a large bank failure. The lack of fallout from this precedent is noteworthy: We have not witnessed depositor runs at large unprofitable or troubled banks since First City.
20 FDICIA does provide an exception to the least cost rule for resolving systemically important banks that fail, but the two-thirds of the FDIC Board and two-thirds of the Federal Reserve Board would have to recommend that an exception be made. The final decision would then be made by the Secretary of Treasury, in consultation with the President.
37

Table A1 Loss Distributions for Three Resolution Methods:
Deposit Payout, Purchase and Assumption (P&A), and P&A with Insured Deposit Transfer
Deposit Payout P&A P&A with Deposit
Transfer Market value of assets $92 $92 $92 Deposits $100 $100 $100 Insured $95 $95 $95 Uninsured $5 $5 $5 Deposits - Market value of assets $8 $8 $8 Premium from acquiring bank $0 $2 $2 Total Loss $8 $6 $6 Loss to FDIC 95% X $8 = $7.60 100% X $6 = $6.00 95% X $6 = $5.70 Loss to Uninsured depositors $0.40 $0.00 $0.30
38

39
Table A2 U.S. Commercial Bank Failures and FDIC Resolution Methods, 1934-2007.
Year Failures P&As Payouts Open Bank
Assistance Year Failures P&As Payouts
Open Bank
Assistance 2007 2 1 1 0 1970 7 3 4 0 2006 0 0 0 0 1969 9 5 4 0 2005 0 0 0 0 1968 3 3 0 0 2004 3 3 0 0 1967 4 0 4 0 2003 2 2 0 0 1966 7 6 1 0 2002 10 6 4 0 1965 5 2 3 0 2001 3 3 0 0 1964 7 0 7 0 2000 6 6 0 0 1963 2 0 2 0 1999 7 7 0 0 1962 1 1 0 0 1998 3 3 0 0 1961 5 0 5 0 1997 1 1 0 0 1960 1 0 1 0 1996 5 5 0 0 1959 3 0 3 0 1995 6 5 1 0 1958 4 1 3 0 1994 11 9 2 0 1957 1 0 1 0 1993 40 35 5 0 1956 2 1 1 0 1992 100 74 24 2 1955 5 1 4 0 1991 108 86 19 3 1954 2 2 0 0 1990 159 141 17 1 1953 2 2 0 0 1989 206 174 31 1 1952 3 3 0 0 1988 280 164 36 80 1951 2 2 0 0 1987 201 133 50 18 1950 4 4 0 0 1986 144 97 40 7 1949 4 4 0 0 1985 118 87 29 2 1948 3 3 0 0 1984 79 62 16 1 1947 5 5 0 0 1983 46 35 9 2 1946 1 1 0 0 1982 35 25 7 3 1945 1 1 0 0 1981 7 5 2 0 1944 2 1 1 0 1980 11 7 3 1 1943 5 1 4 0 1979 10 7 3 0 1942 20 14 6 0 1978 6 5 1 0 1941 15 7 8 0 1977 6 5 0 1 1940 43 24 19 0 1976 17 13 3 1 1939 59 27 32 0 1975 13 10 3 0 1938 73 24 49 0 1974 4 3 0 1 1937 75 25 50 0 1973 6 3 3 0 1936 69 27 42 0 1972 2 0 1 1 1935 25 1 24 0 1971 7 1 5 1 1934 9 0 9 0