A Technical Economic and Policy-centered Feasibility...
220
Assessing the Technical, Economic and Policy-centered Feasibility of a Proposed Satellite Communication System for the Developing World Ayanna T. Samuels, Olivier L. de Weck May 2005 SSL # 8-05
Transcript of A Technical Economic and Policy-centered Feasibility...

Assessing the Technical, Economic and Policy-centered Feasibility of a Proposed Satellite Communication System for
the Developing World
Ayanna T. Samuels, Olivier L. de Weck
May 2005 SSL # 8-05

2

Assessing the Technical, Economic and Policy-centered Feasibility of a Proposed Satellite Communication System for
the Developing World
by
Ayanna Terehas Samuels
S.B., Aeronautics and Astronautics with Information Technology Massachusetts Institute of Technology, 2002
Submitted to the Department of Aeronautics and Astronautics and the
Engineering Systems Division in Partial Fulfillment of the Requirements for the Degrees of
Master of Science in Aeronautics and Astronautics
and Master of Science in Technology and Policy
at the MASSACHUSETTS INSTITUTE OF TECHNOLOGY
June 2005. © 2005 Massachusetts Institute of Technology. All rights reserved.
Author…………………………………………………………………………………….
Department of Aeronautics and Astronautics and the Technology and Policy Program, Engineering Systems Division
May 20, 2005
Certified by………………………………………………………………………………… Olivier L. de Weck
Robert N. Noyce Assistant Professor of Aeronautics and Astronautics and Engineering Systems
Thesis Supervisor
Accepted by………………………………………………………………………………... Dava J. Newman
Professor of Aeronautics and Astronautics and Engineering Systems Director, Technology and Policy Program
Accepted by………………………………………………………………………………...
Jaime Peraire Professor of Aeronautics and Astronautics
Chair, Committee on Graduate Students
3

4

Assessing the Technical, Economic and Policy-centered Feasibility of a Proposed Satellite Communication System for the Developing World
by
Ayanna Terehas Samuels
Submitted to the Department of Aeronautics and Astronautics and
the Engineering Systems Division on May 20, 2005, in Partial Fulfillment of the Requirements for
the Degrees of Master of Science in Aeronautics and Astronautics and Master of Science in Technology and Policy
Abstract Satellite communication systems remain one of the most under utilized development mediums in less industrialized countries. This research proposes to establish a low cost satellite communications system tailored specifically for the developing world (+/- 30° latitude). The technical, economic and policy related frontiers of the problem are integrated within a MATLAB based satellite communication constellation simulation which is used to assess the feasibility of the proposed satellite system. The analysis demonstrates that with technical advances that would allow higher capacity systems at lower costs and a renewed policy framework in line with the present state of the satellite system industry, it could be feasible to establish a low earth orbit satellite communications system for the developing world. The inputs to the satellite simulation are the proposed system’s desired design variables and other relevant parameters. The outputs are system performance, capacity and cost. The Pareto optimal solution trade space is generated by the simulation model using a full-factorial run that probes the entire design space. The application of choice is short messaging services (SMS), chosen for its ability to provide proven connectivity at moderate costs. The capacity and cost of the most ideal Pareto architecture is contrasted against demand in the defined developing world region. The simulation also accounts for the necessary policy considerations and assesses the feasibility of the proposed system amidst the existing industry policy and regulatory framework. Additionally, data regarding the current economic standing of the region and how this forms an underlying basis for the digital divide is presented and assessed. The policy and regulatory constraints on the acceleration of telecommunications development throughout the developing world are discussed. This thesis elaborates upon the need for a focus on design for affordability if satellite communication systems are to realize their immense potential for the delivery of needed social services to the world’s marginalized. Thesis Supervisor :Olivier L. de Weck Title :Robert N. Noyce Assistant Professor of Aeronautics and Astronautics and Engineering Systems
5

6

Acknowledgements First and foremost I would like to thank God for His continued mercies and blessings upon
me and for making the opportunity to pursue a graduate education in this important research
field a reality. I would then like to extend a heartfelt thank you to the Hugh Hampton Young
Memorial Fund Fellowship Committee (this Fellowship is administered by the MIT Graduate
Student’s Office (GSO)) for funding my graduate education for the first two years. A
heartfelt thank you is also in order for the MIT GSO which offered me a GSO administered
Student Fellowship for my final year of graduate school. To the special staff of the GSO,
your faith in investing in me and your many words of encouragement will never be forgotten.
I would also like to thank my advisor, Professor Olivier de Weck, for his guidance. Many life
lessons were learnt along the way and I thank you for your knowledge, financial support and
overall contribution in no small part to the successful completion of my degree. Sincere
thanks also go out to the special staff and faculty of the Aerospace department and the
Technology and Policy Program. Thank you for keeping me afloat.
A special thank you is also in order for the staff of the ITU in Geneva Switzerland. Thank
you for acting as such memorable mentors to me during my summer 2004 internship with
you. To my many friends at MIT who I came to know and love during my seven year tenure
here, words do not exist to thank you. You made every moment worth it and made me a
better person. Thanks for the unbridled love and the many impassioned conversations about
how we can make this world a better place.
And lastly to my family, I love you dearly. Thank you for showing me unconditional love
and keeping me grounded. To my parents who believed in me from the outset, thanks for
making me believe in my astronomical dreams. In anything I have ever done, you have
always let me know that you were proud of me, and that you support me and this is what
makes me never give up and is a priceless gift I will always treasure. Your love and
encouragement mean more than you can ever know, I was blessed to be born to you. You
each have hearts of gold and my wish is that you will both be many times blessed. I am
forever indebted for everything you have done and continue to do.
7

8

Contents 1. Introduction............................................................................................................... 25
1.1. Overview of the Study ......................................................................................... 25 1.2. Historical Background of the Study .................................................................... 27 1.3. Literature Search.................................................................................................. 31
1.3.1. Chang’s Satellite Communication Constellation Simulation ................... 31 1.3.2. von Noorden’s Analysis of Mobile Satellite Communications Applications
for Developing Countries ............................................................................. 31 1.3.3. The ITU’s Report on the Portable Internet as a Tool for Bridging the
Digital Divide ............................................................................................... 32 1.3.4. The Economist’s Report on Issues Behind the Digital Divide ................. 33 1.3.5. Spectrum’s Report on the Digital Divide Index ....................................... 33 1.3.6. Government of Jamaica’s “E-Learning” Report detailing an E-learning
project sponsored by the Government of Jamaica and the ITU……………32 1.3.7. Digital Opportunity Initiative’s (DOI) Report on Creating a Development
Dynamic ....................................................................................................... 37 1.3.8. Lebeau’s Analysis of the Development of Satellite Communications and
its Socio-Economic Implications.................................................................. 39 1.3.9. Mowlana’s Analysis of the Political and Social Implications of
Communications Satellite Applications in Developed and Developing Countries....................................................................................................... 40
1.3.10. SpaceNews’ report on Bringing Space Technology to the Developing World ………………………………………………………………………39
1.3.11. Iida et al.’s proposition of a LEO Satellite Communications System for the Countries in the Low Latitude Region …………………………………….40
1.3.12. Turner’s Study of Constellation Design Using Walker Patterns ………..41 1.3.13. Lang’s Analysis of Optimal Low Earth Orbit Constellations for
Continuous Global Coverage ……………………………………………...41 1.4. Open Questions.................................................................................................... 44 1.5. Needs Assessment for the Developing World ..................................................... 44 1.6. Motivation for Current Research ......................................................................... 47 1.7. Impact of Research Answers on Current State of Knowledge ............................ 50 1.8. Thesis Preview..................................................................................................... 51 1.9. Summary.............................................................................................................. 53
2. The Need to Re-engineer Satellite System Design.................................................. 55
2.1. Introduction.......................................................................................................... 55 2.2. United Nation’s World Summit on the Information Society Objectives............. 55 2.3. Communication Means that Currently Exist to Provide Connectivity ................ 57 2.4. The Commercial Satellite Systems Industry........................................................ 62
9

2.4.1. How Did We Get To Where We Are Now? ............................................. 62 2.4.2. Current State of Commercial Satellite System Industry ........................... 63
2.4.2.1.The Emergence of Low Earth Orbit Systems ..................................... 63 2.4.2.2.Reasons as to Economic Failure of Major Past Satellite Systems ...... 66
2.4.3. Present Focus of Satellite Systems ........................................................... 67 2.5. The Establishment of a World Database ............................................................. 69
2.5.1. Defining the Developing World................................................................ 69 2.5.2. Further Insight Gleaned from Database Compilation............................... 70
3. The Technical and Economic Feasibility of a Satellite Communication System
for the Developing World ......................................................................................... 79
3.1. Introduction.......................................................................................................... 79 3.2. Delivering Innovative Mobility ........................................................................... 79
3.2.1. An Assessment of the Intended Satellite Application............................... 79 3.2.2. Ingenious Messaging Applications ........................................................... 81
3.2.2.1.Saving Lives through Portable Messaging ......................................... 81 3.3. The Simulation Model for LEO Communication Systems.................................. 83
3.3.1. Purpose of Model...................................................................................... 83 3.3.2. Limiting Assumptions of the System Model ............................................ 85 3.3.3. System Architecture Evaluation Framework ............................................ 86 3.3.4. Implementing and Testing the System Model .......................................... 86
3.3.4.1.Input (Design, Constants, Policy, and Requirement) Vectors and Output (Objective and Benchmarking) Vectors Definition (Step 1) ... 88
3.3.4.2.Define, Implement and Integrate the Modules (Steps 2 and 3) .......... 94 3.3.4.2.1. Simulator’s Overall Structure ................................................. 95
3.3.4.3.Benchmark against Reference Systems (Step 4) ................................ 98 3.4. Trade Space Exploration and Optimization (Step 5) ......................................... 100
3.4.1. Non-dominated (Pareto) Architectures ................................................... 102 3.5. Post Processing of the Pareto Optimal Solution (Step 6) .................................. 106 3.6. Implications of Results of System Architectural Trade Space Exploration ...... 111
4. Re-engineering the Policy Framework of Satellite Systems................................ 115
4.1. Current Policy Framework of Satellite Communication Systems for the Developing World ............................................................................................. 117
4.2. Is Current Framework Possibly Influencing ‘Intangibility’ of Satellite Systems for the Developing World? ................................................................................ 119
4.3. What Specific Aspects of Current Telecommunication Policy and Regulatory Environment are acting as Obstacles to Establishing the Proposed Satellite Sytsem?.............................................................................................................. 120
4.3.1. Harsh Regulatory Environment .............................................................. 121 4.3.2. Dearth in Knowledge of Benefits of Satellite Technology..................... 122 4.3.3. Discriminatory Cost of Space Segment Access...................................... 122 4.3.4. Rapid Technological Advancement........................................................ 123 4.3.5. Conflicts of Interests ............................................................................... 123
10

4.3.6. International Administrations’ Lack of Institutionalized Policies for Regulatory Infractions ................................................................................ 124
4.3.7. Agencies Not Structured to Meet Today’s Policy and Regulatory Challenges .................................................................................................. 125
4.4. What Policy Changes Need to be Made to Affect Sustainable Development in Regard to Satellite Systems (especially those Catered to the Developing World)?........................................................................................................................... 125
4.5. How Can Involved Stakeholders Encourage the Widening of the Scope of Possible Satellite Communications Applications? ............................................ 132
4.6. Summary……………………………………………………………………….132
5. Conclusions and Recommendations for Future Work........................................ 137
5.1. Summary of the Current Research..................................................................... 137 5.1.1. Summary of Background Demographics Presentation and Economic
Analysis ...................................................................................................... 137 5.1.2. Summary of Technical and Economic Feasibility Study........................ 138 5.1.3. Summary of Policy-Centered Feasibility Study ..................................... 139
5.2. Conclusions........................................................................................................ 140 5.2.1. Demographic Background and Economic Analysis ............................... 140 5.2.2. Need for Design for Flexibility Approach in Regard to Key System
Parameters .................................................................................................. 142 5.2.3. Modeling Complex Engineering Systems is Feasible and Necessary .... 142 5.2.4. Cost Considerations – Important Design Objective................................ 142 5.2.5. Technical Changes Needed to Make Proposed System Feasible............ 143 5.2.6. The Policy and Regulatory Framework of Satellite Systems ................. 144 5.2.7. New Thought Structure Needed within Developing World to Enact
Economic Development ............................................................................. 145 5.2.8. Role Satellite Communications Can Play in Development Process ....... 146
5.3. Recommendations for Future Work .................................................................. 146 5.3.1. Fine Tune the Market Module Expressly for the Needs of the Proposed
SMS System ............................................................................................... 147 5.3.2. Refine the Design Space ......................................................................... 147 5.3.3. Use of Additional Objectives to Measure Merit of Designs................... 147 5.3.4. Conduct More Rigorous Economic Analysis ......................................... 148 5.3.5. Conduct Further Research Including Sensitivity and Uncertainty Analysis
on the Pareto Designs…………………………………………………….146 5.3.6. Obtain More Detailed 'Activity Per User' Information for SMS
Applications……………………………………………………………….146 5.3.7. Conduct Further Investigation on Pareto Font........................................ 148 5.3.8. Develop Stakeholder Value Model……………………………………..147
5.3.9. Develop Precise Geographic Models of Connectivity………………….147 A Description of the World Database ....................................................................... 151
B Detailed Description of Computer Model Modules ............................................. 157
11

B.1 System Input File (SIF) .................................................................................... 157 B.2 Start File (SF) ................................................................................................... 159 B.3 Coverage/Constellation Module (CCM) .......................................................... 160 B.4 Satellite Network Module (SNM) .................................................................... 171 B.5 Spacecraft Module (SM) .................................................................................. 172 B.6 Launch Vehicle Module (LVM)....................................................................... 181 B.7 Capacity Modules (CM) ................................................................................... 184 B.8 Total Cost Module (TCM)................................................................................ 190 B.9 End User Terminal Module (EUTM) ............................................................... 198 B.10 Total Number of Subscribers for Pareto Architecture...................................... 202 B.11 Output assignment and Postprocessing ............................................................ 204
C Developing World Survey ........................................................................................ 205
12

List of Figures 1-1 Thesis Preview ……………………………………………………... 49
2-1 Polar and Walker satellite constellations……………………………. 62
2-2 LEO communications satellite constellation. ………………………. 63
2-3 Market predictions (in 1991) versus actual number of terrestrial
cellular network subscribers in the United States for the 1991-2000
period ……………………………………………………………….. 65
2-4 Global comparison of GDP/capita vs. Latitude ……………………. 68
2-5 Global 3-D Comparison of Longitude, Latitude and Population …... 69
2-6 Global comparison of Population vs. Latitude………………… 70
2-7 Global comparison of Population vs. GDP/capita ……………. 71
2-8 Global comparison of Population vs. GDP/capita with classifications 72
2-9 Cumulative Total Population in +/- 30° equatorial range with
GDP/capita >= x, where x is the GDP/ capita ……………………. 74
3-1 Architectural trade space exploration methodology ………………... 85
3-2 Input-output mapping of LEO communication satellite constellation
simulation …………………………………………………………... 87
3-3 Communications satellite constellation - simulation structure …….. 94
3-4 LCC vs. System Capacity plot for a full factorial run of 216 designs 99
3-5 Number of users in the +/-30° range vs. amount spent on
communication services ……………………………………………. 106
B-1 One-dimensional design vector vs. Two-dimensional design vector . 156
B-2 Geometry of a satellite in a Walker Constellation …………………. 163
B-3 Geometry involved in calculating single satellite coverage ………... 166
B-4 Relationship between dry mass of spacecraft without ISL and
payload power based on the FCC filings of 23 LEO personal
communication systems ……………………………………………. 171
13

B-5 Relationship between antenna mass and antenna dimension based on
the data of 8 systems provided in Larson and Wertz [WLJR99] …... 172
B-6 Iterations to find satellite mass ……………………………………... 173
B-7 Solid motor dry weight vs. total impulse …………………………... 178
B-8 Launch capability of Long March 2C ……………………………… 180
B-9 Fairing dimensions of Long March 2C. ……………………………. 181
C-1 Developing World Survey ………………………………………….. 206
14

List of Tables
1.1 Summary of key macro economic indicators for Jamaica …………. 33
1.2 Number of mobile and land line telephones (1999 – 2002) ………... 33
1.3 Number and type of telecommunications licenses issued
(2000 – 2003) ………………………………………………………. 34
1.4 Developing world’s identified needs and services that could address
them ………………………………………………………………… 43-45
2.1 Objectives of the United Nation’s World Summit on the Information
Society ……………………………………………………………… 54
2.2 Current main telecommunication mediums ………………………... 55
2.3 Key factors relating to the density of capital cities vs. the
surrounding areas for Ghana, Mexico, Puerto Rico and Nigeria……. 57
2.4 Costs to system operator for the provision of communication
services …..…………………………………………………………. 58
3.1 Design variable definition, x ………………………………………... 88
3.2 Constants definition, c ……………………………………………… 89
3.3 Policy constraints, p ………………………………………………... 90
3.4 Requirements definition, r …………………………………………. 91
3.5 Objectives definition, J …………………………………………….. 91
3.6 Benchmarking vector, B, definition ………………………………... 92
3.7 Benchmarking results of the proposed SMS-based system and the
simulated Orbcomm system against the actual Orbcomm system … 97
3.8 Design variable values for the full-factorial run …………………… 98
3.9 System Total Capacity, LCC, Cost per Year, and the Cost per Year
to send and receive messages for the Pareto Optimal Designs …… 101
3.10 Design Variables of the Pareto Optimal Designs …………………... 101
3.11 The most efficient system filtered from the Pareto Optimal
Designs................................................................................................. 109
15

A.1 Developing World Database ……………………………………….. 150-153
B.1 Lang’s optimized Walker constellations for continuous one fold
coverage of the 30° S to 30° N latitude zone………………………... 160-162
B.2 Coding gain Eb/N0 (dB-b-1) for soft-decision Viterbi decoding,
QPSK ……………………………………………………………… 187
B.3 Learning curve slope values ………………………………………... 191
B.4 Ground segment development cost distribution ……………………. 193
B.5 Paging End User Terminals Data Set………………………………... 197
B.6 Pager Data Set Main Effect Calculations……………………………. 199
16

Nomenclature
Acronyms
FCC Federal Communications Commission
GEO Geosynchronous Equatorial Orbit
ICT Information and Communication Technologies
ISO International Satellite Organization
ITU International Telecommunication Union
LCC Life-Cycle Cost
LDC Least Developed Countries
LEO Low Earth Orbit
MF-CDMA Multiple Frequency – Code Division Multiple Access
MF-TDMA Multiple Frequency – Time Division Multiple Access
MOU Memorandum of Understanding
MSDO Multidisciplinary System Design Optimization
VSATS Very small aperture terminals
17
Symbols
Design Variables
1. c Constellation type
2. h Altitude
3. ε Minimum elevation angle
4. di Diversity
5. Pt Satellite transmit power
6. GtdB Satellite antenna edge cell spot beam gain
7. ISL Inter-satellite link
8. MAS Multiple Access Scheme
9. Tsat Satellite lifetime
Constants
1. AKM
Apogee kick motor type
2. AKMIsp Apogee kick motor specific impulse
18

3. StationIsp Station keeping specific impulse
4. MS Modulation scheme
5. ROF Nyquist filter roll-off factor
6. CS Cluster size
7. NUIF Neighboring user interference factor
8. Rc Convolutional coding code rate
9. K Convolutional coding constraint length
10. RISL Inter satellite link data rate
11. GedB Gain of user terminal antenna
12. Pe User terminal power
13. IDT Initial development time
Policy Constraints
1. FBup Uplink frequency bandwidth
2. FBdown Downlink frequency bandwidth
3. FLV Foreign launch vehicle
19

Objectives
1. Rlifetime Total lifetime data flow
2. Nusers Number of simultaneous users
3. LCC Life-cycle cost
4. Nyear Average annual subscribers
5. Ttotal Total airtime
6. CPF Cost per function
Benchmarking Metrics
1. Nsat Number of satellites
2. Nusers Number of simultaneous users
3. LCC Life-cycle cost
4. Msat Satellite mass
5. Ncell Number of cells
6. Torbit Orbital period
7. EIRP Satellite transmit average EIRP
20

8. Ngateway Number of gateways
Requirements
1. BER Bit error rate
2. Ruser User data rate
3. Margin Link margin
21

22

Key Definitions
Pareto optimality If the objective J* of a design vector x* is not dominated by any
other objective in the objective space, then x* represents a Pareto
optimal design. Let J1 and J2 be two different objective vectors in
the same objective space S. In the case of maximization, J1
dominates J2 if and only if (iff):
iJJiJJ iiii oneleastatforand 2121 >∀≥
A design x* ∈ S is Pareto optimal iff its objective vector J(x*) is
non-dominated by the objective vectors of all the other designs in
S. In other words, in optimization literature, design x* is ‘non-
dominated’ if it is impossible to move feasibly from it to increase
an objective without decreasing at least one of the other
objectives. Note that x* only approximates a Pareto optimal
solution, due to the way in which the design problem has been
transformed into a combinatorial problem. But for the purpose of
finding near-Pareto optimal solutions in the design space of this
research, this difference can be ignored. [deW03]
Low Earth Orbit A LEO communication satellite constellation system is a
constellation of satellites that orbit the Earth at an altitude of
about 500-1500 km and provide wireless communications
between terminals on the ground. There are two major types of
constellations: Polar and Walker. Both constellations are designed
to provide the most efficient global coverage by using a minimum
number of satellites, each with its own advantages and
disadvantages.
MF-CDMA Multiple Frequency – Code Division Multiple Access. Using a
23

unique pseudorandom noise (PN) code, a code division multiple
access (CDMA) transmitting station spreads the signal in a
bandwidth which is wider than necessary. Each authorized
receiving station must have the identical PN code to retrieve the
information. Other channels can operate simultaneously within
the same frequency spectrum as long as different, orthogonal
codes are used. In MF-CDMA, multiple CDMA carriers at
different frequencies are used to increase the number of channels.
MF-TDMA Multiple Frequency – Time Division Multiple Access. In MF-
TDMA, a communication channel simultaneously occupies a
specific time slot in the time domain and a specific frequency
carrier in the frequency domain. Thus the total number of
channels is the product of the number of time slots and the
number of frequency channels. Both the time domain and the
frequency domain are used efficiently.
Trade space The trade space includes the design and objective space. The term
“design space” refers to the x-space, i.e. the domain of design
variables where designers have formulation freedom. The term
“objective space” refers exclusively to the J-space, i.e. the space
of system attributes, behaviors or objectives that are used by
decision makers to understand the resulting system designs. The
term “trade space” is the umbrella term that encompasses both the
design space and the objective space.
All definitions taken from [DC04] and [deWDC03a].
24

Chapter 1
Introduction
1.1. Overview of the Study There are currently stark inequities in levels of accessibility to all of today’s major social
needs upon which a society’s stability and by extension the world’s stability rests. Some
of the most pressing social needs surround sanitation, health, land, education, emergency
relief, early warning systems, opportunities for involvement in the civic process,
transport, jobs and rural connectivity to the outside world. A vital and potent vehicle
towards addressing most of these social needs would be to strengthen the link between
the potential and current reach of information and communication technologies (ICTs).
Towards this end, this thesis proposes the establishment of a satellite communication
system tailored specifically towards least developed countries (LDCs). This system
would provide the low cost and potent communication application of short messaging
services.
Economic analysis illustrated within this thesis provides a rationale for the decision to
demarcate the equatorial zonal range of +/- 30° latitude as the developing world region of
focus for the proposed satellite system. The definition is appropriate because as
illustrated later in this thesis, 91.5 percent of the world’s inhabitants within this equatorial
range exist on a GDP per capita less than the world’s average GDP/capita of $7,600 in
2002 dollars. This proposition of a satellite communication system for the developing
world raises a plethora of engineering and design research questions that cannot be
appropriately and comprehensively addressed without conducting an assessment of the
economic, political, cultural and policy environment in which the technology will be
implemented.
25

The present major impediments towards the growth of satellite communications as a tool
to affect empowerment in developing regions are its impairing cost and an often
non-facilitating policy and regulatory climate. However if the cost of satellite
communications applications were commensurate with what people in less industrialized
countries could afford, the technology could provide extremely needed instantaneous and
universally available connectivity to a wide expanse of developing regions. This
connectivity could ‘leap-frog’ many less industrialized countries to realizing needed
access to the previously mentioned social needs. In regards to the policy realm, the field
has noticed positive signs towards liberation of the telecommunication market in many
developed and developing countries. A commitment to further encouraging
telecommunications liberalization must be garnered from organizations such as the ITU
and FCC to reduce barriers to entry and other existing debilitating facets of
telecommunications policy.
This thesis shows that with a design for affordability revolution in the way satellite
systems are engineered, coupled with the availability of low cost end-user terminals,
significant achievements can be accomplished. Low cost applications can be provided
that are in tandem with amounts the inhabitants of the demarcated equatorial range can
afford to spend on communications services. To assess the feasibility of the proposed
system a low earth orbit satellite communication system simulation is employed. This
study researches whether there is a feasible satellite system architecture for the proposed
system from the subset of non-dominated architectures resulting from the simulation
utilized. The inputs to this MATLAB based simulation are, inter alia, the end-user’s
technical requirements for the system and the existing policy constraints on the system.
After analysis, the simulation then outputs the orbital dynamics and physical attributes of
the satellite system and information related to the system performance, lifecycle cost and
capacity. The cost per function or in this case the cost per “message,” along with the cost
of the end-user terminal is also outputted from the simulation.
The costs to be born by the consumer are contrasted against researched amounts that
people in this demarcated region can afford to spend on communications services. In the
26

final analysis, after due consideration of the attendant technical, economic and policy
related relevant concerns and changes necessary to realize the envisioned connectivity
goals, the feasibility of the proposed system is evaluated.
1.2 Historical Background of the Study In undertaking an analysis of this nature it is important to first have a keen understanding
of the role information and communication technologies (ICTs) can play in the social
development of a society. In any society an increase in the volume of information that
can be exchanged is traditionally designated as progress. The milestones of this progress
are earmarked by the emergence of new methods of transmission and analysis of
information.
Unsurprisingly, the invention of printing i.e. the mobile typescript is often associated
with the beginning of the Modern Era. A significant advancement was made at the
beginning of the 20th century with the transmission of information using a radio-electric
wave. This innovation in turn facilitated an increased reliance on the electromagnetic
signal for data processing and transmission. These advancements played a major role in
ushering in the technological revolution which dominated the twentieth century and
continues to be a leading force in the twenty-first century. The 20th and now 21st
centuries have been revolutionized by the information revolution much like the industrial
revolution, brought about by the discovery of the steam engine, dominated the 19th
century.
Satellite communications continues to play a major role in this revolution as it provides a
robust solution to the problem of finding the best means to send a signal from one point
of the earth to another. Before the emergence of satellite technology the only means to
send a signal over long distances was to maneuver it from point to point overground via
cables of radio-relay systems. With the launching of the first satellite in 1957 a new
method for setting up a relay visible simultaneously from two distant points emerged.
This idea was continuously exploited starting with the launch of the Telstar satellite in
1962.
27

A number of important factors led to the development and diversification of satellite
communications in the course of the last fifty years. Firstly, satellite communication
systems have the flexibility of not being limited to the terrestrial infrastructural needs of
land-based communication systems. Secondly, people began to appreciate that the
emergence of satellites can do away with existing bottlenecks such as the time and
volume restrictions on the relay of intercontinental data. Thus with a foundation of
significant benefits, the satellite communication field has continued to grow from
strength to strength.
Today’s global information infrastructure tends by and large to the elite and serves to
widen an ever yawning divide between the haves and the have nots. The developing
world is currently in dire need of communication mediums that can bridge this ever
widening digital divide. In the developed world satellite communication applications are
viewed as “substitution” applications, in such regions the system symbolizes a medium
providing already available applications. However for many regions of the developing
world where other means of communication (such as roads, post or fixed-line phones) are
poor or non-existent, the presence of satellite communications connectivity would
provide a means to the desired end of the provision of basic social needs.
The provision of this connectivity would be a significant empowering force as
marginalized peoples can quickly find ingenious applications to forward their
development agenda. There are numerous noteworthy examples of such ingenious
applications. “Telephone Ladies” in Bangladesh have made a business from sharing and
renting out mobile phones they bought using micro-credit loans. In Kenya, in order to get
the best price for their harvest, or to ensure that the “middle man” is representing an
accurate picture of the market, farmers and fishermen use mobile phones to conduct price
comparisons from several markets. [ITU04] A means of connectivity can prevent wasted
journeys. As a result, throughout Africa, small businesses use mobile units to find the
cheapest vendor for supplies. In Zambia and several other African countries mobile
phones are used to make cashless payments, this has significant economic and security
28

benefits. [ECON05b] In Zambia’s Soweto market located in the capital city, a Coca-Cola
distributor’s full load of bottles is sold every few days. A full load costs 10 million
kwacha (about US$2000) in 2005 dollars. In cash, this amount is difficult to store
discreetly, is a challenge to be counted and is valued at ten times the average Zambian
annual wage, which makes it prone to theft. A system was thus implemented to have the
Coca-Cola distributors pay for their deliveries not in cash but by sending a text message.
[ECON05a] Other budding entrepreneurs have established themselves as “text message
interpreters,” wherein these interpreters send and receive text messages on behalf of their
customers who may be illiterate or unable to afford the SMS end user terminal. It can
thus be seen that this sort of connectivity reduces transaction costs, widens trade
networks, facilitates real time feedback on the market price of often perishable goods and
can reduce the need to travel. For various sectors of society in developing regions these
benefits signal significant advancements towards economic development.
Over forty percent of the world’s 6.3 billion people live in rural and remote areas of
developing countries [WSRN], most in abject poverty. Their right to be able to
communicate has not received much investment from the international technical and
donor community. Statistics such as the island of Manhattan in N.Y. USA having more
mobile phones than the entire continent of Africa stands testament to the disparities in
access to the digital era across the globe. [ECON05] Mr. Iqbal Quadir, the developer of a
very successful ICT for development initiative in Bangladesh known as Grameen Phone,
once told a poignant personal story which illustrates the gravity of the aforementioned
inequities. When Mr. Quadir was only about ten years old a family member was ill and
his mother requested that he make the ten mile trip to decipher whether the village doctor
was present and able to attend to the family’s sick. This means of communication was the
only option available to Iqbal’s family as there was no other way this communication
could be carried out other than physical discourse. Iqbal made the ten mile trip only to
discover that the doctor was not in and had to make the ten mile return trip to deliver the
bad news to his mother and his sick family member.
29

Unfortunately, lack of access to communication infrastructure and its attendant benefits is
still grossly lacking in LDCs. This digital divide merits global concern as it can lead to
national disintegration which not only limits the scope of a country’s national economic
growth but also risks political upheavals which would most certainly have international
effects. [HM97]
The economic health of the developing world between 1990 and 2000 is the worst it has
been since the Great Depression. [MW02] In Latin America for instance, income per
person experienced a 75 percent growth rate between 1960 and 1980. However the next
two decades would see income per person growing by 7 percent or remaining stagnant.
Even more jolting economic statistics emanate from Africa which suffered reverse
economic growth between 1960 and 1980 with a decline of some fifteen percent in
income per person. Amidst all this China did register the fastest growth known to history
between the 1980s and the turn of the millennium. Nonetheless, even including China
which is weighted by its significant population of 1.3 billion, the developing economies
as a group grew at half the rate between 1980 and 2000 as they had from 1960 to 1980.1
Debilitating events such as the events of September 11, 2001 have not served to inject a
positive change in this trend in the first 5 years of the 21st century. This poor economic
growth over the past two and a half decades has only served to widen the digital divide.
This puts in context the fact that the digital divide is symptomatic of deeper divides of at
the very least – income, development and literacy.
The consequence of the aforementioned negative economic trend is that satellite
communications applications have been out of reach economically for the people who
could benefit the most. The last two major innovations in personal satellite
communications systems, namely Iridium and Globalstar proved technological successes
but economic failures. These systems had to file for bankruptcy as they proved too
expensive an option even among affluent customers.
In trying to mitigate the digital divide it must be remembered that IT infrastructure
introduced in a top-down manner is not the answer. For instance, placing a free computer
in every household within a community in abject poverty does nothing if the recipients
30

have no food or electricity and are illiterate. ICTs must be used as a tool to affect
development, delivering sorely needed applications to empower, enrich and affect
sustainable development.
1.3 Literature Search
1.3.1 Chang’s Satellite Communication Constellation Simulation [DC04]
Chang in his June 2002 Master’s of Science thesis developed a multi-objective, satellite
communication constellation capable of incorporating technical, economic and policy-
related factors. The simulation employs design space exploration, which facilitates
assessing particular architecture in the larger technical, economic and policy context. A
computer simulation captures the important elements of the satellite constellation design
problem. The simulation maps high level design decisions such as the orbital altitude of
the constellation or the transmitter power aboard the satellites to system performance,
lifecycle cost and capacity. Chang’s work makes a significant contribution to the
understanding of engineering, economic and policy issues related to satellite
communication systems and allows for the quantification of the impact of technological
change and policy implementation on complex systems.
1.3.2 von Noorden’s Analysis of Mobile Satellite Communications
Applications for Developing Countries [WN89]. von Noorden illustrates examples of how a mobile satellite system can offer a range of
applications and reach user communities that cannot be served by fixed systems. One
potent application he expounds upon is using mobile satellite terminals as early warning
systems. This has direct relevance to current times as it is now widely agreed inside and
outside of the satellite communications industry that a greater prevalence of early
warning systems could have assisted in abating the immense death toll of over 220,000
arising out of the December 26, 2004 Indian Ocean earthquake and tsunami. von
Noorden identifies ways in which the International Maritime Satellite Organization’s
31

(Inmarsat) satellite system could benefit the developed world. He rightly suggests that
Inmarsat’s institutional commitments, the evolution of space technology, and the
introduction of new service applications will enable Inmarsat to contribute to economic
and social developmental goals in developing regions.
von Noordon’s suggestion that it is primarily economies of scale achievable through a
global network which can put satellite communications within financial reach of most
users in the developing world is not satisfactory to affect connectivity goals given the size
of today’s existing global income divide. Fifteen years on from this 1990 analysis,
satellite communications has not been able to break the ‘affordability barrier’ for people
in developing countries which leads to the conclusion that to truly make these systems
tangible options for the people who could benefit the most, these systems have to be
engineered for affordability from the design phase.
1.3.3 The ITU’s Report on the Portable Internet as a Tool for
Bridging the Digital Divide. [ITU04] This report analyzes numerous case studies for which satellite communications acting in
a symbiotic relationship with other ICTs has succeeded in providing communications
access to marginalized peoples. There are examples emanating from Brazil, Canada,
India, and the Caribbean. The Brazilian example is quite intriguing as it demonstrates the
digital divide being bridged for a private nature reserve for which access is only possible
via a 40 hour boat trip from the city of Manaus in Brazil. The reserve is known as the
Xixuaú-Xipariná Ecological Reserve. The reserve’s isolation and lack of electricity has
left the native Caboclo Indians with virtually no access to modern health care, education
and economic opportunities.
To begin to address this problem, the first problem that had to be dealt with was a lack of
electricity. To this end, the president of the Amazon Association contacted the Solar
Electric Light Fund (SELF), a non-profit organization located in Washington, DC, for
help with the financing and establishment of solar electric systems on the ecological
reserve. SELF eventually installed the systems, which were used, inter alia, to power a
32

satellite Internet link. High-speed Internet access (a maximum capacity of 4 Mbit/s
downlink and a 192 kbit/s uplink) was established by means of a two-way VSAT system.
To complement the VSAT system, a wireless LAN was implemented at the reserve.
Before operation of the satellite dish commenced, it was necessary to acquire a licence
from Anatel, Brazil’s national telecommunications authority. No commercial return is
expected from this venture. This connectivity has brought applications ranging from
distance education, to telemedicine to e-commerce to this once cordoned-off reserve in
Brazil. [ITU04]
1.3.4 The Economist’s Report on Issues Behind the Digital Divide
[ECON05b] Jhunjhunwala argues that affordability is the “deciding factor” in determining whether
the digital divide will be bridged. In light of this, he and his colleagues are researching a
number of low-cost devices, including a remote banking machine and a fixed wireless
system that cuts the cost of internet access by more than half. Jhunjhunwala is thus aware
that creative research which designs for affordability commencing at the initial design
phase is the direction research and development must focus on to affect tangible
development goals.
1.3.5 Spectrum’s Report on the Digital Access Index [SPEC04] The ITU recently conducted a tangible measure of social inequities in the adoption of
ICT across the globe. This measure is known as the Digital Access Index (DAI) and
corresponds to a specific score for each country in the world which attempts to quantify
the digital divide. The study was compiled by the ITU and released in November 2003.
The ITU calculated a DAI ranking for each country which was determined by factors
such as education, the affordability of Internet access, and the proportion of Internet users
with high-speed connections, in addition to the raw availability of bandwidth. The factor
that most illustrates the extent of the digital divide is affordability, defined by the cost of
access to the Internet as a percentage of a country’s gross national income per capita. The
measure considered the basic monthly cost of Internet access for an individual line plus
33

any additional cost for twenty hours online. The country ranking worst in affordability
was the Congo which scored an alarming 5000 times worst than the country ranking the
best. This speaks volumes to the astounding extent of today’s digital divide.
The report illuminated other stark realities such as the fact that in Nigeria a year of
internet access of the sort taken for granted by the developed world costs 3.54 times the
average Nigerian’s total annual income. This Digital Divide Index succeeds in
quantifying the extent of today’s digital divide as concerns internet connectivity, and
without overtly stating it, vividly demonstrates that our understanding of and planning for
the impact of communications satellites has lagged far behind the technical state of the
art. That is, the link between the potential and reach of information and communication
technologies broadly defined, remains dangerously weak.
1.3.6 Government of Jamaica’s “E-Learning” Report detailing an
E-learning project sponsored by the Government of Jamaica
and the ITU. [ITU], [MOU03]
This report which details the general health of the Jamaican telecommunications industry,
provides a vibrant example of the fact that despite the developing world's economic
downturn in the last 25 years, encouraging “leap-frogging” effects are possible if
connectivity means are provided at an affordable price to customers. First, it presents a
summary of Jamaica’s key macro economic indicators so that there is a context within
which to judge the country’s recent significant telecommunications growth. From Table
1.1 it can be seen that the Gross National Income per capita for Jamaica was a mere
$2,820 in 2002 with a corresponding annual growth of a meager 1.0% in that year. These
statistics rank Jamaica as a lower middle income developing country according to the
ranking of the International Telecommunication Union. [ITU]
34
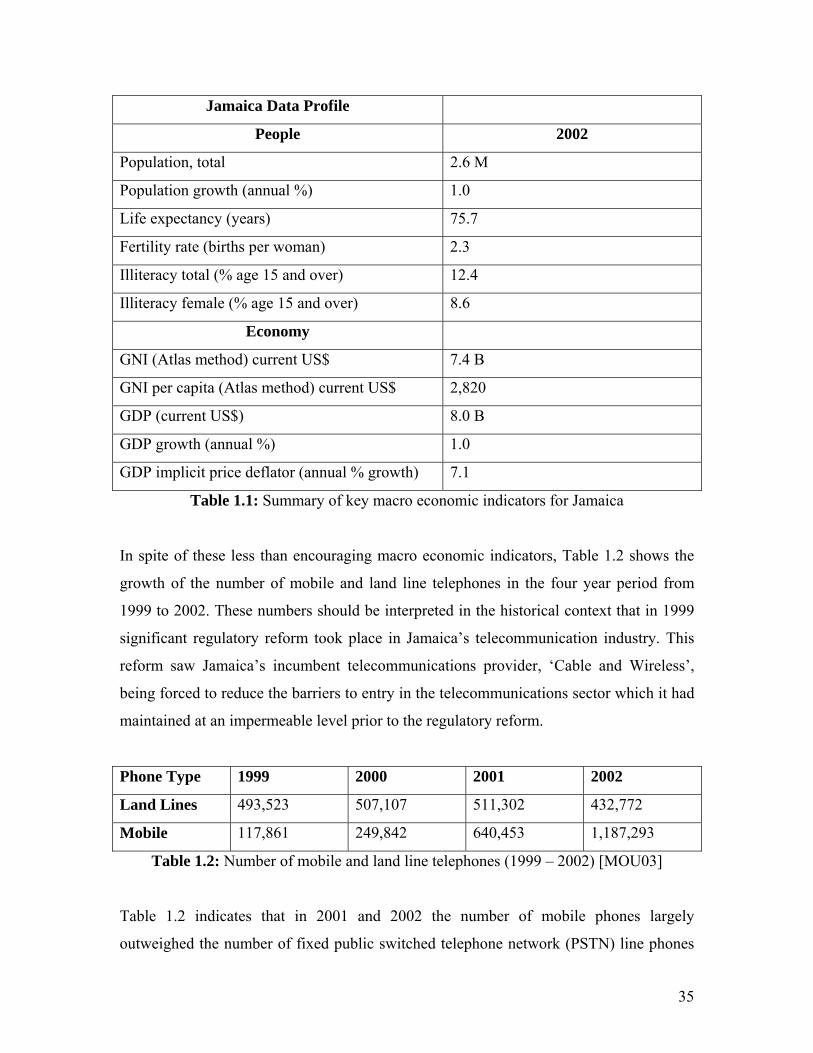
Jamaica Data Profile
People 2002
Population, total 2.6 M
Population growth (annual %) 1.0
Life expectancy (years) 75.7
Fertility rate (births per woman) 2.3
Illiteracy total (% age 15 and over) 12.4
Illiteracy female (% age 15 and over) 8.6
Economy
GNI (Atlas method) current US$ 7.4 B
GNI per capita (Atlas method) current US$ 2,820
GDP (current US$) 8.0 B
GDP growth (annual %) 1.0
GDP implicit price deflator (annual % growth) 7.1
Table 1.1: Summary of key macro economic indicators for Jamaica
In spite of these less than encouraging macro economic indicators, Table 1.2 shows the
growth of the number of mobile and land line telephones in the four year period from
1999 to 2002. These numbers should be interpreted in the historical context that in 1999
significant regulatory reform took place in Jamaica’s telecommunication industry. This
reform saw Jamaica’s incumbent telecommunications provider, ‘Cable and Wireless’,
being forced to reduce the barriers to entry in the telecommunications sector which it had
maintained at an impermeable level prior to the regulatory reform.
Phone Type 1999 2000 2001 2002
Land Lines 493,523 507,107 511,302 432,772
Mobile 117,861 249,842 640,453 1,187,293
Table 1.2: Number of mobile and land line telephones (1999 – 2002) [MOU03]
Table 1.2 indicates that in 2001 and 2002 the number of mobile phones largely
outweighed the number of fixed public switched telephone network (PSTN) line phones
35

in Jamaica. In fact in 2002, the number of mobile phones on the island was 1.2 million
out of a total population of 2.6 million which is nearly 50%, further research indicates
that the numbers have continued to rise. This pattern noted in Table 1.2 is largely due to
the effects of deregulation ushered in by the liberalization of the telecommunication
sector by the Jamaican Government just a few years prior to this 1999-2002 period.
Table 1.3 gives an idea of how the range of telecommunication services available in
Jamaica has now flourished in this post monopoly-driven era within the
telecommunications sector. It provides details of licenses issued by category of service
providers between January 1, 2000 and October 31, 2003. Just fewer than three hundred
licenses have been issued to service providers in ten categories since 2000. This
represents a highly competitive telecommunications sector which could not have been
realized had their not been regulatory reform.
Licenses TOTAL
ISP 59
ISP (STVO) 7
IVSP 5
DC 26
DVSP 35
DSP 28
FTZC 10
FTZSP 8
IC 45
INT’L SP 35
TOTAL 298
Table 1.3: Number and type of telecommunications licenses issued (2000 – 2003)
Glossary for Table 1.3
DC – domestic carrier
DSP – Data Service Provider
36

FTZC – Free Trade Zone Center
FTZSP – Free Trade Zone Service Provider
IVSP – International Voice Service Provider
DVSP – Domestic Voice Service Provider
ISP – Internet Service Provider
ISP (STVO) – Internet Service Provider for Subscriber Television Operations
IC – International (Voice/Data/Transit) Carrier
INT’L ISP – International (Voice/Data) Service Provider
This Jamaican telecommunications case study is tangible proof of the fact that in
developing countries people are willing and anxious even to incorporate the benefits of
connectivity into their lives. With the amass of benefits connectivity can bring as detailed
in the Historical Background section of this thesis, it is not of much surprise that people
in poor countries spend a larger proportion of their income on telecommunications than
those in rich ones. Providing these regions with access to connectivity thus makes sense
on business and social good grounds for those who can provide this connectivity.
1.3.7 Digital Opportunity Initiative’s (DOI) Report on Creating a
Development Dynamic [DOI01]
The DOI, a public private partnership of Accenture, the Markle Foundation and the
United Nations Development Program conducted a detailed analysis of the experiences of
the deployment of ICT in a wide range of developing nations. The results of the study are
presented in this report. The report concludes that the persistent debate regarding ICTs
versus traditional development mediums is not the way the situation should be perceived.
Rather the report found that ICTs appeared to be an integral component of development
endeavors and have the potential to act as a powerful enabler of development. The report
ends with a potent call to action for the international community to help developing
countries in taking advantage of the potential of ICTs and integrating them into the core
of their development initiatives.
37

The DOI report also details a rural connectivity case study which researched the
Bangladeshi Grameen Phone initiative. In Bangladesh 97 percent of households and
virtually all rural villages lack a telephone,7 rendering the country one of the least wired
in the world. This lack of connectivity has been a decisive factor in the
underdevelopment of the country and the impoverishment of individual Bangladeshis. To
address this problem Mr. Iqbal Quadir, a Bangladeshi native and lecturer at Harvard
University’s Kennedy School of Government co-founded Grameen Phone Ltd., a for-
profit mobile carrier. He modeled what was an already existing system of women in the
community purchasing cows with micro-credit loans financed by a familiar Bangladeshi
Bank, Grameen Bank. Modeling off the animal husbandry model, where a mobile phone
was now akin to a cow, the Grameen mobile phone system was set up to provide
connectivity to urban areas and rural Bangladeshis.
Grameen Phone Limited is now the country’s dominant mobile carrier. As of September
2000, Grameen Phone had 57 percent of the mobile telecommunications market in
Bangladesh. Within rural areas, local entrepreneurs purchase phones with a micro-credit
loan from Grameen Bank. Phone services are then sold at twice the wholesale rate to the
village customers. An average of 70 customers a month use each shared village phone.
When an incoming call is received on a shared village phone, the owner of the phone
goes in search of the person who has been called and is subsequently paid for her
services. This can become an inefficient means of receiving a call if the person who has
been called is difficult to locate. This provides evidence for the need for personal
communicator units for people especially in remote regions. Nonetheless, the results
show that this Grameen Phone shared-access business model concentrates demand and
engenders a relatively high cash flow allowing the phone owner to make his or her loan
payments while still making a profit. Consequently, the rural telephones have turned out
to be quite profitable for Grameen Phone resulting in revenues per phone of US$93 per
month in March 2001. This insightful case study illustrates that it is possible to enable
profitable, market-driven approaches to providing connectivity and its benefits even in
the most rural of areas.
38

1.3.8 Lebeau’s Analysis of the Development of Satellite
Communications and its Socio-Economic Implications. [AL82]
Lebeau’s 1982 analysis heralds the immense potential of satellite communications
connectivity as a medium that can provide complete and instantaneous coverage of any
given area. From a legal standpoint, the main problems of his time that Lebeau highlights
relate to the allocation of frequencies to users and the limitation of broadcast reception to
a specific national territory. He comments that overflow beyond national boundaries is
much more difficult to confine than when terrestrial-based transmission facilities are
used.
As far back as 1982 when this study was conducted and still today, the bottleneck
restricting the development of terrestrial based connectivity is the cumbersomeness of the
infrastructure necessary for full territorial coverage. These difficulties are exacerbated as
the population density decreases (a predicament often referred to as the ‘last mile
problem’) and/or the more mountainous the land. To make matters worst, often times
developing countries do not have existing detailed maps of their own terrain adding
another layer of difficulty to the non-ideal quest to provide connectivity solely by
terrestrial means. Thus satellite communications must be a part of any time sensitive
solution to address inequities in access to the information society.
Lebeau projects that there is a distinct correlation between gross national income per
capita and quantitative indexes of the development of telecommunications in a given
country such as the number of telephones per inhabitant. A correlation is not a causal
relationship and the details of the causal relationships underlying the correlation are not
easily modeled but research suggests that the causality is actually two way. Within this
two way relationship, economic development fosters the growth of telecommunications
and the development of telecommunications engenders economic growth. In light of
these observations, Lebeau compares the emergence of satellite communications in less
developed countries with the emergence of aviation in relation to land transportation.
39

The above analogy draws on some vivid correlations. In both cases, choosing the more
‘sophisticated’ option negates the need to create and maintain a ground system. This
choice also facilitates operations being organized according to their level of priority,
without the common obstacles that arise from the progressive development of a
necessarily continuous system. The emergence of aviation now also means that travel that
once looked long, tedious and very dangerous was now reduced to matter of hours with
safety of travel increasing many-fold. Additionally, in contrast to satellite systems, a
localized absence or failure of maintenance can disorient a major proportion of a
terrestrial system, if not completely render it as inoperable. This fact is of extreme
relevance to developing countries in which skilled manpower is not always available to
provide maintenance and international consultants command costly salaries.
1.3.9 Mowlana’s Analysis of the Political and Social Implications of
Communications Satellite Applications in Developed and
Developing Countries. [HM97]
Mowlana raises the important point that some people with genuine philanthropic
objectives as concerns applying satellite communication technologies to the developing
world fail in their initiatives due to lack of comprehensive forethought. This is due to a
frequently occurring belief that one can simply transplant communications technologies
in their existing state from industrialized countries to developing countries without trying
to model it to the setting it will be operating within. Because the technology was not
made with the developing world in mind, numerous problems can arise. If the system
broadcasts content, such as television broadcasting, there could be fears of infiltration of
the recipient’s culture. There could also be concerns that the application provided by the
system is not applicable to the proletariat’s natural mode of going about their endeavors.
And finally even if it is adaptable to the lifestyle of the developing country in question
the ‘unmodified direct transplantation’ factor means it will most likely be unaffordable to
the average person in the recipient developing country.
40

Mowlana contributes the keen observation that the potential of satellite communication
technologies will not be realized unless participating nations succeed in agreeing on
rules, procedures and policies that avoid technological and political conflict and allow the
innovation to develop in an orderly and maximal way. He concedes that the growth of
communications satellites is testament to some level of international cooperation, but
reinforces that the current level of cooperation reflects only a fraction of that which will
be necessary to foster and protect the growth of worldwide space communications in the
future.
1.3.10 SpaceNews’ report on Bringing Space Technology to
the Developing World. [SPNS01] The practical value of space technology was illuminated to Mazlan Othman, the director
of the United Nations Office for Outer Space Affairs (UNOOSA) in 1997 when forest
fires burnt more than 400,000 hectares in Malaysia and Indonesia, engulfing the entire
region for weeks with thick, choking clouds of smoke. Although satellite imagery was
available from developed nations, it was expensive and inadequate to assist her native
Malaysia in fighting the forest fires. Othman explains that “we needed satellite photos of
hot spots, but the accuracy initially available was only a resolution of 1 kilometer. That
was insufficient and satellites with better resolution only came over Malaysia once every
20 days.” Othman makes the key observation that “we realized that we could not rely on
others for our specific needs.” Since then, Malaysia has championed the development of
a regional system of disaster monitoring satellites, a cause the UNOOSA supports.
Othman states that within Malaysia, while enough funds are not being allocated for
research, there are concerted efforts to improve awareness among the public that if you
want to build up the country in a bottom-up approach, space technology must be a part of
the solution. A well informed conclusion is made that developing countries such as
Malaysia need to build their own infrastructure (or have infrastructure built with their
specific needs in mind) not only for the mere reason that owning your own technology is
convenient but because it is sorely needed to solve the myriad of problems these regions
face.
41
The UNOOSA director underlines the need to get private sector involved in this goal of
bringing space technology to the developing world, stating that in contrast to the current
conventional belief, there are incentives for the private sector be a part of the ‘digital
connectivity’ solution. In detailing these benefits Othman reflects on the fact that there is
a large group of countries that is still unaware of the many benefits of space technologies.
However it is this very fact that means there is a lot of opportunity for industry to develop
new markets. In these regions, the expanse of human capital having no other option for
connectivity is immense and thus demand for communication services in these regions is
at the highest levels. A commonly held myth is debunked when Othman states that it is
not that these countries cannot afford space technology, it is that in many cases they are
just not aware and thus have not built the necessary infrastructure they need to exploit the
potential of space technology. Once this occurs the private sector can profitably sell
communication services to developing regions.
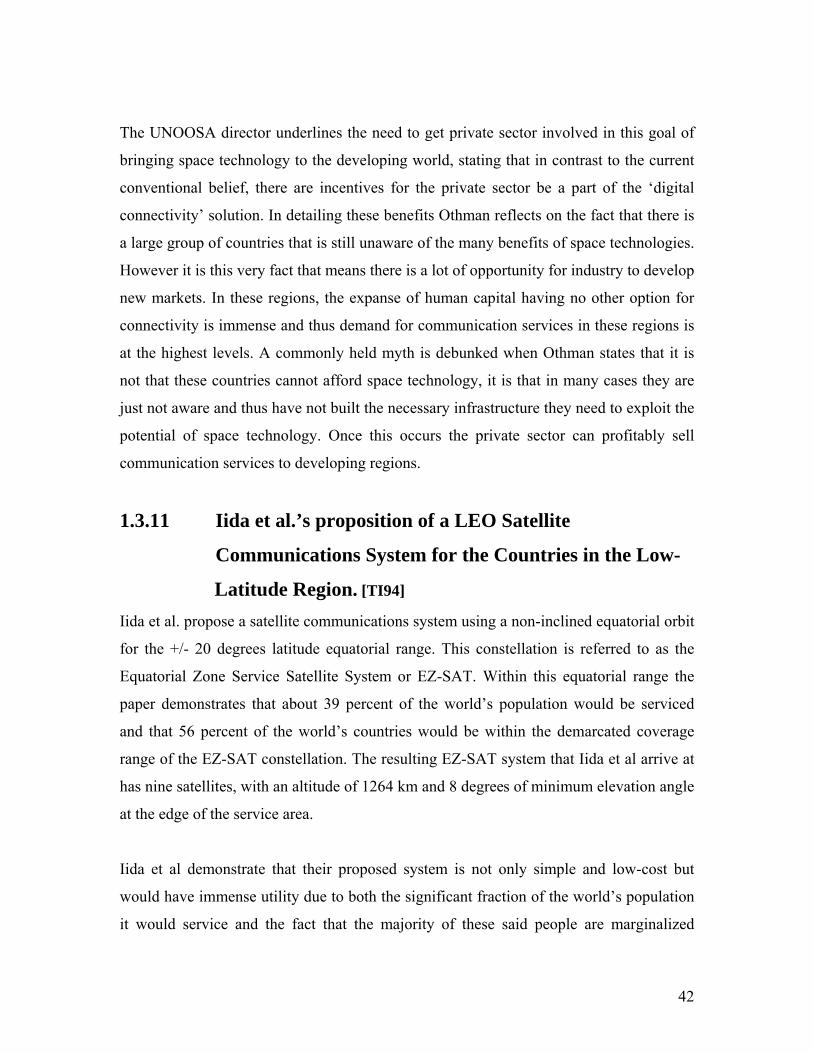
1.3.11 Iida et al.’s proposition of a LEO Satellite
Communications System for the Countries in the Low-
Latitude Region. [TI94]
Iida et al. propose a satellite communications system using a non-inclined equatorial orbit
for the +/- 20 degrees latitude equatorial range. This constellation is referred to as the
Equatorial Zone Service Satellite System or EZ-SAT. Within this equatorial range the
paper demonstrates that about 39 percent of the world’s population would be serviced
and that 56 percent of the world’s countries would be within the demarcated coverage
range of the EZ-SAT constellation. The resulting EZ-SAT system that Iida et al arrive at
has nine satellites, with an altitude of 1264 km and 8 degrees of minimum elevation angle
at the edge of the service area.
Iida et al demonstrate that their proposed system is not only simple and low-cost but
would have immense utility due to both the significant fraction of the world’s population
it would service and the fact that the majority of these said people are marginalized
42

peoples who could immeasurably benefit from the instantiation of such an endeavor. The
authors conclude by imploring the satellite community to grasp the potential of satellite
communications constellations to be significant landmarks along the path of development
assistance to less industrialized countries.
1.3.12 Turner’s Study of Constellation Design Using
Walker Patterns. [AT02] Turner discusses rules to guide in the selection of Walker patterns for new candidate
constellations to provide earth coverage. Effort is placed on minimizing the number of
orbital planes to allow for the establishment of constellations with a minimum number of
launches, this is also a strong focus in Chang’s satellite communications simulation. This
‘minimum number of launches’ objective minimizes the number of dedicated spares
required for on orbit support and also allows for on-orbit servicing of satellites. Within
his study Turner analyzes low-altitude, circular and high-altitude elliptical orbits.
Turner adds insight to the specific context of this thesis as he discusses low altitude
partial coverage cases where coverage is not continuous but is maximized for a given
zone of latitude. His work successfully shows that Walker patterns are of considerable
use for constellation design under a variety of orbital conditions. This thesis utilizes a
variant of Walker constellation design in the MATLAB based system simulation.
1.3.13 Lang’s Analysis of Optimal Low Earth Orbit
Constellations for Continuous Global Coverage. [TL93] Lang contributes significantly to the field of low earth orbit constellations for continuous
global or partial coverage. He developed an algorithm which allows the user to optimize
non-polar, symmetric constellations of circular orbit satellites for continuous global or
partial coverage. For constellations of T circular orbit satellites, the objective is to find
the arrangement which necessitates the smallest value of the central angle radius of earth
coverage, Θ, and still achieves the desired coverage.
43

Using Lang’s algorithm within the developed simulation, symmetric constellations of
satellites are produced in a tabular list format. Each constellation is defined with four
values. Firstly there is the total number of satellites in the constellation, denoted by the
letter ‘T.’ Secondly, there is the number of different orbital planes P; thirdly there is the
relative phasing parameter F, and finally there is the common inclination of all satellites,
I. T, P, F and I are then used to determine the central angle radius of earth coverage, Θ.
These non-polar symmetric constellations are contrasted against the more traditional
polar, non-symmetric constellations that Adams and Rider research in their reputed work
in the satellite communications field. [WALR87] Lang found that the former were more
efficient in many cases as they provided the required coverage with fewer satellites or
with the same number of satellites at a lower altitude. Lang’s algorithm is utilized in the
partial coverage version of Darren Chang’s simulation produced for the analysis in this
thesis.
1.4 Open Questions The literature search shows a lack of comprehensive quantifiable efforts undergone to
design a satellite system that is affordable to those in developing regions. Allusions are
made to possible cost reductions brought on by economies of scale but these are simply
‘band-aid’ solutions that are not likely to be effective and sustainable. Fundamentally,
there needs to be a revolution from the design phase of such systems which I will
henceforth refer to as ‘re-engineering’ satellite system design. Within this ‘re-
engineering’, given economic data on what people are willing to pay for communication
services and a concrete idea from those affected as to their priority needs, a satellite
communications system established to meet these needs with affordability as a leading
objective. The thesis sets about to address this open issue within the satellite
communications sphere.
1.5 Needs Assessment for the Developing World Table 1.4 presents a discussion of the identified needs of the developing world and
projections of the role satellite communications can play in addressing these needs. When
44
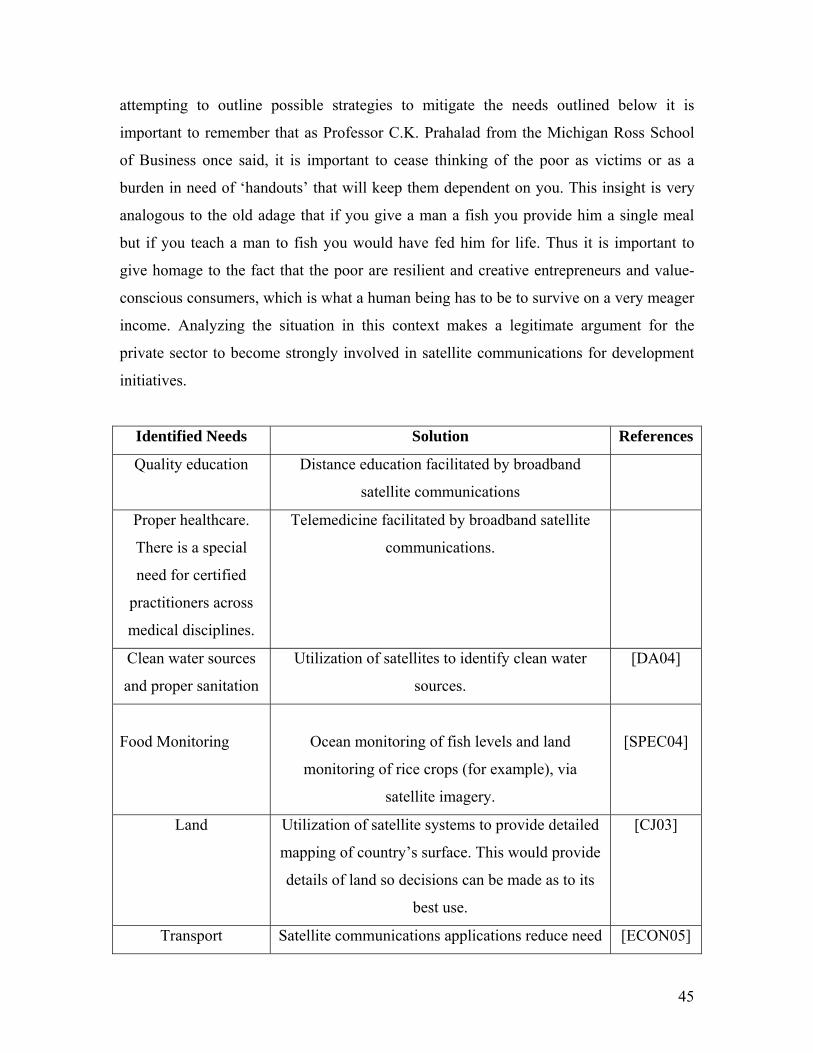
attempting to outline possible strategies to mitigate the needs outlined below it is
important to remember that as Professor C.K. Prahalad from the Michigan Ross School
of Business once said, it is important to cease thinking of the poor as victims or as a
burden in need of ‘handouts’ that will keep them dependent on you. This insight is very
analogous to the old adage that if you give a man a fish you provide him a single meal
but if you teach a man to fish you would have fed him for life. Thus it is important to
give homage to the fact that the poor are resilient and creative entrepreneurs and value-
conscious consumers, which is what a human being has to be to survive on a very meager
income. Analyzing the situation in this context makes a legitimate argument for the
private sector to become strongly involved in satellite communications for development
initiatives.
Identified Needs Solution References
Quality education Distance education facilitated by broadband
satellite communications
Proper healthcare.
There is a special
need for certified
practitioners across
medical disciplines.
Telemedicine facilitated by broadband satellite
communications.
Clean water sources
and proper sanitation
Utilization of satellites to identify clean water
sources.
[DA04]
Food Monitoring
Ocean monitoring of fish levels and land
monitoring of rice crops (for example), via
satellite imagery.
[SPEC04]
Land Utilization of satellite systems to provide detailed
mapping of country’s surface. This would provide
details of land so decisions can be made as to its
best use.
[CJ03]
Transport Satellite communications applications reduce need [ECON05]
45
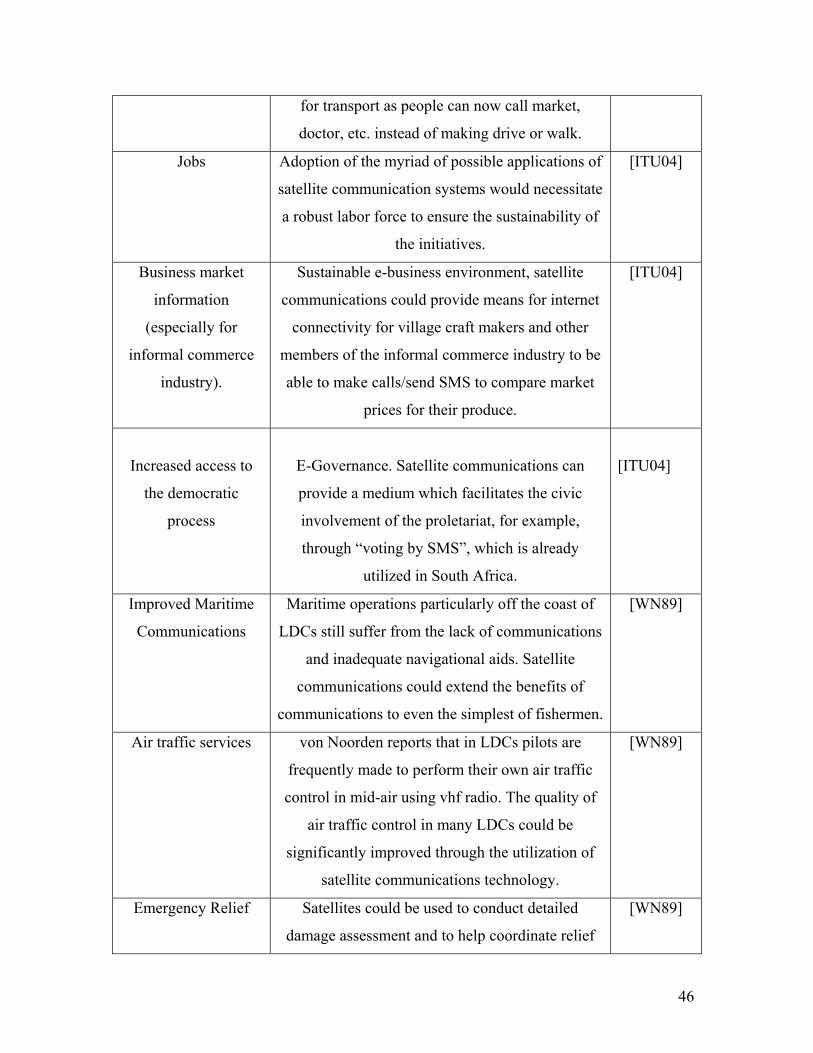
for transport as people can now call market,
doctor, etc. instead of making drive or walk.
Jobs Adoption of the myriad of possible applications of
satellite communication systems would necessitate
a robust labor force to ensure the sustainability of
the initiatives.
[ITU04]
Business market
information
(especially for
informal commerce
industry).
Sustainable e-business environment, satellite
communications could provide means for internet
connectivity for village craft makers and other
members of the informal commerce industry to be
able to make calls/send SMS to compare market
prices for their produce.
[ITU04]
Increased access to
the democratic
process
E-Governance. Satellite communications can
provide a medium which facilitates the civic
involvement of the proletariat, for example,
through “voting by SMS”, which is already
utilized in South Africa.
[ITU04]
Improved Maritime
Communications
Maritime operations particularly off the coast of
LDCs still suffer from the lack of communications
and inadequate navigational aids. Satellite
communications could extend the benefits of
communications to even the simplest of fishermen.
[WN89]
Air traffic services von Noorden reports that in LDCs pilots are
frequently made to perform their own air traffic
control in mid-air using vhf radio. The quality of
air traffic control in many LDCs could be
significantly improved through the utilization of
satellite communications technology.
[WN89]
Emergency Relief Satellites could be used to conduct detailed
damage assessment and to help coordinate relief
[WN89]
46

activities. Would provide much needed relief
against broken or non-existent land
communications systems.
Early warning
systems
Develop satellite communication systems as early
warning systems for all major subdivisions of the
globe.
[WN89]
Table 1.4: Developing world’s identified needs and services that could address them
Table 1.4 unambiguously shows that that there exists a stark and burgeoning need for a
myriad of services which satellite communications could facilitate. Some general
pertinent issues that would need to be addressed in tandem with the above solutions are
the development of an ICT Policy Framework for the different regions in the developing
world (Latin America and the Caribbean, Africa, Asia, the Middle East). Obstacles to
establishing appropriate infrastructural frameworks, connectivity & funding must also be
identified and possible solutions outlined. Identifying resources for this bridging the
digital divide initiative is imperative. The UN Office for Outer Space Affairs, the United
Nations Development Program, the ITU and the European Development Fund are but a
few international development organizations that could make serious inroads with respect
to funding.
There is currently a dilemma of how to convince potential funders and developing world
governments to allocate limited resources to ICT investment while basic needs are still to
be fulfilled. Developing regions must be made aware of the fact that ICTs should not be
thought of separate and apart from basic needs, but rather they should be viewed as
vehicles through which the basic needs can be ascertained.
1.6 Motivation for Current Research A serious bottom-up commitment needs to be given to the challenge of making satellite
systems affordable for the regions that stand to benefit the most from the applications
they bring. The approach cannot be to take an already established system, such as Iridium
or Globalstar, which has been proven to be out of reach financially for developing
47

economies and hope advertising or mass production strategies will bring it into the hands
of the poor. In contrast, the industry must seek to re-engineer system design and if
committed to bridging the digital divide then specific attempts must be made to design
for affordability. A successful endeavor to achieve this goal must seek to quantify the
analysis, be methodological and incorporate people’s purchasing power into decisions on
the type of application and its eventual cost. This change in design approach is
fundamental as the cost to the consumer is the deciding factor in determining whether or
not the digital divide will ever be bridged. It is this need to ‘re-engineer’ satellite system
design that motivates this study.
Currently, the link between the potential and current reach of communication
technologies is very weak. The fact is that where there is no existing infrastructure, or
where other forms of communication are not economically viable, satellite
communications may be the only time sensitive solution. Connectivity using traditional
terrestrial networks for rural or remote areas is a very lengthy and expensive process.
Furthermore, the recent surge in China’s demand for scrap metal has resulted in cases
across the African continent of the poor uprooting traditional land lines to mine the
copper casing and sell it to those willing to export it to countries such as China. Thus
continuing to pour all of ICTs investment funds and research and development into
exclusive traditional land based means of connectivity is an extremely inadequate way to
move forward.
The developing world is thus in dire need of a medium that can extend access to
communications for those in most need and which is not affected by the country’s
topology and state of infrastructural layout. There is also a need to create the regulatory
and policy climate that will foster the growth of communication technologies within and
across borders. At every step of the process there is a significant need for consideration to
be given to whether or not the system will be economically viable and sustainable. Also,
symbiotic connectivity with PSTN, fiber optics and other traditional means of
communications should be the goal of satellite communications engineers. This should be
especially so since there is not a need for expensive supporting infrastructure to make this
48
symbiotic relationship a reality. Moreover there is a principal need for the technology to
be unambitious and affordable.
In developed regions satellites will only experience continued need if they offer
unrivalled competitive advantages, such as broadcasting and providing connectivity in
deeply rural areas. Moreover, this research is motivated by the fact that for developing
regions satellites would not be merely an alternative form of communication but would
rapidly enhance development effectiveness and robustly address the needs detailed in the
preceding paragraph. In the world’s LDCs, the populace should be armed with a suite of
space and land based connectivity mediums which first and foremostly hold the potential
to significantly increase knowledge sharing and access to information which is a tried and
proven means to sustainable development. There would also be the result of a general
building of local capacity which would empower communities in numerous ways. This is
also a principal motivation for this study.
A solid example of the empowering effect of access to communications is provided
through a new study by Leonard Waverman of the London Business School, and Meloria
Meschi and Melvyn Fuss, of LECG, an economics consultancy, provides the most in
depth analysis yet of the relationship between mobile phones and economic growth.
Waverman and his colleagues used a technique called the endogenous growth model
which is widely employed to investigate differences in growth rates between countries.
They used this model to study the impact of telecoms on economic growth in 92
countries, both rich and poor between 1980 and 2003. Overall Waverman’s research
suggests that in a typical developing country, an increase of ten mobile phones per 100
inhabitants boosts gross domestic product growth by 0.6 percentage points [ECON05a].
This gives but a small window into the amazing development potential of any medium
that can provide connectivity to regions that currently have no existing institutionalized
means of communicating with themselves or their outside environs. To this end, the
research hopes to play a major role in strengthening the aforementioned ‘link’ between
the potential and current reach of satellite communications technologies.
49

1.7 Impact of Research Answers on Current State of
Knowledge This research employs a methodological and quantifiable approach to decipher the
feasibility of the proposed satellite system, facilitated by the established satellite
communications constellation simulation which models the technical, economic and
policy frontiers of this feasibility study. The research impacts the current state of
knowledge in the satellite communications for development realm by allowing for a
detailed understanding of the technical, economic and policy factors that would enable a
satellite communication system such as the one proposed by this thesis to strengthen the
link between the current potential and reach of its technology.
The research allows for both a quantitative and qualitative understanding of how ‘re-
engineering’ satellite systems for affordability in both the technical and policy realms,
can catapult satellite communications through the ‘affordability barrier’ for developing
countries. Additionally, a thorough global economic analysis illuminates both the
expanse of the income divide and the need for immediate action on this issue. Lastly, the
policy and regulatory analysis impacts the current state of knowledge by shedding light
on the policy and regulatory changes necessary to enact sustainable satellite
communications for development growth in today’s policy framework.
50

1.8 Thesis Preview
Chapter 2: Need to Re-Engineer Satellite System Design Quantified demonstration of the fact that the digital marketplace is
not accessible to the developing world Presentation of Global Economic Data collected Discussion of need to re-engineer satellite system design for
affordability
Chapter 4: Re-Engineering the Policy Framework of Satellite Systems Discussion of the Current Policy Framework Policy changes that must be made to affect
long term sustainable development in regard to satellite systems for the developing world.
Discussion of how policy sphere can encourage the widening of the scope of possible applications
Suggested Solutions to technical, economic and policy challenges faced.
Chapter 1: Introduction Overview of the Study Historical Background Literature Search Impact of Research Answers on Current State of Knowledge
Chapter 3: Technical and Economic Feasibility of Satellite Communication System for the Developing World Simulator System Architecture Presentation of SMS System Case Study Results of Case Study Discussion of Results
Chapter 5: Conclusion, Future Work and Recommendations for Future Work Summarization of feasibility of proposed satellite system Presentation of technical and policy factors that affect feasibility Recommendations for Future Work
B y
Figure
Appendix ibliograph
1-1: Thesis Preview
51

Chapter 1 sets a framework for the research problem by firstly giving an overview of the
study. The historical background of the problem is then detailed so an appropriate context
can be had for the study. Work done thus far in this research regime is detailed through
the presentation of the results of the literature study. Remaining open questions from this
literature research are then presented to motivate the need for the present research. In
light of the above, the motivation for the current research along with an analysis of the
impact it will have on the current state of knowledge in the research sphere are then
detailed.
Chapter 2 then presents solid evidence of the expanse of the digital divide which is
largely based on an underlying income divide. The analysis in this Chapter makes the
argument for why a re-engineering satellite system design for affordability revolution in
satellite system constellation design is necessary for efforts to bridge the digital divide.
Chapter 3 analyzes the technical and economic feasibility of the proposed satellite
communication system for the developing world. The analysis commences with a
presentation of the details of the MATLAB based satellite communication simulation
instantiation for this zonal equatorial coverage, proposed satellite system feasibility
study. The details of the SMS version of the simulation are presented along with a
presentation of how the feasibility analysis was carried out. The results of the case study
along with a discussion of the implications of the results are then discussed.
Chapter 4 takes a detailed look at the “re-engineering” that needs to take place within the
policy framework of satellite systems. Answers are proffered for questions such as: Is the
current policy framework acting as an obstacle to the establishment of satellite systems
for the developing world? What policy and/or regulatory existing schemas would be
obstacles to establishing proposed satellite system? What policy changes need to be made
to affect long term sustainable development in regard to satellite systems? How can
current policy sphere encourage the widening of the scope of possible common satellite
communications applications (such as telemedicine or tele-education)? The policy-
52

centered, technical and economic challenges faced and suggested solutions to these
challenges are then discussed.
Chapter 5 rounds off the thesis with a summarization of the points surrounding the
feasibility of the proposed satellite system for the developing world. The technical and
policy components of a revolution in satellite system design surrounding design for
affordability are also summarized. Recommendations for future work are then presented.
1.9 Summary The first task of this introductory Chapter was to present an overview of the research
objective and method of approach. A historical background of the study was then given
to set a context for how the research moves forward. Previous work conducted regarding
the relevance of advances in telecommunications, (with a focus on satellite
communication systems), for development is reviewed and analyzed. Remaining open
questions in the research realm that will be probed by this thesis were then presented.
This Chapter also looked at the question of the most pressing public policy needs in the
developing world today and the role satellite communications can play in addressing
these needs. Next, a discussion of the motivation for the research is presented and the
impact the research answers will have on the current state of knowledge within the
satellite communications for development sphere discussed. The Chapter closes with a
succinct preview of the information presented throughout the thesis.
53

54

Chapter 2
The Need to Re-engineer Satellite System
Design
2.1 Introduction In this Chapter the framework and supporting data is provided to support the need to
re-engineer satellite system design for affordability. The development goals of the
international development arena around Information and Communication technologies
(ICTs) in general are first presented to set a context for the analysis. Telecommunication
means that currently exist to provide connectivity are then explored along with a
discussion of the past and current commercial satellite system industry. Solid evidence of
the expanse of the digital divide which is largely based on an underlying income divide is
subsequently analyzed. Finally, the argument for why a re-engineering of satellite system
design for affordability revolution is necessary to support efforts to bridge the digital
divide is presented.
2.2 United Nation’s World Summit on the Information
Society Objectives The United Nations (UN) envisioned the need for a Summit on the Information Society
after taking stock of the immense effect and potential of the digital revolution. To affect a
multi-stakeholder informed dialogue and subsequent action steps on the topic of the
digital revolution it was decided to place a world Summit on the Information Society
(WSIS) on the UN agenda. The first Summit occurred in Switzerland in December 2003
and the second Summit will take place in Tunisia in November 2005. At the first meeting
of the WSIS a set of objectives were outlined that the UN and the greater development
55

community intend to have in effect by 2015. These objectives of the WSIS are shown in
Table 2.1.
BY 2 a) coestab b) co c) co d) cowith e) co f) co emai g) adInfor h) enservi i) enorde
The
revo
think
pote
pote
OBJECTIVES OF THE WORLD SUMMIT ON THE INFORMATION SOCIETY
015 IT IS DESIRED TO:
nnect villages with Information and Communication Technologies (ICTs) and lish community access points;
nnect universities, colleges, secondary schools and primary schools with ICTs;
nnect scientific and research centers with ICTs;
nnect public libraries, cultural centers, museums, post offices and archives ICTs;
nnect health centers and hospitals with ICTs;
nnect all local and central government departments and establish websites andl addresses;
apt all primary and secondary school curricula to meet the challenges of the mation Society, taking into account national circumstances;
sure that all of the World’s population have access to television and radio ces;
courage the development of content and to put in place technical conditions in r to facilitate the presence and use of all World languages on the Internet;
Table 2.1: Objectives of the United Nation’s World Summit on the Information Society
UN and other leading development organizations have recognized that the digital
lution propelled by the growth of ICTs has fundamentally altered the way people
, behave, communicate and transact business. The need to make the most of ICTs is
ntly highlighted by the fact that this revolution has far reaching potential. This
ntial is evidenced for example by the carving out of new ways to educate people,
56

administer health care and earn a livelihood. The digital revolution also affects the
administration of societies at a national level, hence making for an even more urgent need
to ensure the possibilities afforded by ICTs are exploited. The effect on the
administration of countries is demonstrated by ICTs impacting both on the way
governments administer their country’s civic process and the access marginalized people
have to this civic process. Finally, of great interest to the international development
agenda is the fact that the digital revolution has also afforded faster global humanitarian
aid response and a new platform for environmental protection.
Because satellite communications play a non-negligible role within the suite of ICTs that
hold the potential to bridge the digital divide, the preceding arguments sum up to serious
action being necessary to ensure satellite communications are affordable to the
developing world so this technology can realize its full development potential.
2.3 Communication Means that Currently Exist to Provide
Connectivity As at the first five years of the 21st century, the current main means of telecommunication
available to mankind are shown in Table 2.2.
PSTN with copper wires & other
traditional terrestrial wired means
of connectivity.
Wireless Terrestrial Connectivity
(e.g., Wi-Fi, Wi-Max and Cellular
Mobile Connectivity)
Underwater fiber optic cables
Satellite Communications
Table 2.2: Current main telecommunication mediums
57

From the four main communications facilitating genres illustrated in Table 2.2, satellite
communications is inarguably a genre which is markedly under achieving its connectivity
potential for the reasons detailed in Chapter 1. A significant reason behind this under-
utilization of satellite systems is that the telecommunications industry often considers
these four mediums to be in competition. This approach results in the sum of the whole
being less than the sum of the parts with respect to the maximum effect all four mediums
could have. Consequently, in light of what people in the satellite industry consider to be
competing means to achieve connectivity and given the non-trivial present cost-related
deterrences to employing satellite communications applications, engineers and policy
makers alike have ruled this medium out as a vital aspect of the solution to bridging the
digital divide.
However, the fact that under the current telecommunications setting the vast majority of
the world is not able to reap the benefits of their human right to be able to communicate
and participate in the information society should not be ignored. This argument is
strengthened by the fact that land based mediums alone cannot remedy the digital divide
inequities in a time efficient manner. Thus rather than accepting the current cost structure
and applications provided by satellite systems as fixed and hence eliminating it from the
set of ICTs into which research and development is invested, research should center
around how satellite communications can be re-engineered for affordability. If satellite
communications becomes an affordable medium, rather than act in competition, it could
act in a symbiotic relationship with the other communications mediums detailed in Table
2.2. This would facilitate the necessary participation in the global information space of
sparsely populated and deeply rural areas. Thus in the satellite industry’s forward
thinking it is important to end the current telecommunications policy legacy in which real
tensions exist between these four main communication means of Table 2.2
58

Ghana/ Accra
Mexico/ Mexico
Puerto Rico/ San Juan
Nigeria/ Lagos*
Average
Total Population 21,029,853 106,202,903 3,957,988 156,468,571 71,914,829
Population of Capital
3,460,757 14,576,626 431,285 10,601,160 7,267,457
Area of Country (km^2)
238,538.00 1,967,138.00 9,104.00 923,768.00 784,637.00
Area of Capital (km^2)
3,685.00 21,461.00 136.23 3,345.00 7,156.81
% of pop in Capital 16.46 13.73 10.90 6.78 11.96
Capital's area as % of total area
1.54 1.09 1.50 0.36 1.12
density of Capital (persons/km^2)
939.15 679.21 3,171.21 3,169.26 1,989.71
density outside of Capital
(persons/km^2)
74.81 47.09 393.26 158.48 168.41
% reduction in density
92.03 93.07 87.60 95.00 91.92
Table 2.3: Key factors relating to the density of capital cities vs. the surrounding areas for Ghana, Mexico, Puerto Rico and Nigeria [CIAWFB], [WG05]
Table 2.3 illustrates, inter alia, the population density of the capital of the countries
Ghana, Mexico, Puerto Rico and Nigeria along with the density of the regions outside
each capital. These countries represent a wide swath among countries within the +/- 30°
latitude range. The four chosen countries range from small and earning less than the
world average GDP/capita (Ghana) to being large and earning more than the world
average GDP/capita (Mexico). Note that the world average GDP/capita is $7600 in 2002
United States dollars. Further details about these classification regions are given in Figure
2-8.
59

Wired Wireless Satellite
Capital $0.13 $1.76 $7.14
Outside of the Capital $1.48 $20.78 $7.14
Table 2.4: Costs to system operator for the provision of communication services
Table 2.4 details the cost per user per km squared to a system operator for the provision
of communication services to a country with average characteristics as shown in the sixth
column of Table 2.3. The cost to provide the service to the capital of the country vs. more
rural areas is detailed. Three different means for the provision of communication services
are detailed in Table 2.4. The first means is via a wired service such as PSTN, the second
is via a wireless service such as a terrestrial mobile system and the third is via a satellite
communications system. For the wired service, the cost per user per km squared is
calculated with the cost representing the cost to lay a km of copper which is taken to be
$250 in US 2005 dollars. The cost to provide wireless service is taken to be the cost of
setting up a mobile tower which is assumed to be $3500 in this analysis. For satellites, the
cost per user is taken to be the life-cycle cost of the system. The life-cycle cost of the
satellite system in Table 2.4 is taken to be $580 million dollars serving a subscriber base
of 81, 259, 200 people. These are the key factors of the satellite system that was
established through this research in Chapter 3.
For a greater understanding of the lifecycle cost (LCC) of a satellite system, Larson and
Wertz in their text indicate that the LCC can be broken down into three main phases.
[WLJR99] There is the Research, Development, Test, and Evaluation phase including
design, analysis, and test of breadboards, brassboards, prototypes and qualification units.
This phase also incorporates prototype flight units and nonrecurring ground station costs.
Then there is the Production phase which includes the cost of producing flight units and
launching them. Then finally, there is the Operations and Support phase which is
comprised of ongoing operations and maintenance costs, including spacecraft unit
replacements. Replacement satellites and launches after the space system’s initial
operating capability has been established are also a part of this Operations and Support
phase.
60

Insight can be gained from analyzing the cost to the communications system operator to
provide communications services (these services are as detailed in Table 2.2) to the
average of the values listed in Table 2.3 as detailed in Table 2.4. For the purposes of this
analysis it is assumed that terrestrial means of connectivity are supported from a main
trunk backbone which runs approximately equidistant from the northern and southern
boundaries/coasts of the country in question. For terrestrial services the population
density of a region is a significant factor as wires have to be laid from the main backbone
to each customer. As the density of the population decreases the cost per user to the
system operator increases as cost per user is given by the cost of providing the service
divided by the population density of the region. This difference in costs is vividly
demonstrated in Table 2.4
In contrast, with satellite systems the cost of establishing the system is independent of the
density of the region and satellite systems do not incur further costs to add additional
users to the system. The situation is drastically different for terrestrial systems.
Observation of Table 2.3 illustrates the large changes in densities that occur when one
goes from the capital of the country to the surrounding areas which would include a
significant proportion of rural land mass. Table 2.4 demonstrates the costing that is a
result of this change in density. Going from the city to the surrounding areas, the density
changes for each of the countries in Table 2.3 are significant. As can be seen, the density
reduces on the order of greater than 90% when going from the capital to less dense
surrounding regions. Due to satellites’ lack of dependence on density, compared to
terrestrial means of providing similar ‘unwired’ services, satellites are the clear winner
with costs per user of $7.14 as opposed to $20.78 with terrestrial mobile systems.
It is this important fact that makes satellite systems so necessary despite successes with
terrestrial mobile connectivity. This significant reduction in the population density of
countries when one goes from industrialized to less industrialized regions makes it very
costly to terrestrial systems to provide connectivity to those in rural areas with very little
existing architecture. However because the cost to establish and add users to a satellite
61

system is independent of the population density of its coverage area, satellite systems
must be looked upon as the vehicle to provide connectivity to the rural and cut off regions
of countries for which the ‘last mile problem’ renders terrestrial connectivity either very
expensive or entirely not possible, due to rough or unknown terrain for instance.
2.4 The Commercial Satellite Systems Industry Significant advancements have been made within the realm of satellite communications
constellation systems since the first operational communications satellites were launched
into geosynchronous Earth orbit (GEO) in 1962 (TELSTAR and RELAY). These
advancements include commercial intercontinental telephone service, television
broadcasting, scientific missions, space shuttle operations, telemedicine applications, and
distance learning applications. These applications signify immense development in the
telecommunications arena, but what path did the satellite industry traverse to get to this
point? Section 2.4.1 responds to this question.
2.4.1 How Did We Get To Where We Are Now? As recently as 1980, the main aspect of telecommunications infrastructure in the
industrialized world was the public switched telephone network (PSTN). PSTN systems
facilitated mainly voice and some low bandwidth data signals such as telefax and
elementary computer data traffic. Within industrialized countries these PSTN systems
had grown steadily since the turn of the 20th century and around this time of 1980, no
other communications means seemed poised to compete with this mode of
communication. PSTN systems have the disadvantage however that they are limited to
recipients that are able to connect directly to the public switched telephone network by
wire. It is this fact that motivated communication engineers to look to alternate solutions
to provide global communication coverage. At the turn of the 1980s, the only means to
provide the desired global wireless communications coverage without having to take into
consideration terrestrial infrastructure needs was through GEO satellites.
62

Three GEO satellites, separated by 120° in longitude and orbiting the earth at an altitude
of 35,786 kilometers can facilitate total earth coverage below approximately 70° latitude.
The initial system to provide satellite telephone service via a GEO constellation was
INMARSAT. The system was primarily catered to marine users. As a result of the
transmission distance from the GEO satellites to the end user, delays between GEO
satellites and the ground are at least 120 milliseconds, such a delay is discernable in two-
way voice communications. This transmission delay meant that the distance factor
associated with GEO systems rendered ‘smooth’ personal communications difficult.
Combined with losses along the transmission path and bulky and expensive terminals,
GEO systems never succeeded in convincing the necessary market share of customers to
employ their services for personal communications. Furthermore, their few customers
came from a market base that had no other telecommunications choice and that was not
price discriminatory - such as military personnel, mariners and certain research scientists
working in remote places. This failure to generate the necessary market share meant GEO
systems did not realize the reductions in cost of service expected from economies of
scale. By the mid-1990s, the nominal cost of a GEO satellite was around $100- $200
million US dollars with launch costs at approximately $50 million. [deWDC03a]
2.4.2 Current State of Commercial Satellite System Industry
2.4.2.1 The Emergence of Low Earth Orbit Systems
It had now become obvious that personal communications would not be possible without
tackling the ominous GEO distance factor. This motivated a significant development
within the satellite communications industry which resulted in Low Earth Orbit (LEO)
Systems coming on stream. Presently, the majority of communications satellites exist
within GEO orbit, however LEO systems play the leading role in the provision of
personal communications applications. It should be noted however that recently the
Thoraya satellite, developed by the United Arab Emirates' Thoraya Satellite
Telecommunications Company has been able to provide cellular services from GEO due
the presence of large mesh antennas.
63

LEO communication satellite constellation systems orbit the Earth at an altitude of about
500-1500 km and facilitate wireless communications between terminals on the ground.
Only three LEO systems have been launched in the past, they are Orbcomm by Orbital
Sciences, Iridium by Motorola, and Globalstar by Loral. A defining feature of LEO
systems is that they entail many satellites (up to 66 with Globalstar) working in concert.
The two main types of constellations are Polar and Walker systems as illustrated in
Figure 2-1. Each type of constellation has its own advantages and disadvantages with
Polar systems being better suited for coverage that needs to include the poles and Walker
systems being best suited for complete global coverage below a certain latitude (such as
+/-70° for Globalstar). Hence with an equal number of satellites, a Walker constellation
enables a higher diversity than a polar constellation. Diversity is the average number of
satellites in view at once to a user on the ground. The benefits of a high diversity are that
the user enjoys a higher availability, fewer dropped connections and reduced multipath
fading.
Figure 2-1: Polar (left) and Walker satellite constellations (right) [deWDC03a]
The general construct of a LEO communications constellation is shown in Figure 2-2.
Ground users can be in the form of an end user terminal such as a ‘satellite phone” or a
gateway. Gateways allow communication between satellite phones and traditional wired
PSTN land line telephones as illustrated in Figure 2-2. This connection between gateways
and PSTN telephones is made possible by gateways having large antenna dishes and
harboring a direct connection to the terrestrial PSTN system.
64

Figure 2-2: LEO communications satellite constellation. The orbital altitude, h, is
typically between 500-1500 km. The minimum elevation angle, εmin, is typically 5-15 degrees. [deWDC03a]
With the advent of LEO systems the distance problem that made personal
communications difficult with GEO systems was solved. Transmission delays in LEO
systems are on the order of 10 milliseconds which makes practical personal
communications possible. The price paid for reduction in transmission delays is a
significant increase in the number of satellites needed. Dozens of satellites are needed to
ensure continuous global coverage at between 500 and 1500 km. Another challenge is the
footprint area of LEO satellites.
Compared to GEO systems more complex technical feats had to be conquered in order to
make LEO satellite systems a reality. On average a LEO satellite travels from West to
East at a speed of 7 km/second and depending on satellite altitude and the location of the
user relative to the satellite’s ground track, the satellite may be visible for between 7 and
20 minutes. Therefore calls with a duration of greater than 7 to 20 minutes have to be
flawlessly switched over from one satellite to another. This switching requires complex
and thus costly switching hardware and software. Additionally, many GEO satellites
operate in a one-to-many broadcast mode in which there is a satellite acting as the single
source of transmission and many receivers on the ground. In contrast, LEO systems
operate in a two-way, many-to-many mode which demands greater frequency bandwidth
65

as well as increased hardware and software complexity with regards to both the space and
terrestrial aspects.
The technical challenges were impressively overcome and with the reduced distance
factor, which reduces the demands on power and antenna size, LEO satellite phones are
much more compact than their GEO predecessors, which allows them to be employed for
personal communication purposes.
2.4.2.2 Reasons as to Economic Failure of Major Past Satellite Systems
While LEO system designers displayed extreme technological prowess they were not as
sound economically. This is evidenced by the two major satellite systems, i.e. Iridium
and Globalstar, eventually filing for Chapter 11 bankruptcy protection. The lesson was
taught that more than ever, astute system architects must not only be versed in the
technical aspects of their systems but must also have a strong familiarity with and context
for the underlying economics and existing competing and non-competing alternatives to
the application it is desired to provide. If any of these components of the system design
process is missing, the system will prove unsustainable. Both major satellite systems
faced bankruptcy due to a similar underlying fact – at the time Iridium and Globalstar
were conceived, that is 1990 and 1991 respectively, in the face of available terrestrial
alternatives available later in 1998 to 1999, Iridium and Globalstar were too expensive to
gain the market share that would afford them a healthy economic base.
Iridium and Globalstar’s predictions for their number of users, Nu, turned out to be
severely overestimated. As an example, the number of users prediction for Iridium was
6,076,000 subscribers in 1990. [deWDC03a]. However in hindsight, this number severely
overestimated the actual Nu. This overestimation came with a heavy price tag as Nu and
Au are two key variables that must be estimated with some accuracy as far as this is
possible for any particular type of service. The overestimate was unfortunately
exacerbated by the fact that by 1991 predictions that had been made for the number of
terrestrial cellular subscribers had proven to be significantly underestimated. Figure 2-3
66

demonstrates market predictions in 1991 versus actual number of terrestrial cellular
network subscribers in the USA for the 1991 to 2000 timeframe. The US forecast is the
green leftmost bar in each group of bars, while the US actual number of terrestrial
cellular subscribers is the blue rightmost bar in each group.
0
20
40
60
80
100
120
1991 1992 1993 1994 1995 1996 1997 1998 1999 2000
Year
Mill
ions
of s
ubsc
riber
s
US (forecast) US (actual)
Figure 2-3: Market predictions (in 1991) versus actual number of terrestrial cellular
network subscribers in the United States for the 1991-2000 period [deWDC03a]
Globalstar encountered a similar fate and it is this failure to fully understand their
system’s economic context that led to the system operators eventually filing for
bankruptcy. Iridium filed a petition under Chapter 11 of the U.S. Bankruptcy Code in the
U.S. Bankruptcy Court in Delaware in August 1999. Globalstar followed soon after with
a similar bankruptcy petition in February 2002. [SAT]
2.4.3 Present Focus of Satellite Systems With Globalstar having filed for bankruptcy only three years ago, satellite systems have
yet to fully recover from the sizeable debt they incurred. In attempting to gain a
comprehensive understanding of this economic breakdown in the satellite system
industry, necessary insight can also be gained if one looks at satellite systems in general
and seeks to understand exactly what type of customer the systems were targeted
towards. A detailed analysis will show that the current focus of these satellite systems is
67

primarily on the top niche business career professional whose career spans across
countries and is in need of a means by which he can have a single satellite phone for
instance that will work in any setting his travels dictate he work within. Hence the current
design of the applications provided by satellite systems is mainly focused on design to
push the technological frontier. This is especially so because often times because it is the
top-niche customer in the industrialized world that is being catered to, there are an array
of already existing options that the prospective customer could use to provide his
connectivity.
Consequently, the satellite system designers must push the technological envelope to try
to present an application that is technologically sophisticated, does more for the potential
customer and could thus make him consider switching to the satellite based mode of
connectivity. As Iridium and Globalstar proved however there are many other
considerations to this problem and irrespective of the fact that the target market base did
not tend to be very price discriminatory, a convincing argument for the prospective
customers to switch to satellite based services was not delivered.
In contrast, were these satellite system designers to focus research and development
efforts towards developing less technologically elaborate applications which provide
basic connectivity and which are targeted towards the immense potential market base in
the developing world, oversubscription, rather than heavy debt is likely to be the
challenge incurred. It is with regards to this important point that satellite systems are
being grossly under-utilized today, but the satellite industry will only be able to realize its
full potential to bridge the digital divide if a revolution occurs in how satellite systems
and the ensuing applications are engineered. Because affordability is the key factor, the
systems have to be ‘re-engineered’ for cost-effectiveness.
68

2.5 The Establishment of a World Database
2.5.1 Defining the Developing World It is important that when proposing a satellite system to provide connectivity to the
“developing world,” that a defendable definition of the developing world is presented.
For this thesis, it was desired to identify and subsequently have the proposed system
address an equatorial belt that captured the world’s poorest countries. In order to carry
this analysis out a survey was done of GDP per capita vs. the latitudes of all the countries
in the world as presented by the exhaustive U. S. Central Intelligence Agencies’ world
Factbook. [CIAWFB] The world Factbook details extensive up to date information on
229 of the world’s countries. Information and local context is given for important factors
relating to a country such as a concise history, its geography, people, government,
economy, communications, transportation, religions, military and transnational issues.
Using the information provided in the world Factbook an extensive database was put
together to firstly get a working definition of the developing world and then to explore
other key aspects of the developing world that would inform the development agenda of
this thesis. A summary of the world database is shown in Appendix A.
As stated, with regards to the developing world definition, a graph was computed of GDP
per capita vs. latitude for all the world’s countries. The resulting graph is shown in Figure
2-4. The graph has somewhat of a basin shape. A rectangle ABCD is demarcated,
wherein the length AB outlines the average world GDP/capita of $7600 in US 2002
dollars. As Figure 2-4 illustrates, the majority of countries within the +/- 30° latitude
range have a GDP per capita less than that of the world’s average. It is this keen
observation that lends to the definition of the developing world for the analysis in this
thesis being the equatorial range between 30° north and 30° south latitude.
69

GDP/capita ($) vs. latitude (degrees)
01,9003,8005,7007,6009,500
11,40013,30015,20017,10019,00020,90022,80024,70026,60028,50030,40032,30034,20036,10038,00039,90041,80043,700
-60 -50 -40 -30 -20 -10 0 10 20 30 40 50 60 70 80
latitude (degrees, N+, S-)
GD
P/ca
pita
($)
Figure 2-4: Global comparison of GDP/capita vs. Latitude
B
A C
D
2.5.2 Further Insight Gleaned from Database Compilation The economic data collected within the database shown in Appendix A demonstrates that
as at 2003, 53% of the world’s population resided in the +/- 30° latitudinal equatorial
range. This fact is illustrated vividly in Figure 2-5 which shows a distribution of
population sizes (where each country is represented by a circle in which its population
size is proportional to the radius of the circle) against a latitude vs. longitude graph for all
the world’s countries. The +/- 30° latitude lines are demarcated by black arrows making it
possible to deduce from simple visual analysis that at least 50% of the world’s population
inhabits this equatorial range.
70
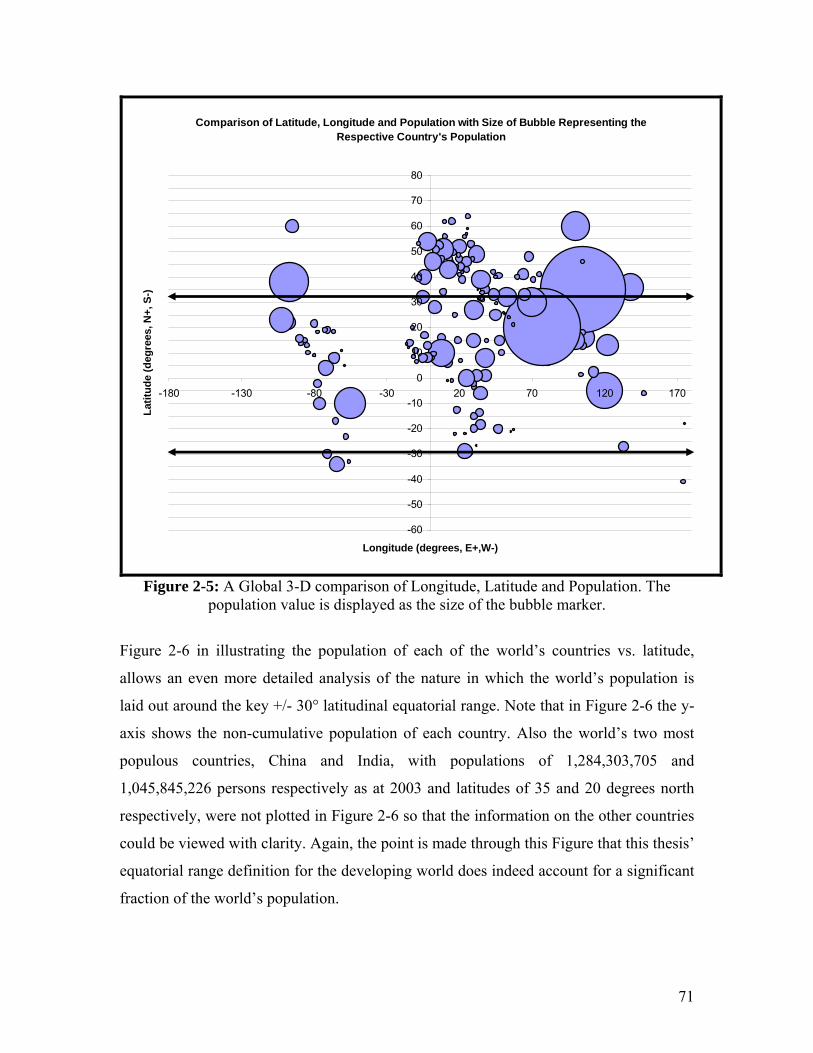
Comparison of Latitude, Longitude and Population with Size of Bubble Representing the Respective Country's Population
-60
-50
-40
-20
-10
0
10
20
30
40
50
60
70
80
-180 -130 -80 -30 20 70 120 170
Longitude (degrees, E+,W-)
Latit
ude
(deg
rees
, N+,
S-)
-30
Figure 2-5: A Global 3-D comparison of Longitude, Latitude and Population. The population value is displayed as the size of the bubble marker.
Figure 2-6 in illustrating the population of each of the world’s countries vs. latitude,
allows an even more detailed analysis of the nature in which the world’s population is
laid out around the key +/- 30° latitudinal equatorial range. Note that in Figure 2-6 the y-
axis shows the non-cumulative population of each country. Also the world’s two most
populous countries, China and India, with populations of 1,284,303,705 and
1,045,845,226 persons respectively as at 2003 and latitudes of 35 and 20 degrees north
respectively, were not plotted in Figure 2-6 so that the information on the other countries
could be viewed with clarity. Again, the point is made through this Figure that this thesis’
equatorial range definition for the developing world does indeed account for a significant
fraction of the world’s population.
71

Population of the World's Countries vs. Latitude
0
50,000,000
100,000,000
150,000,000
200,000,000
250,000,000
300,000,000
-60 -50 -40 -30 -20 -10 0 10 20 30 40 50 60 70 80
Latitude (degrees, N+,S-)
Popu
latio
n (-)
2 countries with the following data points were not represented:(20, 1,045,845,226) and (35, 1,284,303,705)
Figure 2-6: Global comparison of Population vs. Latitude
Figures 2-5 and 2-6 demonstrate how different countries compare when their population
sizes are compared to their latitude and longitude and latitude only respectively, but is
there insight to be gained from a comparison of population sizes to respective GDP per
capitas? Most definitely; such an analysis would allow one to know the proportion of the
world’s population which earns less than the world’s average GDP per capita, the
magnitude of the fraction of the developing world having a GDP less than the world’s
average could certainly lend anchorage to the need to “re-engineer” satellite system
design for affordability. Figure 2-7 plots population against GDP/capita for all the
world’s countries. The population y-axis is non-cumulative. A vertical line is drawn at
the world’s average GDP per capita of $7600 in 2002 dollars. This Figure shows a
significant cluster of countries exist with GDP per capitas less than $7600.
72

Population vs. GDP/Capita
1,000
10,000
100,000
1,000,000
10,000,000
100,000,000
1,000,000,000
10,000,000,000
0 5,000 10,000 15,000 20,000 25,000 30,000 35,000 40,000 45,000
GDP/Capita (2002 US$)
Popu
latio
n (-)
Figure 2-7: Global comparison of Population vs. GDP/capita
Figure 2-8 shows this relation even more vividly by differentiating between countries
within the demarcated +/- 30 ° latitudinal range (red triangles) and countries which lie out
of this range (blue diamonds). A vertical solid purple line demarcates the world’s average
GDP per capita of US $7600 in 2002 dollars and a dashed green line demarcates a
country’s average population as at 2003 of 27, 221, 930 people. Figure 2-8 shares many
key insights. Firstly, as at 2003, the number of people in the +/- 30 ° developing world
equatorial belt was approximately 3,318,842,429; the fraction of people within this
developing world region that earn less than the world’s average GDP per capita is 91.4%
or 3,018,842,429 people. This staggering percentage of the developing world population
illustrated by the red triangles is shown lying to the left of the world’s average GDP per
capita line. A visual analysis of the information presented in Figure 2-8 makes it easy to
see that the majority of developing world countries earn less than the world’s average
GDP per capita. A second interesting insight brought out through the mode of
representation of the population vs. GDP/capita analysis in this graph is that by using the
world’s average GDP per capita line and the average world Population line as points of
reference, it was possible to break the graph up into 4 quadrants. These quarters entail
countries which range from having GDP per capitas greater than the world’s average and
73

having smaller than average populations to entailing countries which have larger than the
world’s average population and GDP per capitas less than the world’s average. Taking a
look at the quarter in Figure 2-8 which is comprised of countries which have less than
both the world’s average population and the world’s average GDP per capita, it is
noteworthy that many of the developing countries that are already having to deal with
economic constraints from having low GDPs also have small populations which often
also means a smaller land mass or smaller domestic market potential. Being a small
country can add other constraints of limited natural resources and infrastructure across
the scope of a country’s major necessities and it is this lack of basic infrastructure
coupled with economic fragility.
Population vs. GDP/Capita
1,000
10,000
100,000
1,000,000
10,000,000
100,000,000
1,000,000,000
10,000,000,000
$100 $1,000 $10,000 $100,000
GDP/Capita(2002 US$)
Popu
latio
n (-)
- 30º < x lat < 30º -30º > x lat > 30º
world avg GDP/capita ( $7,600 in 2002$)world avg population/country (27,221,930)
Figure 2-8: Global comparison of Population vs. GDP/capita with classifications
Large & earning over World’s average
Large & earning under World’s average
Small & earning under World’s average
Small & earning over World’s average
74

Figure 2-9 shows a final noteworthy insight gleaned from the compiled developing world
database. It shows a graph displaying the cumulative population within the developing
world on the y-axis wherein for any point on the graph that point represents the total
population within the developing world which has a GDP/capita greater than or equal to
the respective GDP/capita shown on the x axis. The data presented in this graph provides
a greater understanding of the number of people in the developing world who have
GDP/capitas greater than or equal to the world average. Specifically this number is
highlighted by the horizontal line drawn which shows that only 300 million people or
8.6% of the developing world have a GDP/capita greater than or equal to the world
average. This bears greatly on affordability considerations that should be kept in mind
when designing services for this developing world region.
Another important fact to note is that as shown in Figure 2-9 there is a significant drop
off in GDP/capita between $2000/year/person and $3000/year/person in 2002 US dollars.
Approximately 2.23 billion people in the demarcated developing world region earn a
GDP/capita greater than $2000/year/person. However there is a severe drop off when one
moves to a GDP/capita of $3000/year/person as only 0.9 billion people earn more than
this amount. Hence an increase in GDP/capita of only $1000/year/person caused a
sizeable reduction in the number of people in the demarcated range that earn greater than
or equal to that amount. Again, statistics such as these greatly underscore the need for
design for affordability in satellite and end user terminal design.
75

Total Population in +/- 30 deg latitude range with GDP/capita >= X vs. GDP/capita {where GDP/capita =X}
0
500000000
1000000000
1500000000
2000000000
2500000000
3000000000
3500000000
100 1000 10000 100000
GDP/Capita (2002 US$) {= X}
Tota
l Pop
ulat
ion
with
GD
P/ca
pita
>=
X World average GDP/capita = $7600in 2002 US dollars
# of people that have a GDP/capita >= the World average
Figure 2-9: Cumulative Total Population in +/- 30° equatorial range with GDP/capita >=
x, where x is the GDP/ capita
In summary, the data gleaned from the developing world database leaves the astute reader
with two major conclusions. Firstly, a satellite system specifically developed to address
the connectivity inequities of the developing world as proposed in this thesis is an
immediate and extremely needed solution to a continuously exacerbating digital divide
inequity. Secondly, there are non-trivial economic inequities which underscore the fact
that developing world countries would be afforded enormous advantages through the
introduction of a communications medium that is not dependent on the country’s specific
infrastructural maturity state and which is affordable and applicable to extremely
marginalized communities. Hence the developing world has a yet untapped, immense
potential to be a bustling market base for connectivity applications. With informed
hindsight on the part of system designers to ensure the satellite system’s applications are
not technologically overly elaborate and provide the needed connectivity at minimum
cost, this thesis’s proposed system would make serious inroads in increasing access to
many of the world’s most basic social needs.
76

The current satellite system industry is technologically mature but yet to make impressive
strides in the social good, policy and economic contexts. Satellite system design of the
future must be revolutionized such that system designers endeavor to design for a
multiobjective problem for which the objectives are:
• affordability for market bases most in need
• basic technical capability to carry out desired connectivity
• efficient design within current policy context
• adherence to the regulatory framework and,
• seamless incorporation (as is possible) within desired region/s of coverage’s already
existing mode/s of communication
77

78

Chapter 3
The Technical and Economic Feasibility of a
Satellite Communication System for the
Developing World
3.1 Introduction
Chapter 3 commences with a description of and rationale for the application that the
proposed satellite system will deliver. The Chapter then sets up the analysis for the
technical and economic feasibility of the proposed satellite communication system for the
developing world. This feasibility analysis commences with a presentation of the details
of the MATLAB based satellite communication simulation for the zonal equatorial
coverage, proposed satellite system. The details of the SMS version of the simulation are
presented along with a presentation of how the feasibility analysis was carried out. The
results of the case study along with a discussion of the implications of the results are then
discussed.
3.2 Delivering Innovative Mobility
3.2.1 An Assessment of the Intended Satellite Application As a result of the affordability of the intended service being a major concern in the
system design process for the proposed satellite system for the developing world, the
development of extremely low-cost end user terminals with low cost-per-function
connectivity costs must be a principal design objective. To this end, the envisioned goal
of the proposed satellite system is to create a low cost non-realtime paging system for
79

developing countries in the +/-30° latitude equatorial belt. The paging application would
provide short messaging services (SMS) for its customers akin to the SMS service that is
now quite popular amongst mobile phone users. SMS allows users to send a recipient a
text based message using a given end user terminal. Currently the industry norm is that
the fixed SMS message length is 160 characters but longer messages can be sent by being
broken up into multiple messages. Because illiteracy amongst the poor is a major
concern, the paging end user terminal could also be structured such that there would also
be icons representing key messages such as “I have to cancel the plan we agreed on,” or
“I am at the desired location” or “The person or thing is not there” for example. The
presence of such icons would extend the applicability and relevance of the application
amongst marginalized communities.
The phenomenon of messaging has become an integral and very popular use of the
portable Internet in today’s mobile information society. The decision to have messaging
be the application of choice for the system proposed by this thesis was driven in no small
part by the fact that SMS has been proven to bring desired connectivity without
discriminating costs. As evidence of this fact, the frequency with which text messages are
sent around the world speaks for itself. China, which is a leading force in text messaging,
sent a total of 220 billion text messages in 2003. [CD04] During the month of March in
2004 some 2.1 billion text messages were sent in the UK. [TEXT04] In the Philippines,
despite its lackluster economic stance, as recently as 2002, Filipinos held the rank of first
place in the world for SMS messages sent and received by each mobile user. At the
height of the SMS boom, statistics showed that Filipino users sent an average of 20 text
messages per day. [ITU04] Filipino operators have also initiated the use of SMS on
fixed-line telephones. Consequently, within the realm of the portable Internet, the
unprecedented success of text messaging has undoubtedly taken the industry by surprise.
However for the reasons given in Section 2.3 and other parts of the discussion in this
thesis thus far, the use of satellite systems in rural regions as yet untouched by any form
of terrestrial-based wired or wireless connectivity medium is most certainly a needed
service that has an undeniable role to play in attempts to bridge the digital divide.
80

With portable messaging end-user terminals becoming more resourceful and multi-
modal, messaging has advanced from being an entertaining way to communicate - mainly
utilized by the elite, to being an essential communication and business tool for person-to-
person and private sector to customers interactions. Globally, SMS has become a
revenue generating means to be reckoned with. It is being useds to inform, transact
business within, organize, entertain and facilitate our increasingly busy lives. From
business to governments to institutions to spouses and so many others, the high
penetration of portable end user terminals and the cheap costs, coupled with the ubiquity
of access and instantaneousness arrival times has resulted in messaging being used to
promote goods, keep families in touch and various other applications which are greatly
influencing the course of today’s society.
3.2.2 Ingenious Messaging Applications Airlines like Virgin Blue have introduced SMS check-in services where a barcode
containing reservation details is sent to the end user terminal which is scanned at check-
in. Mobile marketing campaigns are now quite common with different techniques such
as competitions, SMS-based promotions, m-coupons, alerts etc. being used to link to
targeted audiences. The traditional pink slip has also been digitized with SMS being used
in countries like South Korea and the UK to inform employees of their redundancy. It is
also becoming a means of court room evidence, playing a decisive role in many criminal
investigations. [ITU04]
3.2.2.1 Saving Lives through Portable Messaging
Multimedia Messaging Service (MMS), wherein a photo can be sent as if it were a text
message from a designated sender to a receiver, is being used by accident services in the
UK to inform hospitals of the state of accident victims before they arrive at the
Emergency Units. The service, operated by Orange UK and Fife Fire and Rescue
Service, allows rescue workers at the scene of an accident to take photographs of
casualities and immediately send photos by MMS to Dunfermline’s Queen Margaret
Hospital which also has mobile end user terminals and can thus receive the pictures in
real time. Doctors then assess the magnitude of the injuries and organize the appropriate
81

medical teams. Additionally, they can also determine whether they need to travel to the
site of the accident or whether the victim’s state can facilitate him or her being
transported to hospital before treatment is administered. This is a more advanced
application that has immense promise to improve the quality of health care in the critical
first few moments following an accident. [ITU04]
Many more intriguing applications exist, in South Africa, SMS is being used to help HIV
patients with the complicated process of taking drugs. The drugs each person has taken
daily is recorded via an SMS message by the caretaker who travels through the village,
this information is sent via text message back to the town hospital for recording in a
database. This ‘paper-less’ method has greatly improved this aspect of HIV health care in
South Africa. [BBC05] SMS is also being used in China and South Africa to allow
people to vote and share their opinions on issues related to their Governance resulting in
increased participation in the civic process, which should not be taken for granted given
the recent history of China. In Kenya, SMS is used by rural farmers to find out the price
for their produce in the main markets so they can ensure the “middle man” is presenting
them with fair prices for their harvest. [ITU04]
On the more technical side of things, messaging being the application of choice lends
numerous benefits. Firstly, affordability must be the driving tenet behind application
choice and it satisfies this criterion. Secondly, the end user terminal is basic, that is, it is
not an instrument that promises to ‘do it all’ but rather is focused on delivering a specific
single task (i.e., messaging) well. There is not a significant memory storage requirement
with these systems, though there is some memory required to store old messages. This
further contributes to the end user terminal being small, compact and not technologically
elaborate. The provision of the application of messaging means the system can operate in
store and forward mode instead of real time which helps to significantly drive down
costs. Additionally, the low power electronics involved has the capacity to enable
extended operation using batteries or any available renewable energy source (such as
solar powered terminals). This reduced power need in comparison to other
82

communications facilitating terminals and in concert with simple antenna requirements,
also helps to drive down costs.
In sum, the exciting applications for messaging mentioned earlier in concert with these
technical benefits demonstrate that messaging is a proven popular communication
medium which has confirmed that it can reliably deliver the desired connectivity at an
affordable cost. Thus the proposed satellite system in this thesis attempts to capitalize on
the immense potential of messaging services to deliver greater access to basic social
services and in so doing empower the poor.
3.3 The Simulation Model for LEO Communication
Systems
3.3.1 Purpose of Model Many different fields comprise the background knowledge necessary to formulate a LEO
satellite system. The system designer must be adept, inter alia, at spacecraft design,
launch vehicle matching and pricing, orbital dynamics, recommendations for end user
terminal design, satellite communication and cost analysis. In order to simulate an
envisioned satellite system, a MATLAB based simulation was built by Chang and de
Weck [deWDC03a] which based on the desired purpose of the satellite system can model
the important elements of the satellite design constellation problem. In the process of the
simulation, high level design decisions such as the constellation type or the minimum
elevation of the satellites are mapped to system performance, lifecycle cost and capacity,
where capacity is indicative of the number of simultaneous users. The simulation is
focused on trading off lifecycle cost (LCC) with system capacity, while keeping the
communication performance per channel constant.
For the particular instantiation of the simulation in this research, it is important to
understand the functional system requirements of the system. In this case the fundamental
83

requirement of the LEO constellation system is that it provide non real-time, store and
forward based, good quality messaging communication. Depending on certain
engineering fundamentals such as the multiple access scheme and diversity of the system,
technical specifications required to meet the customer’s demands for the messaging
system in the form of bit error rate, data rate per user channel and link margin are
derived. These three metrics form the requirement vector r.
Another important consideration is the design vector x of the system that the system
designers have flexibility to change at the early stage of the design process. For this
system there are nine design variables which are expounded upon further in this Chapter.
It is the exhaustive combination of all possible design variable values that form the
design space. While each architecture in the design space has a specific design vector x,
they all share a vector of constants c. Because each architecture shares the same sub-
technology, the values of the constants are the same for each of these architectures. For
example, each architecture utilizes the same modulation scheme and the Nyquist filter
rolloff factor is the same for each system.
Of equal importance as design variables and system constants are the important policy
constraints p stipulated by governing organizations such as the FCC or the ITU. As
Larson and Wertz inform us, regulatory constraints exist on the choice of frequency band,
transmission bandwidth and power flux density. For example, international agreements
have set frequency bands for space communications. These agreements were established
by the ITU and the World Administrative Radio Conference (WARC). They are
administered in the US by the FCC for commercial users and the Interdepartmental Radio
Advisory Committee for military users. [WLJR99] The policy constraints, p, design
requirements, r, and system constants, c, are shared by all architectures across the design
space and together form the known metrics of the system.
Based on the known metrics, it is the task of the system designer to construct a means to
connect from the design space to objective space in order to fully understand and probe
the trade space of the system. This will facilitate prediction of the system performance
84

once the metrics p, r and c are known and a set of design vectors x is provided. In order
to provide reliable and real time prediction of system performance capability, the
computer based model referred to previously was developed to mimic real world designs
in a computer environment. The simulation facilitates the following mapping from design
space to objective space: J = f(x,c,p,r), where J is the objective vector. It is important
that the fidelity of the model be ratified. In order to accomplish this ratification, a vector
of benchmarking metrics B is also generated by the simulation to see how it matches up
with real systems. The system designer can be confident that the simulation model is
reproducing reality if the comparison matches up with real systems favorably.
3.3.2 Limiting Assumptions of the System Model The model is solely designed to simulate LEO constellation systems, as such there are
some inherent limiting assumptions that pertain to the system. These are as follows:
• All orbits are circular.
• The satellite system simulation is designed to provide coverage to the 30° latitude north
to 30° latitude south equatorial range.
• The system has a diversity of one.
• LEO systems are situated between the altitudes of 500 and 1500 km. The launch
vehicles modeled by the simulation can launch satellites to an altitude of 2000km. The
system thus assumes that all systems will only need to be launched to an altitude of
2000km.
• The average elevation angle for LEO systems is under 30°. The simulation will
successfully model systems with elevation angles in the range of 0° to 40°.
• In the event that the satellite mass is extremely large, the simulation will return no
solution. However since launch vehicles such as Ariane 5 can lift six tons of payload to
85

the geostationary transfer orbit, it is hard to imagine any design that would be unable to
find a launch vehicle capable of lifting it to the much lower LEO orbits.
• The only multiple access schemes modeled are multiple frequency-time division
multiple access (MF-TDMA) and multiple frequency-code division multiple access
(MF-CDMA). The multiple access scheme employed informs the method by which
multiple channels are connected with a single satellite. MF-TDMA and MF-CDMA are
the two most popular multiple access schemes in use in LEO systems today.
While these limitations are in line with LEO systems, future system designers should
keep them in mind to ensure technically sound results are outputted from the model.
3.3.3 System Architecture Evaluation Framework
We are now ready to build, implement and use the system model. The following six steps
proposed by de Weck and Chang carry out the entire system architecture evaluation
framework process. The first four steps build and implement the modules while the last
two steps demonstrate how the model is used in this analysis.
1. Choose the elements and bounds of the architectural design space inputs which
include the design vector x, constant vector c, policy vector p, and requirement vector r;
and outputs that include the objective vector J, and benchmarking vector B.
2. Build the mapping matrix between inputs and outputs and subdivide the problem into
modules which match the system’s physical and functional characters. Define clear cut
interfaces between modules.
3. Implement and integrate the modules based on technological, physical, economic and
policy relationships such as constellation geometry, astrophysics, communication theory,
cost estimating relationships and market estimation. Implement the individual modules
86

and test them in isolation from each other. Then integrate the modules into an overall
simulation.
4. Benchmark the simulation against the data of reference systems. Tune and refine the
simulation as necessary (Loop A in Figure 3-1).
5. Conduct a systematic trade space exploration using a full factorial run that covers the
entire possible range of design variables.
6. Identify and post-process the Pareto optimal set. If no acceptable Pareto optimal
solution is found, the design space needs to be modified (Loop B in Figure 3-1). Once the
Pareto optimal solutions are arrived at, extract a subset of Pareto optimal architectures
that are non-dominated for further study.
Figure 3-1 shows a block diagram of the proposed architectural design space exploration
methodology modified to suit the research proposed by this thesis.
Figure 3-1: Architectural trade space exploration methodology [deWDC03a]
Define architectural 1
design s( x
p ,
a c
c ,
e p
inputs ,
( J r
, ) ) and outputs B
Mapping matrix and define modules and
interfaces
2 3Implement
and integrate modules
Benchmark against reference systems
Trade space exploration and
optimization
Postprocessing and sensitivity
analysis
ok?
4n A5 y
B
6 ok?
y Pareto-Optimal Set of Architectures for Further Study
n
Inner Loop: Increase model fidelity – make results realisticA
make results acceptable Outer Loop: Modify trade space –B
87

3.3.4 Implementing and Testing the System Model The proposed system architecture evaluation framework of Section 3.3.3 is applicable to
many classes of complex systems but in this research it will be used to explore the trade
space of zonal equatorial LEO systems. In this section the first four steps of the
previously mentioned system architecture evaluation framework will be explored. We
begin by clearly defining the input and output vectors of the simulation, and end with
benchmarking the simulation against an actual messaging system that has been launched
in the recent past called Orbcomm. Orbcomm is a global messaging LEO system that
started to provide full service in 1998. In addition to global two-way data (wireless email,
fax etc.) and messaging applications, it also provides tracking and monitoring capabilities
for high level industries such as the U.S. Armed Forces, transportation, marine, aviation,
automotive, utility, oil, and gas industries [ORBM].
3.3.4.1 Input (Design, Constants, Policy, and Requirement) Vectors and
Output (Objective and Benchmarking) Vectors Definition (Step 1).
Figure 3-2 shows the vector of design variables x, constants c, policy constraints p,
performance requirements r, objectives J and benchmarking vector B that are utilized in
and produced by the system model. The Figure also illustrates which of the vectors are
inputs into the model and which are outputs.
88

Figure 3-2: Input-output mapping of LEO communication satellite constellation
simulation [deWDC03a]
-Apogee kick motor type“ Design vector”- Constellation ty e “Constant vector”p- Orbital altitude -Apogee kick motor specific
impulse x c- Minimum elevation angle -Station keeping specific impulse- Coverage diversity - Modulation scheme- Satellite transmitter powe r
- Satellite spot beam gain -Nyquist filter rolloff factor
The design vector x is instrumental in framing each architecture as it captures the
architectural design decisions and is the sole input into the system that the system
designer can change for each architecture to test the effect on system performance. For
this SMS based instantiation of the simulation, the design vector was subject to the
bounds or discrete values shown in Table 3.1.
- Cluster size -Neighboring use interference r
factor -Convolutional coding code rate-Convolutional coding constraint
length -Intersatellite link data rate
-Gain of user terminal antenna- Us r terminal po ere w
- Discount rate -Initial development time
- Intersatellite link (Boolean)
- Multiple access scheme - Satellite lifetime
-Mobile - to satellite uplink -frequency bounds
-Satellite - to - mobile downlink frequency bounds
- Bit error rate -Data rate per user channel
- Link margin
J “ Objective vector”
LEOcomsatcom - Total lifetime data flow - Number of simultaneous Simulationusers in the system
- Life - cycle cost p - Subscribers per ear “Policy vector” y
- Total air time - Cost per function
- Average delay
“Requirement vector”
r
- Number of satellites - Number of simultaneous users
- ife L - cycle cost Satellite mass-
- Number of cells - Orbital period
- Satellite transmitter average EIRP - Number of gateways
“ Benchmarking vector”
B
89

Symbol Variable xLB xUB Unit
C Constellation type Walker Walker [-]
H Altitude 500 1350 [km]
εmin min elevation 5 35 [deg]
Div Diversity 1 1 [-]
Pt sat transmit pwr 5 200 [W]
Gt dBsat antenna edge
cell spot beam gain 2 2 [dBi]
ISL inter sat links 1 0 [-]
MAS Multiple access
scheme MF-TDMA MF-CDMA [-]
Tsat sat lifetime 5 15 [years]
Table 3.1: Design variable definition, x [deWDC03a]
The constant vector, c, illustrated in Table 3.2, includes technical parameters that are
assumed fixed throughout the design space exploration process. These technical
parameters are assumed fixed either because they are determined by existing
technologies, or because their variation will still result in technologically sound solutions.
But nevertheless, these parameters are use to compute some important calculations during
the simulation.
90

Symbol Constant Value Unit
AKM apogee kick motor type 2 (3-axis-
stablized) [-]
AKMIspapogee kick motor
specific impulse 290 [s]
StationIspStation keeping specific
impulse 230 [s]
MS modulation scheme QPSK [-]
ROF Nyquist filter rolloff
factor 0.5 [-]
CS Cluster size 1 [-]
NUIF neighboring user
interference factor 1.36 [-]
Rcconvolutional coding
code rate ½ [-]
K convolutional coding
constraint length 9 [-]
RISLintersatellite link data
rate 0 [MB/s]
Ge dBgain of user terminal
antenna 0.7 [dBi]
Pe user terminal power 0.5 [W]
D discount rate 15 [%]
IDT initial development time 5 [years]
NGPCRF Non-government project
cost reduction factor 0.8 [-]
Table 3.2: Constants definition, c [deWDC03a]
The policy vector, p, contains only the bounds of the frequency bands assigned by
FCC. These values are based on the values declared by the Orbcomm system in their
FCC filing. The policy vector p, is where other policy decisions, such as restrictions on
the placement of gateways or the use of foreign launch vehicles could be included. The
simulation includes a Boolean variable representing whether to use foreign launch
vehicles or not. However it is usually turned off unless we want to test the effect of
banning non U.S. launch vehicles.
91

Policy constraints Orbcomm
uplink frequency
bandwidth upper
bound [MHz]
150.05
uplink frequency
bandwidth lower
bound [MHz]
148.00
downlink frequency
bandwidth upper
bound [MHz]
138.00
downlink frequency
bandwidth lower
bound [MHz]
137.00
Table 3.3: Policy constraints, p [deWDC03a]
For this research, the requirement for LEO communication satellite constellations is to
provide satisfactory messaging communication. In order to provide the minimum
acceptable messaging quality, the requirements r that include bit error rate (BER), data
rate per user channel (Ruser) and link margin (Margin) must be decided upon. The
requirement vector r is dependent upon the following two design variables: the multiple
access scheme (MAS) and the diversity (div). With the MAS taking values of MF-TDMA
or MF-CDMA and the diversity being 1 throughout the analysis, the following
requirements vector is obtained as shown in Table 3.4. It should be noted that the link
margin value indicated is the margin for the satellite to end user terminal downlink. Also
the data rate value shown is the equivalent subscriber unit downlink data rate. The BER ,
Ruser , and Margin values were all influenced by publicly available data on the Orbcomm
system.
92

Design variables R e q u i r e m e n t s
Multiple
access
scheme
Diversity Bit error rate
(BER) [-]
Data rate per
user channel
(Ruser) [kbps]
Link margin
(Margin)
[dB]
MF-TDMA 1 1e-6 4.8 4.4
MF-CDMA 1 1e-5 2.4 3.3
Table 3.4: Requirements definition, r [deWDC03a]
The objective vector J captures all the metrics by which the “suitability” of a particular
architecture can be evaluated. As Table 3.5 demonstrates, the objective vector shares
insight as to the total lifetime data flow that represents the total communication traffic
(throughput) throughout the lifetime of the system, the number of simultaneous users the
system can support (i.e., its capacity), the life-cycle cost, and the cost per function (CPF).
Cost per function here is defined as the life-cycle cost divided by the total lifetime data
flow. Note that all costs mentioned in this analysis are in 2002 United States dollars.
Symbol Objectives Unit
Rlifetimetotal lifetime data
flow (integrated) [GB]
Nusersnumber of
simultaneous users [-]
LCC life-cycle cost [B$]
CPF cost per function [$/GB]
Table 3.5: Objectives definition, J [deWDC03a]
To prove that the simulation is producing trustworthy data, the results must be
benchmarked against similar existing satellite systems. In that regard the simulation also
outputs a benchmark vector which is comprised of technical specifications that result
from the design process. If the simulation uses the same design vector, x, as an existing
satellite system, then a comparison between the benchmarking vector of the simulation
93

and the existing operational system should not show a major variation in resulting
technical specifications. A high fidelity simulation will have technical specifications that
are very close to that of the real system from which its design vector was modeled. Table
3.6 shows the technical specifications contained in the simulation’s benchmarking vector,
B. Some of these variables are also contained in the objective vector, J.
Symbol Benchmarking variables Unit
Nsat number of satellites [-]
Nusersnumber of simultaneous
users per satellite [-]
LCC life-cycle cost [B$]
Msat satellite mass [kg]
Ncell number of cells [-]
Torbit orbital period [min]
EIRP sat xmit average EIRP [dB]
Ngateway number of gateways [-]
Table 3.6: Benchmarking vector, B, definition [deWDC03a]
3.3.4.2 Define, Implement and Integrate the Modules (Steps 2 and 3)
Step 1 of the System Architecture Evaluation Framework process, i.e. the definition of
the input and output vectors of the architectural trade space has now been completed
given the discussion in section 3.3.4.1. We will now enter the inner loop A of Figure 3-1
in which the simulation modules are defined, implemented, integrated and benchmarked.
It is within this important loop that any necessary changes to the simulation required to
have it align with its intended function and reflect reality are implemented. This is of the
utmost importance to ensure the simulation’s results will benchmark favorably with
existing systems. In this discussion, the state of the completed model at the end of the
iteration process is presented.
94

The main focus of this section is steps 2 and 3 of the evaluation framework which are to
define, implement and integrate the system’s modules. In order to ensure the simulation
benchmarks well, great effort was undergone to ensure the economic and physical laws
that underlie the system are accurately defined and reproducible. The following
discussion gives an overview of the overall structure of the simulation then takes it one
level down to a description of each module of the simulation in conjunction with a
description of the module’s implementation.
3.3.4.2.1 Simulator’s Overall Structure
The satellite system simulation structure is based on a modular framework. Speaking
generally the simulation’s modules can be broken up between technology and economic
domains, each module falling squarely into one category or into the other. A major
concern of the simulation developers was that they wanted to ensure that if a single
module needed to be changed that this would not necessitate changes in other modules of
the system. In such a large scale simulation this goal is imperative and was accomplished
by having the modules communicate with each other through input-output interfaces.
Consequently, as long as the interface was not perturbed, a change in one module of the
simulation would not cause for attendant changes in other modules of the system. The
physical or functional relationship between the components of the simulated satellite
system is enacted through the communication that takes place between the modules. The
complete model structure is shown in Figure 3-2 wherein each box represents an
individual MATLAB file within the simulation. Note that the Market module shown is
not utilized within the simulation.
95

+ ++
- -
+ +
- - -
- + -
+ +
-
System Input File
Start File
Cost Module
Satellite Network Module
Spacecraft Module
Launch Vehicle Module
Coverage/Constellation
Module
Capacity Module (MF-
CDMA)
Capacity Module (MF-
TDMA)
Market Module
Design Vector (x)Constant Vector (c)Policy Vector (p)
+ -Converging node Diverging node
Figure 3-3: Communications satellite constellation - simulation structure. [deWDC03a]
The simulation model gets kicked off by the System Input File (SIF). The SIF entails all
the values of the design vector x, constant vector c, and policy vector p as inputted by the
satellite system architect. The SIF then communicates the values of these vectors to the
Start File (SF). Start File then produces the requirement vector r, influenced by the
design vector fed in by the SIF. The Start file is an integral part of the system model as
this is the main warehouse for the summoning and execution of each module in the
simulation in a specific order. The input-output interfaces that facilitate communication
between the modules also exist within the SF. The modules along with their main roles
are as follows [DC04]
1. Coverage/Constellation Module (CCM) that defines the constellation structure
and coverage geometry
96

2. Satellite network module (SNM) that determines the network topology
3. Spacecraft module (SM) that computes the physical attributes of the spacecraft
4. Launch vehicle module (LVM) that selects the capable and most economical
launch vehicle
5. Capacity modules (CM) that compute the satellite capacity of different multiple
access schemes
6. Total cost module (TCM) that computes the life-cycle cost of the system and also
computes the cost of the messaging end user terminal
7. The results from the Market module (MM) are superseded by the analysis in
section 3.5 which details the post processing of the Pareto optimal solutions.
The SF calls and runs all the modules of the system. The results of the simulation are
subsequently stored in the objective vector J and the benchmark vector B to facilitate
post-processing and analysis by the system designer. An in-depth description of the
modules has been prepared by de Weck and Chang and is included in Appendix B.
The discussion in Appendix B also includes a detailed description of the changes made to
the simulator to facilitate this study’s requirement for adequate messaging capability.
Nonetheless, as a brief summary, the changes made to the simulation for the purpose of
this research are that firstly, the design, requirements, policy and constants vectors were
all changed to suit the needs of this messaging based system. Secondly, the coverage
constellation module was changed so that it employs a numerical optimization of Walker
constellation designs developed by Lang and Adams [TLWA97] specifically catered to
the +/- 30° equatorial belt. As such, the constellation structure and coverage geometry are
defined specifically for the region of interest. Thirdly, an end user terminal module was
97

defined which determines the cost of the end user unit given certain end user terminal
design requirements that the system operator is given the flexibility to decide upon.
A fourth change is that the number of staff members accounted for in the cost module
was reduced by half in keeping with the reduced system coverage requirement which
reduces the need for as many staff members. The fifth change was that within the satellite
network module, the outputted number of gateways parameter’s calculation no longer
incorporates values based on Globalstar’s parameters, but on Orbcomm’s. Finally, the
launch module was changed to account for the fact that the ranges within which launch
vehicles would apply needed to be in line with the structure of the messaging system.
3.3.4.3 Benchmark against Reference Systems (Step 4)
de Weck and Chang performed benchmark tests of the simulation to test its fidelity.
[deWDC03a] The simulation was run using the input parameters identical to those of four
real-world systems: Iridium, Globalstar, Orbcomm and SkyBridge. Iridium, Globalstar
and Orbcomm have all previously been mentioned. SkyBridge is a proposed large scale,
pioneering, LEO broadband multimedia satellite system. For each of the four systems, the
design variables, constants, policy constraints and requirements vectors were collated and
each independently run through the simulator to see how its benchmarking vector and
objective vector matched up with the known attributes of the four real-life systems.
The benchmarking results were that for the chief system attributes of number of satellites,
satellite mass, system capacity, and lifecycle cost, the discrepancies between the real-
life/planned systems and simulated systems were on average less than 20%. The fidelity
of the simulation acceptably satisfies the research needs of the system studies that the
simulation was envisioned to assist. Table 3.7 illustrates the benchmarking results for the
SMS instantiation of the simulation (second column of Table 3.7) compared to the results
the simulation produced for the Orbcomm system under the work by de Weck and Chang
(third column of Table 3.7) and how these both compare to the actual parameters of the
real-life Orbcomm System (fourth column of Table 3.7). The input design variables into
98

the simulation to conduct the benchmarking of the proposed SMS based system were
made to match those of Orbcomm.
Benchmarking
vector, B,
variables
Simulation of
proposed SMS-
based system
Simulation of
Orbcomm
Actual
Orbcomm
number of
satellites
19
39
36
number of
simultaneous users
per satellite
219 216 N/A (store &
forward)
life-cycle cost
[billion $]
0.66
1.79
0.5+
satellite mass [kg] 45.34 45.34 41.7
number of cells 1 1 1
orbital period
[min]
101.0
101.3
N/A
sat xmit average
EIRP [dBW]
18
18
10.7
number of gateways
5
64
9
Table 3.7: Benchmarking results of the proposed SMS-based system and the simulated Orbcomm system against the actual Orbcomm system
Note that the difference in the benchmarked number of satellites in the proposed SMS
system and the simulated Orbcomm system as shown in Table 3.7 is due to the fact that
the simulated SMS-based system only serves the +/-30° latitudinal equatorial belt (hence
the reduction in number of satellites). The LCC of the proposed SMS system is also
different from the simulated Orbcomm system due to reduced costs stemming from a
minimized number of satellites requirement, staffing needs which are commensurate with
the scale of the system and other such cost reducing factors. The number of gateways
parameter is also different due to reduced coverage needs. As of this point we have
completed the inner loop A shown in Figure 3-1, the next step is to explore the trade
99

space of the proposed SMS-based LEO communication satellite system using the
simulation model. Given these differences in input the benchmarking process provides
reasonable results.
3.4 Trade Space Exploration and Optimization (Step 5) At this stage, we will run a full factorial exploration of all exhaustive combinations of
selected values of the design variables. This allows the system designer to get a good
understanding of the trade space which is integral to an informed system design process.
The discrete value or choice of values for each design variable used in the full factorial
run is illustrated in Table 3.8. The result of the design space exploration process will
show the extent of designs or objective values that can be arrived at through the
simulation. The next step will be to filter out the set of non-dominated architectures that
define the Pareto front of the design space. The Pareto optimal architectures resulting
from the simulation are distributed along the Pareto front.
I Variable Values Unit
1 constellation type Walker [-]
2 Altitude 500, 825, 1350 [km]
3 min elevation 5,20,35 [deg]
4 Diversity 1 [-]
5 sat xmit pwr 5,200 [W]
6 sat antenna edge cell
spot beam gain 2 [dBi]
7 Inter sat links 0, 1 [-]
8 multiple access
scheme MF-TDMA, MF-CDMA [-]
9 satellite lifetime 5, 10, 15 [years]
Table 3.8: Design variable values for the full-factorial run
The full factorial run computed in this simulation ran a total of 216 designs. The results
are shown in the full factorial curve in Figure 3-4. Each point on the plot in Figure 3-4
100

represents an individual architecture which has its own distinct objective vector, J, and
design variable x. The y-axis represents the LCC in billions of 2002 US dollars while the
x-axis represents the system capacity in terms of the number of simultaneous users that
the system can support.
101 102 103 104 1050.5
1
1.5
2
2.5All Architectures in blue with Pareto Front in red (squares)
System Capacity [simultaneous users]
LCC
[$B
]
Figure 3-4: LCC vs. System Capacity plot for a full factorial run of 216 designs
One of the first trends that this full factorial plot shows is that in general systems with
larger capacities have higher costs and vice versa. This trend does not come as a surprise
as all other things being equal it takes greater capital to simultaneously serve a greater
number of customers. Now given the full factorial results how does one begin to make
sense of all the system architectures shown in this plot? If the objective vector J of a
satellite design is non-dominated in comparison to the objective vectors of all other
designs in the design space, then this design is Pareto optimal and is of interest to the
system designer. Note that there are some designs in Figure 3-4 that appear to be
dominated despite the use of a strong Pareto filter. Further work should be conducted on
101
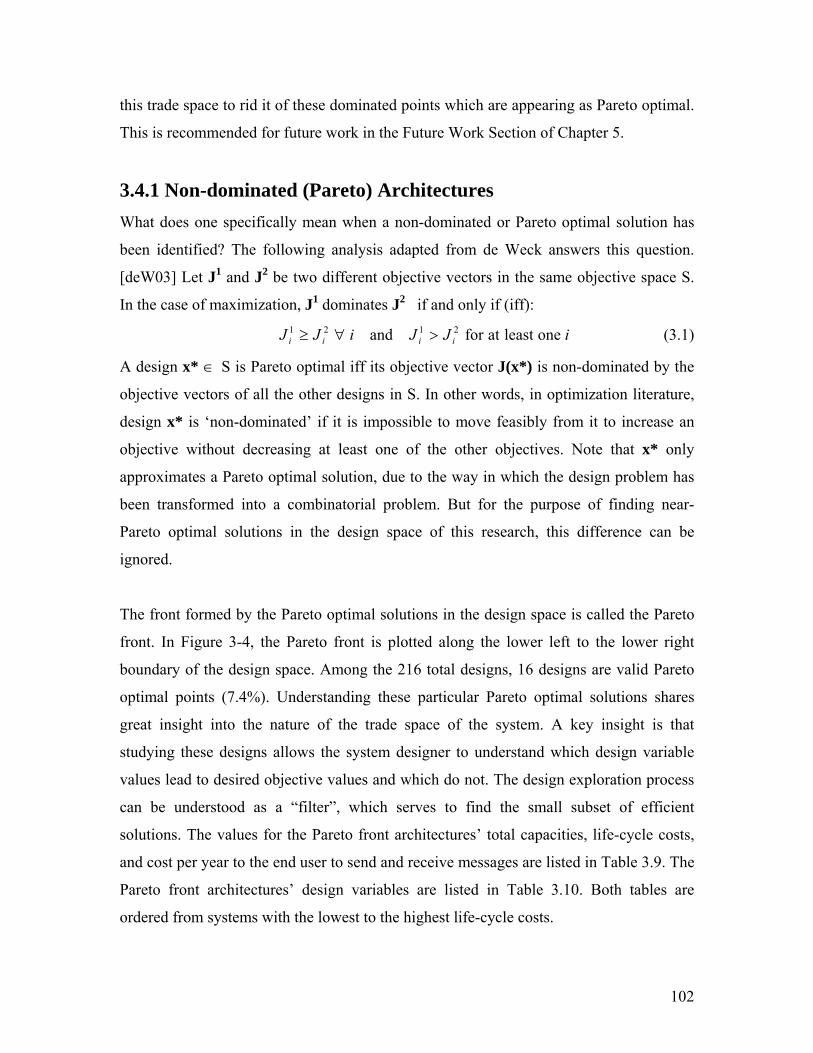
this trade space to rid it of these dominated points which are appearing as Pareto optimal.
This is recommended for future work in the Future Work Section of Chapter 5.
3.4.1 Non-dominated (Pareto) Architectures What does one specifically mean when a non-dominated or Pareto optimal solution has
been identified? The following analysis adapted from de Weck answers this question.
[deW03] Let J1 and J2 be two different objective vectors in the same objective space S.
In the case of maximization, J1 dominates J2 if and only if (iff):
iJJiJJ iiii oneleastatforand 2121 >∀≥ (3.1)
A design x* ∈ S is Pareto optimal iff its objective vector J(x*) is non-dominated by the
objective vectors of all the other designs in S. In other words, in optimization literature,
design x* is ‘non-dominated’ if it is impossible to move feasibly from it to increase an
objective without decreasing at least one of the other objectives. Note that x* only
approximates a Pareto optimal solution, due to the way in which the design problem has
been transformed into a combinatorial problem. But for the purpose of finding near-
Pareto optimal solutions in the design space of this research, this difference can be
ignored.
The front formed by the Pareto optimal solutions in the design space is called the Pareto
front. In Figure 3-4, the Pareto front is plotted along the lower left to the lower right
boundary of the design space. Among the 216 total designs, 16 designs are valid Pareto
optimal points (7.4%). Understanding these particular Pareto optimal solutions shares
great insight into the nature of the trade space of the system. A key insight is that
studying these designs allows the system designer to understand which design variable
values lead to desired objective values and which do not. The design exploration process
can be understood as a “filter”, which serves to find the small subset of efficient
solutions. The values for the Pareto front architectures’ total capacities, life-cycle costs,
and cost per year to the end user to send and receive messages are listed in Table 3.9. The
Pareto front architectures’ design variables are listed in Table 3.10. Both tables are
ordered from systems with the lowest to the highest life-cycle costs.
102

Design Capacity LCC Cost/Year Number (persons) (B US$) ($/year)
1.00 77.00 0.58 221.68 2.00 1,375.00 0.58 12.41 3.00 66.00 0.58 258.62 4.00 1,331.00 0.58 12.82 5.00 44.00 0.58 387.94 6.00 1,958.00 0.58 8.72 7.00 2,679.00 0.58 6.45 8.00 16,720.00 0.58 1.03 9.00 2,603.00 0.58 6.64 10.00 16,720.00 0.79 0.70 11.00 16,720.00 1.01 0.59 12.00 27,930.00 1.30 1.38 13.00 27,930.00 1.51 0.80 14.00 49,830.00 1.68 1.00 15.00 49,830.00 1.94 0.58 16.00 49,830.00 2.20 0.44
Table 3.9: System Total Capacity, LCC, and the Cost per Year to send and receive messages for the Pareto Optimal Designs
Design Altitude Elev T. Power
MAS Sat Lifetime
Number (km) (deg) (W) TDMA/CDMA (years) 1.00 1,350.00 5.00 5.00 1.00 5.00 2.00 1,350.00 5.00 5.00 2.00 5.00 3.00 1,350.00 20.00 5.00 1.00 5.00 4.00 1,350.00 20.00 5.00 2.00 5.00 5.00 1,350.00 35.00 5.00 1.00 5.00 6.00 1,350.00 35.00 5.00 2.00 5.00 7.00 825.00 5.00 5.00 2.00 5.00 8.00 825.00 20.00 5.00 2.00 5.00 9.00 825.00 35.00 5.00 2.00 5.00 10.00 825.00 20.00 5.00 2.00 10.00 11.00 825.00 20.00 5.00 2.00 15.00 12.00 825.00 20.00 200.00 2.00 5.00 13.00 825.00 20.00 200.00 2.00 10.00 14.00 500.00 20.00 200.00 1.00 5.00 15.00 500.00 20.00 200.00 1.00 10.00 16.00 500.00 20.00 200.00 1.00 15.00
Table 3.10: Design Variables of the Pareto Optimal Designs
Observation of Tables 3.9 and 3.10 will illustrate a few noteworthy generalizations about
the Pareto optimal designs of LEO satellite constellations for messaging communication
103

services to a zonal equatorial region. The first point to note is that by design, all
architectures produced by the full factorial trade space exploration process were Walker
constellations with a diversity of 1 and a satellite antenna edge cell spot beam gain of
2dBi. In general, systems with lower life-cycle costs were stationed at high altitudes, had
low satellite transmitter power values, and had elevation angles that varied between high
and low values.
The Pareto optimal satellite systems produced became expensive at low altitudes, higher
elevation angles and high transmitter power. The highest cost systems employed the MF-
TDMA multiple access scheme and had a high system lifetime. At the most expensive
levels such systems catered to a capacity of 49,830 simultaneous users but at an LCC of
$2.2 billion US dollars. On the other hand, the least expensive systems had high altitudes,
a mixture of high and low elevation angles, low transmitter power, varied between MF-
TDMA and MF-CDMA and had low system lifetimes. The most efficient low cost
system had a capacity of 16,720 simultaneous users which is approximately 34% of the
capacity of the high cost systems, but did so at approximately 26% of the cost with an
LCC of $0.58 billion US dollars.
All optimal solutions did not have inter satellite links (ISL) and systems with significant
cost and capacity benefits had short system lifetimes. These trends are in accordance with
real world observations. The function of inter satellite links is to reduce the satellite
system’s requirements on the ground. Their implementation can realize real reductions in
the number of ground stations needed, but this does not help to increase capacity (which
is a goal of the optimization process). Furthermore, the development costs and additional
weight requirements inter satellite links necessitate increases the system life-cycle cost. If
it is believed that there could be policy and regulatory issues limiting the placement of
ground stations in ‘sensitive’ locations then ISLs become a very wise choice. To this
point, Chang reminds us in his work that the concept of ISLs was first developed for spy
satellites by Motorola. [DC04] However the suite of requirements that become necessary
upon the implementation of ISL does not render such systems Pareto optimal for this
analysis.
104

The short lifetime design variable in the optimal designs is also not a surprise as longer
system lifetimes mean more fuel is needed to keep the satellites in orbit. Further, a larger
fuel requirement signals a greater satellite wet weight and more demanding launch
capability requirements which serves to drive system costs upward. Admittedly, a longer
system lifetime has the advantage of averaging the initial deployment costs over the
system lifetime. Nonetheless, by and large for the developing world market, with
affordability being the driving objective, low cost systems are most desirable. This
affordability requirement lends to lower system lifetimes. Thus, the overriding attractive
architectures from the Pareto front are those which orbit at high altitude, supporting
relatively small amounts of users at low cost.
The astute reader could then ask whether amongst the Pareto optimal designs there exists
a “most optimal” or “best” solution. The preferred solution depends on the goals of the
system designer. Technically, by definition, all designs along the defined Pareto front are
equally optimal. It is the overarching purpose envisioned for the system which will
influence the system designer to choose a particular architecture along the Pareto front to
be more “ideal” than another. For the purposes of this analysis it is desired to choose a
Pareto point that is most likely to be agreeable with the economic constraints of its
potential customers in the developing world, since affordability is a driving factor in this
analysis. Thus a cluster of designs in the lower left half of Figure 3-4 will be chosen to
see whether any could be a feasible architecture, affordable to those in the +/- 30°
equatorial band. This analysis is conducted in the Post Processing of Section 3.5.
Table 3.9 details the values for the following objective variables: the total system
capacity, the LCC, the cost per year to the user to send and receive a nominal amount of
messages per year, (this nominal amount is 10 messages per user per day; the rationale
for this choice is given in Section 3.5). If the system designer has a desired objective
vector in mind for which he would like to find the matching design that results in this
objective then he should use the design of the closest architecture to his desired objective
in the trade space. Once the closest matching architecture is found then the system
105

designer can make the mapping from objective vector space to design vector space. If
there happens to be no architectural designs with objective values close to the desired
objective then a full-factorial run with more values for each design variable could be
performed to allow for a finer design space resolution. Now that the Pareto optimal
solutions have been identified and detailed, step 4 of the architectural design space
exploration process is completed. The next step is to conduct important post-processing
of the Pareto optimal architectures.
3.5 Post Processing of the Pareto Optimal Solution (Step 6) The goal of post processing is to extract the subset of Pareto optimal architectures for
further study that are non-dominated and which harbor favorable characteristics given the
system designer’s goals. Once the ‘ideal’ architecture is filtered out, the nature of the
optimal solution x* that produces this ‘ideal’ candidate architecture can be deduced.
Knowledge of the optimal design vector shares keen insight as the system designer has
control over the values within the design vector and thus knowledge of the values these
design variables should take to produce the desired objective values greatly aids the
system design process.
Figure 3-5 shows the cumulative number of users in the developing world region against
amounts in US dollars that represent the percentages of GDP per capita that research has
shown people are willing to spend on communication services. Harry E. Cook in his
economic work [HC97] explains that irrespective of a person’s income, the fraction of
personal income that one would be prepared to spend on life’s basic necessities is
approximately the same across income levels. For instance, irrespective of level of
income people tend to spend approximately the same fraction of their income on housing,
food, services and other basic necessities. Through extensive economic research Cook
has ascertained that people spend approximately 5% of their income on apparel and
services. I hence surmised that approximately 3% of a person’s income would be focused
on services, a reasonable fraction of which would be spent on communication purposes,
as while not having given specific numbers, it is documented that people in the
106

developing world spend a greater fraction of their income on communication services
than their counterparts in the developed world. [ECON05b]
With knowledge in hand of the dollar amount people are able to spend on communication
services, data was then ascertained that indicated the cumulative population within the
demarcated region that would be able to afford a communication service priced within
this given 3% of income range. The red negatively sloping curve of Figure 3-5 is the
result of curve fitting which represents the cumulative population within the developing
world region against the fraction of GDP per capita spent on communication services.
Thus if an observer were to choose any x axis ‘GDP per capita spent on communication’
point, they would be able to map the number of people within the developing world that
would be able to afford a communication service priced at this amount. This is the
exponential fit to an analysis similar to Figure 2-9 which plots cumulative total
population in +/- 30° equatorial range with GDP/capita >= x, where x is the GDP/capita
of the countries within the given range. The difference is that for the data in this fit, x
represents GDP per capita spent on communications. The equation for this resulting
exponential fit of the data is
(3.2) ( ) xexf 01158.0450,704,148,4 −=
This fit has coefficients with 95% confidence bounds. Let a = 4.149e+009 and
let b = -0.01158 which are the two coefficients from equation 3.2 above. Within the
confidence bounds ‘a’ can vary between 4.005e+009 and 4.293e+009 and similarly ‘b’
can vary between -0.01229 and -0.01086. R square is a statistic that measures how
successful a fit is in explaining the variation of the data. The R square statistic was
computed for this analysis and is 0.9622 for this fit. It should be noted that R-square can
take on any value between 0 and 1, with a value closer to 1 indicating a better fit. For
example, the R2 value of 0.9622 in this case means that the fit explains 96.22% of the
total variation in the data about the average.
107

0 100 200 300 400 500 600 700 800 900
106
107
108
109
Num of users in the +/- 30 deg Range vs. Amt Spent on Communication Services
Communication Cost [US $ 2002]
Cum
ulat
ive
Num
of u
sers
with
in +
/- 30
deg
rees
latit
ude
rang
e Cost to user Capacity limit Log (fit)
System capacity limit
Affordability limit
Figure 3-5: Number of users in the +/-30° range vs. amount spent on communication
services
The x axis amounts in Figure 3-5 represent the cost per year for sending and receiving
text messages plus the cost of the paging end user terminal and a standard one time
activation fee. Note that an amortization schedule for the end user terminal has not been
built in, but due consideration should be given to this issue in future work.
The cost of the end user terminal is an important variable. To ensure an informed analysis
of what the price of the end user terminal should be, a database of terrestrial pagers
available in today’s market was assembled with relevant details about each pager device
recorded. The parameters recorded include the number of characters that can be sent in
one message, whether the pager is one-way or two-way, whether or not it has a keyboard,
its physical volume in inches cubed and its memory capacity. An end user terminal
module was then subsequently defined and incorporated within the satellite simulation.
This end user terminal module allows a system designer to define his or her ideal pager
108
characteristics and obtain the estimated cost and one time activation fee that such a pager
would merit in US 2002 dollars. The suite of characteristics decided upon for the end user
terminal for the proposed satellite system is a pager that can send messages with up to
100 characters, (note that for such an end user terminal it would still be possible to send
an SMS of the average 160 character length, it would just be broken up into two
messages. Hence for a pager such as this the user would be charged for sending a
“message” whenever up to 160 characters are sent to another user.) can send and receive
messages (i.e. is two-way), has a virtual keyboard that lets you type messages on the
screen, a volume of 1 – 4.9 inches cubed and a memory capacity that can store up to 5kb
of past sent and received messages. In general, these characteristics should be satisfactory
for the needs of the intended market group.
Averaged across many different types of pagers and system providers, such a pager as
described in the aforementioned paragraph would have a unit plus one time activation fee
cost of approximately $38.70. The calculations used to arrive at this cost along with a
more detailed description of the end user terminal module are elaborated upon in Section
B.9 of Appendix B. Another important parameter is the cost to send and receive
messages, this is an objective value resulting from the simulation and listed within Table
3.9 as the ‘cost per year’ parameter. The cost per year to send and receive messages is
based on an informed estimate of the number of messages that would be sent per day by
the average individual in the developing world. The ITU’s Portable Internet report details
that as at 2002, the Philippines held the world record for the highest amount of text
messages sent and received daily. Filipinos send and receive an average of 20 messages
per day. [ITU04] With 20 messages per day as the upper bound I surmised that a nominal
value of 10 messages sent and received per day was a conservative nominal estimate for
the activity level of the average potential users of the proposed paging system. At this
activity level, the cost per year to send and receive 10 messages per day ranges between
$0.44/year and $387.94/year as illustrated in Table 3.9. Note that these values do not
include a profit, thus each respective operator would add his or her desired profit margin.
109

The value for the cost per year to send and receive messages is added to the cost of the
end user terminal to provide the minimum cost to the user for utilization of the service.
The green vertical line in Figure 3-5 represents the value of the sum of both the cost of
the described two-way pager plus the cost per year to send and receive messages for the
Pareto architecture chosen to be most efficient. Figure 3-5 illustrates that if there were no
limiting capacity constraints, at this cost approximately 2.75 billion of the 3.3 billion
people in this developing world region would be able to afford the service.
The third line within Figure 3-5 represents the maximum number of subscribers of the
most ‘ideal’ Pareto architecture filtered from the simulation’s resulting Pareto front. The
number of subscribers parameter is calculated from the capacity of the system. For this
analysis the most ‘ideal’ Pareto architecture could support a subscriber base of
81,259,200 million subscribers where this value represents the number of subscribers
limit for this SMS based system as indicated in Figure 3-5. Section B.10 of Appendix B
contains a detailed description of how this 81,259,200 million subscribers value was
calculated. To inform the selection of the most ideal architectures, the objective values
most applicable to the needs of the developing world were analyzed. As such, the LCC,
capacity and cost per year to the consumer for both utilizing the service and purchasing
the end user terminal were compared to choose the most ‘efficient’ systems.
The cost per year for use of the paging service is a parameter derived from the
multiplication of the cost per message parameter (which is an objective variable resulting
from the simulation), the number of messages sent per day and the number of days in a
year. From Table 3.9, design number 8 was chosen as the most ‘ideal’ system. This
system provided the best ratio between LCC and total number of subscribers served as
can be seen by comparison against the other Pareto designs in Table 3.9. This design was
also the one with the highest capacity and lowest LCC among the Pareto designs in
Figure 3-4. For systems such as this Pareto design number 8, the information for which is
repeated in Table 3.11, compared to the cost of the end user terminal (i.e. $38.70) the cost
per year for sending and receiving messages ($1.03 for design number 8) proved
110

negligible. Hence, efforts of design for affordability should focus on the design of cheap
satellite end user terminals.
Design Number
(from Table 3.9)
Total Number of
Subscribers (-)
Cost per year for
use of Paging
Service (US $)
LCC (US billion
dollars)
8 81,259,200 $1.03 0.58
Table 3.11: The most efficient system filtered from the Pareto Optimal Designs
The implications of the information shared by the three lines plotted within Figure 3-5 are
elaborated upon in the next section. Post processing can also include sensitivity and
uncertainty analysis and this is recommended for future work to gain a greater
understanding of the Pareto designs and how changes in the design vectors affects the
behavior of the designs.
3.6 Implications of Results of System Architectural Trade
Space Exploration Figure 3-5 illustrates that with the currently available satellite communications
technology the number of subscribers parameter calculated for the most ‘ideal’ Pareto
architecture would serve 2.46% of the region (or 81,259,200 persons) with a cost to the
user of approximately $345 per year. Thus while in its current instantiation the proposed
system would not address a significant proportion of the defined developing world
population, the proposed system could deliver affordable connectivity for small
developing countries and populations in abject poverty with no alternate means of
communication. Also as seen in Table 3.11, the LCC of this proposed system would be
580 million US dollars which is orders smaller than the LCC of existing satellite systems
such as Iridium and Globalstar which are on the order of 3 to 6 billion dollars. This is a
positive move in the path towards design for affordability.
111

Hence the analysis carried out in the trade space exploration process indicates that given
what people can afford, the simulation’s resulting Pareto optimal architecture has
constraints on capacity and subsequent number of subscribers that would render the
proposed system out of the price range of the majority of inhabitants within the
developing world. Hence the constraint on number of subscribers for the proposed system
does not match the demand of those within least developed regions within the demarcated
equatorial zone, generally speaking.
In order to have a system such as the suggested one be feasible to a larger fraction of
people within the demarcated zone, satellite engineers need to develop a system that can
facilitate higher capacities at lower costs. Otherwise systems such as these will never
realize their possible potential to render connectivity to those who stand to benefit the
most from the delivered applications. The level of current technical ability within the
satellite industry to provide low cost and reasonable capacity satellite systems is still
worthy of sufficient additional research and development. This is not to undermine the
connectivity that the proposed system has been shown to be able to deliver, but this
analysis shows precisely that a serious commitment to design for affordability from the
satellite community is imperative and needed to bridge the digital divide.
In 1988 dollars, for $1000 or less, Orbcomm offered a communication device that offered
GPS signals with a short data messaging capability, allowing a customer to transmit
location and a message from any location on earth. [JAF88] Compounded by the effects
of inflation over the now 17 years since 1988, such a cost for an end user terminal is
unambiguously out of the reach of the average person in the developing world. Hence
there is a very real need for research to also surround the development of affordable end
user terminals which would ideally rely on renewable energy as a power source.
Renewable energy for end user terminal units should also be a strong area of research and
development as access to electricity is often unavailable in the regions of concern.
Research and development should also surround the manufacture of alternative
keyboard/icon concepts for end user terminals for the illiterate, along with research on
how these end user terminals can be made as sturdy as possible to withstand harsh
112

environmental conditions such as rain, sand and other conditions common to the
demarcated equatorial band.
113

114

Chapter 4
Re-engineering the Policy Framework of
Satellite Systems In the multifaceted arena that is satellite communications, a revolution in engineering
design in which system designers design primarily for affordability is a necessary but
insufficient requirement to realize the potential satellite communications technology has
to provide a low cost means for realizing telecommunication services. In order to realize
the objective of the fulfilling of public sector objectives through widening access to
information and communication technologies, reducing costs associated with the policy
and regulatory realm is also an absolute necessity. These costs take the form of economic,
time related and productivity/potential reducing costs.
Reducing costs that arise specifically because of the nature of current national regulation
is unlike the technical recommendations of Chapter 3, within current reach of the
Administrations of many countries within the developing world. Lower regulatory and
policy related costs will increase the affordability and hence tangibility of satellite based
social services for the most needy. Another effect of lowered costs is that sales would
also increase which would result in increased user volumes and hence greater economies
of scale. This would then subsequently lead to additional cost reductions. Hence the
possible effect of ‘re-engineering’ the policy and regulatory framework of satellite
systems is not to be undermined and would have a significant positive impact on the
satellite industry.
In the early 1960s the USA through the Communications Satellite Corporation
(COMSAT), formed as a result of the Communications Satellite Act of 1962, [DJW]
established the need for a public monopoly organization for the provision of basic
telecommunications services using advancements in satellite technology which were
115

taking place at the time. [BN94] This was the motivation behind the creation of the
INTELSAT international organization. At that time, administering telecommunications
via a monopoly structure made sense as there was a vision of a globally unified system
wherein a single system such as INTELSAT serves society’s needs. This philosophy of
approach stemmed from the combination of high infrastructure costs, network
harmonization requirements and the requirement to provide universal service, all factors
which led to telecommunications becoming a natural monopoly. [ST94] In this setting
regulation was simply a matter of taxing generous profits and enforcing universal service
obligations. [ITUD04]
However, today, more than 40 years since the catalytic changes of the early 60’s, the
satellite industry’s policy and regulatory climate has taken on an entirely different
character. The Policy structure has now made encouraging changes in tide towards
liberalization and commercialization in satellite services and applications, first in
developed countries and hopefully with time in developing countries also.
Consequently, it is important to now take stock and ask questions such as: what is the
nature of the current policy and regulatory framework? Is it valid to assume that the
models which were built up around telecommunications monopolies and unified global
systems are no longer valid frameworks for the new millennium? Is the current
framework possibly influencing satellite systems being out of reach for the developing
world? What aspects of that framework are obstacles to the growth of satellite
communications for the developing world? What policy changes need to be made and
what are the best new national, regional and global processes and mechanisms for
regulating satellite communications to affect long term sustainable development? How
can concerned administrations encourage the widening of the scope of possible
communication satellite applications to realms such as telemedicine and tele-education?
These key questions related to the policy structure of satellite systems are addressed in
the sections below.
116

4.1 Current Policy Framework of Satellite Communication
Systems for the Developing World Today, “the rules and procedures that make up the world of satellite communications are
in the midst of change and even turmoil.” [JP04] The rules that worked for the satellite
industry in the past when telecommunications was squarely in the hands of state-owned
monopolies are not the rules that will affect productivity today. During the 1980s the
satellite communications industry experienced significant change. There were certain key
forces that led to this change. The efforts within the United Sates government and private
sector to engender competition and deregulation of the US telecommunications industry
was one significant marker along the path of change and an important instigator of
liberalization in the international policy framework of satellite systems. Another key step
in this liberalization process was the move toward specialization in terms of high
powered satellite systems with consequent lower cost demands on the ground from earth
stations. The emergence of the regionalization of satellite systems (i.e. ‘region’ specific
systems such as PanAmSat and Arabsat) also played a role in loosening the tight grip of a
unified monopolistic approach to the regulation of satellite systems. Specialization also
came in the form of the establishment of fixed, mobile, broadcast and radio determination
services, these types of specialization were also key forces of change that occurred in the
1980s. [JP04]
As a result of these pioneers who facilitated this movement towards liberalization and
competition in satellite services, the current regulatory and policy schema is one in which
there is encouraging competition spreading into regions like Asia, Latin America, Africa
and other traditionally developing regions. [ITUD04] Administrations within these
countries are able to model their competitive frameworks from best practices learnt from
the pioneers. However these changes in the policy framework have brought about new
challenges and opportunities which undoubtedly require a review of the policy and
regulatory framework that dictates the future direction of satellite technology.
117

Across the span there are now numerous varieties in how the satellite industry is
regulated, as a result of the emergence of competition. It was stated earlier that across the
globe, a wide variety of satellite regulatory schemas exist, this is because in some
sovereign states a monopolistic framework still reigns true while in others there is fully
operational competition with no unnecessary regulatory obstacles to new market
entrants. Hence for the up and coming network operator it is necessary to contend with
license requirements and procedures that may change considerably from country to
country. Needless to say, this weighs heavily on resources of time, productivity and
money.
There are encouraging signs however, the UK and Australia have successfully
implemented regulatory agencies, the Office of Telecommunications (OFTEL) and the
Australian Telecommunications (AUSTEL) agencies respectively, which are designed for
open competition and which have already achieved measurable success. These are
smaller operations that operate on the ‘less is more’ paradigm when it comes to
regulation. To put in context, these organisations are about 25 times smaller than the FCC
in the United States. [JP04]
Hence the predominant paradigm of today’s policy and regulatory satellite
communications agenda is one of far sweeping competition and a realization that there is
a need to unify the regulatory standards across countries to harmonize standards as much
as possible. An attendant positive effect of the far sweeping liberalization is that
administrations in less developed countries are avoiding the need to have to agonize
through the same slow, difficult chronological policy and regulatory steps that North
Americans or Europeans went through. Instead, they are able to ‘leap frog’ traditional
evolutionary steps and are now spending their energies on building internationally
accepted principles and learning from success factors in the regulatory approaches
embraced by more mature regulators. Specific current debilitating problems in the policy
framework as concerns satellite communications for the developing world and attendant
strategies towards solutions will be outlined in the next sections.
118

4.2 Is Current Framework Possibly Influencing
‘Intangibility’ of Satellite Systems for the Developing
World? The above discussion demonstrates that the old policy and regulatory models no longer
apply today. And as in any other sector, once the rules of operation have changed, new
tactics are needed to be effective. But how, if any at all, is the current framework acting
in a debilitating manner as concerns extending the reach of satellite communications
throughout the developing world? Firstly it must be noted that monetary assistance to aid
telecommunications development from the World Bank and other regional development
banks, INTELSAT, INMARSAT and other similar sources on average reduced in
constant dollars from the mid 80s to the mid 90s. [JP94] And with a depressed world
economy due to the terrorist attacks on the United States on September 11, 2001 and the
ensuing wars in Afghanistan and Iraq, there is not much reason to believe the support
would have increased appreciably at the turn of the 21st century.
To firstly set a context for the need to have the regulatory environment encourage
satellite communication proliferation in the developing world, consider that in many
developing countries, illiteracy rates are extremely high. In regions such as South and
West Asia, for instance, only 1 in 10 females from rural regions have basic literacy skills,
this is according to the Economic and Social commission for Asia and the Pacific region
(ESCAP). [ST94] Unfortunately in spite of these stark needs, most parts of developing
countries, especially rural regions, are still unabashedly cut off from existing national and
international telecommunication services. Furthermore unlike in developed countries,
terrestrial options are inadequate, extremely expensive and even sometimes non-existent,
leaving no viable telecommunication solution for business leaders and everyday people
within these regions.
In this process of the overhauling of the satellite communications sector from
monopolistic to liberalized there are many obstacles to the wide application of this
119

technology in developing regions. A knowledge gap which denies developing world
authorities the ability to evaluate the opportunities offered by evolving technological
advancement is one such obstacle. Also of concern are the existing inadequate financial
resources and often overly excessive regulatory constraints.
Additionally, the very fact that the industry is in flux is a hamper. The recent two large
LEO systems, Iridium and Globalstar, which were supposed to bridge the connectivity
gap and bring personal communication benefits among other connectivity benefits to the
globe turned out to be technological feats but economic failures. As such, the details of
what works within the new model of international satellite communication competition
and general operation is not yet very clear, even though billions of dollars have been
spent on solutions that should have worked. This makes it difficult to get an all
encompassing model for how to engender success in today’s policy and regulatory
climate. Furthermore, predicting future problems and trends in the field also becomes
difficult, which may result in the satellite industry being deemed too risky a venture for
resource strapped developing world countries. These factors play a strong role in the
‘intangibility’ of satellite communication systems.
4.3 What Specific Aspects of Current Telecommunication
Policy and the Regulatory Environment are acting as
Obstacles to Establishing the Proposed Satellite
System? By far, the most potent obstacle acting against the establishment of the proposed satellite
system for the developing world is system cost. With regards to technical considerations,
after implementing the satellite simulation of Chapter 3, recommendations were made for
steps that should be taken by the satellite communications industry to design for
affordability when envisioning future systems. However, as alluded to earlier, the
problem does not solely lie in the technological realm, there are certain existing policy
120

and regulatory standards which if not changed will render any possible technical design
related cost reductions in satellite system design futile.
Reducing regulatory and policy related burdens so that those who wish to establish
satellite businesses can have a realistic prospect of seizing commercial opportunities
while also realizing public policy objectives is an objective that must be met with utmost
urgency. It is reasonable to proffer that many opportunities may have already been lost to
strengthen the link between the potential and current reach of satellite technology because
of overburdening and unnecessary regulatory constraints. The following is a brief
discussion of specific present policy and regulatory related constructs which are obstacles
to establishing satellite systems within the developing world.
4.3.1 Harsh Regulatory Environment
Numerous telecommunications regulatory bodies today are subject to micro managing
political interference, exacerbated by the fact that these same political institutions
oftentimes also fund the regulatory organizations and this thus makes it difficult for the
regulatory bodies to advocate for reduced political interference. Additionally, poor
management and inefficient use of resources are also problems which plague the
regulatory administrations within many developed and developing countries. Furthermore
often to their own peril, many countries impose limits on the use of foreign mobile
satellite terminals. It does not take much thought to realize that such a regulation hinders
potential users from being able to reap the immense benefits of mobile satellite
communications. [ST04]
Harmonized regulatory structures are of key importance from the viewpoint of satellite
operators because of the extensive coverage area of satellite systems. By definition the
services that satellite operators provide are often on a multi-regional scale which
underscores the need for regulatory harmonization. Satellite operators thus depend on
authorizations and spectrum allocations in each country in its coverage zone. If these
authorizations take great pains to obtain, especially in a liberalized setting with many
121

providers, then the prospects of realizing the benefits of satellite services would be
severely retarded.
4.3.2 Dearth in Knowledge of Benefits of Satellite Technology
There is lack of knowledge and general awareness of the vast potential of satellite
communications technology to act as a development enabling tool across a variety of
public sector goals. Domestic education policies need to surround incorporation of
teaching about the general benefits of information and communication technologies so
that the proletariat will be convinced of the need to support and facilitate efforts to
incorporate ICTs in their local agenda. Raising awareness levels across the private sector
would also be beneficial as many private sector leaders do not even engage in meaningful
discussions about the need to invest in satellite technologies for the developing world, as
it is written off as extremely capital intensive and has been thus relegated to the public
sector only. However private sector investment is critical to the sustained development of
satellite communication technology.
4.3.3 Discriminatory Cost of Space Segment Access
Unfortunately, numerous regulatory bodies and many international satellite organizations
(ISOs) use the satellite regulatory process primarily as a revenue generating mechanism.
For instance, Signatories of the ISOs administer costly mark ups on their customers for
access to the space segment they have governance over. This is counterproductive and
goes against proclaimed intentions by these ISOs to propel the growth of the satellite
communication industry. Furthermore, economic analysis shows that it is the consumer
who ultimately bears the brunt of such fees and hence such costs translate to an additional
tax on the already burdened consumer. Inordinate license fees imposed on satellite
system operators are another way in which the current regulatory regime is acting as an
obstacle to the growth of satellite systems for the developing world.
122

4.3.4 Rapid Technological Advancement
Rapid technological advancement presents real problems for the developing world as
technologies that developing world make real efforts to incorporate into their national
agenda are often not developed with the context of the developing world in mind. Hence
there is a perpetual ‘catching up game’ that has to be played to reconstruct the technology
in question to the needs of the populace. However if and when this is successfully
accomplished there is normally another headlining technology about to come on stream
that has the potential to leap frog the country to a greater stage of development. Hence
speedy technological development presents a challenge to developing countries’ abilities
to adequately respond to these new changes. Some of the challenges are ensuring the
right environment and developing applications that are in tune with the specific needs of
the countries.
4.3.5 Conflicts of Interests
There is often times a conflict of interest caused by the fact that the owners and
shareholders of the satellite systems, i.e. the Signatories, in many cases are also the ones
promoting their own governmental systems which they may view as being in competition
with many satellite systems’ applications. Additionally, as at the mid-90s the major
satellite systems (i.e. INMARSAT, INTELSAT AND EUTELSAT) had provisions for
only one Signatory per member country. However in an era of increased liberalization,
this provided for the difficult situation in which Signatories are empowered to allocate
space segment capacity to national operators with whom they were in competition.
Furthermore, with respect to EUTELSAT specifically, the Signatories’ investment share
in EUTELSAT is calculated as proportional to the country’s total utilization of the space
segment, however this total utilization parameter includes that of the Signatory’s national
competitors that share the system. [BN04]
123

4.3.6 International Administrations’ Lack of Institutionalized
Policies for Regulatory Infractions
Quite against what is allowed, China in the past launched a satellite called APSTAR 1
into the unregistered position of 131 degrees east which represented a new found problem
for the ITU as the organization had no sanctions or tools to address this infraction. [JP04]
Another troublesome infraction came in the form of Tongsat, the Friendly Islands
Satellite Communication Company of the Kingdom of Tonga, “selling off orbital
locations and filing ‘copy cat’ versions of satellite systems as they are presented to their
national government.” [JP04] At the time this infraction was a major source of concern to
international regulatory agencies.
Pacific Star Communications, Incorporated (“PacStar”), a US based communications
firm also caused concern and illustrated the need for greater policing when they
attempted to establish satellite systems under a “flag of convenience” approach to enable
them to gain rights to a convenient and low cost orbital assignment. [JP04] It is not to be
believed that this problem of faulty governance is unique to the ITU or as a result of the
lackadaisical implementation of their statutes. It turns out that similar to the ITU, the
raison d'être for international satellite organisations such as INTELSAT and INMARSAT
once included acting as a quasi-official standards making body for modulation
techniques, error control and earth station characteristics. However a fate similar to that
of the ITU befell them as the authority and global consensus potential of these
organisations have eroded extensively.
These observations of the above paragraph underscore the fact that these institutions were
created with a set of assumptions about how telecommunications in general and satellites
in particular would best be regulated; and now the industry is operating under a different
set of rules which render the original assumptions null and void. It is this mismatch in
the world these organisations were premised on and the world that exists today that can
act as an obstacle to the establishment and sustainable development of satellite systems
under today’s rules of operation.
124
4.3.7 Agencies Not Structured to Meet Today’s Policy and
Regulatory Challenges
At the root of the problem elaborated upon in the section preceding this one is the fact
that many of the national and international units which are regulating and defining the
policy environment for satellite communications were envisioned and structured when
monopoly control was the order of the day. In the policy regime under which these
organisations were formed, the telecommunications monopoly established the industry
standards, set tariffs, and planned systems which were then ratified, regulated or
controlled by the government. Often the regulating body was the Ministry of
Communications or a similar authority which in effect resulted in the agency supervising
itself. The possible problems associated with an administration reporting to and policing
itself should be clear, but in addition these institutions are not well equipped to deal with
an open competitive environment with ever advancing technologies and the need for
ingenious tariffing and standards policies that can mean the difference between success
and failure in today’s marketplace. The “re-engineering” of the policy framework that
needs to occur to enable these policy setting organisations to be effective and to facilitate
the growth of sustained growth of satellite communications is elaborated upon in the next
section.
4.4 What Policy Changes Need to be Made to Affect
Sustainable Development in Regard to Satellite
Systems (especially those Catered to the Needs of
the Developing World)? The World Bank’s Information for Development international consortium wrote in early
2005 that “In the past few years, Information and Communication Technologies (ICT) for
development initiatives have proliferated. Yet, rigorous field-tested knowledge about
“what works and why” in ICT for development, and a deeper understanding of the
enabling conditions and success factors in ICT-for-development initiatives, have been
125

relatively scarce.” [INFOD] This is especially true as it concerns the potential of satellite
communications to bridge the digital divide. By and large satellite operators have not
been enlightened as to the power of the development enhancing tool that is satellite
communications.
There is a growing consensus in the development community that ICT can only become
an effective and mainstream tool of poverty reduction and sustainable development if the
supporters of ICT-for-development can provide more rigorous evidence, strategies,
benchmarks, indicators, and good practices that are directly relevant to the core poverty-
reduction and development priorities of developing countries. The literature search I
conducted demonstrated a significant lacking in quantified rigorous support of the
feasibility and tangibility of satellite communication systems catered exclusively to the
developing world. The developing world has a strong role to play in bringing this
information to the masses. Until such evidence and information becomes available
satellite operators and possible investors will not be convinced of the tangible benefits of
directing their efforts towards fulfilling public policy objectives.
For all the potential that satellite communications harbors to ‘leap frog’ many countries
from the negative ramifications of poverty and effect sustainable development, I have not
seen a commitment from the international administrative agencies to encourage current
and future providers to assist in bridging the digital divide. With the licensing and
spectrum authorizing power that these organizations have, steps could be made to
incorporate incentives to providers who show a demonstrated commitment to realizing
social needs across the world’s poorest countries. Whether it is an increased probability
of obtaining a license, increased license times or reduced licensing fees, there are a
wealth of creative incentives that could be implemented to effect a solid commitment
from the satellite communications industry to exploit the significant development
promoting power the technology has. History has shown us that we cannot depend on
altruism alone.
126

Additionally, in regards to the concern raised in the previous section that the ITU, among
other international agencies, does not have stringent enough policies in place to deal with
infractions, a restructuring and re-definition of the role of the ITU to establish clear and
enforceable standards is in order. Currently, ITU standards are expressed as
‘recommendations,’ however in a setting where systems are vigorously vying to be
established in a timely manner such ‘recommendations’ can lead to intersystem
coordination processes taking years to resolve and this is unacceptable. Like the recently
formed new age regulatory agencies OFTEL and AUSTEL, we need agencies that do
more ‘policing’ than ‘recommending’ to avoid the time burden and the type of infractions
detailed in Section 4.3. The first step to realize such an ambition would be to empower
international organizations to be able to fine both governments and corporations that do
not operate within the letter of established rules and procedures concerning the use of
orbital space, frequency allocations, interference abatement methods and fair methods of
competition.
Moving from the ITU to commercial based international satellite organizations, these
ISOs have to be called to enact serious policy changes to affect the sustainable
development of the satellite industry. For space communications there is a need to adjust
to the new environment which means privatization of their capital forming structure,
enabling direct competitive access to their space segment for all services (not just popular
tried and true ones such as VSATs and DirectTV), and greater elasticity in the tariff
setting process to reflect market scenario and costs. [JP04]
Mention was made earlier of OFTEL and AUSTEL as two examples of the new breed of
regulatory agencies which have made successful strides to adapt to the new policy
framework of communication systems. Unlike their predecessors, these agencies have not
made it their mission to monitor ever tariff, service, and application within their domestic
communication realm, but rather they work to expose any unfair or inequitable
competition or infractions in their country’s open access to the network. Infractions
reported by customers, service providers or other stakeholders are duly investigated and
serious penalties administered where infractions are confirmed. Penalties can comprise of
127

fines in the millions of dollars or limiting the market access of the perpetrators. Pelton
informs us that to date the evidence has shown that these agencies are succeeding at
enforcing an equitable operating base. [JP04] The key point for other regulators to
internalize is that an agency designed to keep watch over a competitive environment
would operate differently than an agency designed to ensure that a monopoly does its job
well.
Thus with regards to the serious violations mentioned in the previous section, the
feasibility of International Trade Organizations or the ITU itself being authorized to
penalize organizations and governments that violate the guidelines and procedures for
international satellite communications is an urgently policy direction that must be
pursued.
Increased private sector participation is vital to the sustainable development of satellite
systems. In developed countries there are solid examples of private sector operators who
have been key players in efforts to achieve universal service in their home countries.
These investors would be willing to invest in the great potential that exists within
developing countries; the investment climate has to be attractive however. Thus
developing countries’ private and public sectors must do all they can to weed out top
level corruption and other investment hindering forces. Such actions would then create a
setting that can attract private sector investment from operators who have successfully
implemented public policy objectives elsewhere. As an example of the private sector
getting involved, in Thailand, educational television services by satellite are provided
through a joint initiative between the Ministry of Education and the private sector.
[ST04] More and more, public-private sector partnerships are emerging as feasible means
by which to enact telecommunications development.
The high cost of obtaining operations licenses and other regulatory necessities was raised
in Section 4.3 as one of the lead obstacles in the path of establishing satellite systems for
the developing world. Hence due consideration and efforts must be put in place to reduce
barriers to entry for satellite communication operators who seek to enter the satellite
128

market. The goal of universal service, especially to rural and remote areas must always be
the yard stick against which regulators measure when making licensing decisions. It goes
without saying however that it is important that appropriate conditions are met and
sustainable viability proven before licensing is granted.
Another important change that must occur is a move from viewing satellite technology as
a competitor to terrestrial systems. Still today many governments view this technology as
a threat to the terrestrial systems they have invested in heavily. This thesis thus seeks to
illustrate that satellite technology should be viewed as an enabler of development for
regions that terrestrial telecommunications has not yet been able to service. Section 2.3
illustrated that for rural regions without the existing infrastructure to enable the
development of wired communications, and for which the implementation of such wired
infrastructure is often impractical due to costing, time of implementation and difficult
terrain, satellite systems offer real cost advantages over terrestrial mobile systems. In
contrast to satellite systems which are not dependent on the density of their regions of
coverage, the cost per user of terrestrial systems is adversely affected by the spatial
layout of the traditional low population densities of rural regions.
Even for regions currently served by telecommunications services, governments and
other decision makers should be made to see that satellite technology can also deliver
certain social services such as telemedicine, tele-education and disaster relief at a rate and
to a coverage area that terrestrial communications cannot currently measure up to. As
such, satellite communications should be viewed as a necessary aspect of the solution to
the digital divide conundrum with efforts being made to have this technology work in a
symbiotic relationship with terrestrial telecommunications technology rather than as a
competitor.
As an example, developments in satellite technology have brought about the growth of
VSAT systems. Unfortunately the growth of these inexpensive and high potential
systems has been hindered by restrictive regulations in many developing countries.
[ST04] Taylor informs that this is mainly due to there being a perception that VSATs
129

compete directly with the mainly terrestrial, telecommunications infrastructure present in
these countries. Many countries are also wary of the security concerns that the
introduction of such systems, often from foreign providers, introduce. However if this
technology is to be allowed to take its rightful place amongst the ranks of development
enablers, the appropriate facilitating framework must be established. One avenue to
pursue is the creation of licensing procedures and type approval to ensure the necessary
safeguards for these new emerging technologies. At the same time, in order to be granted
a license these operators should not be allowed to focus exclusively on the top niche
markets in the developing countries they seek to serve.
Yet another debilitating obstacle mentioned in section 4.3 is that of the nature of the ISOs
Signatory function and conflicts of interest that may arise. This goes hand in hand with
the limitations in direct access to space being experienced by satellite operators. As the
previous section detailed, the problem arises from the basic Agreement establishing the
ISOs in which signatory Parties are required to appoint a Signatory, usually the public
telecommunications operator, as the sole provider of space segment capacity in their
country. The Agreement dictated that all requests for space segment capacity come
through the Signatory. While this would have been appropriate in a monopolistic schema,
in a competitive environment this arrangement could raise serious conflicts of interest.
The crux of the problem being that the Signatory is empowered to determine the cost of
access to the space segment for its competitors. This is the primary reason why there have
been lobbies for direct access to space segment by satellite system operators. There has
also been an encouraging strong push by satellite operators to be able to approach any
space segment provider for their requirements. While there have been some encouraging
developments in this regard, all ISOs must seek to comprehensively address these
concerns.
Let us now take our assessment of needed policy changes to the regional level. On the
wider regional level, cross country cooperation is a must if the potential of space
communications is to be realized in developing countries. This cooperation should focus
on, amongst other things making the technology affordable and relevant for the neediest
130

amongst us. A model example is the agreement arrived at in Beijing China in September
2004 wherein Ministers of the Asian and Pacific region agreed on a regional strategy for
cooperation in space applications for sustainable development. [ST04] Key aspects of
the adopted policy include the pooling of resources, the integration of space applications
in the development planning stage, and the creation of international networks to raise
awareness amongst the proletariat in their regions of the potential benefits of satellite
technology. In this age of mobile satellite systems which depend on global and regional
harmonization for their commercial viability, this is a sterling example of a group of
nations committing to regional cooperation and its attendant benefits.
In summary, the overriding theme from the above discussion is that satellite regulators
must seek to do only that which is truly and minimally necessary to serve their purpose.
In so doing here are five guiding points provided by a recently issued ITU regulatory
report entitled: Report on Satellite Regulation in Developing Countries [ITUD04], which
all policy and regulation setting bodies would do well to incorporate:
a) Uncomplicate the regulatory process. For instance, if there is no need to
differentiate between domestic and international satellite services then do not do
so.
b) Regularly review the current regulatory and policy framework to ensure it
matches the present context. Be aware that the regulatory framework in place
today may be defunct in five years time.
c) Be extremely aware of hidden costs – especially time. Regulatory structures that
are unnecessarily complex hurt operators the most with regards to time.
d) Resist the temptation to use the regulatory purpose for purposes other than
regulation. The most specific concern here is its use for revenue generation.
e) Create through the medium of the worldwide web for example, a nearly
immediate, inexpensive and transparent public platform from where access to
each Administration’s satellite regulations is provided. Not only would this attract
investment but it would also reduce the Administrations’ administrative burden.
131

4.5 How Can Involved Stakeholders Encourage the
Widening of the Scope of Possible Satellite
Communications Applications? Given that the existing cost structures of current ISOs are a significant hamper to basic
communications applications reaching the disenfranchised, then one can imagine that
sophisticated applications such as telemedicine and tele-education are even further out of
reach. However compared to any other time in history the satellite communication sector
is better equipped today than it ever was to meet this challenge of the widening of the
scope of its applications. Certainly all the strategies mentioned in section 4.4 hold,
however, there are a few other strategies and information specifically catered to
encouraging the widening of the scope of applications to meet public policy objectives
that should be illuminated.
The ITU’s regulatory report [ITUD04] informs that revenues from satellite
manufacturing services, launch, and ground equipment have demonstrated unwavering
growth from 1996 to 2003. This growth which is estimated to have reached US 91 billion
dollars in revenue in 2003 is progressing faster than most other industry sectors, even
more than many other successful sectors in the communications industry in general.
Furthermore, it is in the area of satellite services that the most impressive growth has
been recorded. The latest Figures project global revenues of the satellite industry to top
US 94.7 billion dollars in 2004 and to total as much as 127.2 billion dollars by 2010.
[ITUD04]
Some fraction of this appreciable revenue generated by the satellite industry should go to
research and development directed towards increasing access to telecommunications
services throughout the world via widening the scope of applications which bring needed
social services to areas currently suffering from a dearth of such services. Such actions
would benefit all stakeholders as in today’s connected global village where actions in one
region have direct reactions and consequences in other regions, we can no longer
continue to differentiate the plight of the world’s poor from the world’s global plight.
132

Fundamentally, real improvements in the economic, educational and health standards of
the world’s marginalized, filtrates into an increase in social equity and basic security for
us all.
There have been positive recent signs that the satellite industry is embracing the need to
create a more favorable regulatory framework which could eventually lead to the
widening of the scope of satellite applications. A recent global survey on satellite
regulation in developing countries compiled by the ITU in their 2004 regulatory report
[ITUD04] confirms that administrators are moving towards a host of regulatory
directions designed to enhance competitiveness. Some of the initiatives confirmed by the
survey to already be in place in some regions are:
• “Open Skies” or less cumbersome requirements that have to be met in order for the
landing of foreign satellite services to be permitted
• A relaxation by domestic administrations of the regulatory stronghold governing
satellite-based service provision, which might eventually spill over into the
international arena
• Greater use of mobile satellite terminals
• Relaxation of the obligation to provide local satellite infrastructure (where local
satellite architecture refers to the creation of a hub or teleport as a licensing condition
for networks) and
• Reducing disconnects in satellite regulations within regional and sub-regional groups
Lastly, for individuals such as myself who see promise in establishing new satellite
communications systems specifically catered to the developing world it is of utmost
importance that the legal and regulatory climate does not discriminate in favor of existing
service providers, or otherwise restrict the number of independent service providers that
are allowed to provide satellite services to the populace. The literature search in this area
has given me reason to believe that such discrimination against ‘new-comers’ has existed
in the past. Discrimination of this form makes little sense because as in other industries,
strong competition between a large number of service providers promotes investment in
133

infrastructure, provision of new services, improvements in service quality and the
ultimate benefit to the consumer of lower prices.
With the combination of the above recommendations and those of section 4.4, it is hoped
the way can be paved for the implementation of ingenious and needed applications
stemming out of satellite communications technology.
4.6 Summary Several questions were posed at the beginning of this policy analysis. One point to note
firstly is that while the many issues that were raised are certainly relevant to LEO
systems, there are still missing links in the satellite policy and regulatory framework
concerning how LEO systems such as that proposed in this thesis would specifically be
impacted by the current policy and regulatory climate. This analysis sought to make a
contribution to bridging that gap in the literature.
This analysis showed that the current regulatory framework is in flux with some national
telecommunications policy frameworks ranging from staunchly monopolistic to quite
liberal. There are now a few forward thinking administrations that do not oversee their
regulatory frameworks on the level of fine detail of their predecessor administrations but
rather apply a more ‘hands off’ mode of regulation commensurate with the increased
levels of competition in their countries. These liberalized administrations act more in a
‘policing’ role bringing punishing infringers, rather than in the more ‘micro management’
like model that was more common to the monopolistic schema.
It was shown that the current policy framework is undoubtedly influencing satellite
systems being out of reach for the developing world. Though there have been noteworthy
achievements, inequitable access to space segment and an underlying belief that mobile
satellite applications (such as that which would be produced by this proposed system) act
in competition rather than in a symbiotic relationship with existing traditional systems,
continue to be major blockades in the path of the development of LEO systems.
134

A demonstratable commitment to having the regulatory process not serve primarily as a
revenue generating mechanism along with specific strategies for opening up access to
space segment for potential satellite system operators are outlined among others as
changes that must occur in the regulatory and policy framework. Such changes would
help to ensure the long term sustainable development and would significantly aid in
realizing the potential of satellite communication systems.
135

136

Chapter 5
Conclusions and Recommendations for
Future Work
5.1 Summary of the Current Research The purpose of this research was to assess the technical, economic and policy-centered
feasibility of a proposed satellite communications system for the developing world. The
developing world being defined as the equatorial band of 30° north to 30° south latitude.
The research process was divided into three stages, each of which is summarized in the
sub-sections that follow.
5.1.1 Summary of Background Demographics Presentation and
Economic Analysis The first stage of this research involved the presentation of a comprehensive database of
the developing world which was assembled for the purposes of this research. Information
and local context was given for important factors relating to a country such as a concise
history, its geography, people, government, economy, communications, transportation,
religions, military and transnational issues. Using the information provided in the CIA
World Factbook [CIAWFB] an extensive database was put together to firstly get a
working definition of the developing world and then to explore other key aspects of the
developing world that would inform the development agenda of this thesis. A summary
of the world database is shown in Appendix A.
During this analysis, the framework and supporting data is provided to support the need
to ‘re-engineer’ satellite system design for affordability. The development goals of the
137
international development arena around information and communication technologies
(ICTs) in general are first presented to set a context for the analysis. Telecommunication
means that currently exist to provide connectivity are then explored along with a
discussion of the past and current commercial satellite system industry. Solid evidence of
the expanse of the digital divide which is largely based on an underlying income divide is
subsequently analyzed. The results and data presented provide a sound rationale for why
a ‘re-engineering of satellite system design for affordability’ revolution is necessary to
support efforts to bridge the digital divide.
5.1.2 Summary of Technical and Economic Feasibility Study The second stage of this research involved a formalized technical and economic
feasibility study which took the form of a comprehensive MATLAB based trade space
exploration. The first stage of this process was to implement a computer simulation
originally created by de Weck and Chang. [dWDC03a] This process consisted of the
following six steps:
1. Choose the elements and bounds of the architectural design space inputs which
include the design vector x, constant vector c, policy vector p, and requirement vector r;
and outputs that include the objective vector J, and benchmarking vector B.
2. Build the mapping matrix between inputs and outputs and subdivide the problem into
modules which match the system’s physical and functional characters. Define clear cut
interfaces between modules.
3. Implement and integrate the modules based on technological-physical, economic and
policy relationships such as constellation geometry, astrophysics, communication theory,
cost estimating relationships which implements the economic analysis and market
estimation. Implement the individual modules and test them in isolation from each other.
Then integrate the modules into an overall simulation.
138

4. Benchmark the simulation against the data of reference systems. Tune and refine the
simulation as necessary (Loop A in Figure 3-1).
5. Conduct a systematic trade space exploration using a full factorial run that covers the
entire possible range of design variables.
6. Identify and post-process the Pareto optimal set. If no acceptable Pareto optimal
solution is found, the design space needs to be modified (Loop B in Figure 3-1). Once the
Pareto optimal solutions are arrived at, extract a subset of Pareto optimal architectures
that are non-dominated for further study.
As a result of undertaking these 6 steps shown above a simulation for the proposed
satellite system was developed that had reasonable fidelity. A full factorial run produced
276 designs of which 16 were Pareto optimal. These Pareto designs were studied for their
technical and economic feasibility for the intended developing world market.
5.1.3 Summary of Policy-Centered Feasibility Study The final and third stage of the research involved assessing the ‘re-engineering’ that
needs to take place within the policy and regulatory framework of satellite
communications systems. In order to successfully affect the sustainable development of
satellite systems which can increase access to social needs, attention must be given not
only to changes that need to occur in the technical realm but also to changes that must
occur in the policy and regulatory realm. This is especially important given two reasons,
firstly, the policy framework is currently in a state of change needing new approaches to
keep it buoyant and relevant. Secondly, the long term feasibility of systems such as the
one proposed in this thesis can only be achieved if necessary changes are made in both
the technical and policy realms as successes in each realm independently are necessary
but insufficient aspects of the solution to bridging the digital divide. The necessary and
sufficient conditions to facilitate making real strides in addressing the problem of the
139

digital divide include, inter alia, technical, policy-related, economic and cultural
considerations.
Consequently, as concerns the policy realm, this stage of the research is where we pause
and take stock and ask questions such as: what is the nature of the current policy and
regulatory framework? Is it valid to assume that the models which were built up around
telecommunications monopolies and unified global systems are no longer valid
frameworks for the new millennium? Is the current framework possibly influencing
satellite systems being out of reach for the developing world? What aspects of that
framework are obstacles to the growth of satellite communications for the developing
world? What policy changes need to be made and what are the best new national,
regional and global processes and mechanisms for regulating satellite communications to
affect long term sustainable development? How can concerned administrations encourage
the widening of the scope of possible communication satellite applications to realms such
as telemedicine and tele-education? These key questions related to the policy structure of
satellite systems are addressed in the third stage of the research. The analysis points to an
urgent need to have the policy and regulatory framework be commensurate with the
present reality of the satellite industry.
5.2 Conclusions Given the research conducted in this thesis, the following conclusions can be drawn:
5.2.1 Demographic Background and Economic Analysis In summary, the data gleaned from the developing world database points to two major
conclusions. Firstly, a satellite system specifically developed to address the connectivity
inequities of the developing world as proposed in this thesis is an immediate and
extremely needed solution to a continuously exacerbating digital divide inequity.
Secondly, there are non-trivial economic inequities which underscore the fact that
developing world countries would be afforded enormous advantages through the
introduction of a communications medium that is not dependent on the country’s specific
140

infrastructural maturity state and which is affordable and applicable to extremely
marginalized communities. Hence the developing world has a yet untapped, immense
potential to be a bustling market base for well researched connectivity applications. With
informed hindsight on the part of system designers to ensure the satellite system’s
applications are not technologically overly elaborate and provide the needed connectivity
at minimum cost, this thesis’s proposed system would make significant inroads in
increasing access to many of the world’s most basic social needs.
Of particular note is the fact that as shown in Figure 2-9 and Figure 3-5, there is a
significant drop off in the number of people that would be able to afford a satellite system
when the price for the end user terminal plus service costs vary between $60 and $90 in
2002 US dollars. At a pricing of $60 approximately 2.3 billion people would be able to
afford the communication service while at a pricing of $90 only approximately 1.4 billion
people would be able to afford the service. Hence an increase of only $30 has caused a
sizeable shift in the number of people in the demarcated range that would be able to
afford a given service. This underscores the need for design for affordability in satellite
and end user terminal design.
The current satellite system industry is technologically mature but yet to make impressive
strides in the social good, policy and economic contexts. Satellite system design of the
future must be revolutionized such that system designers endeavor to design for a
multiobjective problem for which the objectives are:
• affordability for market bases most in need
• basic technical capability to carry out desired connectivity
• efficient design within current policy context
• adherence to the regulatory framework
• seamless incorporation (as is possible) within desired region/s of coverage’s already
existing mode/s of communication and lastly,
• design for sustainability of envisioned system
141

5.2.2 Need for Design for Flexibility Approach in Regard to Key
System Parameters The economic failure of Globalstar and Iridium is largely due to overestimation of the
intended market size for the two systems. It is important that when modeling important
parameters such as the number of users and the user activity level that extreme caution is
taken to design for flexibility should those estimations be off the mark. It is also
important that concerted efforts be made to consider competing technologies that may
sway some of the envisioned satellite system’s potential users once the system comes on
stream, which may be as much as a decade onwards from the design phase.
5.2.3 Modeling Complex Engineering Systems is Feasible and
Necessary This research has demonstrated that even for complex engineering systems with high
level economic analysis built in, system modeling utilizing a multiple modular
framework is feasible. Irrespective of certain simplifying assumptions as detailed in
Chapter 3, the system benchmarks reasonably with established satellite systems such as
Orbcomm in this case and is quite comprehensive. Successful implementation of the
system model lends to a platform from which a trade space exploration can be enacted
which results in insightful information about both the design space and costs to be
incurred for the envisioned system.
5.2.4 Cost Considerations – Important Design Objective Unlike the analysis carried out for previous major satellite systems, cost considerations,
more specifically life-cycle cost considerations, need to be integrated as a design
objective from the very outset of the design process. As Chang details, lack of
consideration for cost early in the design process could be the reason why some of
today’s real world systems are not Pareto optimal. The analysis he conducted illustrated
that the Pareto optimal designs for Globalstar and Iridium that have similar capacities to
the two systems, have costs around $2 billion dollars, in contrast to the $3.3 billion of
Globalstar or the $5.7 billion of Iridium. [DC04] Chang shares interesting insight when
142

he states that the tendency to not consider cost early in the design process could be a
ramification of the “spin off” model that characterized technological development in the
United States during the Cold War era. In the “spin off” model technologies were first
developed for defense purposes, and then subsequently transferred to the civilian
commercial market. The history of satellite systems supports this phenomenon as it is a
known fact that many of the civilian satellite technologies we enjoy today first premiered
as space technologies utilized in defense capacities.
Especially for systems such as the proposed satellite system, cost considerations need to
be integrated in the design process from the initial design phase. Affordability has to be
of primary concern in the design process. The way the satellite simulation in this analysis
goes about incorporating cost considerations is to make cost one of the dimensions in the
objective space, and thus the Pareto optimal designs in this objective space would have
optimized, inter alia, for cost as illustrated in Chapter 3 of this thesis.
5.2.5 Technical Changes Needed to Make Proposed System
Feasible With the currently available satellite communications technology the number of
subscribers that the simulation’s ‘ideal’ Pareto design would serve amounts to 2.46% of
the +/30° region (or 81,259,200 persons) at a cost to the user of approximately $345.
Thus while in its current instantiation the proposed system would not address a
significant proportion of the defined developing world population, for small developing
countries and populations in abject poverty with no alternate means of communication,
the proposed system could deliver affordable connectivity. Also as seen in Table 3.11 the
LCC of the Pareto architecture of the proposed system would be 580 million US dollars
which is orders smaller than the LCC of existing satellite systems such as Globalstar and
Iridium which were on the order of 3.3 to 5.7 billion dollars respectively. This is a
positive move in the path towards design for affordability.
Hence the analysis carried out in the trade space exploration process indicates that given
what people in the developing world region can afford, the simulation’s resulting systems
143

have constraints on capacity and subsequent number of subscribers that would render the
proposed system out of the price range of the majority of inhabitants within the
developing world. Hence, generally speaking, the constraint on number of subscribers for
the proposed system does not match the demand of those within least developed regions
within the demarcated equatorial zone.
In order to have a system such as the suggested one be feasible to a larger fraction of
people within the demarcated zone, satellite engineers need to develop a system that can
facilitate higher capacities at lower costs. Otherwise systems such as these will never
realize their full possible potential to render connectivity to those who stand to benefit the
most from the delivered applications. The level of current technical ability within the
satellite industry to provide low cost and reasonable capacity satellite systems is still
worthy of sufficient additional research and development. This is not to undermine the
connectivity that the proposed system has been shown to be able to deliver, but this
analysis shows precisely that a serious commitment to design for affordability from the
satellite community is imperative and needed to bridge the digital divide.
5.2.6 The Policy and Regulatory Framework of Satellite Systems If we are to meet the necessary call of realizing the full potential of satellite
communications technology, developing countries and ISOs must review their present
policy and regulatory frameworks to remove those constraints that create bottlenecks in
the full exploitation of satellite technology for development and are no longer relevant
given that the present policy framework has the industry moving beyond monopolies. A
minimalist regulatory structure should be enacted that does not micro manage the
industry and its newly liberalized scheme which involves numerous operators but rather
acts as a watch dog for infractions against set rules and policies. This will be to the
benefit of all involved stakeholders - the service providers, the equipment suppliers, and
most importantly the end user.
144

5.2.7 New Thought Structure Needed within Developing World to
Enact Economic Development Developing world leaders must ensure they are astutely aware of the fundamental
changes that are overtaking their regions as a consequence of economic globalization. Let
us take the Caribbean region for example. The World Bank [WBNK] recently issued a
timely report entitled: 'A Time to Choose: Caribbean Development in the 21st Century',
the report is based on a honest premise – for developing regions such as the Caribbean,
economically, things cannot remain the same.
As Jamaica’s leading newspaper, The Gleaner, states, “It (the report) proposes that the
region eschews the trade preferences that have been an economic crutch for the past 30
years. Despite their apparent advantages, these trade preferences have left the region with
a shrinking share of the European and North American markets. The bank sees benefits
from offshore education, health services and information and communication technology,
which it suggests are potentially strong areas of growth for the island states.
Getting regional leaders and policymakers to make a move along this path may not be so
easy. Ignoring the obvious - or not seeing it - in the changing economic paradigm, they
continue to determine economic growth by outdated measurements. In those areas in
which governments claim to have accepted the increasing economic value of information
and communication technology, there appears to be myopia and confusion. In Jamaica,
the technology minister, who once spoke of the need to create a computer literate and
technologically-advanced society, was silent when his colleague minister of finance made
the retrograde step on re-imposing a tax on computers.
The World Bank accepts that the new economic route for the region will not be easy. It
sees hurdles in sub-standard social services such as health and education, and the
increasing dead-weight of intractable unemployment. There is concern that fundamental
changes in economic policy could be hindered by repeated indications of petty
parochialism and nationalism that are blind to the impact on small economies of
economic globalization.
145

The global economy is changing rapidly and significantly. Caribbean economic minds
must start thinking out of the domestic box and combine their efforts to make beneficial
use of new challenges (such as the incorporation of information and communication
technologies), that bring new opportunities.” [JG05]
5.2.8 Role Satellite Communications Can Play in Development
Process New digital technology and explosions in multimedia and broadband services underscore
the immense potential satellite communications technology has to fulfill as yet unmet
development goals to a coverage area and within a time span as yet unrivalled by
terrestrial systems. In developing countries a necessity for socio-economic advancement
is integrated rural development. An essential requirement in this integration process is
communication infrastructure, within which satellite communications has a leading role
to play. The technology has the potential to leap frog marginalized regions many rungs
up the ladder of development and the international satellite community must capitalize on
this opportunity to better the plight of our fellow human beings.
It is important to remember however that ICTs can only be a useful enabler of
development if it is introduced in a meaningful, relevant and structured way. Without the
training of the target users, access to the technology in an appropriate context, a well-
organized plan for integration into the existing system (or plans for the reform of the
existing system), and a vision for the way forward, ICT will be just another missed
golden opportunity – which is too high a price to pay.
5.3 Recommendations for Future Work To continue to carry this necessary research forward, the following recommendations are
made for future work:
146
5.3.1 Fine Tune the Market Module Expressly for the Needs of the
Proposed SMS System The Market Module is a key module for the analysis in this thesis. It outputs the number
of subscribers provided by the satellite system per year, the total air time of the system,
and the total amount of data transmitted throughout the system’s lifetime. The inputs of
the module are, among others, the number of users supported per satellite, the Earth land
area and Earth surface area of the coverage area of the satellite system. To fine tune the
analysis further it would be best to obtain values specifically pertaining to the context of
a messaging system for the +/- 30° equatorial band, for the number of potential
subscribers to the system and the yearly increment of subscribers. The value used in the
thesis was a market researched value for the number of subscribers to low bandwidth
satellite systems (i.e, user data rates less than 50 kbps).
5.3.2 Refine the Design Space It would be of merit to conduct a trade space analysis with a greater number of values for
each design variable. This would facilitate a deeper understanding of the design space
and possibly provide further Pareto points for analysis. However, because the trade space
grows exponentially with the discretization, full factorial runs at high levels of
discretization of the design variables may be extremely computationally intensive. At
high levels of computational intensity, alternate optimization algorithms should be
utilized in the process of obtaining the optimal solutions.
5.3.3 Use of Additional Objectives to Measure Merit of Designs Within the research the “goodness” of each design is measured using the objective values
of life-cycle cost and system capacity. However additional objectives can and should be
used to ascertain which of the various resulting architectures are better than others. Total
lifetime data flow or system reliability (which would have to be modeled and
incorporated into the simulation) are examples of additional parameters that could be
used to measure the “goodness” of the system designs.
147

5.3.4 Conduct More Rigorous Economic Analysis Within the thesis, given the research conducted by Cook, [HC97] it was surmised that
approximately 3 percent of a person’s income would be focused on services, a reasonable
fraction of which would be spent on communication purposes. Further research should be
conducted to ascertain more decisive values for how much people in the developing
world spend on communications services, especially in light of how much current mobile
connectivity options are being embraced throughout the developing world.
5.3.5 Conduct Further Research Including Sensitivity and
Uncertainty Analysis on the Pareto Designs Sensitivity and Uncertainty analysis allows the system designer to gain an understanding
for how changes in the design variables affect the objective vectors and the degree to
which uncertainty perturbs the system. Further research in this regard should be carried
out on the Pareto designs.
5.3.6 Obtain More Detailed ‘Activity Per User’ Information for
SMS Applications During the simulation analysis, given information on maximum SMS usage across the
developing world today, it was surmised that a usage activity level of 10 messages sent
and received per day was a fair assumption. This assumption should be refined through
further detailed research into user messaging activity throughout the developing world.
5.3.7 Conduct Further Investigation on Pareto Font There are certain seemingly redundant Pareto front architectures being produced by the
simulation analysis as demonstrated in Figure 3-4 despite the use of a strong Pareto front
filter. Further research should be conducted to confirm the reason for the production of
these seemingly redundant Pareto designs since the strong Pareto front filter by all
accounts was used appropriately. I have investigated this matter but found no anomalies
that could have resulted in the production of extraneous designs. The further research in
148

this regard should be aimed at presenting a set of Pareto designs that are all valid and
which represent strongly non-dominated designs.
5.3.8 Develop Stakeholder Value Model It would be of extreme value to carry out a quantified stakeholder value model analysis.
This would be a dynamic analysis which would allow for a clear delineation of each
stakeholder’s needs and how these needs are being met. It also allows one to understand
how different stakeholders map to others and the incorporation of 360° mapping allows
for a comprehensive understanding of the system. Additionally, the process of the
quantification of the stakeholder value model enables comparisons between stakeholders
which may have once been obscure to be clearly identified and compared against others if
necessary.
5.3.9 Develop Precise Geographic Models of Connectivity Section 2.3 entails a discussion of the cost to provide connectivity in the capital of
countries vs. more rural areas within these countries for four sample countries exhibiting
different characteristics. The discussion was predicated on the stark change in population
density which occurs when one moves from the industrialized capital of a country to the
outlying rural regions. This stark change in population density often makes it
economically difficult to provide terrestrial connectivity services to rural and sparsely
connected populations. It would be of worth to develop geographic models of
connectivity for the exact layout of the population densities in countries within the
coverage area of the satellite system in order to analyze how this affects the cost of
providing terrestrial connectivity mediums vs. satellite based connectivity mediums. Any
differences in monolithic type country layouts vs. a group of islands (such as the
Philippine archipelago), as concerns geographic models of connectivity should be
researched and outlined.
149

150

Appendix A
Description of the World Database As detailed in Chapter 2, a world database was assembled using the CIA World Factbook
as an information resource. [CIAWFB] Pertinent information relating to this thesis was
gathered and stored in a number of tables. The main aims of gathering the information
were to firstly gain an in-depth knowledge of the demographics and significant defining
information about each country, especially those in the developing world. For any
researcher attempting to conduct an analysis of the impact information and
communication technologies can have on development, it is of fundamental importance
that time and energy be spent on getting to know the nuances of the area of focus well.
Some of the questions that should be asked are: what, if any, are the peculiar traits about
the developing world region? What is their economic stance in real dollars? How do they
measure up specifically with industrialized countries with regards to their
telecommunications sectors? How stable is their government and thus the prospects for
long term development, what are their main industries? Significant time was spent
gaining a familiarity with the answers to these questions. To further this end a global
survey was formulated and sent out to all of the ITU’s 189 member countries to attempt
to gain an intimate knowledge of the issues related to ICTs for developed and developing
countries from each country’s specific point of view. Appendix C discusses the result of
this effort in further detail.
The second goal of setting up this developing world database was to set the stage for the
feasibility study enacted in the thesis. It was desired to obtain, inter alia, an informed
definition of the developing world and a key analysis to aid this formulation would be to
see how GDP/Capita maps with the latitude and longitude of each country on a global
sphere. Analysis such as this shared some insights as detailed further in Chapter 2. Table
A.1 is an example of one of the many tables produced during the assemblage of the world
151

database. This table in particular details only the countries in the defined +/ 30°
developing world equatorial range and is ordered from 30° latitude south to 30° latitude
north. An extended version of this key table which included the expanse of the world’s
countries for which data is available was vital in the production of Figure 2-4 which
shows the results of mapping GDP/capita against latitude for 229 of the world’s countries
in 2002 US dollars. It was this analysis that led to the +/- 30° range being termed ‘the
developing world’ for the purposes of this thesis.
Country Lat (N+, S-) Long (W-,E+) Population GDP/Capita Chile -30 -71 15,498,930 10,000
Lesotho -29.5 28.5 2,207,954 2,450 South Africa -29 24 43,647,658 9,400
Australia -27 133 19,546,792 24,000 Swaziland
-26.5 31.5 1,123,605 4,200 Paraguay
-23 -58 5,884,491 4,600 Botswana
-22 24 1,591,232 7,800 Namibia -22 17 1,820,916 4,500
New Caledonia -21.5 165.5 207,858 15,000 Cook Islands -21.23 -159.77 20,811 5,000
Reunion -21.1 55.6 743,981 4,800 Mauritius -20.28 57.55 1,200,206 10,800
Madagascar -20 47 16,473,477 870 Tonga -20 -175 106,137 2,200
Zimbabwe -20 30 11,376,676 $2,450 Niue -19.03 -169.87 2,134 3,600
Mozambique -18.25 35 19,607,519 900 Fiji -18 175 856,346 5,200
Bolivia -17 -65 8,445,134 2,600 Vanuatu -16 167 196,178 1,300
Saint Helena -15.93 -5.7 7,317 2,500 French Polynesia -15 -140 257,847 5,000
Zambia -15 30 9,959,037 $870 American Samoa -14.33 -170 68,688 8,000
Samoa -13.58 -172.33 178,631 3,500 Malawi -13.5 34 10,701,824 660
Wallis and Futuna -13.3 -176.2 15,585 2,000 Mayotte -12.83 45.17 170,879 600 Angola -12.5 18.5 10,593,171 1,330
Comoros -12.17 44.25 614,382 710
152

Country Lat (N+, S-) Long (W-,E+) Population GDP/Capita Brazil -10 -55 176,029,560 7,400 Peru -10 -76 27,949,639 4,800
Tokelau -9 -172 1,431 1,000 East Timor -8.83 125.92 952,618 500
Solomon Islands -8 159 494,786 1,700 Tuvalu -8 178 11,146 1,100
Papua New Guinea -6 147 5,172,033 2,400 Tanzania -6 35 37,187,939 $610 Indonesia -5 120 231,328,092 3,000 Seychelles -4.58 55.67 80,098 7,600 Burundi -3.5 30 6,373,002 600 Ecuador -2 -77.5 13,447,494 3,000 Rwanda -2 30 7,398,074 1,000
Congo, Republic of the -1 15 2,958,448 900
Gabon -1 11.75 1,233,353 5,500 Nauru -0.53 166.92 12,329 5,000
Congo, Democratic Republic of the
0 25 55,225,478 590 Kenya 1 38 31,138,735 1,000
Sao Tome and Principe 1 7 170,372 1,200 Uganda 1 32 24,699,073 $1,200
Singapore 1.37 103.8 4,452,732 24,700 Kiribati 1.42 173 96,335 840
Equatorial Guinea 2 10 498,144 2,100 Malaysia 2.5 112.5 22,662,365 9,000 Maldives 3.25 73 320,165 3,870 Colombia 4 -72 41,008,227 6,300
French Guiana 4 -53 182,333 6,000 Suriname 4 -56 436,494 3,500
Brunei 4.5 114.67 350,898 18,000 Guyana 5 -59 698,209 3,600
Cameroon 6 12 16,184,748 1,700 Liberia 6.5 -9.5 3,288,198 1,100
Micronesia, Federated States of 6.92 158.25 135,869 2,000
Central African Republic 7 21 3,642,739 1,300 Sri Lanka 7 81 19,576,783 3,250
Palau 7.5 134.5 19,409 9,000 Cote d'Ivoire 8 -5 16,804,784 1,550
Ethiopia 8 38 67,673,031 700 Ghana 8 -2 20,244,154 1,980 Togo 8 1.17 5,285,501 $1,500
Venezuela 8 -66 24,287,670 $6,100
153

Country Lat (N+, S-) Long (W-,E+) Population GDP/Capita Sierra Leone 8.5 -11.5 5,614,743 500
Marshall Islands 9 168 73,630 1,600 Panama 9 -80 2,882,329 5,900 Benin 9.5 2.25 6,787,625 1,040
Costa Rica 10 -84 3,834,934 8,500 Nigeria 10 8 129,934,911 840 Somalia 10 49 7,753,310 550 Guinea 11 -10 7,775,065 1,970
Trinidad and Tobago 11 -61 1,163,724 $9,000 Djibouti 11.5 43 472,810 1,400
Guinea-Bissau 12 -15 1,345,479 900 Grenada 12.12 -61.67 89,211 4,750
Netherlands Antilles 12.25 -68.75 214,258 11,400 Aruba 12.5 -69.97 70,441 28,000
Burkina Faso 13 -2 12,603,185 1,040 Cambodia 13 105 12,775,324 1,500 Nicaragua 13 -85 5,023,818 2,500 Philippines 13 122 84,525,639 4,000 Barbados 13.12 -59.53 276,607 14,500
Saint Vincent and the Grenadines 13.25 -61.2 116,394 2,900 Gambia, The 13.47 -16.57 1,455,842 1,770
Guam 13.47 144.78 160,796 21,000 El Salvador 13.83 -88.92 6,353,681 4,600 Saint Lucia 13.88 -61.4 160,145 4,400
Senegal 14 -14 10,589,571 1,580 Martinique 14.67 -61 422,277 11,000
Chad 15 19 8,997,237 1,030 Eritrea 15 39 4,465,651 740
Honduras 15 -86.5 6,560,608 2,600 Sudan 15 30 37,090,298 1,360
Thailand 15 100 62,354,402 $6,600 Yemen 15 48 18,701,257 $820
Northern Mariana Islands 15.2 145.75 77,311 12,500
Dominica 15.42 -61.33 70,158 3,700 Guatemala 15.5 -90.25 13,314,079 3,700 Cape Verde 16 -24 408,760 1,500
Niger 16 8 10,639,744 820 Vietnam 16 106 81,098,416 $2,100
Guadeloupe 16.25 -61.58 435,739 9,000 Montserrat 16.75 -62.2 8,437 2,400
Mali 17 -4 11,340,480 840 Antigua and
Barbuda 17.05 -61.8 67,448 10,000 Belize 17.25 -88.75 262,999 3,250
154

Country Lat (N+, S-) Long (W-,E+) Population GDP/Capita Saint Kitts and
Nevis 17.33 -62.75 38,736 8,700 Laos 18 105 5,777,180 1,630
Anguilla 18.25 -63.17 12,446 8,600 Jamaica 18.25 -77.5 2,680,029 3,700
Puerto Rico 18.25 -66.5 3,957,988 11,200 Virgin Islands 18.33 -64.83 123,498 15,000 British Virgin
Islands 18.5 -64.5 21,272 16,000 Dominican Republic 19 -70.67 8,721,594 5,800
Haiti 19 -72.42 7,063,722 1,700 Cayman Islands 19.5 -80.5 36,273 30,000
India 20 77 1,045,845,226 2,500 Mauritania 20 -12 2,828,858 1,800
Oman 21 57 2,713,462 8,200 Cuba 21.5 -80 11,224,321 2,300
Turks and Caicos Islands 21.75 -71.58 18,738 7,300 Burma 22 -98 42,238,224 1,500 Macau 22.17 113.55 461,833 17,600
Hong Kong 22.25 114.17 7,303,334 25,000 Mexico 23 -102 103,400,165 9,000 Taiwan 23.5 121 22,548,009 17,200
Bangladesh 24 90 133,376,684 1,750 United Arab
Emirates 24 54 2,445,989 $21,100 Bahamas, The 24.25 -76 300,529 16,800
Libya 25 17 5,368,585 7,600 Saudi Arabia 25 45 23,513,330 10,600
Qatar 25.5 51.25 793,341 21,200 Bahrain 26 50.55 656,397 13,000 Egypt 27 30 70,712,345 3,700
Bhutan 27.5 90.5 2,094,176 1,200 Algeria 28 3 32,277,942 5,600 Nepal 28 84 25,873,917 1,400
Kuwait 29.5 45.75 2,111,561 15,100 Pakistan 30 70 147,663,429 2,100
Table A.1: Developing World Database
155

156

Appendix B
Detailed Description of Computer Model
Modules This Appendix B contains the technical details that comprise each of the modules in the
satellite simulation employed in this analysis. It is taken directly from the appendix of the
MIT Industry Systems Study on Communications Satellite Constellations produced by de
Weck and Chang [deWDC03]. This systems study represents a comprehensive analysis
of the simulation used in this thesis in the greater context of understanding how to
perform a thorough study of the design space of complex engineering systems. The
necessary changes that were made to the simulation to reflect the instantiation of the SMS
based simulation used in this thesis are detailed below. There were also some aspects of
de Weck and Chang’s work which were not relevant for this analysis and were thus not
included.
B.1 System Input File (SIF)
In the system input file (SIF), design variables, constants, and policy constraints are
defined and bundled into their vector forms x, c, and p.
There are two types of SIF. One of them represents a particular design. In this type of SIF
each design variable has only a single value. The design vector is one-dimensional.
Another kind of SIF represents a group of possible designs. In this type of SIF each
design variable has an array of different values. Therefore the design vector is a two-
dimensional array. Specified by hardware, policy constraints, and requirements, the
parameters in c, p, and r always have just a single value in both types of SIF. An example
for the first kind of SIF is the input file for any major established system, which contains
157

exactly the values of parameters used within that of the Orbcomm system. The system
input file makes the start file call all the simulation modules (once) in order to obtain the
simulation results for Orbcomm. The second kind of SIF calls the modules multiple times
until it finishes performing an exhaustive search of all allowable combinations of design
variable values.
It should be noted that in the two-dimensional design vector array, design variables do
not need to contain the same number of values. For example, orbital altitude can take
five different values at 500km, 750km, 1,000km, 1,250km, and 1,500km, while minimum
elevation angle has four values at 5o, 15o, 25o, and 35o. Figure B-1 demonstrates the
difference between the two types of design vectors.
c
h
ε
di
Pt
Tsat
MAS
ISL
Gt dB
c 1
h 1
ε 1
di1
Pt 1
Tsat 1
MAS 1
ISL 1
Gt dB 1
c 2
h 2 h 3 h 4 h 5
ε 2 ε 3 ε 4
di2
Pt 2 Pt 3 Pt 4 Pt 5
Gt dB 2Gt dB 3
ISL 2
MAS 2
Tsat 2 Tsat 3
x x
1-dimensional design vector representing a particular design
2-dimensional design vector representing an exhaustive combination of 14,400 designs.
Figure B-1: One-dimensional design vector vs. Two-dimensional design vector.
The first case represents the simulation of a single architecture. The second case
represents a combinatorial problem. SIF passes the bundled vectors to the start file.
158

B.2 Start File (SF)
After inputting design, constant, and policy vectors from the system input file, the start
file first unbundles the vectors and assigns their values to local variables. It also keeps
track of the size of each design variable. There is no need to track the size of the
constants and policy constraints since they always have a size of 1.
After unbundling the design, constant, and policy vectors, SF first performs a number of
checks on the input data. An example of such a check is to determine whether the antenna
size required by the user-defined transmitter antenna gain (a design variable) is larger
than 3 meters. This checking is done in sub-routine LDRcheck.m. If the size of the antenna
is larger than 3 meters, LDRcheck.m will ask the user to enter lower value(s) for the
transmitter gain, and returns the new value(s) as well as the variable dimensions to SF.
The assumption here is that an antenna larger than 3 meters requires a large deployable
reflector technology.
Using the design variable size information obtained when unbundling the design vector,
SF runs an exhaustive combination of all selected values of design variables. This is a so
called full-factorial run. In MATLAB, we achieve a full-factorial run through a set of
nested for-loops. Each for-loop represents one design variable, iterating through all its
allowable values. The one dimensional design vector example in Figure B-1 has nine for-
loops, with a single iteration for each for-loop. Altogether this consists of one single run
of the simulation. The two-dimensional design vector example used within the simulation
also has nine for-loops, with, respectively, 1, 3, 3, 1, 2, 1, 2, 2, and 3 iterations for each
for-loop. Altogether this leads to 216 simulation runs.
Individual simulations are almost entirely run inside the nested for-loops except for some
post-processing. The SF, simply keeps track of the number of runs, makes calls to a series
of subroutines and functions and directs the traffic of information among them. It also
collects and post-processes outputs from the subroutines and functions that are of
interests to the user.
159

Inside the nested for-loops, SF first stores the number of runs in a variable named
result_count. It then calls the subroutine named requirements in which the requirements are
calibrated based on the relation defined in Table 3.4. Then, SF makes calls to the
following functions: coverage.m (CCM), satNetwork.m (SNM), spacecraft.m (SM), LV.m
(LVM), either linkRate.m followed by MF-TDMA.m or linkEbNo.m followed by MF_CDMA.m
depending on the type of multiple access scheme (CM), cost.m (TCM), and market.m
(MM). After the execution of these functions, SF stores values of the objectives into
vector J and values of the benchmarking metrics into vector B. After the nested for-loops
end, post-processing procedures for finding the Pareto optimal solutions are carried out.
B.3 Coverage/Constellation Module (CCM)
CCM calculates the geometry and size of the constellation. The inputs into this module
are the following: constellation type, orbital altitude, minimum elevation angle, diversity,
satellite antenna spot beam gain, and the center frequency of the downlink bandwidth.
The outputs of the module are the following: inclination angle, number of satellites in the
optimal constellation design, number of orbital planes in the design, beamwidth of the
edge cell spot beam, number of cells, the distance from a satellite to the center of its edge
cells, orbital period, duration of a beam over a center cell, satellite antenna dimension,
and footprint area.
CCM starts with the calculation of some basic constellation geometric parameters
including the satellite nadir angle ϑ and the corresponding central angle ψ as in the
following equations, where Re stands for the Earth radius, r for orbital altitude measured
from the center of earth, and ε for minimum elevation angle.
⎟⎠⎞
⎜⎝⎛= εϑ cosarcsin
rRe (B.1)
160

εεψ −⎟⎠⎞
⎜⎝⎛= cosarccos
rRe (B.2)
The simulation is equipped to deal with both Polar and Walker systems. To calculate the
geometry of polar or Walker constellations, depending on which type of constellation the
design uses, CCM calls polar.m or walker_lang.m. However for the analysis in this thesis
only Walker systems are used and thus polar.m is never run.
When walker_lang.m is called, the file employs a numerical optimization of Walker
constellation designs developed by Lang and Adams.[TLWA97] The optimization is not
a simple function where we can plug in orbital altitude and minimum elevation and
output N/P/F (This is a classic way of representing the geometry of a Walker
constellation, where N is the same as Nsat, P is the number of planes, and F is the phasing
factor that determines the angular offset between the satellites in adjacent orbit planes).
Numerical optimization of P/F needs to be performed and inclination for each value of
Nsat needs to be deciphered. By optimization we mean the configuration that requires the
smallest value of ψ to achieve continuous global coverage. This will be the constellation
that can be operated at the lowest altitude and still give global coverage. Conversely, at
the same altitude it will offer the largest values of minimum elevation angle and still
achieve coverage. The result is a table which contains optimized Walker constellations
of from 5 to 197 satellites for continuous one fold coverage of the 30° S to 30° N latitude
zone. The details of this table are shown in Table B.1.
Values of N/P/F which as stated earlier are the Walker parameters of the optimal
constellation are outputted in Table B.1 along with I, the optimal inclination (where 0.4 is
approximately equal to an inclination of 0 degrees), and thmax, which is the size of the
coverage circle (measured in earth central angle of the radius, ψ) required to obtain the
desired coverage. This value of coverage circle angle, theta, can be obtained from
knowledge of the constellation altitude and minimum usable elevation angle. The table
also outputs a value, Latmx, which is the latitude at which a hole will open if the
coverage circle is too small. NGT stands for number of (independent) ground tracks and
161

indicates a suspicious solution if it is too small (none present in Table B.1). Note that it
can be seen that the number of satellites parameter does not run continuously from 5 to
197 satellites as some constellations were inefficient; that is there existed a smaller
constellation providing the same coverage requiring the same or smaller theta. Also
when the constellation is an equatorial one (i.e., inclination=0 degrees, actually 0.4 in the
Table B.1), it actually means a symmetric distribution of satellites about the equator.
N P F I THMAX LATMX NGT 5 5 1 0.400 45.609 30.00 5 6 2 0 0.400 41.561 30.00 6 7 7 1 0.400 38.785 30.00 7 8 4 1 0.400 36.988 30.00 8 9 9 6 0.400 35.703 30.00 9 10 10 2 0.400 34.658 30.00 10 11 11 6 0.400 33.953 30.00 11 12 2 1 0.400 33.320 30.00 12 13 13 1 0.400 32.813 30.00 13 14 14 10 0.400 32.483 30.00 14 15 15 12 27.400 31.638 30.00 15 16 16 6 27.500 30.070 30.00 16 17 17 4 26.100 29.484 17.50 17 18 9 5 25.800 28.189 30.00 18 19 19 11 26.200 27.153 1.00 19 20 5 4 25.600 26.648 14.50 20 21 7 2 25.000 25.974 1.00 21 22 22 4 25.300 25.179 30.00 22 23 23 17 25.700 24.651 13.00 23 24 12 3 24.400 24.336 0.00 24 25 5 3 24.700 23.820 30.00 25 26 13 6 25.300 23.362 30.00 26 27 27 9 23.600 23.178 30.00 27 28 28 2 23.700 22.632 11.50 28 29 29 7 25.100 22.320 30.00 29 30 15 10 24.700 21.595 30.00 10 32 32 8 24.300 21.549 18.50 32 33 33 20 24.700 20.678 30.00 11 35 35 12 24.300 20.249 30.00 35 36 12 6 24.500 19.765 6.00 12 37 37 22 24.400 19.586 16.00 37 38 19 12 24.800 19.381 30.00 38 39 13 1 23.700 19.065 30.00 39 40 40 30 23.700 18.870 30.00 40 41 41 8 24.200 18.524 0.00 41 42 14 6 24.600 18.478 0.50 42 43 43 29 23.000 18.392 1.50 43 44 22 11 23.300 18.102 30.00 44 45 9 8 23.600 17.922 0.00 45 46 46 26 24.700 17.873 30.00 46 47 47 40 25.700 17.547 20.50 47 48 6 3 25.800 17.449 30.00 48 49 49 5 26.500 17.195 4.00 49
162

50 50 10 25.100 16.980 30.00 50 51 17 8 24.900 16.744 30.00 51 52 52 22 25.000 16.583 5.50 52 53 53 46 25.200 16.506 5.00 53 54 6 2 25.700 16.307 4.00 54 55 11 0 24.400 16.152 30.00 55 56 28 9 24.400 15.997 6.00 56 57 57 16 24.300 15.929 30.00 57 58 29 21 24.700 15.801 5.00 58 59 59 15 23.900 15.635 30.00 59 60 60 48 23.900 15.582 6.50 60 61 61 10 23.900 15.439 30.00 61 62 62 54 26.800 15.304 1.00 62 63 7 4 26.600 15.094 1.50 63 64 64 6 26.700 15.020 9.50 64 65 65 35 26.800 14.805 9.00 65 66 22 4 26.900 14.786 30.00 66 67 67 19 25.900 14.679 30.00 67 68 34 25 25.800 14.542 1.00 68 69 69 61 25.800 14.312 30.00 69 70 7 3 26.000 14.291 2.00 70 71 71 6 26.200 14.143 30.00 71 73 73 52 25.100 14.049 0.50 73 74 74 46 25.200 13.866 1.00 74 75 75 33 25.300 13.788 30.00 75 76 76 68 25.400 13.694 30.00 76 77 7 2 25.800 13.624 2.50 77 78 78 6 26.100 13.547 2.50 78 80 20 9 24.700 13.473 1.00 80 81 27 17 24.800 13.358 30.00 81 82 41 32 25.000 13.279 1.50 82 83 83 57 26.800 13.197 30.00 83 84 42 23 27.100 13.168 1.50 84 85 17 3 27.200 13.097 30.00 85 86 86 38 26.600 13.060 30.00 86 87 87 78 26.400 12.912 3.50 87 88 8 4 26.300 12.783 30.00 88 89 89 7 26.400 12.697 30.00 89 90 90 48 26.300 12.632 30.00 90 91 91 32 26.500 12.596 30.00 91 93 31 20 25.900 12.524 30.00 93 94 47 37 25.800 12.427 30.00 94 95 95 86 26.000 12.282 3.50 95 96 8 3 25.800 12.203 30.00 96 98 49 37 28.100 12.189 4.50 98 99 33 5 26.300 12.187 1.50 99 100 25 4 26.600 12.077 1.00 100 101 101 30 25.400 11.957 3.50 101 102 102 46 25.500 11.864 30.00 102 103 103 27 27.200 11.812 3.00 103 104 104 84 27.300 11.763 3.50 104 105 105 18 27.500 11.724 3.50 105 107 107 67 27.800 11.660 4.50 107 108 9 5 26.800 11.618 30.00 108 109 109 69 25.200 11.566 3.50 109 110 55 7 26.600 11.505 2.50 110 111 37 6 26.700 11.332 30.00 111
163

113 113 46 26.900 11.309 30.00 113 114 19 3 27.000 11.294 30.00 114 115 115 52 26.400 11.293 30.00 115 117 117 84 28.000 11.175 0.50 117 118 118 8 26.200 11.080 30.00 118 119 119 63 26.100 11.075 2.50 119 120 120 82 26.300 11.023 30.00 120 121 121 92 26.400 10.968 3.00 121 123 123 78 25.900 10.901 1.50 123 125 125 51 27.500 10.771 1.00 125 126 21 4 27.500 10.748 7.00 126 128 32 17 27.400 10.666 0.00 128 129 43 29 27.600 10.641 0.00 129 131 131 119 27.900 10.614 30.00 131 132 132 70 27.000 10.564 2.00 132 133 133 91 27.000 10.433 1.50 133 134 134 102 27.000 10.344 6.50 134 137 137 20 27.000 10.321 0.50 137 138 138 52 27.200 10.278 30.00 138 139 139 31 27.400 10.258 30.00 139 140 10 5 26.700 10.190 2.50 140 142 71 8 26.500 10.093 6.00 142 144 72 39 26.600 10.051 1.00 144 146 73 50 26.600 10.026 0.50 146 147 21 3 26.900 10.002 0.50 147 149 149 116 27.200 9.954 0.00 149 150 10 4 26.200 9.901 6.00 150 152 152 80 26.100 9.839 1.50 152 153 51 7 26.200 9.831 6.50 153 157 157 135 26.700 9.725 7.50 157 159 159 33 27.100 9.620 2.50 159 161 23 4 27.100 9.592 3.00 161 163 163 127 27.100 9.574 3.50 163 164 82 33 27.200 9.556 4.00 164 165 11 6 27.100 9.551 1.50 165 166 166 38 25.700 9.523 5.00 166 167 167 88 26.700 9.478 2.00 167 168 56 8 26.600 9.401 30.00 168 170 34 6 26.700 9.305 3.00 170 172 172 148 26.900 9.282 3.00 172 176 11 5 26.500 9.233 2.00 176 178 89 9 26.400 9.128 30.00 178 181 181 146 26.500 9.051 3.00 181 183 183 79 26.700 8.992 3.50 183 186 186 174 26.400 8.905 1.50 186 189 189 99 26.200 8.888 30.00 189 190 38 20 27.300 8.803 6.50 190 193 193 89 27.500 8.794 7.50 193 194 194 56 26.600 8.782 3.50 194 196 14 13 27.800 8.778 30.00 196 197 197 185 25.900 8.734 2.00 197
Table B.1: Lang’s optimized Walker constellations for continuous one fold coverage of
the 30° S to 30° N latitude zone. [TLWA97]
164

Hence this resulting Table B.1 contains the best P/F and inclination values for each Nsat,
along with the minimum value of ψ to achieve the designated equatorial coverage. All
constellations produced in Table B.1 have a diversity of 1. The file walker_lang.m goes
through the following steps to find an optimal Walker constellation:
1. Compute central angle ψ using equation (2).
2. Scan down the table to the first entry (lowest number of satellites) for which the
table value of ψ (required) is less than the value in step1 (available). This is the
optimal constellation for the design. The N/P/F and inclination are given in the
table. Read the value of N from the table.
At the end, walker_lang.m returns the value of optimal N/P/F and inclination I to
coverage.m. The geometry of a satellite in a Walker constellation providing global
coverage is shown in Figure B-2. Note that the analysis in this research only requires a
Walker constellation to provide coverage between the 30° N to 30° S equatorial belts so
the coverage area would be limited to this zonal region and hence would not be as
extensive as shown in Figure B-2.
Figure B-2: Geometry of a satellite in a Walker Constellation providing global coverage
165

After calculating the formation of the constellation, the module finds the dimension of
satellite transmitter. First, the wavelength λ of the transmission is the ratio between the
speed of light c and the average frequency of the downlink bandwidth f
fc=λ (B.3)
Then, using Gt edge the edge cell gain converted from Gt dB, the dimension of satellite
transmitter is
πλ edgettranssat GD = (B.4)
Another calculation is dedicated to finding the number of cells in the footprint of a
satellite. First, the beamwidth θedge of an edge cell is found to be
edgetedge G
πθ 35= (B.5)
And footprint area and slant range are respectively found to be
( ψπ cos12 2−= efoot RA ) (B.6)
and
ψcos222 rRrRR eeslant −+= (B.7)
Figure B-3 helps in understanding the following geometric derivation. Essentially, we
will try to find the hexagonal areas of the edge cell and center cell. Then we divide the
footprint area with the average of the two hexagonal areas to estimate the total number of
cells in the footprint. Let,
166

edgeθϑα 21 −= (B.8)
where β1 is the earth centered angle corresponding to α1.
111 sinarcsin ααβ −⎟⎟⎠
⎞⎜⎜⎝
⎛=
eRr (B.9)
11 βψγ −= (B.10)
The radius of the edge cell is
121 γeedgecell Rr = (B.11)
The circular area of the edge cell is
(( 2cos12 12 γπ −= eedgecell RA )) (B.12)
And the hexagonal area is
edgecelledgehexa AA ⎟⎠⎞
⎜⎝⎛=
3sin3 π
π (B.13)
167

¦ Á1
¦ Á2 ¦ Á3
¦ Ã1
¦ Â2
¦ Â3
¦ Â1
edge celledge cell center cellθ
Figure B-3: Geometry involved in calculating single satellite coverage
Because the distance from the edge cell to the satellite is larger than the distance from the
center cell to the satellite, to keep the same cell area the edge cell beam width needs to be
narrower than the center cell beam width. In other words, the gain of the edge cell spot
beam needs to be larger than the gain of the center cell spot beam. Iridium’s edge cell
gain is 6dB larger than the gain of the center cell. We can assume this to be the general
case and get
6−= dBtdBcentert GG (B.14)
The beamwidth of the center cell spot beam is
centertcenter G
πθ 35= (B.15)
Let
168

centerθα =2 (B.16)
222 sinarcsin ααβ −⎟⎟⎠
⎞⎜⎜⎝
⎛=
eRr (B.17)
The radius of the center cell is
221 βecentercell Rr = (B.18)
The circular area of the center cell is
(( 2cos12 22 βπ −= ecentercell RA )) (B.19)
And the corresponding hexagonal area is
centercellcenterhexa AA ⎟⎠⎞
⎜⎝⎛=
3sin3 π
π (B.20)
Then, the number of cells per footprint is estimated to be
( ) ⎟⎟⎠
⎞⎜⎜⎝
⎛
+=
2round2
edgehexacenterhexa
footcell AA
AN (B.21)
The factor of 2 compensates for the overlapping of cells in the footprint.
Besides the number of cells per footprint, this module also takes care of the calculation of
the distance from satellites to the center of an edge cell, the orbital period, and the
duration of a beam over a center cell for use in later modules.
169

To find the distance from a satellite to the center of an edge cell, let
edgeθϑα −=3 (B.22)
where β3 is the earth centered angle corresponding to α3
333 sinarcsin ααβ −⎟⎟⎠
⎞⎜⎜⎝
⎛=
eRr (B.23)
The distance is then
322 cos2 βrRrRD eeedge −+= (B.24)
To find the orbital period in minutes,
( )earthorbit GMrT 32601 π= (B.25)
where GMearth is the Earth’s gravitational constant (=398601km3sec-2).
To find the duration of a beam over a center cell, the orbital angular velocity of satellite
in (rad/s) is 2/334812.631 −= rcirω (B.26)
The central angle of a center cell is 2 β2. Then, the cell duration Tcell is
circellT ωβ 22= (B.27)
170

Upon finishing all the calculations, CCM passes the values of the outputs back to SF. SF
calls the next module, which is the satellite network module.
B.4 Satellite Network Module (SNM)
SNM does some calculation that scales the network. The inputs of the module include
constellation type, the Boolean variable representing the availability of ISL, number of
satellites, number of orbital planes, and the footprint area. It can be seen that the last three
inputs are outputs from CCM. The outputs of SNM include gateway thousand lines of
code, number of gateways, and number of personnel staffed at the gateways.
Gateway thousand lines of code is an important parameter useful for estimating system
life-cycle cost. In this study it is estimated to be 6.3 thousand lines per gateway for LEO
systems. This estimation is based on the FCC filings of four systems including ARIES,
Globalstar, ORBCOMM, and Starnet.
In estimating the number of gateways, distinctions are made between systems with ISL
and systems without ISL. Two assumptions were made. The first assumption is that for
systems with ISL, the number of gateways can be made to scale with the number of
gateways present in the Orbcomm system. For the total number of satellites in the
Orbcomm system which was 36 satellites, there were 9 gateways utilized. Thus for the
system in this research the number of gateways required was made to be proportional to
the number of satellites used in the system (given by Nsat in equation B.28 below). Hence
the number of gateways for a non ISL system was implemented in this module as:
⎟⎟⎠
⎞⎜⎜⎝
⎛×=
satellites
satGWGW
NN
369round (B.28)
For systems with ISL, the assumption was made that two gateways are needed per orbital
plane. Although in theory an ISL system needs just one gateway to interface the space
171

segment with the ground segment, in practice each orbital plane should have two
gateways to diverge the communication traffic. Indeed this is the design adopted by
Iridium. Therefore the number of gateways for an ISL system is simply
PNGW 2= (B.29)
where P is the number of planes.
The number of personnel is estimated assuming at any moment there are three personnel
members stationed at each gateway on a eight-hour rotating schedule. So the total number
of personnel at all gateways are
⎟⎠⎞
⎜⎝⎛××=
.hrs8hrs.243GWpersonnel NN (B.30)
After the above calculations, SNM passes the output values back to SF.
B.5 Spacecraft Module (SM)
The next module called by SF is SM. The inputs of this module are satellite transmitter
power, ISL, thousand lines of code of gateway, apogee kick motor specific impulse,
station keeping engine specific impulse, orbital altitude, space life of the system, ISL
datarate, and satellite transmitter antenna dimension. The outputs of the module are
satellite mass, injection fuel mass, antenna weight, communication electronics weight,
spacecraft bus dry weight, beginning of life power, apogee kick motor type, apogee kick
motor dry weight, apogee kick motor impulse, and flight software thousand lines of code.
Although SM has multiple outputs, its major product is the satellite in-orbit wet mass.
This mass is important to launch vehicle selection and cost estimation in later modules.
To estimate this mass, a combination of analogy with existing system, scaling from
172

existing systems, and budgeting by components is used. SM first estimates the
relationship between the dry mass of spacecraft without ISL and its payload power based
on data from the FCC filings of twenty-three LEO personal communication systems
collected by Phil Springmann in November 2002. [PSdeW04]
6076.0025.11 tdry PM = (B.31)
The data are shown in Figure B-4.
S/C dry mass vs. PL power for 23 systems without ISL
y = 11.025x0.6076
R2 = 0.7777
0
500
1000
1500
2000
2500
3000
3500
0 2000 4000 6000 8000 10000 12000
PL power (W)
s/c
dry
mas
s (k
g)
23 LEO systemsPower (23 LEO systems)
Figure B-4: Relationship between dry mass of spacecraft without ISL and payload power based
on the FCC filings of 23 LEO personal communication systems.
After the spacecraft dry mass, the antenna weight is estimated from the transmitter
antenna dimension. The relationship between antenna weight and antenna size is
estimated based on data provided in Larson and Wertz [WLJR99] as what follows
4029.11734.9 transsatant DM = (B.32)
The data are shown in Figure B-5.
173

Antenna mass vs. antenna dimension for 8 systems
y = 9.1734x1.4029
R2 = 0.8023
05
101520253035404550
0 1 2 3
Antenna dimension (m)
Ant
enna
mas
s (k
g)
8 Systems fromSMADPower (8 Systemsfrom SMAD)
Figure B-5: Relationship between antenna mass and antenna dimension based on the data of 8
systems provided in Larson and Wertz [WLJR99]. Note that the reference [WLJR99] is referred to as ‘SMAD’ in the legend of the Figure.
If the mass of the receiver antenna is assumed to be same as the transmitter, then a factor
of 2 is added to represent both antennas.
An estimation of the ISL weight is made based on information provided by Yoshisada
Koyama at Next-Generation LEO System Research Center (NeLS) in Japan. The
assumption is that the ISL system of a satellite has four links. The mass is estimated to be
426 kg for a radio frequency (RF) ISL with data rate lower than 100 Mbps, 480 kg for an
RF ISL with data rate higher than 100 Mbps, and 117 kg for an optical ISL (OISL) with
data rate of 10 Gbps.
Using the dry mass of spacecraft without ISL and ISL (if applicable) as initial value, Msat
goes through an iteration in which the significant portions of the spacecraft fuel mass are
added. An iteration is used because the deorbiting and station-keeping fuels added at later
steps of the calculation will affect the spacecraft cross-section area calculated in earlier
steps. It has been shown that Msat typically converges to within 0.01% of its value in less
than 10 iterations. The structure of the iteration is shown below in Figure B-6.
174

Msat +
+
Vsat Axsection Mdeorbit
Mstation
h, Tsat, StationIsp
Cballistic
Mdry no ISL+MISL
Initial value
Iterate until msat converges
Msat=Mdry no ISL+MISL
Mant, Dant
Figure B-6: Iterations to find satellite mass.
As shown in Figure 3-6, the first step in the iteration is to find the volume and cross-
sectional area of the satellite. This step is done in a subroutine named scgeometry.m.
Based on data from fifteen LEO communication systems collected by Phil Springmann in
November 2002, the average density of this type of spacecraft is found to be 234.18
kg/m3. Since the volume will later be used in finding the satellite storage capacity of
rocket fairings, we include the entire mass of the satellite, including the antenna, to find
the volume
3mkg18.234
satsat
MV = (B.33)
Next, we find the cross-sectional area of the satellite in orbit. Since in orbit the antennas
are often unfolded from the spacecraft, we will account antenna area separately from
spacecraft cross-section area. Assuming spherical shape of spacecraft and circular shape
of antennas, the total cross-section area of the spacecraft and antennas is
232
mkgsec 2
218.2344
33
⎟⎟⎠
⎞⎜⎜⎝
⎛+⎟⎟
⎠
⎞⎜⎜⎝
⎛ −= transsatantsat
tionx
DMMA π
ππ (B.34)
Again, a factor of 2 is added to represent both the transmitter and receiver.
175

The third step is to add deorbiting fuel mass to satellite mass. The deorbiting fuel mass is
found in subroutine deorbit.m. First the delta V for deorbiting is suggested by the
following equation [WJLR99]
⎟⎟⎠
⎞⎜⎜⎝
⎛
+−≈∆
rRR
VVE
Edeorbit
21 (B.35)
where RE is earth radius and r earth-centered orbital radius.
This equation assumes the deorbiting process brings the satellite from its original orbital
altitude to the earth’s surface. But the FCC filings of both Iridium and Globalstar suggest
that a ∆V much smaller than defined by Equation (B.35) is needed. In practice, the
decommissioned satellite is propelled only to an altitude low enough to avoid collision
with the other satellites in the constellation, and the rest of the descending is natural
decay due to friction. In the simulation, de Weck and Chang assume the satellite is thrust
to 90% of its original orbital altitude. So Equation (B.35) becomes
( )( ) ⎟
⎟⎠
⎞⎜⎜⎝
⎛
+++
−≈∆rhR
hRVV
E
Edeorbit 9.0
9.021 (B.36)
To find the fuel needed for deorbiting, we first find the sum of fuel and satellite using
equation
stationspdeorbit gIV
satsatfuel eMM ∆+ = (B.37)
The specific impulse of station-keeping thruster is used because the same thruster is
assumed to be used for decommission, which is very often the case. Then the fuel mass is
found simply by
satsatfuelfuel MMM −= + (B.38)
176

The value of deorbiting fuel mass is returned to spacecraft.m and added to total satellite
mass.
The next step is to find station-keeping fuel mass. For satellites with circular orbit at low
altitude, the most significant disturbance comes from atmosphere drag. The other
disturbances due to earth’s oblateness and third-body interaction are negligibly small
compared with drag. The first thing to be found is ballistic coefficient Cballistic. In
ballistic.m, the cross-sectional area calculated earlier is used. According to Larson and
Wertz [WLJR99], an approximate value of 2.2 should be used for drag coefficient Cd.
Then ballistic coefficient Cballistic is
tionxd
satballistic AC
MC
sec
= (B.39)
After ballistic.m, station.m is called. In station.m, the density at the particular orbital altitude
is interpolated through atmosphere density data that are available in many references.
Then the mean ∆V per year required to maintain altitude (in m/s per year) is
orbitballisticstation TC
rVV πρ=∆ (B.40)
where r is orbital radius in meter, V orbital velocity in m/s, Cballistic ballistic coefficient in
kg/m2, and Torbit orbital period in year. This equation can be found in column 6 on the
back sheet of the text by Larson and Wertz. [WLJR99]
After knowing the ∆V required for station-keeping, the station-keeping fuel mass is
calculated using Equation (B.37) and (B.38) as described above. This mass is added to
satellite mass.
The calculation of station-keeping fuel mass concludes the iteration. The iteration loops
until the mass of satellite converges. Although the satellite includes orbital injection fuel
177

at launch, but this part of the fuel has been used up when the satellite enters the orbit, and
therefore does not affect the iterative calculation of satellite mass when the satellite is in
orbit.
It should be noted that the order of calculations on different masses is designed to be the
reverse of their order of removal from the satellite during its life. The dry mass and ISL
mass (if applicable) are the original masses of the satellite. Deorbiting fuel stays on
satellite throughout satellite’s lifetime and is used only at the end of it, therefore its mass
is the next to be calculated and added to total satellite mass. The station-keeping fuel is
consumed throughout the lifetime of the satellite, and its mass is the last to be calculated
and added to satellite mass. The orbit injection fuel is used up before the satellite enters
the orbit, therefore its mass is not included in the iterative calculation. Indeed, it is the
first thing to be calculated outside the iteration.
The calculation of orbital injection fuel depends not only on characteristics of the
spacecraft and orbit, but also on the launch vehicle employed to send the spacecraft to the
orbit from where the injection will happen. Different launch vehicles vary from each
other in flight profile. Even the same launch vehicle has different versions that are
customized to be mission-specific. It is difficult to make a generic calculation for the
injection fuel requirement for a specific design. de Weck and Chang were only able to
make a rough estimation based on available data of existing systems. In its FCC filing,
the original design of Iridium uses 17.5 kg of fuel to inject 323.2 kg of in-orbit wet mass.
The original design of Globalstar uses 30 kg of fuel to inject 232.0 kg of in-orbit wet
mass. The average of the two systems is 23.75 kg of injection fuel for 277.6 kg in-orbit
wet mass. A reasonable assumption is that the injection fuel mass is linearly proportional
to in-orbit wet mass. So the following relation for a ballpark estimation of injection fuel
mass is derived
6.27775.23 sat
insertionM
M ×≈ (B.41)
178

Together with a few other inputs, Minsertion is plugged into insertion.m. In insertion.m, we
find the impulse and dry weight of the apogee kick motor (AKM) that propels the orbit
injection. These two quantities will be useful in finding the life-cycle cost of the system.
First, the ∆Vinsertion for orbital insertion is found using an equation from Larson and Wertz
[WLJ99]
sat
insertionsatinsertionspinsertion M
MMgIV
+=∆ ln (B.42)
Then the impulse for the AKM in kg·m/s is
insertionsatAKM VMJ ∆= (B.43)
But the cost model that will be used later requires JAKM in kg·s, so we use a modified
equation
gVMJ insertionsatAKM ∆=ˆ (B.44)
Since AKM is typically a solid-fuel motor, its dry weight can be estimated using data on
solid rocket motors provided in in Larson and Wertz [WLJR99]. Based on 12 existing
motors, a relation can be found between the dry weight and the total impulse of the
motor, as illustrated in Figure B-7.
179

Solid rocket motors dry weight (kg) vs. total impulse (Ns)
y = 2E-05xR2 = 0.9481
0
100
200
300
400
500
600
700
800
0.00E+00 5.00E+06 1.00E+07 1.50E+07 2.00E+07 2.50E+07 3.00E+07
total impulse (Ns)
Solid
rock
et m
otor
dry
wei
ght (
kg)
dry weight vs.total impulse
Linear (dryweight vs.total impulse)
Figure B-7: Solid motor dry weight vs. total impulse.
In mathematical form, the relation is
AKMJAKMDW 5102 −×= (B.45)
The quantities calculated in insertion.m are returned to spacecraft.m.
A few more parameters are prepared for use in estimating the system life-cycle cost.
These parameters are communication electronics weight (CEW), spacecraft bus dry
weight (SCBDW), beginning of life power (BLP), and flight software thousand lines of
code (FSKLOC). Based on data from existing systems, basic scaling relations are found
to be
satMCEW 27.0= (B.46)
180

satMSCBDW 436.0= (B.47)
tPBLP 61.2= (B.48)
FSKLOC is approximated equal to gateway thousand lines of code that has been
calculated in satNetwork.m.
This concludes all the calculations in spacecraft.m. The module returns all useful values to
the start file (SF).
B.6 Launch Vehicle Module (LVM)
The LVM checks six launch vehicles against the satellite mass and volume and selects
the ones that are capable of launching the satellites to the designed orbit. Among the
capable launch vehicles, the module then selects the one with lowest launch cost. The
inputs of the module are satellite mass (including insertion fuel mass), orbital inclination
angle, orbital altitude, and number of satellites in the constellation. The outputs that are
of interests to this research are the name of the selected launch vehicle, number of
satellites per vehicle, number of launches, selected launch site, launch success ratio of the
selected launch vehicle, launch cost, and counter of capable vehicles.
The six launch vehicles are: Atlas IIIA (U.S.A.), Delta II 7920 (U.S.A.), H-IIA 202
(Japan), Long March 2C (China), Pegasus XL (U.S.A.), and Ariane 5 (Europe). Except
Long March 2C and Ariane 5, the launch capability data are from International Reference
Guide to Space Launch Systems published by AIAA. [SIJHJH99] The data on Long
March 2C and Ariane 5 are from the official website of their service providers,
respectively. [CALT03], [ARSE03]
The launch capability data of a vehicle are typically given in diagram as shown in Figure
B-8. The diagram is specifically for launching into circular orbits. The x-axis stands for
181

orbital altitude and the y-axis stands for payload mass that the vehicle is capable to send
up. Each curve represents a different orbital inclination angle. The highest curve is the
lower bound of orbital inclination the launch vehicle is able to reach, while the lowest
curve is the higher bound (Unless it is a sun synchronous orbit [SSO]. In this case the
curve above the SSO should be read for higher bound). The altitude bound of the vehicle
can also be read directly from the diagram. Thus, the diagram provides two bounds we
need to measure against: the inclination bounds and the altitude bounds.
Figure B-8: Launch capability of Long March 2C.
The other physical limit on launch capability is dimensions of the launch vehicle’s
fairing. Fairing is where the payload of the launch vehicle is stored. The satellite to be
launched must fit in the fairing or otherwise it cannot be launched even if its mass is
lower than the vehicle’s lifting capability. Figure B-9 shows a typical fairing diagram.
From the data provided by the diagram, the volume of the fairing can be easily estimated.
By comparing the volume of the satellite with the internal volume of the fairing, we will
know whether the fairing can accommodate the satellite.
182

Figure B-9: Fairing dimensions of Long March 2C.
LVM checks the satellite design against the three limits mentioned above: inclination,
altitude, and fairing dimension. If the satellite design is within the range of these limits,
then we interpolate the type of diagrams in Figure B-8 to find the payload mass the
launch vehicle can lift to the designed orbital altitude. If the payload mass is larger than
satellite mass, and the fairing volume is larger than satellite volume, then the launch
vehicle is recognized as a capable vehicle and added to an array recording capable launch
vehicles. To find how many satellites can be sent up per vehicle (SPV), we use the
following simple expression, in which MPL is payload mass, Vfairing is fairing volume, Msat
is satellite mass including insertion fuel, and Vsat is satellite volume including insertion
fuel,
⎟⎟⎠
⎞⎜⎜⎝
⎛⎟⎟⎠
⎞⎜⎜⎝
⎛⎟⎟⎠
⎞⎜⎜⎝
⎛=
sat
fairing
sat
PL
VV
MM
SPV floor,floormin (B.49)
so that the lower of the mass limit and volume limit is taken. The number of launches to
send up the entire constellation is found as
183

⎟⎠⎞
⎜⎝⎛=
SPVN
N satlaunch ceiling (B.50)
The information sources for launch capabilities also gives the cost per launch for each
launch vehicle. Then the total launch cost Claunch is simply
launchlaunchperlaunch NCC = (B.51)
After checking the capabilities of all six launch vehicles, the array recording the capable
launch vehicles and their cost information is scanned. The capable vehicle with lowest
cost is chosen to be the selected launch vehicle for the design, and its information and
technical data are returned to SF.
Since launch vehicles such as Ariane 5 can lift 6 tons of payload to the geostationary
transfer orbit (STO), it is hard to imagine any design is unable to find a launch vehicle
capable of lifting it to the much lower LEO orbits. In the unlikely event that the satellite
cannot find a capable launch vehicle, SF will set its capability in term of simultaneous
users supported by a satellite to zero. Otherwise, the satellite capability needs to be
calculated in the capacity modules as introduced in the following section.
B.7 Capacity Modules (CM)
The capacity modules calculate the number of simultaneous users a satellite can support.
As described in the thesis, there are two major types of modulation schemes: MF-TDMA
and MF-CDMA. Each scheme requires a different approach in capacity calculation.
Therefore, CM is divided into five subroutines. The first three subroutines together
calculate the capacity of MF-TDMA scheme, and the rest two subroutines calculate the
capacity of MF-CDMA scheme. Before introducing the computer codes, we will look at
the mathematical equations for the capacity calculation. In the paragraphs below, de
Weck and Chang give the final equations that are used in the code. A paper was written
184

by de Weck and Chang to describe the physics behind these equations and to give a more
thorough derivation. [deWDC03b]
For MF-TDMA, we first need to find the total data rate for FDMA carriers per cell. There
are two possible limits on the data rate – power limit and bandwidth limit. The FDMA
data rate per FDMA carrier due to power limit can be calculated using link budgeting,
where RFDMA stands for data rate per FDMA carrier, Powercell for transmitter power per
cell, NFDMA for number of FDMA carriers per cell, Gt for transmitter gain, Gr for receiver
gain, k for Boltzmann’s constant, Ts for system temperature, Eb/N0 for bit energy to noise
ratio, Ltot for total loss along the transmission path, and margin for link margin
marginNEkT
LGGN
Power
Rb
s
totrtFDMA
cell
FDMA
0
= (B.52)
Moving NFDMA to the left-hand side of the equation gives the total data rate of all the
FDMA carriers per cell defined by power limit
marginNEkT
LGGPowerNR
bs
totrtcellFDMAFDMA
0
= (B.53)
To find data rate per cell due to bandwidth limit, we first write the data rate per FDMA
channel defined by bandwidth limit. Let BWcell denotes bandwidth per cell (= satellite
bandwidth / cluster size), M denotes signal modulation level, β for Nyquist filter rolloff
factor, normally ranging from 0.2 to 0.5, BT for frequency channel bandwidth, and Bg for
guard bandwidth, then
⎟⎟⎠
⎞⎜⎜⎝
⎛
++=
gT
TFDMA
cell
FDMA BBB
MNBW
Rβ1
log2
(B.54)
185

Moving NFDMA to the left-hand side of the equation gives the total data rate of all the
FDMA carriers per cell defined by bandwidth limit
⎟⎟⎠
⎞⎜⎜⎝
⎛
++=
gT
TcellFDMAFDMA BB
BMBWNR
β1log2 (B.55)
In this equation, we already know BWcell; M is 4 if QPSK is used, and β is set to 0.26 as a
constant. In Iridium, the frequency domain is divided so that
9712.0MB236.1MB67.41
MB67.41=
+=
+ gT
T
BBB (B.56)
We assume this division applies to all MF-TDMA systems and use the value of 0.9712 in
Equation (B.55).
To find the number of TDMA channels, we refer to the geometry of time distribution. In
the geometry, let FL denote frame length, FIL denote framing time slot length, TGL
denote total guard slot length, and Ruser denote individual user datarate. It is not difficult
to perceive the following relation
⎟⎠⎞
⎜⎝⎛
−−+
⎟⎠⎞
⎜⎝⎛ −
=
TGLFILFLTGLR
FLFILR
Nuser
FDMA
TDMA
1
1 (B.57)
Per theory of MF-TDMA modulation scheme, the total number of MF-TDMA channels
is the product of NFDMA and NTDMA. Then we will get
186

TDMAFDMANN ⎟⎠⎞
⎜⎝⎛
−−+
⎟⎠⎞
⎜⎝⎛ −
=
TGLFILFLTGLR
FLFILR
N
user
FDMA
FDMA
1
1
⎟⎠⎞
⎜⎝⎛
−−+
⎟⎠⎞
⎜⎝⎛ −
=
TGLFILFLTGLR
FLFIL
RN
user
FDMAFDMA
1
1 (B.58)
In this equation, NFDMARFDMA is the lower of the results from Equation (B.53) and (B.55).
To find the fractional term in the equation, we use the design of Iridium and assume it is
typical of MF-TDMA systems. In Iridium, the time domain is divided so that
77.0
04.0192.0104.01
192.01
1
1=
−−+
−=
−−+
−
TGLFILFLTGLFLFIL
(B.59)
Therefore, the capacity of a MF-TDMA system can be found. For Iridium, equation
(B.58) gives a capacity of 905 simultaneous users per satellite.
For MF-CDMA system, omitting the detailed derivations, we arrive at an equation for the
number of simultaneous users per cell Nc, where T denotes number of CDMA carriers in
the satellite bandwidth, Bsat denotes satellite bandwidth, Bg denotes guard band between
CDMA carriers, Ruser denotes individual user data rate, α of value 0.5 represents the
expected value of voice channel activity state, f denotes neighboring user interference
factor, Eb/N0 represents the ratio of bit energy to noise caused along the link, and Eb/Itot
represents the ratio of bit energy to noise including both N0 and interference noise.
( ) ⎥⎥⎦
⎤
⎢⎢⎣
⎡⎟⎟⎠
⎞⎜⎜⎝
⎛−⎟⎟
⎠
⎞⎜⎜⎝
⎛⎥⎦
⎤⎢⎣
⎡+
−+=
−− 1
0
1
11
NE
IE
fRTBB
TN b
tot
b
user
gsatc α
(B.60)
187

and an equation for Eb/N0 for each individual link is
marginRkT
LGGN
Power
NE
users
totrtc
cell
b =0
(B.61)
or, if move Nc to the left-hand side,
marginRkTLGGPower
NNE
users
totrtcellc
b =0
(B.62)
Substituting (B.61) into (B.60) and solving for Nc, we find the following expression
( )
( )
1
111
11
−
⎟⎟⎠
⎞⎜⎜⎝
⎛+
−+
+
−+
=
marginRkTLGGPower
fRTBB
EI
fRTBB
TN
users
totrtcell
user
gsat
b
tot
user
gsat
c
α
α (B.63)
As was mentioned before the equations were introduced, five subroutines are written to
convert the above mathematical expressions into the simulation. The first three
subroutines are for MF-TDMA, among which, the first subroutine linkRate.m returns the
value of RFDMANFDMA in (B.53). The second subroutine BWLimit.m returns the value of
RFDMANFDMA in (B.55). The lower of these two values defines the bound and is input into
the third subroutine MF_TDMA.m, which uses (B.58) to find the total number of MF-
TDMA channels supported by a satellite.
The next two subroutines find the capacity of a MF-CDMA system. The first of them
linkEbNo.m gives (Eb/N0)Nc in (B.62). Substituting this result to the last subroutine
MF_CDMA.m, Nc in (B.63) is calculated. The satellite capacity is the product of Nc and the
number of cells Ncell calculated in (B.21).
188

cellcsat NNC ×= (B.64)
One more thing worth mentioning despite the omission of the derivation of the equations
is convolutional coding. In convolutional coding, redundancy cleverly coded into
transmitted information reduces transmit power required for a specific bit error
probability. This reduction process has two important parameters, code rate r and
constraint length K. Code rate r is defined by the ratio between the original information
bits k and the redundantly coded content bits n,
nkRc = (B.65)
The bit energy to mean total noise power spectral density ratio Eb/Itot corresponding to
several bit error probabilities, pb, are listed in Table B.2 for soft-decision Viterbit
decoding. [JKWE00]
Rc = 1/3 R c = ½ Rc = 3/3 Rc = ¾ pb
Eb/Itot
uncoded K = 7 K = 8 K = 5 K = 6 K = 7 K = 6 K = 8 K = 6 K = 9
10-3 6.8 4.2 4.4 3.3 3.5 3.8 2.9 3.1 2.6 2.6
10-5 9.6 5.7 5.9 4.3 4.6 5.1 4.2 4.6 3.6 4.2
10-7 11.3 6.2 6.5 4.9 5.3 5.8 4.7 5.2 3.9 4.8
Table B.2: Coding gain Eb/N0 (dB-b-1) for soft-decision Viterbi decoding, QPSK
From Table B.2, the values of Eb/N0 in (B.53) and of Eb/Itot in (B.63) can be read and
used in the simulation.
The satellite capacity of either the MF-TDMA system or MF-CDMA system is returned
to SF. Then in SF, the system capacity in term of the number of simultaneous users
supported by the entire constellation is calculated. The calculation is slightly different for
polar constellation and Walker constellations. Because satellites in the polar constellation
all need to fly above the poles, at the poles there is a severe overlapping of satellites’
footprints. This overlapping causes a reduction in the overall system capacity of polar
189

constellation, which can be represented by the polar overlapping factor (POL)of 0.68 for
polar constellation. For Walker constellation, POL is 1 because Walker constellation
covers only below certain latitude and never passes the poles. Therefore the system
capacity equation is
POLNCC satsatsystem ××= (B.66)
B.8 Total Cost Module (TCM)
The cost module methodically computes the present value of the life-cycle cost of the
system. The method is modified on the basis of cost estimating relationships (CERs) in
Larson and Wertz [WLJR99]. A step-by-step introduction to the method will be given
after we introduce the inputs and output of the module. The inputs include the number of
satellites in the constellation, number of orbital planes, orbital altitude, antenna weight,
communication electronics weight, spacecraft bus dry weight, satellite mass (wet weight),
beginning-of-life power, flight software thousand lines of code, ground software
thousand lines of code, designed life of space segment, initial deployment time, number
of gateways, number of operations and support personnel, AKM type, AKM dry weight,
AKM impulse, discount rate, minimum launch cost, and ISL datarate. The output of the
module is the total present value of the life-cycle cost (LCC) of the designed system. All
cost terms in this module are in unit of thousand of U.S. dollars in fiscal year 2002.
In this module, it takes totally 16 steps to account for the LCC of the system. The first
step sets space mission characteristics. Most of these characteristics are design variables,
constants, or system parameters obtained in previous modules. There are two exceptions:
payload type and number of spare spacecraft. Apparently, the payload type is
communication. A spare satellite is typically launched into each orbital plane at altitude
lower than that of the regular orbit so that it is ready to replace a failed satellite in that
orbital plane. Therefore the number of spare spacecraft is set to the number of orbital
planes.
190

The second step accounts for the hardware cost of the research, development, test and
evaluation (RDT&E) phase. As the name suggests, this phase occurs very early in the
system life-cycle. It is a breakdown of the costs of antenna, communication electronics,
spacecraft bus, and apogee kick motor. Each cost is in relation with the weight of that
particular component except that the AKM cost is linear with the AKM impulse.
If antenna weight is Mant, then the antenna cost is found to be
59.01015 antant MC = (B.67)
The communication electronics cost is
7.0917CEWCCE = (B.68)
where CEW is weight of communication electronics. The cost of spacecraft bus is based
on SCBDW, the dry weight of spacecraft bus
SCBDWC busSC 11016253+= (B.69)
The AKM weight depends on AKM impulse and also on the AKM type. If the AKM is
spin-stabilized, then the cost is
AKMAKM JC 0518.0490 += (B.70)
If the AKM is 3-axis stabilized, which is more popular for current LEO communication
satellite design, then the cost is
AKMAKM JC 0156.0= (B.71)
191

The total hardware cost of the RDT&E phase is the sum of the above component costs.
Because the relations above are developed using 1992 USD value, de Weck and Chang
converted them to 2002 USD value by the inflation rate of 1.369. Therefore the hardware
cost is
( ) 369.1×+++= AKMbusSCCEant CCCCRDTEHC (B.72)
The third step is to find to find theoretical first unit (TFU) hardware cost. This step is the
same as the previous step except the component costs are calculated differently as
follows 59.023020 antant MC += (B.73)
CEWCCE 179= (B.74)
77.0185SCBDWC busSC = (B.75)
For spin-stabilized AKM,
72.058AKMDWCAKM = (B.76)
For 3-axis stabilized AKM,
AKMAKM JC 0052.0= (B.77)
The rest of step 3 is the same as step 2. The TFU hardware cost is
( ) 369.1×+++= AKMbusSCCEant CCCCTFUHC (B.78)
192

Step 4 is to find the hardware cost of every spacecraft produced. This step includes the
learning curve phenomenon that accounts for production cost reduction as the production
quantity increases. The reduction in cost is due to economies of scale, set up time, and
human learning. The total production cost of N units is modeled as
( S
N NTFUC %100log1 2−×= ) (B.79)
The learning curve slope S represents the percentage reduction in cumulative average cost
when the number of production units is doubled. Larson and Wertz [WLJR99]
recommend the values shown in Table B.3 for learning curve slope.
Number of units Learning curve slope
≤10 95%
10< and ≤50 90%
50< 85%
Table B.3: Learning curve slope values
The cost of the first unit is C1 given by equation (82) with N = 1; the cost of the second
unit is C2 – C1 where C2 is given by equation (82) with N = 2; the cost of the third unit is
C3 – C2 – C1, so on and so forth. The hardware costs of all units are assigned to elements
of an array called UHC.
Step 5 finds aerospace ground equipment cost for RDT&E. The cost is expressed in a
simple linear relation
( TFUHCRDTEHCAGEC += 11.0 ) (B.80)
Step 6 finds total program level cost for RDT&E and all units including TFU. First,
program level cost for RDT&E is
193

RDTEHCPLC ERDT 36.0& = (B.81)
Program level cost for all units is
∑= UHCuPLC (B.82)
Total program level cost is
uERDTtot PLCPLCPLC += & (B.83)
Step 7 is to find launch operations and orbital support cost. For launch without the use of
AKM, the cost per satellite is
satMLOOSC 51.2= (B.84)
For launch with AKM, the cost per satellite is
satMLOOSC 44.164 += (B.85)
The total cost of all satellite units is
369.1××= sattot NLOOSCLOOSC (B.86)
Step 8 finds flight software cost by scaling the thousand lines of code.
369.1375 ××= FSKLOCCFS (B.87)
Step 9 accounts for the minimum launch cost found in the launch vehicle module.
194

minlaunchLV CC = (B.88)
Step 10 finds ground software cost assuming the language used is Unix-C.
369.1190 ××= GSKLOCCGS (B.89)
Step 11 is to find total ground segment development cost, which is consisted of costs of
all the gateways and two command centers. Larson and Wertz [WJLR99] suggest that the
cost of developing a gateway (or ground station) has a breakdown as listed in Table B.4.
Ground Station Element Development Cost as Percent
of Software Cost (%)
Facilities (FAC) 18
Equipment (EQ) 81
Software (SW) 100
Logistics 15
System level
Management 18
Systems engineering 30
Product assurance 15
Integration and test 24
Table B.4: Ground segment development cost distribution
So the ground station development cost is simply
( ) GSCGSDC ×+++++++= 0024153018151008118 (B.90)
In addition to gateways, the system also needs command centers to control network and
satellite operations. Two command centers are assumed for the system. The cost of each
command center is the average of seven actual systems’ command center costs drawn
from their FCC filings. These seven systems are @contact, ARIES, GEMnet, Globalstar,
195

Orbcomm, Starnet, and VITA. The average cost is 11.856 million USD. Therefore the
total ground segment development cost is the sum of the costs of all the gateways and
two command centers.
CCCGSDCNGSDC GWtot ×+×= 2 (B.91)
Step 12 is to find initial development cost (IDC), which is the cost up to the onset of the
service of the system. To get IDC, we need to sum up all the costs we have calculated
previously.
LV
ofsize
itotFStottoti CGSDCCLOOSCPLCAGECRDTEHCIDC ∑
=
+++++++=UHC
UHC1
(B.92)
In order to find the present value of the cost, a cost distribution over development time
needs to be modeled first. To be clear, the life-cycle of the system is consisted of two
stages. The first stage is the initial development time (IDT) that starts with the RDT&E
stage of the system, and extends till the deployment of the entire system. The second
stage is the space segment life, which starts with the completion of system deployment
and onset of service, and lasts until the end life of the satellites. In step 13 we look at the
cost distribution in IDT. Larson and Wertz [WLJR99] suggest finding the cost spreading
by a function of the form
( ) ( )( )[ ] ( )[ ] ( )[ ]( ) 432 451156102041510 SSBASSSBSSSSASF −+−+−++−−+= (B.93)
where F(S) is the fraction of cost consumed in time S, S is the fraction of the total time
elapsed, and A and B are empirical coefficients. Coefficients A and B depend on
percentage of expenditure at schedule midpoint. For project involving more than two
satellites, 50% expenditure at schedule midpoint is suggested, and the corresponding A
and B are 0 and 1.00. Using these values, it is easy to find the cost per year for each year
196
during the IDT. These values are stored in array Cyear. As mentioned above, we assume
the IDT to be a constant at 5 years.
Step 14 gives operation and support cost per year during space segment life time. The
yearly maintenance cost per gateway is
( ) yearFACEQSWCmaint ++×= 1.0 (B.94)
For personnel cost, contractor labor is estimated to cost $140K/staff year. Also 150 staff
members are assumed to keep the business running, besides the personnel at the
gateways. Summing the maintenance and personnel costs, the total operation and support
cost per year is
( )150140 ++×= personnelGWmaintyearperOS NNCC (B.95)
In step 15, COS per year is distributed over space segment life time. Because the
maintenance and personnel costs are assumed constant throughout the years, we simply
assign the value of COS per year to each year in the space segment life time. After appending
the space segment life time yearly cost to it, Cyear covers the entire life-cycle of the
system.
∑=
=yearC
yearCofsize
iitotC
1 (B.96)
In step 16, an additional fee is accounted as 10% of the total cost. So the final total cost
Ctot is
( ) ∑=
+=yearC
yearCofsize
iitotC
11.01 (B.97)
The value of the total cost is returned to SM.m as the life-cycle cost.
197

B.9 End User Terminal Module (EUTM) EUTM estimates the unit cost and one time activation fee of a paging end user terminal
given certain input characteristics. The inputs to the module are the number of characters
that can be sent in a message, whether the terminal is desired to be one-way or two-way,
whether it has a keyboard, the size of its physical volume and its memory storage level.
For each input there is more than one level that can be inputted. They are as follows:
• For the number of characters, the input can be 1-100 characters, 101-250 characters or
251-500 characters per message
• The one-way or two-way input is a Boolean variable representing either that the pager
is one-way or two-way.
• The keyboard input is also a Boolean representing the presence or absence of a
keyboard. Note that given advances in current technology it is possible to have a virtual
keyboard by which one can input letters without the traditional keyboard format.
• The physical volume parameter can take the values of 1 to 4.9 inches cubed or 5 to 8.9
inches cubed
• The memory storage level input can take values of 1 to 5000 bytes, 5001 bytes to 100
KB or 200 KB to 4.5 MB
A Design of Experiments (DOE) analysis was conducted on a number of pagers that have
attributes within the various ranges as detailed above. Note that each of the inputs
described above are known as the factors within the DOE analysis. Also as detailed
above, each factor can take different levels of values. The DOE facilitates a formulaic,
decisive approach to deciphering the output of a system with many inputs that can take
more than one level of input values. In this case the final output is the pager end user
terminal unit cost plus a standard one time activation fee. The formulas resulting from the
DOE process which incorporate each level of each input attribute are modeled into
198

MATLAB such that through choosing a combination of any level of each input variable
one can gain a value for the end user terminal cost plus one time activation fee for a
terminal harboring the characteristics inputted.
Table B.5 demonstrates the paging end user terminals data set. It details all the pagers
assessed and the values for each factor for each pager analyzed. The unit cost and
monthly charge for each pager are also detailed in Table B.5. Across all the factors and
costs reported, the average value of each factor and the costs are reported in the final row
of Table B.5. This will be instrumental in calculating the costs of the pager given specific
inputted factor levels.
Pager Name
Trt/Rec (T+R=1; T = 0)
Keyboard (yes = 1, no = 0)
Number of characters
Volume (inches^3)
Memory (bytes)
Unit cost (including activation fee; 2002 US $)
Monthly Charge (2002 US $)
MBR850 0 0 20 2.5 1200 65 20
MPE 0 0 20 3.680 320.000 30.000 20.000
MBF 0 0 20 3.780 320.000 40.000 20.000
MAE 0 0 240 5.030 4560.000 70.000 30.000
T900 1 1 500 5.400 70,000.00 99.000 15.000
ALII 1 0 500 5.280 4,000,000.00 70.000 15.000
T350 0 0 250 5.280 1600.000 30.000 17.000
PF1500 1 0 250 4.449 100,000.00 50.000 17.000
Jazz 0 0 250 2.682 2200.000 40.000 60.000
Average 227.78 4.23 464,466.67 54.89 23.78
Table B.5: Paging End User Terminals Data Set
Table B.6 details the specific amount by which each level of each factor changes the unit
cost plus activation fee and the monthly charge respectively. This was calculated as
follows: Taking level 1 of the factor of number of characters for instance (i.e., 1 to 100
199

characters) the average of the unit cost plus activation fee parameter for all the pagers
which have level 1 values for their number of characters parameter is calculated. The
average of the unit cost plus activation fee for all the pagers across all levels of this factor
(i.e., the 7th column and final row element of Table B.5) is subtracted from the value
previously calculated for the average cost for the number of characters level 1 cost
values. The result indicates how much the average unit cost plus activation fee value
would change if a pager with the level 1 value for the number of characters factor was
used.
Table B.6 details in entirety how much both the unit cost plus activation fee parameter
and the monthly charge parameter’s average values reported in the last row of Table B.5
would change if any level of each factor is inputted into the EUTM to create a desired
pager unit. The MATLAB implementation of this module incorporates every possible
combination of factors and their respective levels and given the values in Table B.6
consequently calculates what the final values for the unit cost plus activation fee and the
monthly charge would be given the inputted factor levels.
200

Factor Level Unit cost + activation fee
Monthly Charge
#char level 1 (1-100) -9.889 -3.778 level 2 (101-250) -7.389 7.222 level 3 (251-500) 29.611 -8.778
tran/rec level 1 (0) -9.056 -2.778 level 2 (1) 18.111 -8.111
keyboard level 1 (0) -5.500 1.097 level 2 (1) 44.111 -8.778
volume level 1 (1 to 4.9 in^3)
-9.889 3.622
level 2 (5 to 8.9 in^3)
12.361 -4.528
memory level 1 (1 to
5000) bytes -9.056 4.056
level 2 (5001bytes - 100 KB)
19.611 -7.778
level 3 (200KB - 4.5MB)
15.111 -8.778
Table B.6: Pager Data Set Main Effect Calculations
Hence for this analysis the chosen pager resulted in the following unit cost plus activation
fee ( the monthly charge is calculated but not reported as this largely depends on the
lifecycle cost of the system used to provide connectivity and would thus be dependent on
the system operator of the proposed system to set). Note all values shown in the
calculations that follow are taken from Tables B.5 and B.6.
201

Average unit cost plus activation fee = $54.89
1 -100 characters changes average value by - $9.889
Two way functionality changes average
value by
+ $18.111
No keyboard present changes average
value by
- $5.500
Volume of 1 – 4.9 inches cubed changes
average value by
- $9.889
Memory capacity of 1 to 5000 bytes
changes average value by
- $9.056
Resulting cost for pager with the above
factor levels =
$38.67
This value of $38.67 is what an end user would have to pay for a pager with the levels of
each factor as described above. The above attributes were the attributes of the pager
selected as the pager of choice in the system analysis and contributed to the green vertical
cost to the user line in Figure 3-5. If the values for each level were to be changed by the
system designer the resulting cost for the pager unit would change. The EUTM can be
used to decipher the cost of a pager unit given any combination of levels for each factor.
B.10 Total Number of Subscribers for Pareto Architecture
The following analysis demonstrates how the total number of subscribers value of 81,
259, 200 subscribers was arrived at for the most ideal Pareto optimal architecture
resulting from the system simulation. The capacity of the most ideal Pareto architecture is
16,720 users as shown in Table 3.9 for design number 8. Recall that as shown in Table
3.4 the data rate per user channel is 4800 bits per second. Also recall that each SMS
message can hold up to 160 characters, and there are 8 bits in every character and thus
(160 * 8) = 1280 bits in every message. Hence the number of messages per user per
second that the Pareto satellite system can accommodate is given by:
202

messagebitsonduserbits
/1280sec//4800 = 3.75 messages/second/user (B.98)
With a total capacity of 16, 170 users the system can send the following number of
messages per second:
usersondusermessages 720,16sec//75.3 ∗ = 62,700 messages/second (B.99)
However the satellite system will most likely not operate at 100% capacity at all times.
For systems such as this, the fraction of available capacity that is actually used is
normally approximately 15%. [deWDC03a] Hence the number of messages that the
system will send per second accounting for this average 15% usage equals:
ondmessages sec/700,6210015
∗ = 9,405 messages per second (B.100)
With knowledge in hand of the number of messages that the system will send per second,
the number of seconds in a day and the number of messages that each user will send and
receive per day, one can now calculate the total number of subscribers to the satellite
system as follows:
messagesdayuser
dayonds
ondmessages
10/1
1sec400,86
sec1405,9
∗∗ = 81, 259, 200 subscribers (B.101)
Hence the Pareto optimal system resulting from the simulation in this analysis could
serve 81, 259, 200 subscribers when 15% of the total system capacity is being utilized.
203

B.11 Output assignment and Postprocessing
The last step in the for-loops of the SF is to assign the values of the objectives to the
objective vector J, the benchmarking parameters to B, and requirements to r. This
concludes the nested for-loop.
The post-processing is carried out at the end of SF. It involves finding the Pareto front of
the design space. This character of the design space exploration was introduced in the
design space exploration and optimization section of Chapter 3. Before exploring the
design space, benchmarking was performed to prove the fidelity of the simulation.
204

Appendix C
Developing World Survey As mentioned in Appendix A, for the purposes of this research I developed a survey to
act as a relevant and detailed assessment of the digital divide for developing countries.
Great care was taken to ensure that the survey was relevant, asked the right questions and
would strike the balance between not being too time intensive while still providing an in-
depth view of the state of communications technology in the developing world. The
survey in its exact form as it appeared to potential respondents via World Wide Web
format is shown below in Figure C-1. The survey was sent to one of each of the ITU’s
189 member country representatives (many countries have more than one member
organization) in the hopes that a statistically significant response rate would be achieved.
A reasonable response rate from the survey had the potential to add immense value to my
research.
The purpose of this survey was firstly to give a snapshot of the state of development of
the telecommunications sector within the country the respondent represents. This would
then allow for the identification of the current communication needs of each country
surveyed. Additionally, the information from the survey would provide a tangible idea of
the role the respondent feels satellites could play in providing communications
applications to the underserved in developing and even in developed countries. Another
major thrust of the survey was to assess the feasibility of a paging system with a satellite
backbone which would provide connectivity in regions currently underserved by
communications technologies. Lastly, the survey allowed for the prioritization of the
applications viewed as most needed by the respondent along with the identification of
barriers impeding growth in the telecommunication sector of the respondent’s country.
205

Potential respondents were informed that participation in the survey was voluntary and
that they could decline to answer any or all questions. Also the survey did not have to be
filled out at one sitting, responses could be saved and the survey returned to at a later
date. Respondents could also decline further participation, at any time. All respondents
were informed that anonymity would be ensured by representing all data obtained with
the country represented by the respondent as the sole identifier. No personal details of the
respondent would have been used when processing and representing the survey results.
Email was the means used to contact potential respondents. Between the ITU member
countries not having email addresses or not having a valid email addresses, in all 160
requests to fill out the survey in Figure C-1 were successfully sent out. From that Figure a
total of 10 member countries responded after an approximate 3 month period. The ten
responses did not represent complete responses from each individual. As a result of the
paltry 6% response rate, I was unfortunately not able to use the survey as a resource for
my thesis.
The effort was a learning process however and I thought it worthwhile to share the
insight I learned. The following would be my recommendations to future researchers
seeking to conduct a global survey in the information and communication technologies
for development sphere.
1. In the ICT realm, there still is not much organized national data available from
one telecommunications source, be it in the public or private sector. In my
opinion, a major contributant to my survey’s low response rate is that the
telecommunication agencies contacted simply did not know the answer to a lot of
the questions asked and I would not be surprised if the body to be approached to
respond to the answers was not much clearer either.
206

2. Email should not be the only means of contact, it is best if you can visit the
administration you want to interview and interview relevant personnel face to
face. Failing that, a phone interview would be the next best medium to pursue.
3. Incentives of some form are essential. My survey did not have an incentive and
this could have been another major contributant to the low response rate.
4. No matter the purpose, try to stick to a time limit of less than or equal to 10
minutes for the average person to fill out the survey. Once a potential respondent
takes a look at the survey and sees that it will probably take more than 10
minutes, the opportunity to gain a response from him or her may be lost.
5. Do not ask for personal information if at all possible.
6. Have a means by which you can follow up with potential respondents to remind
them to fill out the survey.
207

Assessment of the Digital Divide for Developing Countries
Respondent Data
1. What is your full name?
2. What is your email address?
3. What is your work telephone number?
4. Which country do you represent?
5. Signatory to ITU since when?
6. Is there an Organization of Telecomm domestically and if applicable under what Ministry?
Yes No
Under which Ministry?
7. What is your position at ITU/in your country’s telecomm Ministry/administrative agency?
8. Please indicate whether your country is a stakeholder in an International Satellite organization/s such as: (Intelsat, EutelSat, ArabSat, InmarSat for ex.)
Land Based Wired Communications (including Copper and fiber optics)
9. Percentage of households with electricity?
208

1-5%
6-10%
11-15%
16-20%
21-25%
26-30%
31-35%
36-40%
41-45%
46-50%
51-55%
56-60%
61-65%
66-70%
71-75%
76-80%
81-85%
86-90%
91-95%
96-100%
10. Cost of a basic radio that has AM/FM functionality only (in US $)? (example: $5)
11. Estimation of growth rate of terrestrial PSTN subscribers in the last four years (i.e. 2000-2001-2002-2003)? (example: 2000 – 10% subscriber growth rate (gr) ; 2001 – 8% subscriber gr; 2002- 7% subscriber gr; 2003 – 4% subscriber gr.)
12. Estimation of growth rate of PSTN land telephone lines over the last 5 years. (example: 2000 – 10% growth rate of land telephone lines (gr) ; 2001 – 8% gr; 2002- 7% gr; 2003 – 4% gr)
Terrestrial Cellular Communications
13. Number of mobile telephone numbers issued? (example: As of this year there have been approximately 2,453,678 mobile telephone numbers issued)
14. A map of cellular coverage as of 2004 (where available please provide internet URL) – or estimate percentage of landmass where terrestrial cellular coverage exists.
15. Estimation of growth rate of percentage land mass coverage by terrestrial cellular systems over the last 5 years. (example: "Over the last 5 years Tanzania has experienced a growth rate of 17% in the percentage land mass covered by terrestrial cellular systems.")
16. Estimation of the number of mobile users your country has had over the last four years (2000-2001-2002-2003). (example: 2000 – 100,000 mobile users; 2001 –
209

150,090 m. users; 2002- 476,450 m. users; 2003 – 876,543 m. users)
17-22. Current mobile telephone protocols in use by your Telecom industry?* (more than one answer may be indicated)
GSM-9.6 kbit/s
IS-136/TDMA-57.6 kbit/s
PDC-28.8-kbit/s
IS-95A/CDMA-64kbit/s
GPRS- 171.2 kbit/s
IS-95B/CDMA-115kbit/s * the kbit/s Figure given represents the maximum speed that the mobile protocol operates within.
Satellite based communications
23. Number of Satellite Television receivers per 100 people? (example: 24 satellite television receivers per 100 people)
24. What role if any are satellite services playing in assisting to bridge the digital divide in your country?
Market, Competition, Affordability and Regulatory Issues
25. Internet access tariff in US $ (for sample 20 hours per month package)
26a. For Mobile phone service (please give any requested costs in US $) i. What is the percentage of prepaid subscribers?
ii. What is the cost of sending one SMS?
iii. What is the cost of sending one MMS?
210

iv. What is the cost of a basic mobile phone?
26b. Internet access (please give costs in US $) i. What is the cost of one hour in a cybercafe?
ii. What is the cost of Wi-Fi access for one hour (if available)
iii. What is the cost of a basic desktop computer?
27. Number of Internet Users per 100 Inhabitants (Internet user is defined as someone who uses the internet at least once a month whether it is via his/her own equipment or not).
28. Telecom market competition in your country? Pick one.
a. Monopoly (single provider) Please provide name:
b. Oligopoly (few providers) Please provide names:
c. Free Market competition (Many, >3 providers). Give names of three main Telecom providers:
29. What percentage of your population would you say is below the poverty line (poverty line defined as living on less than US $2 a day? (example: 28%)
Potential for a low cost SMS based paging system
30. Estimation of the amount (specific components outlined below) an individual earning an average salary would be willing to pay for a paging service such as short messaging service (SMS) in regions where no other communication option exists?
a. For purchase of a paging/SMS only type device (end user terminal)
b. For monthly subscription fee that comes with 300 SMS messages for example?
211

c. For cost per message when not dealing with prepaid SMS packages?
Particular Needs and Challenges
31. Are you of the opinion that there are a sufficient number of local websites providing national news, tending to civic matters and addressing public and private sector concerns that are available in the countries local and/or official language? (example: yes/no)
32. Are problems currently being faced due to insufficient cellular/telecomm coverage, if so what are three of the main issues contributing to these problems? a. Issue 1:
b. Issue 2:
c. Issue 3:
33. What is the current state of your country’s communication infrastructure?
1. much improved over the last 10 years but still deeply lacking, deepest issue currently lies with...
2. current situation in need of injection of funds and proper planning but can be ameliorated if such resources become available
3. deeply lacking, terrestrial connectivity media absent, satellite communications applications only real answer
4. other
Particular Needs and Challenges (continued)
212

34. What are major potential benefits of satellite based telecommunications services in your country? (These could be services that are either not being currently provided or are not being offered at desirable levels.) Please cite specific examples (e.g. person-to-person communications, telemedicine, tele-education, emergency service response, e-commerce, e-government, earth observation [e.g. monitoring of fish populations, water level and water cleanliness observation and hence management, etc...]).
35. What are the major impediments to the use of satellite based communications services in your country? Please be as specific as you can.
36. What is the historical context of your country’s communications industry?
1. A monopoly/oligopoly is in existence, this provider offers a diverse array of services, with cost being the only debilitating factor.
2. A monopoly/oligopoly is in existence with a limited number of available services. This monopoly/oligopoly presents high barriers to new entrants.
3. There are no incentives for people to invest in the communications industry, current regulatory atmosphere too strict
4. Other?
37. What type of communication services would you say are most needed in your country at this time? (more than one answer may be indicated)
213

1. PSTN
2. Voice applications (mobile connectivity)
3. VOIP
4. Data services (broadband applications)
5. Wide Scale Multimedia applications (telemedicine, tele-education, disaster recovery, e-commerce etc.)
6. Other?
38. What do you feel the introduction of an SMS paging system with coverage over your countries’ entire surface area could do for your country? (more than one answer may be indicated)
1. enable connectivity in regions where there is none and thus would make real initial steps towards bridging the digital divide
2. infrastructure deeply lacking to enable this technology
3. basic literacy issues could be an obstacle
4. would not make much of a difference given the ‘saturation’ in the communications department of the country
5. would not be of much use...
6. Other?
Figure C-1: Developing World Survey
Bibliography
214

[AL82] Andre Lebeau, “The Development of Satellite Communications and its
Socio-Economic Implications.” Earth-Oriented Applications of Space Technology, Vol. 2, No. 3-4, pp. 221 – 224, 1982.
[ARSE03] Arianespace official website. http://www.arianespace.com/site/index2.html [August 4, 2003].
[AT02] Andrew E. Turner, “Constellation Design Using Walker Patterns.” AIAA/AAS Astrodynamics Specialist Conference and Exhibit, Paper No. AIAA 2002 – 4636, August 5-8 2002. Monterey, California
[BBC05] The British Broadcasting Corporation news service See http://news.bbc.co.uk/go/em/fr/-/2/hi/africa/4437447.stm [April 13, 2005]
[BN94] Birgitta Naeslund. “Policy and Regulatory Issues Affecting the International Satellite Organisations: The EUTELSAT Perspective.” 45th Congress of the International Astronautical Federation. October 9 – 12, 1994. Jerusalem, Israel
[CALT03] China Academy of Launch Vehicle Technology (CALT) official website English version. http://www.calt.com.cn/new/english/ [4 August 2003].
[CD04] China Daily News. See http://www.chinadaily.com.cn/english/doc/2004-04/16/content_324043.htm [April 16, 2004]
[CIAWFB] Central Intelligence Agencies’ World Factbook. See http://www.cia.gov/cia/publications/factbook/ [ May 1, 2005]
[CJ03] Calestous Juma, Research Presentation, Computer Professionals for Social Responsibility Conference. Cambridge, MA, USA. 2003
[DA04] Danielle Adams, Research Presentation, Massachusetts Institute of Technology, 2004.
[DC04] Darren D. Chang, “Quantifying Technology Infusion and Policy Impact on Low Earth Orbit Communication Satellite Constellations.” Science Master, Massachusetts Institute of Technology, 2004.
[deWDC03a] Olivier L. de Weck and Darren D. Chang, MIT Industry Systems Study, Communications Satellite Constellations; Version 1.1, October 20, 2003. Engineering Systems Learning Center (ESLC), Massachusetts Institute of Technology; Units 1 & 2.
215

[deWDC03b] Darren D. Chang and Olivier L. de Weck. Basic Capacity Calculation
Methods and Benchmarking for MF-TDMA and MF-CDMA Communication Satellites. 21st AIAA International Communications Satellite System Conference (ICSSC) and Exhibit, 2003.
[deW03] Professor Olivier de Weck and Professor Karen Wilcox, Multidisciplinary System Design Optimization, Lecture 14, Multiobjective Optimization (1), March 31, 2003.
[DJW] David J. Whalen. Communications Satellites: Making the Global Village Possible. NASA Headquarters, Washington, DC. See http://www.hq.nasa.gov/office/pao/History/satcomhistory.html [May 6, 2005]
[DOI01] Digital Opportunity Initiative; www.opt-init.org; “Creating a Development Dynamic.” Digital Opportunity Initiative Report, July 2001.
[ECON05] The Economist Magazine, March 12, 2005 issue
[ECON05a]
The Economist, “Calling Across the Divide.” March 12, 2005 issue, p. 74
[ECON05b] The Economist, “The Real Digital Divide.” March 12, 2005 issue, p.11
[ECON05C] The Economist, “Behind the Digital Divide.” March 12, 2005 issue, p. 22.
[HC97] Harry E. Cook. Product Management, Value, Quality, Cost, Price, Profit and Organization. Chapman & Hall Publishers, 1997.
[HM97] Hamid Mowlana, “Political and Social Implications of Communications Satellite Applications in Developed and Developing Countries.” Chapter 5 from “Economic and Policy Problems in Satellite Communications.” (A77-30591 13-80) New York, Praeger Publishers, Inc., 1997, p. 124-142
[INFOD] Information for Development International Consortium. See www.infodev.org [May 6, 2005]
[ITU] The International Telecommunication Union. See www.itu.int [May 6, 2005]
[ITU04] The International Telecommunication Union’s sixth annual Internet
216
report, “The Portable Internet.” Chapter 5: "The Portable Internet as a Tool for Bridging the Digital Divide.” September 2004.
[ITUD04] The International Telecommunication Union Development Sector’s Study Group 1 Report on Satellite Regulation in Developing Countries. 2004. See http://www.itu.int/itudoc/itu-d/question/studygr1/q17-1-ii.html [May 6, 2005]
[JAF88] Journal of the Air Force, Volume 81, Number 12. December, 1988.
[JG05] The Jamaica Gleaner Newspaper. Editor’s Letter. May 4, 2005. See http://www.jamaica-gleaner.com/gleaner/20050504/cleisure/cleisure1.html [May 4, 2005]
[JKWE00] J.E. Kadish and W.R. East. Satellite Communications Fundamentals. Artech House, Boston, 2000.
[JP94] Dr. Joseph N. Pelton. “Overview of World Satellite Systems: Key Trends and Patterns Toward Open Competition.” 45th Congress of the International Astronautical Federation. October 9 – 12, 1994. Jerusalem, Israel
[MOU03] Memorandum of Understanding signed by the International Telecommunication Union and the Jamaican Ministry of Science, Technology and Commerce for a National Jamaican E-Learning Project, 2003.
[MW02] Mark Weisbrot. “Economists in Denial.” Center for Economic and Policy Research, Washington, D.C., USA, August 5, 2002
[ORBM] The Orbcomm Satellite System. See www.orbcomm.com [May 6, 2005]
[PSdeW04] P.N. Springmann and O.L. de Weck. “A Parametric Scaling Model for Non-Geosynchronous Communications Satellites.” AIAA Journal of Spacecraft and Rockets, 41, No.3, pp.472-477, May-June 2004.
[SAT] ‘Space and Tech’ editorial. See http://www.spaceandtech.com/digest/flash2002/flash2002-012.shtml [May 6, 2005]
[SIJHJH99] S.J. Isakowitz, J.P. Hopkins Jr., and J.B. Hopkins. “Reference Guide to Space Launch Systems.” AIAA, Reston, VA, 1999.
217

[SPEC04] Institute of Electrical and Electronics Engineer’s Spectrum Magazine, February 2004 edition, “Digital Divide Index Report,” www.spectrum.ieee.org.
[SPNS01] SPACENEWS Profile on Mazlan Othman, Director, United Nations Office for Outer Space Affairs. October 29, 2001
[ST94] Shola Taylor. “Satellite Communications in Developing Countries – In Search of a Viable Regulatory Framework.” 45th Congress of the International Astronautical Federation. October 9 – 12, 1994. Jerusalem, Israel
[TEXT04] ‘Text.it’ – a web resource containing information regarding text messaging in the United Kingdom. See http://www.text.it/mediacentre/default.asp?intPageId=664 [May 09, 2005]
[TI94] Takashi Iida et al., “LEO Satellite Communications System for the Countries in the Low-Latitude Region.” AIAA 15th International Communications Satellite Systems Conference. Technical Paper No. (A94-22651 05-32), February 28 – March 03, 1994. San Diego, California
[TL93] Thomas J. Lang, “Optimal Low Earth Orbit Constellations for Continuous Global Coverage.” AAS/AIAA Astrodynamics Specialist Conference, Paper No. AAS 93-597 August 16-19 1993. Victoria, B.C., Canada
[TLWA97] Thomas J. Lang and W.S. Adams "A Comparison of Satellite Constellations for Continuous Global Coverage", paper 1.4, IAF International Workshop on Mission Design and Implementation of Satellite Constellations, Toulouse, France, November 17-19, 1997.
[WALR87] W.S. Adams and L. Rider, “Circular Polar Constellations Providing Continuous Single or Multiple Coverage above a Specified Latitude.” The Journal of the Astronautical Sciences, Vol. 35, No. 2, April – June 1987, pp. 155 – 192.
[WBNK] The World Bank. See www.worldbank.org [May 6, 2005]
[WG05] The World Gazetteer http://www.gazetteer.de/home.php [May 16, 2005]
[WLJR99] W. J. Larson and J. R. Wertz. Space Mission Analysis and Design.
218

Microcosm Press and Kluwer Academic Publishers, 1999.
[WN89] Wolf D. von Noorden, “Mobile Satellite Communications: Applications for Developing Countries.” Symposium on Space Commercialization: Roles of Developing Countries, Technical Paper No. (A91-38976 16-12), March 5-10, 1989. Nashville, Tennessee.
[WSRN] WorldSpace Satellite Radio Network. See www.worldspace.com [May 6, 2005]
219

220