
“A Sustainable Dental Clinic Business Model which Achieves the ...
67
“A Sustainable Dental Clinic Business Model which Achieves the Triple Aim while Meeting Your Community`s Oral Health Needs” FOM/IT October 2015
Transcript of “A Sustainable Dental Clinic Business Model which Achieves the ...

“A Sustainable Dental Clinic Business Model which Achieves the Triple Aim while Meeting Your Community`s Oral Health Needs”
FOM/IT October 2015
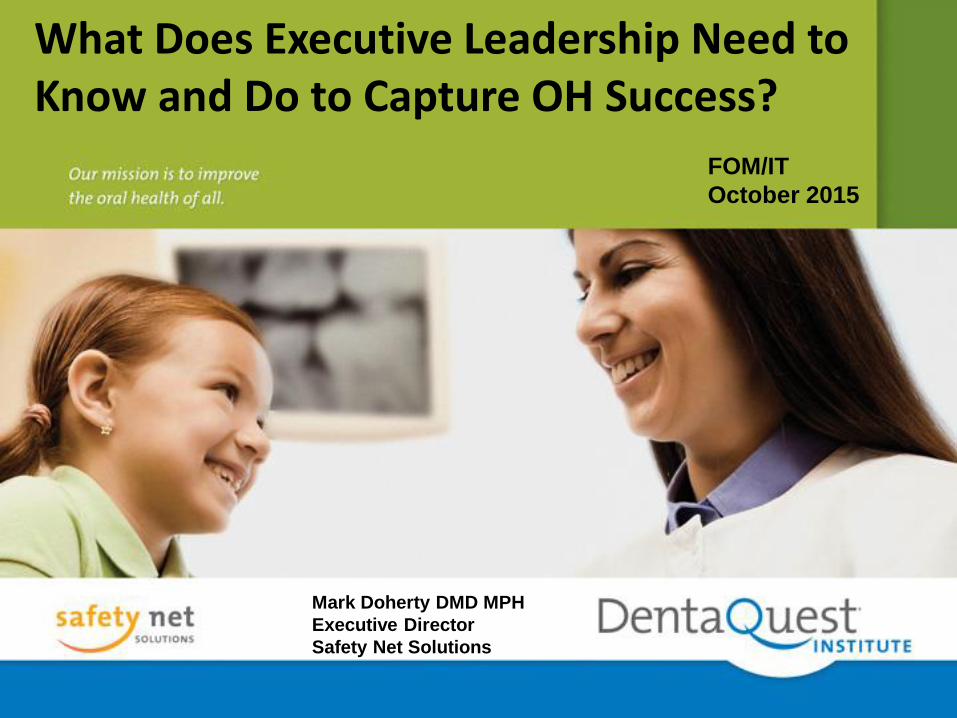
Mark Doherty DMD MPH
Executive Director
Safety Net Solutions
FOM/IT
October 2015
What Does Executive Leadership Need to Know and Do to Capture OH Success?


Who?
1. Teaches us dental business in the Safety Net?
2. Gives us the knowledge and guidance we need to run a sound dental department?
3. Even defines what a sound dental department would be?
4. Gives us the tools, policies and operational strategies we need?
5. Defines how many dental visits we should have?
6. Defines the types of dental services we should provide ?
7. Describes how to determine a nominal dental fee?
8. Teaches us how to create the sliding fee schedule in dental?
9. Defines how to create a scope of project in dental and then…. What our correct scope of service should be within that SOP?
10. Who determines for us and shares with us what each service we provide in dental will cost us?

What We Share and Teach • For Administrators/Executives/C-Suite members of an FQHC :what
a practical, successful HC oral health program should look like in relation to balance in: Access, Quality, Affordability and Outcomes within governance compliance and with a sound financial plan
• How an effective executive team could provide proper support and infrastructure to help create an efficient and effective oral health program
• What we need to know before we create a business plan and then how to create a sound business planning approach to an FQHC oral health program
• What a dental director and/or oral health program practice manager should know to establish clarity around program and individual goals; roles; responsibilities and timelines
• The 10 most important areas to prioritize for the development of an efficient and effective FQHC oral health program as learned from the analysis and work with of over 400 safety net dental programs

We get the results we tolerate
What gets measured gets done
Clarity around Goals, Roles, Responsibilities and Timelines
Evaluation of individuals is around how they fulfill their: Goals, Rolls, Responsibilities and Timelines
The biggest challenge in HCs is Health IT
5 Nuggets

Sound Business Plan Development

Our Largest Failure
Understanding Our Capacity

Potential vs. Actual Capacity based on
FTE Dentists
# of FTE
Providers
X 1.7
Visits/FTE/
Clinical
Hour
X # of
Clinical
Hours
Potential
Visit
Capacity
Actual
Visits
% of
Capacity
Achieved
Mon. %
Tues. %
Wed. %
Thurs %
Fri %

Benchmark Budget Breakdown
• Practice Overhead: 66%
• Payroll (salary, taxes, & fringe benefits) : 55%
• Lab fees: 5%
• Office Supplies: 1%
• Depreciation 4%
• Facility Costs 5%
• Dental Supplies: 17%
• Repairs: 2%
• Marketing/Promotion: 1%
• Recruitment: 1%
• Building, Utilities, telephone 8%

Benchmark Accounts Receivable
• Current A/R: 68%
• A/R less than 90 days 20%
• A/R greater than 90 days 9%
• A/R written off as uncollectible 2-4%

Benchmarks • 2500-3200 encounters/year/FTE dentist
• 1300-1600 encounters/year/FTE hygienist
• 2700 encounters/year with 1100 patient base
• 1.7 patients/hour or 13.6 patients per day per dentist
• 8-10 patients/day for hygienists
• Gross Charges = >$400K- $500K per dentist per year

Benchmarks cont. • 230 work days/year (or 1600 work hours/year after
holidays and vacations)
• $171 average cost per encounter (UDS 2014)
• 330 Allocation = 11% average
• 2 Chairs/dentist (3:1 is ideal)
• 1.5 Assistants/dentist (1 DA per chair is ideal)
• 2.5 ADA coded services/treatment visit
• 2 ADA coded services as the diagnostic part of a recall or comprehensive visit (exam, FMX)

Benchmarks cont. • 2 ADA coded services as preventive part of a recall/comp
exam visit (Prophy, FL)
• All sealants needed (1,2,3 or 4) at sealant visit or as part of recall or comp exam visit.
• Blood Pressure on all new patients, rechecked annually, at every visit with anesthesia on hypertensive patients, and at all extraction/surgical visits.
• Services should not be unbundled. The community standard of care needs to be upheld.

The Five Areas to Understand and Own
• Access
• Affordability
• Outcomes
• Quality
• Financial Success
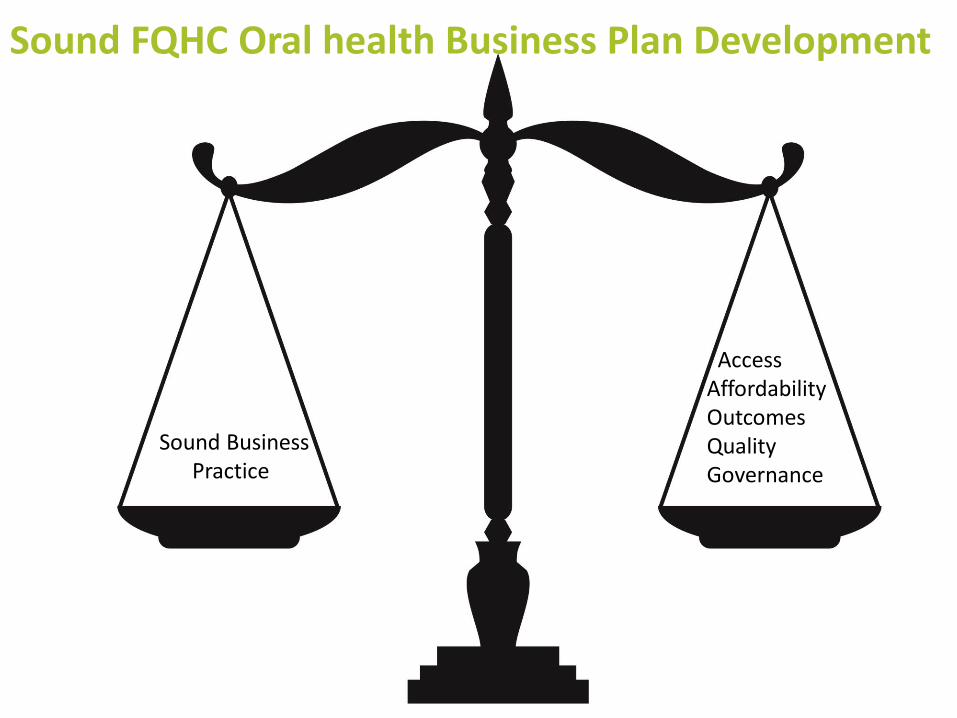
Sound Business Practice
Access Affordability Outcomes Quality Governance
Sound FQHC Oral health Business Plan Development

Oral Health in the Safety Net 101 for Executives

Medical Dental
• 80% of clinic volume • 80% of visits= similar • 80% of visits=shorter • 80% of billing similar • 80% of visits diagnostic • 80% of RVU similar • 100% of governance is
designed around Med. • EMR silo • Familiar with medical
model • Confident Leadership
• 20% of clinic volume • 80% of visits varied • 80% of visits=longer • 80% of billing varied • 80% of visits treatment • 80 % of RVU different • 0% of Governance is
designed around dental • EDR silo • Not familiar with dental
model • Lack of Confidence

Are Different!!!
MEDICAL
DENTAL
Defining Success:
• Access
• Finance
• Health Outcomes
• Quality

What Data Should We Collect?
• Number of Visits
• Gross Charges
• Net Revenue
• Expenses
• # of Services(CDT)
• Revenue per Visit
• Cost per Visit
• Services per Visit
• No-Show Rate
• Emergency Rate
• # of Completed Treatments
• % Children seen Receiving a Preventive Service
• A/R out 90 days

Other Data to Consider?
• Gross Charges
• Net Revenue
• Expenses
• Number of Visits
• Revenue per Visit
• Cost per Visit
• # of Unduplicated Patients
• # of New Patients
• # of Transactions
• # of Transactions/visit
• No-Show Rate
• Emergency Rate
• # FTE Providers
• # FTE Billing Staff
• # of Completed Treatments
• # of Children Receiving Sealants (under 21)
• # of Sealants Applied
• % Children seen Receiving a Preventive Service
• A/R out 90 days

Top Priorities for Dental
1. Understanding What Success Should Look Like in Dental
2. Collecting Data that is :Accurate, Meaningful and Timely.
3. Computing and Understanding your actual Capacity
4. Setting Clear :Goals, Roles and Timelines for both the Dental Team as a whole and Individuals in :Productivity; Access; Quality; Finance and Health Outcomes.
5. How to use the Dental Schedule Strategically! .
6. Having the right policy for “Everything”!!!!
7. How to actively Manage : No-Shows/Last Minute Cancellations; Self Pay Patients; Front Desk; Payer Mix ; Customer Service; Billing; Emergencies; priority populations; scope of service
8. How to Create a Dental Culture of Accountability
9. How to Execute a Quality Management System including CQI and QA in Dental and in the CHC
10. What your own Executive Leadership should look and feel like to best enable and support Dental

SNS is: (L) Danielle, Laura, Dori, Mark, Da-Nell and Caroline
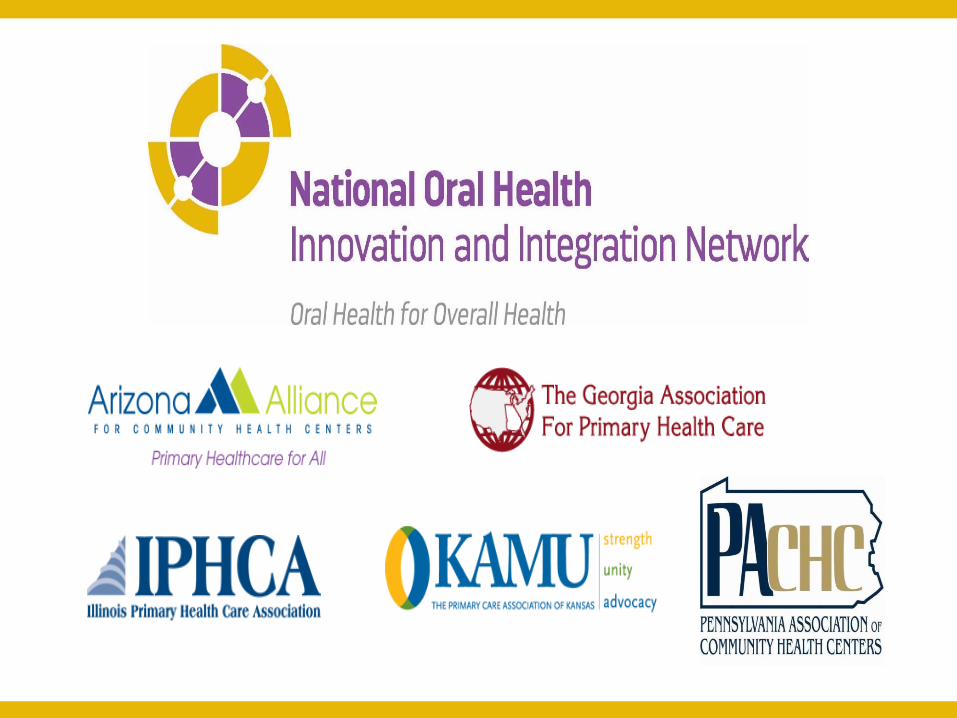

What is NOHIIN?
• Purpose – Build connections among PCAs, and create value for the PCAs that are participating in this network through the development and sharing of resources, tools, and in-person convening meetings.
• Vision – We envision an innovative, equitable safety net healthcare system where: • Oral health is an integrated, critical component of person-
centered, comprehensive healthcare and wellbeing • Health outcomes are improved for all • PCAs and safety net providers are part of a network and have
access to the tools and resources needed to elevate oral health
• Mission – To unify and empower a network of PCAs and safety net providers to be champions of oral health as a part of overall health.
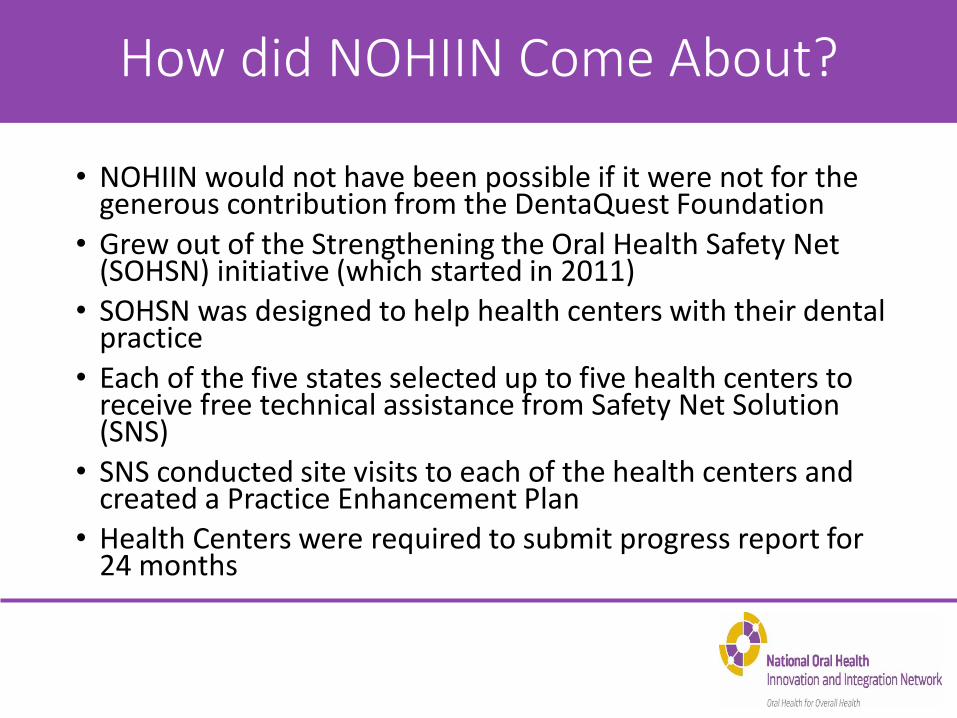
How did NOHIIN Come About?
• NOHIIN would not have been possible if it were not for the generous contribution from the DentaQuest Foundation
• Grew out of the Strengthening the Oral Health Safety Net (SOHSN) initiative (which started in 2011)
• SOHSN was designed to help health centers with their dental practice
• Each of the five states selected up to five health centers to receive free technical assistance from Safety Net Solution (SNS)
• SNS conducted site visits to each of the health centers and created a Practice Enhancement Plan
• Health Centers were required to submit progress report for 24 months

Basic Information from NOHIIN States
PCA # of Org % w/
Dental
Medical
Sites
Dental
Sites
Arizona 25 68.0% 145 50
Georgia 32 58.8% 194 20
Illinois 48 70.0% 450 82
Kansas 20 65.0% 52 23
Pennsylvania 48 70.1% 260 52
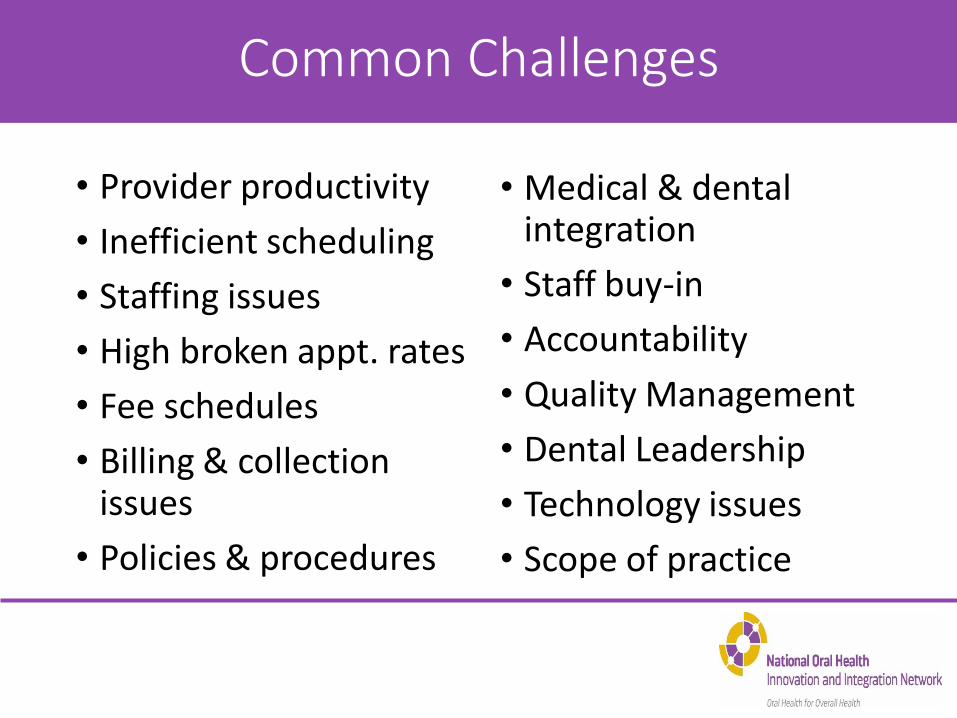
Common Challenges
• Provider productivity
• Inefficient scheduling
• Staffing issues
• High broken appt. rates
• Fee schedules
• Billing & collection issues
• Policies & procedures
• Medical & dental integration
• Staff buy-in
• Accountability
• Quality Management
• Dental Leadership
• Technology issues
• Scope of practice
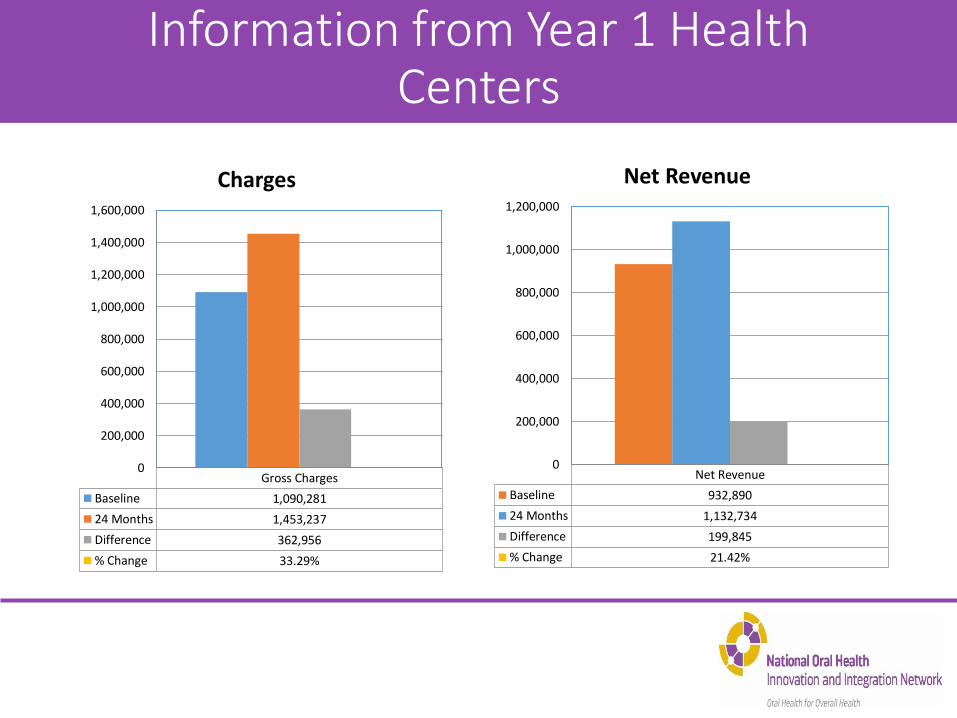
Information from Year 1 Health Centers
Gross Charges
Baseline 1,090,281
24 Months 1,453,237
Difference 362,956
% Change 33.29%
0
200,000
400,000
600,000
800,000
1,000,000
1,200,000
1,400,000
1,600,000
Charges
Net Revenue
Baseline 932,890
24 Months 1,132,734
Difference 199,845
% Change 21.42%
0
200,000
400,000
600,000
800,000
1,000,000
1,200,000
Net Revenue

Information from Year 1 Health Centers (cont.)
Visits
Baseline 6,269
24 Months 6,444
Difference 174
% Change 2.78%
0
1,000
2,000
3,000
4,000
5,000
6,000
7,000
Visits
Unduplicated Patients
Baseline 2,705
24 Months 3,443
Difference 738
% Change 27.28%
0
500
1,000
1,500
2,000
2,500
3,000
3,500
4,000
Unduplicated Patients

Information from Year 1 Health Centers (cont.)
New Patients
Baseline 1,048
24 Months 786
Difference -262
% Change -24.99%
-400
-200
0
200
400
600
800
1,000
1,200
New Patients
Transactions
Baseline 12,596
24 Months 15,023
Difference 2,427
% Change 19.27%
0
2,000
4,000
6,000
8,000
10,000
12,000
14,000
16,000
Transactions

Information from Year 1 Health Centers (cont.)
Baseline 24 Months
No-Show Rate 24.40% 20.13%
0.00%
5.00%
10.00%
15.00%
20.00%
25.00%
30.00%
Broken Appt./No-Show Rate
Baseline 24 Months
Bottom Line -96,401 -46,229
-120,000
-100,000
-80,000
-60,000
-40,000
-20,000
0
Bottom Line

Key Messages
• For PCAs • Get with your health centers and work with them
on improving their operations • If your PCA is not involved with NOHIIN, submit
an application next grant period • For Health Centers
• Don’t get discouraged, you can turn it around • Put more of an emphasis on oral health • Integrate with your medical practices

Ed Franchi
Special Project Coordinator
Pennsylvania Association of Community Health Centers
1035 Mumma Road – Suite 1
Wormleysburg, PA 17043
(717) 761-6443 Ext. 212


Our Mission
To provide accessible, affordable, comprehensive, quality primary healthcare in an atmosphere of respect, dignity, and cultural sensitivity. The health and well being of patients and community alike are promoted through direct services, training/education, outreach and advocacy.
How can my center support and create a successful,
well balanced dental program?

Steps to Success
• Relationship, relationship, relationship
• Knowledge, education • Environment
• Encouragement
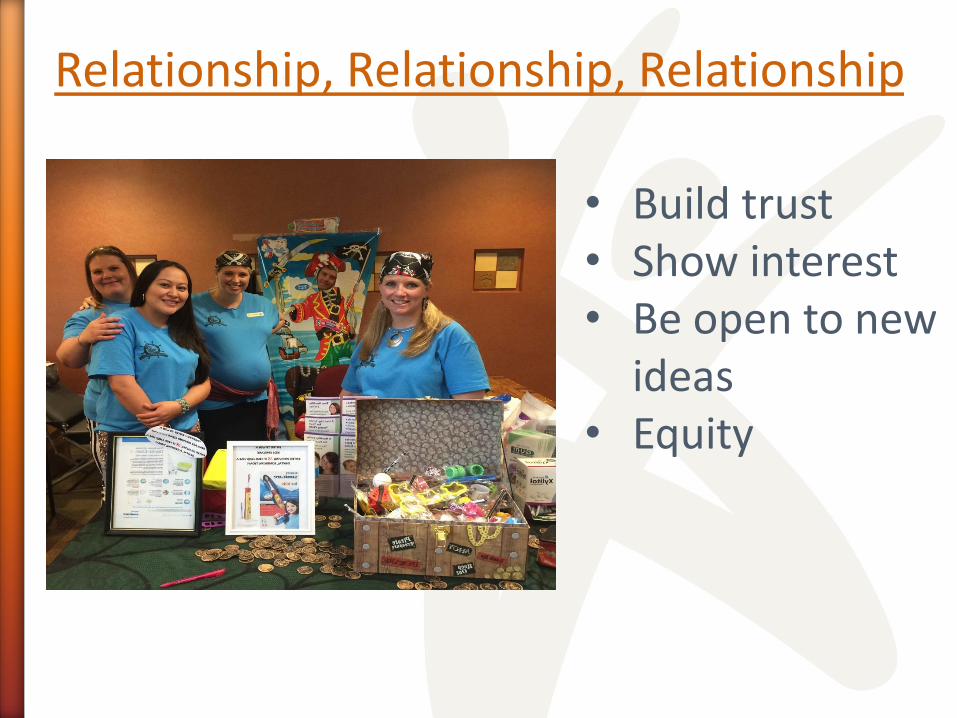
Relationship, Relationship, Relationship
• Build trust • Show interest • Be open to new
ideas • Equity

Knowledge and Education
• Listen to your dental director and learn from them
• Reach out to your PCA for help
• Attend dental conferences

Environment
• Empowerment
• Equity
• Physical space

6% 5%
15%
11% 63%
FY 2013 - 2014
Other Income - $2,189,612
Pharmacy - $1,975,000
Grants - $5,497,293
Federal - $4,092,973
Patient Revenue - $22,863,994
Encouragement
• Time
• Equity
• Communication
• Celebrate successes

6% 5%
15%
11% 63%
FY 2013 - 2014
Other Income - $2,189,612
Pharmacy - $1,975,000
Grants - $5,497,293
Federal - $4,092,973
Patient Revenue - $22,863,994
It can be done through hard work
and perseverance.

Thank you!

Main Title: smaller title
Jenny Englerth, CEO
Family First Health
York, PA

Family First Health

Our 10 year journey to viable oral health services
Reasons to Celebrate: Key elements of our current program
• Facilities upgrades and expansion
• Engaged dental team, great leadership
• Broad community recognition
• Loyal patients
• Thriving pediatric practice
Lots more work to do!

We got by with a little help from our friends…
• DentaQuest Institute/Safety Net Solutions/PACHC
• Local public health department
• Local oral health coalition
• FFH medical staff
• Private funders/local foundations
• Peers & colleagues

Transition to Hub & Spoke Model for pediatric care

Expanding Pediatric Dental Access Using a Comprehensive Hub & Spoke
Model

The “Spokes”
Each spoke has been crafted and developed to provide:
Care where it is needed
Decrease barriers to care
Cultivate community partnerships
Support the hub with patient flow and revenue
Provide service to a larger demographic

30 minutes from entry to patient care

Since 2010 our pediatric new patients has increased 400%
• Each year we had at least 33% growth

Challenges of Hub and Spoke dental model
• Increased management/planning • Reimbursement • Sacrificing production at brick and mortar site • Need for equipment
– Clinical and IT infrastructure
• Transportation – Of staff and equipment
• Capabilities of partner site – Electrical/IT/Space – Parental support – Partner Staff involvement/influencing patient
(negative perception of dental care)

Advantages of Hub and Spoke Model
• Cheaper than brick and mortar expansion
• Staff are interested in non-traditional work day
• Community partners enjoy the convenience of having a dentist come on site
• Great exposure for organization

Is the juice worth the squeeze?

Questions?
THANK YOU!