
A Survey of National Transmission Grid Modeling ...vhowle/publications/SAND2003-8433P.pdf · A...
53
711 712003 A Survey of National Transmission Grid Modeling Capabilities at DOE Laboratories Steve Thomas' Paul Boggs2 Victoria Howle3 Sandia National Laboratories PO Box 969, MS 9217 Livermore, CA 94550 Sandia is a multiprogram laboratory operated by Sandia Corporation, a Lockheed Martin Company, for the United States Department of Energy under Contract DE-AC04-94AL85000. Sandia National laboratories ' Sandia National Laboratories, [email protected], 925-294-2954 Sandia National Laboratories, [email protected], 925-294-4630 Sandia National Laboratories, [email protected], 925-294-2204
Transcript of A Survey of National Transmission Grid Modeling ...vhowle/publications/SAND2003-8433P.pdf · A...

711 712003
A Survey of National Transmission Grid Modeling Capabilities at DOE
Laboratories
Steve Thomas' Paul Boggs2
Victoria Howle3
Sandia National Laboratories PO Box 969, MS 9217 Livermore, CA 94550
Sandia is a multiprogram laboratory operated by Sandia Corporation, a Lockheed Martin Company, for the United States Department of Energy under Contract DE-AC04-94AL85000.
Sandia National laboratories
' Sandia National Laboratories, [email protected], 925-294-2954 Sandia National Laboratories, [email protected], 925-294-4630 Sandia National Laboratories, [email protected], 925-294-2204

7/22/2003
TABLE OF CONTENTS
1 . EXECUTIVE SUMMARY ................................................................... 3
2 . INTRODUCTION .............................................................................. 3
2.1 Scope and Objectives ........................................................................ 3
2.2 Catalog Organization ........................................................................ 4
3.1 Capabilities Template ....................................................................... 4
3.2 Capabilities Data Sheets .................................................................... 9
Electricity Market Complex Adaptive Systems (EMCAS) .................. 10
Generation and Transmission Maximization (GTMAX) ..................... 11
. .
3 . CAPABILITIES CATALOG ................................................................. 4
3.2.1
3.2.2
3.2.3 Transmission Entities with Learning-capabilities and On-line Self-healing
TELOS) ...................................................................................... 12
3.2.4 Power Market Simulator ......................................................... 13
3.2.5 Power Systems Analyzer ......................................................... 14
3.2.6
Simulation (PSDS) by GE and PSS/E fiom Power Tech, Inc ........................ 15
3.2.7 Buzzard ............................................................................. 16
3.3 Completed Survey Forms ................................................................. 17
Positive Sequential Load Flow (PSLF) and Positive Sequential Dynamic
3.3.1
3.3.2
3.3.3
Electricity Market Complex Adaptive Systems (EMCAS) .................. 17
Generation and Transmission Maximization (GTMax) ...................... 23
Transmission Entities with Learning-capabilities and On-line Self-healing
(TELOS) .................................................................................... 30
Power Systems Analyzer ......................................................... 38
3.3.4
3.3.5
3.3.6
Simulation (PSDS) by GE and PSSE from Power Tech, Inc ........................ 42
3.3.7 Buzzard (Buzzard and PFLOW) ................................................ 46
4 . REFERENCES ................................................................................. SO
APPENDIX A: Survey Questionnaire ......................................................... 51
Power Market Simulator ......................................................... 34
Positive Sequential Load Flow (PSLF) and Positive Sequential Dynamic
2

711 712003
1. Executive Summary
This report catalogs the results of a brief survey, conducted in early 2003, designed to answer the question “What DOE Laboratories electric power grid modeling and analysis software tools are available today that might be of value in carrying out a next-generation National Transmission Grid Study?” Software tool capabilities are described as answers by respondents to a standardized questionnaire, and are summarized by a datasheet for each tool. This survey does not address the significantly broader universe of tools and capabilities actively under research and development within the Laboratories, but not ready for use.
2. Introduction
2.1 Scope and Objectives
This report describes the results of a brief survey of DOE National Laboratories electric power grid modeling and simulation software tools potentially of use for purposes such as carrying out a next-generation National Transmission Grid Study (NTGS, Ref [ 11). Of major interest in this survey are capabilities that enable simulation (defined as usefully accurate prediction of real-world behavior) of the consequences of transmission grid congestion for electric power service reliability and market economics. A specific objective of this survey was to obtain a characterization of capabilities that is consistent across the collection of available software tools.
In order to obtain a useful survey with limited resources, the scope of the survey was limited by:
0 Restriction to software tools and capabilities which are currently available (as of 1403) for support of users other than the tool developers.
0 Power grid related software tools listed in the national infrastructure database [2], suggested by Laboratory contacts for appropriate power grid tools listed in [2], or suggested by authors of the NTGS [3]. While this approach is appropriate for a ‘snapshot’ study, it obviously cannot guarantee 100% coverage of all appropriate tools.
0 No attempt was made at hands-on evaluation of tool capabilities. Capabilities are reported as described by the survey contact for each tool.
0 Tools and capabilities under active or planned R&D, but not immediately available for use are not included. This limitation greatly simplified the survey task, at the expense of ignoring what appear to be significant R&D efforts.
3

7/ 1 7/2003
2.2 Catalog Organization
Section 3 presents the results of this survey in the form of a power grid modeling and simulation tools catalog. The core of the catalog is the set of one-page modeling tool capability data sheets shown in Section 3.2. Each data sheet summarizes the answers to a consistent set of questions in response to the questionnaire displayed in Appendix A. More detailed capability data for each tool are given in the full narrative answers to the survey questions shown in Section 3.3. Section 3.1 describes motivation and definitions of the capabilities questions in terms of the objectives of this survey.
3. Capabilities Catalog
3.1. Capabilities Template
What would tool capabilities look like that satisfy the objectives of Section 2? In developing an answer to this question, the authors made use of the excellent background issue papers attached to the NTGS [4], the intellectual framework provided by modern ‘textbook’ power systems analysis [5], and the authors’ experience with a wide variety of (non-electric power) engineering simulators within the DOENNSA Advanced Simulation and Computing Initiative (ASCI) [6]. The authors also gratefully acknowledge the benefit of private communications with power systems experts, including [3], [7], [8]. Responsibility for all misunderstandings, errors, or omissions remains solely with the authors.
For this survey, the goal of modeling and simulation is taken to be the usehlly accurate prediction of electric power grid behavior in the presence of transmission bottlenecks. The behavior of interest focuses on loss of service events (‘blackouts’) or power market inefficiencies (‘price spikes’). A useful simulator ought to be able to predict the occurrence of events of interest as a function of the configuration and operating characteristics of the transmission grid itself, of the related power markets, and of an interesting set of ‘what-ifs’. For this survey, what-ifs might include the construction of specific new transmission lines or the introduction specific new market policies. The value of a useful simulator is in enabling replacement of real-world experiments with credible computer-based experiments.
An ideal modelinghimulation tool would integrate capabilities for realistic grid reliability simulation with a flexible power/transmission market simulation. For example, a high- quality reliability simulation might predict dynamic voltage and frequency throughout the grid in the presence of faults. A high-quality market simulation might find market price
4

711 712003
equilibriums for power prices by control area, given market rules and incremental power generation and transmission costs. An integrated reliabilityleconomics simulation will be useful, for example, to analyze the interesting case of optimal market prices subject to reliability constraints.
The survey questions and data sheets of this report are based on a taxonomy of simulation capabilities organized by both type of capability and maturity (power or level of detail) of capability. The following outline describes that taxonomy in terms of three types of capability: 1) Grid reliability, 2) Market economics, and 3) Degree of realism. The taxonomy then characterizes capabilities within each type that correspond to increasing capability maturity. The survey questions in Appendix A follow directly from this taxonomy.
A. Grid Reliability SimulatiodAnalysis
A.i. Intension: Assess the significance of grid congestion on grid reliability. What is the
Example: One regional blackout resulting from a “bottleneck” (California, 1996) had an estimated economic cost of $2 Billion, and could likely have been avoided by providing more transmission capacity to the Pacific Northwest, or by providing real time control more effective near the edge of the operating envelope
value of de-bottlenecking in terms of reliability?
A i . What capabilities would enable a better study? In order of increasingly better answers:
A.iii. Realistic modeling of grid voltage, frequency, and phase in the presence of N-1, N- 2, N-3 faults, given network topology, demand, and generation. [Characteristics: Does it provide a dynamic model of voltage and frequency? Does it allow simulation to continue “though” faults? Does it take as input to its model specification grid topology, generation and demand by node or control area? Does it allow for change of demand and generation as functions of time? Are these data available for real regional power grids?]
A h . Given A.iii above, assess the reliability (probability of blackout, size of blackout) of various network topologies and real time operations methods. [Characteristics: Can the simulator identify the occurrence of a “blackout” by observing the faulted frequency behavior of the grid? Can it estimate the size of the “blackout” from grid topology and frequency behavior at nodes? If probabilities are assigned to fault events, can the simulator then calculate the probabilities of the resulting blackouts? Are raw fault probability data from real regional grids available?]
A.v. Given capability A.iv above, assess the economic cost of network topologies (bottlenecked v. de-bottlenecked).
5

7/17/2003
[Characteristics: Can we assign an economic value to a “blackout” of known location, extent and duration? Can we aggregate many such probability weighted economic values?]
B. Market Economics Simulation/Analysis
B.i. Intension: Assess the significance of grid bottlenecks on customer prices. What is the economic value to the customer community of grid de-bottlenecking?
Example: NTGS vl reports results of a POEMS study showing that cost of grid bottlenecks, compared to bottleneck-free transmission, is (at least) $500 Million per year.
B.ii. What capabilities would enable better study: In order of increasingly better answers:
B.iii. Realistic model computation of market prices (by say control area), given grid configuration, power demand, and generation, and market rules. [Characteristics: Does it calculate market prices for power by node or control area? OR Does it calculate path-specific transmission prices by path? Does it accept as input: grid topology (including capacities), incremental generation costkapacity by node or control area, similarly demand, power andor transmission market rules? Are these data available for real regional power grids? Are there signs of real economics expertise in solving the market price problem (e.g. game theory or Nash equilibrium approaches)?]
B.iv. Given capability B.iii above, assess economic benefit between market rule cases; say between present grid with reliability-driven operations and present grid “de- bottlenecked” with respect to market rules. [Characteristics: Can this model faithfully represent both reliability-driven operations and market-driven operations?]
B.v. Given capability B.iv above, what is economic benefit of grid with topology optimized as a consequence of market rules? [Characteristics: Is it possible to optimize over grid topology and transmission capacity such that aggregate consumer prices are minimized? (These might be a good model for the best achievable consumer power prices.) Is it possible to include the capital cost of transmission capacity increases in this optimization?]
C. Degree of realism
C.i. Intension: To what extent will the simulated behavior mimic real-world grid behavior? Example: A fully realistic simulation of the national power grid would model on the order of 100,000 generators and control areas. Simulators obtain practical advantages in computer run time and data requirements by aggregating generators and control areas into many fewer units at the potential cost of simulation fidelity.
6

7/17/2003
Simulator fidelity can and should be calibrated with real-world data and validated by comparing simulator response to real-world grid response in key scenarios.
C.ii. What is the degree of~amegation assumed by this model? Are individual elements, such as generators, transmission lines, and radial-distribution markets represented, or are these lumped into aggregate elements in order to reduce the computational complexity of the model? [Example: a heavily-aggregated (heaviIy-Zumped) model for the entire US (POEMS) assumes -70 generators. A moderately aggregated commercial model assumes -70 generators for the entire West Coast. PJM’s model for their tri-state region has 100’s of generators. There are roughly 16,000 generators in the eastern transmission region (-half of the US).]
C.iii. Are actual economic parameters of the generators represented, such as “heat rate’ (percent conversion efficiency from heat to electricity), cost of fuel, cost of operation and maintenance (O&M), capital cost, cost of cold start ($ to go from stopped to spinning)?
C.iv. Implementation: What is the scale and degree of realism of the current use(s) of the model? [e.g. runs a regional case for all of NM, with realistic data; runs standard IEEE Test Bus model; runs 5-node proof-of-concept.]
C.V. Calibration: are model parameters based on calibration to a real-world data set? Is there a software mechanism provided for calibrating (fitting) the model to different data set values? Are data sets available for US regions?
C.vi. Validation: Has the model been validated by comparing its output to real-world data representing normal and abnormal transmission phenomena?
Availability Categories
In addition to information gathered and reported according to the above taxonomy, the availability status of each software tool was also surveyed. For purposes of consistent reporting, availability is reported in the following categories:
Currently Used by Others: Software is in use by organizations other than the developing organization. Implies mature software function (e.g. substantial testing/debugging based on actual use), with training and user support (e.g. user manual, examples) available and in use.
Available for Use by Others Now: Software is ready for use by organizations other than the developing organization. Implies maturing software function, with training and user support (e.g. user manual, examples) available.
7

7/17/2003
Available for Use by Others within One Year: Considered by the developers at the time of the survey to be within one year of reaching Available-for-Use-by-Others status.
8

3.2. Capabilities Data Sheets
This section contains a set of one-page modeling tool capability data sheets. Each data sheet summarizes the answers to a consistent set of questions in response to the questionnaire displayed in Appendix A. More detailed capability data for each tool are given in the full narrative answers to the survey questions shown in Section 3.3.
9

711 712003
3.2.1 Lab: Argonne National Laboratory (ANL) Primary Contact: Richard R. Cirillo (630-252-5629, [email protected])
Electricity Market Complex Adaptive Systems (EMCAS)
Grid Reliabili
fieauencv
of time Identifies blackouts from faulted frequency behavior Estimates size of blackout
* Calculates probability of blackouts J Can assign economic value to
blackouts
Degree Realism I Assumes heavily aggregated data I Assumes moderately aggregated Allows multi-resolution aggregation
I J I Includes representation of economic I parameters
ip Uses regional model wl realistic data Uses IEEE standard test bus models
ip Calibrated based on real-world data J Allows calibration for different data
sets Validated against real-world phenomena
Market Economics
J control area Calculates path-specific
J transmission prices J Allows input of incremental
generation costs, demand, power, market rules
operations
operations
topology and transmission capacity
J Represents reliability-driven
J Represents market-driven
* Allows optimization over grid
Availability 1 Currently used by others
Available for use J Available for use by others within
one year J Significant investment in project J I Future development plans
Lepend for Tables J = existing capability ip = capability is in progress * =seenotes
Notes and brief summary EMCAS was designed to analyze the restructured electricity markets. It is currently being set up to run a study for the Illinois Commerce Commission. A user interface version is scheduled to be available in the last quarter of 2003. Development has been sponsored by Argonne LDRD funding.
10

7/17/2003
3.2.2 Generation and Transmission Maximization (GTMAX) Lab: Argonne National Laboratory (ANL) Primary Contact: Thomas D. Veselka (630-252-5629, [email protected])
Market Economics
Allows input of grid topology / J Allows input of incremental
J Demand and generation are functions I / generation costs, demand, power, capacity, generation, and demand
of time market rules Identifies blackouts from faulted Represents reliabi 1 i ty-driven
J I Can assign economic value to I
operations Represents market-driven operations
J Allows optimization over grid topology and transmission ‘ I I caoacitv
I blackouts
Availability
Available for use by others now Available for use by others within one year
J Currently used by others J
J Significant investment in project J Future development plans
Legend for Tables J = existing capability ip = capability is in progress * =see notes
Notes and brief summary GTMAX is an optimization model that minimizes the cost of serving loads given a set of both supply and demand bids. It is currently available for use and includes a user’s manual and on-line help. Training courses have been conducted by Argonne staff. GTMAX is currently used by the Western Area Power Administration, the Bureau of Reclamation, the Fish and Wildlife Service, and a several international organizations.
I 1
7/ 1 712003
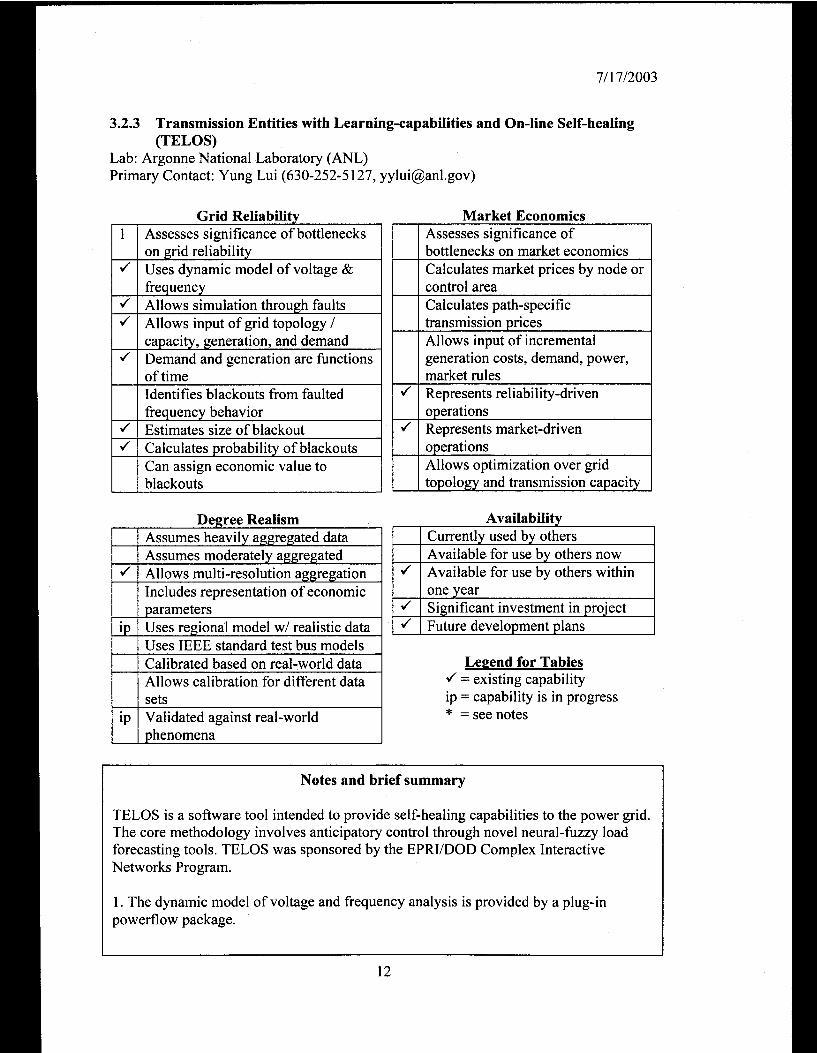
3.2.3
Lab: Argonne National Laboratory (ANL) Primary Contact: Yung Lui (630-252-5 127, [email protected])
Transmission Entities with Learning-capabilities and On-line Self-healing (TELOS)
control area Calculates path-specific
J P transmission rices
frequency Allows simulation through faults
J Allows input of grid topology / capacity, generation, and demand Demand and generation are functions of time - - - - - -. -
I Identifies blackouts from faulted I I frequency behavior J Estimates size of blackout
Calculates probability of blackouts Can assign economic value to blackouts
Allows input of incremental generation costs, demand, power, market rules cc J Represents reliability-driven
I I oDerations I Represents market-driven operations Allows optimization over grid topology and transmission capacity
Availabilitv I I Currentlv used bv others I
Available for use by others now Available for use by others within one vear
J
J Significant investment in project J Future development plans
Calibrated based on real-world data Allows calibration for different data
Legend for Tables J = existing capability - -
sets
phenomena
ip = capability is in progress * =seenotes ip Validated against real-world
Notes and brief summary
TELOS is a software tool intended to provide self-healing capabilities to the power grid. The core methodology involves anticipatory control through novel neural-fuzzy load forecasting tools. TELOS was sponsored by the EPRUDOD Complex Interactive Networks Program.
1. The dynamic model of voltage and frequency analysis is provided by a plug-in powerflow package.
12

711 712003
3.2.4 Power Market Simulator Lab: Los Alamos National Laboratory (LANL) / National Infiastructure Simulation and Analysis Center (NISAC) Primary Contact: Achla Marathe (505-667-9034, [email protected])
Market Economics Assesses significance of bottlenecks on market economics Calculates market prices by node or control area Calculates path-specific transmission prices Allows input of incremental generation costs, demand, power, market rules Represents reliability-driven operations Represents market-driven operations
J Allows optimization over grid topology and transmission capacity
Calibrated based on real-world data
Validated against real-world Dhenomena
Availa bilitv Y
I I Currentlv used bv others I I 4 I
Available for use by others now Available for use by others within one vear
J Significant investment in project Future development plans
Legend for Tables J = existing capability - -
ip = capability is in progress * =see notes
Notes and brief summary This project is part of NISAC. The software is usable now, but not it the public domain. It can be used to determine how regulatory models affect market prices and how policy changes affect market dynamics. With LDRD support, they are investigating interdependencies and cascading effect of failures. They are also looking at spot markets and ways to handle congestion. These should be available next year.
I
13

711 712003
3.2.5 Power Systems Analyzer Lab: Los Alamos National Laboratory (LANL) / National Infrastructure Simulation and Analysis Center (NISAC) Primary Contact: Cetin Una1 (505-665-2539, [email protected])
Market Economics Assesses significance of bottlenecks on market economics Calculates market prices by node or control area Calculates path-specific transmission prices Allows input of incremental generation costs, demand, power, market rules Represents reliability-driven operations Represents market-driven operations Allows optimization over grid topology and transmission capacity
Availability Currently used by others Available for use by others now Available for use by others within one year
arameters J Significant investment in project -- Future development plans ~
Uses IEEE standard test bus models Calibrated based on real-world data LePend for Tables
J Allows calibration for different data J = existing capability ip = capability is in progress * = seenotes
Notes and brief summary This project is part of NISAC. The tool is connected to a commercial powerflow model. They have large data bases of excellent data. Outages can be predicted, but only in steady state. They expect to have dynamic capabilities in about a year.
14

711 712003
3.2.6
Lab: Pacific Northwest National Laboratory (PNNL) Primary Contact: Jeff Dagle (509-375-3629, [email protected])
Positive Sequential Load Flow (PSLF) and Positive Sequential Dynamic Simulation (PSDS) by GE and PSSm from Power Tech, Inc.
Grid Reliability Market Economics Assesses significance of bottlenecks on grid reliability
J Uses dynamic model of voltage & frequency control area Allows simulation through faults
capacity, generation, and demand
Assesses significance of bottlenecks on market economics Calculates market prices by node or
Calculates path-specific
Allows input of incremental J Allows input of grid topology / transmission prices
J Demand and generation are hnctions generation costs, demand, power, of time market rules Identifies blackouts from faulted frequency behavior operations Estimates size of blackout
J Calculates probability of blackouts operations Can assign economic value to blackouts 1 topology and transmission capacity
Represents reliability-driven
Represents market-driven
Allows optimization over grid
Availability J* Currently used by others J* Available for use by others now
Available for use by others within one year
J Significant investment in project Future development plans
1.lLegend for Tables J = existing capability ip = capability is in progress * =see notes
Notes and brief summary * These are commercial products that are used for their studies and analysis. They are the standard to the Western Electric Coordinating Council. There are no economic modeling capabilities at present, but they have an LDRD to develop some market economics on top of another commercial product called the Alstom Dispatcher Training Simulator. Preliminary versions of the economic models should be available by the end of this fiscal year.
15

3.2.7 BUZZARD Lab: Sandia National Laboratories (SNL) Primary Contact: David G. Robinson (505-844-5883, [email protected])
Availability 1
LePend for Tables J = existing capability ip = capability is in progress * =seenotes
Notes and brief summary BUZZARD is composed of two packages: a power flow package (Bonneville/IPF or NMSU/PFLOW IPF or PFLOW) and an artificial intelligence based search code also referred to as BUZZARD. In it’s simplest form, BUZZARD is an N-node contingency analysis. It is used to find those combinations of N nodes on the grid, which if disrupted, would result in the most widespread damage. BUZZARD is currently being ported to massively parallel machines and exhaustive validations using the IEEE 300 Bus RTS are underway.
16

7/17/2003
3.3 Completed Survey
3.3.1. Electricity Market Complex Adaptive Systems (EMCAS) Lab: Argonne National Laboratory (ANL) Primary Contact: Richard R. Cirillo (630-252-5629, [email protected])
Survey filled out by Richard R. Cirillo.
ELECTRICITY MARKET COMPLEX ADAPTIVE SYSTEMS (EMCAS) ARGONNE NATIONAL LABORATORY Contact: Richard R. Cirillo Decision and Information Sciences Division Argonne National Laboratory Argonne, IL 60439
cir.ill,r(iTi2unl.,~~ov (630)252-5629
Capabilities Template
1. What was this software designed to do? What problem(s) was it designed to solve? Describe in terms of criteria 1.1 - 1.2 below, when possible.
EMCAS was designed to analyze the restructured electricity markets. It addresses the problem that conventional analytical techniques using optimization and equilibrium methodologies are inadequate to deal with the new market configuration in which there are many participants, each seeking to achieve their own (ofen conflicting) objectives. The “equilibrium solution” and the “optimum solution” are useful results, but the path that the system travels to reach these points has taken on greater significance in the restructured marketplace. The non-equilibrium and non-optimum points of system operation are what can create reliability and economic problems as evidenced in the California crisis. EMCAS applies an agent-based model formulation to address this situation. The agents interact in several layers as shown on the attached figure.
1.1 Does it assess the significance of bottlenecks on grid reliabilitv? Measure degree of usefulness according to rough scale of the following characteristics:
EMCAS addresses bottlenecks by simulating how the market will respond to congestion. It simulates how the system responds and adjusts (including both physical adjustments and market adjustments) when the physical limits of the grid are reached.
1. I . 1 Does it provide a dynamic model of voltage and frequency?
17

7/17/2003
Not directly. In its physical layer, EMCAS uses a load flow model to determine the operation of the system under specified reliability constraints. It is not designed to study voltage and frequency effects directly.
1.1.2 Does it allow simulation to continue “though” faults?
Yes. The Special Event Generator allows for the introduction of disruption events (e.g., generator outages, transmission outages, unexpected load variations). The simulation continues when there are disruptions and the EMCAS agents adjust to these disruptions. Situations where load must be dropped can be simulated Energy Not Served (ENS) is calculated in these situations.
1.1.3 Does it accept as input to its model specification grid topology/capacity, generation and demand by node or control area?
Yes. The grid topology can be input at any Ievel of detail desired It can be done at the transmission bus level (e.g., the current study under way for the State of Illinois will include about 2,500 buses in the State). A reduced network configuration can also be input with the appropriate adjustments to line capacity, reactances, etc. (e.g., the current Illinois study also has a reduced network of about 30 nodes).
1.1.4 Does it allow for change of demand and generation as functions of time?
Yes. Demand is represented on an hourly basis. Generation to meet the demand is also determined on an hourly basis. Simulations can be run for 8,760 hours per year for a number ofyears.
1.1.5 Can we identify the occurrence of a “blackout” by observing the faulted frequency behavior of the grid? Can we estimate the size of the “blackout” from grid topology and frequency behavior at nodes?
No. Analysis of the frequency behavior is not included in the physical layer of EMCAS.
I . 1.6 If we assign probabilities to fault events, can we then calculate the probabilities of the resulting blackouts?
Yes - qualified. Specific faults can be injected into the simulation (see 1.1.2 above). A specific fault can be analyzed to determine i f a blackout will occur or ifthe system can adjust to meet load requirements without dropping load. Probabilities can be calculated from this process.
1.1.7 Can we assign an economic value to a “blackout” of known location, extent and duration? Can we aggregate many such probability weighted economic values?
18

71 1 712003
Yes. Energy Not Served is calculated (see 1.1.2 above). If data are available on the mix of consumers at any node in the network (e.g., residential, commercial, industrial) and if data are available to determine the economic cost of loss ofpower to each customer type, then the economic value of the blackout is readily calculated Further, EMCAS can include specific consumers in the simulation (e.g., large industrial facilities) and do the calculation of their losses. This is primarily a data issue since EMCAS can do the calculations readily.
I .2 Does it assess the significance of bottlenecks on power market economics? Measure degree of usefulness according to rough scale of the following characteristics:
Yes. This is the focus of the EMCAS simulation. EMCAS can also simulate the “gaming” of the market by having company agents engage in strategic bidding and capacity withholding.
1.2.1 Does it calculate market prices for power by node or control area? OR Does it calculate path-specific transmission prices by path?
All of the above. EMCAS calculates prices by each node that is represented in the transmission network. This can be at the bus level or at the reduced network node level. Detailedprices at the bus level can be aggregated up to any higher level desired.
1.2.2 Does it accept as input: grid topology (including capacities) incremental generation costkapacity by node or control area, similarly demand, power and/or transmission market rules?
EMCAS accepts grid topology at the bus level (see 1.1.3 above). Generation information is included at the unit level. (Small units can be aggregated ifdesired) Transmission data is at the line leveL Demand is at the consumer level. (In principle, individual consumers can be represented In practice, due to data availability, consumers are aggregated into consumer types - e.g., residential, commercial, industrial - and large consumers can be included separately.)
1.2.3 What are the market economics principles used in solving the market price problem (e.g. game theory or Nash equilibrium approaches)?
EMCAS uses an agent-based formulation in which each agent (e.g., generation companies, demand companies, consumers) seeks to maximize its utility (e.g., profit, market share, cost of service) separately. Agents are characterized by their objectives and their risk preferences to formulate their utility function. Each agent uses a look back (Le., at historical performance), look ahead (Le., at expected conditions in the future), and look sideways (Le., at what competitors are doing) to develop their decisions for each time step in the simulation. Agents apply a “bounded rationality” to their decision making in that they each have incomplete information. Each agent learns and adapts its strategy at each decision milestone (e.g., day ahead, month ahead, year ahead) to try to improve its performance. This process allows for a representation
19

711 712003
of the path that is taken towards an equilibrium or optimum (if one exists), not just the end equilibrium or optimum state.
1.2.4 Can this model represent both reliability-driven operations and market-driven operations?
Yes. Reliability requirements can be imposed on the system that restricts the manner in which the markets operate. Alternatively, reliability requirements can be relaxed to allow the market to operate in a wider space.
1.2.5 Is it possible to optimize over grid topology and transmission capacity such that aggregate consumer prices are minimized? Is it possible to include the capital cost of transmission capacity increases in this optimization.
Yes - qualified EMCAS does not assume a single market participant that “optimizes ” the whole system. This can be approximated by having all market participants use the same utility function and by having all refrain from strategic market behavior (e.g., price escalations, capacity withholding). Transmission capacity expansion costs can be included, but are not now part of the simulation,
2. What is the degree of aggregation assumed by this model? Are individual elements, such as generators, transmission lines, and radial-distribution markets represented, or are these represented by aggregate elements in order to reduce model complexity?
EMCAS is set up to accept data at varying levels of detail.
2.1 e.g. a heavily-aggregated (heavily-lumped) model for the entire US assumes -70 generators. A moderately aggregated commercial model assumes -70 generators for the West Coast. PJM’s model for their tri-state region has 100’s of generators. There are roughly 16,000 generators in the eastern transmission region.
The basic structure allows for individual generators, transmission lines, busses to be modeled (This is the approach that is being used for the current study for the State of Illinois. About 2,500 busses and 300 generators are included in the simulation,) The deciding factors are (a) data availability, and (b) simulation run time. With regard to run time, the current Illinois case will take approximately 2 hours of run time on a single high end workstation to do a 1-year simulation of 8,760 hours. If desired, EMCAS is designed to run on multiple desktop computers simuItaneousIy, which can significantly reduce run time and eliminate this as a deciding factor. Data availability then becomes the primary determinant of how detailed the model should be.
2.2 e.g. are actual economic parameters of the generators represented, such as “heat rate’ (% conversion efficiency from heat to electricity), cost of fuel, cost of operation and maintenance (O&M), capital cost, cost of cold start ($ to go from stopped to spinning), etc.
20

711 712003
Each generator included in an EMCAS simulation is represented by technical data (e.g., capacity - nameplate, summer, winter; heat rate - by capacity utilization; ramp up/down rates; startup time; shutdown time; minimum down time; forced outage rate; maintenance requirements) and by economic data (e.g., capital cost, fuel cost, OM cost - fmed and variable, startup cost).
3. Implementation, calibration and validation: 3.1 Implementation: What is the scale and degree of realism of the current use(s) of the model? e.g. runs a regional case for all of NM, with realistic data; runs standard IEEE Test Bus model; runs 5-node proof-of-concept.
EMCAS is currently being set up to run a study for the Illinois Commerce Commission of the state of Illinois. State power companies are providing data for the simulation.
3.2 Calibration: are model parameters based on calibration to a real-world data set? Is there a software mechanism provided for calibrating (fitting) the model to different data set values? Are data sets available for US regions?
Historical data can be input to allow the simulation to use this to determine the projections of future market and system operation conditions. The historical data is used to “spin up” the model based on past experience. Future period simulations can then begin with historical data serving as the initial conditions.
The dataset for the State of Illinois is near completion. Release of some this in formation is governed by confidentiality agreements.
In general, the basic data for EMCAS can be developed from publicly available sources (e.g., FERC filings).
3.3 Validation: Has the model been validated by comparing its output to real-world data representing normal and abnormal transmission phenomena?
Discussions are underway with California and New York to obtain access to market data that can be used to validate the model behavior.
4. When will these capabilities be available for use by or on behalf of others?
By design, EMCAS is intended to be transferred to other organizations for their use. A user interface version is scheduled for the last quarter of 2003.
4.1 Do others use now? For what purpose?
EMCAS will be transferred to the Illinois Commerce Commission for their internal use at the completion of the study. They will use it to evaluate the behavior and operation of the restructured electricity market in Illinois.
21

711 712003
4.2 On what computer platforms does it run?
EMCAS is written in JA VA and is, therefore, reasonably platform independent. Currently, it is run on high-end Windows desktop machines.
5 .Who sponsored development of this capability?
Development has been sponsored by Argonne LDRD funding.
5.1 How much has been invested?
Approximately, $900K to date.
6. Are there publications that describe the capabilities, or studies resulting from them?
Yes. Copies can be provided.
7. What are plans for future development?
7.1 Added capabilities?
Currently, EMCAS runs a Day Ahead Planning and Hourly Dispatch simulation. The Month Ahead Planning structure is developed and is ready to be implemented Future enhancements will include Year Ahead Planning (to allow for company business strategy adjustments), and Long Term Planning Cfor capacity expansion analysis).
Work is currently underway to pair EMCAS with the Sandia ASPEN model, which is a macroeconomic analysis tool and which also uses an agent-based formulation. The ASPEN model will develop analysis of the economic drivers for electricity demand and EMCAS will develop analysis of the electricity market response.
7.2 Schedule for new capabilities?
The Month Ahead Planning is scheduled for the first quarter of calendar year 2003. The Year Ahead and Long Term Planning are scheduled for the end offlscal year 2003.
7.3 Are milestones for the next 12 months available?
The study for the State of Illinois is schedule for completion at the end offiscal year 2003.
22

711 712003
3.3.2. Generation and Transmission Maximization (GTMax)
Survey completed by Thomas D. Veselka (630-252-5629, [email protected]) Data completed by Thomas D. Veselka.
GENERA TION AND TRANSMISSION MAXIMIZATION (GTMax) MODEL ARGONNE NATIONAL LABORATORY Contact: Thomas D. Veselka Decision and Information Sciences Division Argonne National Laboratory Argonne, IL 60439
[email protected] (630)252-5629
Capabilities Template
1. What was this software designed to do? What problem(s) was it designed to solve? Describe in terms of criteria 1.1 - 1.2 below, when possible.
GTMax is an optimization model that minimizes the cost of serving loads given a set of both supply and demand bids. From an ISOLUTO perspective, it determines what bids will be selected and it estimates the flow ofpower through the transmission system Powerflows are computed on either a DC loadflow basis or based on contact path. From the perspective of a generation company or a power purchaser, it is used to maximize the operation of its resources. The model simultaneously optimizes hourly operations for periods of up to one week. This allows the model to eflectively simulate the operations of hydropo wer plants, including pumped storage facilities, whereby their limited energy resources are maximized based on locational market prices (LMP). GTMax represents various types of suppIy resources andfinancial transactions for firm contracts, customer demands, and the transmission system. Contracts include both firm and non-firm financial transactions and operational agreements such as energy interchanges and exchanges. Physical constraints in the model are numerous ranging from limits on fossil fuel supplies to operational limits on hydropower reservoirs to ramp rate constraints. Institutional factors such as minimum proflt levels that trigger power sales or purchases are also considered
1 . 1 Does it assess the significance of bottlenecks on grid reliability? Measure degree of usefulness according to rough scale of the following characteristics:
GTMax computes transmission bottlenecks on an hourly basis and LMPs based on transmission line congestion. Power plants are dispatched and load curtailment decisions are made such that the transmission system remains within a secure operating mode. The model can be used to make economic trade-offs between factors such serving load and operating the transmission system at levels above design limits.
I 1.1.1 Does it provide a dynamic model of voltage and frequency?
23

71 1 712003
GTMax operates at an hourly time step and therefore it does not directly model voltage and frequency. However, the model includes the modeling of ancillary services such as regulation and spinning reserves. These types of ancillary services are estimated hourly and can either be optimized by the model or the user assigns specific duties to individual power plants or generating units. Ancillary service requirements are assigned on a regional basis or for the entire system.
1.1.2 Does it allow simulation to continue “though” faults?
Yes. Disruption scenarios (e.g., generator outages, transmission outages, unexpected load variations) can be specified by the user to simulate the system response an unplanned event.
1.1.3 Does it accept as input to its model specification grid topologylcapacity, generation and demand by node or control area?
Yes. The grid topology can be represented at various levels of detaiL It can be done at the transmission bus. A reduced network configuration, such as an aggregate control area representation, can also be configured with the appropriate adjustments to line capacity, reactances, etc
I . 1.4 Does it allow for change of demand and generation as functions of time?
Yes. Demand and demandprice responses are simulated on an hourly basis. Generation to meet the demand is also determined on an hourly basis. Since the model is run over a week, factors such as generator hourly ramp-rate restrictions allow the model to estimate the chronological response of generators to rapid fluctuations in hourly load By running 52-weekly simulations peryear the model can be simulate all 8,760 hoursper year for a number ofyears. The model also uses various methods to handle model boundary conditions (Le., initial conditions and end-effects) which, in some systems, may play an important role in hourly plant operations.
1.1.5 Can we identify the occurrence of a “blackout” by observing the faulted frequency behavior of the grid? Can we estimate the size of the “blackout” from grid topology and frequency behavior at nodes?
No. Analysis of the frequency behavior is not included in GTMam
1.1.6 If we assign probabilities to fault events, can we then calculate the probabilities of the resulting blackouts?
Yes - qualified. Specijk faults can be injected into the simulation. A specific fault can be analyzed to determine i f a blackout will occur or ifthe system can adjust to meet load requirements without dropping load Probabilities can be calculated from this process.
24

71 1 7/2003
1.1.7 Can we assign an economic value to a “blackout” of known location, extent and duration? Can we aggregate many such probability weighted economic values?
Yes. Load curtailments are calculated and the cost of not serving demand is calculated Up to three customers types are specified in GTMax at each demand sink. Economic trade-oris among, serving load, running generators or transmission components above design levels, and maintaining or curtailing system security services (e.g., spinning reserves and area load control) are made by the model based on user input.
1.2 Does it assess the significance of bottlenecks on power market economics? Measure degree of usefulness according to rough scale of the following characteristics:
Yes. The GTMax model computes LMPs and the economic andfinancial implications of transmission system congestion. The user must specifi GTMax supply and demand bids. The user through bid inputs, bilateral contract specifications, and transmission contracts can simulate gaming strategies by various market players.
1.2.1 Does it calculate market prices for power by node or control area? OR Does it calculate path-specific transmission prices by path?
All of the above. GTMax calculates prices by each node that is represented in the transmission network. This can be at the bus level or at a reduced network node level. Detailed prices at the bus level can be aggregated up to any higher level desired
1.2.2 Does it accept as input: grid topology (including capacities) incremental generation cost/capacity by node or control area, similarly demand, power and/or transmission market rules?
GTMax begins with a clean slate and the user builds supply, demand, and transmission components via a drop-and-drag interface. In formation associated with each system component and overall system controls are entered through input data views. Generation information is included at the unit level. (Small units can be aggregated ifdesired) Transmission data is at the line level. Demand at the consumer level is specified by type (e.g., residential, commercial and industrial). The model is currently being enhanced with options for downloading loads from a SCADA system to GTMax demand nodes.
1.2.3 What are the market economics principles used in solving the market price problem (e.g. game theory or Nash equilibrium approaches)?
GTMax is an optimization model that determines LMPs based on supply and demand functions given numerous physical and institutional limitations of the power system.
25

7/17/2003
1.2.4 Can this model represent both reliability-driven operations and market-driven operations?
Yes. Reliability requirements are imposed on the system that restricts the manner in which the markets operate. As indicated earlier the model can make trade-ofls between reliability and economics.
1.2.5 Is it possible to optimize over the grid topology and transmission capacity such that aggregate consumer prices are minimized? Is it possible to include the capital cost of transmission capacity increases in this optimization.
The GTMax model optimizes the system. If customer rates are based on overall system costs then these cost savings are directly passed through to the customer thus minimizing customer rates. However, ifcustomer rates are tied to LMPs then it does not minimize customer rates. Capital investment costs are considered sunk costs from a short-term operationalperspective and are not included in the model. However, the model has been used to assess the economic andfinancial viability of expanding the systems transmission system (e+, new lines) and building new generation resources.
2. What is the degree of aggregation assumed by this model? Are individual elements, such as generators, transmission lines, and radial-distribution markets represented, or are these represented by aggregate elements in order to reduce model complexity?
GTMax is set up to accept data at varying levels of detail,
2.1 e.g. a heavily-aggregated (heavily-l?mpe&) model for the entire US assumes -70 generators. A moderately aggregated commercial model assumes -70 generators for the West Coast. PJM’s model for their tri-state region has 100’s of generators. There are roughly 16,000 generators in the eastern transmission region.
The basic structure allows for individual generators, transmission lines, busses to be modeled A two-hundred plus node network of SE Europe (7-countries with 8 systems) runs in about 15-20 minutes on a standard PC. The model formulation is currently being restructured to decrease run-time.
2.2 e.g. are actual economic uarameters of the generators represented, such as “heat rate’ (YO conversion efficiency from heat to electricity), cost of fuel, cost of operation and maintenance (O&M), capital cost, cost of cold start ($ to go from stopped to spinning), etc.
Each generator included in a GTMax simulation is represented by technical data (e.g., capacity - nameplate, summer, winter; heat rate - by capacity utilization; ramp up/down rates; forced outage rate; and maintenance requirements) and by economic data (e.g., capital cost, fuel cost, OM cost -fixed and variable).
3. Implementation, calibration and validation:
26

711 712003
3.1 Implementation: What is the scale and degree of realism of the current use(s) of the model? e.g. runs a regional case for all of NM, with realistic data; runs standard IEEE Test Bus model; runs 5-node proof-of-concept.
GTMax has been used by the Western Area Power Administration for several years to simulate and guide hourly system operations. It has also been used to perform various economic andfinancial studies. The system covers a &state area and contains about 50 nodes.
GTMax has also been used in a study for ENRON to estimate the economic and financial viability of building new transmission lines.
A large study of several interconnected country systems is its final stages. The network contains numerous nodes at various levels of aggregation and includes various supply resources such as CHPs, power plants, run-of-river hydro, poundage hydro, pumped storage units, gas-turbines, combined cycle units, market purchase hubs, nuclear power plants and fossil fuel fired steam plants.
3.2 Calibration: are model parameters based on calibration to a real-world data set? Is there a software mechanism provided for calibrating (fitting) the model to different data set values? Are data sets available for US regions?
There are various mechanism and controls in the model to adjust operations to match systems operations. Model results have been benchmarked to actual system operations. Digerences between model simulations and actual operations have pointed the way for improved system operations.
Data typically comes from a variety of publicly available and proprietary sources. Data is input into the model via various mechanisms including importingfiles and databases from external sources into the model, We are currently in the process of including new features that will hook GTMax into a SCADA system for real-time data feeds and updates.
3.3 Validation: Has the model been validated by comparing its output to real-world data representing normal and abnormal transmission phenomena?
The model has been used to simulate numerous power systems by experts that operate the system.
4. When will these capabilities be available for use by or on behalf of others?
Yes, GTMax is currently available for use. A users manual, on-line help, and animated presentations of GTMax are available. Argonne staff have conducted several GTMax training courses. Training course presentation materials are also available.
27

4.1 Do others use now? For what purpose?
GTMax is currently used in the US by the Western Area Power Administration, the Bureau of Reclamation, and the Fish and Wildlve Service. Domestic organizations have used the model and its predecessors to estimate the economic andfinancial implications of system operations. International organizations will use the model to assess the economic andfinancial advantages of creating a regional open market in SE Europe. Argonne is transferring the individual and regional system representations to interested parties that have been trained to use the GTMax by Argonne stan
4.2 On what computer platforms does it run?
GTMax runs on a PC under various operating systems.
5.Who monsored development of this capability?
Development has been funded over the past few years by several organizations in support of both specific studies and for general applications.
5.1 How much has been invested?
Multiple person years over a 10 year period.
6. Are there publications that describe the capabilities, or studies resulting from them?
Yes. Copies can be provided
7. What are plans for future development?
7.1 Added capabilities?
Argonne will add features for linking GTMax directly to SCADA systems for real-time data feeds. There are also a number of applications planned over the next year that will require the addition of new features on an as-needed basis.
7.2 Schedule for new capabilities?
GTMax is continually being enhanced and upgraded New SCADA features will be completed in autumn 2003.
7.3 Are milestones for the next 12 months available?
Yes, the second round of SE Europe simulations have been completed and will be reviewed one more time by system experts in the region before the final report is issued Additional activities in this region are being planned
28

711 712003
The Western Area Power Administration with assistance from A rgonne will model the Loveland Area Projects with GTMax and combine these operations with those of the Salt Lake City Area Integrated projects.
Both domestic and international training course will be conducted.
29

71 1 7/2003
3.3.3. Transmission Entities with Learning-capabilities and On-line Self-healing
Lab: Argonne National Laboratory (ANL) Primary Contact: Yung Lui (630-252-5 127, [email protected])
(TELOS)
Data completed by Yung Lui.
Capabilities Template
TELOS is a software tool intended to provide self-healing capabilities to the power grid Designed as a multi-agent software package it is easy to use as a plug-in with Energy Management Systems (EMS). The core methodology at TELOS involves anticipatory (or proactive) control through novel neural-fuzzy load forecasting tools implemented at what is known as the Local Area Grid (LAG) level. TELOS has been using the power systems ofANL as a testbed (TELOS-ANL).
1. What was this software designed to do? What problem(s) was it designed to solve? Describe in terms of criteria 1.1 - 1.2 below, when possible.
1.1 Does it assess the significance of bottlenecks on grid reliability? Measure degree of usefulness according to rough scale of the following characteristics:
1.1.1 Does it provide a dynamic model of voltage and frequency?
Yes, it does provide a dynamic model of voltage and frequency analysis. Such capability is provided by a plug-in powerflow package internal to TELOS.
1.1.2 Does it allow simulation to continue “though” faults?
TELOS allows anticipatory and distributed estimation before, through, and past faults.
1.1.3 Does it accept as input to its model specification grid topology/capacity, generation and demand by node or control area?
Yes, it does.
1.1.4 Does it allow for change of demand and generation as functions of time?
Yes, it does.
1.1.5 Can we identify the occurrence of a “blackout” by observing the faulted frequency behavior of the grid? Can we estimate the size of the “blackout” from grid topology and frequency behavior at nodes?
In principle, it does. But, actually, this depends on the plug-in powerflow used by TELOS. However, TELSO does estimate the size of the blackout.
30

1.1.6 I f we assign probabilities to fault events, can we then calculate the probabilities of the resulting blackouts?
Yes, we can.
1.1.7 Can we assign an economic value to a “blackout” of known location, extent and duration? Can we aggregate many such probability weighted economic values?
In principle, yes, but this capability is not presently there. An economic model can be built into TELOS.
1.2 Does it assess the significance of bottlenecks on power market economics? Measure degree of usefulness according to rough scale of the following characteristics:
1.2.1 Does it calculate market prices for power by node or control area? OR Does it calculate path-specific transmission prices by path?
Not at this time.
1.2.2 Does it accept as input: grid topology (including capacities) incremental generation costkapacity by node or control area, similarly demand, power and/or transmission market rules?
This could be included in an economic model to be implemented in the future.
1.2.3 What are the market economics principles used in solving the market price problem (e.g. game theory or Nash equilibrium approaches)?
This is not there yet for TELOS. We have considered an Evolutionary Computing - Game Theory Hybrid Approach to address this problem.
1.2.4 Can this model represent both reliability-driven operations and market-driven operations?
We think so.
1.2.5 Is it possible to optimize over grid topology and transmission capacity such that aggregate consumer prices are minimized? Is it possible to include the capital cost of transmission capacity increases in this optimization.
It may be possible by intelligent problem solving techniques such as genetic algorithm.
2. What is the degree of amregation assumed by this model? Are individual elements, such as generators, transmission lines, and radial-distribution markets represented, or are these represented by aggregate elements in order to reduce model complexity?
31

711 712003
TELOS adopts a multi-resolution scheme. At each level, it accommodates a moderate amount of nodes (generators, transmission lines, customers, etc.). For example, when modeling ANL, each building and major facilities can be regarded as an individual node. When modeling the entire Chicago-are grid, ANL as a whole is regarded as a single node. The concept of Local Are Grid (defined as a set of loads) entails flexibility in defining boundaries.
2.1 e.g. a heavily-aggregated (heavily-lumped) model for the entire US assumes -70 generators. A moderately aggregated commercial model assumes -70 generators for the West Coast. PJM’s model for their tri-state region has 100’s of generators. There are roughly 16,000 generators in the eastern transmission region.
As stated before, TELOS contains a workable amount of nodes at each level.
2.2 e.g. are actual economic parameters of the generators represented, such as “heat rate’ (% conversion efficiency from heat to electricity), cost of fuel, cost of operation and maintenance (O&M), capital cost, cost of cold start ($ to go from stopped to spinning), etc.
No, they are not.
3. Implementation, calibration and validation:
3.1 Imdementation: What is the scale and degree of realism of the current use(s) of the model? e.g. runs a regional case for all of NM, with realistic data; runs standard IEEE Test Bus model; runs 5-node proof-of-concept.
A TELOSprototype is currently running on the ANL grid off-line with realistic data.
3.2 Calibration: are model parameters based on calibration to a real-world data set? Is there a software mechanism provided for calibrating (fitting) the model to different data set values? Are data sets available for US regions?
TELOS possesses on-line learning capabilities. It requires historical load consumptiodprice data and weather in formation as inputs. All these data are readily available.
3.3 Validation: Has the model been validated by comparing its output to real-world data representing normal and abnormal transmission phenomena?
ANL is currently working to validate the model.
4. When will these capabilities be available for use by or on behalf of others?
4.1 Do others use now? For what purpose?
32

711 7/2003
N/A
4.2 On what computer platforms does it run?
Desktop PC with Windows OS.
5 .Who sponsored development of this capability?
TELOS was sponsored by a program jointly funded by EPRI and the Department of Defense, known as the “EPRIZDOD Complex Interactive Networks Program. ’:
5.1 How much has been invested?
1.5M.
6 . Are there publications that describe the capabilities, or studies resulting from them?
Selected publications: 0 Tsoukalas, L.H., Gao, R., Fieno, T., Wang, X., “Anticipatory Regulation of Complex Power Systems, ” Proc. of European Workshop on Intelligent Forecasting, Diagnosis and Control- IFDICON 2001, Santorini, Greece, June 2001 0
Journal of Intelligent and Robotic Systems, 31:149-157,2001 0
Logic-Based Methodology for Trend Identijication, ” in Nuclear Technology, 135, No.
0 Gao, R., et. AI, Short-term Elasticities via Intelligent Tools for Modern Power Systems, Med Power’02, Athens, Greece, November 4 - 6,2002
Gao, R., Tsoukalas, L. H., Neural- Wavelet Methodology for Load Forecasting,
Wang X , Tsoukalas L.H., Wei T.Y.C., Reifman J., “An Innovative Fuzzy-
I , pp. 67-83,2001
7. What are plans for fbture development?
7.1 Added Capabilities?
Intelligent consumption planning capabilities for individual customers will be added
7.2 Schedule for new capabilities?
Economic models development will be scheduled
7.3 Are milestones for the next 12 months available?
It is possible to achieve the above-mentioned goals in 12 months.
33

711 712003
3.3.4. Power Market Simulator Lab: Los Alamos National Laboratory (LANL) I National Infrastructure Simulation and
Analysis Center (NISAC) Primary Contact: Achla Marathe (505-667-9034, [email protected])
Data taken by P. Boggs based on telephone conversation.
Capabilities Template
1 . What was this software designed to do? What problem(s) was it designed to solve? Describe in terms of criteria 1.1 - 1.2 below, when possible.
The code, called Power Market Simulator, is designed to analyze how various regulatory models affect the market for electric power and how policy changes affect the market dynamics. The somare is usable now, but the code is not in the public domain. It can also evaluate the effect ofpart of the system going down and the interdependencies with other parts of the power infrastructure.
1.1 Does it assess the significance of bottlenecks on grid reliability? Measure degree of usefulness according to rough scale of the following characteristics:
N/A
1.1.1 Does it provide a dynamic model of voltage and frequency?
N/A
1.1.2 Does it allow simulation to continue “though” faults?
NIA
1.1.3 Does it accept as input to its model specification grid topology/capacity, generation and demand by node or control area?
N/A
I . 1.4 Does it allow for change of demand and generation as functions of time?
N/A
1.1.5 Can we identify the occurrence of a “blackout” by observing the faulted frequency behavior of the grid? Can we estimate the size of the “blackout” from grid topology and frequency behavior at nodes?
N/A
34

71 1 712003
I 35
1.1.6 If we assign probabilities to fault events, can we then calculate the probabilities of the resulting blackouts?
N/A
1. I .7 Can we assign an economic value to a “blackout” of known location, extent and duration? Can we aggregate many such probability weighted economic values?
N/A
1.2 Does it assess the significance of bottlenecks on power market economics? Measure degree of usefulness according to rough scale of the following characteristics:
Yes
1.2.1 Does it calculate market prices for power by node or control area? OR Does it calculate path-specific transmission prices by path?
They calculate by area, not nodal. They use one centralized clearing procedure.
1.2.2 Does it accept as input: grid topology (including capacities) incremental generation costkapacity by node or control area, similarly demand, power andor transmission market rules?
Yes, can model new capabilities as needed
1.2.3 What are the market economics principles used in solving the market price problem (e.g. game theory or Nash equilibrium approaches)?
They use game theory or oligopoly. And they can ‘Wear ” the market in dinerent ways.
1.2.4 Can this model represent both reliability-driven operations and market-driven operations?
Yes
1.2.5 Is it possible to optimize over grid topology and transmission capacity such that aggregate consumer prices are minimized? Is it possible to include the capital cost of transmission capacity increases in this optimization.
Some optimization is possible.
2. What is the degree of aggregation assumed by this model? Are individual elements, such as generators, transmission lines, and radial-distribution markets represented, or are these represented by aggregate elements in order to reduce model complexity?

711 712003
, 36
2.1 e.g. a heavily-aggregated (heavily-lumped,) model for the entire US assumes -70 generators. A moderately aggregated commercial model assumes -70 generators for the West Coast. PJM’s model for their tri-state region has 100’s of generators. There are roughly 16,000 generators in the eastern transmission region.
They can do aggregation but they do have models down to low level.
2.2 e.g. are actual economic parameters of the generators represented, such as “heat rate’ (% conversion efficiency from heat to electricity), cost of hel , cost of operation and maintenance (O&M), capital cost, cost of cold start ($ to go from stopped to spinning), etc.
They have a cost function for each generator, but it is simple: frxed + variable.
3. Implementation, calibration and validation:
3.1 Imslementation: What is the scale and degree of realism of the current use(s) of the model? e.g. runs a regional case for all of NM, with realistic data; runs standard IEEE Test Bus model; runs 5-node proof-of-concept.
Much more realistic than other models. They have run the Portland model with detailed description of the demand profiles, using real physical clearing and market models.
3.2 Calibration: are model parameters based on calibration to a real-world data set? Is there a software mechanism provided for calibrating (fitting) the model to different data set values? Are data sets available for US regions?
Doing case studies based on the Portland data.
3.3 Validation: Has the model been validated by comparing its output to real-world data representing normal and abnormal transmission phenomena?
Doing case studies based on the Portland data.
4. When will these capabilities be available for use by or on behalf of others?
4.1 Do others use now? For what purpose?
They can do studies for others.
4.2 On what computer platforms does it run?
N/A
5.Who sponsored development of this capability?

711 712003
NISAC and LDRD
5.1 How much has been invested?
Approximately $500 - 700K.
6. Are there publications that describe the capabilities, or studies resulting from them?
Yes
7. What are plans for future development?
7.1 Added capabilities?
More case studies related to interdependencies and the cascading effect of failures. They will also address the spot market and congestion improvement.
7.2 Schedule for new capabilities?
Within the next 12 months.
7.3 Are milestones for the next 12 months available?
NIA
37

7/ 1 7/2003
3.3.5. Power Systems Analyzer Lab: Los Alamos National Laboratory (LANL) / National Infrastructure Simulation and Analysis Center (NISAC) Primary Contact: Cetin Una1 (505-665-2539, [email protected])
Data taken by P. Boggs based on telephone conversation
Capabi 1 i ties Template
1. What was this software designed to do? What problem(s) was it designed to solve? Describe in terms of criteria 1.1 - 1.2 below, when possible.
The somare was designed to assess electric power reliability and vulnerability. LANL has developed its own code, called Power Systems Analyzer which can be connected to a commercial power j low modeler. It is considered a very powerful tool for steady state analysis. For any dynamic studies, they use the commercial GE codes. Much of the work is devoted to interdependencies between various infrastructure energy components.
1.1 Does it assess the significance of bottlenecks on grid reliabilitv? Measure degree of usefulness according to rough scale of the following characteristics:
Yes
I . 1.1 Does it provide a dynamic model of voltage and frequency?
No
1.1.2 Does it allow simulation to continue “though” faults?
No
1.1.3 Does it accept as input to its model specification grid topology/capacity, generation and demand by node or control area?
Yes. And they have what they regard as the best data to support this.
1.1.4 Does it allow for change of demand and generation as functions of time?
No
1.1 S c a n we identify the occurrence of a “blackout” by observing the faulted frequency behavior of the grid? Can we estimate the size of the “blackout” from grid topology and frequency behavior at nodes?
Only in steady state.
38

7/17/2003
I . 1.6 If we assign probabilities to fault events, can we then calculate the probabilities of the resulting blackouts?
No
1.1.7 Can we assign an economic value to a “blackout” of known location, extent and duration? Can we aggregate many such probability weighted economic values?
No
1.2 degree of usefulness according to rough scale of the following characteristics:
Does it assess the significance of bottlenecks on power market economics? Measure
They are beginning to work on this problem. They are doing some testing with a commercial code (REME) using local area data bases. They are also looking into getting national data bases. They should have some capabilities here soon.
1.2.1 Does it calculate market prices for power by node or control area? OR Does it calculate path-specific transmission prices by path?
N/A
1.2.2 Does it accept as input: grid topology (including capacities) incremental generation costhapacity by node or control area, similarly demand, power and/or transmission market rules?
N/A
1.2.3 What are the market economics principles used in solving the market price problem (e.g. game theory or Nash equilibrium approaches)?
N/A
1.2.4 Can this model represent both reliability-driven operations and market-driven operations.
N/A 1.2.5 Is it possible to optimize over grid topology and transmission capacity such that aggregate consumer prices are minimized? Is it possible to include the capital cost of transmission capacity increases in this optimization.
N/A
39

711 712003
2. What is the degree of aggregation assumed by this model? Are individual elements, such as generators, transmission lines, and radial-distribution markets represented, or are these represented by aggregate elements in order to reduce model complexity?
They can aggregate within PSA.
2.1 e.g. a heavily-aggregated (heavily-limped) model for the entire US assumes -70 generators. A moderately aggregated commercial model assumes -70 generators for the West Coast. PJM’s model for their tri-state region has 100’s of generators. There are roughly 16,000 generators in the eastern transmission region.
2.2 e.g. are actual economic Parameters of the generators represented, such as “heat rate’ (% conversion efficiency from heat to electricity), cost of fuel, cost of operation and maintenance (O&M), capital cost, cost of cold start ($ to go from stopped to spinning), etc.
3. Implementation, calibration and validation:
They have the best validation and calibration within the national labs. They run many bench marks.
3.1 Implementation: What is the scale and degree of realism of the current use(s) of the model? e.g. runs a regional case for all of NM, with realistic data; runs standard IEEE Test Bus model; runs 5-node proof-of-concept.
N/A
3.2 Calibration: are model parameters based on calibration to a real-world data set? Is there a software mechanism provided for calibrating (fitting) the model to different data set values? Are data sets available for US regions? N/A 3.3 Validation: Has the model been validated by comparing its output to real-world data representing normal and abnormal transmission phenomena?
N/A
4. When will these capabilities be available for use by or on behalf of others?
4.1 Do others use now? For what purpose?
Can be used for studies. Some classified work done.
4.2 On what computer platforms does it run?
N/A
40

7/17/2003
5 .Who sponsored development of this capability?
Was originaIIy DOD sponsored, but now is part of NISAC.
5.1 How much has been invested?
$2-3M/yr. Over 10 years.
6 . Are there publications that describe the capabilities, or studies resulting from them?
Some publications are in process.
7 . What are plans for future development?
7.1 Added capabilities?
Adding dynamic capabilities.
7.2 Schedule for new capabilities?
Should be ready during this flscal year.
7.3
N/A
Are milestones for the next 12 months available?
41

711 7/2003
3.3.6. Positive Sequential Load Flow (PSLF) and Positive Sequential Dynamic
Lab: Pacific Northwest National Laboratory (PNNL) Primary Contact: Jeff Dagle (509-375-3629, [email protected])
Simulation (PSDS) by GE and PSS/E from Power Tech, Inc.
Data taken by P. Boggs based on telephone conversation.
Capabilities Template
1. What was this software designed to do? What problem(s) was it designed to solve? Describe in terms of criteria 1.1 - 1.2 below, when possible.
The somare is for transmission level planning and consists of several commercial codes, including Positive Sequential Load Flow an Positive Sequential Dynamic Simulation by GE. These are the standards for the Western Electric Coordinating Council. They also have PSSB by Power Tech, Inc., which is similar to the GE somare. They also have some experience with EPRI software, but have not renewed the license for this somare.
1.1 Does it assess the significance of bottlenecks on grid reliabilitv? Measure degree of usefblness according to rough scale of the following characteristics:
1.1.1 Does it provide a dynamic model of voltage and frequency?
Yes
1.1.2 Does it allow simulation to continue “though” faults?
Yes
1.1.3 Does it accept as input to its model specification grid topology/capacity, generation and demand by node or control area?
Yes
1.1.4 Does it allow for change of demand and generation as functions of time?
No
1.1.5 Can we identi@ the occurrence of a “blackout” by observing the faulted frequency behavior of the grid? Can we estimate the size of the “blackout” from grid topology and frequency behavior at nodes?
Yes 1.1.6 If we assign probabilities to fault events, can we then calculate the probabilities of the resulting blackouts?

711 712003
Yes
1.1.7 Can we assign an economic value to a “blackout” of known location, extent and duration? Can we aggregate many such probability weighted economic values?
No
1.2 Does it assess the significance of bottlenecks on power market economics? Measure degree of usefulness according to rough scale of the following characteristics:
They have no economic modeling capabilities at this time, but are working on adding some as explained below.
1.2.1 Does it calculate market prices for power by node or control area? OR Does it calculate path-specific transmission prices by path?
N/A
1.2.2 Does it accept as input: grid topology (including capacities) incremental generation costkapacity by node or control area, similarly demand, power andor transmission market rules?
N/A
1.2.3 What are the market economics principles used in solving the market price problem (e.g. game theory or Nash equilibrium approaches) N/A
1.2.4 Can this model represent both reliability-driven operations and market-driven operations?
N/A
1.2.5 Is it possible to optimize over grid topology and transmission capacity such that aggregate consumer prices are minimized? Is it possible to include the capital cost of transmission capacity increases in this optimization. N/A
2. What is the degree of aggregation assumed by this model? Are individual elements, such as generators, transmission lines, and radial-distribution markets represented, or are these represented by aggregate elements in order to reduce model complexity?
These types of models include individual elements, e.g., generations, transformers, transmission lines, etc., down to the substation level. The distribution system is
43

71 1 712003
aggregated up to the substation. For example, our model of the Western US power system has approximately 12,000 nodes.
2.1 e.g. a heavily-aggregated (heavily-l~rmperl) model for the entire US assumes -70 generators. A moderately aggregated commercial model assumes -70 generators for the West Coast. PJM’s model for their tri-state region has 100’s of generators. There are roughly 16,000 generators in the eastern transmission region.
No
2.2 e.g. are actual economic parameters of the generators represented, such as “heat rate’ (% conversion efficiency from heat to electricity), cost of fuel, cost of operation and maintenance (O&M), capital cost, cost of cold start ($ to go from stopped to spinning), etc.
No 3. Implementation, calibration and validation:
3.1 Implementation: What is the scale and degree of realism of the current use(s) of the model? e.g. runs a regional case for all of NM, with realistic data; runs standard IEEE Test Bus model; runs 5-node proof-of-concept.
Runs with realistic data.
3.2 Calibration: are model parameters based on calibration to a real-world data set? Is there a software mechanism provided for calibrating (fitting) the model to different data set values? Are data sets available for US regions?
Yes, each of the NERC regions maintains datasets for that region.
3.3 Validation: Has the model been validated by comparing its output to real-world data representing normal and abnormal transmission phenomena?
Yes
4. When will these capabilities be available for use by or on behalf of others?
4.1 Do others use now? For what purpose?
Are being used throughout the country and internationally.
4.2 On what computer platforms does it run?
N/A
5.Who sponsored development of this capability?
44

N/A
5.1 How much has been invested?
N/A
6 . Are there publications that describ
N/A
the capabilities, or studie r
-
71 1 712003
sulting from them?
7. What are plans for future development?
NA
7.1 Added capabilities?
They have plans to add market economic modeling on top of the Alstom Dispatcher Training Simulator.
7.2 Schedule for new capabilities?
By the end of the fiscal year.
7.3 Are milestones for the next 12 months available?
Yes, related to the LDRD that is sponsoring this work.
45

7/17/2003
3.3.7. BUZZARD (BUZZARD and PFLOW) Lab: Sandia National Laboratories (SNL) Primary Contact: David G. Robinson (505-844-5883, [email protected])
Data taken by Victoria Howle based on telephone conversation.
Capabilities Template
I . What was this software designed to do? What problem(s) was it designed to solve? Describe in terms of criteria 1.1 - 1.2 below, when possible.
BUZZARD is composed of two packages: a powerflow package (either IPF or PFLOW) and an artificial intelligence based search code. In it’s simplest form, BUZZARD is an N-node contingency analysis tooL
1 . 1 Does it assess the significance of bottlenecks on grid reliability? Measure degree of usefulness according to rough scale of the following characteristics:
Yes. BUZZARD is designed to analyze topology and flow bottlenecks.
I . 1.1 Does it provide a dynamic model of voltage and frequency?
No.
I . 1.2 Does it allow simulation to continue “though” faults?
Not currently, but it could easily be modified to do this.
1.1.3 Does it accept as input to its model specification grid topology/capacity, generation and demand by node or control area?
Yes.
1.1.4 Does it allow for change of demand and generation as functions of time?
No, not on a scale of minutes or lower. But it does allow for change on the scale of hours.
I . 1.5 Can we identify the occurrence of a “blackout” by observing the faulted frequency behavior of the grid? Can we estimate the size of the “blackout” from grid topology and frequency behavior at nodes?
No. BUZZARD can be used to identi& blackouts, but not from the faulted frequency behavior.
46

711 712003
1.1.6 If we assign probabilities to fault events, can we then calculate the probabilities of the resulting blackouts?
Yes. This can be done, however it is not an integratedpart of BUZZARD.
1.1.7 Can we assign an economic value to a “blackout” of known location, extent and duration? Can we aggregate many such probability weighted economic values?
No. But can anyone really do this? Even with the 1996 blackout, economic value has not been able to be assigned.
1.2 Measure degree of usefulness according to rough scale of the following characteristics:
Does it assess the significance of bottlenecks on power market economics?
N/A
1.2.1 Does it calculate market prices for power by node or control area? OR Does it calculate path-specific transmission prices by path?
N/A 1.2.2 Does it accept as input: grid topology (including capacities) incremental generation costkapacity by node or control area, similarly demand, power and/or transmission market rules?
N/A 1.2.3 What are the market economics principles used in solving the market price problem (e.g. game theory or Nash equilibrium approaches)?
N/A 1.2.4 Can this model represent both reliability-driven operations and market-driven operations?
N/A
1.2.5 Is it possible to optimize over grid topology and transmission capacity such that aggregate consumer prices are minimized? Is it possible to include the capital cost of transmission capacity increases in this optimization.
N/A
2. What is the degree of aggregation assumed by this model? Are individual elements, such as generators, transmission lines, and radial-distribution markets represented, or are these represented by aggregate elements in order to reduce model complexity?
47

711 712003
No aggregation.
2.1 e.g. a heavily-aggregated (heavily-lmped) model for the entire US assumes -70 generators. A moderately aggregated commercial model assumes -70 generators for the West Coast. PJM’s model for their tri-state region has 100’s of generators. There are roughly 16,000 generators in the eastern transmission region.
N/A
2.2 e.g. are actual economic parameters of the generators represented, such as “heat rate’ (% conversion efficiency from heat to electricity), cost of fuel, cost of operation and maintenance (O&M), capital cost, cost of cold start ($ to go from stopped to spinning), etc.
No.
3. Implementation, calibration and validation:
3.1 Implementation: What is the scale and degree of realism of the current use(s) of the model? e.g. runs a regional case for all of NM, with realistic data; runs standard IEEE Test Bus model; runs 5-node proof-of-concept.
Current uses include IEEE RTS system, real world data andgrid topology, and FERC data sets.
3.2 Calibration: are model parameters based on calibration to a real-world data set? Is there a software mechanism provided for calibrating (fitting) the model to different data set values? Are data sets available for US regions?
Yes.
3.3 Validation: Has the model been validated by comparing its output to real-world data representing normal and abnormal transmission phenomena?
No, but BUZZARD is not providing the model. The model is user provided BUZZARD has been “validated” on standard test sets.
4. When will these capabilities be available for use by or on behalf of others?
Releasing in a couple of months (as soon as validation is complete).
4.1 Do others use now? For what purpose?
No.
4.2 On what computer platforms does it run?
48

711 712003
PC for small power models. In L INW, ported to massively parallel machines.
5.Who sponsored development of this capability?
Internal Sandia funding.
5.1 How much has been invested?
Approximately 600K (including SCADA work).
6. Are there publications that describe the capabilities, or studies resulting from them? No. Although the work is not classifled, much of the data (such as the FERC data) is sensitive.
7. What are plans for future development?
Development i s scheduled to continue through FY03.
7.1 Added capabilities?
Interface to Bonneville Power Association (BPA) code and another power flow code called IPF in FY03.
7.2 Schedule for new capabilities?
FY03 schedule includes integration of BUZZARD and Bonneville power flow code, port of BUZZARD to parallel machines, and vulnerability analysis of ERCOT (Texas) power region, Western power region, and Eastern power region.
7.3 Are milestones for the next 12 months available?
Yes.
49

7/17/2003
4. References
[ 13 National Transmission Grid Study, Report of The Secretary of Energy to the President, May 2002.
[2] Energy Infrastructure Assurance Program Catalog of Department of Energy Laboratories’ Capabilities, (Official Use Only), November 2002.
[3] J. Eto, Staff Scientist, Environmental Energy Technologies Division, Berkeley National Laboratory, private communications, December 2002 - January 2003.
[4] Six issue papers were attached to the National Transmission Grid Study. Their titles are “Transmission System Operation and Interconnection,” Reliability Management and Oversight,” “Alternative Business Models for Transmission Ownership and Operation,” Transmission Planning and the Need for New Capacity,” “Transmission Siting and Permitting,” and “Advanced Transmission Technologies.”
[5] Wood, A.J. and Wollenberg, B.F., Power Generation, Operation, and Control, Second Edition, John Wiley and Sons, New York, 1996.
I [6] Home page for the ASCI program: http://www.Ilnl.Eov/asci
I [7] Robert Thomas, Professor of Electrical and Computer Engineering, Cornell University, private communication, November - December 2002.
I
[8] Fernando Alvarado, Professor of Electrical and Computer Engineering, University of Wisconsin, private communication, December 2002.
50

711 712003
APPENDIX A
National Transmission Grid Modeling Capabilities at DOE Labs: Survey Questionnaire
Scope and Purpose: A consistent survey of DOE Labs modeling capabilities relevant to study of transmission congestion (grid “bottlenecks”) on the reliability and economics of the national electric grid. Roughly, “What software tools do the Labs have that would support the next generation of the National Transmission Grid Study?”
Capabilities Survev: Please tell us of any existing modeling/analysis software within the general scope above. Please limit your answers to software capabilities available now, or within 3 months. We would appreciate your help in collecting consistent survey information by structuring your answers along the lines of the Capabilities Template below, where possible.
Surveyors’ Contact Info:
Computational Sciences and Mathematics Research Department Sandia National Laboratories MS9217, PO Box 969 Livennore, CA 94550-0969 Fax: 925 294 2234
Paul Boggs 925 294 4630, ptbongs@,sandia.gov
Victoria Howle 925 294 2204, vehowle@,sandia.gov
Steve Thomas, Manager 925 294 2954, [email protected]
Capabilities Template
1. What was this software designed to do? What problem(s) was it designed to solve? Describe in terms of criteria 1.1 - 1.2 below, when possible.
1.1 Does it assess the significance of bottlenecks on grid reliability? Measure degree of usefulness according to rough scale of the following characteristics:
1.1.1 Does it provide a dynamic model of voltage and frequency?
1.1.2 Does it allow simulation to continue “though” faults?
51

71 1 712003
1. I .3 Does it accept as input to its model specification grid topologylcapacity, generation and demand by node or control area?
1.1.4 Does it allow for change of demand and generation as functions of time?
1.1.5 Can we identify the occurrence of a “blackout” by observing the faulted frequency behavior of the grid? Can we estimate the size of the “blackout” from grid topology and frequency behavior at nodes?
1.1.6 if we assign probabilities to fault events, can we then calculate the probabilities of the resulting blackouts?
1.1.7 Can we assign an economic value to a “blackout” of known location, extent and duration? Can we aggregate many such probability weighted economic values?
1.2 Does it assess the significance of bottlenecks on power market economics? Measure degree of usefulness according to rough scale of the following characteristics:
1.2.1 Does it calculate market prices for power by node or control area? OR Does it calculate path-specific transmission prices by path? .
1.2.2 Does it accept as input: grid topology (including capacities) incremental generation costlcapacity by node or control area, similarly demand, power and/or transmission market rules?
1.2.3 What are the market economics principles used in solving the market price problem (e.g. game theory or Nash equilibrium approaches)?
1.2.4 Can this model represent both reliability-driven operations and market-driven operations?
1.2.5 Is it possible to optimize over grid topology and transmission capacity such that aggregate consumer prices are minimized? Is it possible to include the capital cost of transmission capacity increases in this optimization?
2. What is the degree of aggregation assumed by this model? Are individual elements, such as generators, transmission lines, and radial-distribution markets represented, or are these represented by aggregate elements in order to reduce model complexity?
2.1 e.g. a heavily-aggregated (heavily-Zmped model for the entire US assumes -70 generators. A moderately aggregated commercial model assumes -70
52

711 712003
generators for the West Coast. PJM’s model for their tri-state region has 100’s of generators. There are roughly 16,000 generators in the eastern transmission region.
2.2 e.g. are actual economic parameters of the generators represented, such as “heat rate’ (% conversion efficiency from heat to electricity), cost of fuel, cost of operation and maintenance (O&M), capital cost, cost of cold start ($ to go from stopped to spinning), etc.
3. Implementation, calibration and validation:
3.1 Implementation: What is the scale and degree of realism of the current use(s) of the model? e.g. runs a regional case for all of NM, with realistic data; runs standard IEEE Test Bus model; runs 5-node proof-of-concept.
3.2 Calibration: are model parameters based on calibration to a real-world data set? Is there a software mechanism provided for calibrating (fitting) the model to different data set values? Are data sets available for US regions?
3.3 Validation: Has the model been validated by comparing its output to real- world data representing normal and abnormal transmission phenomena?
4. When will these capabilities be available for use by or on behalf of others?
4. I Do others use now? For what purpose?
4.2 On what computer platforms does it run?
5.Who sponsored development of this capability?
5.1 How much has been invested?
6. Are there publications that describe the capabilities, or studies resulting from them?
7. What are plans for future development?
7.1 Added capabilities?
7.2 Schedule for new capabilities?
7.3 Are milestones for the next 12 months available?
53


![Power Transmission Solutions Grid · PDF filePower Transmission Solutions Grid Access ... Station 132 kV Cables. ... _Greater Gabbard Grid Access_V 1a.ppt [Schreibgeschützt]](https://static.fdocuments.net/doc/165x107/5aaf1b2d7f8b9a3a038cf7dd/power-transmission-solutions-grid-transmission-solutions-grid-access-station.jpg)
