A Survey of AM-FM methods for Applications in Medical Imaging
12
Journal of Intelligent and Robotic Systems manuscript No. (will be inserted by the editor) A Survey of AM-FM methods for Applications in Medical Imaging Victor Murray · Eduardo S. Barriga · Marios S. Pattichis · Peter Soliz Received: date / Accepted: date Abstract Amplitude-Modulation Frequency- Modulation (AM-FM) decompositions represent images using spatially-varying sinusoidal waves and their spatially-varying amplitudes. The model uses different scales and bandpass filters to characterize the wide range of frequencies that may be present in an image. In the past few years, as the understanding of its the- ory advanced, AM-FM has been used in a series of medical imaging problems ranging from ultrasound to retinal image analysis, yielding excellent results. This paper summarizes the theory of AM-FM and some of its main medical imaging applications: carotid artery ultrasound, pneumoconiosis, diabetic retinopathy, and age-related macular degeneration. Keywords Multidimensional AM-FM methods · digital image processing · medical imaging. 1 Introduction In the field of computer aided detection and diagnostics (CAD), recent advances in image processing techniques have brought a wide array of applications into the field. Many existing CAD methods rely on fixed basis func- tions based on wavelet decompositions [1] and Gabor fil- V. Murray · M.S. Pattichis University of New Mexico, Department of Electrical and Com- puter Engineering, Albuquerque, NM-87131. Tel.: +1-505-277-2436 Fax: +1-505-277-1439 E-mail: [email protected], [email protected] E.S. Barriga · P. Soliz VisionQuest Biomedical, Albuquerque, NM-87106. Tel.: +1-505-508-1994 Fax: +1-505-508-5308 E-mail: [email protected], psoliz@visionquest- bio.com ters [2]. Amplitude-Modulation Frequency-Modulation (AM-FM) methods [3–6] represent an emerging tech- nique that shows great promise in this area. Multi-dimensional AM-FM models and methods pro- vide us with powerful, image and video decompositions that can effectively describe non-stationary content. They represent an extension to standard Fourier anal- ysis, where we allow both the amplitude and the phase functions to vary spatially over the support of the im- age, following changes in local texture and brightness. To explain some of the advantages of AM-FM meth- ods, we begin with the basic AM-FM model. In the 2D model, we expand an input image I (x, y) into a sum of AM-FM harmonics using: I (x, y)= M n=1 a n (x, y) cos ϕ n (x, y), (1) where a n (x, y) denote slowly-varying instantaneous am- plitude (IA) functions, ϕ n (x, y) denote the instanta- neous phase (IP) components, and n =1, 2,...,M in- dexes the different AM-FM harmonics. In (1), we have that the n-th AM-FM harmonic is represented by a n (x, y) cos ϕ n (x, y). With each phase function, we associate the instanta- neous frequency (IF) vector field defined by ∇ϕ n (x, y). Here, the AM-FM demodulation problem is defined as one of determining the IA, IP, and IF functions for any given input image. We now have a number of different methods for computing AM-FM decompositions. AM-FM decompositions provide for physically mean- ingful texture measurements. Usually, significant tex- ture variations are captured in the frequency compo- nents. For single component cases, IF vectors are or- thogonal to equi-intensity lines of an image, while the IF magnitude provides a measure of local frequency
Transcript of A Survey of AM-FM methods for Applications in Medical Imaging

Journal of Intelligent and Robotic Systems manuscript No.(will be inserted by the editor)
A Survey of AM-FM methods for Applications in MedicalImaging
Victor Murray · Eduardo S. Barriga · Marios S. Pattichis · Peter Soliz
Received: date / Accepted: date
Abstract Amplitude-Modulation Frequency-Modulation (AM-FM) decompositions represent images
using spatially-varying sinusoidal waves and their
spatially-varying amplitudes. The model uses different
scales and bandpass filters to characterize the wide rangeof frequencies that may be present in an image. In
the past few years, as the understanding of its the-
ory advanced, AM-FM has been used in a series of
medical imaging problems ranging from ultrasound to
retinal image analysis, yielding excellent results. Thispaper summarizes the theory of AM-FM and some of
its main medical imaging applications: carotid artery
ultrasound, pneumoconiosis, diabetic retinopathy, and
age-related macular degeneration.
Keywords Multidimensional AM-FM methods ·
digital image processing · medical imaging.
1 Introduction
In the field of computer aided detection and diagnostics
(CAD), recent advances in image processing techniques
have brought a wide array of applications into the field.Many existing CAD methods rely on fixed basis func-
tions based on wavelet decompositions [1] and Gabor fil-
V. Murray · M.S. PattichisUniversity of New Mexico, Department of Electrical and Com-puter Engineering, Albuquerque, NM-87131.Tel.: +1-505-277-2436Fax: +1-505-277-1439E-mail: [email protected], [email protected]
E.S. Barriga · P. SolizVisionQuest Biomedical, Albuquerque, NM-87106.Tel.: +1-505-508-1994Fax: +1-505-508-5308E-mail: [email protected], [email protected]
ters [2]. Amplitude-Modulation Frequency-Modulation(AM-FM) methods [3–6] represent an emerging tech-
nique that shows great promise in this area.
Multi-dimensional AM-FM models and methods pro-vide us with powerful, image and video decompositions
that can effectively describe non-stationary content.
They represent an extension to standard Fourier anal-
ysis, where we allow both the amplitude and the phase
functions to vary spatially over the support of the im-age, following changes in local texture and brightness.
To explain some of the advantages of AM-FM meth-
ods, we begin with the basic AM-FM model. In the 2Dmodel, we expand an input image I(x, y) into a sum of
AM-FM harmonics using:
I(x, y) =
M∑
n=1
an(x, y) cosϕn(x, y), (1)
where an(x, y) denote slowly-varying instantaneous am-
plitude (IA) functions, ϕn(x, y) denote the instanta-
neous phase (IP) components, and n = 1, 2, . . . , M in-
dexes the different AM-FM harmonics. In (1), we havethat the n-th AM-FM harmonic is represented by
an(x, y) cosϕn(x, y).
With each phase function, we associate the instanta-neous frequency (IF) vector field defined by ∇ϕn(x, y).
Here, the AM-FM demodulation problem is defined as
one of determining the IA, IP, and IF functions for any
given input image. We now have a number of different
methods for computing AM-FM decompositions.
AM-FM decompositions provide for physically mean-
ingful texture measurements. Usually, significant tex-
ture variations are captured in the frequency compo-nents. For single component cases, IF vectors are or-
thogonal to equi-intensity lines of an image, while the
IF magnitude provides a measure of local frequency
2
content. In (1), by using AM-FM components from dif-
ferent scales, we can produce IF vectors from different
scales, at a pixel-level resolution [4, 5].
Since AM-FM texture features are provided at a
pixel-level resolution, AM-FM models can be used tosegment texture images that are very difficult to model
with the standard brightness-based methods [7]. On the
other hand, using just histograms of the IF and IA,
we can design effective content-based image retrievalsystems using very short image feature vectors [8].
In summary, the advantages of AM-FM methods in-
clude [9]: (i) they provide for a large number of physi-
cally meaningful texture features, over multiple scales,
at a pixel-level resolution, (ii) we can reconstruct theimage from the AM-FM decompositions, (iii) based on
the target application, we can design for different AM-
FM decompositions using different frequency coverage
and (iv) we have the recent development of very robustmethods for AM-FM demodulation (see some recent
examples in [4]).
We can extend AM-FM decompositions for repre-
senting videos using [10]:
I(x, y, t) =
M∑
n=1
an(x, y, t) cosϕn(x, y, t), (2)
where each AM-FM function has been extended to be
a function of both space and time. The original phase-
based modeling approach was provided by Fleet andJepson in [11] and was recently extended by Murray et
al. in [10, 11].
The comparison between an AM-FM reconstruction
and the original image provides us with a method tobetter understand what AM-FM is measuring. For
continuous-space image decompositions, AM-FM recon-
struction examples can be found in [12], while [4, 5]
give several recent, robust multi-scale examples for both
images and videos. AM-FM Transform examples wereshown in [13], while multidimensional orthogonal FM
transforms were demonstrated in [14].
An early example of the use of frequency-domain
filtering to target a particular application can be foundin the fingerprint examples in [15]. More recently, Ra-
machandran provided a tree-growth application, where
inter-ring spacing was used to design filterbanks that
cover a specific part of the spectrum, so as to recover
tree ring and tree growth structure from very noisy im-age inputs [16]. For general images, Gabor filterbank
approaches were investigated by Havlicek in [3]. Simi-
larly, for general images and videos, Murray introduced
dyadic, multiscale decompositions in his dissertation[4].
Alternatively, AM-FM estimates can be obtained
using an Energy Separation Algorithm (ESA) as de-
scribed in [17–19]. Both ESA and Hilbert-based meth-
ods share the use of a filterbank prior to AM-FM de-
modulation. Furthermore, both methods extract esti-
mates from a dominant component. For ESA, the dom-
inant component is selected based on an energy crite-rion. In QEA, the dominant component is often selected
based on IA estimates. In this article, we will only pro-
vide details for the Hilbert-based methods focusing on
the accurate results presented in [5].
The methods Section 2 describes the theory behind
AM-FM and some of the post-processing and classifica-tion techniques used. Results are presented for several
applications in Section 3. Finally, conclusions and fu-
ture work are presented on Section 4.
2 Methods
2.1 AM-FM methods
We consider multi-scale AM-FM representations, under
least-square approximations, for 2D signals (images)given by
I(x, y) ≃M∑
n=1
an(x, y) cosϕn(x, y), (3)
where n = 1, 2, . . . , M denote different scales [4, 5]. In
(3), a continuous image I(x, y) is a function of a vectorof spatial coordinates (x, y). A collection of M differ-
ent scales are used to model essential signal modulation
structure. The amplitude functions an(·) are always as-
sumed to be positive.
AM-FM models non-stationary image content in
terms of its amplitude and phase functions [6]. The
aim is to let the frequency-modulated (FM) compo-nents cosϕn(·) capture fast-changing spatial variability
in the image intensity. For each phase function ϕn(·)
we define the instantaneous frequency (IF), ∇ϕn(·), in
terms of the gradient. We have:
∇ϕn(x, y) =
(
∂ϕn
∂x(x, y),
∂ϕn
∂y(x, y)
)
. (4)
The instantaneous frequency vector ∇ϕn(·) can vary
continuously over the spatial domain of the input signal.
The basic, Hilbert-based AM-FM demodulation sys-tem is given in Figs. 1 and 2. First, the real-valued in-
put signal is “analytically” extended by removing all
negative frequency components. The effect of this op-
eration is to create a complex-valued signal of the form:a(x, y) exp[jϕ(x, y)]. We then use a collection of band-
pass filters to isolate the individual AM-FM compo-
nents [3].

3
The basic assumption here is that different AM-FM
components will be picked up by different bandpass fil-
ters, at the same image region. In other words, given
any local image region, the assumption is that the cor-
responding AM-FM components will be separated bythe use of different filters in the filterbank.
Given the digital input image I(k1, k2) (where k1
and k2 are the discrete versions of x and y, respec-tively), we first apply a partial Hilbert transform to
form a 2D extension of the 1D analytic signal: IAS(k1, k2).
This 2D extension is processed through a collection of
bandpass filters (to be described in the subsection 2.2)within the desired scale. Each processing block will pro-
duce the instantaneous amplitude, the instantaneous
phase, and the instantaneous frequencies in both x and
y directions.
For each pixel (pixel-level approach) we select the
AM-FM demodulation estimates from the bandpass fil-
ter that produces the largest instantaneous amplitude
estimate (dominant component analysis, DCA). Hence,the algorithm adaptively selects the estimates from the
bandpass filter with the maximum response. This ap-
proach does not assume spatial continuity, and allows
the model to quickly adapt to singularities in the inputsignal (both high and low frequency changes).
For any single-scale, the IA and the IP are estimated
using [3] a(k1, k2) = |IAS(k1, k2)| and ϕ(k1, k2) =
arctan(
imag(IAS(k1, k2))/ real(IAS(k1, k2)))
,
respectively, with IAS(k1, k2) = I(k1, k2)+jH2d[I(k1, k2)],
where H2d denotes a two-dimensional partial Hilbert
transform operator.
For robust IA and IF estimations, we use a vari-
able spacing, local linear phase (VS-LLP) method as
described in [4,5]. Here, for estimating the first compo-
nent, we generate four estimates using:
ϕ1(k1, k2) =
1
n1
arccos
(
IAS(k1 + n1, k2) + IAS(k1 − n1, k2)
2IAS(k1, k2)
)
, (5)
where IAS(k1, k2) = IAS(k1, k2)/|IAS(k1, k2)|, n1 rep-
resents a variable displacement n1, from 1 to 4. VS-LLP produces the most accurate of the four estimates
by considering the condition number of the arccos(·)
function [4, 5]. The approach is similar for the second
component direction. It turns out that VS-LLP reducesto the earlier method of Quasi-Eigenfunction Approxi-
mation (QEA) for the special case when n1 = n2 = 1
(see [3] for QEA).
(a) (b)
Fig. 2 Four-scale filterbank used. (a) Complete frequency spec-trum of the filterbank. (b) Zoom on the low frequency bandpassfilters.
2.2 Filterbank Design
For computing the AM-FM estimates, we need to iso-
late the AM-FM components from (3) using a multi-
scale filterbank. Here, the basic idea is to isolate dif-
ferent AM-FM components over different frequencies(see [20] for details). Fig. 2 (a) depicts the frequency
support for a dyadic filterbank decomposition.
In Fig. 2, the low pass filter (LPF, with label number
1) has frequency support in [−π/16, π/16] radians for
both the x and y directions. The filters in the highest
frequencies (filters from 2 to 7 in Fig. 2), have a band-width of π/2 for both x and y directions. The band-
width is decreased by a factor of 0.5 for each added
scale. In Fig. 2 (b), we provide a closeup that shows
the low frequency filters.
We define the scales using a collection of bandpass
filters as: (i) LPF (lowpass filter), (ii) VL (very low fre-quencies), (iii) L (low frequencies), (iv) M (medium fre-
quencies) and (v) H (high frequencies) as given in [4].
When the structures are well defined in sizes, the mea-
surements can be related with specific instantaneouswavelengths described in number of pixels [21, 22].
For example, for classifying lung opacities in pneu-moconiosis (to be fully described in subsection 3.2), the
correspondence between opacity size and instantaneous
frequencies using eleven different combinations of scales
(CoS) is shown in Table 1. The pneumoconiosis im-ages that were analyzed in the study have a resolution
of 300dpi. This resolution means that along 0.5mm we
have 6 pixel samples. From the ILO standard [23], the
rounded opacities labeled as p, q and r, are in the sizes
up to 10mm. With the knowledge of the sizes, we canrelate the lengths with the corresponding frequencies.
In Table 2 we summarize these relationships. Based on
the frequency ranges for each rounded opacity type, we
set up the cut-off frequencies of the bandpass filters tofit the opacities in them by each scale. Then, we design
our four-scale filter-bank such that each scale will be
related with the frequency ranges described in Table 2.

4
Fig. 1 Block diagram of the 2D multi-scale AM-FM demodulation. Dominant AM-FM components are selected over different imagescales. The bandpass filter selector (upper left) is used to define the bandpass filters that correspond to each scale. The dominantAM-FM component is selected using the maximum amplitude at every pixel (see lowest block).
Table 1 Combinations of scales used for computing the domi-nant AM-FM feature parameters.
CoS* Scales used CoS* Scales used
1 VL, L, M, H 7 LPF, VL
2 LPF 8 VL, L
3 VL 9 L, M
4 L 10 M, H
5 M 11 H
6 LPF, VL, L, M, H
CoS*: Combination of Scales.
Table 2 Relationship among ILO standard grades for roundedopacities and the size in mm, size in pixels and range in frequency.Relationships are based on a scanning rate of 12 pixels per mm.Frequency range refers to the cut-off frequencies that can be usedto characterize an opacity [21].
Type ofroundedopacities
Range inmm
Range inpixels
Range inlowest fre-quency con-tent
p Up to 1.5 Up to 18 [π/9, π]
q 1.5 - 3 18 - 36 [π/18, π/9]
r 3 - 10 36 - 120 [π/36, π/18]
2.3 Post-processing Methods
The AM-FM estimates produced with the methods de-
scribed in the previous subsections can be improved for
better classification purposes. In this subsection, we de-
scribe first how the AM-FM estimates are encoded ashistograms for a region or image. Second, we present
the morphology processing applied as part of the post-
processing methods.
2.3.1 Histograms processing
For each of the 11 combinations of scales (see Table
1), we create a 96-bin feature vector that contains the
AM-FM histograms. Each AM-FM histogram has the
information of (32-bin each): (i) the IA, (ii) the IF mag-nitude and (iii) the IF angle. Thus, each image produces
11 different feature vectors, each one corresponding to
one of the 11 different CoS.
Since the AM-FM estimates of neighboring pixels
could be affected by noisy estimates, a 9×9 median filter
is applied to the output of the IA and IF estimates (see[4, 5, 12]). Median filtering has the effect of smoothing
AM-FM estimates.
Due to the ambiguity of the instantaneous frequency
vectors (coming from cosϕ(k1, k2) = cos(−ϕ(k1, k2))),
we map the IF estimates to two frequency quadrants:
– Instantaneous frequencies ∂ϕn
∂x (x, y) ≥ 0 and∂ϕn
∂y (x, y) ≥ 0 are kept as they are.
– Instantaneous frequencies ∂ϕn
∂x (x, y) ≥ 0 and∂ϕn
∂y (x, y) < 0 are kept as they are.

5
– Instantaneous frequencies ∂ϕn
∂x (x, y) < 0 and∂ϕn
∂y (x, y) < 0 are mapped to |∂ϕn
∂x (x, y)| and
|∂ϕn
∂y (x, y)|.
– Instantaneous frequencies ∂ϕn
∂x (x, y) < 0 and∂ϕn
∂y (x, y) ≥ 0 are mapped to |∂ϕn
∂x (x, y)| and
−|∂ϕn
∂y (x, y)|.
Then, the IF histograms are computed.For the IF angle, given by
arctan(
∂ϕn
∂y (x, y)/∂ϕn
∂x (x, y))
, we center the histogram
around the maximum value using:
[h] ← histogram (IF angle using l bins) {Where his a column vector.}
H ← [hhh]. {Triplicate version of h.}
i← Location of the maximum value ofh.
h← Hl+i−l/2+1:l+i+l/2.
As last step, all the computed histograms (IA, IF
magnitude and IF angle) are normalized such that the
cumulative sum of each one is equal to 1. Thus, the binswill now correspond to PDF estimates.
2.4 Partial Least Squares Classification
Partial Least Squares (PLS) is a linear regression method
that has been used to create a classifier using the AM-FM features extracted from medical images. The re-
gression problem is given by
y = Xβ + ε, (6)
where y is a n×1 vector of the classification variables, X
is a n×p matrix of the extracted AM-FM features, β is a
p×1 vector of regression weights, and ε is a n×1 vector
of residuals. The least squares solution to estimating βis given by the normal equations β = (XT X)−1(XT y).
In our case, we have much more features than im-
ages (p < n), and AM-FM features in X are highly cor-
related. Thus, XT X will be singular or nearly singular
and a unique solution to the normal equations does notexist. PLS reduces X to a lower dimensional subspace
(k ≪ p). The first step is to factor X as X = TL, where
T is an orthogonal n × k matrix of T -scores and L is
a k × p matrix of factor loadings. The T -scores matrixare used to find a threshold for a classifier [24].
2.5 Morphological segmentation
AM-FM features can also be used for image segmenta-
tion. A simple Bayesian classification scheme based onthe IA and IF magnitude was demonstrated in [7].
The segmented AM-FM regions can be very noisy.
Segmentation region denoising is achieved via the use of
an alternating sequential filter (ASF) [25]. We assume
that the noise in the segmented image is due to small
structural components that do not belong to the abnor-
mal regions. Under this assumption, it can be shown
that the optimal morphological filter will be an ASFdefined by:
M = (((((((IS ◦B) •B) ◦ 2B) • 2B) . . .) ◦ nB) • nB) ,
(7)
where: IS is the binary segmented image, B is the struc-
tural element; nB the result of n dilations of B by itself;
◦ the standard open operation and • the standard close
operation.
The value of n needs to be chosen so that the smaller,
noisy structures are removed, while the larger struc-
tures are preserved. Once the order of the morphologi-cal filter is calculated, the segmented image is denoised
using (7).
3 Applications
We provide a selected list of AM-FM biomedical imag-
ing applications in Table 3. We have a number of med-
ical applications based on energy operators. In one of
the earlier applications in electron microcopy, a simple
Bayesian method using the IA and the IF was used, inconjunction with morphological filtering to provide seg-
mentations of different abnormalities over 26 images [7].
Elshinawy et al. [26] demonstrated the reconstruction
of breast cancer images using AM-FM components.
Boudraa et al. [27] introduced a new cross-energy
operator and used the operator to demonstrate the func-
tional segmentation of dynamic nuclear images. Mara-gos et al. provide an important application in [28], where
AM-FM models are used for improving Doppler ultra-
sound resolution. Vector-valued based AM-FM demod-
ulation is given in [29].
Hilbet-based AM-FM methods were used recently
applied to medical imaging problems such as chest ra-
diographs [21, 22], ultrasound images of carotid artery
[30–32], retinal images [8,33,34], and electron microscopy[7].
AM-FM methods are being applied to different med-
ical applications for not only 2D signals images but alsofor 1D signals. Only in the last two years, there have
been 1D signal applications based on AM-FM meth-
ods [35–38], for the classification of surface electromyo-
graphic signals [30], brain rhythms in electroencephalo-grams [39]. We will not summarize 1D applications. We
do note that the general AM-FM methodology is also
closely related to traditional time-frequency analysis.

6
For 2D medical applications, related work includes
the work by Pattichis [9] where he describes AM-FM
methods and models for biomedical image computing,
image retrieval in ophthalmology [40], tracking [41–43]
and analysis [44, 45].
3.1 Retinal Image Analysis
Diabetic retinopathy (DR) and age-related macular de-
generation (AMD) are two retinal diseases that present
particular characteristics (lesions) on retinal photographs
which can be used in early detection and/or classifica-tion of the disease. DR and AMD affect individuals in
their most productive years of life. Early detection that
leads to prevention of vision loss, alone, will lead to
significant decrease in risk of early vision loss.According to the National Eye Institute, diabetic
retinopathy (DR) is one of the leading causes of blind-
ness among working-age Americans, while macular de-
generation is a leading cause of blindness among older
Americans [57]. It has been shown that regular com-prehensive eye exams and timely treatment can lead
to improved outcomes and reduced loss of vision. How-
ever, to screen the tens of millions at risk for DR would
tax the health-care system beyond capacity. Results ofan automatic DR screening system based on AM-FM
exhibit strong promise in addressing this problem.
Age-related macular degeneration (AMD) is the most
common cause of visual loss in the United States and
is a growing public health problem. One third of Amer-icans will develop AMD in their lifetimes. To detect
AMD, retinal images are graded using the Age-related
Eye Disease Study (AREDS) protocol for human grad-
ing. AM-FM has been used to develop an automatedsystem for characterizing pathological features on these
images.
3.1.1 Diabetic Retinopathy
AM-FM has been used to characterize retinal images
with DR, and to screen out patients with different levelsof the disease. Fig. 3 shows an image of a retina with
DR and one of its IA image.
The types of lesions that need to be detected by the
system are shown in Fig. 4. Agurto et al. [33, 58] pre-
sented the extraction of Amplitude-Modulation Frequency-Modulation (AM-FM) features for classification of DR
images using 376 images from the MESSIDOR database
[59].
These 376 images were processed with AM-FM andwere divided in two groups for training and testing pur-
poses. Table 4 shows the number of images per risk in
each group. The most severe level of DR is grade 3, in
(a)
(b) (c)
Fig. 3 Example of a retinal image with DR. Note the exudatesshown with a white square. (a) Original Retinal Image. (b) In-stantaneous Amplitude using CoS 4. (c) Thresholded Image of(b) showing large IA values. A valid range for the pixels between[15% - 30%] of the maximum value was used for determining thethresholded image.
which 15 or more microaneurysms or 5 or more hem-
orrhages are present. For grade 2, the number of mi-
croaneurysms in the retina is between 5 and 15 and
for grade 1 the retinal images contain between 1 and 5microaneurysms. The grade 0 corresponds to diabetic
patients with no apparent DR in the image. It is im-
portant to mention that the images not only contain
red lesions such as microaneurysms and hemorrhages,but also contain bright lesions such as exudates and
cotton-wool spots.
After all the images were processed with AM-FM,
they were divided in regions of 100x100 pixels avoiding
the optic disc. We calculate as feature vectors the mo-ments in each region: mean, standard deviation, skew-
ness, and kurtosis. Finally, the information per image is
the input for the PLS algorithm were the algorithm is
trained to classify normal images vs abnormal images.The results obtained with this approach show an
area under the ROC curve of 0.84 with best sensitiv-
ity/specificity of 92%/54%. Table III shows the number
of images correctly classified per risk level. On this table
we can see a large percentage of the high-risk patientsare being classified correctly.
3.1.2 Age-Related Macular Degeneration
Barriga et al. [34] have developed a system based on
AM-FM to generate multi-scale features for classify-

7
Table 3 Select list of AM-FM applications in Biomedical Imaging.
Author Filterbank AM-FM Demodula-tion Method
Medical Application
Pattichis et al. 2000 [7] Gabor filterbank Quasi-EigenfunctionApproximation (QEA)
Electron microscopy image segmentation
Maragos et al. 2002 [28] 1-D Gabor filterbank Energy Separation Al-gorithm (ESA)
Doppler ultrasound spectroscopy resolution
Elshinawy et al. 2004[26]
Gabor filterbank QEA and continuous-space demodulation
Demonstrated AM-FM reconstructions ofbreast cancer images
Boudraa et al. 2006
[27]
Cross ΨB energy oper-
ator
Nuclear cardiac sequences for one normal and
four abnormal cases
Alexandratou et al.2006 [29]
Gabor filterbank Vector-valued ESA forcolor images
Ploidy image analysis (cancer).
Murray et al. 2007 [46] Dyadic 3D filterbank(optimal design)
QEA + new AM andFM motion estimation
Motion Estimation for Atherosclerotic Plaquevideos compared against other Phased-basedmethod
Murray et al. 2008 [8],Agurto et al. 2008 [33]and Barriga et al. [34]
Dyadic 2D filterbank New variable spacing,local linear phase (VS-LLP) method
Retinal image analysis.
Pitris et al. 2009 [47–49]
Gabor QEA Optical coherence tomography.
Rodriguez et al. 2002-2006 [50–52]
Dyadic 2D filterbank QEA implementationusing SIMD
Cardiac applications including Wireless Trans-mission.
Gill et al. 2005 [53] 1-D monocomponentAM-FM
Detection and identification of heart sounds.
Ramachandran et al.2001 [54, 55], Pattichiset al. 2002 [56] andMurray et al. 2009 [21,
22]
Polynomial 2D fil-terbank [54–56]and Dyadic 2D fil-terbank (optimal
design) [21, 22]
Hilbert-based AM-FM Analysis of pneumoconiosis X-Ray images.
Nguyen et al. 2008 1-D filters and Kalmanfilters
1-D Hilbert based AM-FM
Analysis of Electroencephalography.
Christodoulou et al.2009 [30, 31] andLoizou et al. 2009 [32]
Dyadic 2D filterbank New VS-LLP method Segmentation and classification in the carotidartery.
Fig. 4 Lesions typical of a DR retinal image. A) MicroaneurysmB) Exudates C) Hemorrahages D) Neovascularization.
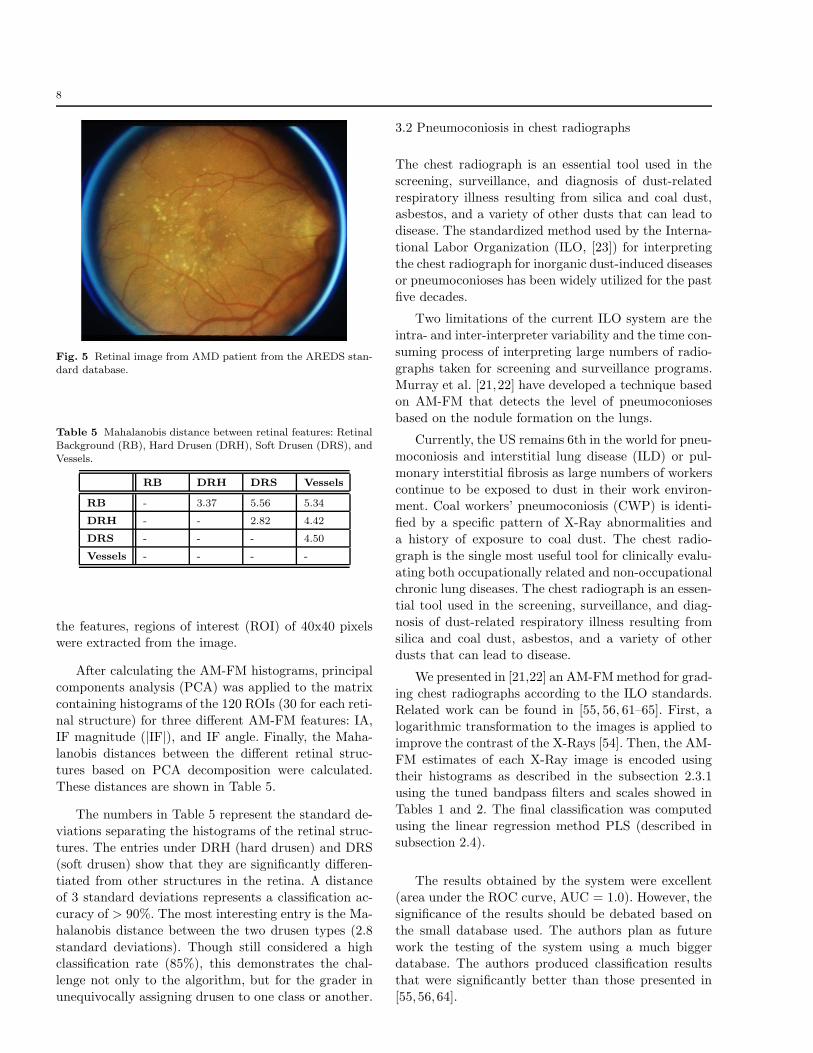
ing pathological structures, such as drusen, on a retinal
image. Drusen are subretinal deposits characteristic of
AMD. Fig. 5 shows an AMD patient with soft and hard
Table 4 Images correctly classified per risk. Risk 0 has no DRwhile Risk 3 images present the most amount of lesions.
Risk Number Percentage(%)
3 68 97
2 32 82
1 8 89
0 38 54
drusen present (white spots on the fundus). The stan-
dard high-resolution AREDS images were downloaded
from the Wisconsin Fundus Photo Reading Center’s
website [60]. A certified ophthalmic technician (reader)selected the retinal features. For these studies, only ar-
eas that contain retinal background, vessels, soft drusen,
and hard drusen were used. After the reader selected
8
Fig. 5 Retinal image from AMD patient from the AREDS stan-dard database.
Table 5 Mahalanobis distance between retinal features: RetinalBackground (RB), Hard Drusen (DRH), Soft Drusen (DRS), andVessels.
RB DRH DRS Vessels
RB - 3.37 5.56 5.34
DRH - - 2.82 4.42
DRS - - - 4.50
Vessels - - - -
the features, regions of interest (ROI) of 40x40 pixelswere extracted from the image.
After calculating the AM-FM histograms, principal
components analysis (PCA) was applied to the matrix
containing histograms of the 120 ROIs (30 for each reti-
nal structure) for three different AM-FM features: IA,IF magnitude (|IF|), and IF angle. Finally, the Maha-
lanobis distances between the different retinal struc-
tures based on PCA decomposition were calculated.
These distances are shown in Table 5.
The numbers in Table 5 represent the standard de-
viations separating the histograms of the retinal struc-
tures. The entries under DRH (hard drusen) and DRS
(soft drusen) show that they are significantly differen-
tiated from other structures in the retina. A distanceof 3 standard deviations represents a classification ac-
curacy of > 90%. The most interesting entry is the Ma-
halanobis distance between the two drusen types (2.8
standard deviations). Though still considered a highclassification rate (85%), this demonstrates the chal-
lenge not only to the algorithm, but for the grader in
unequivocally assigning drusen to one class or another.
3.2 Pneumoconiosis in chest radiographs
The chest radiograph is an essential tool used in the
screening, surveillance, and diagnosis of dust-related
respiratory illness resulting from silica and coal dust,asbestos, and a variety of other dusts that can lead to
disease. The standardized method used by the Interna-
tional Labor Organization (ILO, [23]) for interpreting
the chest radiograph for inorganic dust-induced diseasesor pneumoconioses has been widely utilized for the past
five decades.
Two limitations of the current ILO system are the
intra- and inter-interpreter variability and the time con-
suming process of interpreting large numbers of radio-
graphs taken for screening and surveillance programs.
Murray et al. [21,22] have developed a technique basedon AM-FM that detects the level of pneumoconioses
based on the nodule formation on the lungs.
Currently, the US remains 6th in the world for pneu-
moconiosis and interstitial lung disease (ILD) or pul-
monary interstitial fibrosis as large numbers of workers
continue to be exposed to dust in their work environ-ment. Coal workers’ pneumoconiosis (CWP) is identi-
fied by a specific pattern of X-Ray abnormalities and
a history of exposure to coal dust. The chest radio-
graph is the single most useful tool for clinically evalu-
ating both occupationally related and non-occupationalchronic lung diseases. The chest radiograph is an essen-
tial tool used in the screening, surveillance, and diag-
nosis of dust-related respiratory illness resulting from
silica and coal dust, asbestos, and a variety of otherdusts that can lead to disease.
We presented in [21,22] an AM-FM method for grad-
ing chest radiographs according to the ILO standards.Related work can be found in [55, 56, 61–65]. First, a
logarithmic transformation to the images is applied to
improve the contrast of the X-Rays [54]. Then, the AM-
FM estimates of each X-Ray image is encoded usingtheir histograms as described in the subsection 2.3.1
using the tuned bandpass filters and scales showed in
Tables 1 and 2. The final classification was computed
using the linear regression method PLS (described insubsection 2.4).
The results obtained by the system were excellent(area under the ROC curve, AUC = 1.0). However, the
significance of the results should be debated based on
the small database used. The authors plan as future
work the testing of the system using a much biggerdatabase. The authors produced classification results
that were significantly better than those presented in
[55, 56, 64].

9
3.3 Carotid Artery Ultrasound images
Cardiovascular disease (CVD) is the third leading cause
of death and adult disability in the industrial world
after heart attack and cancer. Of all the deaths causedby CVD among adults aged 20 and older, an estimated
6 millions are attributed to coronary heart disease and
to stroke, with atherosclerosis as the underlying cause
[30–32].
A method based on image analysis of ultrasound im-
ages of carotid plaques that can differentiate between
the stable plaques that tend to remain asymptomaticand the unstable ones that eventually produce symp-
toms has the potential to refine the basis for surgery
and spare some patients from an unnecessary costly op-
eration which itself carries a risk of stroke.
AM-FM methods are being applied for characteriz-
ing and analyzing plaques in ultrasound images.
Christodoulou et al. present in [31] their investigationsfor the AM-FM characterization of carotid plaques in
ultrasound images. In [32], Loizou et al. present how
to use AM-FM features for describing atherosclerotic
plaque features. In what follows, we described the ba-
sics of their approaches.
The extraction of features characterizing efficiently
the structure of ultrasound carotid plaques is important
for the identification of individuals with asymptomaticcarotid stenosis at risk of stroke. Christodoloulou et
al. present how to characterize the carotid plaques us-
ing AM-FM features in [31]. They use as basic descrip-
tors the information about the AM-FM estimates sim-ilar as in the subsection 2.3.1: the IA, IF magnitude
and IF angle histograms. In addition to the AM-FM
features, the authors compute Spatial Gray Level De-
pendence Matrices (SGLDM) computing the following
texture measures: (i) angular second moment, (ii) con-trast, (iii) correlation, (iv) sum of squares: variance, (v)
inverse difference moment, (vi) sum average, (vii) sum
variance, (viii) sum entropy, (ix) entropy, (x) difference
variance, (xi) difference entropy and (xii) informationmeasures of correlation. Also, the Gray Level Difference
Statistics (GLDS) are computed: (i) contrast, (ii) an-
gular second moment, (iii) entropy and (iv) mean. The
final step applied by the authors corresponds to the
statistical k-nearest neighbor (KNN) classifier imple-mented for different values of k (k = 1, 3, 5, 7, 9, 11, 13).
The authors applied their method to a database of 274
carotid plaque ultrasound images divided as 137 symp-
tomatic and 137 asymptomatic.Using the AM-FM estimates, the authors got a classi-
fication success up to 71.5% when the three AM-FM
estimates and k = 5 were used. This result was better
than using the textures features SGLDM and GLDS
when they got 68.2% of succeed.
Loizou et al. present in [32] an AM-FM analysis as
an application for investigating the intima media com-
plex (IMC), media layer (ML) and intima layer (IL)of the common carotid artery (CCA). This study rep-
resents the first study for the IMC, IL and ML. Clin-
ically, the intima-media thickness (IMT) is used as a
validated measure for the assessment of atherosclerosis,that causes enlargement of the arteries and thickening
of the artery walls. The authors use the same AM-FM
histograms as in subsection 2.3.1 but computed using
only horizontal-oriented bandpass filters. Thus, the au-
thors use similar scales like those described in Table 1but using only the filters numbered as (see Fig. 2a): 1
(LPF), 2, 5 (in the H scale), 8, 11 (in the M scale) and
14 and 17 (in the L scale). The reason for the selec-
tion of these horizontal-oriented filters is related withthe horizontally elongated nature of the atherosclerotic
structures. As the last step for the statistical analysis,
the authors use the Mann-Whitney rank sum test in or-
der to identify is there are significant differences (SD)
or not (NS) between the extracted AM-FM features.The authors use p < 0.05 for significant differences and
comparison between different age groups.
Their study, performed on 100 ultrasound images, re-
veals that the IA of the media layer decreases withage. The authors state that the decreasing of the IA
is maybe related to the reduction in calcified, stable
plaque components and an increase in stroke risk with
age. In terms of the IF, the median of this AM-FM
estimate of the media layer increases suggesting frag-mentation of solid, large plaque components that also
increases the risk of stroke.
4 Conclusions and Future Work
This paper has shown the advances in the application
of AM-FM to medical imaging. Its ability to represent
different frequencies is highly valuable when analyz-
ing structures with spatial and spectral variability. Inretinal images, structures such as drusen and microa-
neurysms have a well-defined shape that gets captured
by the higher-frequency scale AM-FM filters, while ves-
sels and hemorrhages are better represented in the lower
frequencies. In chest radiographs, nodules can also bewell represented using the AM-FM features. The combi-
nation of feature extraction and classification using PLS
has produced robust systems for the analysis of chest
radiographs, where an automatic grading system forpneumoconiosis has been demonstrated on a limited-
size database. For diabetic retinopathy, a screening sys-
tem has been developed and it is currently being tested

10
on an extensive database for FDA approval.
Future work on AM-FM will be concentrated on devel-
oping new scales (compared with the four-scale filter-
bank showed in Fig. 2) for representation of lower fre-
quencies. Also, a filter design that includes a constraintof the number of coefficients (length in space) will be
applied. This approach will have the advantage of not
including extra information of lesion shapes when the
filters are applied.
References
1. M. Unser, A. Aldroubi, and A. Laine, “Guest editorial:Wavelets in medical imaging,” IEEE Trans. Med. Imag.,vol. 22, no. 3, pp. 285–288, March 2003.
2. A. Osareh and B. Shadgar, “Retinal vessel extrac-tion using gabor filters and support vector machines,”Communications in Computer and Information Science,vol. 6, pp. 356–363, November 2009. [Online]. Available:http://www.springerlink.com/content/m38744668m814665
3. J. P. Havlicek, “AM-FM image models,” Ph.D. dissertation,The University of Texas at Austin, 1996.
4. Victor Manuel Murray Herrera, “AM-FM methods for imageand video processing,” Ph.D. dissertation, University of NewMexico, 2008.
5. V. Murray, P. Rodriguez, and M. S. Pattichis, “Multi-scaleAM-FM demodulation and reconstruction methods with im-proved accuracy,” accepted, IEEE Transactions on Image
Processing, 2009.6. M. S. Pattichis and A. C. Bovik, “Analyzing image structure
by multidimensional frequency modulation,” IEEE Transac-
tions on Pattern Analysis and Machine Intelligence, vol. 29,no. 5, pp. 753–766, 2007.
7. M. Pattichis, C. Pattichis, M. Avraam, A. Bovik, and K. Kyr-iacou, “AM-FM texture segmentation in electron microscopicmuscle imaging,” IEEE Trans. Med. Imag., vol. 19, no. 12,pp. 1253–1257, Dec. 2000.
8. V. Murray, M. Pattichis, and P. Soliz, “New AM-FM analy-sis methods for retinal image characterization,” in Asilomar
Conference on Signals, Systems and Computers, 2008.9. M. Pattichis, “Multidimensional AM-FM models and meth-
ods for biomedical image computing,” in the 34th IEEE
Annual International Conference of the Engineering in
Medicine and Biology Society, September 2009.10. V. Murray and M. S. Pattichis, “AM-FM demodulation
methods for reconstruction, analysis and motion estimationin video signals,” in IEEE Southwest Symposium on Image
Analysis and Interpretation, vol. 0. Los Alamitos, CA, USA:IEEE Computer Society, 2008, pp. 17–20.
11. D. J. Fleet and A. D. Jepson, “Computation of componentimage velocity from local phase information,” Int. J. Com-
put. Vision, vol. 5, no. 1, pp. 77–104, 1990.12. J. Havlicek, P. Tay, and A. Bovik, Handbook of Image and
Video Processing. Elsevier Academic Press, 2005, ch. AM-FM Image Models: Fundamental Techniques and EmergingTrends, pp. 377–395.
13. M. Pattichis and A. Bovik, “AM-FM expansions for images,”in Proc. European Signal Processing Conference, September1996.
14. M. Pattichis, A. Bovik, J. Havlicek, and N. Sidiropoulos,“Multidimensional orthogonal fm transforms,” IEEE Trans-
actions on Image Processing, vol. 10, no. 3, pp. 448–464, Mar2001.
15. M. Pattichis, G. Panayi, A. Bovik, and H. Shun-Pin, “Finger-print Classification using an AM-FM model,” IEEE Transac-
tions on Image Processing, vol. 10, no. 6, pp. 951–954, June
2001.16. J. Ramachandran, “Image analysis of wood core using in-
stantaneous wavelength and frequency modulation,” Ph.D.dissertation, University of New Mexico, 2008.
17. P. Maragos, J. F. Kaiser, and T. F. Quatieri, “On amplitudeand frequency demodulation using energy operators,” IEEE
Transactions on Signal Processing, vol. 41, no. 4, pp. 1532–1550, April 1993.
18. ——, “Energy separation in signal modulations with appli-cations to speech analysis,” IEEE Transactions on Signal
Processing, vol. 41, no. 10, pp. 3024–3051, October 1993.19. P. Maragos and A. C. Bovik, “Image demodulation using
multidimensional energy separation,” J. Opt. Soc. Am. A,vol. 12, no. 9, pp. 1867–1876, 1995. [Online]. Available:http://josaa.osa.org/abstract.cfm?URI=josaa-12-9-1867
20. V. Murray, P. Rodriguez V., and M. S. Pattichis, “Robustmultiscale AM-FM demodulation of digital images,” in IEEE
International Conference on Image Processing, vol. 1, Octo-ber 2007, pp. 465–468.
21. V. Murray, M. S. Pattichis, H. Davis, E. S. Barriga, andP. Soliz, “Multiscale AM-FM analysis of pneumoconiosis x-ray images,” in IEEE International Conference on Image
Processing, November 2009.22. V. Murray, M. S. Pattichis, and P. Soliz, “Retrieval of X-Ray
images with different grades of opacities using multiscale am-fm methods,” in Asilomar Conference on Signals, Systems
and Computers, 2009.23. International Labour Office, Guidelines for the use of ILO
International Classification of Radiographs of Pneumoco-
nioses, Geneva, Switzerland, 1980.24. M. Barker and W. Rayens, “Partial least squares for dis-
crimination,” Journal of Chemometrics, vol. 17, no. 3, pp.166–173, 2003.
25. D. Schonfeld and J. Goutsias, “Optimal morphological pat-tern restoration from noisy binary images,” IEEE Trans.
Pattern Anal. Mach. Intell., vol. 13, no. 1, pp. 14–29, Jan.1991.
26. M. Y. Elshinawy, J. Zeng, S.-C. B. Lo, and M. F. Chouikha,“Breast cancer detection in mammogram with am-fm mod-eling and gabor filtering,” in Proc. 7th International Confer-
ence on Signal Processing, vol. 3, Aug. 31–Sep. 4, 2004, pp.2564–2567.
27. A.-O. Boudraa, J.-C. Cexus, and H. Zaidi, “Functional
segmentation of dynamic nuclear images by cross-ψb-energy operator,” Computer Methods and Programs in
Biomedicine, vol. 84, no. 2-3, pp. 146 – 152, 2006,medical Image Segmentation Special Issue. [Online]. Avail-able: http://www.sciencedirect.com/science/article/B6T5J-4M3J0J4-2/2/8de0269291691256943ff4a2409b5588
28. P. Maragos, T. Loupas, and V. Pitsikalis, “Improving dopplerultrasound spectroscopy with multiband instantaneous en-ergy separation,” in Proc. 14th International Conference on
Digital Signal Processing, vol. 2, Jul. 1–3, 2002, pp. 611–614.29. E. Alexandratou, A. Sofou, H. Papasaika, P. Maragos,
D. Yova, and N. Kavantzas, “Computer vision algorithms inDNA ploidy image analysis,” in Proc. of the SPIE Imaging,
Manipulation, and Analysis of Biomolecules, Celss, and
Tissues, ser. IV, D. L. Farkas, D. V. Nicolau, and R. C. Leif,Eds., vol. 6088, no. 1. SPIE, 2006, pp. 180–190. [Online].Available: http://link.aip.org/link/?PSI/6088/60880O/1
30. C. Christodoulou, P. Kaplanis, V. Murray, M. Pattichis, andC. Pattichis, “Classification of surface electromyographic sig-nals using AM-FM features,” in 19th International Confer-
ence on Artificial Neural Networks, Limassol, Cyprus, 2009.

11
31. C. I. Christodoulou, C. Pattichis, V. Murray, M. Pat-tichis, and A. Nicolaides, “AM-FM representations forthe characterization of carotid plaque ultrasound im-
ages,” in 4th European Conference of the Interna-
tional Federation for Medical and Biological Engineer-
ing, vol. 22, 2009, pp. 546–549. [Online]. Available:http://www.springerlink.com/content/m75t710245211858
32. C. P. Loizou, V. Murray, M. S. Pattichis, C. S. Christodoulou,M. Pantziaris, A. Nicolaides, and C. S. Pattichis, “AM-FMtexture image analysis of the intima and media layers of thecarotid artery,” in 19th International Conference on Artifi-
cial Neural Networks, Limassol, Cyprus, September 2009.33. C. Agurto, S. Murillo, V. Murray, M. Pattichis, S. Russell,
M. Abramoff, and P. Soliz, “Detection and phenotyping ofretinal disease using AM-FM processing for feature extrac-tion,” in Asilomar Conference on Signals, Systems and Com-
puters, 26–29 Oct. 2008, pp. 659–663.34. E. Barriga, V. Murray, C. Agurto, M. Pattichis, S. Russell,
M. Abramoff, H. Davis, and P. Soliz, “Multi-scale AM-FM forlesion phenotyping on age-related macular degeneration,” inIEEE International Symposium on Computer-Based Medical
Systems, Albuquerque, New Mexico, August 2009.35. T. Ezzat, J. Bouvrie, and T. Poggio, “AM-FM demodulation
of spectrograms using localized 2d max-gabor analysis,” inProc. IEEE International Conference on Acoustics, Speech
and Signal Processing ICASSP 2007, vol. 4, 2007, pp. IV–1061–IV–1064.
36. F. Gianfelici, C. Turchetti, and P. Crippa, “MulticomponentAM-FM demodulation: The state of the art after the devel-opment of the iterated hilbert transform,” in IEEE Interna-
tional Conference on Signal Processing and Communications
ICSPC 2007, 2007, pp. 1471–1474.37. N. Wang, E. Ambikairajah, B. Celler, and N. Lovell, “Fea-
ture extraction using an AM-FM model for gait pattern clas-sification,” in Proc. IEEE Biomedical Circuits and Systems
Conference BioCAS 2008, 2008, pp. 25–28.38. H. Li, L. Fu, and Z. Li, “Fault detection and diagnosis of
gear wear based on teager-huang transform,” in Proc. In-
ternational Joint Conference on Artificial Intelligence JCAI
’09, 2009, pp. 663–666.39. D. P. Nguyen, R. Barbieri, M. A. Wilson, and E. N. Brown,
“Instantaneous frequency and amplitude modulation of EEGin the hippocampus reveals state dependent temporal struc-ture,” in Proc. 30th Annual International Conference of the
IEEE Engineering in Medicine and Biology Society EMBS
2008, 2008, pp. 1711–1715.40. S. Acton, P. Soliz, S. Russell, and M. Pattichis, “Content
based image retrieval: The foundation for future case-basedand evidence-based ophthalmology,” in Proc. IEEE Interna-
tional Conference on Multimedia and Expo, 2008, pp. 541–544.
41. R. Prakash and R. Aravind, “Modulation-domain particle fil-ter for template tracking,” in Proc. 19th International Con-
ference on Pattern Recognition ICPR 2008, 2008, pp. 1–4.42. R. Senthil Prakash and R. Aravind, “Invariance properties of
AM-FM image features with application to template track-ing,” in Proc. Sixth Indian Conference on Computer Vision,
Graphics & Image Processing ICVGIP ’08, 2008, pp. 614–620.
43. N. Mould, C. Nguyen, and J. Havlicek, “Infrared targettracking with AM-FM consistency checks,” in Proc. IEEE
Southwest Symposium on Image Analysis and Interpretation
SSIAI 2008, 2008, pp. 5–8.44. I. Kokkinos, G. Evangelopoulos, and P. Maragos, “Texture
analysis and segmentation using modulation features, gen-erative models, and weighted curve evolution,” IEEE Trans.
Pattern Anal. Mach. Intell., vol. 31, no. 1, pp. 142–157, 2009.
45. P. Tay, “AM-FM image analysis using the hilbert huangtransform,” in Proc. IEEE Southwest Symposium on Image
Analysis and Interpretation SSIAI 2008, 2008, pp. 13–16.46. V. Murray, S. E. Murillo, M. S. Pattichis, C. P. Loizou,
C. S. Pattichis, E. Kyriacou, and A. Nicolaides, “An AM-FM model for motion estimation in atherosclerotic plaquevideos,” in 41st Asilomar Conference on Signals, Systems
and Computers, Nov. 4–7, 2007, pp. 746–750.47. C. Pitris, A. Kartakoullis, and E. Bousi, “AM-FM techniques
in the analysis of optical coherence tomography signals,”Journal of Biophotonics, vol. 2, no. 6-7, pp. 364–369, 2009.
48. A. Kartakoulis, E. Bousi, and C. Pitris, “AM-FManalysis of optical coherence tomography signals,” inOptical Coherence Tomography and Coherence Domain
Optical Methods in Biomedicine XIII, J. G. Fujimoto,J. A. Izatt, and V. V. Tuchin, Eds., vol. 7168,no. 1. SPIE, 2009, p. 71681M. [Online]. Available:http://link.aip.org/link/?PSI/7168/71681M/1
49. A. Kartakoullis, E. Bousi, and C. Pitris, “AM-FMtechniques in optical coherence tomography,” in Optical
Coherence Tomography and Coherence Techniques IV,P. E. Andersen and B. E. Bouma, Eds., vol. 7372,no. 1. SPIE, 2009, p. 73720U. [Online]. Available:http://link.aip.org/link/?PSI/7372/73720U/1
50. P. Rodriguez V. and M. S. Pattichis, “Nested random phase
sequence sets: a link between AM-FM demodulation and in-creasing operators with application to cardiac image anal-ysis,” in Proc. 6th IEEE Southwest Symposium on Image
Analysis and Interpretation, Mar. 28–30, 2004, pp. 196–200.51. ——, “Real time AM-FM analysis of ultrasound video,” in
45th Midwest Symposium on Circuits and Systems, vol. 1,Aug. 4–7, 2002, pp. I–216–19.
52. P. Rodriguez V., M. Pattichis, M. Goens, and R. Abdal-lah, M-Health: Emerging Mobile Health Systems. SpringerUS, 2006, ch. Object-Based Ultrasound Video Processing forWireless Transmission in Cardiology, pp. 491–507.
53. D. Gill, N. Gavrieli, and N. Intrator, “Detection and identi-fication of heart sounds using homomorphic envelogram andself-organizing probabilistic model,” in Proc. Computers in
Cardiology, Sep. 25–28, 2005, pp. 957–960.54. M. Pattichis, J. Ramachandran, M. Wilson, C. Pattichis, and
P. Soliz, “Optimal scanning, display, and segmentation of theinternational labor organization (ILO) X-ray images set forpneumoconiosis,” in IEEE Symposium on Computer-Based
Medical Systems, 2001, pp. 511–515.55. P. Soliz, M. S. Pattichis, J. Ramachandran, and D. S. James,
“Computer-assisted diagnosis of chest radiographs for pneu-moconioses,” M. Sonka and K. M. Hanson, Eds., vol. 4322,no. 1. SPIE, 2001, pp. 667–675.
56. M. Pattichis, C. Pattichis, C. Christodoulou, D. James,L. Ketai, and P. Soliz, “A screening system for the assess-ment of opacity profusion in chest radiographs of miners withpneumoconiosis,” in IEEE Southwest Symposium on Image
Analysis and Interpretation, 7-9 April 2002, pp. 130–133.57. D. C. Klonoff and D. M. Schwartz, “An economic
analysis of interventions for diabetes.” Diabetes care,vol. 23, pp. 390–404, Mar. 2000. [Online]. Available:http://www.hubmed.org/display.cgi?uids=10868871
58. C. Agurto, M. Pattichis, S. Murillo, V. Murray, M. Abramoff,S. Russell, E. Barriga, H. Davis, and P. Soliz, “Detection ofstructures in the retina using am-fm for diabetic retinopa-thy classification,” in 2009 Meeting of the Association for
Research in Vision and Ophthalmology, May 2009.59. TECHNO-VISION Project, “MESSIDOR: methods to
evaluate segmentation and indexing techniques in thefield of retinal ophthalmology.” [Online]. Available:http://messidor.crihan.fr/

12
60. AREDS, “Areds database.” [Online]. Avail-able: http://eyephoto.ophth.wisc.edu/ResearchAreas/AREDS/AREDSstdPhotoIndex.htm
61. H. Kondo and T. Kouda, “Detection of pneumoconiosisrounded opacities using neural network,” in Joint 9th IFSA
World Congress and 20th NAFIPS International Confer-
ence, vol. 3, 25-28 July 2001, pp. 1581–1585.62. ——, “Computer-aided diagnosis for pneumoconiosis using
neural network,” in IEEE Symposium on Computer-Based
Medical Systems, 26-27 July 2001, pp. 467–472.63. M. Pattichis, T. Cacoullos, and P. Soliz, “New models for
region of interest reader classification analysis in chest ra-diographs,” Pattern Recognition, vol. 42, no. 6, pp. 1058 –1066, 2009, digital Image Processing and Pattern Recogni-tion Techniques for the Detection of Cancer.
64. M. Pattichis, H. Muralldharan, C. Pattichis, and P. Soliz,“New image processing models for opacity image analysis inchest radiographs,” in IEEE Southwest Symposium on Image
Analysis and Interpretation, 7-9 April 2002, pp. 260–264.65. B. Van Ginneken, B. M. Ter Haar Romeny, and M. Viergever,
“Computer-aided diagnosis in chest radiography: a survey,”IEEE Transactions on Medical Imaging, vol. 20, no. 12, pp.1228–1241, December 2001.