Analysis of Total Microcystins versus Chlorophyll a from ...

FINAL REPORT Title: “A Survey of 50 NH Lakes for Microcystins (MCs)” Project Duration: September 1. 1998 - November 30, 2000 Principal Investigators: James F. Haney and Miyoshi Ikawa Department of Zoology and Center for Freshwater Biology Spaulding Life Science Building
University of New Hampshire, Durham, NH 03824
INTRODUCTION
Autotrophic microorganisms are the primary producers that comprise the basis of the food chain and energy budget in aquatic ecosystems. They utilize dissolved nutrients and photosynthesize new organic materials that support animal life at higher trophic levels. As nutrient levels and phytoplankton biomass increase with eutrophication, the dominant organisms may shift from eukaryotic protistan species to prokaryotic cyanobacteria, a.k.a. blue-green algae. The relationship between advanced eutrophication of freshwater ecosystems and the dominance of summer blooms of cyanobacteria has been demonstrated. Ordinarily, the primary productivity by algae is efficiently consumed and transformed into useable energy by primary consumers (i.e., zooplankton). The latter thrive, reproduce and provide food for higher trophic levels, e.g., larval fishes. Under optimal conditions, the water exhibits low turbidity, maintains suitable fish populations and generally has higher water quality for multiple uses. Cyanobacterial blooms are often associated with secondary metabolites, or biotoxins, which harm animals and compromise the safe use of water for drinking or recreational purposes (Watanabe, et al., 1996; Chorus and Bartram, 1999). Toxic cyanobacteria blooms have been reported from at least 32 countries, including 16 in Europe, 5 Canadian Provinces and 27 of the United States. Biotoxins cause mortality of vertebrate animals (Carmichael, 1992, 1995) and may impact various planktonic, pelagic and benthic components of aquatic communities (Kotak, et al 1995). Dominant cosmopolitan cyanobacterial species may be sources of several types of neurotoxins and a family of liver toxins. The fast acting neurotoxins are (a) alkaloids called saxitoxins, or aphantoxins, which block sodium channels in nerve and muscle membranes (Adelman, et al., 1982; Sasner et al., 1984; Carmichael, 1995), (b) fast acting secondary amines called anatoxin-a, which depolarize postsynaptic nicotinic and muscarinic acetylcholine receptors, and (c) organic phosphates, called anatoxin-a(s), which inhibit acetlycholinesterase activity and enhance the effects of the transmitter acetylcholine (Carmichael, 1995; Watanabe, et al , 1996). Species that produce neurotoxins (Aphanizomenon and Anabaena) occur intermittently in New Hampshire, Vermont, and worldwide and cause infrequent problems. On the other hand, the slower-acting

hepatotoxins, called microcystins (MCs), produced by Microcystis aeruginosa, are particularly noteworthy and recognized as potent offenders around the world and commonly occur in New Hampshire lakes. MCs comprise a family of slow acting, cyclic, heptapeptides that cause internal bleeding in hepatic tissues (Foxall and Sasner, 1982: Falconer, et al., 1991. The World Health Organization (WHO) in 1998 recommended safety guidelines of 1.0 µg MC L-1 (1.0 ppb) for drinking water (Chorus and Bartram, 1999). Microcystis aeruginosa, the most common producer of MCs, has been implicated in the poisoning of cattle, sheep, waterfowl, dogs, and trout (Galey, et al., 1987, Kotak, et al., 2001). The reported LD50 for MCs in mammals is 50 mg Kg-1 body weight (Carmichael, 1992). MCs have also been related to the mortality of sea-pen-reared Atlantic salmon, the anomaly called net-pen liver disease (NLD), in the northwest US and Canada (Anderson, et al, 1993) and the mass mortality of catfish in aquaculture ponds in the southeastern U.S. (Zimba, et al., 2001). MCs were also isolated from marine bivalves from the Western Pacific, the Canadian Maritimes and European waters (Chen, et al., 1993) although it is more commonly found in freshwater ecosystems. At the cellular level MCs inhibit protein phosphatase (PP1 and PP2a) activity (Yoshizawa, et al, 1990; Honkanen, et al, 1991) and promote tumor growth (Falconer, 1991). The impact of human exposure to Microcystis is noted in health reports from water supplies in Australia (Falconer, et al., 1993), from Harare, Zimbabwe, where blooms have been linked to seasonal outbreaks of gastroenteritis in children (Zilberg, 1986), and Brazil, where deaths occurred in numerous hemodialysis patients (Jochimsen, et al., 1998). In the 1980s, toxic cyanobacterial blooms in New Hampshire were reported, intermittently, in at least 30 lakes, ponds and reservoirs, some with environmental, legal, and health-related implications. On two occasions, NH Public Health officials reported approximately 100 people with gastroenteritis and flu-like symptoms that occurred after contact with lake water at NH State Parks in which Microcystis blooms dominated the phytoplankton. Few studies have examined levels of MCs in lake compartments, since they are considered to be intracellular toxins that are released, sporadically, into the surrounding water when cells lyse. We have measured MC levels in Silver Lake, Hollis, NH and found significant concentrations in Microcystis cells (2500 µg MC g
-1 dry wt), zooplankton (60 µg MC g
-1
dry wt), benthic bivalves (7 µg MC g-1
dry wt.) and dissolved in lake water filtrates (0.4 - 20 µg MC L
-1) Capron, 1995, Nye, 1997). The latter result attracted our attention, since it
exceeds the guideline of 1 µg L-1
suggested for safe exposure for recreation and drinking. Most field studies of cyanobacteria toxins have examined nutrient-rich lakes with
conspicuous surface blooms, with the assumption that biotoxin problems are confined to conditions of excessive phytoplankton growth and are directly linked to eutrophication. There are several lines of evidence that suggest this is not always the case, and should be tested. For example, Prepas et al (1997) used freshwater mussels as biomagnifiers of MC and demonstrated the presence of MCs in oligotrophic lakes in Canada. In addition, not all cyanobacteria species require high nutrient levels. For example, Microcystis aeruginosa, an important producer of MCs, is present in most of the lakes in New
Hampshire, and is the dominant phytoplankton in the meso-eutrophic Silver Lake as well as in Russell Pond, an ultra-oligotrophic lake. We have detected significant quantities of MCs in >30 NH lakes with varied trophic conditions. There is little known about the incidence of MCs in NH lakes, their effects on aquatic organisms, or how the toxins may be transferred or accumulated, although it appears that aquatic invertebrates pass these toxins through the food web by their grazing activities (Kotak et al. 1996). The presence of biotoxins, like MC, even in dilute systems may be problematic both as direct health threats to vertebrate animals, and as harmful secondary metabolites that may alter lake ecosystems. The recent development of MC ELISA methods increased assay sensitivity by three orders of magnitude. This increased sensitivity allows detection of MCs in lake water, phyto- and zooplankton components from a broader trophic range of lakes than was possible previously.
The project objective tests the hypothesis that proposes a direct relationship
between nutrient concentrations, chlorophyll a and the presence of microcystins (MCs) in lakes. More specifically, we tested whether widely used eutrophication models describing a log-log relationship between the concentration of chlorophyll-a and total phosphorus (TP) concentration were also valid to predict the concentration of MCs in lakes. Statistically, the null hypothesis is that there is no difference in the slope of the linear regression between total phosphorous (TP) vs. chlorophyll a (Chl a), and TP vs. MC concentrations. A second objective aims to identify other variables that contribute to the MC toxicity found in the lakes, such as N: P ratio, species composition of the phytoplankton and zooplankton, lake basin characteristics, watershed features, and geographic region. The N: P ratio may influence the composition of the phytoplankton, as N-fixing cyanobacteria may be favored at low N: P ratios. Microcystis, one of the important producers of MCs, is not, however, considered to be effective at N-fixation in oxygenated waters since it lacks heterocysts. The wide range of lake basins and trophic conditions in the lakes of New Hampshire (Figure 1) offer an exceptional opportunity to test these hypotheses dealing with the nutrient control of biotoxins. To provide a representative data set for testing these hypotheses and constructing models, we selected 50 lakes from the databases of the UNH-Lakes Lay Monitoring Program (LLMP) and the NH Division of Environmental Services. These represent a broad range of lake basins, trophic conditions and watersheds characteristics. Study lakes represent the major regions in New Hampshire i.e., Northern Forest, White Mountains, Coastal Plain, and Southern In-land (urban and suburban) regions.
MATERIALS and METHODS Study Sites We selected study lakes from across New Hampshire to represent a range of trophic conditions and lake morphometry (Table 1-3). Field sampling was performed during the spring-summer seasons in 1999 and 2000.
Multiparameter Profiles and Light Measurements Deep sites in each lake were located using a Humminbird 200DX sonar depth finder. A multi-parameter water quality probe (YSI-6600 Multiprobe), equipped with an YSI-610DM data logger, was used to take a single profile of the water column in each lake. The probe was lowered at a rate of approximately 0.5 m min-1 with the data logger recording eight parameters at 5 s intervals. The physical and chemical, parameters included depth (pressure), temperature, dissolved oxygen as concentration (DO), and percent saturation (% Sat), pH, oxidation-reduction potential (ORP), specific conductivity (corrected to 25o C), chlorophyll a (chl a), and turbidity. Maximum depth of the epilimnion was noted during the profiling. Light profiles were taken with a LICOR LI-1000 data logger equipped with a deck cell and an underwater 2π quantum photo sensor, designed to measure photosynthetically active radiation (PAR) at 400-700 nm. To compensate for immersion effects, separate air and underwater sensor calibration factors were used. The deck cell readings were used to correct for changes in the ambient light reaching the water’s surface. Three replicate profiles were done by lowering the photo sensor through the water column on the sunny side of the boat and readings were recorded on the data logger at every 0.5 m interval until the light level was less than 0.1 µmol photons m-2 s-1, or the sensor reached the lake bottom. Linear regressions of depth (m) versus ln light intensity were used to estimate the extinction coefficient (kext) for each lake. Water transparency was measured using a standard black-and-white Secchi disk (20 cm diam.) that was lowered into the water on the sunny side of the boat. A PVC view scope was used to eliminate effects from glare, wind, and wave action. The average of three readings depth (m) at which the Secchi disk disappeared from view was recorded as the Secchi disk depth (SDD). Integrated Water Sampling and Analysis by the NH-LLMP Integrated epilimnetic water samples were collected for the analyses of chlorophyll a (chl a), dissolved color, nitrate nitrogen (NN), total phosphorus (TP), total nitrogen (TN), acid-neutralizing capacity or alkalinity (ANC), and whole lake water (WLW) MC. One to several integrated epilimnetic water samples were collected and pooled to provide a 2 L composite reservoir of epilimnetic water for several analyses described below. To collect each integrated water sample, a weighted Tygon tube (2 cm O.D.) was lowered to the bottom of the epilimnion and clamped-off at the upper end to seal the water within the tube. The bottom end of the tube was retrieved using an attached line, the contents emptied into a 2-L plastic bottle, and stored on ice. The composite integrated epilimnetic samples were thoroughly mixed before being sub sampled for analysis of the components listed above. Collection of integrated water and sample preparation for chemical analyses are depicted in Figure 2. Chemical analyses for chl a, dissolved color, NN, TP, and TN were performed by the Center for Freshwater Biology Analytical Laboratory at the University of New Hampshire following protocols listed in a generic limnological quality assurance project plan reviewed and on file with EPA New England (Region 1). Except where noted, standard methods (APHA 1998, EPA 1983) were employed. Chlorophyll a

An integrated water sample (500 ml) was vacuum-filtered through a 0.45 µm cellulose membrane filter (Millipore Corp.) and the filters immediately stored in a darkened, portable desiccator before extraction for chl a. The filters were dissolved and the sample ground manually in a glass-to-glass tissue grinder (Kontes) containing acetone (15 ml of 95%) with MgCO3 buffer (1%, vol/vol). The sample was mixed and stored (4° C; in dark; 4 h) to allow for chl a extraction. The sample was centrifuged (500 x g, 20 min.), the supernatant transferred to a near-UV cuvette (5 cm path length) and read at 663 and 750 nm using a Spectronic 1001+ spectrophotometer (Thermo Spectronic, Rochester NY) with a 2 nm bandwidth. Chl a concentrations were determined using the monochromatic chlorophyll equation (APHA method 10200H.2.b). A chl a absorption coefficient of 11.9 was used in the calculations based on research from Vollenweider (1969). Dissolved Color
Fifty ml of filtrate of the composite, integrated water sample was transferred to a 60 ml high-density polyethylene (HDPE) bottle and stored on ice in the field then refrigerated in the laboratory. Samples were analyzed in quartz cuvettes in a Spectronic 1001+ spectrophotometer (2 nm bandwidth, 5 cm path length) at wavelengths of 390 nm, 440 nm, 750 nm and 880 nm (Thermo Spectronic, Rochester NY). Dissolved color in choroplatinate units (CPU) was calculated using a multiplication factor of 859 and the absorbance at 440 nm. The 750 nm measurement acts as a check for turbidity in the sample to insure that it was filtered correctly. The value of 859 was a color absorbance coefficient derived from a standard curve from fresh chloroplatinate standards (APHA 1998). The absorbencies at 750 nm and 880 nm were used to determine if there was significant particulate matter, or contamination, in the samples. The 390 nm measurement is used in other studies to determine a slope derivative for possible organic matter type identification. Nitrate Nitrogen (NN)
Fifty ml of filtrate (0.45 µm) from the composite, integrated water sample was transferred to an acid-washed HDPE bottle (60-ml) and stored on ice in the field, and frozen (–40° C) in the laboratory before NN analysis. Samples were thawed and filtered again through Whatman 0.7 um 47 mm GF/F syringe filters. Sub samples (30 ml) were acidified (0.6 ml of 36 N H2SO4) and analyzed in quartz cuvettes in a Varian Cary 50 scanning spectrophotometer (5 cm path length). Samples were scanned at wavelengths between 190-250 nm and NN concentrations calculated from a standard curve using the sample’s 2nd derivative peak between 226-229 nm following the methods of Crumpton et al, (1992) and Bachmann and Canfield, (1996). Total Phosphorus (TP) and Total Nitrogen (TN)
Composite integrated epilimnetic water samples were placed in acid-washed, 500 ml HDPE bottles, stored on ice in the field, and frozen (–40° C) in the laboratory before analysis for total phosphorus (TP) and total nitrogen (TN). After thawing, H2SO4 (2 ml of 36 N) was added to the sample bottle to prevent any biological activity. The procedure for TP analysis followed Standard Method 4500-PB.3-E. Sub samples (50 ml) were acid

digested (1 ml of 11 N H2SO4 + 0.5 g of ammonium peroxydisulfate), autoclaved at 121° C for 0.5 h, pH neutralized with 10 N NaOH, and then reacted with a mixture of ammonium molybdate, ascorbic acid, and potassium antimonyl tartrate (together the color complex). Absorbance at 660 nm was measured in near-UV cuvettes (5 cm path length) in a Varian Cary 50 spectrophotometer and TP concentrations interpolated from a standard curve derived from a serial dilution of a phosphate standard. For TN analysis, sub samples (30 ml) were acid treated with a basic (2.0 N NaOH) potassium persulfate solution (4.5 ml of 6 g 100 ml-1) and autoclaved (123° C, 0.5 h) to achieve complete digestion. Samples were pH neutralized with 2 N NaOH and analyzed in quartz cuvettes following the same method used in NN analysis, but with a different standard curve derived from a nitrate standard that has been digested as described above to better reflect post-digestion condition. (Crumpton et al, 1992; Bachmann and Canfield, 1996).
Acid Neutralizing Capacity (ANC) Acid-neutralizing capacity (mg CaCO3 L-1) was determined from composite, integrated water samples (50 ml) transferred to white, HDPE sample cups (250 ml) to which 4 to 6 drops of a methyl-red-bromcresol-green indicator were added. Samples were titrated with H2SO4 (0.002 N) to a gray end-point (pH ~5.2; Lind, 1979). Whole Lake water MC (WLW MC) Composite, integrated whole lake water (WLW) samples were placed in HDPE sample cups (250 ml) and immediately placed on ice in the field and stored frozen (–40° C). The WLW samples were frozen/thawed (3X) to release intracellular MC. Samples (15 ml) were thoroughly mixed, transferred to borosilicate glass serum bottles (30 ml), and frozen on edge to maximize exposed surface area . The frozen samples were lyophilized in a freeze-dry system (LabConco Freezone 4.5) under vacuum (~30 X 10-3 mbar) at -50° C for 18-24 h. Dried material was then re-hydrated with 1.5 ml of water and mixed on a shaker table for 16-24 h. This procedure achieved a 10-fold concentration of materials and increased the sensitivity range of the ELISA methods used. About 1 ml of the re-hydrated sample was filtered through a 13 mm, 0.2 µm Whatman PTFE syringe filter into a 1.5 ml polypropylene centrifuge tube, which was stored frozen (–40° C) before ELISA analysis for MC. Net (>50 mm) Phytoplankton and Zooplankton MC
Collection of net plankton samples and the preparation of materials for analyses are depicted in Figure 3. Integrated net plankton tows were taken from ~1 m above lake bottom to the surface using a 30 cm diam. plankton net with 50-µm Nitex mesh (Aquatic Research Instruments, ARI). Contents of the cod-end bucket were rinsed into a separatory bottle, composed of an inverted 2 L polycarbonate bottle with a clamped Tygon tube at the bottom and a hole at the top for adding the sample. The volume of sample was brought to 1L with filtered lake water. The bottle was then covered with black plastic to darken the interior, except for 2-3 cm at the bottom. After 15 min, the phototactic zooplankton migrated toward the light at the bottom of the bottle and into the Tygon tube, leaving the phytoplankton suspended (Capron, 1995). The first 100-125 ml of sample released from the Tygon tube contained most of the zooplankton that were collected on a
piece of 50 µm Nitex mesh. The mesh, containing the zooplankton, was blot-dried on a sponge and placed in a polypropylene sample vial (6 ml). The remaining contents of the separatory bottle (predominantly phytoplankton) were passed through a second piece of Nitex mesh and placed into another polypropylene vial (6 ml). Zooplankton and phytoplankton vials were stored on ice and frozen (-40° C) in the laboratory.
Plankton (phyto- and zooplankton) samples, concentrated on the Nitex meshes, were frozen/thawed (3X) and 0.02-0.045 g of each sample was extracted in a centrifuge tube (1.5 ml) with methanol (0.25 ml of 80% MeOH) (room temp., 18-24 h). Following MC extraction, 0.75 ml of phosphate buffer solution (PBS) was added and a 0.3 ml sample was filtered through a 13 mm, Whatman PTFE syringe filter (0.2 µm) into a new centrifuge tube (1.5 ml). Additional PBS (0.45 ml) was added to bring the final MeOH concentration to 8% (Honkanen, et al, 1995 and Metcalf, et al, 2000). The storage tubes were then frozen (–40° C) until ELISA analysis for MC. Enzyme-Linked Immunosorbent Assay (ELISA) for MC
All ELISA analyses for microcystins were performed using Microcystin 96-Well-Plate Kits (EnviroLogix Inc. Portland, ME). The three MC kit standards provided (160, 500, and 1600 pg ml-1) were further diluted with water to make 4 additional standards (15, 25, 53, and 100 pg ml-1) to expand the standard curve and increase the sensitivity range of the assay. For MC analyses the 96-well-plates were warmed to room temperature, diluent (125 µl) was added to each well using a Titertek Digital Multichannel Pipette, and 20 µl of each sample or standard were added to separate wells. Each of the 7 standards (3 commercial + 4 prepared) was run in duplicate wells and compared before preparation of the final standard curve, against which all unknown samples were measured. The 96-well-plate was covered with parafilm and incubated (0.5 h, room temp.) on an orbital shaker (~200 rpm) to allow binding of MC-antibody to MC in the samples and standards. Following incubation, MC-enzyme conjugate (100 µl) was added to each well and incubated again (0.5 h, room temp.) to allow MC-enzyme conjugate binding to any free MC-antibody sites not occupied by the samples or MC standards. Well contents were removed and the plates were rinsed (3X) with a saline wash solution to remove unbound material. The plates were carefully emptied and chromogen-substrate (100 µl) was added to each well before a final incubation (0.5 h, room temp.) to allow chromogen-substrate, a colored indicator, to bind to the MC-enzyme-conjugate previously bound to MC-antibody. The binding of chromagen-substrate to the MC-enzyme conjugate produced a blue color in the wells. The intensity of the blue color was inversely proportional to the MC concentration, since the amount of MC-enzyme-conjugate binding in the wells was inversely proportional to the MC concentration in the original samples or standards. Finally, stop solution (100 µl of 1.0 N HCl) was added to each well to produce a yellow color. The OD of the 96-well-plate was read on a Bio-Tek EL800 Plate Reader (Winooski, VT) (sensitivity of ± 0.010 Abs) at a wavelength of 450 nm. MC concentrations were calculated based on a cubic log-log standard curve produced by the program KC Junior, a companion program to the Bio-Tek EL800 Plate Reader. The 96-well-plate was also read at a dual wavelength of 630 nm as a reference to remove any interference from bubbles in the sample or scratches on the plastic.

Net Plankton (>50 µm) Sampling for Enumeration Integrated net plankton tows were taken with an ARI plankton net (30 cm diam., 50 µm Nitex mesh) following the same procedure described above for phyto- and zooplankton MC. Net contents were thoroughly rinsed into the cod-end bucket by pouring lake water onto the outside of the net so that no additional net plankton was added. Cod-end bucket contents were rinsed into sample cups (250 ml), preserved with 4% formalin-sucrose (3 ml per 50 ml sample), and stored at room temp. Before net phytoplankton and zooplankton counts were made, the samples were adjusted to a volume of 150 ml by either adding water or removing excess lake water with a syringe pipette (20 µm).
For phytoplankton enumeration, a Hensen-Stempel pipette was used to transfer thoroughly mixed sample (1 ml) into a Sedgewick-Rafter counting chamber. Some samples were diluted with water to provide the desired range of 150-500 total algal cells per chamber. One ml sub samples were counted and the phytoplankton identified to the genus level at 100X magnification using a compound microscope. For zooplankton enumeration, 1 ml of the thoroughly mixed, original sample was transferred into a Sedgewick-Rafter counting chamber using a Hensen-Stempel pipette. Cladocera and copepods were counted and identified to genus level at 40X magnification using a compound microscope. Samples were counted until at least 50 total organisms were recorded. Counts were used to estimate lake concentrations of each zooplankton genus, which were then multiplied by a factor of 2.18 to correct for the efficiency (~45%) of the 50 µm plankton net used to collect samples.
For enumeration of benthic Microcystis, samples fixed with 4% formalin-sucrose were thoroughly mixed, allowed to settle 24 h. In formalin-sucrose, Microcystis colonies float near the surface. The liquid was decanted and passed through Nitex mesh (50 µm) to collect the cyanobacterial colonies. The net contents were then rinsed with water into a Sedgewick-Rafter counting chamber. The total number of Microcystis colonies in each sample was counted at 100X magnification using a compound microscope.
Information from Databases
Watershed landcover analysis was performed using data provided by GRANIT NH, the centralized database for NH GIS data. Landcover information was produced by GRANIT from 1986-1990 LANDSAT Thematic Mapper data with an approximate resolution of 0.2 acres. Watershed boundaries were screen digitized in ArcView 3.2 based on 1996 1:24,000 USGS 7.5 minute topographic quadrangles. Final categories used for regression analysis were as follows: agriculture, cleared, forest, wetland, urban, water and other.
RESULTS AND DISCUSSION
The Study Lakes Over 50 lakes in New Hampshire were surveyed. All of the lakes had detectable
quantities of microcystins. For completeness and comparability, these results summarize

data collected from 44 different lakes plus multiple basins within three lakes (Squam Lakes, Swains Lake and Umbagog Lake) making a total of 47 lake basins (Table 1). Thirty of these lakes were sampled on two or three dates, with a total of 85 lake sampling dates for the two sampling years in 1999 and 2000. The lakes selected for this study were distributed throughout New Hampshire, including the contrasting southern (urban/suburban), coastal plain, western rural, White Mountains lakes region and the Northern Forest regions (Figure 1). The study lakes represented a wide range of sizes (5.8-2737 ha, 2.7-50 m maximum depth) and trophic conditions, from ultra-oligotrophic to eutrophic lakes (Figures 9-12, Tables 1-3). Based on mean TP (10.62 µg L-1), TN (315.5 µg L-1) Chl a (4.26 µg L-1) and water transparency (5.03 m), the average lake in this study could be classified as oligo-mesotrophic. The study lakes closely match the mean values for the New England Highlands Ecoregion (TP 10.62 µg L-1, TN 349.7, Chl a 4.46 µg L-1, Secchi disk depth 4.36 m) as defined in the EPA Nutrient Ecoregions (NEIWPCC, 2000). Because of the contrasting weather conditions in 1999 (exceptionally dry and sunny) and 2000 (exceptionally wet and cloudy), we analyzed the combined data as well as for each year. Although TP was higher and TN was lower in the wet year (2000), these differences were not significant (t-test, p<0.05, Table 2). Direct year comparisons are difficult, however, since not all lakes were sampled in each of the years. Based on our observations that cyanobacteria populations become abundant after mid-July, we have divided the data set into two seasons into spring (May – July 13) and summer (July 14 – October), similar to Jacoby et al. (2000) for their study of microcystins in a Washington State lake. There were no significant differences (t-test, p <0.05) in the mean trophic parameters with season (Table 2). However, the range (max-min) of nutrient concentrations (TP, TN, NN) and chlorophyll a was much larger in the summer sampling period.
Toxin Concentrations Microcystins (MC) were found in lake water and plankton of all the lakes sampled. On only three of the 85 sampling dates for the 47 lakes were the levels of MC whole lake water (WLW) extrapolated from a standard curve, i.e. <1.5 ng L-1. Mean MC concentration in the WLW for all sampling dates was 13.2 ng L-1, ranging from 0.2-114.1 ng L-1 (Table 4, Figure 9). Mean summer concentrations of WLW MC were higher than spring WLW MC (10.2 vs 15.6 ng MC L-1, although these were not significantly different (t-test, p<0.05). MC concentrations in the net phytoplankton ranged over four orders of magnitude (Figure 10) from 0.8 (Newfound Lake) to 31472.0 ng g-1 w.wt (Silver Lake, Hollis) and were generally 4-5 X the concentration of MC in the zooplankton (0.9 - 8980.7 ng g w.wt-1, Figure 11). Mean MC concentrations in the phytoplankton and zooplankton for all dates were 1577.4 and 330.1 ng g-1 w.wt., respectively. MC tended to be higher in the summer in the water and plankton. During the summer, mean phytoplankton MC was over four times the mean spring concentration (2375.5 vs 542.1 ng g-1 w.wt.) and median summer phytoplankton was approximately seven times the spring median concentration (242.4 vs 34.2 ng g-1 w.wt., Table 4, Figure 10). Average zooplankton MC was only slightly (not significant, test, p<0.05) higher (293.8 vs 357.4 ng g-1 w.wt.) in the summer. Mean and median MC concentrations in the zooplankton were approximately 20 and 17%, respectively, of the phytoplankton MC.

MC concentrations were generally lower in the 2000-sampling season in all lake compartments measured (Table 3). This is quite likely related to the differences in weather during the two years, although this effect is difficult to isolate, due to other differences in the sampling years, e.g. 1999, sampling season was 2 June – 4 October, n = 65; 2000 sampling season 8 May – 24 August, n = 20. Nutrient Control and the Eutrophication Hypothesis
The major hypothesis posed in this study was that the abundance of microcystin toxins in lakes is linked to the abundance of nutrients, comparable to the relationships established between nutrients and chlorophyll a. More specifically, we set out to (a) test whether there are correlations between nutrients (TP, TN, TN:TP) and MC and (b) compare these relationships with eutrophication models developed to predict chlorophyll a. TP and TN were significantly correlated with MC levels in the lake water and in the plankton for 1999 and the combined 1999-2000 data. The total phosphorus vs chlorophyll a relationship for the New Hampshire lakes in this study was highly significant (p<0.001) and predictive (r2=0.65). The NH lakes model compared most closely with the OECD model of Vollenweider and Kerekas (1982) and Chow-Frazer (1991) (Figure 11).
Overall, log-log (power function) relationships were found between MC in the three lake compartments and both TP and TN, supporting the eutrophication hypothesis. No significant relationships were found with nutrient concentration and MC in the 2000 data set. Regression analysis thus focused on the 1999 and combined 1999-2000 data. Also, the ratio of TN:TP was not significantly (p<0.05) correlated with MC in the water or plankton for any of the years or seasons. Total phosphorus was significantly correlated with the WLW MC concentration in both the spring and summer periods (Figure 12, Table 4). TP was most predictive of WLW MC during the summer (r2=0.31, p<0.001), based on the 1999 samples. Total nitrogen was also highly correlated with WLW MC, explaining 44% of the variability in this toxin in 1999 (Figure 13, Table 4).
TP was also significantly correlated with the concentration of MC in the phytoplankton, accounting for 25% (p<0.001) of the summer phytoplankton MC variation and 16% (p<0.05) in the spring, 1999 (Figure 14, Table 5). Using the combined years, TP was still significantly correlated, but only slightly less predictive (r2=0.15, p=0.001, Table 5, Figure 15). TN was the best predictor of phytoplankton MC in the 1999 spring (r2=0.36, p=0.01, Table 5, Figure 16) and combined seasons for 1999 (r2=0.25, p<0.001) and combined years (r2=0.22, p<0.001, Table 5, Figure 17). Nitrate nitrogen (NN) was not correlated with the concentration of MC in the lake water or plankton.
Zooplankton MC was not so strongly linked with nutrients as the other two MC compartments. TP accounted for 15% (p=0.005, Table 6, Figure 18) of the zooplankton MC in the summer for the combined years and 13% (p=0.008) of the summer zooplankton MC in 1999 (Figure 19, Table 6). TN was a stronger predictor of zooplankton MC than TP in the spring for 1999 (r2=0.24, p<0.04, Table 6, Figure 20) and combined years (r2=0.22, p<0.006, Table 6, Figure 21).

Influence of Chlorophyll a, ANC and Water Transparency Whereas TP was most strongly related to MC in the summer, chlorophyll a was highly correlated with WLW MC, phytoplankton and zooplankton MC in the spring, accounting for 35%, 30% and 21% of the MC variability, respectively (Figures 22-24, Tables 4-6). In the summer and combined seasons, chlorophyll a had significant, but lower correlations with MC concentrations.
Acid neutralizing capacity (ANC) was positively correlated with the WLW MC (r2=0.12) when the seasons were combined (Table 4, Figure 25). Spring ANC was an even better predictor of the weight-specific MC concentration in the phyto- and zooplankton (combined years, r2=0.27 and 0.26, respectively, Tables 5-6, Figures 26-27), as well as the MC concentrations in the phyto- and zooplankton per unit volume lake water (r2=0.30 and 0.28, respectively, Figures 28-29).
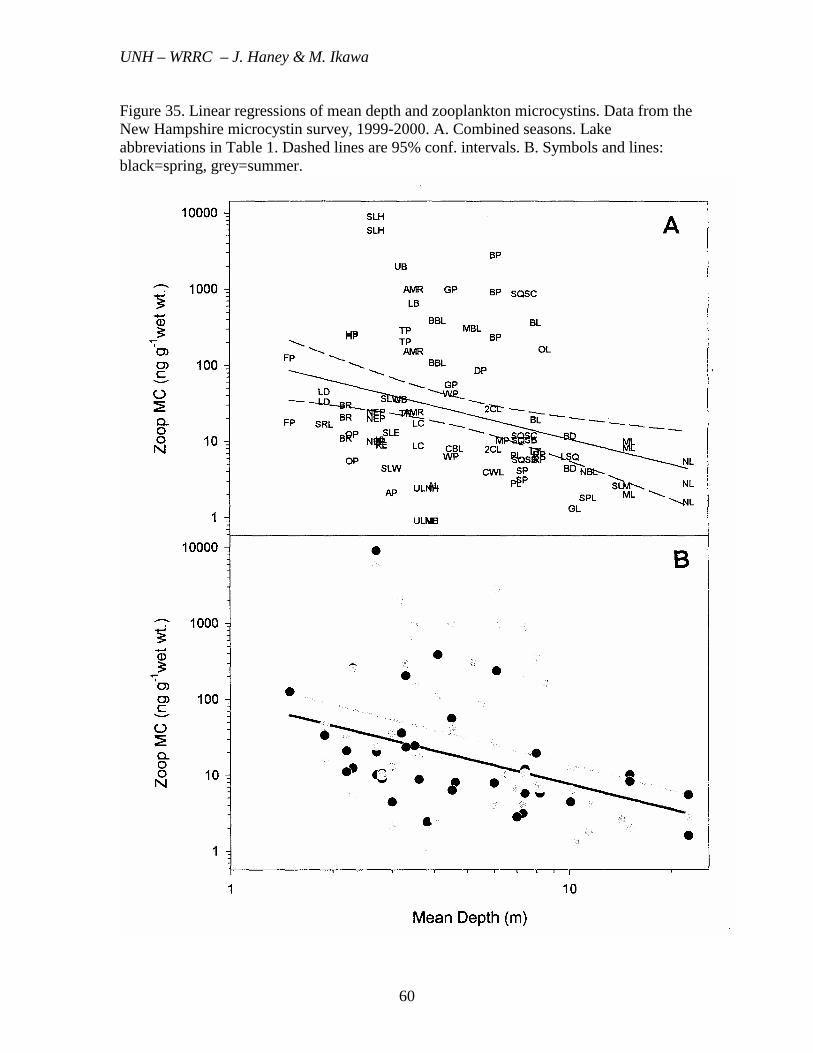
Water transparency (SDD) was negatively correlated with MC in the lake water, phytoplankton and zooplankton, explaining the greatest percentage of the MC variability in the summer period (r2=0.21, 0.21 and 0.14%, respectively, for the combined years, Tables 5-6, Figures 30-32). Effects of Plankton Composition The composition of the phytoplankton present in each lake was determined from microscopic examination. The percentage of cyanobacteria in the net phytoplankton was not correlated with the amount of MC in the lake water. This suggests that MC was not produced equally by all cyanobacteria in the lake or those smaller forms, such as the nanoplankton or picoplankton, also play an important role in microcystin production. The concentration of MC in the zooplankton was positively correlated with the % cladocerans in the spring zooplankton (p<0.01, r2=0.21) and even more strongly correlated with the % Daphnia present in the spring (p<0.001, r2=0.35). The percentage calanoid copepods was negatively correlated with the MC in the zooplankton during the spring period (p<0.01, r2=0.24). Percentage of cyclopoid copepods was not correlated with the zooplankton MC concentration. Also, during the summer, there were no significant correlations between the zooplankton MC and composition of the zooplankton. These findings indicate the transfer of MC from the phytoplankton to the zooplankton is strongly influenced by the types of zooplankton grazers present. Lake Morphometry and Watershed Features Of the lake morphometric features examined (mean depth, maximum depth, area, volume), mean depth was most highly correlated with MC, i.e., MC concentrations generally decreased with increasing mean depth. Strongest relationships with mean depth were found with the spring period (p<0.01), with r2 values of 0.18, 0.29 and 0.17 for the WLW MC, phytoplankton MC and zooplankton MC, respectively (Table Tables 4-6, Figures 33-35). The closer linkage between mean depth and phytoplankton MC concentration per unit biomass than with the MC concentration in the lake water, per unit volume, suggests the phytoplankton MC production is somehow enhanced by the greater contact with the bottom sediments, either through greater growth rates or by promoting specific cyanobacteria that produce microcystins.
We also determined watershed land cover features of 25 of the selected lakes using GIS. Watershed land cover types ranged from highly urbanized lakes (e.g., Horseshoe Pond, 49.2% urban) to lakes with largely forested watersheds (e.g., Lake Chocorua, 94.2%). Of the study lake watersheds none had agricultural use in excess of 10%, reflecting the general decline of farming in New Hampshire. At the watershed level, percentage of any land cover type was not significantly correlated (p<0.05) with the concentration of MC in any of the lake compartments.
GENERAL DISCUSSION Evaluation of the Eutrophication Model The phosphorus chlorophyll a models of Dillon and Rigler (1974) and Vollenweider and Kerekas (1982) have been widely used to implicate phosphorus as an important nutrient regulating the abundance of phytoplankton in lakes. These models have also been useful for predicting the impact of increasing or decreasing the phosphorus concentration. Data from the New Hampshire microcystin survey generally support the application of the eutrophication model to microcystin toxins. Best fits for both chlorophyll a and MC were with power function, i.e., log-log, regressions, suggesting similar patterns of change in chlorophyll a and MC occur with increasing total phosphorus concentration. As with any power function, slow responses to phosphorus increase occur at low phosphorus levels and increase rapidly at higher concentrations.
It is noteworthy that total nitrogen was, in fact, a better predictor of MC in all three MC compartments. This suggests that nitrogen may be a more useful tool for forcasting MC concentrations. The relatively high correlations between TN and WLW (0.57) MC as well as phytoplankton MC (0.64) also suggestive that nitrogen may play a key role in the promotion of microcystin production in these lakes. This is also supported by Lee et al. (2000), who demonstrated that the MC content of Microcystis aeruginosa in laboratory cultures was highly correlated with the TN content of the medium. Similarly, Codd and Poon (1988) and Watanabe and Oishi (1985) reported that the microcystin toxicity of M. aeruginosa decreased dramatically when nitrogen was decreased in the culture medium. Since heterocyst bearing cyanobacteria, such as Anabaena, might be expected to benefit competitively from a scarcity of available nitrogen, the correlative evidence with TN suggest non-heterocystous cyanobacteria, such as Microcystis, may be the important MC producers in the New Hampshire lakes and that MC production may be limited by the nitrogen content of the lake.
The ratio of total nitrogen to total phosphorus is often postulated as an important environmental parameter controlling the abundance of cyanobacteria, since low TN:TP would favor heterocystous, N-fixing cyanobacteria, such as Anabaena or Aphanizomenon. This hypothesis was supported by Kotak et al, (2000) who found that 70% of the variation in MC-LR was explained by the TN:TP in the lake water. This is especially interesting, considering that the MC-LR in their lakes was strongly correlated with the biomass of Microcystis aeruginosa, a non-heterocystous cyanobacterium. In contrast, we found no significant relationship between MC concentrations and the TN:TP ratios in New Hampshire lakes. There are several possible explanations for these differences. First, there was a very small range of TN:TP (max TN:TP approx. 25) in the
Canadian lakes, due to the high phosphorus concentrations in these eutrophic lakes, whereas the New Hampshire lakes were generally much higher (mean TN:TP = 37.6, max. 136), reflecting the more oligotrophic nature of these waters. At such high ratios one might expect phosphorus to be the primary limiting nutrient. In contrast to the Canadian lakes, very few of the New Hampshire lakes were dominated by a single cyanobacteria species, such as M. aeruginosa or other large colonial forms. Possibly, the MC-producing cyanobacteria in our study lakes were largely non-N-fixing species that derived no competitive advantage from a low TN:TP ratio. This idea is also supported by the positive correlation between nitrate nitrogen (NN) and the concentration of MC in the plankton. Although TN and TP were highly correlated with MC, less than one-half of the variability in toxin concentration was explained by these nutrients. Clearly, for any given lake other factors play an important role in determining the MC content. For example, shallow lakes and relatively clear lakes (e.g. Silver Lake, Hollis tended to have relatively high concentrations of MC, considering the TP concentration. Even within the same lake, the shallow basins tended to have the highest concentrations of MC (Squam Lake, Squaw Cove cf. Squam Lake, Sandwich Bay). It appears that lakes with sediments exposed to sunlight promote the growth of cyanobacteria such as Microcystis when they are in the benthic phase of their life cycle. This could account for relatively high MC levels in the lake water and plankton in remote lakes, such as Little Diamond Pond, with median TP levels, but the 4th highest WLW MC and 3rd highest phytoplankton MC of the 47 lakes tested. Similarly, Russell Pond, one of the most oligotrophic lakes examined (Secchi disk depth of nearly 15 m, TP=2 ppb) had relatively toxic phytoplankton, compared to the other lakes. The great water clarity in Russell Pond exposes 100% of its sediments to 0.1% of surface light intensity and over 70% of its sediments to 1% surface light, despite a maximum depth of 23.7 m. The differences in the data collected for the two years indicate climatic factors such as precipitation, temperature and solar light flux may also be important parameters that should be included in future models to predict toxin levels. In previous research on Silver Lake, Hollis, MC levels fell below detectable limits (using HPLC methods) during the 1992 with exceptionally low solar input and low water temperatures associated with major volcanic activity (Capron, 1995).
CONCLUSIONS AND RECOMMENDATIONS Results from this survey indicate the presence of microcystin toxins in all of the lakes examined. These findings shift the emphasis from asking, “which lakes have toxic cyanobacteria?” to “what controls the level of cyanobacteria toxins in lakes?” By measuring the MC levels in the lake water as well as the weight-specific concentrations in the plankton we were able to demonstrate that some lakes have very small amounts of plankton that are relatively toxic and similarly, some lakes with large quantities of plankton with low specific toxicity. Although eutrophication has been linked with problems of toxic cyanobacteria, the focus of most previous studies has been on “problem” lakes that exhibit blooms of cyanobacteria. We have demonstrated that microcystin toxicity parallels the relationship
between nutrients and phytoplankton biomass (chlorophyll a) and extends from ultra-oligotrophic to eutrophic lake conditions. This allows for a quantitative forecasting of the impact of nutrient enrichment on lake toxicity, which could be important for the management of surface water supplies for drinking water and recreation. Because of the emphasis on phosphorus as a limiting factor for phytoplankton growth in lakes, we initially tested our microcystin-eutrophication hypothesis using total phosphorus as the driving nutrient. Surprisingly, nitrogen (total nitrogen) provided a better predictor of toxin concentration than phosphorus, suggesting future lake monitoring and research should also include the testing for total nitrogen. The New Hampshire microcystin survey also demonstrated that microcystin toxin concentrations are correlated with other parameters commonly measured in lake monitoring programs, such as chlorophyll a, Secchi disk depth and acid neutralizing capacity. This is a significant finding in that it indicates the results for lake monitoring surveys can be applied to predict the likelihood of toxicity problems in a lake. Microcystins were detected in an extremely broad range of concentrations in the net phytoplankton and zooplankton of all of the lakes tested. Overall, the zooplankton contained approximately 20% of the phytoplankton microcystin content, indicating considerable amounts of this toxin are passing into the lake food web and possibly being bioaccumulated by other lake biota, such as fish and benthic consumers. Some of the study lakes had high levels of microcystins in the zooplankton, compared to other lakes with comparable nutrient levels, raising questions concerning the roll of the composition of the lake food web in the transfer of toxins. The strong positive correlation between zooplankton MC and the % Daphnia in the lakes suggests the species composition of the zooplankton grazers may influence the transfer of microcystins. Likewise, it is likely that the degree of fish planktivory in the lake may indirectly impact the efficiency of movement of MC from the phytoplankton to the zooplankton grazer community. Clearly, investigations of microcystin transfer through lake food webs are needed to better understand these processes. Our data support the model that, in general, nutrients promote the development of microcystin toxicity in lakes. The utility of these models, however, is limited by the high lake-to-lake variability. Other factors must clearly be included in future models to be useful for forecasting the effects of nutrient enrichment on lake toxicity. We have identified lake mean depth as an important variable, along with factors such as the buffering capacity or ANC of the water. Long-term studies should be undertaken on a subset of lakes to incorporate the influence of light and temperature. Such models would have greater predictive power for specific lakes and also permit long-range forecasting of the effects of global climate change on lake toxicity.
REFERENCES Adelman, W.J., Jr., J.F. Fohlmeister, J.J. Sasner, Jr., and M. Ikawa. 1982. Sodium
Channels Blocked by Aphantoxin Obtained from the Blue-Green Alga, Aphanizomenon flos-aquae. Toxicon 20, No. 2: 513-516.
American Public Health Association. (APHA) 1998. Standard Methods for the Examination of Water and Wastewater 20th edition. APHA, AWWA, WPCF.
Anderson, R.J., H.A. Luu. D.Z.X. Chen, and C.F. Holmes. 1993. Chemical and biological evidence links Microcystins to Salmon "Netpen Liver Disease". Toxicon 31, 10:1315-1323.
Bachman, R.W. and D.A. Canfield, Jr. 1996. Use of an alternative method for monitoring total nitrogen concentration in Florida lakes. Hydrobiologica 323:1-8.
Capron, S. 1995. Occurrence of microcystins produced by Microcystis aeruginosa (blue-green algae) and accumulation in zooplankton. MS Thesis. Univ. of New Hampshire.
Carmichael, W.W. 1992. Status Report on Planktonic Cyanobacteria (Blue-Green Algae) and Their Toxins. Tech. Rpt. EPA No.600/R-92/079. U.S. EPA, Cincinnati, OH.
Carmichael, W.W. 1995. The Toxins of Cyanobacteria. Sci. Amer. 270: 78-86. Carmichael, W.W. 1996. Toxic Microcystis and the Environment. In: Toxic Microcystis
(Watanbe, M., K.Harada, W. Carmichael, & H. Fujiki, eds). CRC Press, New York. pp 1-11.
Carmichael, W.W., C. Drapeau, & D.M. Anderson. 2000. Harvesting of Aphanizomenon flos-aquae Ralfs ex Born. & Flah. Var. flos-aquae (Cyanobacteria) from Klamath Lake for human dietary use. Jour. Appl. Phycol. 12: 585-595.
Chorus, I and J. Bartram. (eds) 1999. Toxic Cyanobacteria in Water: A Guide to their Public Health Consequences, Monitoring and Management. E & FN Spon, London, 416 pp.
Chow-Fraser, P. 1991. Use of the morphoedaphic index to predict nutrient status and algal biomass in some Canadian lakes. Can. J. Fish. Aquat. Sci. 48:1909-1918.
Codd, G.A. and G.K. Poon. 1988. Cyanobacteria (blue-green algae). Toxicon 26: 971-973.
Codd, G.A., T.M. Jeffries, C.W. Keevil, and E. Potter (eds). 1994. Detection Methods for Cyanobacterial toxins. Royal Society of Chemistry. Cambridge, UK. 191 pp.
Crumpton, W.G., T.M. Isenhart and P.D. Mitchell. 1992. Nitrate and organic N analysis with second derivative spectroscopy. Limnology and Oceanography 37:907-913.
Dillon, P.J. and F. H. Rigler. 1974. The phosphorus-chlorophyll relationship in lakes. Limnol. Oceanogr. 19:767-763.
Dow, C.S. and U.K. Swoboda. 2000. Cyanotoxins. In: The Ecology of Cyanobacteria. (Whitton, B.A., & M. Potts, eds). Kluwer Academic Publishers, Dordrecht, The Netherlands. pp 613–632.

Falconer, I.R. 1991. Tumor promotion and liver injury caused by oral consumption of cyanobacteria. Env. Tox. and Water Qual. 6 : 177 - 184. Falconer, I.R. (ed).1993. Algal Toxins in Seafood and Drinking Water. Academic Press,
New York. 224 pp. Falconer, I., J. Bartram, I. Chorus, T. Kuiper-Goodman, H. Utkilen, M. Burch, and G.A.
Codd. 1999. Safe Levels and Safe Practices. In (Chorus and Bartram, eds) Toxic Cyanobacteria in Water. E & FN Spon, London. Chap 5. pp 155-178.
Fallon, R.D., and T.D. Brock. 1981. Overwintering of Microcystis in Lake Mendota. Freshwater Biology 11:217-226.
Foxall, T.L. and J.J. Sasner, Jr. 1982. Effects of a Hepatic Toxin from the Cyanophyte, Microcystis aeruginosa. Proceedings of International Conference on Toxic Algae. (W.W. Carmichael, P.R. Gorham, R.E. Moore, and J.J. Sasner, Jr., eds.). The Water Environment: Algal Toxins and Health. Plenum Press, New York, pp. 365-387.
Galey, F. D., V. R. Beasley, W. W. Carmichael, G. Kleppe, S. B. Hooser, and W. M. Haschek. 1987. blue-green algae (Microcystis aeruginosa) hepatotoxicosis in dairy cows. Am. J. Vet res. 48: 1415-1420.
Honkanen, R. E., M. Kekelow, J. Zwiller, R. E. Moore, B. S. Khatra, & A. L. Boynton. 1991. Cyanobacterial nodularin is a potent inhibitor of type-1andtype-2A protein phosphatases. Mol. Pharmacol. 40: 577-583.
Honkanen, R.E., F.R.Caplan, K.K. Baker, C.L. Baldwin, S.C. Bobzin, C.M. Bolis, G.M. Cabrera, L.A. Johnson, J.H. Jung, L.K. Larson, I.A. Levind, R.E. Moore, C.S. Nelson, G.M.L. Patterson, K.D. Tschappat, G.D. Tuang, A.L. Boynton, A.R. Arment, J. An, W.W. Charmichael, K.D. Rodland, B.E. Magun, and R.A. Lewis. 1995. Protein phosphatatse inhibitory activity in extracts of cultured blue-green algae (Cyanophyta). J. Phycol., 31, 478-486.
Ikawa, M. and J. Sasner. 1990. The Chemistry and Physiology of Algal Toxins. In I. Akatsuka (ed.) "Introduction to Applied Phycology".SPB Academic Publishing, The Hague, The Netherlands. pp. 309-347.
Jacoby, J.M., M.C. Collier, E B. Welch, F.J. Hardy and M. Crayton. 2000. Environmental factors associated with a toxic bloom of Microcystis aeruginosa. Can J. Fish. Aquac, Sci. 57: 231-240
Jochimsen, E.M., W.W. Carmichael, J. An, D.M. Cardo, S.T. Cookson, C.E.M. Holmes, M.B.De C. Antunes, D. A. DeMelo Filho, T.M. Lyra, V. S. T. Barreto, S.M.F.O. Azevedo, & W.R. Jarvis. 1998. Liver failure and death after exposure to microcystins at a hemodialysis center in Brazil. N.E. Jour. Med. 38: 873 - 878.
Jungmann, D., K.U. Ludwichowski, V. faltin and J. Benndorf. 1996. A field study to investigate environmental factors that could effect microcystin synthesis of a Microcystis population in the Bautzen Reservoir. Int. Revue ges. Hydrobiol. 81:493-501. Kotak, B.G., R.W. Zurawell, E.E. Prepas, and C.F.B. Holmes. 1996. Microcystin-LR
concentration in aquatic food web compartments from lakes of varying trophic status. Can. J. Fish. Aqua. Sci. 53: 1974-1985.
Kotak, B.G., A.K-Y. Lam, E.E. Prepas, S.L. Kenefick, and S.E. Hrudey. 1995. Variability of the hepatotoxin microcystin-LR in hypereutrophic drinking water lakes. J. Phycol. 31: 248-263.
Kotak, B.G., A.K-Y. Lam, E.E. Prepas, and S.E. Hrudey. 2000. Role of chemical and physical variables in regulating microcystin-LR concentration in phytoplankton of eutrophic lakes. Can. J. Aquat. Sci. 57: 1584-1593.
Kotak, B.G., S. Semalulu, D.L. Fritz, E.E. Prepas, S.E. Hrudey, and R.W. Coppock. (2001).Hepatic and renal pathology of intraperitoneally administered microcystin-LR in rainbow trout (Oncorhynchus mykiss). Toxicon 34, no.5:517-525.
Lee, S.J., M.-H. Jang, H.-S. Kim, B.-D. Yoon and H.-M. Oh. 2000. Variation of microcystin content of Microcystis aeruginosa relative to medium N:P ratio and growth stage. J. Appl. Microbiology 89: 323-329.
Lind, O.T. 1979. Handbook of common methods in limnology. C.V. Mosby, St. Louis. Metcalf, J.S., P. Hyenstrand, K.A. Beattle, and G.A. Codd. 2000. Effects of
physiochemical variables and cyanobacterial extracts on the immunoassay of microcystin-LR by two ELISA kits. J. Appl. Microbiol. 89: 639-546.
Nurnberg, G.K. 1996. Trophic state of clear and colored soft- and hardwater lakeswith special consideration of nutrients, anoxia, phytoplankton and fish. Lake and Reservoir Management 12:432-447.
Nye, T.L. 1997. Microcystins in water, gastropods, and bivalves from Silver Lake, New Hampshire. MS Thesis. University of New Hampshire. Oh, H.M., S.J. Lee, M.H. Jang, and B.D. Yoon. 2000. Microcystin production by
Microcystis aeruginosa in a phosphate limited chemostat, Appl. And Envir. Microbiology 66(1): 176-179.
Prepas, E.E., B.G. Kotak, L.M. Campbell, J.C. Evans, S.E. Hrudley, & C.F.B. Holmes. 1997. Accumulation and elimination of cyanobacterial hepatotoxins by the freshwater clam, Anodonta grandis simpsoniana. Can. J. Aquat. Sci. 54 : 41 - 46.
Preston, T., & D.P. Srewart. 1980. Bloom-forming cyanobacterium Microcystis aeruginosa overwinters on sediment surface. Nature 288: 365-367.
Reckow, K. M Beaulac and J. Simpson 1980; Modeling Phosphorous Loading and Lake Response Under Uncertainty. USEPA 440/5-80-011.
Ringelberg, J. and R. Baard. 1988. Growth and decline of a population of Microcystis aeruginosa in mesotrophic Lake Maarsseveen I (The Netherlands). Arch. Hydrobiol. 111:533-545.
Reynolds, C.S., G.H.M. Jaworski, H.A. Cmiech, & G.F. Leedale. 1981. On the annual cycle of the blue-green algae, Microcystis aeruginosa Kutz.emend.Elenkin.Phil. Trans. Roy. Soc. Lond. B, 293: 419 –
Sasner, J.J., Jr., M. Ikawa, and T.L. Foxall. 1984. Studies on Aphanizomenon and Microcystis Toxins. In E.P. Ragelis (ed.), Seafood Toxins. ACS Symposium Series 262, American Chemical Society, Washington, D.C., pp. 391-406.
Schindler, D.W., E.J. Fee and T Ruszczynski. 1978. Phosphorus input and its consequences for phytoplankton standing crop and production in the experimental lakes area and in similar lakes. J. Fish. Res. Board Can. 35:190-196.

Schloss, J. A. 2001. Development of Statewide Nutrient Loading Coefficients Through Geographic Information System Aided Analysis. University of New Hampshire Water Resources Research Center Project Report. Durham , NH.
Sivonen, K., S.I. Niemela, R.M. Niemi, L. Lepisto, T.H. Luoma, and L.A. Rasanen. 1990. Toxic cyanobacteria (blue-green algae) in Finnish fresh and coastal waters. Hydrobiologia 190:267-75.
Shirai, M. A. Ohtake, T. Sano, S. Matsumoto, T. Sakamoto, A. Sato, T. Aida, K.I. Harada, T. Shimada, M. Suzuki, and M. Nakano. 1991. Toxicity and toxins of natural blooms and isolated strains of Microcystis spp. (cyanobacteria) and improved procedure for purification of cultures. Appl. Environ. Microbiol. 57:2650-7.
Steffensen, D.A., and B.C. Nicholson (eds). 1994. Toxic Cyanobacteria: Current status of research and management. Proceedings of Intern. Workshop, Adelaide, Australia, March 22-26, 1994.
Sponzogni, W.C., W.M. Repavich, J.H. Standridge, R.E. Wedepohl, and J.G. Vennie. (1988). A note on algal toxins in Wisconsin waters experiencing blue-green-algal blooms. Lake & Reservoir Management. 4 (2): 281 - 285.
Takamura, N., M. Yasuno and K. Sugahara. 1984. Overwintering of Microcystis aeruginosa Kütz. In a shallow lake. J. Plank. Res. 6:1019-1029.
U.S. Environmental Protection Agency (EPA). 1983. A manual of methods for chemical analysis of water and wastes. Office of Technology Transfer, Cincinnati. PA-600/4-79-020.
Utkilen, H. and N. Gjolme. 1992. Toxin production by Microcystis aeruginosa as a function of light in continuous cultures and its ecological significance. Appl.and Environ. Microbiol. 58:1321-1325.
Uttermohl, H. 1958. Improvements in the quantitative methods of phytoplankton study. Mitt. Int. Ver. Limnol. 9 : 1 - 25.
Vollenweider, R.A. 1969. A manual on methods for measuring primary productivity in aquatic environments. International Biological Programme. Blackwell Scientific
Publications, Oxford. Vollenweider, R., and J. Kerekes. 1982. Eutrophication of waters, monitoring,
assessment and control. OECD, Paris. Watanabe, M.F., K. Harada, W.W. Carmichael, and H. Fujiki. 1996. "Toxic Microcystis"
CRC Press, New York Watanabe, M.F. and S. Oishi. 1985. Effects of environmental factors on toxicity of a
cyanobacterium (Microcystis aeruginosa) under culture conditions. Appl. And Environ. Microbiol. 49:1342-1344.
Yoo, R.S., W.W. Carmichael, R.C. Hoehn, & S.E. Hrudey. 1995. Cyanobacterial (Blue-Green Algal) Toxins: A Resource Guide. AWWA Research Foundation and the American Water Works Assoc. Denver CO.
Yoshizawa, S. R. Matsushi, M. F. Watanabe, K.-I. Harada, A. Ichihara, W. Carmichael, & H. Fujiki. 1990. Inhibition of protein phosphatases by microcystin and nodularin associated with hepatotoxicity. Cancer Res. Clin. Oncol. 116: 609 - 614.

Zillberg, B. 1966. Gastroenteritis in Salisbury European children --a five your study. Centr. Afr. J. Med. 12 : 164 - 168.
Zimba, P.V., L. Koo, P.S. Gaunt, S. Brittain. & W.W. Carmichael. 2001. Confirmation of catfish, Ictalurus punctatus (Rafinesque), mortality from Microcystis toxins. Jour. Fish Diseases. 24: 41-47.
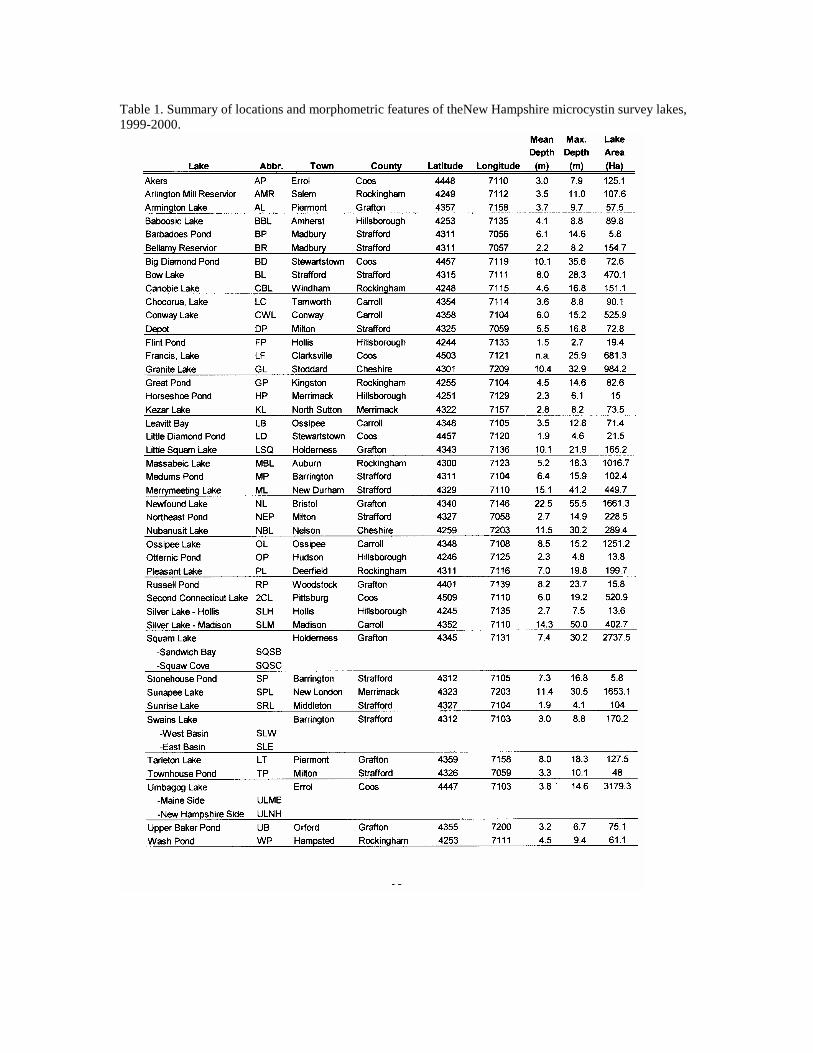
Table 1. Summary of locations and morphometric features of theNew Hampshire microcystin survey lakes, 1999-2000.

Table 2. Summary of trophic indicators for the New Hampshire microcystin survey lakes, 1999-2000.

Table 3. Summary of microcystin concentrations in the lake water, phytoplankton and zooplankton in the New Hampshire microcystin survey lakes, 1999-2000.

Table 4. Linear regressions of whole lake water microcystins (WLW MC) in the New Hampshire Lakes microcystin survey, 1999-2000.
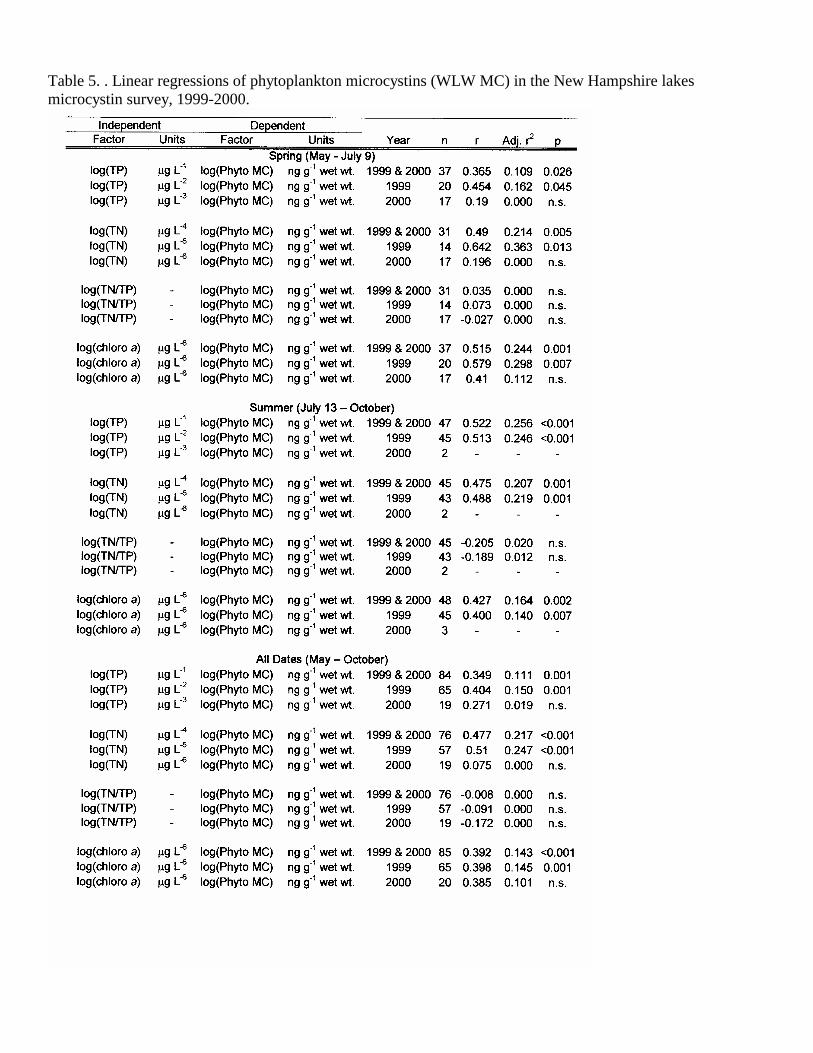
Table 5. . Linear regressions of phytoplankton microcystins (WLW MC) in the New Hampshire lakes microcystin survey, 1999-2000.

Table 6. . Linear regressions of whole zooplankton microcystins (WLW MC) in the New Hampshire lakes microcystin survey, 1999-2000.

Figure 1. Map of New Hampshire showing the locations of the study lakes in the microcystin survey, 1999-2000.

Figure 2. Integrated epilimnetic water sampling and sub sampling methods for chemical analyses.

Figure 3. Net (a 50 pm) plankton sampling and separation of phyto- and zooplankton for MC analysis and enumeration.
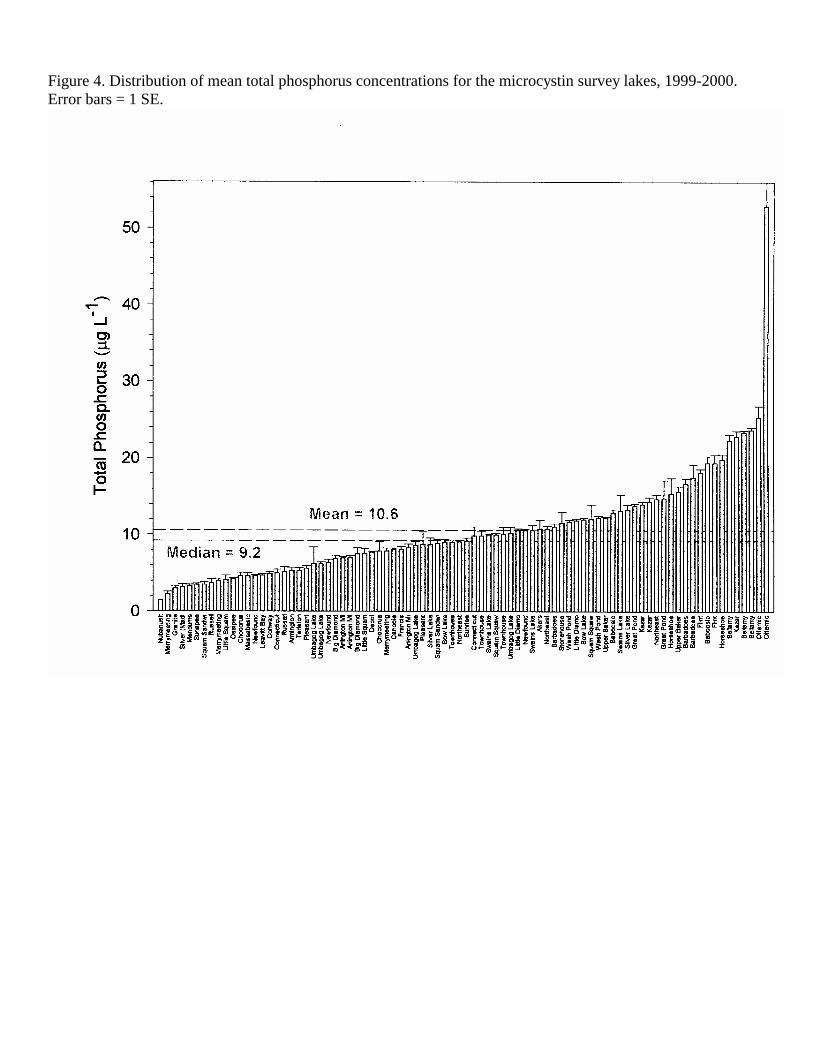
Figure 4. Distribution of mean total phosphorus concentrations for the microcystin survey lakes, 1999-2000. Error bars = 1 SE.
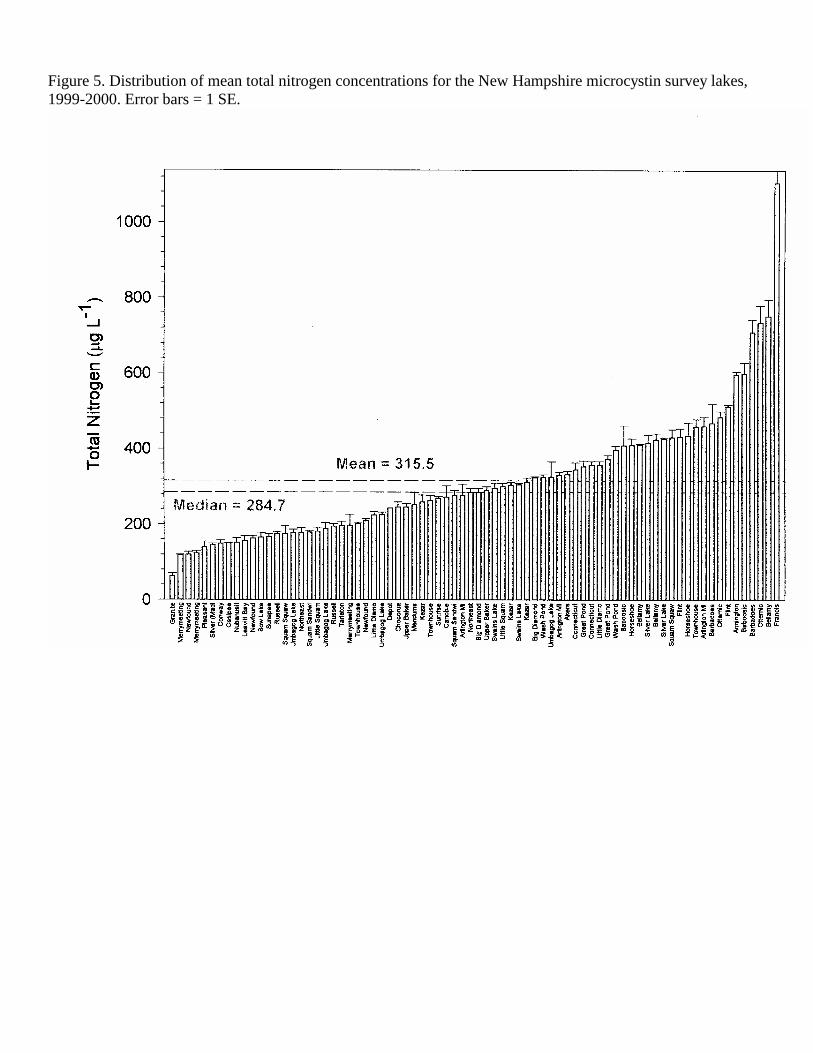
Figure 5. Distribution of mean total nitrogen concentrations for the New Hampshire microcystin survey lakes, 1999-2000. Error bars = 1 SE.
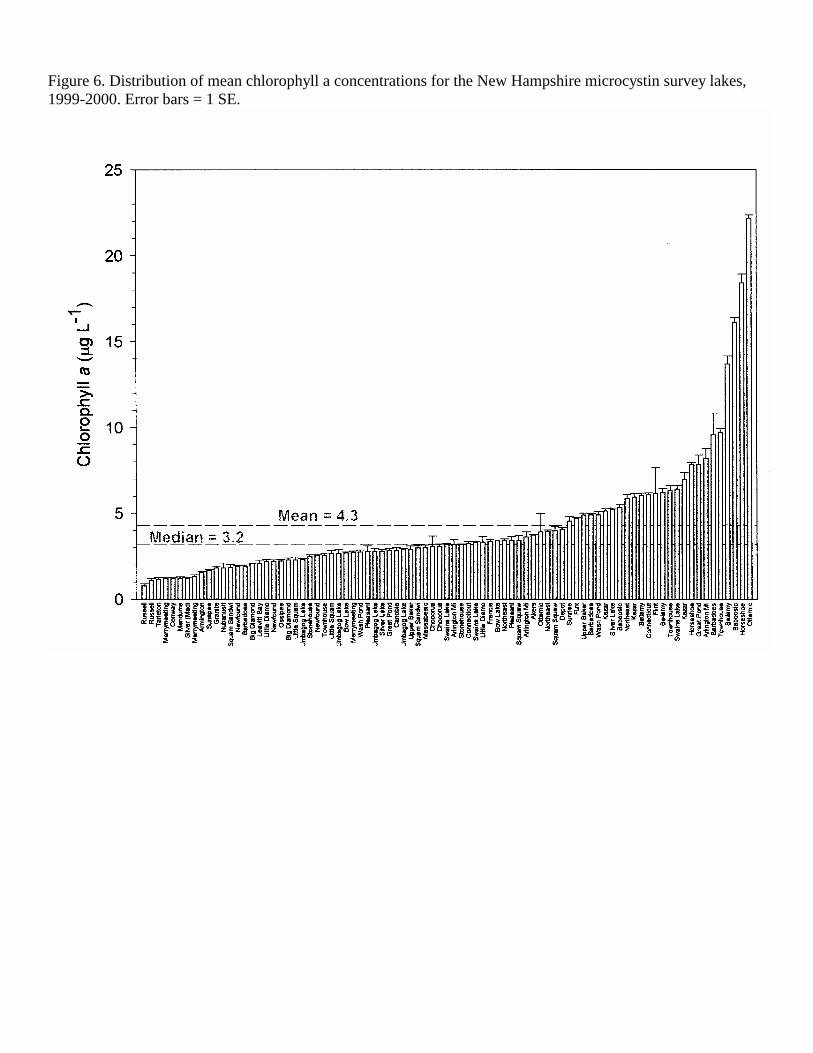
Figure 6. Distribution of mean chlorophyll a concentrations for the New Hampshire microcystin survey lakes, 1999-2000. Error bars = 1 SE.

Figure 7. Distribution of mean Secchi disk depths for the microcystin survey lakes, 1999-2000. Error bars = 1 SE.

Figure 8. Distribution of mean whole lake water MC concentrations for the New Hampshire microcystin survey lakes, 1999-2000. Error bars = 1 SE.

Figure 9. Distribution of mean phytoplankton MC concentrations for the New Hampshire microcystin survey lakes, 1999-2000. Error bars = 1 SE.
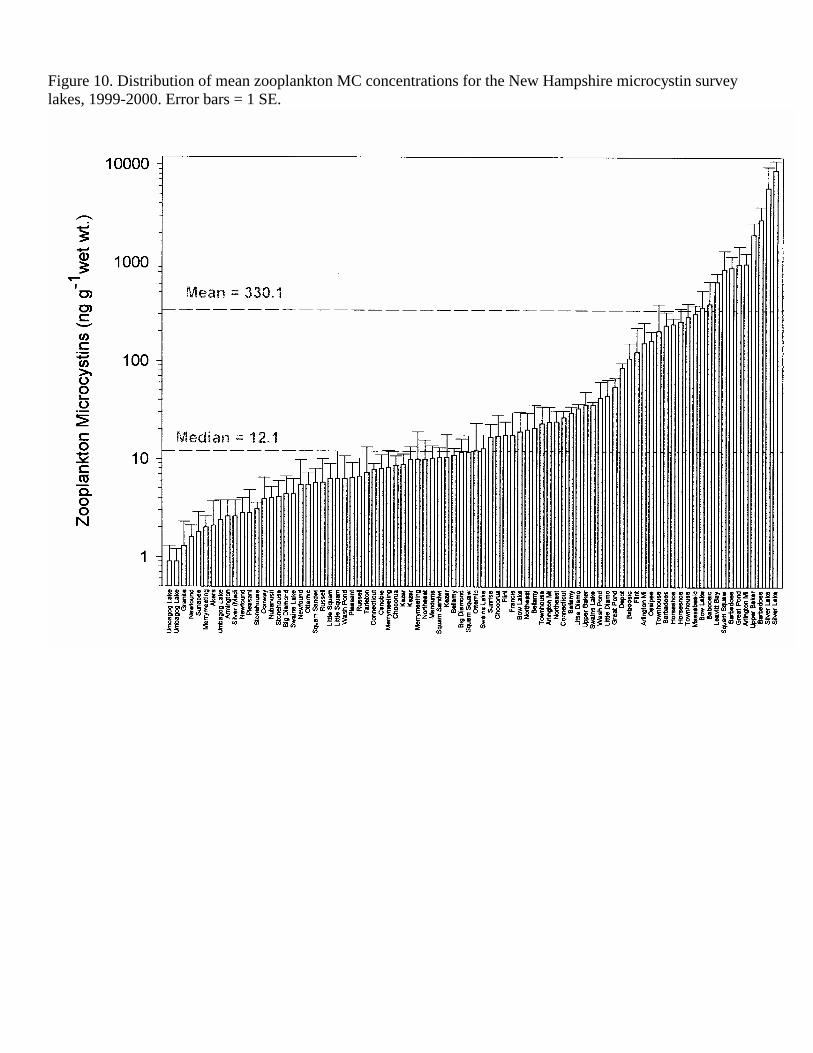
Figure 10. Distribution of mean zooplankton MC concentrations for the New Hampshire microcystin survey lakes, 1999-2000. Error bars = 1 SE.

Figure 11. Comparison of total phosphorus vs. chlorophyll a relationships from the New Hampshire microcystins survey, 1999, with other studies.

Figure 12. Linear regressions of total phosphorus and whole lake water microcystins (WLW MC). Data from the New Hampshire microcystin survey, 1999. A. Combined seasons. Lake abbreviations in Table 1. Dashed lines are 95% conf. intervals. B. Symbols and lines: black=spring, gray=summer.
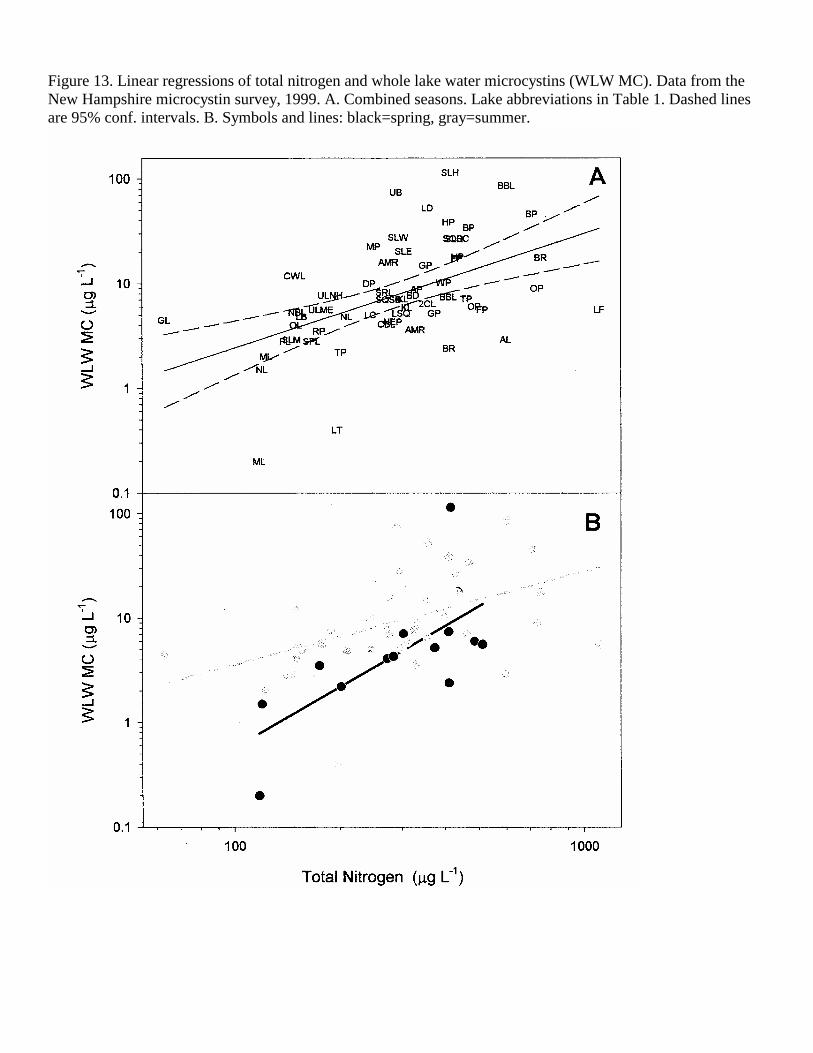
Figure 13. Linear regressions of total nitrogen and whole lake water microcystins (WLW MC). Data from the New Hampshire microcystin survey, 1999. A. Combined seasons. Lake abbreviations in Table 1. Dashed lines are 95% conf. intervals. B. Symbols and lines: black=spring, gray=summer.

Figure 14. . Linear regressions of total phosphorus and net phytoplankton microcystins. Data from the New Hampshire microcystin survey, 1999. A. Combined seasons. Lake abbreviations in Table 1. Dashed lines are 95% conf. intervals. B. Symbols and lines: black=spring, gray=summer.
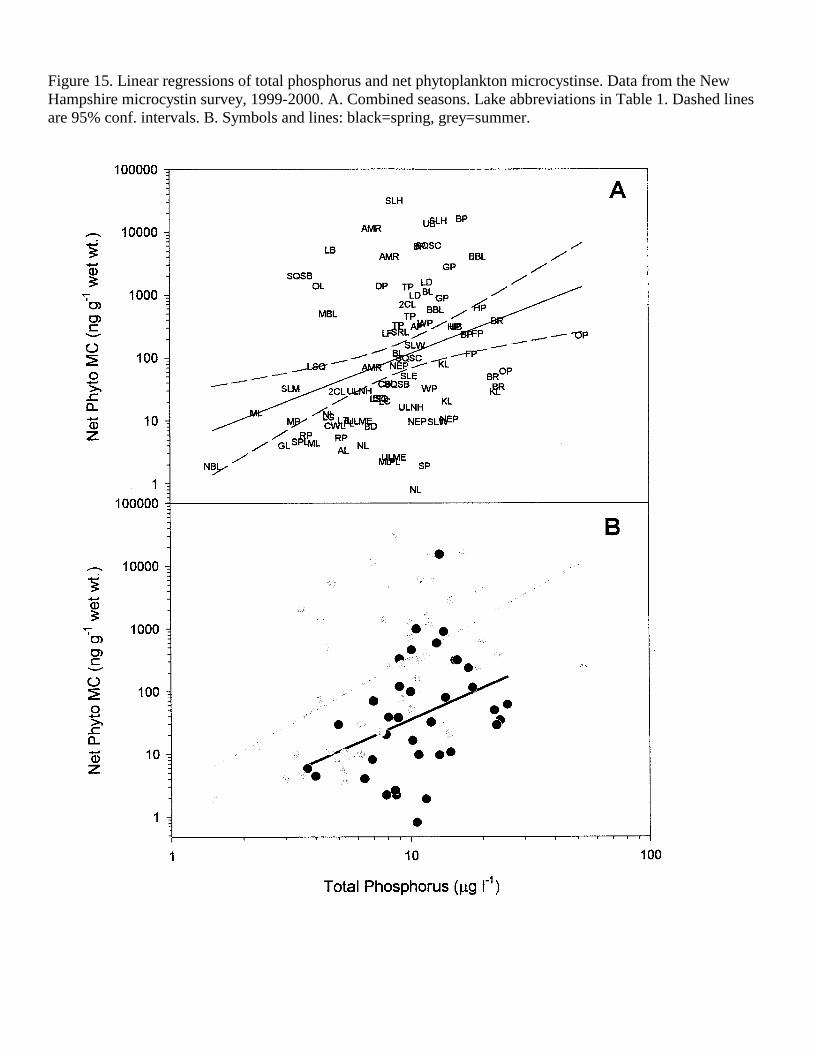
Figure 15. Linear regressions of total phosphorus and net phytoplankton microcystinse. Data from the New Hampshire microcystin survey, 1999-2000. A. Combined seasons. Lake abbreviations in Table 1. Dashed lines are 95% conf. intervals. B. Symbols and lines: black=spring, grey=summer.

Figure 16. Linear regressions of total nitrogen and net phytoplankton microcystins. -- Data from the New Hampshire microcystin survey, 1999. A. Combined seasons. Lake abbreviations in Table 1. Dashed lines are 95% conf. intervals. B. Symbols and lines: black=spring, grey=summer.

Figure 17. Linear regressions of total nitrogen and net phytoplankton microcystins. Data from the New Hampshire microcystin survey, 1999-2000. A. Combined seasons. Lake abbreviations in Table 1. Dashed lines are 95% conf. intervals. B. Symbols and lines: black=spring, grey=summer.

Figure 18. Linear regressions of total nitrogen and zooplankton microcystins Data from the New Hampshire microcystin survey, 1999-2000. A. Combined seasons. Lake abbreviations in Table 1. Dashed lines are 95% conf. intervals. B. Symbols and lines: black=spring, grey=summer.

Figure 19. Linear regressions of total phosphorus and zooplankton microcystins. Data from the New Hampshire microcystin survey, 1999. A. Combined seasons. Lake abbreviations in Table 1. Dashed lines are 95% conf. intervals. B. Symbols and lines: black=spring, grey=summer.

Figure 20. Linear regressions of total nitrogen and zooplankton microcystins. Data from the New Hampshire microcystin survey, 1999. A. Combined seasons. Lake abbreviations in Table 1. Dashed lines are 95% conf. intervals. B. Symbols and lines: black=spring, grey=summer.

Figure 21. Linear regressions of total nitrogen and zooplankton microcystins. Data from the New Hampshire microcystin survey, 1999-2000. A. Combined seasons. Lake abbreviations in Table 1. Dashed lines are 95% conf. intervals. B. Symbols and lines: black=spring, grey=summer.

Figure 22. Linear regressions of chlorophyll a and whole lake water microcystins. Data from the New Hampshire microcystin survey, 1999. A. Combined seasons. Lake abbreviations in Table 1. Dashed lines are 95% conf. intervals. B. Symbols and lines: black=spring, grey=summer.

Figure 23. Linear regressions of chlorophyll a and net phytoplankton microcystins. Data from the New Hampshire microcystin survey, 1999. A. Combined seasons. Lake abbreviations in Table 1. Dashed lines are 95% conf. intervals. B. Symbols and lines: black=spring, grey=summer.
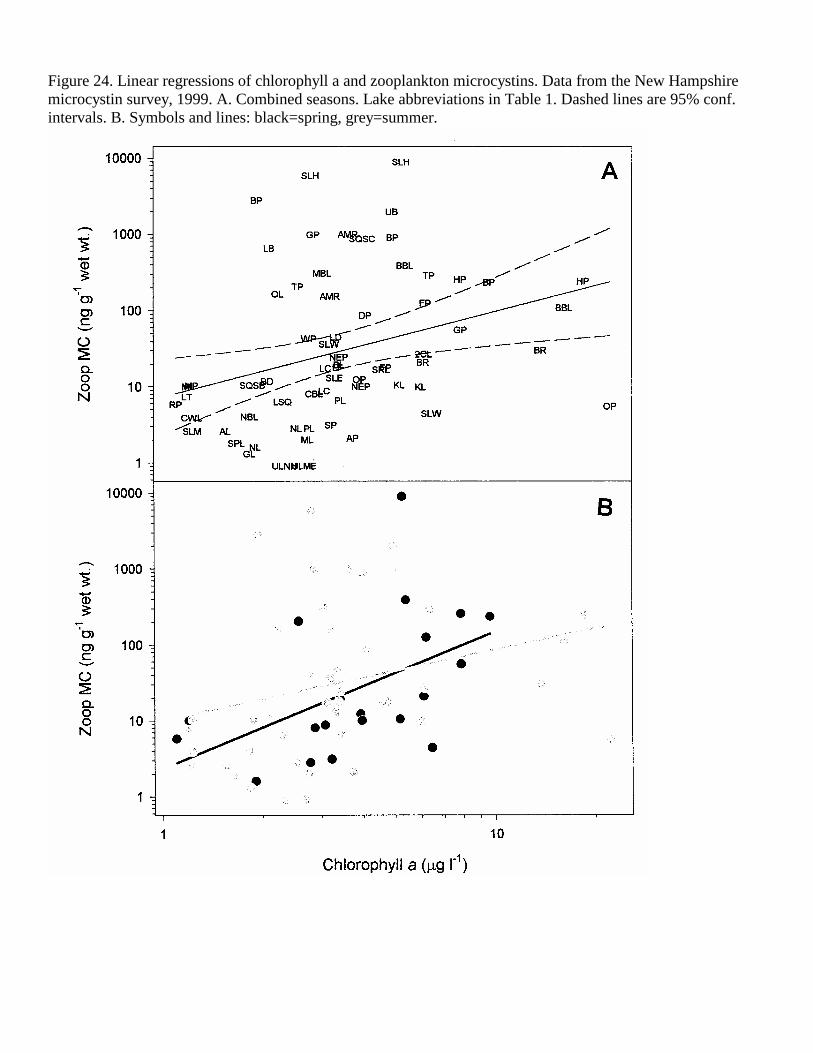
Figure 24. Linear regressions of chlorophyll a and zooplankton microcystins. Data from the New Hampshire microcystin survey, 1999. A. Combined seasons. Lake abbreviations in Table 1. Dashed lines are 95% conf. intervals. B. Symbols and lines: black=spring, grey=summer.

Figure 25. Linear regressions of chlorophyll a and whole lake water microcystins. Data from the New Hampshire microcystin survey, 1999-2000. A. Combined seasons. Lake abbreviations in Table 1. Dashed lines are 95% conf. intervals. B. Symbols and lines: black=spring, grey=summer.
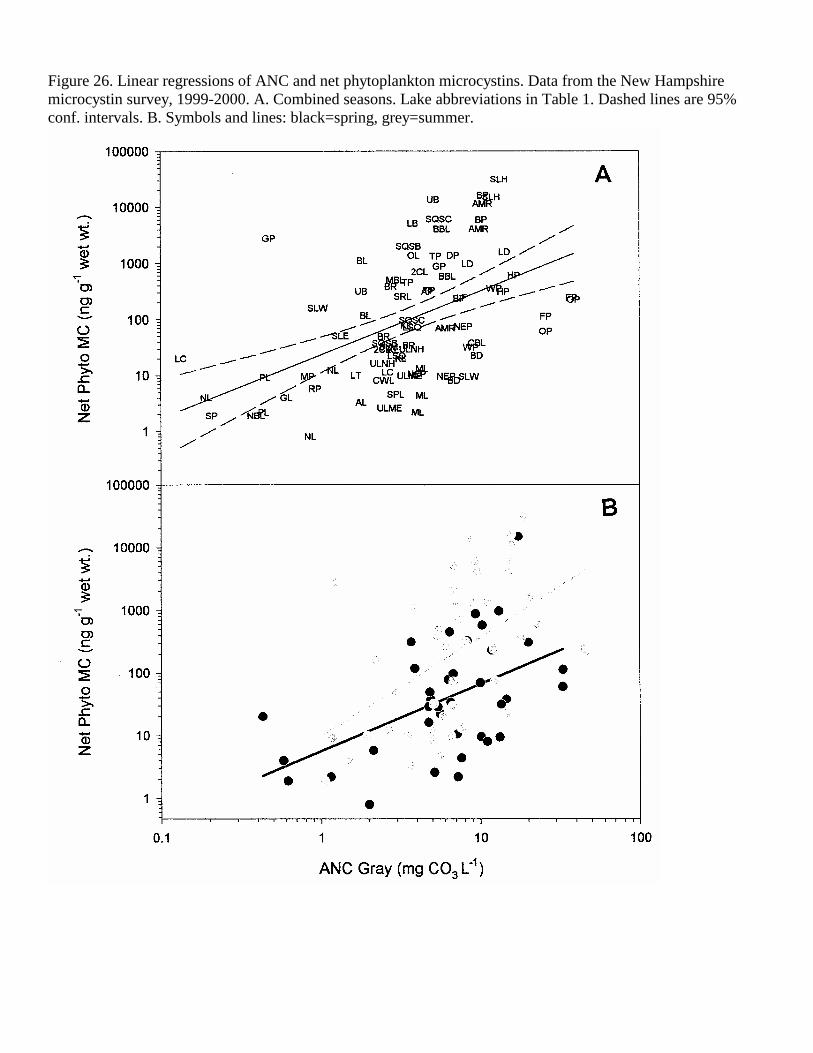
Figure 26. Linear regressions of ANC and net phytoplankton microcystins. Data from the New Hampshire microcystin survey, 1999-2000. A. Combined seasons. Lake abbreviations in Table 1. Dashed lines are 95% conf. intervals. B. Symbols and lines: black=spring, grey=summer.
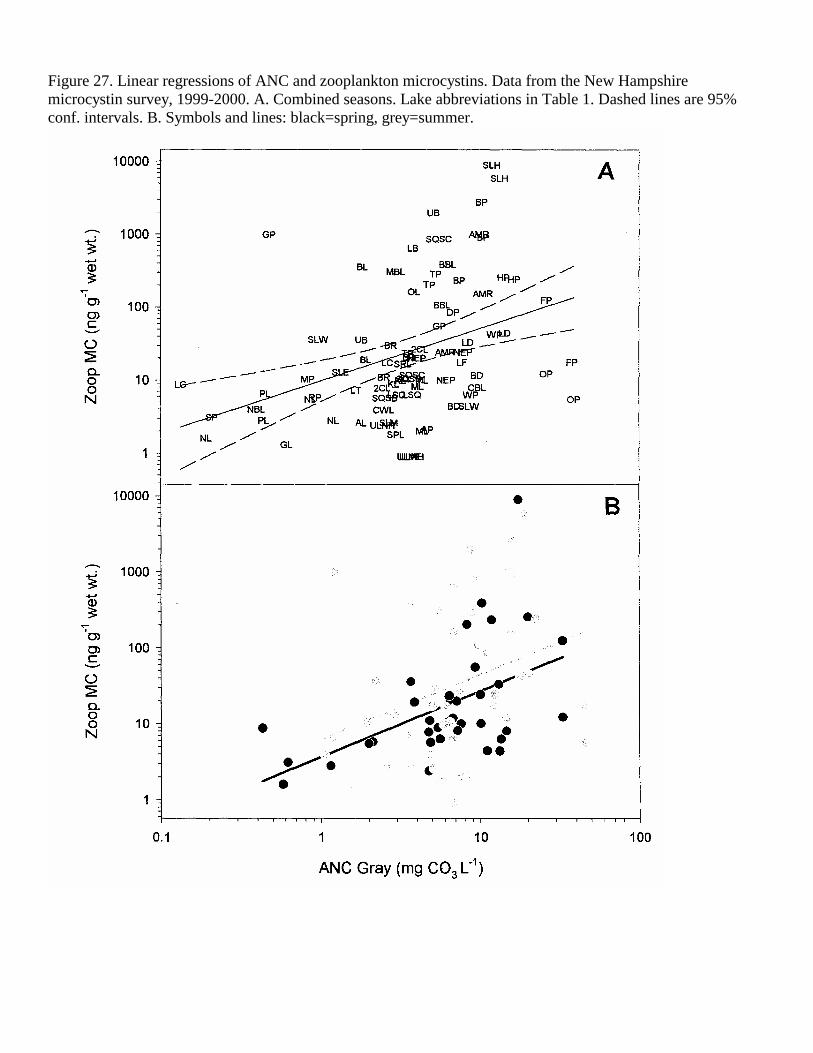
Figure 27. Linear regressions of ANC and zooplankton microcystins. Data from the New Hampshire microcystin survey, 1999-2000. A. Combined seasons. Lake abbreviations in Table 1. Dashed lines are 95% conf. intervals. B. Symbols and lines: black=spring, grey=summer.

Figure 28. Linear regressions of ANC and net phytoplankton microcystins (lake conc.). Data from the New Hampshire microcystin survey, 1999-2000. A. Combined seasons. Lake abbreviations in Table 1. Dashed lines are 95% conf. intervals. B. Symbols and lines: black=spring, grey=summer.

Figure 29. Linear regressions of ANC and zooplankton microcystins (lake conc.). Data from the New Hampshire microcystin survey, 1999-2000. A. Combined seasons. Lake abbreviations in Table 1. Dashed lines are 95% conf. intervals. B. Symbols and lines: black=spring, grey=summer.

Figure 30. Linear regressions of Secchi disk depth and whole lake water microcystins. Data from the New Hampshire microcystin survey, 1999-2000. A. Combined seasons. Lake abbreviations in Table 1. Dashed lines are 95% conf. intervals. B. Symbols and lines: black=spring, grey=summer.

Figure 31. Linear regressions of Secchi disk depth and net phytoplankton microcystins. Data from the New Hampshire microcystin survey, 1999-2000. A. Combined seasons. Lake abbreviations in Table 1. Dashed lines are 95% conf. intervals. B. Symbols and lines: black=spring, grey=summer.

Figure 32. Linear regressions of Secchi disk depth and zooplankton microcystins. Data from the New Hampshire microcystin survey, 1999-2000. A. Combined seasons. Lake abbreviations in Table 1. Dashed lines are 95% conf. intervals. B. Symbols and lines: black=spring, grey=summer.

Figure 33. Linear regressions of mean depth and whole lake microcystins. Data from the New Hampshire microcystin survey, 1999-2000. A. Combined seasons. Lake abbreviations in Table 1. Dashed lines are 95% conf. intervals. B. Symbols and lines: black=spring, grey=summer.

Figure 34. Linear regressions of mean depth and net phytoplankton microcystins. Data from the New Hampshire microcystin survey, 1999-2000. A. Combined seasons. Lake abbreviations in Table 1. Dashed lines are 95% conf. intervals. B. Symbols and lines: black=spring, grey=summer.
UNH – WRRC – J. Haney & M. Ikawa
60
Figure 35. Linear regressions of mean depth and zooplankton microcystins. Data from the New Hampshire microcystin survey, 1999-2000. A. Combined seasons. Lake abbreviations in Table 1. Dashed lines are 95% conf. intervals. B. Symbols and lines: black=spring, grey=summer.