Sinkhorn Label Allocation: Semi-Supervised Classification ...

EARSeL eProceedings 6, 1/2007 26
A SUPERVISED CLASSIFICATION OF MULTI-CHANNEL HIGH-RESOLUTION SAR DATA
Dirk Borghys1 and Christiaan Perneel
2
1. Royal Military Academy, Signal & Image Center, Brussels, Belgium;
Dirk.Borghys(at)rma.ac.be
2. Royal Military Academy, Dept. of Applied Mathematics, Brussels, Belgium
ABSTRACT
Many methods have been proposed in literature for the supervised classification of multi-channel
(polarimetric and/or multi-frequency) SAR data. Most of them are based on the extraction of a set
of features from the original SAR data. In this paper the influence of these features on the results
of the classification is examined in a quantitative manner. A set of multi-channel (P, L, C and X
band) SAR data was acquired by an airborne system over a site in Southern Europe. A ground-
truth mission defined the classes for learning and validation. A feature-based classification
method, based on logistic regression, is used for detecting each of the classes. Logistic regres-
sion combines the input features into a non-linear function, the logistic function, in order to distin-
guish that class from all others. For each class a „detection image‟, with a well-defined statistical
meaning, is obtained. The value at each pixel in the detection image represents the conditional
probability that the pixel belongs to that class, given all input features. The logistic regression is
performed using a step-wise method in which, at each step, the most discriminating feature is
added to the selected feature set, but only if its addition contributes significantly to the detection.
The logistic regression thus also performs a feature selection. Moreover, logistic regression al-
lows combining input data with very diverse statistical distributions.
The main aim of the current paper is to investigate the usefulness of each feature for the detec-
tion of the different classes.
Keywords: Polarimetric multi-channel SAR, supervised classification of SAR data.
INTRODUCTION
This article presents a method for supervised feature-based classification of multi-channel SAR
data and examines the influence of the different features on the classification performance. The
presented classification method was applied in a project on humanitarian demining. It was deliv-
ered as one of the tools that aim at helping a human operator to decide whether a region is po-
tentially mined or not. The experts of a Mine Action Centre defined relevant land-cover classes. A
set of multi-channel SAR data, including polarimetric and dual-pass interferometric data at differ-
ent frequencies was acquired using the E-SAR system of the German Aerospace Centre (DLR).
The images from different bands (P, L, C and X-band) cover the same region but each band has
a different spatial resolution. Geocoding information was also provided.
A ground survey mission collected the necessary ground truth information for each of the defined
classes.
For the classification of polarimetric SAR (POLSAR) images, several unsupervised approaches
have been proposed, based on various polarimetric decomposition methods (1). The most used
method is the decomposition of Cloude and Pottier (2). In this method the polarimetric information
is converted into three parameters (entropy H, angle and anisotropy A) to which the authors
have associated an elegant physical interpretation. They sub-divided the feature space formed by
the three parameters into regions that correspond to distinct scattering behaviours. However, the

EARSeL eProceedings 6, 1/2007 27
exact borders of these different regions depend on many factors. Different methods were sug-
gested to make these borders flexible.
In (3) the samples in the feature space, spanned by the three Cloude parameters, are regrouped
based on the complex Wishart distribution. In (4) a supervised classification method based on
neural networks and fuzzy logic is used to learn the class borders from the available learning
samples. The advantage of the approach is that other input features can be easily added in order
to increase the discrimination ability of the classification. In (4) the largest eigenvalue (1) of the
polarimetric coherence matrix and the interferometric coherence are added to the feature set.
In (5) a supervised classification is proposed based on the complex Wishart distribution of the
polarimetric covariance matrix. This method is regarded as the recommended method for super-
vised classification of polarimetric SAR data (6). The method can also be used for multi-frequency
SAR data.
However, it requires a one-to-one correspondence on pixel-level between the single-look complex
(SLC) data of all the used channels and it does not allow combining the covariance data with
other types of features such as textural features or backscattered intensity. Alberga (7) showed
that the approach based on the covariance matrix does provide important information about the
scatterers on the ground, but that extra information (e.g. backscatter amplitude or texture) can be
needed in order to distinguish complex classes.
This led us to the idea to develop an approach that allows taking into account a set of input fea-
tures with diverse statistical properties, representing for instance radiometric, polarimetric and
interferometric information. The developed approach combines feature selection with the combi-
nation of the features into a classification function.
The authors already developed (8) an approach based on logistic regression (LR), which consid-
ers each class separately and tries to distinguish it from all others by combining the input features
into a non-linear function, the logistic function. The method allows us to add features easily. For
each class, the logistic regression results in a "detection image", with a well-defined statistical
meaning: the value at each pixel in the detection image represents the conditional probability that
the pixel belongs to that class, given all input features. Moreover, the logistic regression implicitly
performs a feature selection. The authors chose to use logistic regression because the statistical
distribution of the used feature set is very diverse and the requirements for using LR are much
less strict than for other methods such as linear discriminant analysis or classical regression.
Other authors have dealt with this problem by developing classification methods based on fuzzy
logic (9) or neural networks (10,11).
In this paper a large feature set is created, consisting of the results of various polarimetric de-
composition methods, interferometric and polarimetric coherences, speckle reduced and original
SAR data, etc. The main aim of the paper is to investigate the usefulness of each of these fea-
tures for the detection of the different classes of interest. The paper is only concerned by the in-
fluence of the different features on the detection results for each class. For a discussion on the
obtained classification results or on the methods to combine the detection results into a classifica-
tion, the authors refer to earlier publications and in particular to (8). The developed classification
method was compared to a method based on neural networks (11) and results were found to be
similar. A detailed comparison is currently being performed and results will be submitted for publi-
cation.
THE DATASET
SAR data
The method was applied to a project on humanitarian demining (the SMART project) for which
SAR data at 4 different frequencies were acquired by the E-SAR system of the German Aero-
space Agency (DLR). P-band and L-band are full-polarimetric, dual-pass interferometric. For C-

EARSeL eProceedings 6, 1/2007 28
and X-band only VV-polarisation was acquired. All data were delivered as Single-Look Complex
(SLC) data as well as geocoded amplitude data. The pixel spacing in the SLC data of different
bands is not the same. Therefore, the DLR also provided geocoding matrices that enable one to
extract polarimetric and interferometric information using the SLC data and geocode the results
afterwards. Table 1 presents principal characteristics of the SAR data.
The test area is an agricultural area in the South of Croatia and covers approximately 2 km by 4
km.
Table 1: Overview of the principal characteristics of the SAR data set
Band Wavelength
(cm)
Polarization Size in pixels
(width × height)
Pixel Spacing
(range × azimuth)
P 70 HH, HV, VV 1410 × 5790 1.50 m × 0.70 m
L 23 HH, HV, VV 1452 × 9598 1.50 m × 0.43 m
C 5.6 VV 1456 × 11350 1.50 m × 0.36 m
X 3 VV 1455 × 11753 1.50 m × 0.35 m
Ground Truth
A field survey mission was organized to acquire ground truth, i.e. the relevant classes of land-
cover in the scene were determined and for each of them, examples were given. The ground truth
objects were then divided into a learning set and a validation set. Both sets contain around 200
objects (regions) from the test-site. The learning set is used for the optimization of the parameters
of the supervised classification. Table 2 shows the twelve classes used for the learning set for
this test-site.
The agricultural fields were subdivided into C8: “Fields without vegetation (FieldsNV)” and the
three types of crops that were visible at the time of image acquisition (barley, wheat and corn).
The class C1: “abandoned land” refers to formerly cultivated land that has been abandoned. The
class C6 can consist of single farms and was indicated as a region encircling the buildings. This
means it can contain buildings, parking lots, roads and paths between the buildings, open spaces
and trees. Agricultural fields in the region are often enclosed by hedges of large shrubs. This is
class C11. The shadow class (C12) represents the radar shadows.
Table 2: Classes of interest defined for the project
1 Abandoned 4 Wheat 7 Roads 10 Water
2 Pastures 5 Corn 8 FieldsNV 11 Hedges
3 Barley 6 Residential 9 Forests 12 Shadows
THE DERIVED FEATURE SET
From the available SAR data, 80 features were derived. All features, except the line detector re-
sults, were determined on the SLC slant-range data and results geocoded. For features deter-
mined using a sliding window, a 5x5 window was used.
Radiometric Information
The considered radiometric information consists of:
original amplitude data for each channel (8 features),
speckle-reduced log-intensity data of each frequency and each polarisation (8 features).
The speckle reduction method (12) combines a context-based, locally adaptive, wavelet

EARSeL eProceedings 6, 1/2007 29
shrinkage and Markov Random Fields to limit blurring of edges, by incorporating prior
knowledge about possible edge configurations.
Figures 1 and 2 show respectively the original SAR data of part of the scene and the same re-
gions after applying the speckle reduction.
Figure 1: Original SAR images: left:L-band, right: P-band (R:HH, G:HV, B:VV)
Figure 2: Speckle reduced SAR images. Left: L-band, right: P-band (R:HH, G:HV, B:VV)
Polarimetric Information
Different polarimetric decomposition methods were applied to the P- and L-band data. Decompo-
sition methods combine the polarimetric information in a way that allows inferring information
about the type of scattering produced by the elements on the ground on the radar waves. The
most well known method is the Cloude & Pottier (2) decomposition. Several parameters were de-
rived from their method: entropy H, scattering angle combinations of the entropy H and anisot-
ropy A: HA, H(1-A), (1-H)A and (1-H)(1-A) and the value of the largest eigenvalue of the po-
larimetric coherency matrix, 1 (14 features).
EARSeL eProceedings 6, 1/2007 30
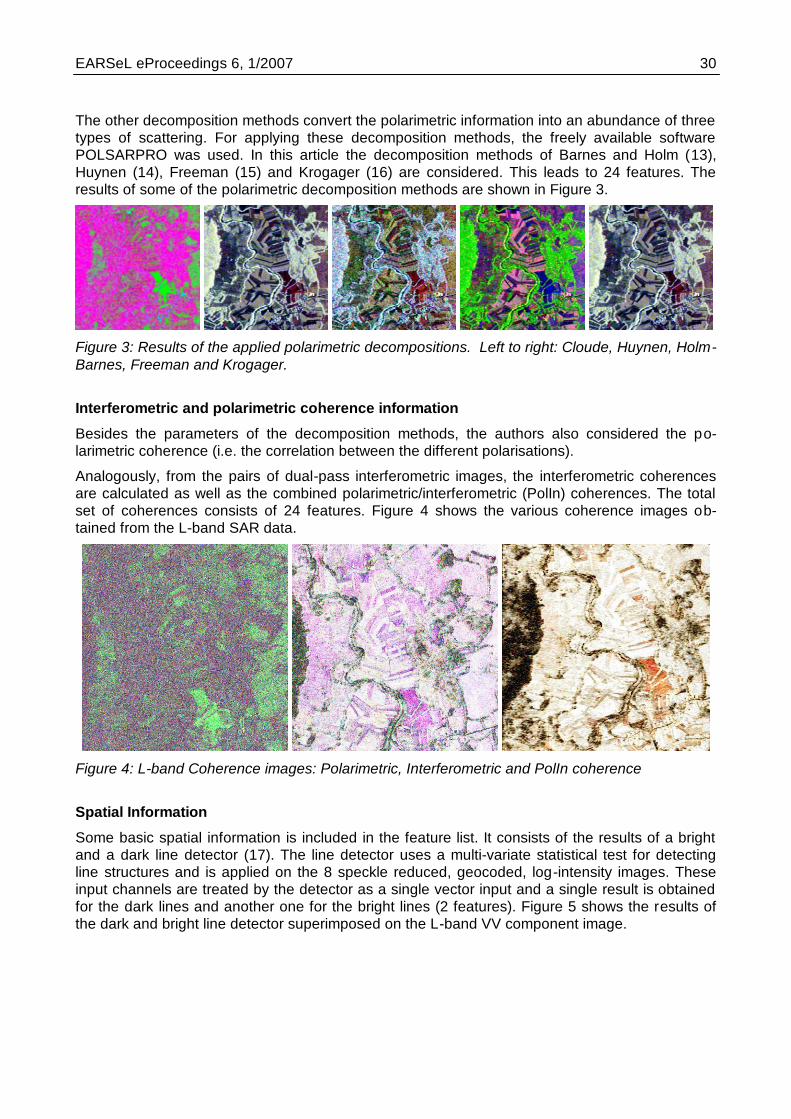
The other decomposition methods convert the polarimetric information into an abundance of three
types of scattering. For applying these decomposition methods, the freely available software
POLSARPRO was used. In this article the decomposition methods of Barnes and Holm (13),
Huynen (14), Freeman (15) and Krogager (16) are considered. This leads to 24 features. The
results of some of the polarimetric decomposition methods are shown in Figure 3.
Figure 3: Results of the applied polarimetric decompositions. Left to right: Cloude, Huynen, Holm-
Barnes, Freeman and Krogager.
Interferometric and polarimetric coherence information
Besides the parameters of the decomposition methods, the authors also considered the po-
larimetric coherence (i.e. the correlation between the different polarisations).
Analogously, from the pairs of dual-pass interferometric images, the interferometric coherences
are calculated as well as the combined polarimetric/interferometric (PolIn) coherences. The total
set of coherences consists of 24 features. Figure 4 shows the various coherence images ob-
tained from the L-band SAR data.
Figure 4: L-band Coherence images: Polarimetric, Interferometric and PolIn coherence
Spatial Information
Some basic spatial information is included in the feature list. It consists of the results of a bright
and a dark line detector (17). The line detector uses a multi-variate statistical test for detecting
line structures and is applied on the 8 speckle reduced, geocoded, log-intensity images. These
input channels are treated by the detector as a single vector input and a single result is obtained
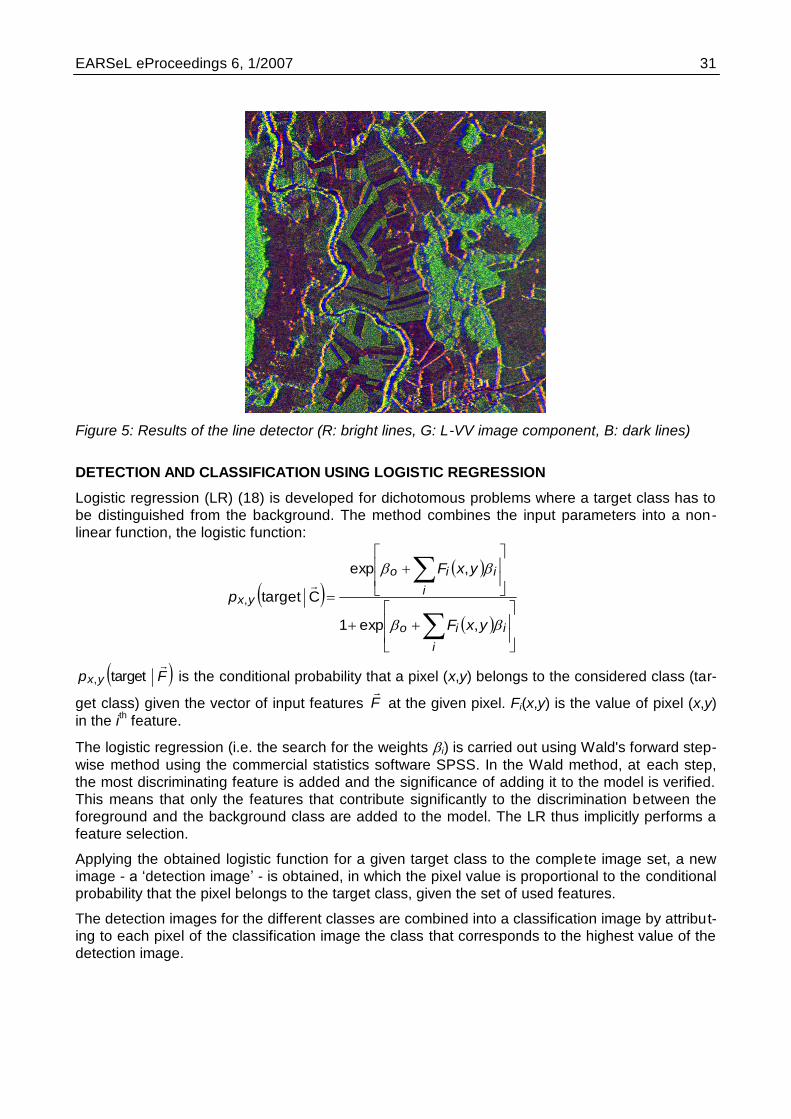
for the dark lines and another one for the bright lines (2 features). Figure 5 shows the results of
the dark and bright line detector superimposed on the L-band VV component image.
EARSeL eProceedings 6, 1/2007 31
Figure 5: Results of the line detector (R: bright lines, G: L-VV image component, B: dark lines)
DETECTION AND CLASSIFICATION USING LOGISTIC REGRESSION
Logistic regression (LR) (18) is developed for dichotomous problems where a target class has to
be distinguished from the background. The method combines the input parameters into a non-
linear function, the logistic function:
i
iio
i
iio
yx
yxF
yxF
p
,exp1
,exp
Ctarget,
Fp yx
target, is the conditional probability that a pixel (x,y) belongs to the considered class (tar-
get class) given the vector of input features F
at the given pixel. Fi(x,y) is the value of pixel (x,y)
in the ith feature.
The logistic regression (i.e. the search for the weights i) is carried out using Wald's forward step-
wise method using the commercial statistics software SPSS. In the Wald method, at each step,
the most discriminating feature is added and the significance of adding it to the model is verified.
This means that only the features that contribute significantly to the discrimination between the
foreground and the background class are added to the model. The LR thus implicitly performs a
feature selection.
Applying the obtained logistic function for a given target class to the complete image set, a new
image - a „detection image‟ - is obtained, in which the pixel value is proportional to the conditional
probability that the pixel belongs to the target class, given the set of used features.
The detection images for the different classes are combined into a classification image by attribut-
ing to each pixel of the classification image the class that corresponds to the highest value of the
detection image.
EARSeL eProceedings 6, 1/2007 32
RESULTS AND DISCUSSION
The logistic regression was applied to find the best combination of several subsets of features. In
order to compare the adequateness of each combination of features, each time the overall detec-
tion accuracy was determined for the different classes.
The subsets that were considered are:
the full feature set
all features leaving out the speckle reduced, the original amplitude and the interferometric
data, respectively
only the features derived from the L-band and P-band data, respectively
only features derived from the Cloude & Pottier (CP) decomposition as polarimetric data
for each of the other decomposition methods results were derived when the method is
omitted from the feature set and when it is combined with the CP method
Table 3 presents the detection accuracy obtained by the logistic regression on the learning set.
Results are shown for the different classes, for each of the defined subsets of features. In gen-
eral, not using the speckle-reduced data degrades the detection performance. While the speckle
reduction adds important information for the classifier, the original amplitude data are not useful.
The interferometric information only affects the results for the classes residential and wheat. Hav-
ing only P- or L-band data degrades the results for almost all classes. For abandoned land,
wheat, corn and residential areas, the P-band information is most important. For pastures, barley,
roads, fields without vegetation, forests and hedges, the L-band information is most important.
It is very hard to derive a conclusion about the influence of the different polarimetric decomposi-
tion methods. From this table, all methods seem equivalent for most of the classes.
Tables 4-6 present an overview of the features that are selected by the logistic regression when
the full set of features is given as input. The tables give results for each separate feature and for
each class. The three tables represent three subsets of features, i.e. radiometric and spatial in-
formation, coherence information and polarimetric information. The bottom row of each table,
labelled “# Selec.”, counts the number of classes for which each feature is selected. The columns
labelled “# features” count the number of features that were selected by the logistic regression for
distinguishing each class from the others in each of the subsets of features. The second column
of Table 4 shows the total number of features that was selected for distinguishing each class from
the others. The values in the table, corresponding to class/feature combinations, represent the
order in which the different parameters were selected by the iterations of the step-wise logistic
regression (e.g. for roads the first selected parameter is the HV polarised P-band original ampli-
tude channel). As the logistic regression selects the features in decreasing significance for class
detection, this number gives important information on the relevance of the features for detection.
Apparently most of the features were selected for at least one of the classes. The total number of
selected features varies from 10 (for water and pastures) to 25 (for barley and wheat). Although
one would expect the original amplitude data to be redundant with the speckle-reduced data, for
most of the classes, combinations of both were selected. Exceptions are pastures, water and
forests where only one of the two types of radiometric information is used.
The line detector results were selected for each class except water. Spatial information thus
seems to be important.
Although, from the analysis in Table 3, the interferometric coherence parameters do not seem to
influence the overall detection accuracy, they are selected for the majority of classes. From the
coherence parameters, the interferometric coherence parameters are the most selected; the po-
larimetric coherence is only very rarely selected.

EARSeL eProceedings 6, 1/2007 33
Table 3: Detection results (overall detection accuracy in %) for the different classes and for the
various defined sub-sets of features
Abandoned
Pastu
res
Barley
Wheat
Corn
Resid
ential
Roads
Fie
ldsN
V
Fore
sts
Wate
r
Hedges
Shadow
s
1 2 3 4 5 6 7 8 9 10 11 12
All 86.6 84.1 98.2 95.2 86.1 91.7 94.2 91.6 99.8 99.1 93.8 98.1
No Speckle Red 85.7 84.5 95.4 93.9 84.3 89.2 91.2 90.7 99.5 99.2 88.7 96.8
No Amplitude 87.2 84.8 98.2 96.7 86.2 91.5 94.6 91.5 99.5 99.4 94.5 98.2
No Interferometry 87.2 84.3 99.2 94.9 86.1 90.0 94.8 91.3 99.7 99.3 93.7 98.4
Only Lband 80.6 83.6 97.8 85.5 77.5 80.1 90.5 90.8 99.5 99.0 90.8 94.2
Only Pband 84.1 79.9 88.5 90.6 79.2 88.3 82.4 84.1 95.9 98.3 89.5 89.7
Only CP 86.1 85.3 98.7 95.7 84.8 90.7 94.8 89.8 99.5 99.4 93.8 97.3
No CP 87.4 84.4 98.1 95.5 86.1 89.4 94.1 90.6 99.5 99.4 93.6 97.7
No Barnes 87.4 85.3 98.8 95.4 86.1 91.3 94.4 92.2 99.9 99.5 94.4 98.4
No Freeman 87.6 85.7 98.9 95.3 86.8 92.0 94.3 92.7 99.9 99.2 93.9 97.4
No Holms 87.6 85.9 99.2 96.3 87.7 92.0 94.9 91.6 99.4 99.3 94.5 98.7
No Huynen 87.6 86.2 98.8 95.4 87.4 91.8 94.9 91.6 99.4 99.2 94.5 98.6
No Krogager 87.8 85.3 98.5 96.7 87.4 91.6 94.2 92.3 99.4 99.3 94.5 98.1
CP+Barnes 87.7 84.9 97.4 95.8 87.3 91.5 94.2 90.7 99.6 99.4 93.9 97.0
CP+Freeman 86.6 84.3 98.8 95.6 86.4 90.8 95.0 90.2 99.4 99.5 94.7 97.2
CP+Holms 86.7 85.0 98.7 95.6 86.3 90.8 94.7 91.5 99.5 99.4 94.4 97.5
CP+Huynen 86.4 85.3 98.3 95.8 86.4 92.0 94.6 91.6 99.5 99.4 94.3 97.4
CP+Krogager 86.5 85.0 98.7 95.8 86.3 90.7 95.4 92.1 99.5 99.6 94.3 97.8
Most of the polarimetric decomposition parameters were selected for at least one class. It seems
that more of these parameters are used in L-band. L-band parameters were selected 54 times
while the P-band parameters appear only 42 times. This can be explained by the fact that the
backscattering mechanisms for the different classes are more discriminative at the shorter wave-
length of the L-band (23 cm). The Holm decomposition is the least selected. The “spherical scat-
tering” of Krogager was never selected. These results require a further analysis. In particular, it
could be interesting to investigate the order in which the features are selected in the iterative LR
process and how the feature selection changes when different sub-sets of features are given as
input to the LR or to investigate the discrimination of the classes two-by-two.
CONCLUSION
A method for feature-based supervised classification, using logistic regression (LR), is presented.
The method is applied on a set of multi-channel SAR data. Twelve classes were defined. The
method is applied to discriminate each class from all others. A large feature set was determined.
The main topic of the paper was to investigate the influence of these features on the overall de-
tection accuracy and to use the feature selection property of the logistic regression to investigate
the selection of parameters for the different classes. Most parameters seem relevant for at least
one class. For the different polarimetric decomposition methods some seem much more effective
than others. The interferometric coherence is more important than the polarimetric or the com-
bined polarimetric/interferometric coherence. It could be useful to expand the feature set with new
PolInSAR features such as proposed in 19 and 20. It is important to add spatial information to the
feature set. This was done here by means of the results of line detectors. Other types of spatial

EARSeL eProceedings 6, 1/2007 34
operators (e.g. texture parameters) should be examined. The obtained results need to be ana-
lysed further. In particular, it could be interesting to investigate how the feature selection changes
when different sub-sets are given as input to the LR or to investigate the discrimination of the
classes two-by-two.
The presented analysis is based on only one dataset. Results are likely to depend on the classes
present in the scene, the environmental conditions (e.g. moisture) and topography and therefore
a generalisation is not straightforward. So, it would be interesting to apply a similar analysis on
several datasets. However, it is very difficult to obtain a comprehensive SAR dataset together
with detailed ground truth. A joined effort of the SAR community for establishing a test database
would be very welcome.
Table 4: Overview of selected radiometric and spatial parameters.
HH
HV
VV
HH
HV
VV
VV
VV
HH
HV
VV
HH
HV
VV
VV
Bright
Dark
C X X
Abandoned 20 9 11 10 13 14 15 12 20 1 3
Pastures 10 3 7 6 3
Barley 25 9 18 9 15 10 14 6 3 7 16
Wheat 25 10 23 7 17 24 25 22 9 4 6 1
Corn 17 8 10 17 7 14 13 11 9 12
Resi 23 7 18 1 2 6 23 17 10
Roads 17 8 2 6 1 16 4 14 7 5
FieldsNV 15 5 3 8 12 11 10
Forests 11 3 1 7 5
Water 10 5 6 9 6 3 7
Hedges 13 4 3 2 13 1
Shadows 16 5 11 12 13 14 3
# Selec. 4 5 5 4 3 4 5 5 5 3 5 4 4 5 2 6 7
Speckle Reduction Original Amplitude LineDet
PTot.
# F
eatu
res
# F
eatu
res
AllL P L
Table 5: Overview of selected coherence parameters.
HH
HV
VV
HH
HV
VV
HH
/HV
HH
/VV
VV
/HV
HH
/HV
HH
/VV
VV
/HV
HH
/HV
HH
/VV
VV
/HV
HH
/HV
HH
/VV
VV
/HV
Abandoned 3 2 6 19
Pastures 3 2 9 4
Barley 3 17 1 24
Wheat 4 10 8 5 11
Corn 3 5 8 16
Resi 4 7 4 16 22
Roads 4 11 8 16 10
FieldsNV 1 9
Forests 3 4 2 8
Water 0
Hedges 2 5 12
Shadows 0
# Selec. 5 2 5 2 4 4 0 2 1 2 0 1 0 1 0 0 1 0
# F
eatu
res
Pol/Int Polarimetric
L P L P L P
Interferometric
Coherence Measurements

EARSeL eProceedings 6, 1/2007 35
Table 6: Overview of selected polarimetric decomposition parameters.
1
H HA
H(1
-A)
(1-H
)A
(1-H
)(1-A
)
1
H HA
H(1
-A)
(1-H
)A
(1-H
)(1-A
)
T11
T22
T33
T11
T22
T33
Abandoned 8 16 8
Pastures 4 5 10
Barley 13 8 11 4 2 5 21 19
Wheat 11 2 20 21
Corn 6 7 2 4
Resi 12 5 11 15 13 14 19 8 3
Roads 5 13 9 15 3
FieldsNV 9 2 1 5 4
Forests 5 10 6
Water 5 1 4 8 10
Hedges 7 7 11 10 9 6
Shadows 11 16 2 9 4 15
# Selec. 2 3 4 3 2 4 5 4 1 2 1 1 1 1 1 3 3 4 2 2
Dbl
Odd
Vol
Dbl
Odd
Vol
T11
T22
T33
T11
T22
T33
T11
T22
T33
T11
T22
T33
Kd
Kh
Ks
Kd
Kh
Ks
Abandoned 18 4 9 17 5 7
Pastures 8 1
Barley 1 24 22 25 20 26
Wheat 15 14 12 13 18 19 16 3
Corn 3 1 15
Resi 9 20 12 21
Roads 12
FieldsNV 14 7 13 6 15
Forests 9 11 3
Water 2
Hedges 4 8
Shadows 7 6 1 5 8 10
# Selec. 4 1 4 4 3 4 1 3 0 0 2 0 4 1 0 0 3 1 4 2 0 5 1 0
Cloude Barnes
L P
L
Freeman Holm Huynen
L P L P P
L P
L P
Krogager
# F
eatu
res
ACKNOWLEDGEMENTS
The presented research is the result of a collaboration between several projects: a Belgian De-
fense project (F00/07) on Semi-automatic Interpretation of SAR Images; Advanced SAR Tech-
nologies (ASARTECH), funded by the Belgian Science Policy (project no. SR/00/04) and Space
and Airborne Mined Area Reduction Tools (SMART), funded by the European Commission (pro-
ject no. IST-2000-25044). M. Keller of the German Aerospace Center DLR provided the interfer-
ometric coherences. A. Pizurica of Ghent University provided the speckle reduction routines. All
images were provided by DLR in the frame of the SMART project.
REFERENCES
1 Cloude S R & E Pottier, 1996. A review of target decomposition theorems in radar polarime-
try. IEEE Transactions on Geoscience and Remote Sensing, 34: 498-518
EARSeL eProceedings 6, 1/2007 36
2 Cloude S R & E Pottier, 1997. An entropy based classification scheme for land applications
of polarimetric SAR. IEEE Transactions on Geoscience and Remote Sensing, 35: 68-78
3 Lee J, M Grunes, T Ainsworth, L Du, D Schuler & S Cloude, 1999. Unsupervised classifica-
tion using polarimetric decomposition and the complex Wishart classifier. IEEE Transactions
on Geoscience and Remote Sensing, 37, 2249-2257
4 Hellmann M, 2000, Classification of fully polarimetric SAR-data for carthographic applica-
tions. PhD Thesis, Fakultät Elektrotechnik der Technischen Universität Dresden, Dresden.
Deutsches Zentrum für Luft- und Raumfahrt (DLR), Research Report no. 2000-19, 170 pp.
5 Lee J, M Grunes & G de Grandi, 1999. Polarimetric SAR speckle filtering and its implication
for classification, IEEE Transactions on Geoscience and Remote Sensing, 37: 2363-2373
6 Rodrigues A, D G Corr, E Pottier, F Ferro-Famil & D Hoekman, 2003. Land cover classifica-
tion using polarimetric SAR data. POLinSAR 2003, (ESA-ESRIN, Frascati) 10 pp.
7 Alberga V., 2003. Comparison of polarimetric methods in image classification and SAR inter-
ferometry applications. PhD thesis, Fakultät für Elektrotechnik und Informationstechnik der
Technischen Universität at Chemnitz, Dresden. Deutsches Zentrum für Luft- und Raumfahrt
(DLR), Research Report No. 2004-05, 195 pp.
8 Borghys D, Y Yvinec, C Perneel, A Pizurica & W Philips, 2006. Supervised feature-based
classification of multi-channel SAR images, Pattern Recognition Letters, Special issue on
pattern recognition for remote sensing, 27(4): 252-258
9 Corr DG, A Walker, U Benz, I Lingenfelder & A Rodrigues, 2003. Classification of urban SAR
imagery using object oriented techniques. Proceedings of IGARSS‟03 (Toulouse, France, 21-
25 July) 188-190
10 Chen K S, W P Huang, D H Tsay & F Amar, 1996. Classification of multi-frequency SAR im-
agery using a dynamic learning neural network. IEEE Transactions on Geoscience and Re-
mote Sensing, 34(3): 814-820
11 Alberga V, G Satalino & D K Staykova, 2006. Polarimetric SAR observables for land cover
classification: analyses and comparisons. In: SAR Image Analysis, Modeling, and Techniques
VIII, edited by C Notarnicola, S R J Axelsson & F Posa. Proceedings of SPIE. 6363: 636305
12 Pizurica A, W Philips, I Lemahieu & M Acheroy, 2001. Despeckling SAR images using wave-
lets and a new class of adaptive shrinkage estimators, In: Proceedings IEEE 2001 Confe-
rence on Image Processing, 2: 233-236
13 Holm W & R M Barnes 1988. On radar polarization mixed target state decomposition tech-
niques In: IEEE Proceedings 1988 National Radar Conference (Ann Arbor, MI, USA) pp 249-
254
14 Huynen J R,1970. Phenomenological Theory of Radar Targets. PhD thesis, University of
Technology, Delft, The Netherlands
15 Freeman A & S L Durden, 1997. A three-component scattering model for polarimetric SAR
data. IEEE Transactions on Geoscience and Remote Sensing, 36(1), 68-78
16 Krogager E, 1993. Aspects of polarimetric radar imaging. PhD Thesis, Technical University of
Denmark, Electromagnetics Institute
17 Borghys D, A Pizurica, C Perneel & W Philips, 2003. Combining multi-variate statistics and
speckle reduction for line detection in multi-channel SAR images. In: Proceedings of SAR
Image Analysis, Modeling, and Techniques VI, edited by F Posa. Proceedings of SPIE, 5236:
93-104

EARSeL eProceedings 6, 1/2007 37
18 Hosmer D & S Lemeshow, 2000. Applied Logistic Regression, 2nd
Edition (John Wiley & Sons
Inc, New York) 375 pp.
19 Neumann M, A Reigber & L Ferro-Famil, 2005. Data classification based on PolInSAR coher-
ence shapes. Proceedings IGARSS‟05 (Seoul, Korea) 4852–4855
20 Lee J S, M R Grunes, T Ainsworth, I Hajnsek, T Mette & K P Papathanassiou, 2005. Forest
classification based on L-band polarimetric and interferometric SAR data. POLInSAR 2005
(ESA-ESRIN, Frascati) 7 pp.