A Summary of Visual Gaze and Dwell Times for Army Pilots ... · A Summary of Visual Gaze and Dwell...
68
A Summary of Visual Gaze and Dwell Times for Army Pilots During Mission Simulations by Jamison S. Hicks, Michael Sage Jessee, and David B. Durbin ARL-TR-5900 February 2012 Approved for public release; distribution is unlimited.
-
Upload
nguyenkhue -
Category
Documents
-
view
223 -
download
1
Transcript of A Summary of Visual Gaze and Dwell Times for Army Pilots ... · A Summary of Visual Gaze and Dwell...
A Summary of Visual Gaze and Dwell Times for Army Pilots
During Mission Simulations
by Jamison S. Hicks, Michael Sage Jessee, and David B. Durbin
ARL-TR-5900 February 2012 Approved for public release; distribution is unlimited.

NOTICES
Disclaimers The findings in this report are not to be construed as an official Department of the Army position unless so designated by other authorized documents. Citation of manufacturer’s or trade names does not constitute an official endorsement or approval of the use thereof. Destroy this report when it is no longer needed. Do not return it to the originator.

Army Research Laboratory Aberdeen Proving Ground, MD 21005-5425
ARL-TR-5900 February 2012 A Summary of Visual Gaze and Dwell Times for Army Pilots
During Mission Simulations
Jamison S. Hicks, Michael Sage Jessee, and David B. Durbin Human Research and Engineering Directorate
Approved for public release; distribution is unlimited.

ii
REPORT DOCUMENTATION PAGE Form Approved OMB No. 0704-0188
Public reporting burden for this collection of information is estimated to average 1 hour per response, including the time for reviewing instructions, searching existing data sources, gathering and maintaining the data needed, and completing and reviewing the collection information. Send comments regarding this burden estimate or any other aspect of this collection of information, including suggestions for reducing the burden, to Department of Defense, Washington Headquarters Services, Directorate for Information Operations and Reports (0704-0188), 1215 Jefferson Davis Highway, Suite 1204, Arlington, VA 22202-4302. Respondents should be aware that notwithstanding any other provision of law, no person shall be subject to any penalty for failing to comply with a collection of information if it does not display a currently valid OMB control number. PLEASE DO NOT RETURN YOUR FORM TO THE ABOVE ADDRESS. 1. REPORT DATE (DD-MM-YYYY)
February 2012 2. REPORT TYPE
Final 3. DATES COVERED (From - To)
January 2011–September 2011 4. TITLE AND SUBTITLE
A Summary of Visual Gaze and Dwell Times for Army Pilots During Mission Simulations
5a. CONTRACT NUMBER
5b. GRANT NUMBER
5c. PROGRAM ELEMENT NUMBER
6. AUTHOR(S)
Jamison S. Hicks, Michael Sage Jessee, and David B. Durbin 5d. PROJECT NUMBER
62716AH70 5e. TASK NUMBER
5f. WORK UNIT NUMBER
7. PERFORMING ORGANIZATION NAME(S) AND ADDRESS(ES)
U.S. Army Research Laboratory ATTN: RDRL-HRM-D Aberdeen Proving Ground, MD 21005-5425
8. PERFORMING ORGANIZATION REPORT NUMBER
ARL-TR-5900
9. SPONSORING/MONITORING AGENCY NAME(S) AND ADDRESS(ES)
10. SPONSOR/MONITOR’S ACRONYM(S) PEO Aviation 11. SPONSOR/MONITOR'S REPORT NUMBER(S)
12. DISTRIBUTION/AVAILABILITY STATEMENT
Approved for public release; distribution is unlimited.
13. SUPPLEMENTARY NOTES
14. ABSTRACT
The U.S. Army Research Laboratory, Human Research and Engineering Directorate (ARL HRED) uses engineering helicopter simulators to assess crewstation design for Army Aviation aircraft. This report summarizes pilot (PI) visual gaze and dwell times obtained during operational missions conducted with seven engineering simulators. The data were obtained from pilots wearing a head and eye tracker during the simulations to identify if the crewstation design caused significant heads down time during missions. The visual gaze and dwell times for each simulator were compared to the other simulators. Analysis of visual gaze and dwell times will continue to play a meaningful role in the assessment and future development of Army Aviation systems. 15. SUBJECT TERMS
visual gaze, dwell time, head and eye tracker, Army aviation simulation
16. SECURITY CLASSIFICATION OF: 17. LIMITATION OF ABSTRACT
UU
18. NUMBER OF PAGES
68
19a. NAME OF RESPONSIBLE PERSON Jamison S. Hicks
a. REPORT
Unclassified b. ABSTRACT
Unclassified c. THIS PAGE
Unclassified 19b. TELEPHONE NUMBER (Include area code) 334-255-2206
Standard Form 298 (Rev. 8/98) Prescribed by ANSI Std. Z39.18
iii
Contents
List of Figures v
List of Tables vii
1. Introduction and Background 1
1.1 Purpose ............................................................................................................................1
1.2 Basic Anatomy and Function of the Eye .........................................................................1
1.3 Head and Eye Tracker System ........................................................................................1
1.4 Limitations of a Head and Eye Tracker ...........................................................................5
1.5 Army Aviation Engineering Helicopter Simulators ........................................................5
1.6 AH-64D Apache Longbow Aircraft Description ............................................................6
1.6.1 AH-64D RACRS Simulator Description ............................................................7
1.7 ARH Aircraft Description ...............................................................................................8
1.7.1 ARH BHIVE 2 Simulator Description ................................................................8
1.8 OH-58F CASUP Aircraft Description ............................................................................9
1.8.1 OH-58F CASUP BHIVE 2 Simulator Description ...........................................10
1.9 UH-60M Aircraft Description .......................................................................................10
1.9.1 UH-60M BHIVE 1 Simulator Description ........................................................11
1.9.2 UH-60M SIL Simulator Description .................................................................12
1.10 CH-47F Aircraft Description.........................................................................................12
1.10.1 CH-47F Simulator Description .........................................................................12
1.11 TAIS Description ..........................................................................................................13
1.11.1 TAIS Cockpit Simulation Description ..............................................................13
1.12 Air SS Description.........................................................................................................13
1.12.1 Air SS EUD Simulator Description ...................................................................14
2. Method 14
2.1 Mission Descriptions and Setup ....................................................................................14
2.2 Data Analysis ................................................................................................................15
3. Results 15
3.1 AH-64D Eye Tracker Results ........................................................................................15

iv
3.2 ARH Eye Tracker Results .............................................................................................19
3.3 OH-58F Eye Tracker Results ........................................................................................20
3.4 UH-60M Eye Tracker Results .......................................................................................22
3.4.1 UH-60M LEUE BHIVE 1 Eye Tracker Results ...............................................22
3.4.2 UH-60M EUD BHIVE 1 Eye Tracker Results .................................................23
3.4.3 UH-60M LUT SIL Eye Tracker Results ...........................................................24
3.4.4 UH-60M Block III EUD Results .......................................................................26
3.5 CH-47F HSDH Demonstration Results ........................................................................30
3.5.1 Fixation Duration ..............................................................................................33
3.5.2 Saccadic Extent .................................................................................................33
3.5.3 Fixation Frequency ............................................................................................34
3.5.4 Blink Frequency ................................................................................................34
3.5.5 HSD Visual Gaze Analysis ...............................................................................35
3.5.6 RAD ALT Visual Gaze Analysis ......................................................................36
3.5.7 VSI Visual Gaze Analysis .................................................................................37
3.5.8 CH-47F HSDH Visual Gaze Conclusions .........................................................38
3.6 Air SS EUD Results ......................................................................................................39
3.6.1 Visual Gaze During Navigation ........................................................................39
3.6.2 Ocular Activity Analyses During DVE Approaches .........................................41
3.7 TAIS SA into the Cockpit Results ................................................................................42
3.8 Comparison of Eye Tracker Data ..................................................................................46
4. Conclusions 48
4.1 Conclusions ...................................................................................................................48
5. References 50
List of Symbols, Abbreviations, and Acronyms 52
Distribution List 55

v
List of Figures
Figure 1. Anatomy of the eye (National Eye Institute no. NEA05). ..............................................2
Figure 2. ASL eye tracker. ..............................................................................................................2
Figure 3. Control panel interface. ...................................................................................................3
Figure 4. Dot coordinate plane........................................................................................................4
Figure 5. AOI. .................................................................................................................................4
Figure 6. AH-64D Apache Longbow cockpit and displays. ...........................................................7
Figure 7. RACRS cockpit simulator. ..............................................................................................8
Figure 8. Bagram, Afghanistan visual database. .............................................................................9
Figure 9. ARH BHIVE 2 cockpit and simulator. ............................................................................9
Figure 10. OH-58F CASUP cockpit simulator. ............................................................................10
Figure 11. UH-60M BHIVE 1 configuration. ...............................................................................11
Figure 12. UH-60M SIL cockpit view. .........................................................................................12
Figure 13. CPG visual gaze and dwell times during AH-64D VUIT-2 missions. ........................16
Figure 14. CPG visual gaze and dwell times during AH-64D IUAS missions. ...........................17
Figure 15. PI visual dwell times estimates for all AH-64D UAS missions. ..................................17
Figure 16. Visual gaze and dwell times during baseline AH-64D missions (non-UAS mission). ...................................................................................................................................18
Figure 17. Estimated PI visual dwell times during all AH-64D missions. ...................................19
Figure 18. Graphical representation of ARH PI visual gaze and dwell times. .............................20
Figure 19. Graphical representation of OH-58F PI visual gaze and dwell times. .........................21
Figure 20. Graphical representation of OH-58F CP visual gaze and dwell times. .......................21
Figure 21. Graphical representation of UH-60M LEUE eye tracker results. ...............................23
Figure 22. Graphical representation of UH-60M EUD eye tracker results. .................................24
Figure 23. Graphical representation of UH-60M LUT eye tracker results (flying PI). ................25
Figure 24. Graphical representation of UH-60M LUT eye tracker results (non-flying PI). .........26
Figure 25. PI visual gaze distribution for vignette 1, manual approach. ......................................27
Figure 26. CP visual gaze distribution for vignette 1, manual approach. .....................................27
Figure 27. PI visual gaze distribution for vignette 2, final approach. ...........................................28
Figure 28. CP visual gaze distribution for vignette 2, final approach. .........................................28
Figure 29. PI visual gaze distribution for vignette 3, emergency tactical approach. ....................29
Figure 30. CP visual gaze distribution for vignette 3, emergency tactical approach. ...................29

vi
Figure 31. PI gaze analysis scene planes. .....................................................................................31
Figure 32. HSDH display types. ...................................................................................................32
Figure 33. Average fixation duration across display types. ..........................................................33
Figure 34. Average saccadic extent across display types. ............................................................34
Figure 35. Average fixation frequency across display types. .......................................................35
Figure 36. Average blink frequency across display types. ...........................................................35
Figure 37. Percentage of Visual Gaze on HSD.............................................................................36
Figure 38. Percentage of visual gaze on the RAD ALT. ..............................................................37
Figure 39. Percentage of visual gaze on the VSI. .........................................................................38
Figure 40. CP 2-D HUD vs. 3-D HUD gaze distribution during navigation. ...............................40
Figure 41. AOIs used to calculate visual workload. .....................................................................43
Figure 42. Vignette 1 gaze percentages. .......................................................................................44
Figure 43. Vignette 2 gaze percentages. .......................................................................................45
Figure 44. Vignette 3 gaze percentages. .......................................................................................46
vii
List of Tables
Table 1. Army aircraft, associated simulator, and assessment/test. ................................................6
Table 2. UH-60M LEUE pilot comparison data. ..........................................................................22
Table 3. UH-60M LUT eye tracker data. ......................................................................................25
Table 4. Flight stages by vignette. ................................................................................................26
Table 5. Summary of eye gaze DVE data. ....................................................................................41
Table 6. Simulator comparison data. ............................................................................................47

viii
INTENTIONALLY LEFT BLANK.

1
1. Introduction and Background
1.1 Purpose
The U.S. Army Research Laboratory (ARL), Human Research and Engineering Directorate (HRED) uses Army Aviation helicopter engineering simulators to assess crewstation design for new or modified aircraft. To help assess crewstation design, pilots and copilots wear a head and eye tracker to record visual gaze and dwell times during missions conducted in the simulators. Recording visual gaze and dwell times can help identify if pilots and copilots are maintaining an adequate percentage of time visually focused outside the aircraft to avoid obstacles such as trees and wires. It can also identify improvements that need to be made to crewstation design. For example, if pilots and copilots spend an excessive amount of time viewing the crewstation displays, this can indicate that the displays contain information that requires too many steps (e.g., button pushes, interpretation) to retrieve.
This report summarizes pilot (PI) and copilot (CP) eye tracker data collected during missions using the AH-64D Apache Longbow, OH-58F Kiowa Warrior, UH-60M Blackhawk, CH-47F Chinook, and Armed Reconnaissance Helicopter (ARH) engineering simulators. Additional data collected during the Tactical Airspace Integration System (TAIS) cockpit interface assessment and the Air Soldier System (Air SS) Early User Demonstration (EUD) are also included. The data were augmented with observations by ARL HRED personnel during the assessments, PI feedback during post mission interviews, and comparisons of eye tracker data with findings from other helicopter simulators.
1.2 Basic Anatomy and Function of the Eye
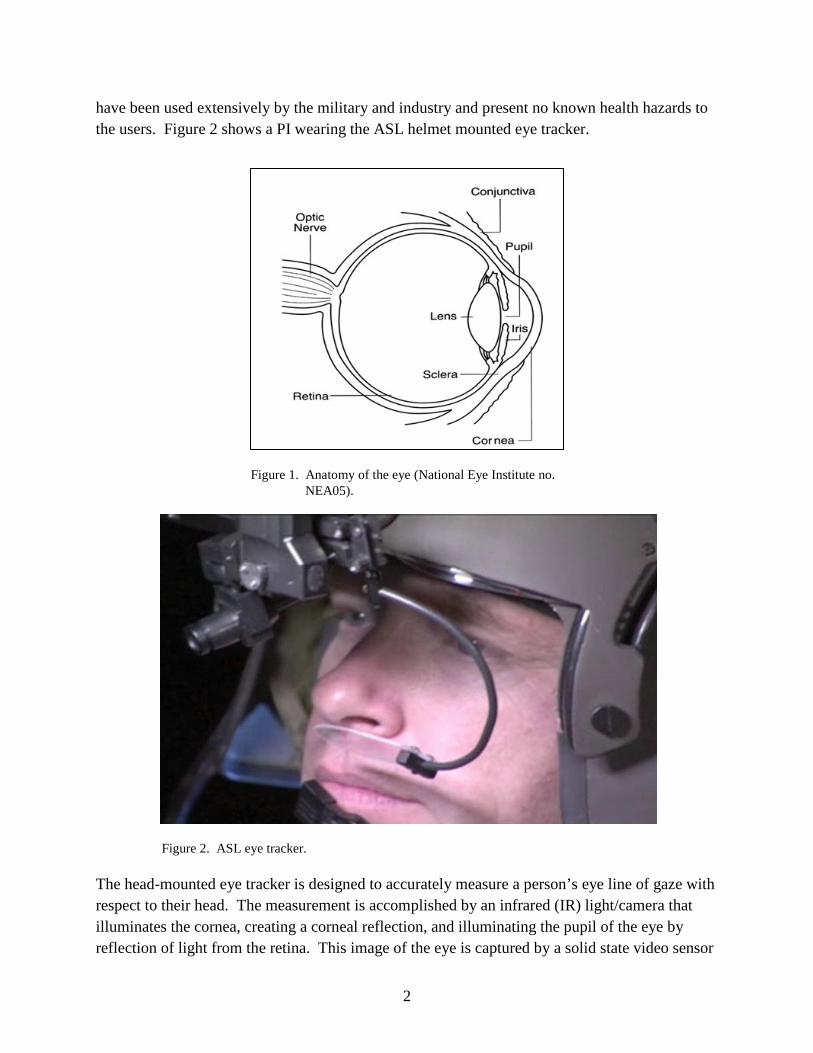
Figure 1 shows the basic anatomy of the human eye. The cornea, iris, pupil, and retina are of particular interest to researchers concerned with capturing infrared eye tracker data. The cornea is considered the “window” of the eye. It is responsible for about two-thirds of the eye’s focusing power (Lens et al., 2008). The iris is the colored part of the eye that splits the eye into two separate chambers. The primary function of the iris is to regulate the size of the pupil via the innervations of its muscles (Lens et al., 2008). The pupil is the opening in the middle of the iris which allows light to enter the eye and focus onto the retina. The retina converts light into electrical signals that travel through the optic nerve to produce images in the brain.
1.3 Head and Eye Tracker System
ARL HRED used a head-mounted eye tracking system from Applied Science Laboratories (ASL) to measure PI visual gaze and dwell times. The eye tracking system is used cooperatively with a laser-guided head tracking device manufactured by Ascension Technology Corporation or an infra-red camera based head tracking system from Northern Digital Inc. The tracking systems
2
have been used extensively by the military and industry and present no known health hazards to the users. Figure 2 shows a PI wearing the ASL helmet mounted eye tracker.
Figure 1. Anatomy of the eye (National Eye Institute no. NEA05).
Figure 2. ASL eye tracker.
The head-mounted eye tracker is designed to accurately measure a person’s eye line of gaze with respect to their head. The measurement is accomplished by an infrared (IR) light/camera that illuminates the cornea, creating a corneal reflection, and illuminating the pupil of the eye by reflection of light from the retina. This image of the eye is captured by a solid state video sensor
3
(eye camera). The camera then passes the image to an ASL control box that uses pupil and cornea reflection discrimination techniques based on bright field object recognition, which are implemented in ASL’s eye tracker software (Jessee, 2010). The distance between the center of the pupil and cornea reflection is then measured during eye rotation, and a corresponding coordinate is associated with each recorded distance. The head tracker monitors the eye position in three-dimensional (3-D) space as it rotates and calculates point of gaze based on eye rotation (eye tracker) and position of the eye (head tracker). Integrating these technologies allows the PI to move their head naturally while operating the simulated aircraft.
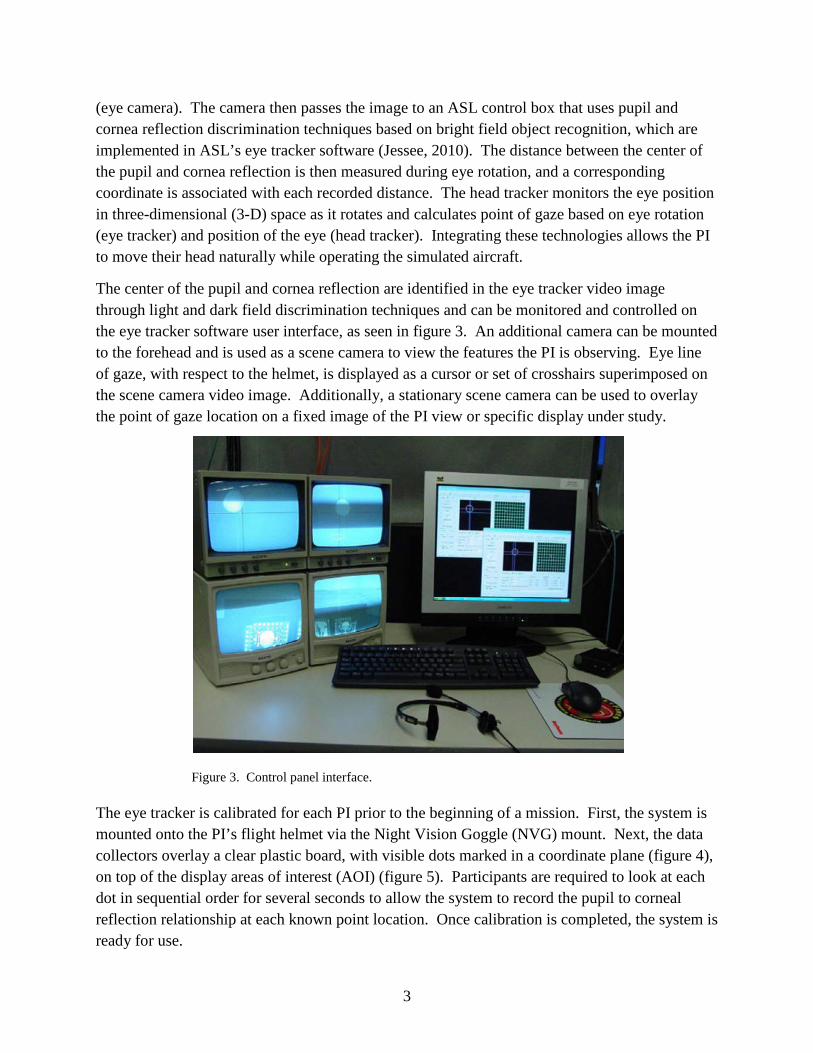
The center of the pupil and cornea reflection are identified in the eye tracker video image through light and dark field discrimination techniques and can be monitored and controlled on the eye tracker software user interface, as seen in figure 3. An additional camera can be mounted to the forehead and is used as a scene camera to view the features the PI is observing. Eye line of gaze, with respect to the helmet, is displayed as a cursor or set of crosshairs superimposed on the scene camera video image. Additionally, a stationary scene camera can be used to overlay the point of gaze location on a fixed image of the PI view or specific display under study.
Figure 3. Control panel interface.
The eye tracker is calibrated for each PI prior to the beginning of a mission. First, the system is mounted onto the PI’s flight helmet via the Night Vision Goggle (NVG) mount. Next, the data collectors overlay a clear plastic board, with visible dots marked in a coordinate plane (figure 4), on top of the display areas of interest (AOI) (figure 5). Participants are required to look at each dot in sequential order for several seconds to allow the system to record the pupil to corneal reflection relationship at each known point location. Once calibration is completed, the system is ready for use.

4
Figure 4. Dot coordinate plane.
Figure 5. AOI.

5
Data obtained via the eye tracker helps determine if PIs were required to spend too much time looking at the crewstation displays to perform tasks. An excessive amount of time required looking ‘inside’ the aircraft can be an indicator of poor cockpit layout, insufficient PI training/familiarity, time consuming tasks, or other visual distractions. Reducing the time required to be visually inside the aircraft can provide PIs with increased situational awareness (SA) of their aircraft with respect to geographical and man-made features. This SA is vital to avoid collisions. Data provided by the eye tracker are typically summarized in a graphical format. The format depicts the amount of time that each PI spent looking at the crewstation displays and controls vs. the out-the-window (OTW) visual scene. Eye tracker results provide an increased understanding of PI workload and the crewstation design characteristics.
1.4 Limitations of a Head and Eye Tracker
The primary limitation of the ASL head and eye tracker is unintentional bumping of the eye tracker by the PI. This can cause the IR camera to lose focus on the eye and result in lost data points. When this event occurs, the camera must be repositioned and in some cases recalibrated. The eye tracker cannot be used while PIs operate simulators with NVGs and other helmet mounted displays (HMD), since the eye tracker uses the NVG mount as an anchor to the helmet. In some cases, PI eyelids can cover too much of the pupil to maintain an accurate track.
1.5 Army Aviation Engineering Helicopter Simulators
The simulators that were used by ARL HRED for the crewstation design assessments are engineering simulators. The engineering simulators were designed to provide a platform for developing and assessing crewstation design, evaluating PI performance, and assessing crew workload, SA and crew coordination. The simulators were also used to help PIs develop tactics, techniques and procedures and provide limited training for PIs prior to operational testing in the aircraft. The results of the assessments were used to support analyses by the Army Test and Evaluation Command (ATEC), Training and Doctrine Command (TRADOC) Capabilities Managers (TCM), aircraft program management offices, Aviation and Missile Research, Development and Engineering Center (AMRDEC), ARL HRED, and industry.
The Army Aviation engineering simulators used by ARL HRED were the AH-64D Apache Longbow Risk and Cost Reduction Simulator (RACRS), UH-60M Blackhawk Helicopter Engineering and Analysis Cockpit (BHEAC)—Battlefield Highly Immersive Virtual Environment 1 (BHIVE 1) and Systems Integration Laboratory (SIL) simulators, ARH simulator—BHIVE 2, CH-47F—BHIVE 2, and the OH-58F Cockpit and Sensor Upgrade Program (CASUP) simulator—BHIVE 2. The simulators contained the hardware and software that emulated the controls, flight characteristics, and functionality of the aircraft. The BHIVE’s provide the OTW display, sound, and lighting environment for the hardware simulators that are

6
housed inside. The simulator crewstations replicated the corresponding crewstation in the actual aircraft, allowing each PI to perform appropriate flight and mission tasks. Table 1 lists the aircraft, associated simulator, and assessment/test for which the simulation was conducted.
Table 1. Army aircraft, associated simulator, and assessment/test.
Aircraft Simulator Assessment/Test
AH-64D RACRS - Unmanned Aircraft System Teaming
ARH BHIVE 2 - Common Aviation
Architecture System Assessment
OH-58F CASUP BHIVE 2 - Crewstation Design Assessment #1
UH-60M BHIVE 1, SIL
- Limited Early User Evaluation
- Early User Demonstration - Limited User Test - Air Soldier System Early
User Demonstration
CH-47F BHIVE 2
- Horizontal Situational Display Hover Assessment
- Tactical Airspace Integration System Situation Awareness Assessment
1.6 AH-64D Apache Longbow Aircraft Description
The AH-64D Apache Longbow is a twin-engine, tandem-seat attack helicopter. Aircraft armament includes a belly-mounted slewable 30-mm chain gun, Hellfire missiles, and 2.75-in aerial rockets. The aircraft integrated sensor suite includes a mast-mounted Longbow fire control radar (FCR) and a nose-mounted modernized target acquisition designation sight (MTADS)/PI night vision system (PNVS). The aircraft displays (figure 6) include two multipurpose displays (MPD) in each cockpit, the MTADS electronic display and control in the Copilot/Gunner (CPG) crewstation, and the integrated helmet and display sight system. The PI flies the aircraft from the rear crewstation. The aircraft has a flight control system with a fully articulated, four-bladed main rotor system. The flight control system consists of conventional cockpit controls: cyclic, collective, and pedals connected mechanically to hydromechanical actuators for the main and tail rotors; a limited authority automatic stabilization system; and an electrically actuated stabilator. Figure 6 shows the AH-64D Apache Longbow cockpit and displays.

7
Figure 6. AH-64D Apache Longbow cockpit and displays.
ARL HRED conducted two PI workload assessments for unmanned aerial system (UAS) teaming using the RACRS. The assessments evaluated the Video from UAS for Interoperability Teaming Level II (VUIT-2) system (Hicks et al., 2009) and the integrated UAS (IUAS) system (Durbin and Hicks, 2009) that were being incorporated into the aircraft. VUIT-2 provided the ability to conduct level II UAS interoperability (receive video from the UAS). The IUAS system provided the aircrew with the capability to conduct level II, level III, and level IV UAS interoperability (receive video from the UAS and control of the UAS sensor and air vehicle).
1.6.1 AH-64D RACRS Simulator Description
The RACRS cockpits used during the VUIT-2 and IUAS simulations consisted of high fidelity aircraft flight controls and displays (figure 7). The CPG used Target Acquisition and Designation Sight (TADS) Electronic Display and Control (TEDAC) grips to select and control the sensor’s field of view (FOV), azimuth, elevation, gain, and level. These controls were also selectable for adjustment of the UAS sensor. The TEDAC and MPD displays were used to monitor the sensor view from the Apache and/or the UAS.

8
Figure 7. RACRS cockpit simulator.
The simulator visual system was configured to fly the Bagram, Afghanistan visual database (figure 8). This is a geo-specific large gaming area built from satellite acquired high-resolution imagery and detailed terrain relief. It also contained appropriate cultural features to increase realism for the PIs.
1.7 ARH Aircraft Description
The ARH was a reconnaissance/scout helicopter designed to replace the OH-58D Kiowa Warrior. It was a militarized version of the Bell 407 single-engine commercial helicopter and designed to provide the Army with an enhanced capability in the areas of deployment, reconnaissance and light attack. The ARH crewstation consisted of multi-function displays and advanced avionics. The aircraft was designed to operate during day and night in limited weather environments.
1.7.1 ARH BHIVE 2 Simulator Description
The ARH BHIVE 2 simulator consisted of the forward section of an ARH fuselage and crewstation hardware and software (figure 9). Each crewstation replicated the corresponding crewstation in the actual aircraft, allowing each PI to perform position appropriate flight and mission tasks. The simulator contained the hardware and software that emulated the controls, flight characteristics, and functionality of the ARH aircraft. The projection system was six SEOS* image generators, which projected the OTW view onto an 180° × 60° directional curved dome. The BHIVE 2 was used by ARL HRED to assess the ARH crewstation design during the Common Aviation Architecture System (CAAS) assessment (Durbin and Hicks, 2006).
* SEOS is trademarked as a subsidiary of Rockwell Collins.

9
Figure 8. Bagram, Afghanistan visual database.
Figure 9. ARH BHIVE 2 cockpit and simulator.
1.8 OH-58F CASUP Aircraft Description
The OH-58D Kiowa Warrior is the Army’s primary armed reconnaissance helicopter. It supports a wide range of activities from support operations to heavy combat. The Kiowa’s primary functions include: reconnaissance, security, and close combat attacks. The OH-58F CASUP program provides a significant upgrade to the Kiowa legacy systems. The CASUP
10
program upgrades the aircraft sensor capabilities, weapons interface, aircraft survivability equipment (ASE), communication systems, and modernizes the cockpit.
1.8.1 OH-58F CASUP BHIVE 2 Simulator Description
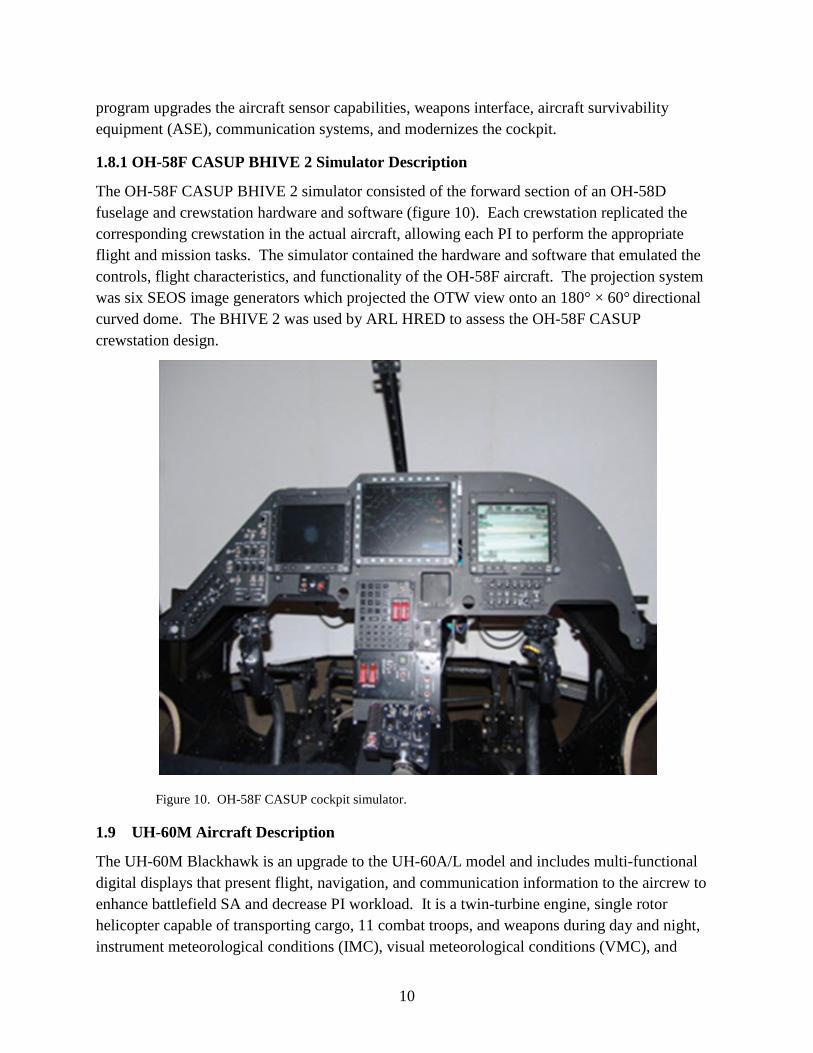
The OH-58F CASUP BHIVE 2 simulator consisted of the forward section of an OH-58D fuselage and crewstation hardware and software (figure 10). Each crewstation replicated the corresponding crewstation in the actual aircraft, allowing each PI to perform the appropriate flight and mission tasks. The simulator contained the hardware and software that emulated the controls, flight characteristics, and functionality of the OH-58F aircraft. The projection system was six SEOS image generators which projected the OTW view onto an 180° × 60° directional curved dome. The BHIVE 2 was used by ARL HRED to assess the OH-58F CASUP crewstation design.
Figure 10. OH-58F CASUP cockpit simulator.
1.9 UH-60M Aircraft Description
The UH-60M Blackhawk is an upgrade to the UH-60A/L model and includes multi-functional digital displays that present flight, navigation, and communication information to the aircrew to enhance battlefield SA and decrease PI workload. It is a twin-turbine engine, single rotor helicopter capable of transporting cargo, 11 combat troops, and weapons during day and night, instrument meteorological conditions (IMC), visual meteorological conditions (VMC), and

11
degraded visual environment conditions. The UH-60M Blackhawk helicopter provides air assault, general support, and medical evacuation (MEDEVAC) capabilities for the U.S. Army.
1.9.1 UH-60M BHIVE 1 Simulator Description
The BHIVE 1 simulator (figure 11) consists of a projection system, 3-D surround sound audio, and a plug-and-play interface for the integration of the UH-60M reconfigurable crew station. Each crewstation replicated the corresponding crewstation in the actual aircraft, allowing each PI to perform position appropriate flight and mission tasks. The simulator contained the hardware and software that emulated the controls, flight characteristics, and functionality of the UH-60M aircraft. The projection system was a fixed base bi-directional curved screen with three soft edge blended projectors and an image generation system. The screen provides a FOV of 40° vertical (111.61 in) and 150° horizontal (229 in). The distance from the screen to the PI and CP was ~152 in. The BHIVE 1 was used by ARL HRED to assess the UH-60M crewstation design during the Limited Early User Evaluation (Havir et al., 2005) and the Early User Demonstration 2 (Kennedy and Durbin, 2005).
Figure 11. UH-60M BHIVE 1 configuration.

12
1.9.2 UH-60M SIL Simulator Description
The UH-60M SIL included the forward section of a UH-60L aircraft (figure 12). Using the forward section of the actual aircraft provided a realistic crewstation environment by using production-representative hardware. The simulator emulated the controls, flight characteristics, and functionality of the UH-60M aircraft. The external visual scene was displayed on three rear projection monitors. The SIL was used by ARL HRED to assess the UH-60M crewstation design during the Limited User Test (LUT) (Havir et al., 2006).
Figure 12. UH-60M SIL cockpit view.
1.10 CH-47F Aircraft Description
The CH-47F Chinook is a twin engine, tandem rotor medium-lift cargo helicopter; used for troop, artillery, and supply transportation. The CH-47F was an upgrade program to the CH-47D that incorporated multi-function displays in the crewstation and improvements to airframe reliability, maintainability, and avionics architecture.
1.10.1 CH-47F Simulator Description
The CH-47F CH-EAC is a reconfigurable cockpit that utilizes computer monitors to emulate actual aircraft displays, control panels, and standby instrumentation (refer to figure 10). The cockpit has two crewstations arranged in a side-by-side configuration. Each crewstation replicated the corresponding crewstation in the actual aircraft, allowing each PI to perform the appropriate flight and mission tasks. The simulator contained the hardware and software that

13
emulated the controls, flight characteristics, and functionality of the CH-47F aircraft. The projection system was six SEOS image generators, which projected the OTW view onto an 180° × 60° directional curved dome.
The CH-47F CH-EAC was used to evaluate the Horizontal Situation Display Hover (HSDH) software. The HSDH software was designed to enhance the PI’s manual control of horizontal (position, drift, and heading) and vertical (position and speed) flight parameters in a brownout degraded visual environment (DVE).
1.11 TAIS Description
TAIS is a mobile airspace management system that provides combined air-ground battlespace management information based on several communication links, including but not limited to; Patriot, Airborne Warning and Control System (AWACS), and civilian airport radars. This system allows operators to de-conflict current and planned airspace usage and relay that information to Division or Corps commanders, aviation, artillery, air defense command posts, or civilian agencies. Currently, there is no way to pass dynamic airspace updates (DAU) into the cockpits of aircraft that are in mid route. Thus, aviators may either receive airspace coordinates of airspace activity via radio calls, a time consuming and workload intensive process, or assume the risk of flying in airspace that is being violated by other users.
1.11.1 TAIS Cockpit Simulation Description
The purpose of the TAIS evaluation was to examine the crew performance effects of receiving DAUs into digital and analog cockpits during mission vignettes with multiple dynamic airspace events. The first phase was conducted in the CH-47F CH-EAC with DAUs passed from a TAIS box to the digital map of the cockpit. The second phase employed a UH-60 with capability imitating that of the A and L models with DAUs passed from the TAIS box to an Electronic Data Manager (EDM) with digital map capabilities.
1.12 Air SS Description
Air SS is an integrated, modular, mission adaptable Aviation Life Support Equipment (ALSE) system and protective ensemble for aircrew Soldiers designed to address capability gaps identified during combat operations in Iraq and Afghanistan. These capability gaps include limited aircrew SA tools (e.g., lack of terrain, weather, threat, and obstacle avoidance display capabilities), the negative effects of aircrew equipment weight and bulk to cockpit operations and overall mission effectiveness of the aircrew, limited ability to operate in degraded visual environments, and the lack of integrated and state-of-the-art helmet capabilities (e.g., 3-D audio and heads-up display technology).
14
1.12.1 Air SS EUD Simulator Description
The UH-60 BHEAC simulator was used for the Air SS evaluation. The BHEAC is a realistic representation of the Blackhawk cockpit and flight characteristics. The AMRDEC Aviation Engineering Directorate (AED) developed flight model and high fidelity control loader emulate the flight characteristics of the UH-60 helicopter. The terrain and out the window view were generated by the BHIVE 2. The BHIVE 2 uses six digital projectors displayed on a 180° horizontal by 70° vertical FOV dome.
The Air SS ensemble included an Elbit Systems, Ltd. 3-D Heads-Up Display (HUD) with Helmet Display Tracking System (HDTS) DVE capabilities, which displayed a 3-D landing grid for PI reference during DVE landings. The advanced audio presentation consisted of two conditions, 3-D Channel and 3-D Source. The 3-D-channel audio presented communication sources relative the airframe with one source to the left, another to the right, and the crew chief behind. The 3-D-source audio presented communication sources from the relative spatial location of the entity creating the sound. The advanced Electronic Data Manager (EDM) capability provided PIs with Terrain Avoidance Warning System symbology, which automatically displayed terrain obstacles that were above the current above ground level (AGL) providing SA about potential controlled flight into terrain (CFIT) obstacles. The tactile display used in the EUD was the U.S. Army Aeromedical Research Laboratory (USAARL) Tactile Situational Awareness System (TSAS). TSAS consisted of a waist-worn belt, seat cushion and over the shoulder straps that contained small vibrating elements (tactors). These “tactors” can present a variety of directional stimulation. When the aircraft was moving under 40-knots indicated airspeed, TSAS provided 8-directional hover drift cues by vibrating the waist-worn belt in the direction of aircraft motion. Also, a seat pan vibration was presented at 10-ft AGL to signal impending landing. TSAS provided an altitude cue by buzzing the shoulder straps when the aircraft airspeed was over 40 knots and the aircraft altitude was over 500 ft.
2. Method
2.1 Mission Descriptions and Setup
ARL HRED calibrated the eye tracker system and monitored it during each mission. The PIs conducted operational missions that were appropriate for their aircraft. The missions for the AH-64D, OH-58F, and ARH included route, area, and zone reconnaissance, landing zone reconnaissance, armed security, and close combat. The missions for the UH-60M and CH-47F included air movement, air assault, landing strip seizure, and long range surveillance detachment (LRSD). The missions were typically 1.5 to 2 hours in length. PIs usually flew one mission per day. PIs had a range of experience from less than 200 flight hours to 4000+ flight hours.
15
ARL HRED personnel observed the missions and recorded any anomalies related to visual workload and eye tracker data collection. If an eye tracker was bumped or lost calibration, the missions were typically paused and the eye tracker was re-calibrated. During the AH-64D missions, an eye tracker was only used for the PI in the front seat because the PI in the back seat wore the Helmet Display Unit (HDU). The HDU was used for flight and targeting tasks and prevented use of the eye tracker. During missions, a camera was mounted to the glare shield in the back seat of the AH-64D. The camera scene content was displayed on a terminal and ARL HRED personnel observed and recorded the amount of time the PI in the back seat spent heads-down in the cockpit and heads out the window.
2.2 Data Analysis
The eye tracker data were summarized by calculating the total percentage of mission time spent focused on different AOI. There were periods of the missions when no eye tracker data were collected or the data collected were unusable because the calibration was disturbed; therefore, for the purpose of analyzing eye tracker data, the mission time is defined as the time during the mission when useful eye tracker data were collected. Several AOIs were created for each PI, for example: left multi-functional display (MFD), right MFD, OTW, cockpit display unit (CDU), and other. The “other” category captured eye fixations focused on areas not captured by the other AOIs. During UH-60M missions, the eye tracker data were complicated because the PIs were allowed to alternate flying responsibilities throughout the flight. Since the eye tracker data are typically separated by flying vs. non-flying PI, this made analysis of the data more difficult. Collected data were reported graphically, by overlaying percentages over the aircraft crewstation AOI.
3. Results
3.1 AH-64D Eye Tracker Results
During the AH-64D VUIT-2 and AH-64D IUAS simulations, the PIs flew a variety of reconnaissance and attack missions. The PIs flew several missions while controlling a UAS, and two baseline missions performing normal AH-64D (non-UAS) tasks. During the VUIT-2 missions, PIs were only able to control the UAS sensor. The IUAS missions allowed PIs full control of the sensor and flight characteristics of the UAS. The data were collected for each mission and summarized graphically. The eye tracker data were summarized by calculating the total percentage of fixations that occurred for the different AOI. Six AOI were created for the CPG: right MPD, left MPD, TEDAC, keyboard, and kneeboard (figure 13). Visual gaze and dwell times were also recorded for OTW. A final category, called “Other,” captured eye fixations not focused on a specific AOI. Figure 13 shows the average percentage of time that the CPGs were visually focused on each AOI during the VUIT-2 missions. The CPGs were visually

16
focused on the right MPD for 13% of the time during missions. They were visually focused on the left MPD for 17% of the time and the TEDAC (MTADS sensor) for 48%. The CPGs typically spent only 3% of the time visually focused OTW during missions.
Figure 13. CPG visual gaze and dwell times during AH-64D VUIT-2 missions.
Figure 14 shows the average percentage of time that the CPGs were visually focused on each AOI during the Apache IUAS missions. The CPGs were visually focused on the right MPD (UAS sensor video) for 49% of the time during missions. They were visually focused on the left MPD Tactical Situation Display (TSD) for 19% of the time and the TEDAC for 14%. The CPGs typically spent only 6% of the time visually focused OTW during missions.
A small camera was mounted on the glareshield in the rear cockpit so that ARL HRED personnel could observe how much time the PIs spent visually focused inside vs. outside the aircraft. ARL HRED personnel observed that the PIs were visually focused outside the aircraft ~75% of the time and inside 25% of the time during the VUIT-2 and IUAS missions (figure 15). The PIs confirmed the observations made by ARL personnel during post-mission discussions. During the VUIT-2 and IUAS missions, the CPGs were not able to maintain visual focus outside the

17
aircraft to assist with flight and navigation tasks (e.g., identification of terrain features), local security, terrain flight, etc. For 90 +% of the time, the CPGs were visually focused inside the aircraft performing (mostly) target detection and engagement tasks.
Figure 14. CPG visual gaze and dwell times during AH-64D IUAS missions.
Figure 15. PI visual dwell times estimates for all AH-64D UAS missions.

18
Baseline missions (MTADS/FCR only, no UAS) were conducted during each simulation to compare how much time the CPG was visually focused outside the aircraft during non-UAS missions. Figure 16 shows the average percentage of time that the CPGs were visually focused on each AOI during the non-UAS missions. The CPGs were visually focused on the right MPD for 7% of the time during missions. They were visually focused on the left MPD for 10% of the time and the TEDAC for 76%. The CPG spent just 3% of the time visually focused OTW during the baseline missions. The baseline missions suggests that the amount of time that CPGs are visually focused outside the aircraft during missions (e.g., day, visual flight rules) when employing the UAS is similar to missions when they did not employ the UAS.
Figure 16. Visual gaze and dwell times during baseline AH-64D missions (non-UAS mission).
A small camera was mounted on the glareshield in the rear cockpit so that ARL HRED personnel could observe how much time the PIs spent visually focused inside vs. outside the aircraft during non-UAS missions. ARL HRED personnel observed that the PIs were visually focused outside the aircraft ~75% of the time and inside 25% of the time (figure 17). The PIs confirmed the observations during post-mission discussions. During the IUAS simulation, the PIs were split when asked if they were “inside” the cockpit more than during a non-UAS mission: 50% of the PIs reported they were inside more than during a comparable non-UAS mission, 40% reported they were inside “about the same” as a comparable non-UAS mission, and 10% said they were inside less than a comparable non-UAS mission.

19
Figure 17. Estimated PI visual dwell times during all AH-64D missions.
The eye tracker results augmented other data (e.g., surveys, interviews) collected during the VUIT-2 and IUAS missions. This helped define the workload that PIs will likely experience during employment of a UAS.
3.2 ARH Eye Tracker Results
The visual workload results collected during the ARH Human Factors Engineering (HFE) crewstation evaluation are displayed in figure 18, which shows the percentage of time that the PIs were visually focused (during visual flight rules [VFR] flight) on each AOI during the missions. During the evaluation, the non-flying PI (left seat) spent just 7% of his time visually focused OTW during missions. Generally, the non-flying PI needs to maintain periodic visual focus outside the aircraft to assist with navigation; identification of terrain and cultural features, local security, terrain flight, etc. Maintaining visual focus outside the aircraft for only 7% of a typical zone reconnaissance mission is likely too low to adequately assist the PI with crew tasks such as obstacle avoidance and terrain flight navigation. The small percentage of time that the non-flying PI was visually focused outside the aircraft may have been due to the workload required to process information on the crewstation displays and/or lack of in-depth experience with the CAAS cockpit system.

20
Figure 18. Graphical representation of ARH PI visual gaze and dwell times.
3.3 OH-58F Eye Tracker Results
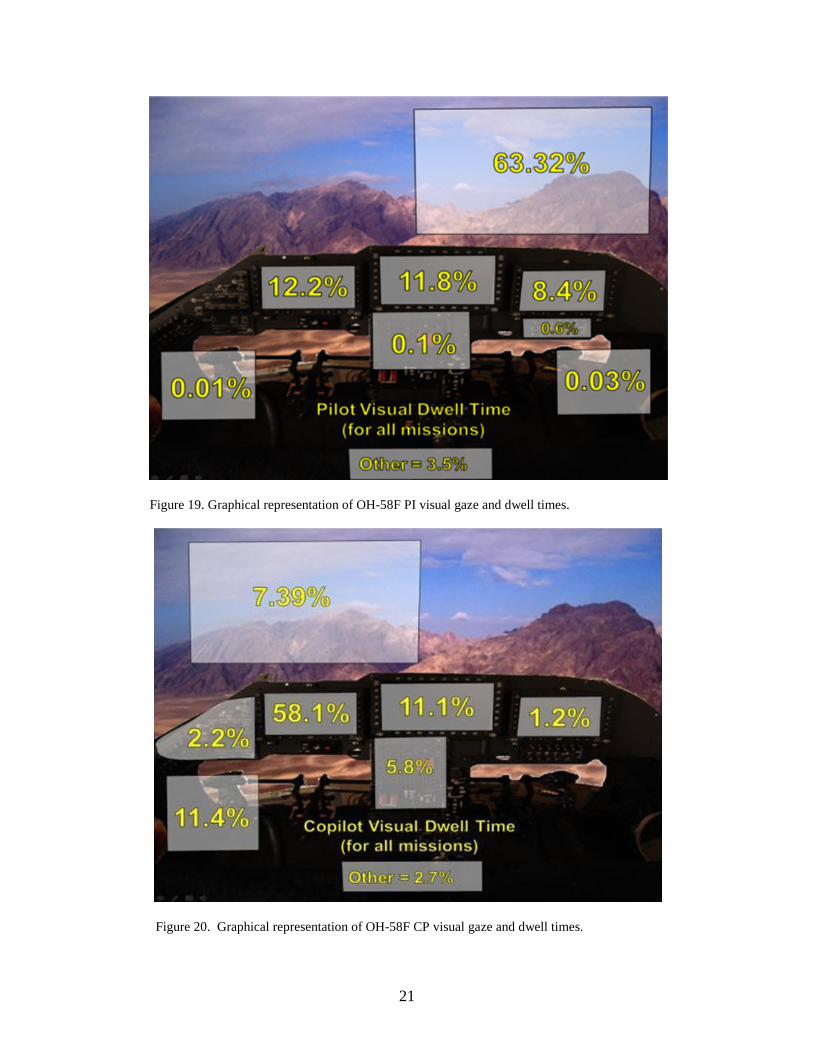
Figures 19 and 20 show the percentage of time that the PIs were visually focused (during VFR flight) on each AOI during the missions. It is interesting to note that the copilots typically spent only 7% of the time visually focused OTW during missions. The CP needs to periodically maintain visual focus outside the aircraft to assist with navigation (e.g., identification of terrain and cultural features) and airspace surveillance. Maintaining visual focus outside the aircraft for only 7% of a typical zone reconnaissance mission is likely too low to adequately assist the PI with crew tasks such as obstacle avoidance and terrain flight navigation. The small percentage of time that the copilots were visually focused outside the aircraft was likely due to the workload required to manage information on the crewstation displays, operate the nose mounted sensor (NMS) and the lack of in-depth experience that the copilots had with the crewstation interface.
The pilots typically spent 63% of the time visually focused OTW during VFR missions. The amount of time (37%) that the pilots were visually focused inside the aircraft was due to performing instrument scans, lack of in-depth experience with the crewstation interface and the ‘helping behaviors’ of the pilots when flying the aircraft. The PI occasionally helped the CP manage information on the crewstation displays, which kept both of them visually focused inside the crewstation.
21
Figure 19. Graphical representation of OH-58F PI visual gaze and dwell times.
Figure 20. Graphical representation of OH-58F CP visual gaze and dwell times.

22
3.4 UH-60M Eye Tracker Results
During the UH-60M evaluations, eye tracker data were collected to determine how well the design of the aircraft allowed the flying PI and non-flying PI to remain focused outside the aircraft during VFR flights. Pilots flew a variety of UH-60 missions (e.g., air movement, air assault, multi-ship, and landing strip seizure) during the simulations. Collecting eye tracker data for the UH-60M simulations proved to be difficult due to pilots swapping flight controls and the performance of missions requiring landings to simulate the pick-up and drop-off of troops. Identifying these segments was important, due to significant differences in eye tracker data that are common between the flying and non-flying pilots. Data analysis techniques were used to analyze the collected eye tracker data and parse out unnecessary data points. This was accomplished by monitoring the simulation to identify flight control handoffs and documenting landing/take-off times to eliminate excessive data points not related to mission flights. New data segments were also created when the pilots transferred the flight controls. These segments were verified for accuracy post mission by a review of the audio and video tapes of the missions.
3.4.1 UH-60M LEUE BHIVE 1 Eye Tracker Results
Figure 21 shows the percentage of time that the left and right seat pilots were focused on each AOI defined in the crew station. An “other” category included periods of time when the pilots were focused in an area not defined by an AOI. Examples include looking down at their kneeboard or glancing across the cockpit to see the other PI’s displays. These “other” AOI values were 16.28% for the left seat and 3.43% for the right seat.
The Limited Early User Evaluation (LEUE) data indicated that the right seat PI spent an unusually high percentage of time focused on the right MFD. It was determined that a significant difference between subjects was the cause of the unusual data. Two of the subjects were experimental test pilots. Table 2 shows a comparison of eye tracker results for the test pilots (Aviation Technical Test Center [ATTC]) and non-test pilots (Non-ATTC). The comparison indicated that the test pilots spent a much larger percentage of time focused on the right MFD than the non-test pilots. After consulting with the test pilots and several other subject-matter experts (SMEs), it was concluded that this was likely caused by the specialized training and experience of the test pilots. Experimental test pilots are highly experienced pilots who are trained to perform advanced test flight maneuvers in the aircraft and closely monitor the aircraft systems during these maneuvers.
Table 2. UH-60M LEUE PI comparison data.
OTW Left MFD Right MFD CDU Other ATTC 52.06% 6.34% 38.02% 0.00% 3.59%
Non-ATTC 75.58% 12.14% 9.11% 0.13% 3.05%
23
Figure 21. Graphical representation of UH-60M LEUE eye tracker results.
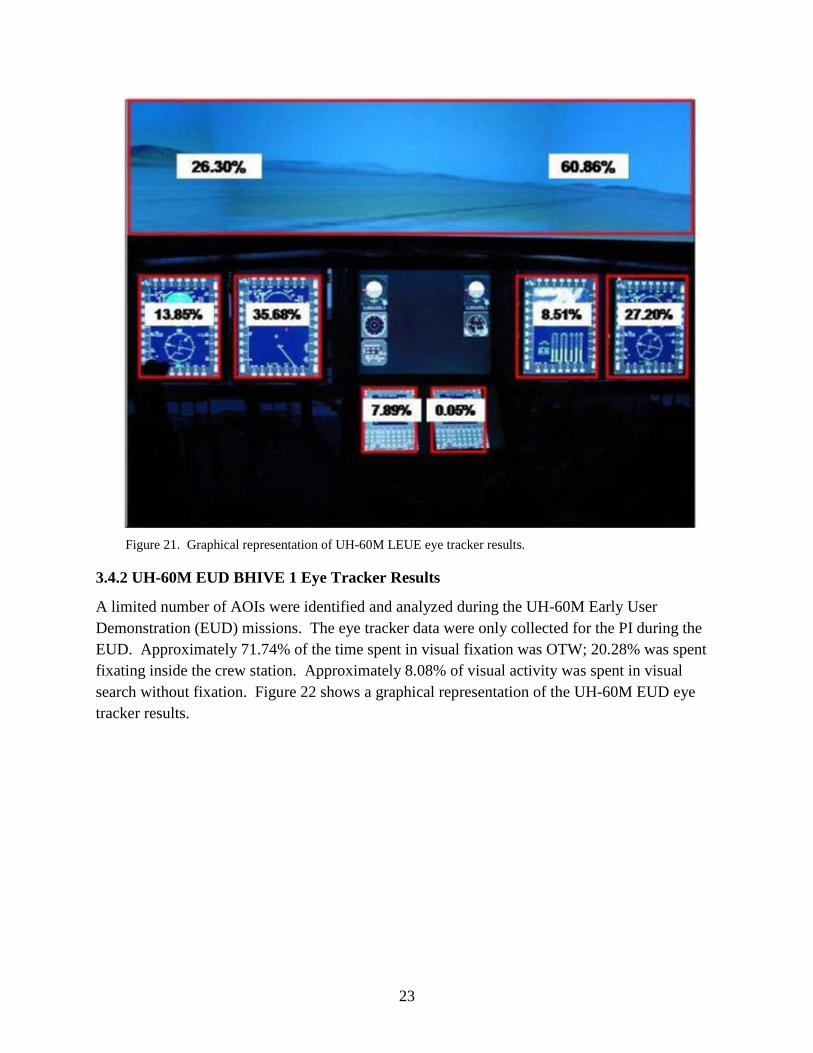
3.4.2 UH-60M EUD BHIVE 1 Eye Tracker Results
A limited number of AOIs were identified and analyzed during the UH-60M Early User Demonstration (EUD) missions. The eye tracker data were only collected for the PI during the EUD. Approximately 71.74% of the time spent in visual fixation was OTW; 20.28% was spent fixating inside the crew station. Approximately 8.08% of visual activity was spent in visual search without fixation. Figure 22 shows a graphical representation of the UH-60M EUD eye tracker results.

24
Figure 22. Graphical representation of UH-60M EUD eye tracker results.
3.4.3 UH-60M LUT SIL Eye Tracker Results
Eye tracker data collection during the LUT was used to determine how well the design of the aircraft allowed the flying PI to remain focused outside the aircraft during VFR. The percentage of time the non-flying PI spent focused outside the aircraft during VFR was also analyzed. Analyzing the eye tracker data to answer these questions was difficult because of the nature of this operational test. First, several different missions were flown that have an impact on eye tracker data. For example, VFR, instrument flight rules (IFR), single-ship, and multi-ship missions were flown during the LUT. Differences were anticipated in the eye tracker data in each case, so the eye tracker data were evaluated collectively and separately. Another challenge was that the pilots were allowed to transfer the flight controls whenever necessary, as is the customary procedure in the UH-60 aircraft. In order to correctly analyze the eye tracker data, missions were closely monitored and new data segments were created every time the pilots transferred the controls. These segments were verified post mission by a review of the audio and video tapes of the missions. Table 3 shows the percentage of time the flying and non-flying pilots spent fixated OTW. The OTW percentage is considerably larger for both the flying and non-flying pilots during multi-ship missions.

25
Table 3. UH-60M LUT eye tracker data.
All Missions Single-Ship Missions Multi-Ship Missions
Flying PI 85.60% 68.04% 90.12% Non-Flying PI 28.21% 23.50% 32.96%
Figure 23 shows a graphical representation of the eye tracker data for the flying PI, regardless of seat position. This figure shows the percentage of mission time that pilots were focused on each AOI. The data for the flying PI were similar, regardless of seat position.
Figure 23. Graphical representation of UH-60M LUT eye tracker results (flying PI).
Figure 24 shows a graphical representation of the eye tracker data for the non-flying PI, regardless of seat position. This figure shows the percentage of mission time that pilots were focused on each AOI. The eye tracker data for the non-flying PI differed significantly, depending on seat position.

26
Figure 24. Graphical representation of UH-60M LUT eye tracker results (non-flying PI).
3.4.4 UH-60M Block III EUD Results
Visual gaze analysis was conducted for the PI and CP. For eye gaze analysis, each vignette was divided into flight stages as show in table 4. The average PI or CP distribution of fixation time for selected flight stages for each vignette are presented in figures 25–30. It is important to note that all the following flights were flown under instrument flight rules (PI using his instruments to fly the aircraft) in order to validate the crewstation usage of software designed to facilitate flexibility of point-to-point navigation. The approach stages for the three vignettes are displayed in the figures. The entire analysis can be found in (Morris et al., 2011).
Table 4. Flight stages by vignette.
Vignette 1 Vignette 2 Vignette 3 1. Preflight 2. Flight plan check 3. Manual approach
1. Preflight 2. Holding pattern & offset
waypoint 3. Final approach
1. Preflight 2. Emergency tactical approach

27
Figure 25. PI visual gaze distribution for vignette 1, manual approach.
Figure 26. CP visual gaze distribution for vignette 1, manual approach.

28
Figure 27. PI visual gaze distribution for vignette 2, final approach.
Figure 28. CP visual gaze distribution for vignette 2, final approach.

29
Figure 29. PI visual gaze distribution for vignette 3, emergency tactical approach.
Figure 30. CP visual gaze distribution for vignette 3, emergency tactical approach.

30
During the pre-flight and flight planning stages, as expected, crews visually attended primarily to their respective flight management system (FMS) performing communication frequency setting, waypoint definition, and procedure selection tasks.
For the holding pattern and offset waypoint task in vignette 2, pilots predominantly gazed at the inboard and outboard MFDs. Copilots predominantly attended to their FMS and outboard MFD.
During the IFR approach stages of the three vignettes, the pilots generally attended to the inboard and outboard MFDs (refer to figure 25). Pilots focused more on the outboard MFD (primary flight display) during the emergency tactical approach of vignette 3 (refer to figure 29). In contrast, the PI focused more on the inboard MFD (navigation display) during the more routine approaches of vignettes 1 and 2 (refer to figure 25). During the final approach in vignette 2, the copilots’ gaze was concentrated on the FMS (refer figure 27). Otherwise, copilots’ across vignettes distributed their gaze times predominantly among the MFDs, FMS, and kneeboard (refer to figure 26).
3.5 CH-47F HSDH Demonstration Results
During the CH-47F HSDH demonstration, visual gaze behavior was analyzed using four ocular activity metrics and localized AOI analyses (figure 31). Specifically, fixation duration, saccadic extent, fixation frequency, and blink frequency were analyzed as behavioral measures and the Horizontal Situation Display (HSD), Vertical Speed Indicator (VSI), and Radar Altimeter (RAD ALT) AOIs were taken as measures of visual attention. Statistical comparisons (one-way repeated measures analysis of variance (ANOVA) were conducted for each of these measures with display types (figure 32) baseline HSDH, proposed HSDH, and decluttered HSDH as the independent variable.

31
Figure 31. PI gaze analysis scene planes.

32
Figure 32. HSDH display types.

33
3.5.1 Fixation Duration
In order to measure the cognitive cost of processing the proposed HSDH symbology compared to the baseline symbology, fixation duration data were analyzed and statistically compared across different display types while collapsing data across a variety of hover tasks. Fixation duration indicates the length of time a PI’s visual attention is captured by a given stimulus. Often, this is taken as a measure of mental workload (Tole et al., 1983), in which longer fixation durations indicate greater workload because of longer processing cycles.
Results can be viewed in figure 33, which indicate no statistical difference, F(2, 6) = 1.536, p > 0.05 across display conditions.
Figure 33. Average fixation duration across display types.
3.5.2 Saccadic Extent
In order to investigate the amount of effort exerted by the visual system as a result of changing the HSDH symbology, saccadic extent, a different measure of visual workload, was compared across display types while collapsing data across all of the hover conditions. A reduction in saccadic extent indicates that less effort was required by the visual system to obtain information related to the PI’s task. A one-way repeated measures ANOVA indicated a strong trend towards significance, F(2, 6) = 5.513, p = 0.057, suggesting that the pilots’ visual system effort requirements were sequentially reduced with the introduction of the proposed and decluttered HSDH symbology. These data are graphically represented in figure 34.

34
Figure 34. Average saccadic extent across display types.
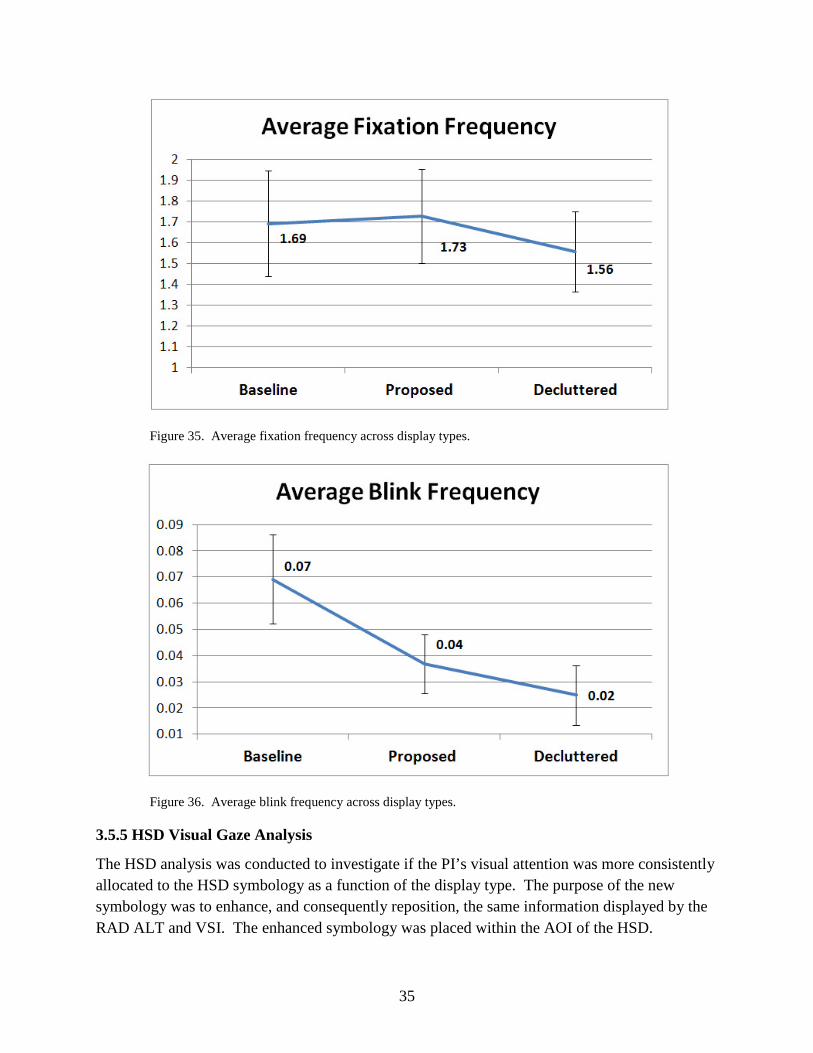
3.5.3 Fixation Frequency
One purpose of the proposed HSDH symbology was to localize the PI’s visual attention to a more central position when monitoring information related to the PI’s hover position. If this were achieved, then the frequency of fixations required to gather these data should have decreased, indicating that pertinent information for the PI was more readily available. Essentially, it means that the “units of information” per fixation would increase, thereby requiring fewer fixations to achieve the same job. Data can be viewed in figure 35, which indicates that there was no significant differences in average fixation frequency across display conditions, F(2, 6) = 0.226, p >0.05.
3.5.4 Blink Frequency
Blink frequency is associated with both visual and mental workload, and some previous research has demonstrated a negative correlation between these variables (Veltman and Gaillard, 1998). As blinks increase workload tends to be reduced. The following analysis evaluates blink behavior as a function of display type. A one-way repeated measures ANOVA indicates a significant difference in blink behavior as a function of display type, F(2, 6) = 9.753, p = 0.021. Figure 36 graphically presents these data.
35
Figure 35. Average fixation frequency across display types.
Figure 36. Average blink frequency across display types.
3.5.5 HSD Visual Gaze Analysis
The HSD analysis was conducted to investigate if the PI’s visual attention was more consistently allocated to the HSD symbology as a function of the display type. The purpose of the new symbology was to enhance, and consequently reposition, the same information displayed by the RAD ALT and VSI. The enhanced symbology was placed within the AOI of the HSD.

36
Consequently, if the enhanced HSD symbology successfully provided the required RAD ALT and VSI information to the PI, then the visual gaze percentages within the HSD symbology should be reduced from the RAD ALT and VSI and should increase within the HSD AOI. The following statistical analysis evaluated the varying gaze percentages of the HSD across display types. Figure 37 presents a significant increase in the percentage of time spent visually gazing over the HSD AOI, F(2, 6) = 6.782, p = 0.04. This indicates that the pilots were able to continuously rely on the enhanced symbology for the required hover information.
Figure 37. Percentage of Visual Gaze on HSD.
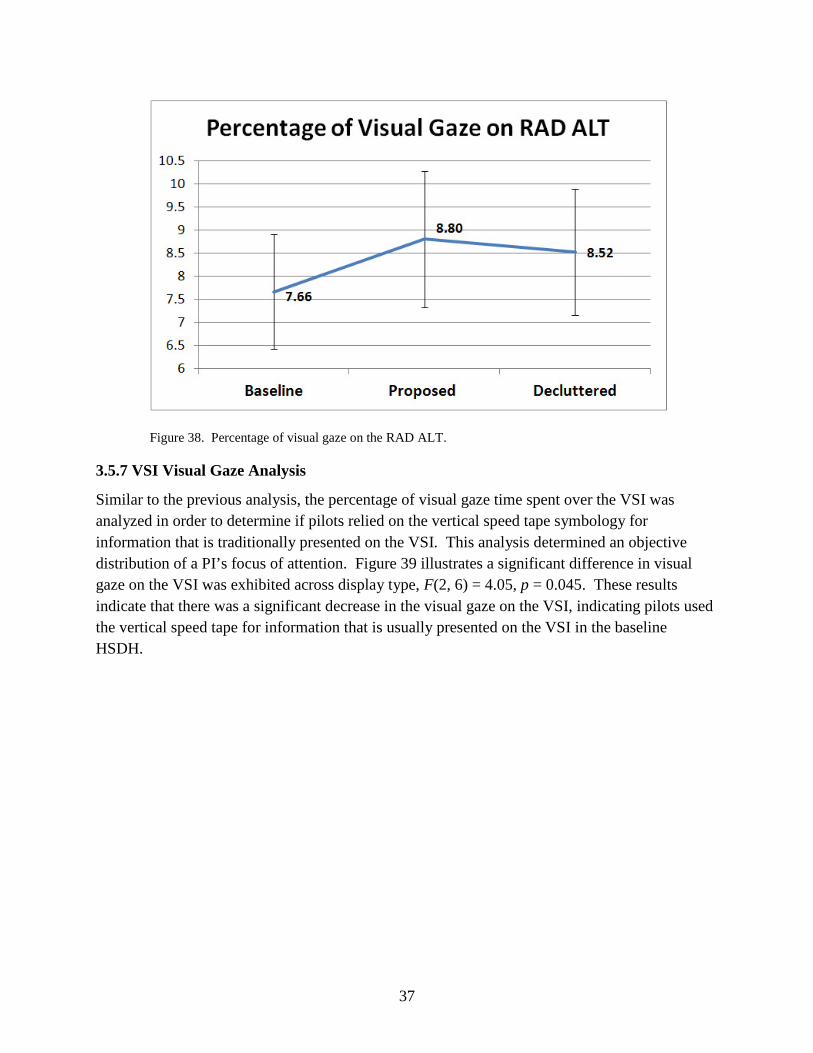
3.5.6 RAD ALT Visual Gaze Analysis
Similar to the previous analysis, the percentage of visual gaze time spent over the RAD ALT was analyzed in order to determine whether pilots relied on the hangman symbology for information that is traditionally presented on the RAD ALT. This analysis determines an objective PI preference for each information source. Figure 38 illustrates that there is no significant difference in visual gaze on the RAD ALT were exhibited across display type, F(2, 6) = 0.222, p > 0.05. These results indicate that, although there was a significant increase in the visual gaze of the HSD symbology, pilots still relied just as heavily on the RAD ALT in terms of total time spent visually dwelling on the RAD ALT symbology.
37
Figure 38. Percentage of visual gaze on the RAD ALT.
3.5.7 VSI Visual Gaze Analysis
Similar to the previous analysis, the percentage of visual gaze time spent over the VSI was analyzed in order to determine if pilots relied on the vertical speed tape symbology for information that is traditionally presented on the VSI. This analysis determined an objective distribution of a PI’s focus of attention. Figure 39 illustrates a significant difference in visual gaze on the VSI was exhibited across display type, F(2, 6) = 4.05, p = 0.045. These results indicate that there was a significant decrease in the visual gaze on the VSI, indicating pilots used the vertical speed tape for information that is usually presented on the VSI in the baseline HSDH.

38
Figure 39. Percentage of visual gaze on the VSI.
3.5.8 CH-47F HSDH Visual Gaze Conclusions
Acknowledging the small sample size, the data pattern for fixation durations, which can be viewed as short processing cycles, indicate that, for the evaluation maneuvers considered as a whole, the display type had no consistent effect on pilots’ fixations. As for the implications to workload, the two proposed displays did not increase workload as compared to the existing display. This is an important metric for “doing no harm” when designing new user interfaces. No reduction in workload for the fixation duration measure was found for the new display designs. This may be attributed to the lack of training with this particular simulator, or the small sample size.
The collective results from the HSD and RAD ALT gaze analyses favorably support the current HSDH design effort. During the collective after action review, pilots openly discussed the synergy between the proposed HSD and RAD ATL. Pilots recommended locating the digital RAD ALT value closer to the HSD horizontal acceleration cue. The concentrated gaze on the new HSD displays and continued reliance on RAD ALT indicate that new useful information for controlling the horizontal disposition of the aircraft was available to pilots in the proposed and decluttered HSDH displays. See Sapp, et al. (2011) for overall percentages of time spent gazing at the RAD ALT, HSD, and VSI across each display condition.

39
3.6 Air SS EUD Results
In order to test various display modalities for pilots flying a simulated analogue UH-60L (advanced HUD, updated EDM, tactile feedback, and auditory presentation technique), visual gaze behavior was analyzed during en-route navigation and DVE hover using four ocular activity metrics and seven localized AOI. Specifically, fixation duration, fixation frequency, blink duration, and blink frequency were analyzed as behavioral measures. The AOI were taken as measures of visual attention and included OTW, primary instruments, and kneeboard/EDM areas. Statistical comparisons were conducted with one-way repeated measures ANOVA for each of these measures during the navigation task with HUD type (two-dimensional [2-D] vs. 3-D) and Display type (EDM vs. mission display module (MDM)).
3.6.1 Visual Gaze During Navigation
Overall, there was only one statistically significant result for the AOI comparisons. The distribution of the CP’s visual attention was significantly reduced from the kneeboard/EDM area during 3-D HUD conditions compared to 2-D HUD conditions. This indicates that the 3-D HUD released the CP’s visual attention from deep in the cockpit to other AOI. However, the data do not specifically indicate where the resulting visual attention was distributed. Figure 40 illustrates the visual attention distributions during navigation during 2-D HUD vs. 3-D HUD conditions for the CP.

40
Figure 40. CP 2-D HUD vs. 3-D HUD gaze distribution during navigation.
41
Of particular note, PI and CP heads-up times were elevated for the 2-D HUD condition. Eye tracking data collected during similar demonstrations, in which pilots did not have a HUD, indicate an average heads-up range of 70% to 75%. Thus, the current data validate that a HUD (2-D or 3-D) increases the heads-up time during navigation. Based on the capability differences between the 2-D HUD and 3-D HUD, it was expected that the performance difference between the two conditions for navigation would be nominal.
Of the four behavioral ocular activity metrics analyzed during the navigation phase of the mission, none revealed a statistically significant difference across HUD conditions. However, a trend for PI blink frequency from the 2-D HUD condition to the 3-D HUD condition exists. These data indicate that blinks increased for the PI during the 3-D HUD condition, which is an indicator of a reduction in visual workload due to the 3-D HUD vs. the 2-D HUD condition.
3.6.2 Ocular Activity Analyses During DVE Approaches
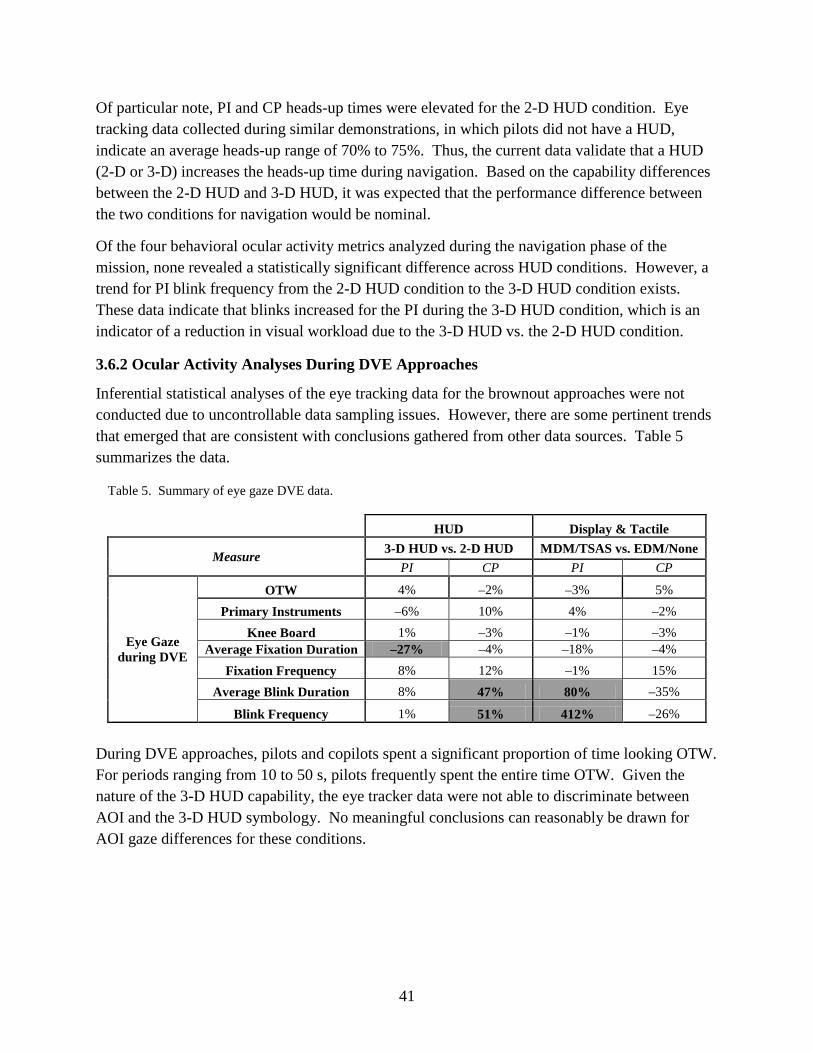
Inferential statistical analyses of the eye tracking data for the brownout approaches were not conducted due to uncontrollable data sampling issues. However, there are some pertinent trends that emerged that are consistent with conclusions gathered from other data sources. Table 5 summarizes the data.
Table 5. Summary of eye gaze DVE data.
HUD Display & Tactile
Measure 3-D HUD vs. 2-D HUD MDM/TSAS vs. EDM/None PI CP PI CP
Eye Gaze during DVE
OTW 4% –2% –3% 5% Primary Instruments –6% 10% 4% –2%
Knee Board 1% –3% –1% –3% Average Fixation Duration –27% –4% –18% –4%
Fixation Frequency 8% 12% –1% 15% Average Blink Duration 8% 47% 80% –35%
Blink Frequency 1% 51% 412% –26% During DVE approaches, pilots and copilots spent a significant proportion of time looking OTW. For periods ranging from 10 to 50 s, pilots frequently spent the entire time OTW. Given the nature of the 3-D HUD capability, the eye tracker data were not able to discriminate between AOI and the 3-D HUD symbology. No meaningful conclusions can reasonably be drawn for AOI gaze differences for these conditions.

42
A decrease in PI fixation duration from 2-D HUD to 3-D HUD indicates that the complexity of information was reduced between the 2-D HUD and 3-D HUD technologies. Essentially, these data indicates two possibilities. First, the information displayed in 3-D HUD may have been easier to cognitively process requiring a reduced amount of time to visually fixate the display. Second, the relative information during the 3-D HUD condition was not stationary to the PI’s visual field. Therefore, important information that pilots needed to fixate was constantly moving and subsequently re-fixated, thereby reducing the average fixation duration.
Across the HUD conditions, the CP data indicate that average blink duration and blink frequency increased for the 2-D HUD vs. the 3-D HUD. Typically, longer blink duration indicates a reduction in visual workload because the operator can relax the amount of time that they lose visual contact with their field of operation. Here, the CP’s behavior expressed a reduced visual workload for the 3-D HUD compared to the 2-D HUD because their blink duration and frequency was longer during the 3-D HUD condition. Interestingly, this same trend was not revealed in the PI data, which may indicate that during a high workload task (hovering in a DVE), these variables are not as sensitive to visual workload changes if the workload condition is fairly elevated.
The second set of conclusions that can be drawn from the brownout ocular activity data relate primarily to the TSAS as compared to the EDM/MDM. The increase in blink duration and blink frequency for pilots during a DVE condition indicates a reduction in visual workload. These data indicate that the tactile information of hover drift velocity was successfully offloaded from the visual system to the tactile system.
Contrary to these results, the CP data seem to indicate the opposite. Although the percent differences seem large between MDM/TSAS and EDM/None (–35% for blink duration and –25% for blink frequency), the practical significance cannot be well substantiated because both blink data variables are already low.
3.7 TAIS SA into the Cockpit Results
Data from the head and eye tracker system were categorized into five AOI that can be seen in figure 41. The OTW AOI includes all gaze data from copilots viewing the environmental scene. The AOI labeled PI instruments simply includes the center and PI instrument console. The heads-down data includes both the EDM and notepad, while primary display includes the instrument panel directly in front of the CP. The AOI labeled “other” includes all data that did not fall within one of the previously mentioned AOIs.

43
Figure 41. AOIs used to calculate visual workload.
Figure 42 shows the average percentage of time that the CP was visually focused in each AOI during vignette 1. Vignette 1 was flow during a mission scenario in which DAU were not automatically updated into the cockpit via an EDM. As can be seen, the CP spent nearly 79% of the time focusing at the EDM and notepad used to write down coordinates of dynamic airspace events. Since both of these AOI were able to move freely, the capability of the eye tracking system does not allow researchers to reliably resolve the exact percentage differences between the notepad and EDM. However, based on a review of the video it was generally observed that the CP spent a significant and unsafe portion of their time writing grid coordinates for dynamic airspace events. Furthermore, regardless of the area of fixation (EDM or notepad), both AOI require deep heads-down engagement.

44
Figure 42. Vignette 1 gaze percentages.
Figure 43 shows the percentage of time that the CP was visually focused in each AOI during vignette 2. During vignette 2 pilots were automatically provided geospatial references for DAUs directly to their EDM. Here, a fivefold increase in heads-up time was exhibited with the support of dynamic airspace information being transmitted directly to the EDM. Although 55.85% heads-down time is still a significant portion of time looking deep within the cockpit, it is important to note that these vignettes were designed to represent heavy navigational task loading on the CP. This was done in order to create a realistic environment that is representative of a very busy and dynamic airspace that is indicative of increasingly congested airspace.

45
Figure 43. Vignette 2 gaze percentages.
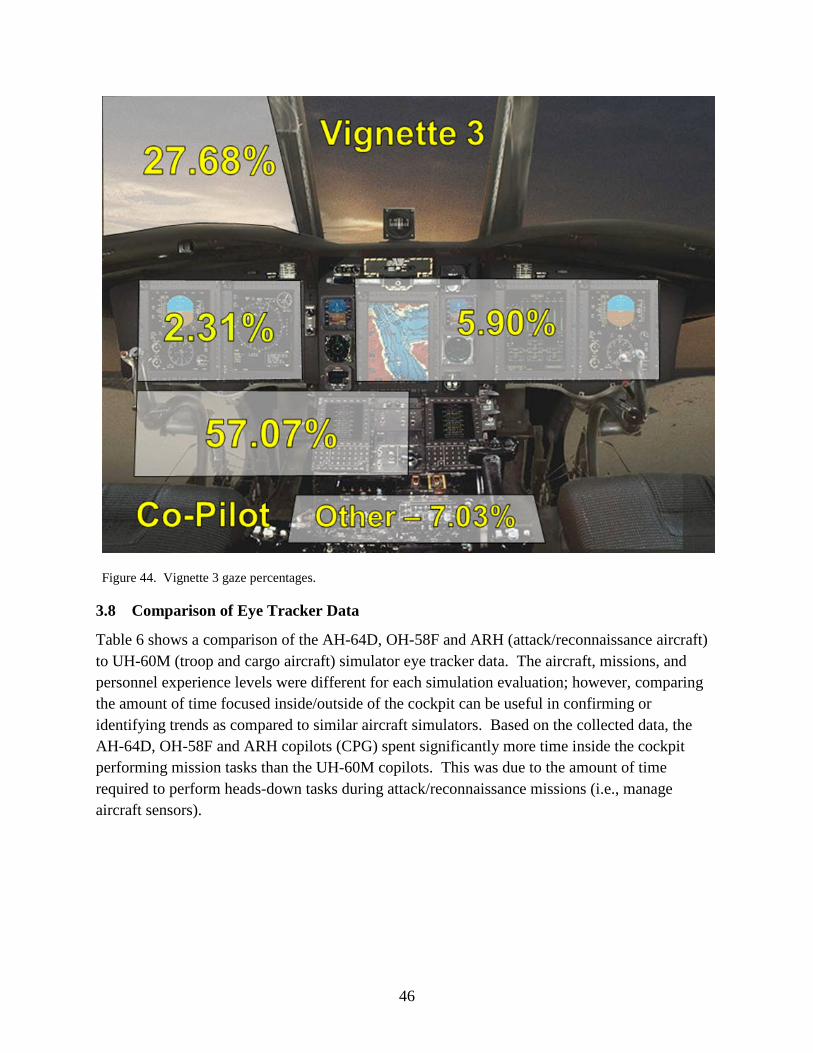
Figure 44 shows the percentage of time that the CP was visually focused in each AOI during vignette 3. During vignette 3, pilots were provided an auditory annunciation when DAUs were updated to their EDM. These data suggest that there is no difference in visual workload between vignette 2 and vignette 3. However, it was reported by the users that annunciations of dynamic events were helpful indicators that increased SA. During this test event, eye tracker data were not sensitive to annunciations of dynamic events that were present in vignette 3.
46
Figure 44. Vignette 3 gaze percentages.
3.8 Comparison of Eye Tracker Data
Table 6 shows a comparison of the AH-64D, OH-58F and ARH (attack/reconnaissance aircraft) to UH-60M (troop and cargo aircraft) simulator eye tracker data. The aircraft, missions, and personnel experience levels were different for each simulation evaluation; however, comparing the amount of time focused inside/outside of the cockpit can be useful in confirming or identifying trends as compared to similar aircraft simulators. Based on the collected data, the AH-64D, OH-58F and ARH copilots (CPG) spent significantly more time inside the cockpit performing mission tasks than the UH-60M copilots. This was due to the amount of time required to perform heads-down tasks during attack/reconnaissance missions (i.e., manage aircraft sensors).

47
Table 6. Simulator comparison data.
Simulator (Attack/Recon) Seat Outside Cockpit Inside Cockpit
AH-64D – IUAS (RACRS)
Front (CPG) 6% 94%
Back (PI)a 75% 25%
AH-64D - VUIT-2 (RACRS)
Front (CPG) 3% 97%
Back (PI)a 75% 25%
AH-64D (RACRS) (non UAS)
Front (CPG) 3% 97%
Back (PI)a 75% 25%
ARH (BHIVE 2) Left (CP) 7% 93%
Right (PI) 61% 39%
OH-58F CASUP (BHIVE 2)
Left (CP) 7% 93%
Right (PI) 63% 37%
Simulator (Cargo/Lift) Seat Outside Cockpit Inside Cockpit
UH-60M – EUD (BHIVE 1)
Left (CP)b — —
Right (PI) 72% 28%
UH-60M – LEUE (BHIVE 1)
Left (CP) 26% 74%
Right (PI) 61% 39%
UH-60M – LUT (SIL) Left (CP) 28% 72%
Right (PI) 86% 14%

48
Table 6. Simulator comparison data (continued).
Other Aviation Simulations Seat Outside Cockpit Inside Cockpit
TAIS SA Into the Cockpit Baseline
Vignette
Left (CP) 5% 95%
Right (PI)b — —
TAIS SA Into the Cockpit Upgrade
Vignettes with DAUs
Left (CP) 24% 76%
Right (PI)b — —
TAIS SA Into the Cockpit Vignettes with
DAUs and Annunciations
Left (CP) 28% 72%
Right (PI)b — —
Air SS 2-D HUD Vignettes
Left (CP) 79% 21%
Right (PI)b 89% 11%
Air SS 3-D HUD Vignettes
Left (CP) 85% 15%
Right (PI)b 88% 12% a.Data collected by ARL observation and survey. b.No data collected.
4. Conclusions
4.1 Conclusions
The head and eye tracker were useful in assessing visual gaze and dwell times for Army pilots. Helicopters are visually demanding systems that have a high risk associated with the loss of visual contact with important environmental features (e.g., elevated terrain, wires), and where multi-tasking during missions is necessary. During these complex tasks, the ocular system can be viewed as the primary limiting factor for several reasons. A PI can perceive and act upon information from multiple modalities simultaneously; however, the eye can only sample information with a high level of acuity from relatively small spatial areas in linear fashion. Furthermore, the spatial environment changes at such a pace that the rate of visual sampling must remain very high when compared to non-aviation task environments. When modifying the capability of existing aviation systems it is important to assess how the new task and/or functions redistribute the operators’ visual attention with the goal of ensuring that the PI and CP maintain enough spare visual capacity to keep their eyes outside of the aircraft as necessary for safe flight.
49
The head and eye tracker aided in assessment of crewstation design and PI workload. The most significant visual gaze and dwell time data obtained during missions are that AH-64D, OH-58F, and ARH (attack/scout) helicopter copilots spent significantly more time visually focused inside the cockpit during missions than the UH-60M helicopter copilots. This was mostly due to the workload required to operate the aircraft sensors and manage targeting information on the crewstation displays. The amount of time that the attack and scout copilots spent visually focused outside the aircraft (<10%) is likely too low to adequately assist the PI with crew tasks such as nearby obstacle avoidance and terrain flight. Identifying an optimal amount of time required for OTW surveillance is a difficult task that requires analysis of mission variables and aircraft requirements. However, future research in identifying optimal amounts of time that copilots should be visually focused outside of the aircraft is needed.
During post-mission interviews, most of the AH-64D, OH-58F, and ARH copilots stated that the amount of time they spent visually focused inside the simulator was similar to the amount of time they spend visually focused inside the aircraft. However, it is not possible to be certain if there are significant differences between visual workload in a simulator vs. the aircraft (e.g., no threat of injury or death when conducting missions in a simulator). Therefore, visual gaze and dwell times should be assessed in the AH-64D and OH-58D/F aircraft. Visual gaze and dwell times will continue to be assessed during future crewstation evaluations to help determine if CP workload precludes maintaining adequate visual focus outside the aircraft.

50
5. References
Durbin, D. B.; Hicks, J. S. AH-64D Apache Longbow Workload Assessment for Unmanned Aerial System (UAS) Employment; ARL-TR-4707; U.S. Army Research Laboratory: Fort Rucker, AL, 2009.
Durbin, D. B.; Hicks, J. S. Human Factors Evaluation of the Armed Reconnaissance Helicopter (ARH) Common Avionics Architecture System (CAAS) Crewstation; U.S. Army Research Laboratory: Fort Rucker, AL, unpublished report, 2006.
Havir, T. J.; Durbin, D. B.; Frederick, L. J. Human Factors Assessment of the UH-60M Common Avionics Architecture System (CAAS) Crew Station During the Limited Early User Evaluation (LEUE); ARL-MR-0634; U.S. Army Research Laboratory: Fort Rucker, AL, 2005.
Havir, T. J.; Durbin, D. B.; Frederick, L. J.; Hicks, J. S. Human Factors Assessment of the UH-60M Crew Station During the Limited User Test (LUT); ARL-TR-3730; U.S. Army Research Laboratory: Fort Rucker, AL, 2006.
Hicks, J. S.; Durbin, D. B.; Sperling, B. AH-64D Apache Longbow/Video from UAS for Interoperability Teaming Level II; ARL-TR-4724; U.S. Army Research Laboratory: Fort Rucker, AL, 2009.
Jessee, M. S. Examining the Convergent and Discriminant Validity of Visual and Mental Workload Using Ocular Activity Variables; ARL-TR-5132; U.S. Army Research Laboratory: Redstone Arsenal, AL, 2010.
Kennedy, J. S.; Durbin, D. Human Factors Assessment of the UH-60M Crew Station During the Early User Demonstration No. 2 (EUD2); ARL-MR-0607; U.S. Army Research Laboratory: Fort Rucker, AL, 2005.
Lens, A.; Nemeth, S. C.; Ledford, J. K. Ocular Anatomy and Physiology 2nd. ed.. SLACK Incorporated, Thorofare, NJ, ISBN 978-1-55642-792-3, 2008.
Morris A.; Jessee S.; Davis B. Human factors Engineering Evaluation of the UH-60M Block III Software Early User Demonstration. U.S. Army Research Laboratory, (February 2012 expected publication date) (unpublished).
Sapp J.; Jessee S.; Crutcher J.; King M. C.; Morris A., Human Factors Engineering Evaluation of the CH-47F Horizontal Situation Display Hover; ARL-TR-5882; U.S. Army Research Laboratory: Redstone Arsenal, AL, 2012.

51
Tole, J. R.; Stephens, A. T.; Vivaudou, M.; Ephrath, A. R.; Young, L. R. Visual Scanning Behavior and Pilot Workload (NASA contractor report, no. 3717). Hampton, VA: Langley Research Center, 1983.
Veltman, J. A.; Gaillard, A. W. K. Physiological Workload Reactions to Increasing Levels of Task Difficulty. Ergonomics 1998, 41 (5).

52
List of Symbols, Abbreviations, and Acronyms
2-D two-dimension(al)
3-D three-dimension(al)
AED Aviation Engineering Directorate
AGL above ground level
Air SS Air Soldier System
ALSE Aviation Life Support Equipment
AMRDEC Aviation and Missile Research, Development and Engineering Center
ANOVA analysis of variance
AOI area(s) of interest
ARH Armed Reconnaissance Helicopter
ARL U.S. Army Research Laboratory
ASE Aircraft Survivability Equipment
ASL Applied Science Laboratories
ATEC Army Test and Evaluation Command
ATTC Aviation Technical Test Center
AWACS Airborne Warning and Control System
BHEAC UH-60M Blackhawk Helicopter Engineering and Analysis Cockpit
BHIVE Battlefield Highly Immersive Virtual Environment
CAAS Common Aviation Architecture System
CASUP OH-58F Cockpit and Sensor Upgrade Program
CDU cockpit display unit
CFIT controlled flight into terrain
CH-EAC Cargo Helicopter – Engineering Analysis Cockpit
CP copilot
CPG Copilot/Gunner
CSWG Crewstation Working Group
DAU dynamic airspace update
DVE degraded visual environment

53
EDM Electronic Data Manager
EUD Early User Demonstration
FCR fire control radar
FMS flight management system
FOV Field of View
HDTS Helmet Display Tracking System
HDU Helmet Display Unit
HFE Human Factors Engineering
HMD helmet mounted displays
HRED Human Research and Engineering Directorate
HSD Horizontal Situation Display
HSDH Horizontal Situation Display Hover
HUD Heads-Up Display
IFR instrument flight rules
IMC instrument meteorological conditions
IR infrared
IUAS Integrated UAS
LEUE Limited Early User Evaluation
LRSD long range surveillance detachment
LUT Limited User Test
MDM Mission Display Module
MEDEVAC medical evacuation
MFD multi-functional display
MPD multi-purpose display
MTADS Modernized Target Acquisition and Designation Sight
NMS nose mounted sensor
NVG Night Vision Goggle
OTW out-the-window
PI pilot
PNVS pilot night vision system
PVI Pilot Vehicle Interface
54
RACRS Risk and Cost Reduction System
RAD ALT Radar Altimeter
SA situation(al) awareness
SIL Systems Integration Laboratory
SME subject-matter expert
TADS Target Acquisition Designation Sight
TAIS Tactical Airspace Integration System
TCM TRADOC Capabilities Manager
TEDAC TADS Electronic Display and Control
TRADOC U.S. Army Training and Doctrine Command
TSAS Tactile Situational Awareness System
TSD Tactical Situation Display
UAS unmanned aircraft system
USAARL U.S. Army Aeromedical Research Laboratory
VFR visual flight rules
VMC visual meteorological conditions
VSI Vertical Speed Indicator
VUIT-2 Video from UAS for Interoperability Teaming Level II

NO. OF COPIES ORGANIZATION
55
1 DEFENSE TECHNICAL (PDF INFORMATION CTR only) DTIC OCA 8725 JOHN J KINGMAN RD STE 0944 FORT BELVOIR VA 22060-6218 1 DIRECTOR US ARMY RESEARCH LAB IMNE ALC HRR 2800 POWDER MILL RD ADELPHI MD 20783-1197 1 DIRECTOR US ARMY RESEARCH LAB RDRL CIO LL 2800 POWDER MILL RD ADELPHI MD 20783-1197 1 DIRECTOR US ARMY RESEARCH LAB RDRL CIO MT 2800 POWDER MILL RD ADELPHI MD 20783-1197 1 DIRECTOR US ARMY RESEARCH LAB RDRL D 2800 POWDER MILL RD ADELPHI MD 20783-1197

NO. OF NO. OF COPIES ORGANIZATION COPIES ORGANIZATION
56
1 ARMY RSCH LABORATORY – HRED RDRL HRM C A DAVISON 320 MANSCEN LOOP STE 115 FORT LEONARD WOOD MO 65473 3 ARMY RSCH LABORATORY – HRED RDRL HRM DI T DAVIS J HANSBERGER S JESSEE BLDG 5400 RM C242 REDSTONE ARSENAL AL 35898-7290 1 ARMY RSCH LABORATORY – HRED RDRL HRS EA DR V J RICE BLDG 4011 RM 217 1750 GREELEY RD FORT SAM HOUSTON TX 78234-5002 1 ARMY RSCH LABORATORY – HRED RDRL HRM DG K GUNN BLDG 333 PICATINNY ARSENAL NJ 07806-5000 2 ARMY RSCH LABORATORY – HRED AWC FIELD ELEMENT RDRL HRM DJ D DURBIN J HICKS BLDG 4506 (DCD) RM 107 FORT RUCKER AL 36362-5000 1 ARMY RSCH LABORATORY – HRED RDRL HRM CK J REINHART 10125 KINGMAN RD BLDG 317 FORT BELVOIR VA 22060-5828 1 ARMY RSCH LABORATORY – HRED RDRL HRM AY M BARNES 2520 HEALY AVE STE 1172 BLDG 51005 FORT HUACHUCA AZ 85613-7069 1 ARMY RSCH LABORATORY – HRED RDRL HR MP D UNGVARSKY POPE HALL BLDG 470 BCBL 806 HARRISON DR FORT LEAVENWORTH KS 66027-2302
1 ARMY RSCH LABORATORY – HRED RDRL HRM DQ M R FLETCHER NATICK SOLDIER CTR AMSRD NSC WS E BLDG 3 RM 343 NATICK MA 01760-5020 1 ARMY RSCH LABORATORY – HRED RDRL HRM AT J CHEN 12350 RESEARCH PKWY ORLANDO FL 32826-3276 1 ARMY RSCH LABORATORY – HRED RDRL HRM AT C KORTENHAUS 12350 RESEARCH PKWY ORLANDO FL 32826 1 ARMY RSCH LABORATORY – HRED RDRL HRM AS C MANASCO SIGNAL TOWERS BLDG 29808A RM 303A FORT GORDON GA 30905-5233 1 ARMY RSCH LABORATORY – HRED FIRES CTR OF EXCELLENCE FIELD ELEMENT RDRL HRM AF C HERNANDEZ 3040 NW AUSTIN RD RM 221 FORT SILL OK 73503-9043 1 ARMY RSCH LABORATORY – HRED RDRL HRM AV S MIDDLEBROOKS 91012 STATION AVE FORT HOOD TX 76544-5073 1 ARMY RSCH LABORATORY – HRED RDRL HRM CN R SPENCER DCSFDI HF HQ USASOC BLDG E2929 FORT BRAGG NC 28310-5000 1 ARMY RSCH LABORATORY – HRED HUMAN RSRCH AND ENGRNG DIRCTRT MCOE FIELD ELEMENT RDRL HRM DW E REDDEN 6450 WAY ST BLDG 2839 RM 310 FORT BENNING GA 31905-5400

NO. OF COPIES ORGANIZATION
57
1 ARMY G1 (CD DAPE MR B KNAPP only) 300 ARMY PENTAGON RM 2C489 WASHINGTON DC 20310-0300
ABERDEEN PROVING GROUND 5 DIR USARL RDRL HR L ALLENDER T LETOWSKI RDRL HRM P SAVAGE-KNEPSHIELD RDRL HRS D B AMREIN

58
INTENTIONALLY LEFT BLANK.