A Study on Slotted Square and Rectangular Hollow ... · Council of Canada and Steel Structures...
246
A Study on Slotted Square and Rectangular Hollow Structural Section Connections by Ruogang Zhao, B.Eng Wuhan University o f Hydraulic and Electrical Engineering, China A thesis submitted to the Faculty of Graduate Studies and Research in partial fulfillment o f the requirements for the degree o f Master of Applied Science Ottawa-Carleton Institute for Civil Engineering Department o f Civil and Environmental Engineering Carleton University Ottawa, Ontario, Canada December 2005 Copyright© Ruogang Zhao, 2005 Reproduced with permission of the copyright owner. Further reproduction prohibited without permission.
Transcript of A Study on Slotted Square and Rectangular Hollow ... · Council of Canada and Steel Structures...

A Study on Slotted Square and Rectangular Hollow Structural Section Connections
by
Ruogang Zhao, B.Eng
Wuhan University of Hydraulic and Electrical Engineering, China
A thesis submitted to the Faculty of Graduate Studies and Research in partial fulfillment of the requirements for the
degree of
Master o f Applied Science
Ottawa-Carleton Institute for Civil Engineering
Department o f Civil and Environmental Engineering
Carleton University
Ottawa, Ontario, Canada
December 2005
Copyright© Ruogang Zhao, 2005
Reproduced with permission of the copyright owner. Further reproduction prohibited without permission.

1*1 Library and Archives Canada
Published Heritage Branch
395 Wellington Street Ottawa ON K1A 0N4 Canada
Bibliotheque et Archives Canada
Direction du Patrimoine de I'edition
395, rue Wellington Ottawa ON K1A 0N4 Canada
Your file Votre reference ISBN: 0-494-13454-2 Our file Notre reference ISBN: 0-494-13454-2
NOTICE:The author has granted a nonexclusive license allowing Library and Archives Canada to reproduce, publish, archive, preserve, conserve, communicate to the public by telecommunication or on the Internet, loan, distribute and sell theses worldwide, for commercial or noncommercial purposes, in microform, paper, electronic and/or any other formats.
AVIS:L'auteur a accorde une licence non exclusive permettant a la Bibliotheque et Archives Canada de reproduire, publier, archiver, sauvegarder, conserver, transmettre au public par telecommunication ou par I'lnternet, preter, distribuer et vendre des theses partout dans le monde, a des fins commerciales ou autres, sur support microforme, papier, electronique et/ou autres formats.
The author retains copyright ownership and moral rights in this thesis. Neither the thesis nor substantial extracts from it may be printed or otherwise reproduced without the author's permission.
L'auteur conserve la propriete du droit d'auteur et des droits moraux qui protege cette these.Ni la these ni des extraits substantiels de celle-ci ne doivent etre imprimes ou autrement reproduits sans son autorisation.
In compliance with the Canadian Privacy Act some supporting forms may have been removed from this thesis.
While these forms may be included in the document page count, their removal does not represent any loss of content from the thesis.
Conformement a la loi canadienne sur la protection de la vie privee, quelques formulaires secondaires ont ete enleves de cette these.
Bien que ces formulaires aient inclus dans la pagination, il n'y aura aucun contenu manquant.
i * i
CanadaReproduced with permission of the copyright owner. Further reproduction prohibited without permission.

ACKNOWLEDGMENTS
I would like to express sincere gratitude to my thesis supervisor, Professor.
Heng Aik Khoo for his guidance and support throughout this project.
I am grateful for the staff o f John Adjeleian Laboratory o f Department of Civil
and Environmental Engineering at Carleton University for their hard work and
professional suggestions.
Thanks should also go to Rongfeng Huang, Yu Kang and Zhiqi Wen, who has
provided valuable help in the tests and thesis proof reading.
Final thanks go to my mother for her support and love during the course of study.
This research project is funded by the National Science and Engineering Research
Council o f Canada and Steel Structures Education Foundation through Professor
Heng Aik Khoo.
iii
Reproduced with permission of the copyright owner. Further reproduction prohibited without permission.
ABSTRACT
A numerical study has been carried out on slotted rectangular (RHS) and square
(SHS) structural hollow section connections with and without welding at the end o f the
gusset plate. The effect o f weld length ratio, slot orientation, gusset plate thickness, slot
opening length and weld height on slotted RHS or SHS connections were investigated
numerically. A total of four rectangular and square HSS specimens were also tested.
Results from the current study support findings from other research that show
provisions to account for the effect of shear lag in slotted RHS or SHS connections are
overly conservative in the design standard for both the Canadian CSA-S16.1-01 and the
American ANSI/AISC-360-05. Shear lag has been found to have no effect on the
tensile strength of a square or a rectangular hollow section when a weld length ratio is
larger than 0.8 for a connection with end welding and when the ratio is larger than 0.9 for
a connection without end welding. Parameters such as orientation o f the slot opening,
slot opening length, gusset plate thickness, weld height, welding at the end o f the gusset
plate and material properties o f HSS comer have been found to have some effect on the
strength o f slotted HSS connections under some specific conditions.
Based on results o f the study, guidelines for designing an economical
full-strength slotted RHS or SHS connection with or without end welding are developed
for CSA-S16.1-01. Improvements to provisions in CSA-S16.1-01 and AISC design
standards were also proposed.
iv
Reproduced with permission of the copyright owner. Further reproduction prohibited without permission.
Table of Contents
Chapter Page
Chapter 1 Introduction............................................................................................ 1
1.1 Objective of the Thesis.......................................................................................... 2
1.2 Methodology Used in the Research...................................................................... 3
1.3 Organization of the Thesis..................................................................................... 5
Chapter 2 Literature Review................................................................................... 9
2.1 Shear lag................................................................................................................... 9
2.2 Provisions in design standards for shear lag in welded tension members 10
2.2.1 CSA -S16.1-01......................................................................................... 10
2.2.2 AISC-LRFD-1999................................................................................... 13
2.2.3 AISC Design Specification for Steel Hollow Structural Section 14
2.2.4 ANSI/AISC 360-05 ................................................................................. 15
2.3 Research on Shear L ag .......................................................................................... 17
2.3.1 Shear Lag on Bolted Connections........................................................... 17
2.3.2 Shear Lag in Welded Connection......................................................... 19
2.3.2.1 Shear Lag in Open Sections Connections.............................. 19
2.3.2.2 Shear lag in HSS connections................................................ 21
2.3.2.3 Numerical simulation for slotted HSS connections 24
2.4 Determination of true stress versus true strain relationship............................. 26
v
Reproduced with permission of the copyright owner. Further reproduction prohibited without permission.

Chapter 3 Testing Program.................................................................................. 35
3.1 Objective................................................................................................................. 36
3.2 Specimen details.................................................................................................... 36
3.3 Specimen measurement and designation............................................................ 37
3.4 Test setup and instrumentation............................................................................. 38
3.5 Test procedure........................................................................................................ 39
3.6 Material properties................................................................................................. 40
3.7 Test results and discussions.................................................................................. 41
3.7.1 Test results................................................................................................ 42
Chapter 4 Material Properties................................................................................ 64
4.1 True stress versus true strain curve.................................................... 65
4.1.1 True stress versus true strain curve up to the peak load..................... 65
4.1.2 True stress versus true strain curve after the peak load .................... 66
4.2 Determining failure limit o f the material.............................................................. 68
4.3 Material properties o f HSS com er......................................................................... 71
Chapter 5 Finite Element Modeling and Verification......................................... 80
5.1 Finite Element M odel........................................................................................... 80
5.1.1 Shell element versus solid element....................................................... 83
5.1.2 Element type comparison on the slotted HSS connection model ... 84
5.1.3 Mesh study............................................................................................... 85
5.1.3.1 HSS mesh densities at the end of gusset p la te .................... 85
vi
Reproduced with permission of the copyright owner. Further reproduction prohibited without permission.
5.1.3.2 Layers o f solid element in the patch..................................... 86
5.1.4 Critical equivalent plastic strain lim it.................................................. 87
5.1.5 Modeling end weld.................................................................................. 88
5.2 Validation o f the m odels....................................................................................... 88
5.2.1 Material properties for HSS comer....................................................... 90
5.2.2 Crack propagation analyses ................................................................. 91
5.2.3 HSS connections with no end welding - phase 1 testing program... 91
5.2.3.1 Net section efficiency............................................................. 92
5.2.3.2 Load versus displacement curve........................................... 93
5.2.4 HSS connections with end welding - phase 2 testing program 95
5.2.5 HSS specimens tested by Korol (1996)............................................... 98
Chapter 6 PARAMETRIC STUDY...................................................................... 129
6.1 Parameters considered in the parametric study.................................................. 129
6.2 Numerical models for the parametric study....................................................... 131
6.3 Discussion of the parametric study result.......................................................... 132
6.3.1 Parametric study for HSS connections with no end welding 133
6.3.1.1 HSS wall thickness................................................................. 133
6.3.1.2 Size factor................................................................................. 134
6.3.1.3 Gusset plate thickness (t) ...................................................... 134
6.3.1.4 Straight segment length o f the slot-opening (GS) ............ 135
6.3.1.5 Weld height (wh) .................................................................. 137
vii
Reproduced with permission of the copyright owner. Further reproduction prohibited without permission.
6.3.1.6 Aspect ratio (a/b).................................................................... 138
6.3.1.7 Weld length ratio (L/w) ....................................................... 140
6.3.1.8 Proposed equations for net section efficiency..................... 140
6.3.2 Parametric study for HSS connections with end welding................. 143
6.3.2.1 Gusset plate thickness (t)....................................................... 143
6.3.2.2 Aspect ratio (a/b) ................................................................. 144
6.3.2.3 Weld length ratio (L/w) ....................................................... 145
6.3.2.4 Comparison to the proposed net section efficiency
equation ................................................................................. 146
6.4 Net section efficiency based on outstanding area............................................ 146
6.5 Guidelines to Design Full-Strength Slotted HSS Members............................. 148
Chapter 7 Summary, Conclusions and Recommendations.............................. 174
7.1 Summary................................................................................................................. 174
7.2 Conclusions............................................................................................................. 176
7.3 Recommendations.................................................................................................. 178
References...................................................................................................................... 180
Appendix A: Test of HSS Specimens (phase 1)........................................................ 186
Appendix B: Additional Test Data............................................................................. 193
Appendix C: Tension Coupon Test............................................................................ 197
Appendix D: Iterative method to determine the true stress versus true plastic
strain relationship................................................................................ 206
viii
Reproduced with permission of the copyright owner. Further reproduction prohibited without permission.
Appendix E: Korol’s Test Results.............................................................................. 211
Appendix F: Additional Results from Parametric Study...................................... 212
Appendix G: The Net Section Eccentricity Calculation........................................ 218
ix
Reproduced with permission of the copyright owner. Further reproduction prohibited without permission.
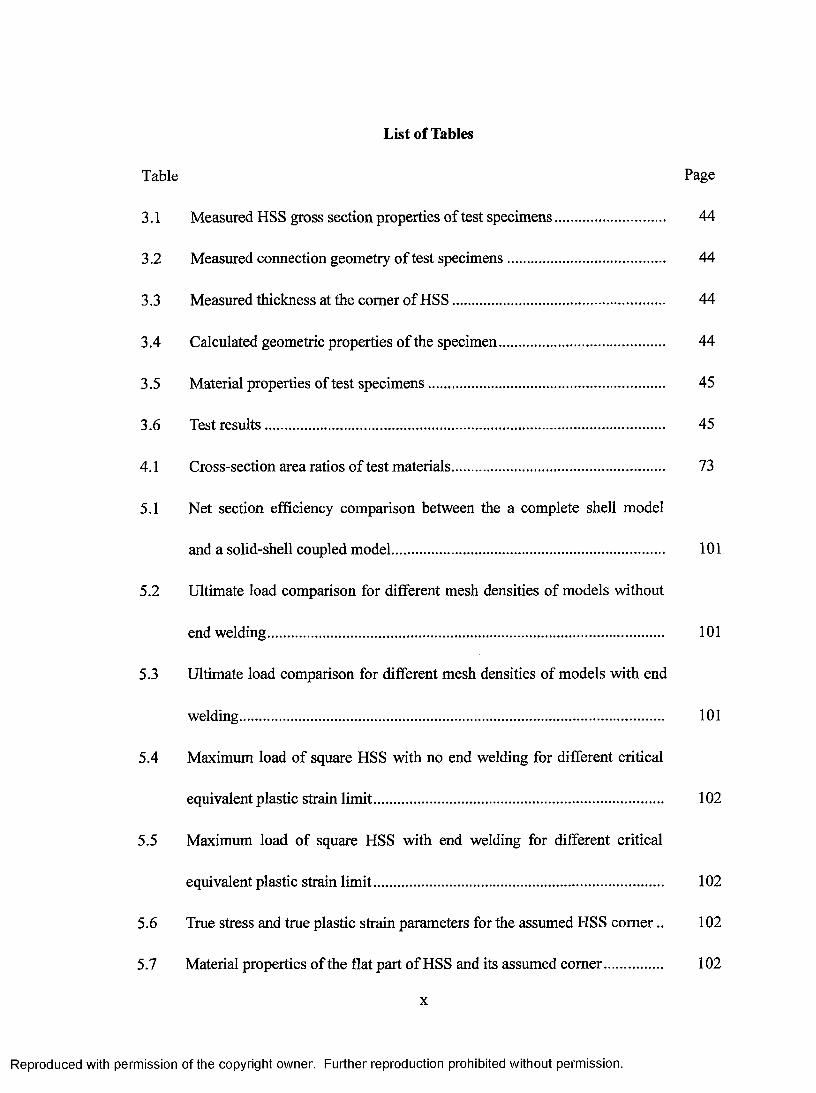
List of Tables
Table Page
3.1 Measured HSS gross section properties o f test specimens.................. 44
3.2 Measured connection geometry o f test specimens............................... 44
3.3 Measured thickness at the comer o f HS S .............................................. 44
3.4 Calculated geometric properties o f the specimen................................. 44
3.5 Material properties of test specimens.................................................... 45
3.6 Test results................................................................................................. 45
4.1 Cross-section area ratios o f test materials.............................................. 73
5.1 Net section efficiency comparison between the a complete shell model
and a solid-shell coupled model............................................................ 101
5.2 Ultimate load comparison for different mesh densities o f models without
end welding.............................................................................................. 101
5.3 Ultimate load comparison for different mesh densities of models with end
welding..................................................................................................... 101
5.4 Maximum load o f square HSS with no end welding for different critical
equivalent plastic strain lim it................................................................ 102
5.5 Maximum load of square HSS with end welding for different critical
equivalent plastic strain lim it................................................................. 102
5.6 True stress and true plastic strain parameters for the assumed HSS com er.. 102
5.7 Material properties o f the flat part o f HS S and its assumed com er................. 102
x
Reproduced with permission of the copyright owner. Further reproduction prohibited without permission.
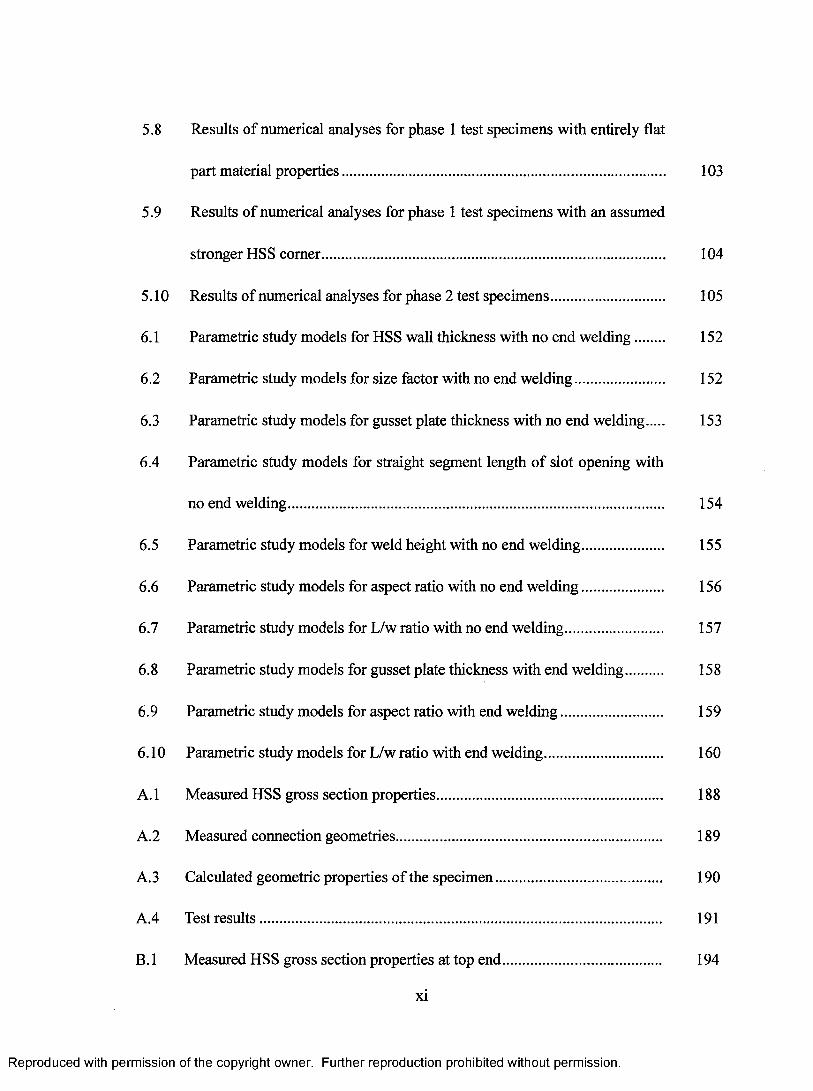
5.8 Results of numerical analyses for phase 1 test specimens with entirely flat
part material properties........................................................................................ 103
5.9 Results o f numerical analyses for phase 1 test specimens with an assumed
stronger HSS comer.............................................................................................. 104
5.10 Results o f numerical analyses for phase 2 test specimens................................ 105
6.1 Parametric study models for HSS wall thickness with no end welding 152
6.2 Parametric study models for size factor with no end welding.......................... 152
6.3 Parametric study models for gusset plate thickness with no end welding 153
6.4 Parametric study models for straight segment length o f slot opening with
no end welding...................................................................................................... 154
6.5 Parametric study models for weld height with no end welding........................ 155
6.6 Parametric study models for aspect ratio with no end welding....................... 156
6.7 Parametric study models for L/w ratio with no end welding............................ 157
6.8 Parametric study models for gusset plate thickness with end welding 158
6.9 Parametric study models for aspect ratio with end welding............................. 159
6.10 Parametric study models for L/w ratio with end welding................................. 160
A. 1 Measured HSS gross section properties................................................ 188
A.2 Measured connection geometries......................................................................... 189
A. 3 Calculated geometric properties o f the specimen................................ 190
A.4 Test results............................................................................................................. 191
B. 1 Measured HSS gross section properties at top end............................................ 194
xi
Reproduced with permission of the copyright owner. Further reproduction prohibited without permission.
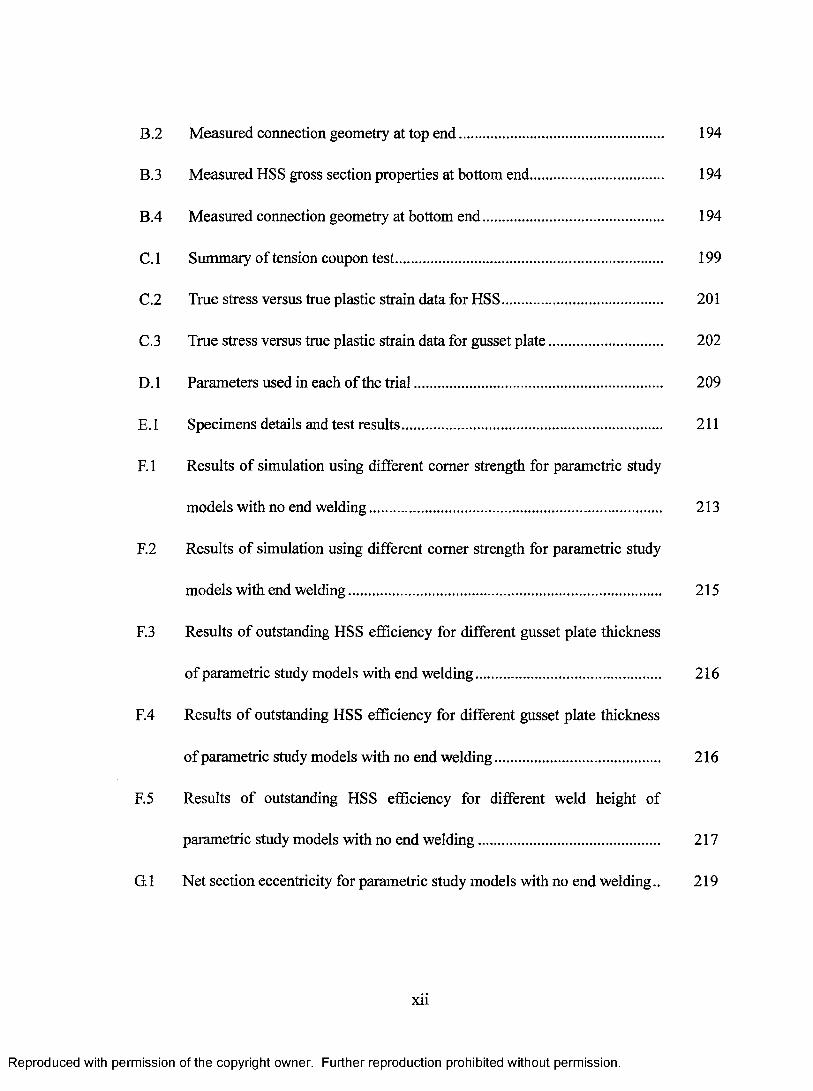
B.2 Measured connection geometry at top end ............................................. 194
B.3 Measured HSS gross section properties at bottom end......................... 194
B.4 Measured connection geometry at bottom end...................................... 194
C. 1 Summary of tension coupon test.............................................................. 199
C.2 True stress versus true plastic strain data for HSS................................. 201
C.3 True stress versus true plastic strain data for gusset plate.................... 202
D. 1 Parameters used in each o f the trial........................................................ 209
E. 1 Specimens details and test results............................................................ 211
F. 1 Results o f simulation using different comer strength for parametric study
models with no end welding................................................................... 213
F.2 Results of simulation using different comer strength for parametric study
models with end welding........................................................................ 215
F.3 Results o f outstanding HSS efficiency for different gusset plate thickness
o f parametric study models with end welding...................................... 216
F.4 Results o f outstanding HSS efficiency for different gusset plate thickness
o f parametric study models with no end welding................................ 216
F.5 Results o f outstanding HSS efficiency for different weld height of
parametric study models with no end welding.................................... 217
G. 1 Net section eccentricity for parametric study models with no end welding.. 219
xii
Reproduced with permission of the copyright owner. Further reproduction prohibited without permission.
List of Figures
Figure.........................................................................................................................................Page
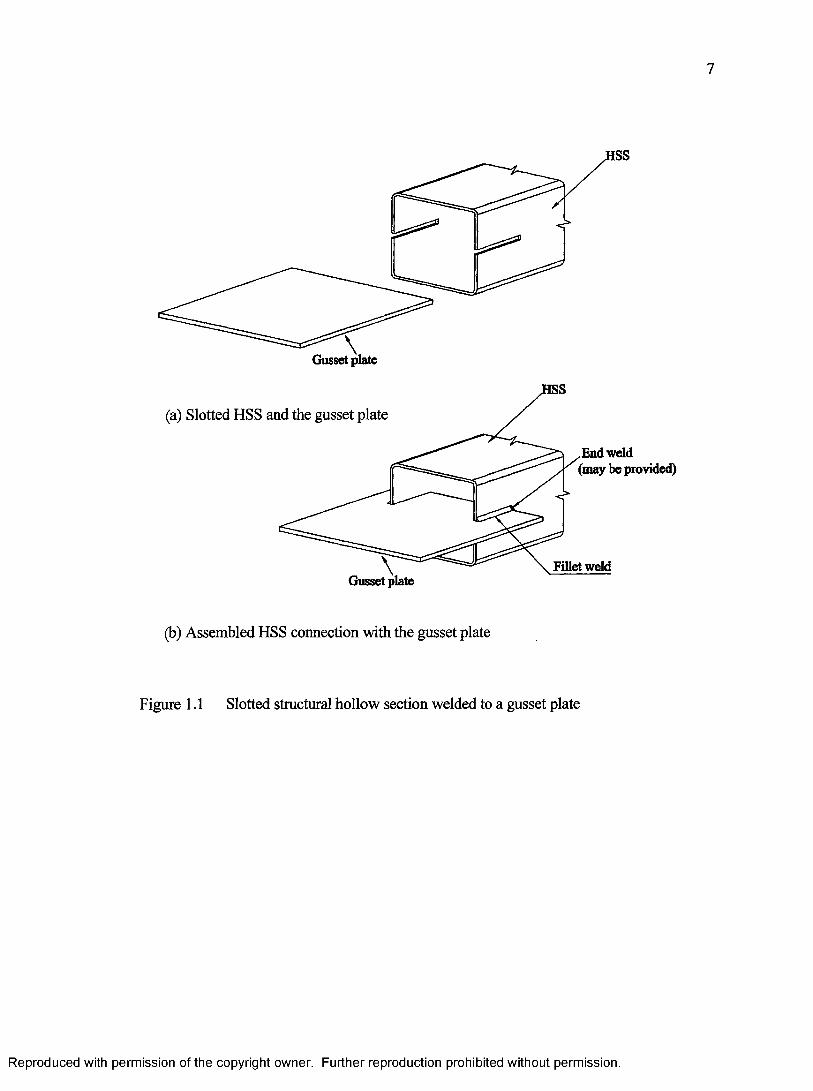
1.1 Slotted structural hollow section welded to a gusset p la te ............................... 7
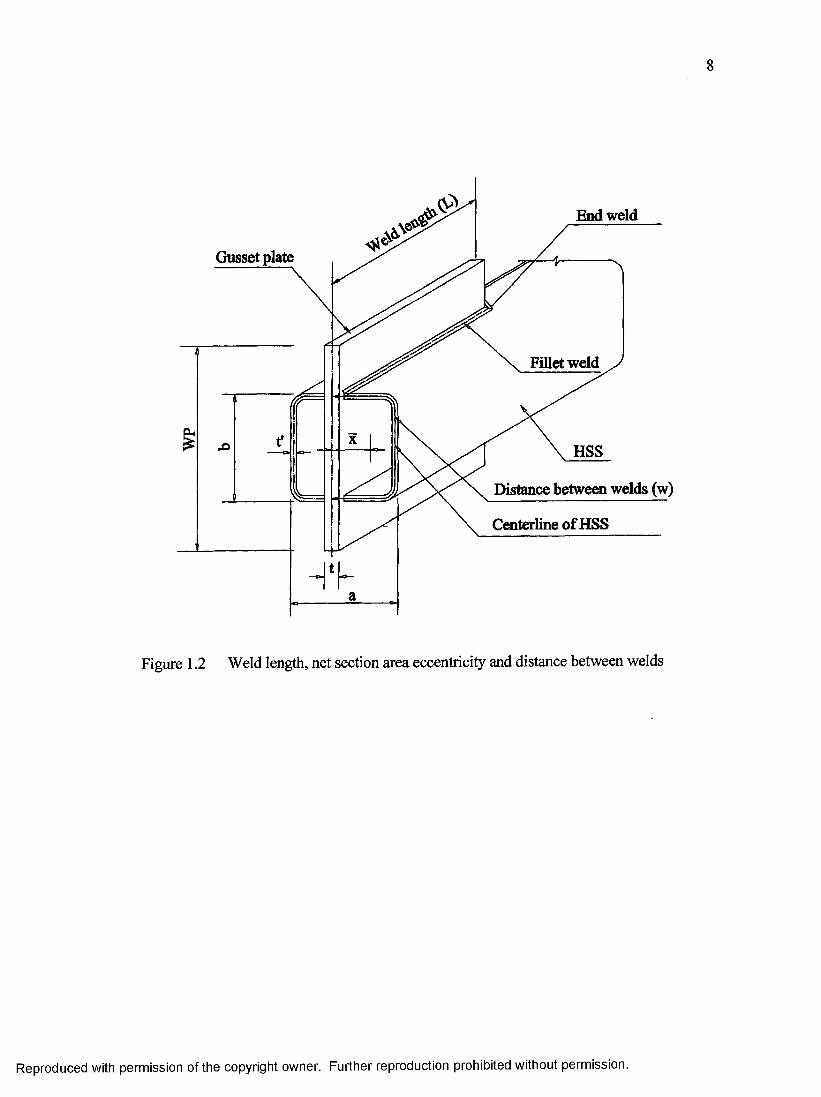
1.2 Weld length, net section area eccentricity and distance between w elds 8
2.1 I shape section connected only to the flanges.................................................... 32
2.2 Non-uniform stress distribution in the web of an I shape section.................. 32
2.3 The configuration tested by Munse and Chesson (1963).................................. 33
2.4 Slot orientation of the HSS connection................................................................ 33
2.5 Deformed cross-section shape o f tension coupons............................................. 34
3.1 Slotted HSS connection with end welding.......................................................... 46
3.2 The specimen geometry......................................................................................... 47
3.3 Comer o f the HSS................................................................................................... 48
3.4 Connection eccentricity......................................................................................... 48
3.5 Definition o f the distance between the welds (w).............................................. 49
3.6 Test setup................................................................................................................. 50
3.7 Test setup details..................................................................................................... 51
3.8 End fixture assemblies........................................................................................... 52
3.9 Locations o f LVDT................................................................................................ 53
3.10 Locations o f strain gauges.................................................................................... 54
3.11 Comer tension coupon........................................................................................... 55
3.12 A tension coupon test in the testing machine..................................................... 56
xiii
Reproduced with permission of the copyright owner. Further reproduction prohibited without permission.

3.13 Engineering stress versus engineering strain for HSS 8 9 x 8 9 tension
coupons.................................................................................................................. 57
3.14 Engineering stress versus engineering strain for HSS 127x51 tension
coupons.................................................................................................................. 57
3.15 Engineering stress versus engineering strain for 16 mm gusset plate
tension coupons..................................................................................................... 58
3.16 Engineering stress versus engineering strain for comer coupons..................... 58
3.17 A typical square HS S specimen failure at the mid-length................................. 59
3.18 Cracks initiation o f the rectangular HSS specimen R07.................................... 60
3.19 Failure o f the rectangular HSS specimen R07 .................................................. 61
3.20 Load versus average LVDT displacement for HSS 89 x 89 specimens 62
3.21 Load versus average LVDT displacement for the HSS 127 x 51 specimen.. 62
3.22 Strain distribution for HSS 89 x 89 specimens at different stages of
loading.................................................................................................................... 63
4.1 Axisymmetric model of the circular coupon........................................................ 74
4.2 Engineering stress versus change in cross-section area for HSS 89 x 89
(phase 1) tension coupons..................................................................................... 75
4.3 Engineering stress versus change in cross-section area for HSS 127 x 51
tensions coupons..................................................................................................... 75
4.4 Engineering stress versus change in cross-section area for HSS 89 x 89
(phase 2) tension coupons..................................................................................... 76
xiv
Reproduced with permission of the copyright owner. Further reproduction prohibited without permission.

4.5 Engineering stress versus change in cross-section area for 12 mm gusset
plate tension coupons............................................................................................ 76
4.6 Engineering stress versus change in cross-section area for phase 1 16 mm
gusset plate tension coupons................................................................ 77
4.7 Engineering stress versus change in cross-section area for 20 mm gusset
plate tension coupons............................................................................................ 77
4.8 Engineering stress versus change in cross-section area for phase 2 16 mm
gusset plate tension coupons................................................................................. 78
4.9 True stress versus true plastic strain curves for H SS.......................................... 78
4.10 True stress versus true plastic strain curves for gusset plates............................ 79
5.1 Modeling o f the fillet weld with three weld zones............................................ 106
5.2 The typical mesh for the HSS connection model with end welding............... 107
5.3 The typical mesh for the HSS connection model with end welding................. 108
5.4 Enlarged view of the mesh at slot opening area for the HSS connection
model without end welding................................................................................... 109
5.5 Enlarged view o f the mesh at the slot opening area for the HSS connection
model with end welding........................................................................................ 110
5.6 Tension coupon model with solid or shell elements.......................................... I l l
5.7 Engineering stress versus engineering strain o f tension coupon modeled
with shell and solid elements............................................................................... 112
xv
Reproduced with permission of the copyright owner. Further reproduction prohibited without permission.
5.8 Load versus displacement curve for solid patch and lull shell models for
square HSS connections....................................................................................... 112
5.9 Different mesh densities o f the solid element patch for a HSS connection
model with no end welding................................................................................. 113
5.10 Different mesh densities o f the solid element patch for a HSS connection
model with end welding....................................................................................... 114
5.11 Load versus LVDT displacement curves of HSS 89 x 89 models without
end welding for different mesh densities........................................................... 115
5.12 Load versus LVDT displacement curves o f HSS 89 x 89 models with end
welding for different mesh densities at L/w = 0.4 and 0 .5 .................. 115
5.13 Load versus LVDT displacement curves o f HSS 89 x 89 models with end
welding for different mesh densities at L/w = 1 .0 ................................ 116
5.14 Load versus LVDT displacement curves of HSS 89 x 89 models without
end welding for two and four layers o f solid element patches........... 116
5.15 Load versus LVDT displacement curves o f HSS 89x89 models without
end welding for different equivalent plastic strain limit.................................. 117
5.16 Load versus LVDT displacement curves o f HSS 89x89 models with end
welding for different equivalent plastic strain limit at L/w = 0 .4 ................... 117
5.17 Load versus LVDT displacement curves o f HSS 89x89 models with end
welding for different equivalent plastic strain limit at L/w = 1 .0 ................... 118
xvi
Reproduced with permission of the copyright owner. Further reproduction prohibited without permission.
5.18 Weld modeling at the end of the gusset plate for HSS connections with
end welding ......................................................................................................... 118
5.19 Load versus LVDT displacement curves of HSS 89x89 models with end
welding for different end welding schemes...................................................... 119
5.20 Engineering stress versus change in cross-section area curves for
HSS 89 x 89 together with assumed com er....................................................... 119
5.21 Engineering stress versus change in cross-section area curves for
HSS 127 x 51 together with assumed com er.................................................... 120
5.22 Engineering stress versus engineering strain curves for HSS 89 x 89
(phase 1) and HSS 127 x 51 together with assumed com er............................ 120
5.23 Engineering stress versus engineering strain curves for HSS 89 x 89
(phase 2) together with assumed com er............................................................ 121
5.24 Test and simulation load versus LVDT displacement curves for rectangular
HSS specimen with end welding........................................................................ 121
5.25 Test and simulation load versus LVDT displacement curves for
SM3G05P20 and SM3G05P20R at L/w = 0.79................................................ 122
5.26 Test and simulation load versus LVDT displacement curves for
SM5G05P20 and SM5G05P20R at L/w = 1.33................................................ 122
5.27 Test and simulation load versus LVDT displacement curves for rectangular
HSS slotted at the long side, RL5G05P16 and RL3G05P16.......................... 123
xvii
Reproduced with permission of the copyright owner. Further reproduction prohibited without permission.
5.28 Test and simulation load versus LVDT displacement curves for rectangular
HSS slotted at the short side, RS5G05P16 and RS3G05P16.......................... 123
5.29 Test and simulation load versus LVDT displacement curves for SlO-a,
S 10-b and S07....................................................................................................... 124
5.30 Predicted deformed shape at fracture for S10..................................................... 124
5.31 Test and simulation load versus LVDT displacement curves for rectangular
HSS specimen with end welding........................................................................ 125
5.32 Contour plot of the equivalent plastic strain for model R07........................... 126
5.33 Test and simulation net section efficiency versus L/w ratio for Korol’s
square HSS connections....................................................................................... 127
5.34 Test and simulation net section efficiency versus L/w ratio for Korol’s
rectangular HSS connections with the short side slotted..................... 127
5.35 Test and simulation net section efficiency versus L/w ratio for Korol’s
rectangular HSS connections with the long side slotted...................... 128
6.1 Straight segment length of the slot opening............................................ 161
6.2 Normalized efficiency versus L/w ratio for different HSS wall thickness
with no end welding.............................................................................................. 161
6.3 Normalized efficiency versus L/w ratio for size factor with no end welding 162
6.4 Normalized efficiency versus L/w ratio for different gusset plate
thicknesses with no end w elding........................................................................ 162
xviii
Reproduced with permission of the copyright owner. Further reproduction prohibited without permission.
6.5 Net section efficiency versus straight segment length for different weld
length ratios with no end welding...................................................................... 163
6.6 Net section efficiency versus weld height for different weld length ratios
with no end welding............................................................................................. 163
6.7 Net section efficiency versus aspect ratio for different weld length ratios
with no end welding.............................................................................................. 164
6.8 Resistance to side contraction............................................................................... 164
6.9 Net section efficiency versus weld length ratio for square HSS with no end
welding................................................................................................................... 165
6.10 Net section efficiency versus weld length ratio for aspect ratios without
end welding and stronger HSS com er............................................................... 165
6.11 Net section efficiency versus weld length ratio for the parametric study
models with 28% stronger comer and no end welding..................................... 166
6.12 Net section efficiency versus weld length ratio for the parametric study
models with 75% stronger comer and no end welding..................................... 166
6.13 Net section efficiency versus net section eccentricity ratio without end
welding and stronger com er................................................................................ 167
6.14 Net section efficiency versus net section eccentricity ratio for parametric
study models with 28% stronger comer and no end welding.......................... 167
6.15 Net section efficiency versus net section eccentricity ratio for parametric
study models with 75% stronger comer and no end welding.......................... 168
xix
Reproduced with permission of the copyright owner. Further reproduction prohibited without permission.

6.16 Normalized efficiency versus L/w ratio for different gusset plate
thicknesses of HSS connection with end welding............................................ 168
6.17 Aspect ratio versus net section efficiency for HSS connection for different
weld length ratios with end welding.................................................................. 169
6.18 Net section efficiency versus weld length ratio for square HSS connection
with end welding................................................................................................... 169
6.19 Net section efficiency versus weld length ratio for the parametric study
models with end welding and entirely flat material......................................... 170
6.20 Net section efficiency versus weld length ratio for the parametric study
models with end welding and 28% stronger comer material.......................... 170
6.21 Net section efficiency versus weld length ratio for different gusset p la tes... 171
6.22 Outstanding HSS section efficiency versus outstanding weld length ratio
for different gusset plates..................................................................................... 171
6.23 Net section efficiency versus weld length ratio for different weld heights
with no end welding.............................................................................................. 172
6.24 Outstanding HSS efficiency versus outstanding HSS weld length ratio for
different weld heights with no end welding....................................................... 172
6.25 Feasible combinations o f An/Ag and L/w for full strength slotted HSS
connections............................................................................................................ 173
A .l The specimen geometry for phase 1 .................................................................... 192
B .l Failures o f SI0-a and SI0-b.................................................................................. 195
xx
Reproduced with permission of the copyright owner. Further reproduction prohibited without permission.
B.2 Failures o f S07 and R07............................................................................ 196
C. 1 Definitions of yield strength (Fy) and ultimate strength (Fu) for H SS 203
C.2 Engineering stress versus engineering strain for HSS 89x 89 (phase 1)
tension coupons........................................................................................ 203
C.3 Engineering stress versus engineering strain for 12 mm gusset plate
(phase 1) tension coupons....................................................................... 204
C.4 Engineering stress versus engineering strain for 16 mm gusset plate
(phase 1) tension coupons....................................................................... 204
C.5 Engineering stress versus engineering strain for 20 mm gusset plate
(phase 1) tension coupons........................................................................ 205
D. 1 True stress versus true strain verves for the iterative method.............. 209
D.2 Engineering stress versus change in cross-section area curves for the
iterative m ethod........................................................................................ 210
xxi
Reproduced with permission of the copyright owner. Further reproduction prohibited without permission.
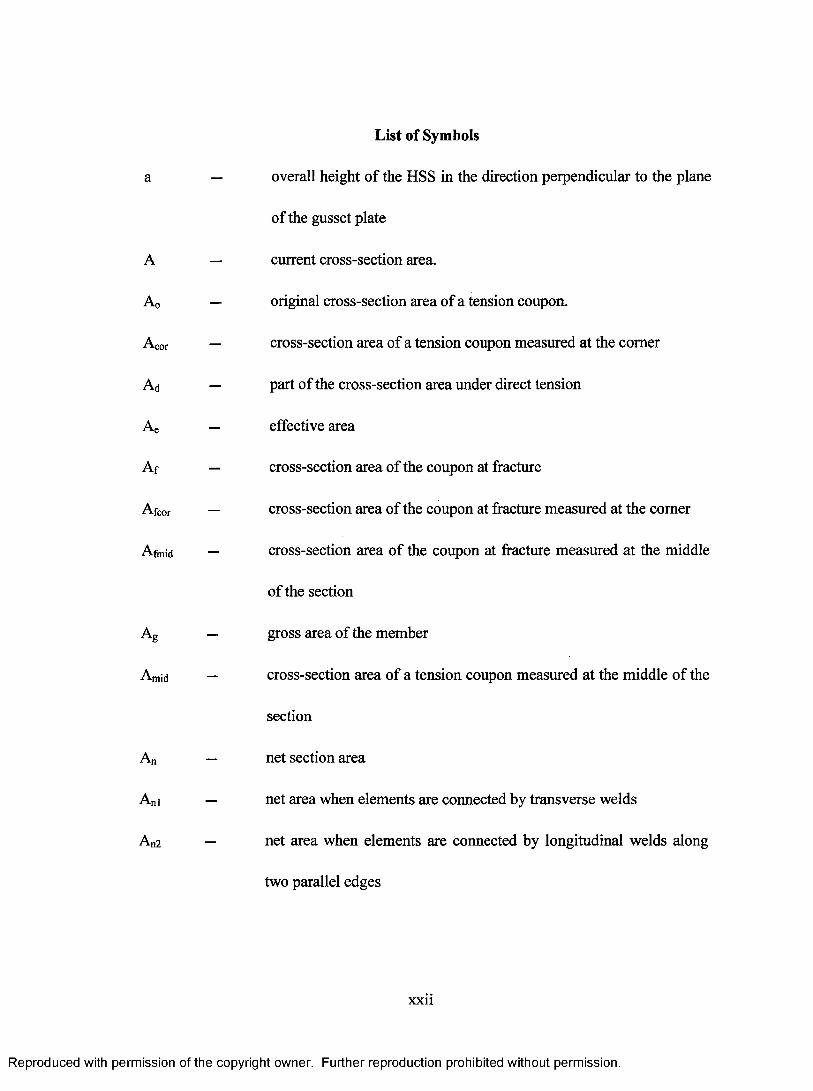
List of Symbols
a — overall height o f the HSS in the direction perpendicular to the plane
of the gusset plate
A — current cross-section area.
A0 — original cross-section area o f a tension coupon.
Acor — cross-section area of a tension coupon measured at the comer
Ad — part o f the cross-section area under direct tension
Ae — effective area
Af — cross-section area of the coupon at fracture
Afcor — cross-section area o f the coupon at fracture measured at the comer
Afmid — cross-section area o f the coupon at fracture measured at the middle
of the section
Ag — gross area of the member
Amjd — cross-section area o f a tension coupon measured at the middle o f the
section
An — net section area
Ani — net area when elements are connected by transverse welds
A„2 — net area when elements are connected by longitudinal welds along
two parallel edges
xxii
Reproduced with permission of the copyright owner. Further reproduction prohibited without permission.

An3 — net area when elements are connected by a single longitudinal weld
A„/Ag — net to gross area ratio
Ane — effective net area
a/b — aspect ratio o f HSS
b — overall width o f the HSS in the direction parallel to the plane of the
gusset plate
c — outside circumference of the HSS
E — elastic modulus o f steel
fm — factor for the actual aspect ratio
fs factor for the reference aspect ratio
ft factor for the net thickness reduction
F — load on the tension specimen
Fu — ultimate strength
Fy — yield strength
G — total length o f the slot opening
GS — straight segment length of the slot opening
GW — width of slot opening
HSS — hollow structural section
L — length of longitudinal welds
L/w — weld length ratio
X X lll
Reproduced with permission of the copyright owner. Further reproduction prohibited without permission.
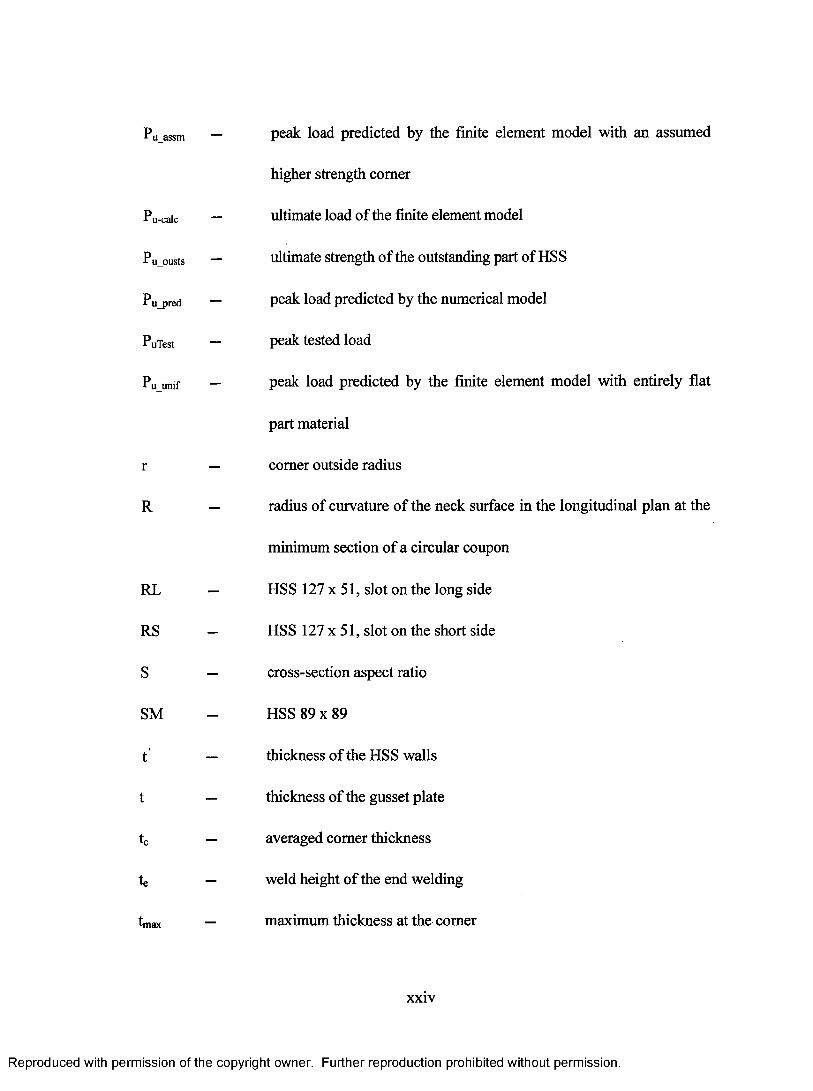
pu peak load predicted by the finite element model with an assumed
P u-calc
P u o u sts
P u_pred
P uTest
P u unif
R
RL
RS
S
SM
t ’
t
tc
te
higher strength comer
ultimate load o f the finite element model
ultimate strength o f the outstanding part of HSS
peak load predicted by the numerical model
peak tested load
peak load predicted by the finite element model with entirely flat
part material
comer outside radius
radius of curvature o f the neck surface in the longitudinal plan at the
minimum section o f a circular coupon
HSS 127 x 51, slot on the long side
HSS 127 x 51, slot on the short side
cross-section aspect ratio
HSS 89 x 89
thickness o f the HSS walls
thickness o f the gusset plate
averaged comer thickness
weld height o f the end welding
tn maximum thickness at the comer
xxiv
Reproduced with permission of the copyright owner. Further reproduction prohibited without permission.
to
tw
Tr
U
Ubase
Un
U n assum
initial thickness of a tension coupon
weld height of the longitudinal weld
factored resistance of the tension member
shear lag reduction coefficient
predicted net section efficiency o f the baseline model
net section efficiency
predicted net section efficiency of a HSS connection model with a
higher strength comer
U n_test
U norm
Un-outsd
U n unif
measured net section efficiency
normalized section efficiency
predicted net section efficiency for the outstanding part o f HSS
predicted net section efficiency o f a HSS specimen model with
entirely flat part material
U,param predicted net section efficiency o f the parametric study models
U,pw proposed efficiency factor based on the weld length ratio
U,px proposed efficiency factor based on the net section eccentricity
the poison’s ratio
w
wh
WP
distance between the welds
weld height
actual width o f the gusset plate
xxv
Reproduced with permission of the copyright owner. Further reproduction prohibited without permission.
— * X
Wt — width of the gusset plate in parametric study
x — eccentricity o f the weld with respect to the centroid of the connected
element
x /L — net section eccentricity ratio
— modified net section eccentricity
x */L — modified net section eccentricity ratio
x„ — distance from the centroid of one-half of the HSS net cross-section
area to the face o f the gusset plate
x n/L — net section eccentricity ratio of eccentricity calculated to the face o f
the gusset plate
x * — modified net section eccentricity
x 7 l — modified net section eccentricity ratio
x* — modified net section eccentricity calculated to the face o f the gusset
plate
x*/L — modified net section eccentricity ratio calculated to the face o f the
gusset plate
3 — the factor which takes into account the Munse shear lag factor as
well as the effect o f the relative width o f the connected leg
ee — engineering strain
8e — elastic strain
xxvi
Reproduced with permission of the copyright owner. Further reproduction prohibited without permission.
sp — true plastic strain
s p — critical equivalent plastic strain
s pq — equivalent plastic strain
s p — true plastic strain at the peak load
ep — true plastic strain at the start o f strain hardening
st — true strain
a — engineering stress
cfavg — average tensile stress
ctf — true stress at the peak load
o I — true stress at the end o f proportional limit when there is no yield
plateau or at the start o f strain hardening
<Jy — true stress at the start o f yield plateau
o' — true stress
<t> — resistance factor
xxvii
Reproduced with permission of the copyright owner. Further reproduction prohibited without permission.
CHAPTER 1 INTRODUCTION
Hollow structural sections (HSS) are widely used in many steel structures,
especially as welded tension and compression members in bracing and trusses. There are
two ways to make a slotted connection for a hollow structural section in tension. As
shown in Figure 1.1, the most commonly employed method is to slot the tube
longitudinally and insert a gusset plate into the slot. The gusset plate is then welded to the
tube by longitudinal fillet welds. Welding may or may not be provided around the end of
the gusset plate. However, it is easier not to weld around the end o f the gusset plate in
fabrication. In both cases, the stress is not distributed uniformly across the section
because not all elements of the HSS are directly connected to the gusset plate. Thus, the
net section may not be fully effective in carrying the load. The phenomenon associated
with this non-uniform distribution o f stress at the connection is termed shear lag. The
effect o f shear lag can be characterized by either the ratio of the weld length (L) to the
circumferential distance (w) between the longitudinal welds or the ratio of the net section
area eccentricity (x ) to the weld length (L). Figure 1.2 shows the graphical representation
of the weld length, net section area eccentricity and the distance between welds (w) for a
connection with end welding. Another way to make the connection is to slot the gusset
plate instead o f the tube. But it is not an arrangement as convenient as the former.
Both the Canadian Standard CSA-S16.1-01 (2001) Limit States Design o f Steel
Structures and American ANSI/AISC-360-05 (2005) Specification for Structural Steel
Building have provisions to account for the effect o f shear lag in calculating the capacity of
a tension member. The net cross-section area is reduced in the strength calculation when
1
Reproduced with permission of the copyright owner. Further reproduction prohibited without permission.
2
the effect o f shear lag is significant. However, results o f a few testing programs on slotted
HSS connections suggest that provisions for shear lag in both CSA-S16.1-01 and
ANSI/AISC-360-05 (2005) are overly conservative. Compared to AISC (2000) Design
Specification for Steel Hollow Structural Sections, there is an improvement in
ANSI/AISC-360-05 (2005) for slotted round HSS connection, but none for square or
rectangular HSS connection.
In both CSA-S16.1-01 and ANSI/AISC-360-05 (2005), gross section yielding and
the net section fracture are the two limit states which need to be considered in designing a
tension member. Thus, in order to fully utilize a tension member, the connection should
be designed so that gross section yielding is the governing state. In other words, the
ultimate strength for net section fracture should be higher than that for gross section
yielding when designing a tension member. The net section fracture strength o f slotted
HSS connection is affected by shear lag. Thus, through the detailed study o f slotted
square and rectangular HSS connections, a more efficient and economical design provision
may be recommended.
1.1 Objective of the Thesis
The objective of this study is to investigate the strength and behavior o f square and
rectangular HSS for various slotted connection details. The study consists o f a
combination o f testing and finite element analyses of slotted HSS connections with and
without end welding for different geometrical parameters, such as weld length, weld height,
gusset plate thickness, slot orientation and slot opening size. Finite element models are
developed and validated using the test results. Models for slotted HSS connections with
no end welding are validated using test results from another study. Thus, only slotted
Reproduced with permission of the copyright owner. Further reproduction prohibited without permission.
HSS connection with end welding were tested in this study. A finite element analyses
parametric study is conducted based on the validated finite element models. Results of
the parametric study are used in developing guidelines for designing an economical
full-strength slotted HSS connection, and formulating recommendations to improve the
shear lag provisions for slotted square and rectangular HSS connections in design
standards.
1.2 Methodology Used in the Research
The overall testing program consists of slotted square and rectangular HSS
connections with and without end welding. Both slotted HSS 89 x 89 x 4.8 and
HSS 127 x 51 x 4.8 connection specimens were tested. One part o f the testing program
consisting of twenty six slotted HSS specimens with no end welding and thirteen different
connection configurations were tested by Huang (2005). Only four slotted HSS
specimens with end welding and three connection configurations were tested in this study.
Connection configurations consisting o f different combinations o f weld length, gusset plate
thickness, size o f slot opening and slot orientation were investigated in the overall testing
program. It is expected that the effect o f shear lag is more severe for connections with no
end welding. Thus any guideline and provision developed for the connection with no end
welding will be conservative when applied to that with end welding. For this reason, the
overall testing program focuses more on specimens with no end welding and only four
specimens with end welding were tested mainly to verify that shear lag is less severe when
end welding is provided.
Tension coupon tests from the flat part o f HSS and gusset plates were carried out to
obtain material properties for assessing the test results of HSS specimens. The
Reproduced with permission of the copyright owner. Further reproduction prohibited without permission.
performance of each HSS specimen, evaluated using the actual material strength obtained
from coupon tests, is compared against net section efficiencies calculated according to the
provisions in design standards. Material properties are also important in carrying out the
numerical simulation because a complete stress versus strain relationship of the material is
required in order to perform the finite element analysis to predict the performance o f the
connection. An iterative procedure is employed to calculate a precise stress versus true
plastic strain of the material up to fracture through numerical simulation o f the tension
coupon test. Since the material properties vary across the HSS section due to
cold-forming, the HSS is idealized to have two regions of distinct material properties in the
numerical simulation. One region is the HSS comer and the other region is the flat part of
HSS. Thus, the true stress versus true plastic strain relationship is assumed for the HSS
comer in order to give a more accurate representation o f the HSS cross-section in the
modeling. The assumed comer HSS material properties are determined through trial and
error by matching numerical simulation result to that o f the test.
Finite element analyses o f test specimens are carried out with ABAQUS (2003)
using the stress versus strain relationship o f the material obtained from coupon tests. The
failure o f a specimen in the simulation is assumed to have occurred when the critical
equivalent plastic strain limit is reached in any part of the specimen. The critical
equivalent plastic strain limit used in the simulation is also determined from the tension
coupon tests. Finite element models o f the connections are validated with results from the
whole testing program as well as other existing test results. A finite element analysis
parametric study based on the validated finite element models is conducted to study the
effect o f each geometric parameter. Based on results o f the parametric study,
Reproduced with permission of the copyright owner. Further reproduction prohibited without permission.
5
recommendations to improve on shear lag provisions for slotted square and rectangular
HSS connections are formulated and guidelines on designing a fixll-strength slotted HSS
connection are developed.
1.3 Organization of the Thesis
Chapter 2 presents a literature review on shear lag in tension connections with an
emphasis on slotted HSS connections. Design provisions to account for shear lag in
welded connection are presented. In addition, a few procedures to calculate the true stress
versus true strain relationship o f the material are discussed.
Chapter 3 presents the testing program on slotted square and rectangular HSS
connections with end welding. The specimens and testing procedures are described.
Test results of slotted HSS specimens and tension coupons are also presented.
In Chapter 4, methods to obtain the true stress versus true plastic strain relationship
for the material are discussed. This includes discussions on the material failure limit and
procedures to determine the assumed material properties for the HSS comer.
Chapter 5 consists o f the finite element models development and validation using
the test results. Finite element models are developed for both phase 1 and phase 2 test
specimens. Material properties from tension coupon tests are used in the analysis.
A detailed parametric study based on the validated finite element models is
presented in Chapter 6. Parameters affecting shear lag in slotted HSS connections are
investigated and discussed. Using results of the parametric study, design guidelines are
developed and recommendations to improve the shear lag provisions in design standards
are proposed.
Reproduced with permission of the copyright owner. Further reproduction prohibited without permission.

6
Chapter 7 consists of a summary of the thesis, and as well as conclusions and
recommendations.
Additional test and numerical analyses data are presented in the appendices.
Reproduced with permission of the copyright owner. Further reproduction prohibited without permission.
7
G usset plate
IS
(a) Slotted HSS and the gusset plate
, End w eld (m ay be provided)
F illet w eldG usset plate
(b) Assembled HSS connection with the gusset plate
Figure 1.1 Slotted structural hollow section welded to a gusset plate
Reproduced with permission of the copyright owner. Further reproduction prohibited without permission.
End weld
Gusset plate
Fillet weld
HSS
Distance between welds (w)
Centerline o f HSS
Figure 1.2 Weld length, net section area eccentricity and distance between welds
Reproduced with permission of the copyright owner. Further reproduction prohibited without permission.
CHAPTER 2 LITERATURE REVIEW
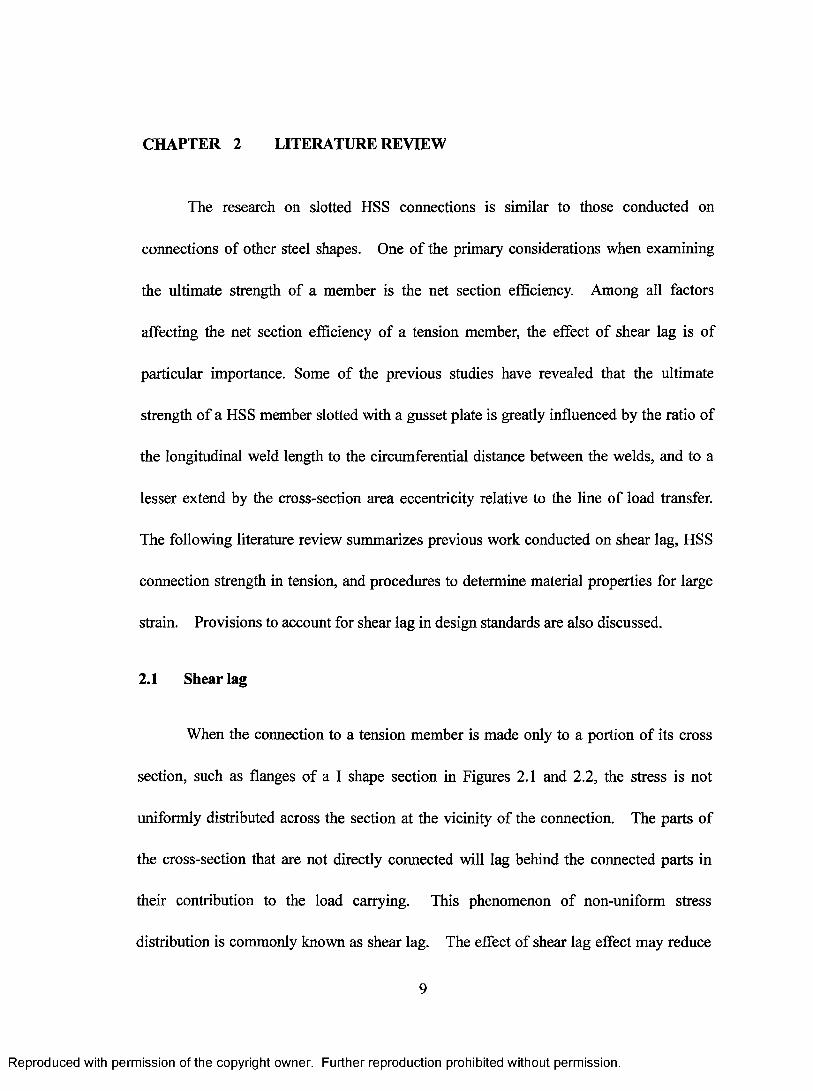
The research on slotted HSS connections is similar to those conducted on
connections of other steel shapes. One o f the primary considerations when examining
the ultimate strength o f a member is the net section efficiency. Among all factors
affecting the net section efficiency of a tension member, the effect of shear lag is of
particular importance. Some o f the previous studies have revealed that the ultimate
strength o f a HSS member slotted with a gusset plate is greatly influenced by the ratio of
the longitudinal weld length to the circumferential distance between the welds, and to a
lesser extend by the cross-section area eccentricity relative to the line o f load transfer.
The following literature review summarizes previous work conducted on shear lag, HSS
connection strength in tension, and procedures to determine material properties for large
strain. Provisions to account for shear lag in design standards are also discussed.
2.1 Shear lag
When the connection to a tension member is made only to a portion o f its cross
section, such as flanges o f a I shape section in Figures 2.1 and 2.2, the stress is not
uniformly distributed across the section at the vicinity o f the connection. The parts of
the cross-section that are not directly connected will lag behind the connected parts in
their contribution to the load carrying. This phenomenon o f non-uniform stress
distribution is commonly known as shear lag. The effect o f shear lag effect may reduce
9
Reproduced with permission of the copyright owner. Further reproduction prohibited without permission.
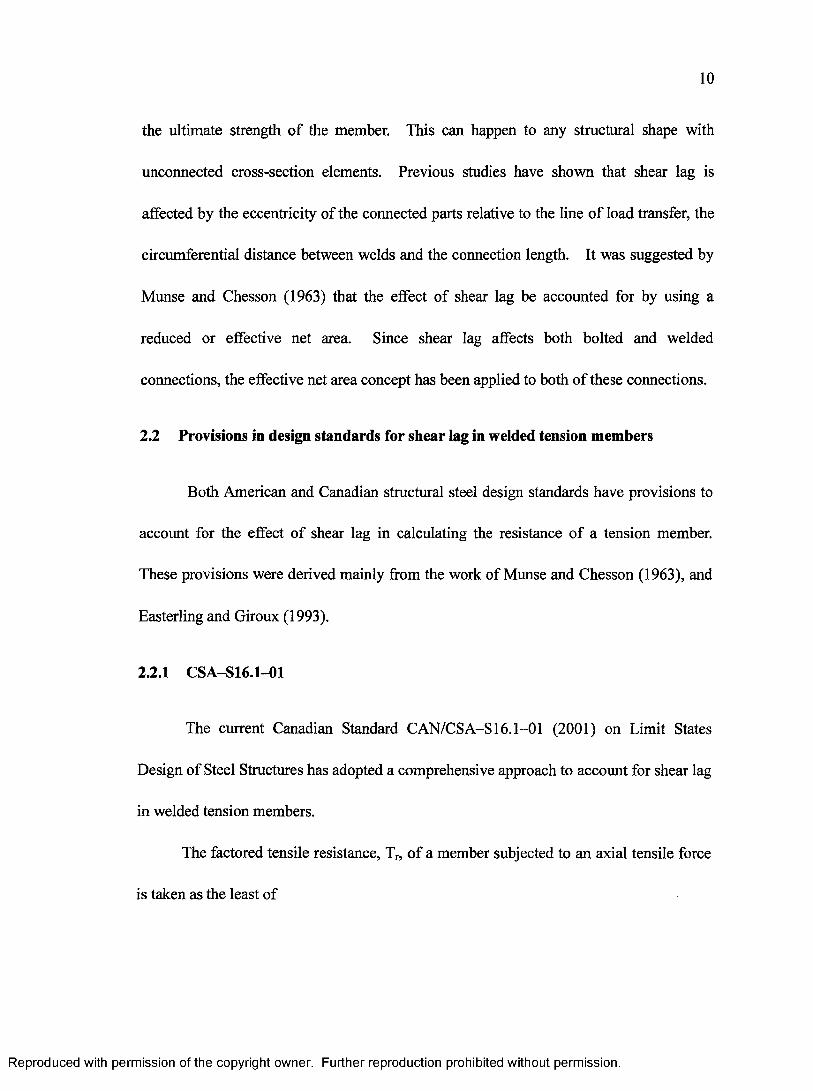
10
the ultimate strength o f the member. This can happen to any structural shape with
unconnected cross-section elements. Previous studies have shown that shear lag is
affected by the eccentricity of the connected parts relative to the line o f load transfer, the
circumferential distance between welds and the connection length. It was suggested by
Munse and Chesson (1963) that the effect o f shear lag be accounted for by using a
reduced or effective net area. Since shear lag affects both bolted and welded
connections, the effective net area concept has been applied to both o f these connections.
2.2 Provisions in design standards for shear lag in welded tension members
Both American and Canadian structural steel design standards have provisions to
account for the effect o f shear lag in calculating the resistance o f a tension member.
These provisions were derived mainly from the work o f Munse and Chesson (1963), and
Easterling and Giroux (1993).
2.2.1 CSA-S16.1-01
The current Canadian Standard CAN/CSA-S16.1-01 (2001) on Limit States
Design o f Steel Structures has adopted a comprehensive approach to account for shear lag
in welded tension members.
The factored tensile resistance, Tr, o f a member subjected to an axial tensile force
is taken as the least of
Reproduced with permission of the copyright owner. Further reproduction prohibited without permission.

11
1) yielding in the gross cross-sectional area,
(2 .1)
2) fracture o f the net area,
Tr = 0.85<)>-AnFu, (2 .2)
3) fracture of the effective net area accounting for shear lag,
where
Fy = yield strength o f the material,
Fu = ultimate strength o f the material,
Ag = gross area of the member,
An = net area,
Ane = effective net area reduced for shear lag, and
<j) = resistance factor taken as 0.90.
The effective net area is taken as
where Ani, A„2 and An3 are net areas o f the connected plate elements subjected to
one o f the following methods o f load transfer,
a) Elements connected by transverse welds,
(2.3)
Anl = Wt, (2.4)
where
w plate element width, and
Reproduced with permission of the copyright owner. Further reproduction prohibited without permission.
12
t = thickness of the element.
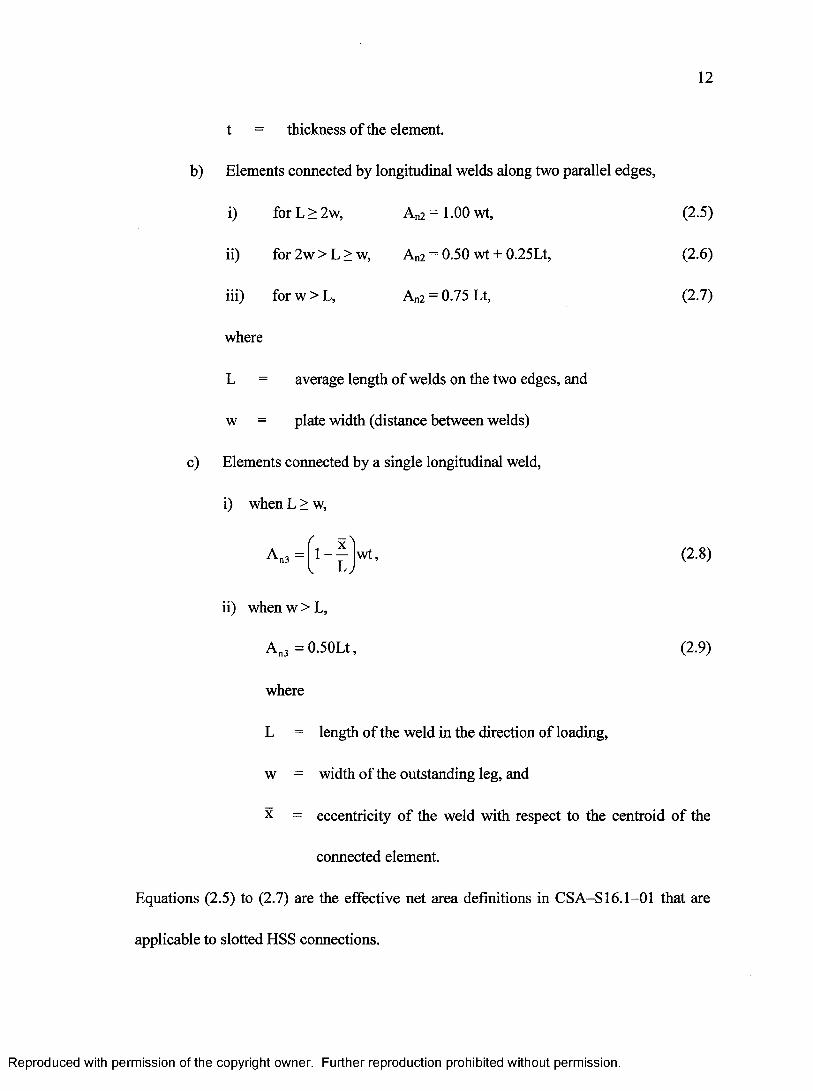
b) Elements connected by longitudinal welds along two parallel edges,
i) for L > 2w, An2 = 1.00 wt, (2.5)
ii) for 2w > L > w, A„2 = 0.50 wt + 0.25Lt, (2.6)
iii) for w > L, A„2 = 0.75 Lt, (2.7)
where
L = average length o f welds on the two edges, and
w = plate width (distance between welds)
c) Elements connected by a single longitudinal weld,
i) when L > w,
A n3 =f x
1 - - w t, (2.8)V W
ii) when w > L,
A n3 = 0.50Lt, (2.9)
where
L = length o f the weld in the direction of loading,
w = width of the outstanding leg, and
x = eccentricity o f the weld with respect to the centroid o f the
connected element.
Equations (2.5) to (2.7) are the effective net area definitions in CSA-S16.1-01 that are
applicable to slotted HSS connections.
Reproduced with permission of the copyright owner. Further reproduction prohibited without permission.
13
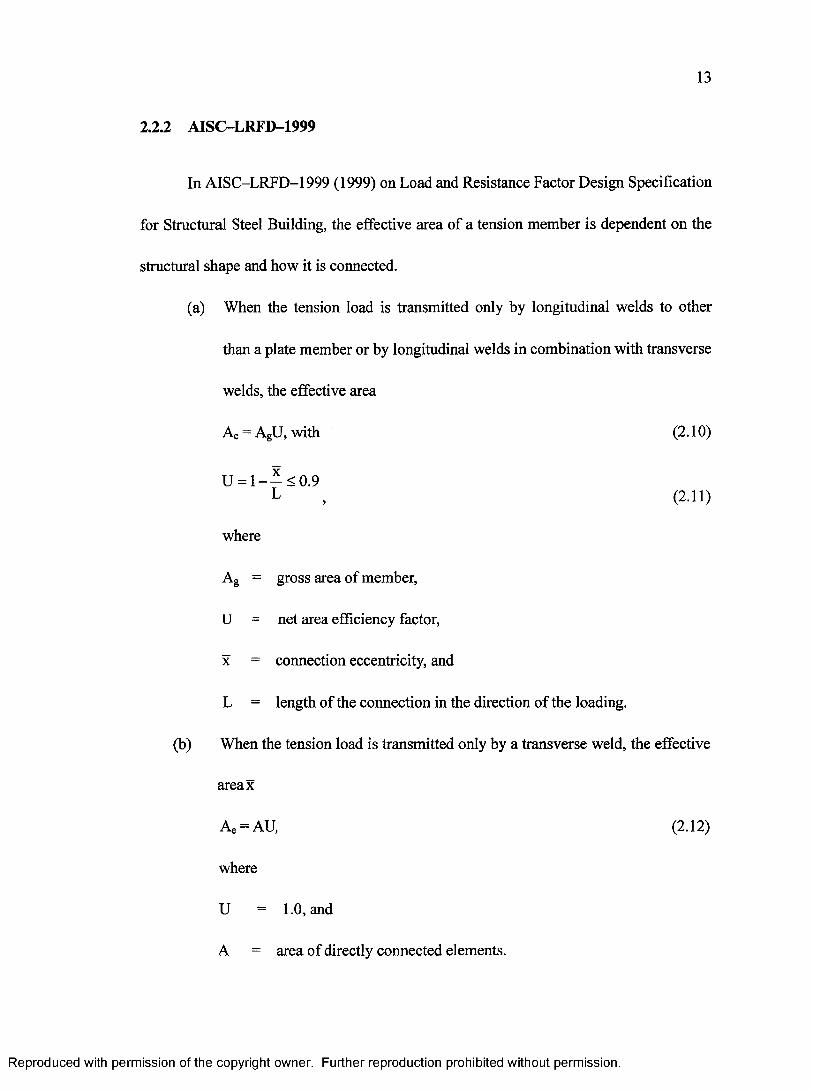
2.2.2 AISC-LRFD-1999
In AISC-LRFD-1999 (1999) on Load and Resistance Factor Design Specification
for Structural Steel Building, the effective area o f a tension member is dependent on the
structural shape and how it is connected.
(a) When the tension load is transmitted only by longitudinal welds to other
than a plate member or by longitudinal welds in combination with transverse
welds, the effective area
where
Ag - gross area of member,
U = net area efficiency factor,
x = connection eccentricity, and
L = length o f the connection in the direction o f the loading.
(b) When the tension load is transmitted only by a transverse weld, the effective
areax
Ae = AgU, with (2 .10)
U = l - — <0.9 L (2 .11)
Ae = AU, (2 .12)
where
U 1.0, and
A = area o f directly connected elements.
Reproduced with permission of the copyright owner. Further reproduction prohibited without permission.
14
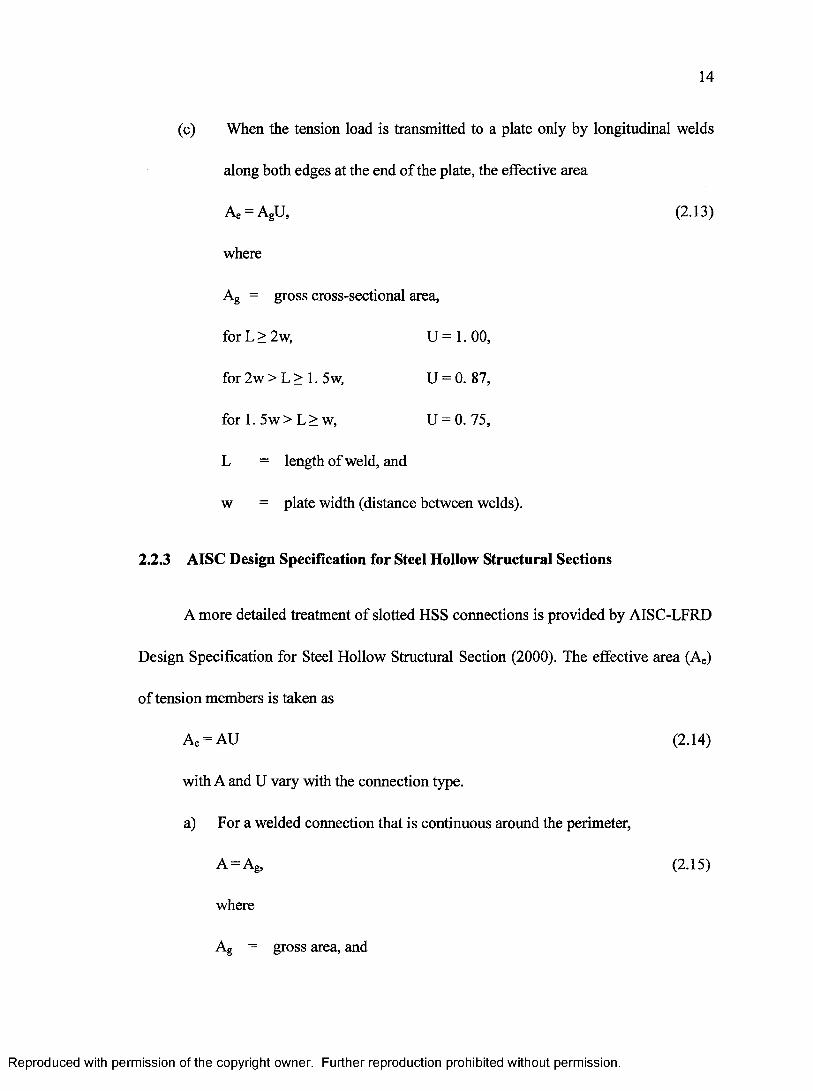
(c) When the tension load is transmitted to a plate only by longitudinal welds
along both edges at the end o f the plate, the effective area
Ae = AgU, (2.13)
where
Ag = gross cross-sectional area,
for L > 2w, U = 1. 00,
for 2w > L > 1. 5w, U = 0. 87,
f o r l . 5 w > L > w , U = 0 .75,
L = length o f weld, and
w = plate width (distance between welds).
2.2.3 AISC Design Specification for Steel Hollow Structural Sections
A more detailed treatment of slotted HSS connections is provided by AISC-LFRD
Design Specification for Steel Hollow Structural Section (2000). The effective area (Ae)
o f tension members is taken as
Ae = AU (2.14)
with A and U vary with the connection type.
a) For a welded connection that is continuous around the perimeter,
A = Ag, (2.15)
where
Ag = gross area, and
Reproduced with permission of the copyright owner. Further reproduction prohibited without permission.
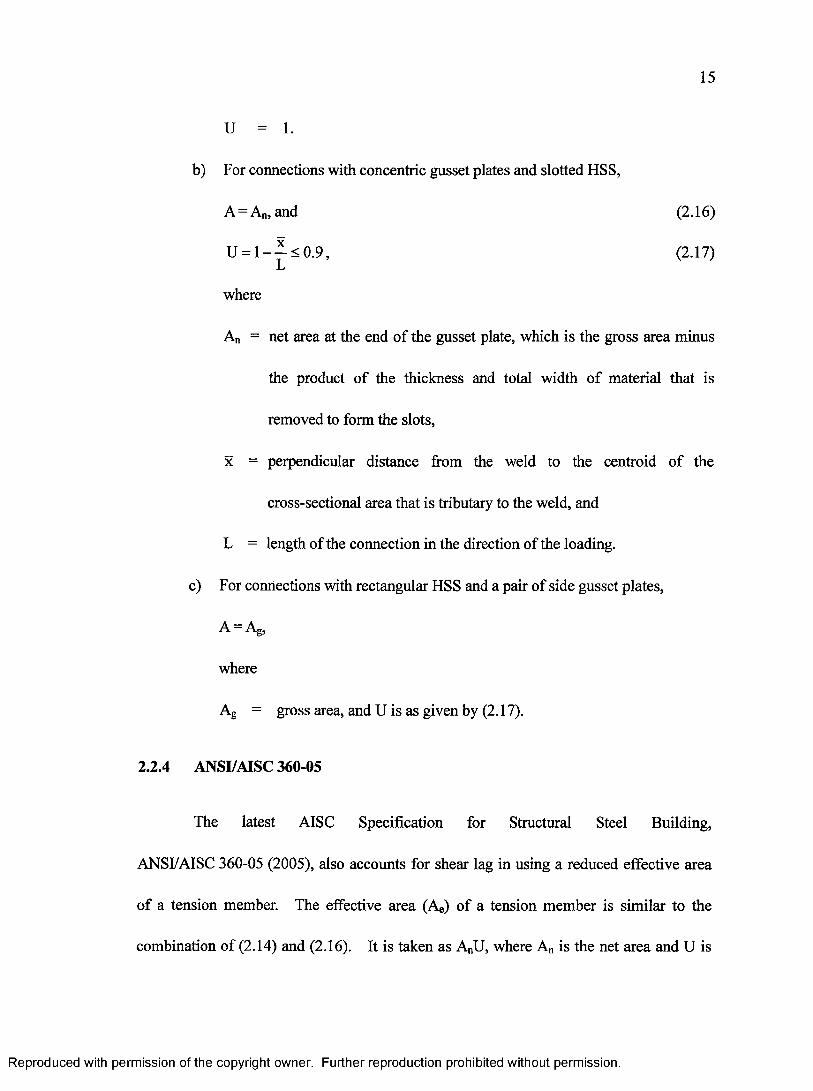
15
U 1.
b) For connections with concentric gusset plates and slotted HSS,
A = An, and (2.16)
U = l - — <0.9 , L
(2.17)
where
An = net area at the end o f the gusset plate, which is the gross area minus
the product o f the thickness and total width o f material that is
removed to form the slots,
x = perpendicular distance from the weld to the centroid o f the
cross-sectional area that is tributary to the weld, and
L = length of the connection in the direction o f the loading,
c) For connections with rectangular HSS and a pair o f side gusset plates,
A = Ag,
where
Ag = gross area, and U is as given by (2.17).
2.2.4 ANSI/AISC 360-05
The latest AISC Specification for Structural Steel Building,
ANSI/AISC 360-05 (2005), also accounts for shear lag in using a reduced effective area
o f a tension member. The effective area (Ae) of a tension member is similar to the
combination of (2.14) and (2.16). It is taken as AnU, where An is the net area and U is
Reproduced with permission of the copyright owner. Further reproduction prohibited without permission.
16
the shear lag factor that varies for different tension member connections. Unlike
previous specifications, an upper limit of 0.9 on the shear lag factor for all connections
has been removed in ANSI/AISC 360-05 (2005).
(a) For all tension members, except plates and HSS, where the tension load is
transmitted to some but not all o f the cross-sectional elements by fasteners
or longitudinal welds
where
x = connection eccentricity, and
L = length of the connection in the direction o f the loading.
(b) For all tension members where the tension load is transmitted only by a
transverse weld, U is equal to 1.0.
(c) For plates where the tension load is transmitted by longitudinal welds only,
(2.18)
for L > 2w, U = 1.00,
for 2w > L > 1. 5 w, U = 0.87,
for 1. 5w > L > w, U = 0.75,
where
L = length of weld, and
w plate width (distance between welds).
Reproduced with permission of the copyright owner. Further reproduction prohibited without permission.
17
(d) For a rectangular HSS with a single concentric gusset plate and
L > b, (2.19)
where
_ _ a2 + 2ab X_ 4(a + b) ’
connection eccentricity, (2.20)
a = overall height o f the HSS in the direction perpendicular to the plane o f
the gusset plate, and
b = overall width o f the HSS in the direction parallel to the plane o f the
gusset plate.
2.3 Research on Shear Lag
There have been a number o f studies carried out on shear lag in connections. The
presentation of the literature review on shear lag will be divided into welded connections
and bolted connections. However, shear lag in bolted connections will only be briefly
discussed.
2.3.1 Shear Lag on Bolted Connections
The interest on the shear lag effect was initially started from a more general
research on the net section efficiency o f the partially connected members. Munse and
Chesson (1963) conducted a series o f tests to evaluate the net section efficiency of bolted
and riveted tension members. The net section efficiency is taken as the ratio o f the
maximum test load to the product o f material tensile strength and net section area. Their
Reproduced with permission of the copyright owner. Further reproduction prohibited without permission.
18
test results showed that several factors affected the test efficiency for a net section rupture
failure. These factors include ductility o f the connected material, geometry o f the
connected cross-section and length o f the connection. Among all these factors,
geometry o f the connected cross-section and length of the connection have the greatest
influence on the net section efficiency when not every cross-sectional element of the
member is directly connected. The reduction in the net section efficiency is due mainly
to shear lag, which is dependent on the geometry of the connected cross-section and the
length o f the connection.
The distance from the face o f the gusset plate to the centroid of the tributary
cross-section area (x )an d the length o f the connection (L) are two parameters that are
found to be pertinent in characterizing the effect o f shear lag. An example o f these two
parameters are shown in Figure 2.3 on the configuration tested by Munse and Chesson.
A simple ratio o f centroidal distance and connection length (x /L) was proposed by
Munse and Chesson to account for the influence of both the cross-section geometry and
the joint length. In order to characterize the effectiveness o f the cross-section area to
transfer the force, Munse and Chesson developed the following empirical effective net
section area equation,
Ae = AnU, with (2.21)
U = l - p (2.22)
where
Ae = effective net section area,
Reproduced with permission of the copyright owner. Further reproduction prohibited without permission.

19
An - net section area,
U = net section efficiency,
x = distance from the face o f the fastener plates to the centroid o f the
tributary area (connection eccentricity), and
L = length o f the connection in the direction of loading (distance from the
first fastener to the last).
Equation (2.21) is the basis where some equations of net section area calculations in
ANSI/AISC 360-05 (2005) and CAN/CSA-S16.1-01 (2001) originated.
Research on shear lag in bolted tension members were also carried out by Davis
and Boomsliter (1934), Chakrabarti and Bjorhovde (1985), Hardash and
Bjorhovde (1985), Madugula and Mohan (1988), Wu and Kulak (1993 and 1997), and
Gupta et al. (2004).
2.3.2 Shear Lag in Welded Connection
The research on shear lag in welded connections will be discussed separately for
opened sections such as angle, channel and plate, and for closed sections such as circular,
square and rectangular HSS.
2.3.2.1 Shear Lag in Open Sections Connections
Gibson and Wake (1942) conducted tests to investigate the influence o f the
arrangement of weld on the load carrying capacity o f the angle. The angles tested were
Reproduced with permission of the copyright owner. Further reproduction prohibited without permission.
20
L 64 x 64 x 7.9 (214 x 2/4 x 5/16). Fifteen connection configurations for angles welded
to gusset plates with both balanced and unbalanced weld were investigated. It was
found that the eccentricity normal to the plane of the gusset plate is the major factor
affecting the strength, and the stress in the angle was unevenly distributed over its
cross-section.
Easterling and Giroux (1993) carried out a testing program on twenty seven
welded tension members that comprised o f plate, angle and channel specimens. Except
for channel specimens whose predominant failure mode is rupture at the middle o f the
specimen, all other specimens failed at the net section close to the weld. For plate
specimens, the net section efficiency ranged from 0.94 to 1.0 when the ratio o f
longitudinal weld length (L) to the distance between the welds (w) was between 1.5 and
2.0. This suggested that the longitudinal weld longer than 150% o f the distance between
the welds has little influence on the net section efficiency. Meanwhile, the net section
efficiency computed using (2.22) gives values between 0.82 and 0.85 for plate specimens.
For angle specimens, the net section efficiency for all but one specimen ranged between
0.8 and 0.82. The lower net section efficiency indicated that the whole section was not
effective in taking the load since only one leg o f the angle was connected to the gusset
plate. The maximum net section efficiency was found to be greater than 0.9 for plates,
0.8 for angles and a maximum of 0.9 for channels. Based on the test results, an upper
net section efficiency limit for (2.22) o f 0.9 was recommended for most structural shapes.
Uzoegbo (1998) also conducted a series o f tension tests on a single angle welded
Reproduced with permission of the copyright owner. Further reproduction prohibited without permission.
to a gusset plate at one leg. Fourteen specimens with equal and unequal length fillet
weld along the sides o f the connected leg were tested. Even though the weld length was
at least twice the length of the outstanding leg, most o f the net section efficiency ranged
between 0.7 and 0.8 for equal weld length specimens and between 0.66 and 0.77 for
unequal weld length specimens. The full strength o f the member was not achieved
because o f the non-uniform stress distribution across the cross-section due to shear lag.
2 3 .2.2 Shear lag in HSS connections
Korol (1996) carried out a tension test program comprising six square HSS
(HSS 89 x 89 x 6.4) and twelve rectangular HSS (HSS 127 x 51 x 6.4) specimens to
investigate the effect of shear lag on a slotted HSS tension member connection.
Specimens with different cross-section aspect ratios and weld length ratios were tested.
The cross-section aspect ratio (a/b) being the ratio of the width o f slotted side (a) over
the unslotted side (b), as shown in Figure 2.4. Slots and welds were made to either the
long or short side o f the rectangular HSS members. There was no welding around the
gusset plate at the end o f the slot opening for all test specimens. The weld length ratio
(L/w) o f the specimens tested, taken as the ratio o f the length of the fillet weld (L) over
the circumferential distance between longitudinal fillet welds (w), varied from 0.4 to
1.0. Specimens with weld length ratios (L/w) around unity were found to have net
section efficiencies close to 1.0, which were much higher than 0.75 allowed in
CAN/CSAS16.1-01. Overall, test results showed that provisions for shear lag are
Reproduced with permission of the copyright owner. Further reproduction prohibited without permission.
22
overly conservative in CAN/CSA-S16.1-01.
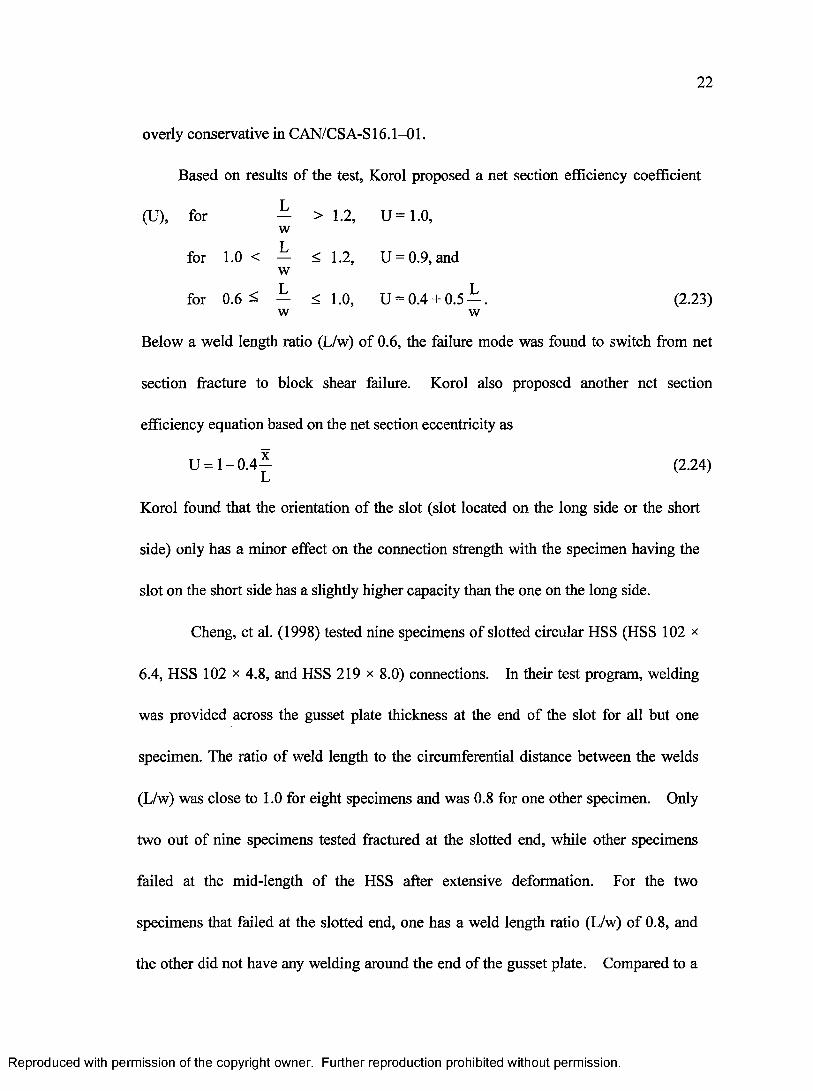
Based on results o f the test, Korol proposed a net section efficiency coefficient
(U), for — > 1.2, U =1.0 ,w
for 1.0 < — < 1.2, U = 0.9, andw
for 0.6 ^ — < 1 . 0 , U = 0 .4+ 0.5 — . (2.23)w w
Below a weld length ratio (L/w) o f 0.6, the failure mode was found to switch from net
section fracture to block shear failure. Korol also proposed another net section
efficiency equation based on the net section eccentricity as
U = 1 - 0 - 4 ^ (2.24)
Korol found that the orientation o f the slot (slot located on the long side or the short
side) only has a minor effect on the connection strength with the specimen having the
slot on the short side has a slightly higher capacity than the one on the long side.
Cheng, et al. (1998) tested nine specimens o f slotted circular HSS (HSS 102 x
6.4, HSS 102 x 4.8, and HSS 219 x 8.0) connections. In their test program, welding
was provided across the gusset plate thickness at the end of the slot for all but one
specimen. The ratio o f weld length to the circumferential distance between the welds
(L/w) was close to 1.0 for eight specimens and was 0.8 for one other specimen. Only
two out of nine specimens tested fractured at the slotted end, while other specimens
failed at the mid-length o f the HSS after extensive deformation. For the two
specimens that failed at the slotted end, one has a weld length ratio (L/w) of 0.8, and
the other did not have any welding around the end o f the gusset plate. Compared to a
Reproduced with permission of the copyright owner. Further reproduction prohibited without permission.
23
specimen with a weld length ratio of 1, the specimen with a weld length ratio o f 0.8 has
a higher stress concentration at the slotted end of the HSS that resulted in crack
initiation and fracture. When there is no end welding, failure occurred at the slotted
end because the net section area at that section is the smallest.
Based on their test results, Cheng et al. concluded that the effect o f shear lag is
insignificant when the weld length ratio (L/w) is close to 1.0. Specimens that failed at
the mid-length essentially have the net section efficiency of 1.0. For the two
specimens that failed at the slotted end, their net section efficiencies were found to be
close to 1.0. Again, tests results showed that provisions for shear lag in the
CAN/CSA S I6.1-01 were overly conservative.
A more recent study was carried out by Willibald et al. (2004) on six circular
HSS (HSS 168 x 4.8) tension specimens with different slotting details. Two o f these
specimens were fabricated by slotting the gusset plate and four were fabricated by
slotting the tube. Among specimens slotted at the tube, two have end welding around
the gusset plate and two without. The weld length ratio (L/w) o f the specimens varied
from 0.5 to 0.88. All specimens failed in HSS. With a similar weld length ratio, a
specimen with end welding and its tube slotted has almost the same tension capacity as
one that has the gusset plate slotted. However, the specimen with the tube slotted but
without end welding has a lower strength compared to that from the other two above
configurations. Again, all specimens achieved higher net section efficiencies
compared to values given by CAN/CSA S I6.1-01 and ANSI/AISC 360-05 (2005).
Reproduced with permission of the copyright owner. Further reproduction prohibited without permission.
24
Similar to tests by Korol, specimens without end welding and having weld length ratio
(L/w) lower than 0.66 experienced block shear failure rather than net section failure.
2.3.2.3 Numerical simulation for slotted HSS connections
Finite element models (FEM) with different elements and boundary conditions
have been employed to study the HSS connections. However, not all the numerical
simulations were able to capture the behavior and predict the member strength of a
slotted HSS connection accurately. The following are some o f the numerical studies
that have been carried out on slotted HSS connections.
Girard et al. (1994) developed a three dimensional finite element model for
slotted rectangular and square HSS connections with six-node triangular elasto-plastic
shell elements. A quarter o f the HSS connection was modeled due to symmetry.
Different weld length ratios (L/w), gusset plate thicknesses and widths were considered in
their numerical study. However, only a simple idealized multi-linear stress versus strain
curve with a yield plateau and a linear strain hardening was assumed. In addition, an
artificial displacement limit was imposed in their simulation. For these reasons, the
numerical analyses were not able to predict the behavior o f the connection accurately.
Cheng etal. (1998) carried out numerical analyses o f their circular HSS
connections using ABAQUS. A four-node reduced integration finite strain membrane
shell element (S4R) was used in the modeling. One-eighth o f the test specimen was
modeled due to symmetry. Connections were assumed to deform according to the
Reproduced with permission of the copyright owner. Further reproduction prohibited without permission.
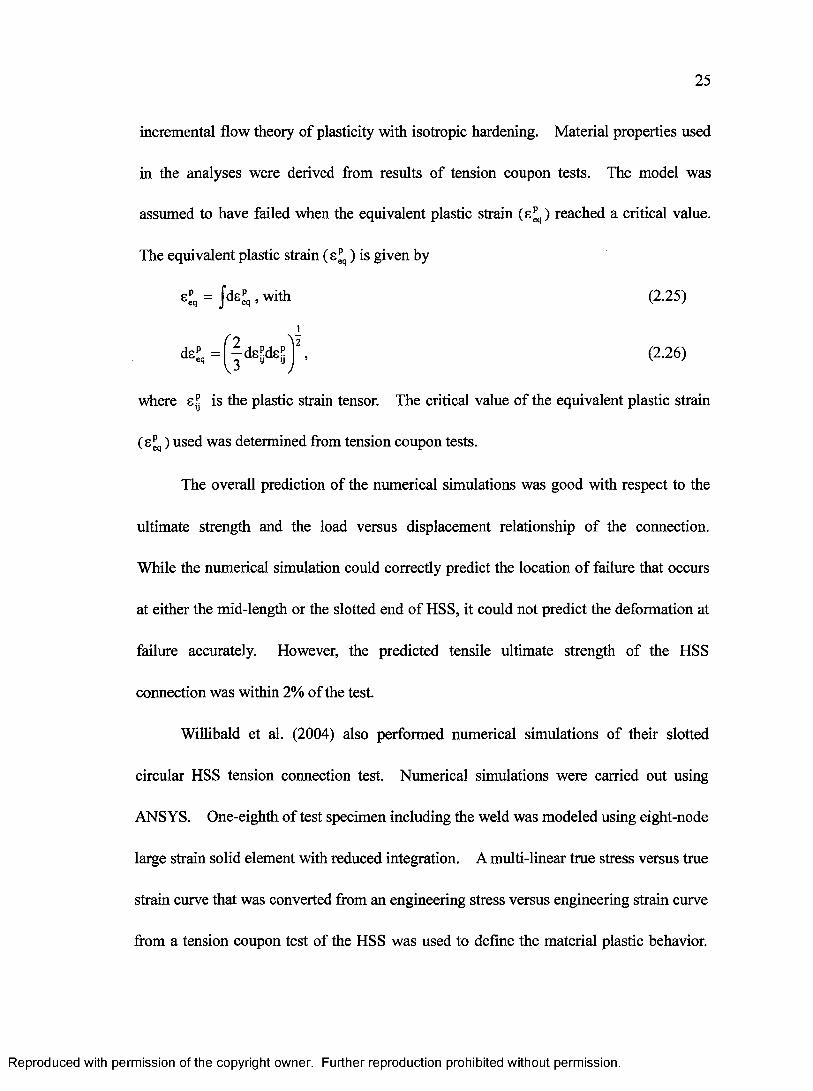
25
incremental flow theory of plasticity with isotropic hardening. Material properties used
in the analyses were derived from results o f tension coupon tests. The model was
where s? is the plastic strain tensor. The critical value o f the equivalent plastic strain
( SPq) used was determined from tension coupon tests.
The overall prediction of the numerical simulations was good with respect to the
ultimate strength and the load versus displacement relationship o f the connection.
While the numerical simulation could correctly predict the location o f failure that occurs
at either the mid-length or the slotted end of HSS, it could not predict the deformation at
failure accurately. However, the predicted tensile ultimate strength of the HSS
connection was within 2% of the test.
Willibald et al. (2004) also performed numerical simulations of their slotted
circular HSS tension connection test. Numerical simulations were carried out using
ANSYS. One-eighth o f test specimen including the weld was modeled using eight-node
large strain solid element with reduced integration. A multi-linear true stress versus true
strain curve that was converted from an engineering stress versus engineering strain curve
from a tension coupon test of the HSS was used to define the material plastic behavior.
assumed to have failed when the equivalent plastic strain ( s ^ ) reached a critical value.
The equivalent plastic strain (e£q) is given by
(2.25)
dsMs£ (2.26)
Reproduced with permission of the copyright owner. Further reproduction prohibited without permission.
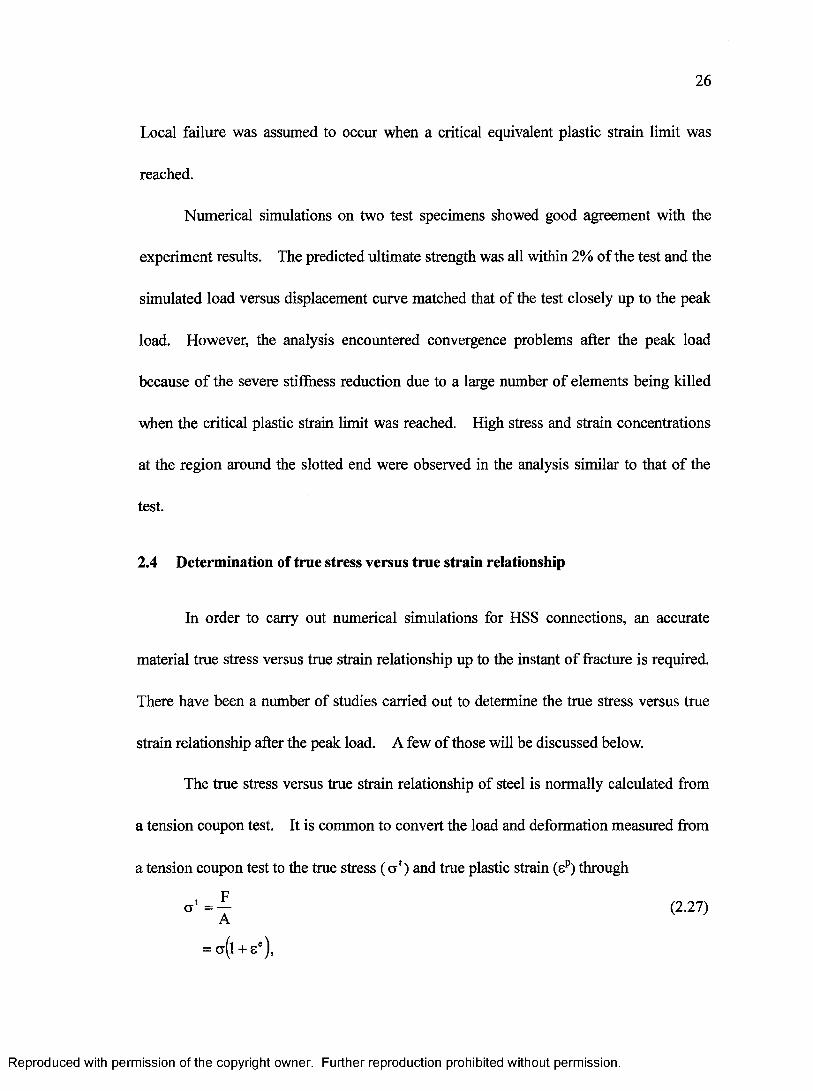
26
Local failure was assumed to occur when a critical equivalent plastic strain limit was
reached.
Numerical simulations on two test specimens showed good agreement with the
experiment results. The predicted ultimate strength was all within 2% of the test and the
simulated load versus displacement curve matched that of the test closely up to the peak
load. However, the analysis encountered convergence problems after the peak load
because o f the severe stiffness reduction due to a large number o f elements being killed
when the critical plastic strain limit was reached. High stress and strain concentrations
at the region around the slotted end were observed in the analysis similar to that o f the
test.
2.4 Determination of true stress versus true strain relationship
In order to carry out numerical simulations for HSS connections, an accurate
material true stress versus true strain relationship up to the instant o f fracture is required.
There have been a number o f studies carried out to determine the true stress versus true
strain relationship after the peak load. A few o f those will be discussed below.
The hue stress versus true strain relationship o f steel is normally calculated from
a tension coupon test. It is common to convert the load and deformation measured from
a tension coupon test to the tme stress (cr') and true plastic strain (sp) through
= a(l + se),
Reproduced with permission of the copyright owner. Further reproduction prohibited without permission.

where
F = load on the tension specimen,
A = current cross-section area,
Ao = original undeformed cross-section area,
86 = engineering strain,
E = elastic modulus, and
a = engineering stress.
However, (2.27) and (2.28) are only applicable for data up to the peak load before
necking starts. A direct conversion o f the tension coupon test data is not possible
beyond the peak load o f the test.
Hollomon (1945) proposed a true stress ( a 1) versus true strain (st) curve in the
plastic region after the initial yielding can be expressed by the following power-law
equation,
CTt = K ( e t ) “ (2.29)
where st is the true strain, m is the slope o f the natural logarithm o f the true stress versus
true strain curve and K is a constant related to the carbon content o f the steel. This
expression allows the true stress versus true strain relationship o f the material after the
peak load of a tension coupon test be approximated.
Reproduced with permission of the copyright owner. Further reproduction prohibited without permission.
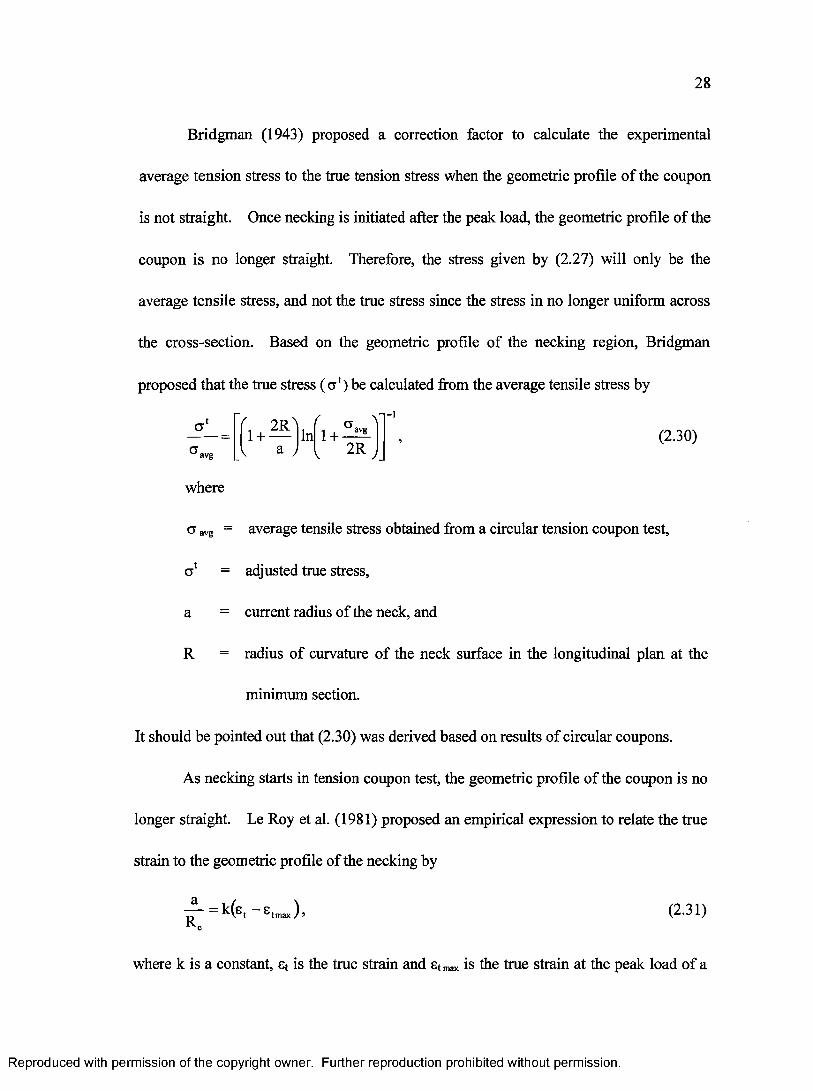
28
Bridgman (1943) proposed a correction factor to calculate the experimental
average tension stress to the true tension stress when the geometric profile o f the coupon
is not straight. Once necking is initiated after the peak load, the geometric profile of the
coupon is no longer straight. Therefore, the stress given by (2.27) will only be the
average tensile stress, and not the true stress since the stress in no longer uniform across
the cross-section. Based on the geometric profile of the necking region, Bridgman
proposed that the true stress ( a ‘) be calculated from the average tensile stress by
(2.30)
where
a aVg = average tensile stress obtained from a circular tension coupon test,
a 1 = adjusted true stress,
a = current radius o f the neck, and
R = radius o f curvature o f the neck surface in the longitudinal plan at the
minimum section.
It should be pointed out that (2.30) was derived based on results o f circular coupons.
As necking starts in tension coupon test, the geometric profile o f the coupon is no
longer straight. Le Roy et al. (1981) proposed an empirical expression to relate the true
strain to the geometric profile o f the necking by
r - = k ( s , - e , „ ) . (2.31)
where k is a constant, st is the true strain and stn,ax is the true strain at the peak load of a
a avg1 +
2RIn 1 + -
avg2R
Reproduced with permission of the copyright owner. Further reproduction prohibited without permission.
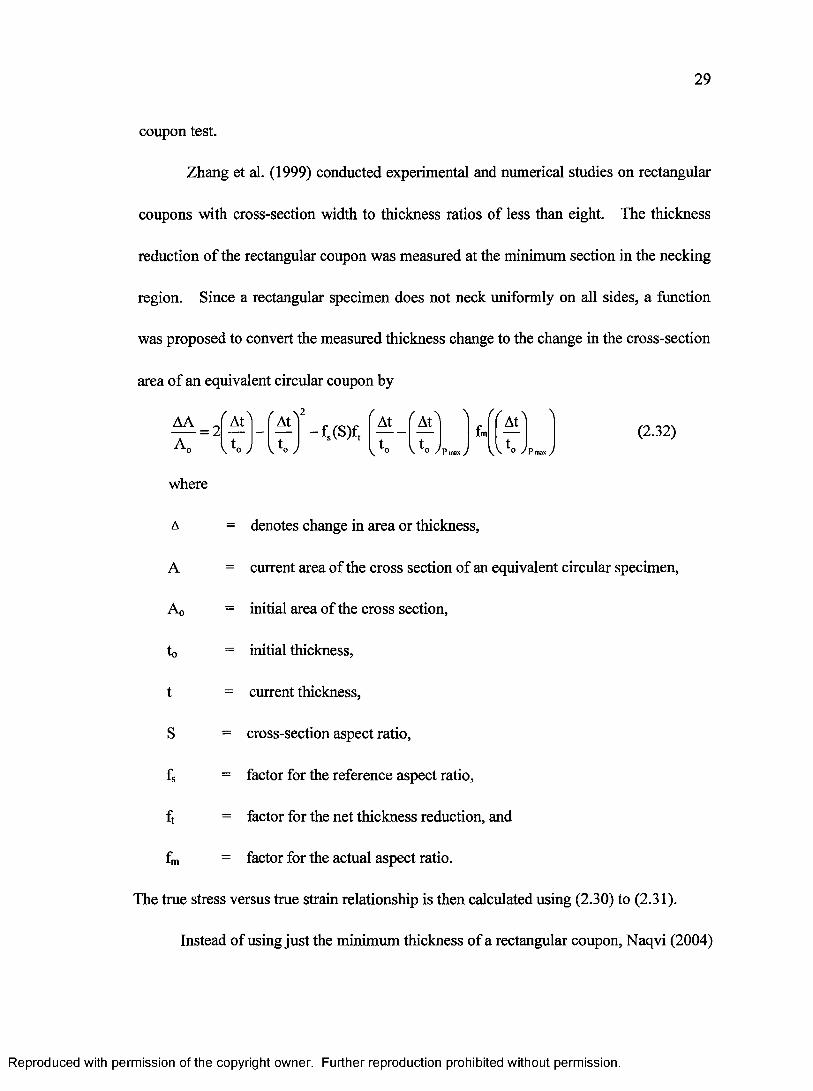
29
coupon test.
Zhang et al. (1999) conducted experimental and numerical studies on rectangular
coupons with cross-section width to thickness ratios of less than eight. The thickness
reduction o f the rectangular coupon was measured at the minimum section in the necking
region. Since a rectangular specimen does not neck uniformly on all sides, a function
was proposed to convert the measured thickness change to the change in the cross-section
area o f an equivalent circular coupon by
AAA„
= 2 ^At^2
v t o y- f s(S)ft
Att„
" A t ' '
v o Z P max / O / P m a x /
(2.32)
where
= denotes change in area or thickness,
A
A0
to
current area o f the cross section o f an equivalent circular specimen,
= initial area o f the cross section,
initial thickness,
t = current thickness,
cross-section aspect ratio,
= factor for the reference aspect ratio,
ft factor for the net thickness reduction, and
fm = factor for the actual aspect ratio.
The true stress versus true strain relationship is then calculated using (2.30) to (2.31).
Instead of using just the minimum thickness o f a rectangular coupon, Naqvi (2004)
Reproduced with permission of the copyright owner. Further reproduction prohibited without permission.

showed that an equivalent area of a circular coupon can be approximated by using four
dimensions at the minimum cross-section of a rectangular coupon. The area o f an
equivalent circular coupon in (2.32) can be approximated by
As shown in Figure 2.5, wcor and tcor are the width and thickness at the comer, wmjd and
to be applicable up to a width to thickness ratio of 6. In order to represent the yield
plateau in the stress versus strain relationship o f steel, Naqvi and Khoo (2004) proposed a
where
cr* = true stress at the end o f proportional limit when there is no yield plateau
or at the start o f strain hardening
<7y = true stress at the start o f yield plateau, and
£p = true plastic strain at the start o f strain hardening.
A 4- AA = ——------ ssL , with
2(2.33)
A cor = t c o r w cor, and
A mid I raid mid •
tmid are the width and thickness at the mid-point o f the sides. Equation (2.33) was found
variation o f power-law equation to represent the true stress ( ct‘) versus true plastic strain
(sp) relationship. The proposed equation takes the form,
when ep>s p,( t Y
s p = C - 1 + s p , and (2.34)
when e £ > s p >0, (2.35)
Reproduced with permission of the copyright owner. Further reproduction prohibited without permission.

C and n are two constants to be determined. It should be noted that (2.35) is only
required when there is a yield plateau. Instead of using (2.35), the true stress may be
assumed to be a constant value equal to the true stress at the start o f strain hardening ( ctJ,)
when the true plastic strain (sp) is below the true plastic strain at the start o f strain
hardening. The reason being that there is little change in the true stress at the yield
plateau.
Unlike methods adopted by Naqvi and Khoo, Hollomon, and Zhang et al,
M atic(1985) proposed a procedure that determines the true stress versus true plastic
strain relationship iteratively instead o f defining this relationship through a function.
The multi-linear true stress versus true plastic strain points o f the material are iteratively
corrected until results o f the numerical simulation o f a circular tension coupon match that
of the test.
Reproduced with permission of the copyright owner. Further reproduction prohibited without permission.
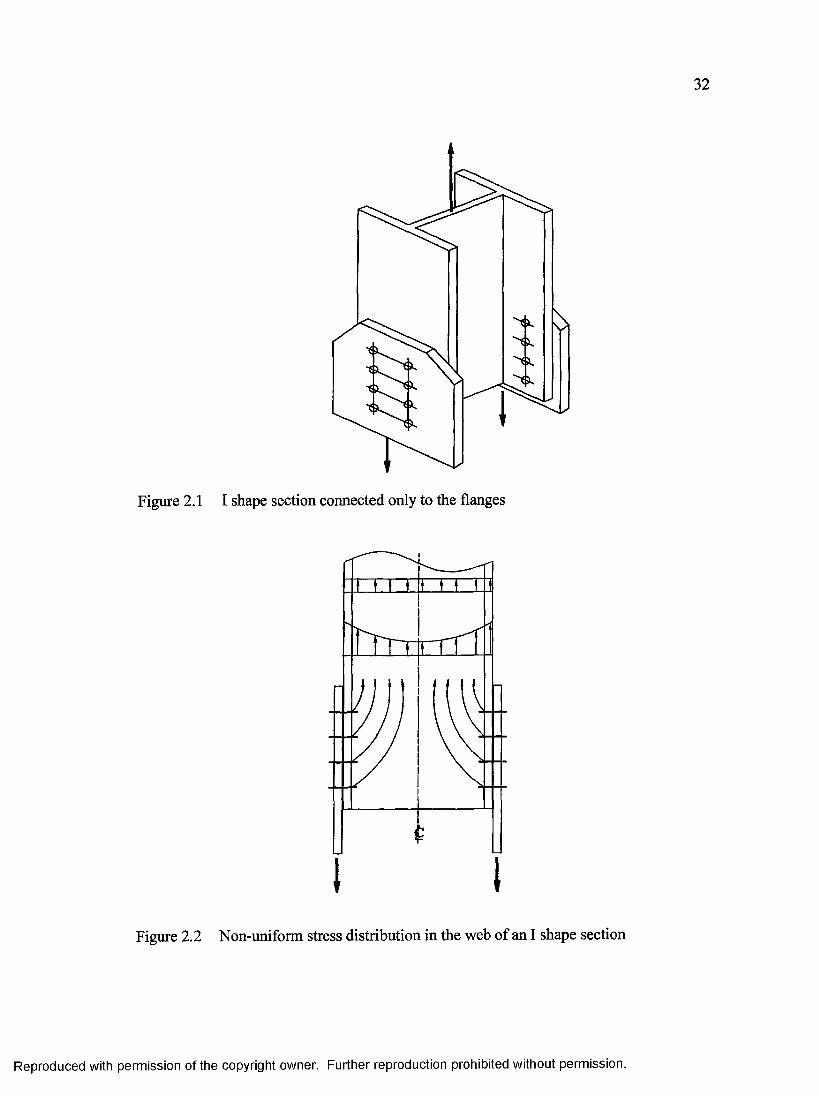
32
Figure 2.1 I shape section connected only to the flanges
1 \
Figure 2.2 Non-uniform stress distribution in the web of an I shape section
Reproduced with permission of the copyright owner. Further reproduction prohibited without permission.

33
I shape column
Gusset plate
Figure 2.3 The configuration tested by Munse and Chesson (1963)
HSS
Gusset plate
Figure 2.4 Slot orientation o f the HSS connection
Reproduced with permission of the copyright owner. Further reproduction prohibited without permission.
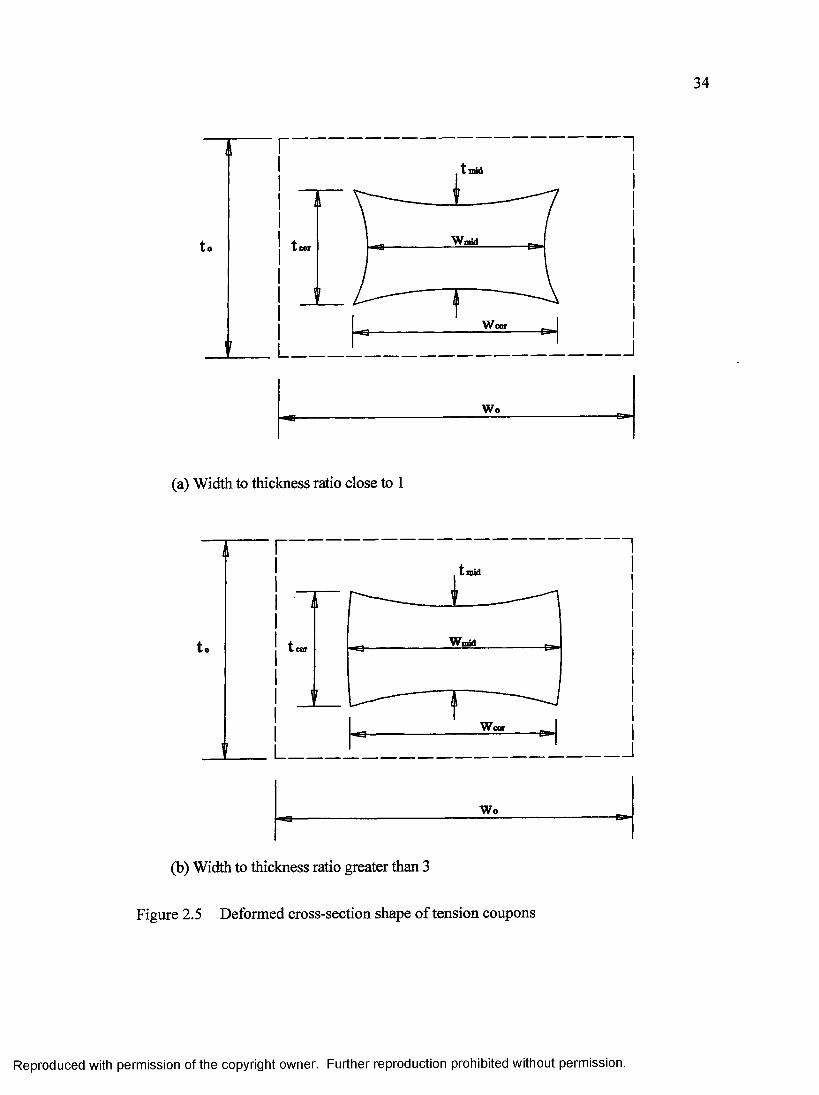
34
r
1 L.
W m idCOT
iWcor
(a) Width to thickness ratio close to 1
]
r
1 L.
W o
, t mid
Wmid
W ear
W o
(b) Width to thickness ratio greater than 3
Figure 2.5 Deformed cross-section shape o f tension coupons
J
"1
.J
Reproduced with permission of the copyright owner. Further reproduction prohibited without permission.
CHAPTER 3 TESTING PROGRAM
From the literature review, it was found that a more detailed study of slotted square
and rectangular HSS tension members is required in order to improve on the provisions for
shear lag in design standards. Therefore, a testing program was designed and carried out
on slotted square and rectangular HSS connections in John Adjeleian Laboratory of
Department o f Civil and Environmental Engineering at Carleton University. The testing
program was divided into two phases. The first phase of the testing program, consisting
o f twenty six HSS specimens with no end welding, were carried out by Huang (2005).
Four slotted HSS specimens with end welding for the second phase o f the testing program
were conducted in this study.
Previous studies have shown that the effect of shear lag is more severe for slotted
connections with no end welding. Thus any guideline and provision developed for the
connections with no end welding will be conservative when applied to that with end
welding. For this reason, the overall testing program focuses more on specimens with no
end wielding, and only four specimens with end welding were tested mainly to verify that
the effect of shear lag is less severe when end welding is provided.
A brief description o f test specimens, test setup and test results for phase 1 are
provided in Appendix A as a reference. This chapter only deals with phase 2 o f the
testing program.
35
Reproduced with permission of the copyright owner. Further reproduction prohibited without permission.
36
3.1 Objective
The objective o f the test is to investigate the strength and behavior o f square and
rectangular HSS with end welding for various slotted connection details. Ultimate load,
load versus deformation relationship and failure mode of the HSS connections with end
welding are examined. Results o f these tests are also used for validating the finite element
models o f the HSS connection that are to be used in the finite element analyses parametric
study.
3.2 Specimen details
Four specimens consisting of one rectangular and three square specimens were
fabricated. As shown in Figure 3.1, a continuous weld wrapping around the gusset plate
was provided at the end of the slot of the HSS connection. The hollow structural sections
consisted o f ASTM-A500 Grade C cold-formed non-stress relieved HSS 89 x 89 x 4.8 and
HSS 127 x 51 x 4.8. While the HSS 127 x 51 x 4.8 came from the same batch o f HSS as
that for phase 1, on the other hand the HSS 89 x 89 x 4.8 was from a different batch.
Gusset plates were fabricated from 16 mm (0.625”) thick ASTM-A572 Grade 55 plate.
Longitudinal fillet welds o f E48 xx grade were 8 mm in height and varied in length for
different specimens. As shown in Figure 3.1, the weld length (L) is taken as the length of
the straight segment of the longitudinal weld excluding the end weld, and the distance
between the welds (w) is taken as half o f the circumference along the centreline o f the HSS
section since the whole cross-section was connected. One duplicate square HSS specimen
was fabricated for a weld length ratio (L/w) o f 1.0. The specimen geometry is shown in
Figure 3.2.
Reproduced with permission of the copyright owner. Further reproduction prohibited without permission.
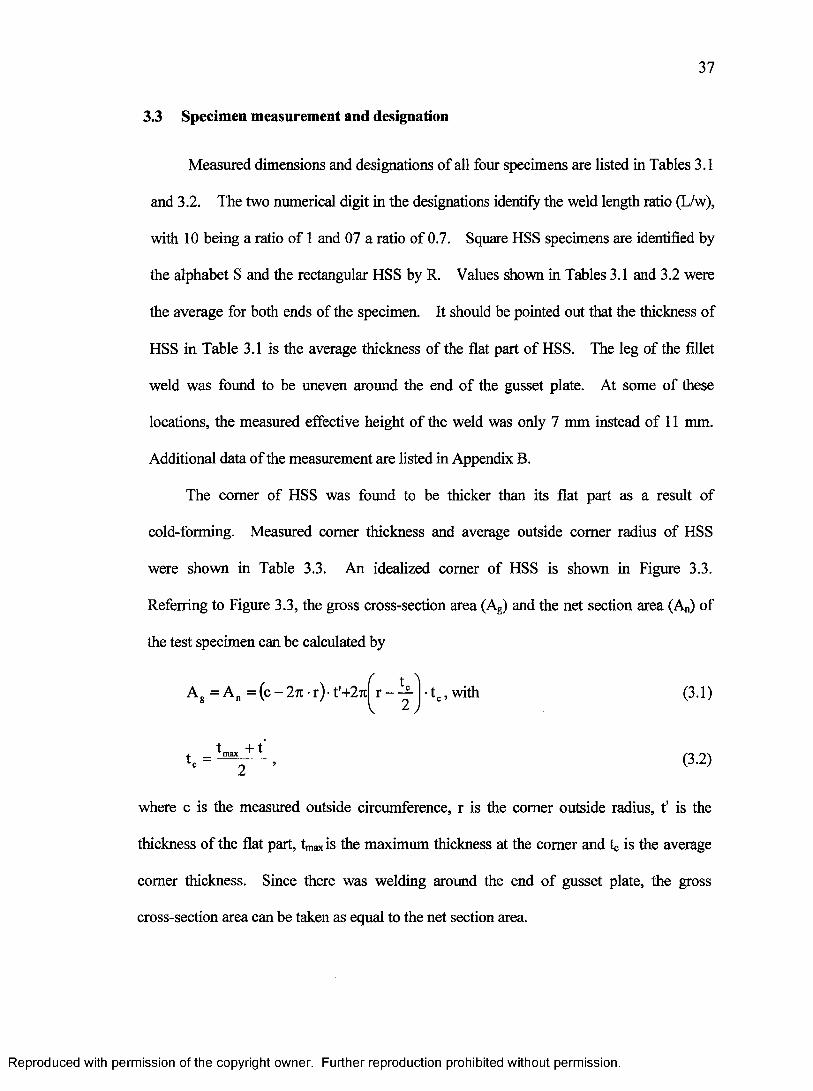
37
3.3 Specimen measurement and designation
Measured dimensions and designations o f all four specimens are listed in Tables 3.1
and 3.2. The two numerical digit in the designations identify the weld length ratio (L/w),
with 10 being a ratio o f 1 and 07 a ratio of 0.7. Square HSS specimens are identified by
the alphabet S and the rectangular HSS by R. Values shown in Tables 3.1 and 3.2 were
the average for both ends of the specimen. It should be pointed out that the thickness of
HSS in Table 3.1 is the average thickness of the flat part o f HSS. The leg of the fillet
weld was found to be uneven around the end o f the gusset plate. At some of these
locations, the measured effective height o f the weld was only 7 mm instead of 11 mm.
Additional data o f the measurement are listed in Appendix B.
The comer of HSS was found to be thicker than its flat part as a result of
cold-forming. Measured comer thickness and average outside comer radius of HSS
were shown in Table 3.3. An idealized comer o f HSS is shown in Figure 3.3.
Referring to Figure 3.3, the gross cross-section area (Ag) and the net section area (A„) of
the test specimen can be calculated by
A = A n = (c - 27t • r) • t'+27t f or - — v 2 ,
■tc,with (3.1)
t -Ft, (3.2)
where c is the measured outside circumference, r is the comer outside radius, f is the
thickness of the flat part, tmax is the maximum thickness at the comer and L is the average
comer thickness. Since there was welding around the end of gusset plate, the gross
cross-section area can be taken as equal to the net section area.
Reproduced with permission of the copyright owner. Further reproduction prohibited without permission.
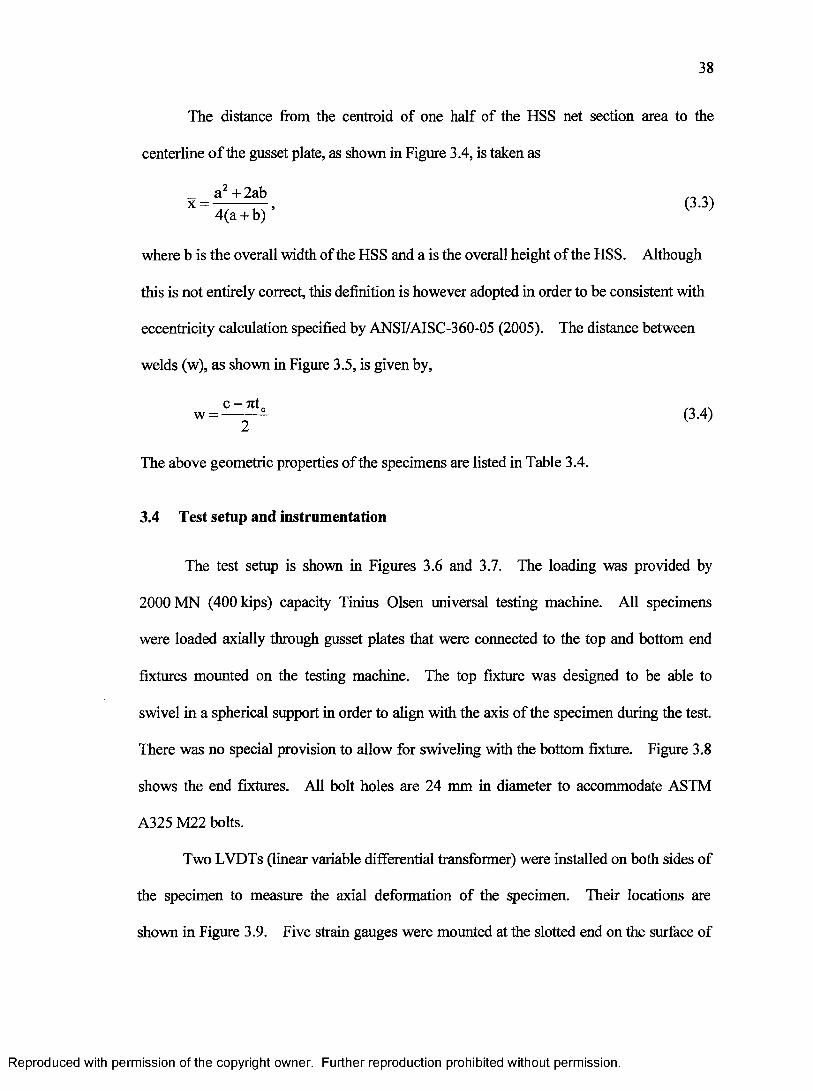
38
The distance from the centroid of one half of the HSS net section area to the
centerline o f the gusset plate, as shown in Figure 3.4, is taken as
_ a 2 + 2abx = 77----4(a + b)
where b is the overall width of the HSS and a is the overall height o f the HSS. Although
this is not entirely correct, this definition is however adopted in order to be consistent with
eccentricity calculation specified by ANSI/AISC-360-05 (2005). The distance between
welds (w), as shown in Figure 3.5, is given by,
c Tit _ . _ . w = --------- (3.4)
2
The above geometric properties o f the specimens are listed in Table 3.4.
3.4 Test setup and instrumentation
The test setup is shown in Figures 3.6 and 3.7. The loading was provided by
2000 MN (400 kips) capacity Tinius Olsen universal testing machine. All specimens
were loaded axially through gusset plates that were connected to the top and bottom end
fixtures mounted on the testing machine. The top fixture was designed to be able to
swivel in a spherical support in order to align with the axis o f the specimen during the test.
There was no special provision to allow for swiveling with the bottom fixture. Figure 3.8
shows the end fixtures. All bolt holes are 24 mm in diameter to accommodate ASTM
A325 M22 bolts.
Two LVDTs (linear variable differential transformer) were installed on both sides of
the specimen to measure the axial deformation o f the specimen. Their locations are
shown in Figure 3.9. Five strain gauges were mounted at the slotted end on the surface of
Reproduced with permission of the copyright owner. Further reproduction prohibited without permission.
39
HSS. They were orientated to measure the strain in the longitudinal (loading) direction.
The strain gauge under the gusset plate is designated as G1 and the gauge furthest away
designated as G5. Locations of strain gauge are shown in Figure 3.10.
3.5 Test procedure
During the test, readings of strain gauges, LVDT, stroke and load were recorded
through a data acquisition system at an interval o f 5 seconds. The real-time displays of
load versus deformation curve and load versus strain curve were monitored by a personal
computer that was connected to the data acquisition system. Stroke control was employed
in all the tests.
The specimen was normally subjected to two stages of loading in a test. The initial
stage o f the loading is elastic, and was followed by an inelastic stage. Initially, a stroke
rate o f 1 mm per minute was used in the elastic stage of the test and no static reading was
taken during this stage o f loading. The First static reading was taken when the load versus
deformation curve started to deviate from the straight line. After the first static reading,
the loading rate was kept at 1 mm per minute for specimens with the weld length ratio (L/w)
of 0.7. A higher rate o f 2 mm per minute was used for specimens with the weld length
ratio (L/w) o f 1.0 since these tests were expected to fail in the mid-length after extensive
deformation. Static readings were taken constantly at every 2 mm stroke interval during
the inelastic stage o f loading. The loading was put on hold for about 30 seconds before a
static reading is taken. A test was terminated when fracture occurred in the specimen.
Reproduced with permission of the copyright owner. Further reproduction prohibited without permission.
40
3.6 Material properties
Material properties of HSS and the gusset plates are required in evaluating the
efficiency of the test specimen and for the numerical simulation of the test. Material tests
were carried out to obtain material properties of HSS and the gusset plate. Tension
coupons were fabricated in accordance to ASTM-E8-04 (2004) and
CAN/CSA-G40.20-04 (2004). Coupons for HSS were cut longitudinally from the middle
half o f the flat part of HSS that was away from the seam weld and comers. Three
non-standard triangular coupons were cut from the comer of HSS 89 x 89 in order to obtain
a rough estimate of the strength increase due to cold-forming. These coupons were
neither flat, uniform nor straight. Figure 3.11 shows the geometry of the comer coupon.
After machining, the end of the coupon was subsequently flattened in order to fit into the
grip o f the test machine.
Tension coupon tests were carried out using a 100 kN capacity INSTRON testing
machine as shown in Figure 3.12. An extensometer with a 57.2 mm gauge length was
used to measure the longitudinal deformation during the test. Readings o f load, stroke and
extensometer were recorded through a data acquisition system. Displacement control was
employed in all tests. The test was carried out at a stroke rate o f 0.5 mm (0.02 inch) per
minute. Static readings and transverse deformations were taken at eveiy 0.5 to 0.8 mm
stroke displacement after yielding. Comer and mid-point thicknesses and widths at the
necking region were measured manually at every static reading once necking has started.
Before necking, only comer thickness and width were measured.
Average mechanical properties o f both HSS and gusset plate are listed in Table 3.5.
The yield strength o f HSS was calculated using the 0.2% offset method. Detailed results
Reproduced with permission of the copyright owner. Further reproduction prohibited without permission.
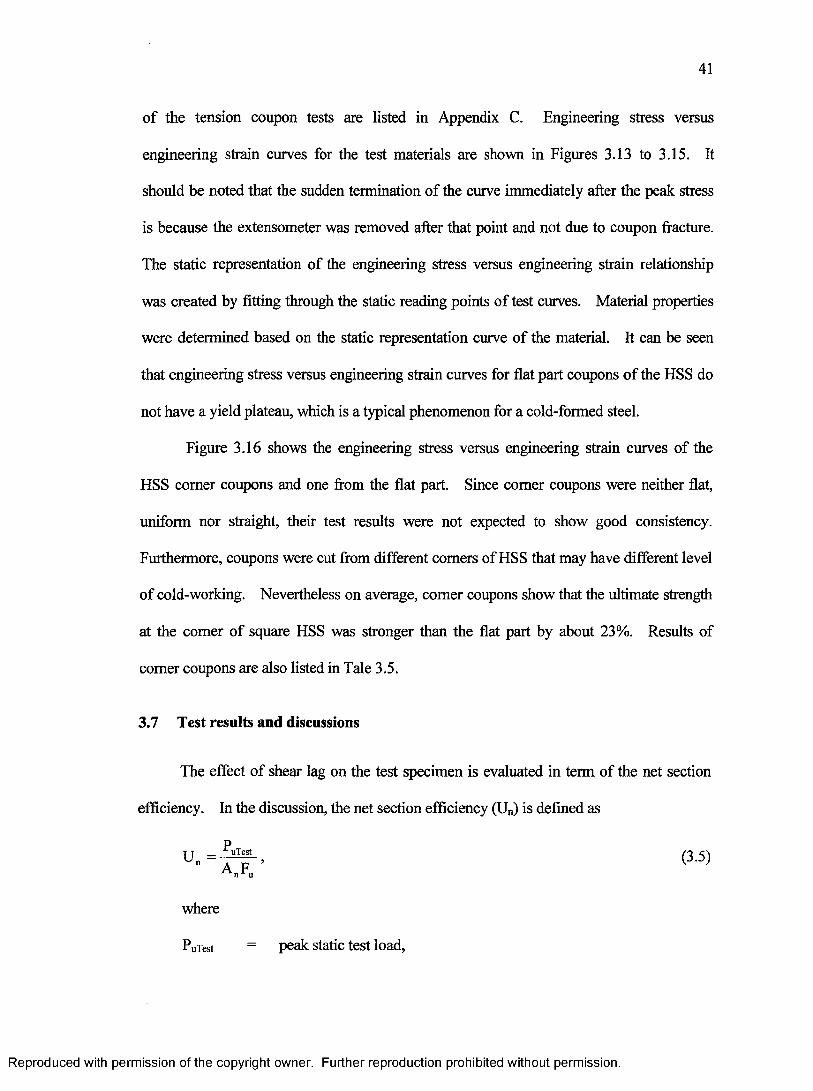
41
of the tension coupon tests are listed in Appendix C. Engineering stress versus
engineering strain curves for the test materials are shown in Figures 3.13 to 3.15. It
should be noted that the sudden termination o f die curve immediately after the peak stress
is because the extensometer was removed after that point and not due to coupon fracture.
The static representation o f the engineering stress versus engineering strain relationship
was created by fitting through the static reading points o f test curves. Material properties
were determined based on the static representation curve of the material. It can be seen
that engineering stress versus engineering strain curves for flat part coupons o f the HSS do
not have a yield plateau, which is a typical phenomenon for a cold-formed steel.
Figure 3.16 shows the engineering stress versus engineering strain curves of the
HSS comer coupons and one from the flat part. Since comer coupons were neither flat,
uniform nor straight, their test results were not expected to show good consistency.
Furthermore, coupons were cut from different comers of HSS that may have different level
o f cold-working. Nevertheless on average, comer coupons show that the ultimate strength
at the comer o f square HSS was stronger than the flat part by about 23%. Results of
comer coupons are also listed in Tale 3.5.
3.7 Test results and discussions
The effect o f shear lag on the test specimen is evaluated in term of the net section
efficiency. In the discussion, the net section efficiency (Un) is defined as
U „ = ~ . (3.5)A nFu
where
PuTest = peak static test load,
Reproduced with permission of the copyright owner. Further reproduction prohibited without permission.
42
An = net area o f the cross-section, and
Fu = ultimate tensile strength of the flat part o f HSS
The ultimate tensile strength of the material was determined by tension coupon tests.
3.7.1 Test results
All square HSS specimens fractured at the mid-length o f the specimen after
extensive necking. An example of the failure is shown in Figure 3.17. Unlike the square
HSS specimens, the rectangular HSS specimen failed at the slotted end. Figure 3.18
shows cracks were initiated both at the end of the gusset plate and at the end o f HSS.
However, it was not able to tell at which location the crack has first started in the test.
Subsequently, complete weld shear failure occurred as the crack ran a full length along the
fillet weld on one side o f HSS, as shown in Figure 3.19. The load versus average LVDT
curves for all specimens are shown in Figures 3.20 and 3.21. All specimens exhibited
significant deformation prior to fracture even for the rectangular HSS specimen.
Figure 3.22 shows the measured strain distribution for square HSS specimens at two stages
of loading where strains at strain gauge G1 are equal between specimens. It can be seen
that there is higher stress concentration for the lower weld length ratio (L/w) specimen o f
0.7 (S07) than that for 1.0 (SlO-a). The higher stress concentration is characterized by the
sharper increase in the strain from gauge G2 to G1.
Net section efficiencies (Un) o f the specimens are shown in Table 3.6. All
specimens have efficiencies slightly greater than unity. The reason being that the comer
of a HSS is stronger than its flat part. The effect of a stronger comer will be studied in
more details through numerical simulations in Chapters 5 and 6. Test results shows that
there is no significant net section efficiency difference between specimens with L/w o f 0.7
Reproduced with permission of the copyright owner. Further reproduction prohibited without permission.

43
and 1.0. The gross section area is used in calculating the net section efficiency with (3.1)
because there is no opening at the end of the gusset plate. But it should be noted that
ANSI/AISC-360-05 neglects the cross-section area removed to make the slot when
calculating the net section area o f the tension member. The net section reduction
factors calculated by (2.5) to (2.7) for CSA-S16.1-01 and by (2.18) for ANSI/AISC-360-05
are also presented in Table 3.6. Compared to test results, it can be seen that provisions to
account for shear lag in CSA-S16.1-01 and ANSI/AISC-360-05 greatly underestimate the
efficiency by up to 20% to 40%. Specimens S07 and R07 with a weld length ratio o f 0.7,
have net section efficiencies that are comparable to specimens from phase 1 of the testing
program that have the weld length ratio of around 0.8 (Appendix A). This shows that the
effect o f shear lag is more severe in a slotted HSS connection without end welding
compared to the one with end welding. Thus, the efficiency equation developed for a
slotted HSS connection with no end welding can be applied to one with end welding.
Reproduced with permission of the copyright owner. Further reproduction prohibited without permission.
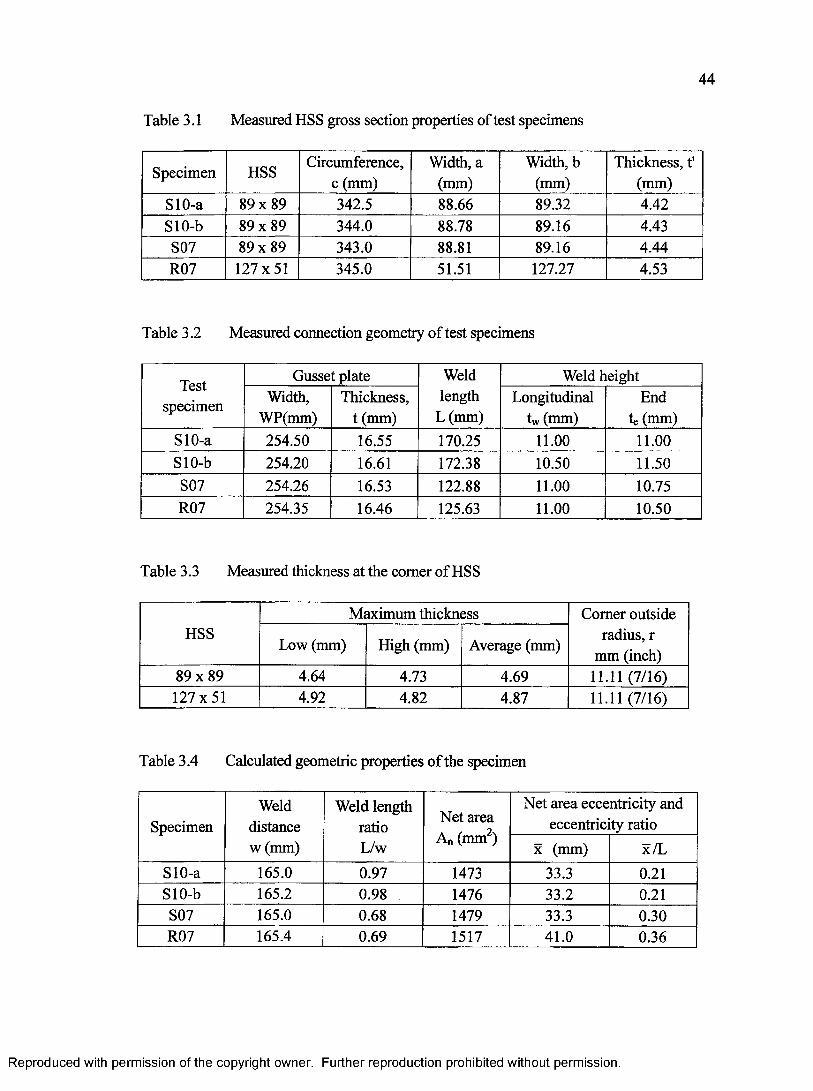
44
Table 3.1 Measured HSS gross section properties of test specimens
Specimen HSSCircumference,
c (mm)Width, a
(mm)Width, b
(mm)Thickness, t1
(mm)SlO-a 8 9 x 8 9 342.5 88.66 89.32 4.42SlO-b 8 9 x 8 9 344.0 88.78 89.16 4.43S07 8 9 x 8 9 343.0 88.81 89.16 4.44R07 127x51 345.0 51.51 127.27 4.53
Table 3.2 Measured connection geometry o f test specimens
Testspecimen
Gusset plate Weld length
L (mm)
Weld heightWidth,
WP(mm)Thickness,
t (mm)Longitudinal
tw (mm)End
te (mm)SlO-a 254.50 16.55 170.25 11.00 11.00SlO-b 254.20 16.61 172.38 10.50 11.50S07 254.26 16.53 122.88 11.00 10.75R07 254.35 16.46 125.63 11.00 10.50
Table 3.3 Measured thickness at the comer of HSS
HSSMaximum thickness Comer outside
radius, r mm (inch)
Low (mm) High (mm) Average (mm)
8 9 x 8 9 4.64 4.73 4.69 11.11 (7/16)127x51 4.92 4.82 4.87 11.11 (7/16)
Table 3.4 Calculated geometric properties o f the specimen
SpecimenWeld
distance w (mm)
Weld length ratio L/w
Net area An (mm2)
Net area eccentricity and eccentricity ratio
x (mm) x/LSlO-a 165.0 0.97 1473 33.3 0.21SlO-b 165.2 0.98 1476 33.2 0.21S07 165.0 0.68 1479 33.3 0.30R07 165.4 0.69 1517 41.0 0.36
Reproduced with permission of the copyright owner. Further reproduction prohibited without permission.
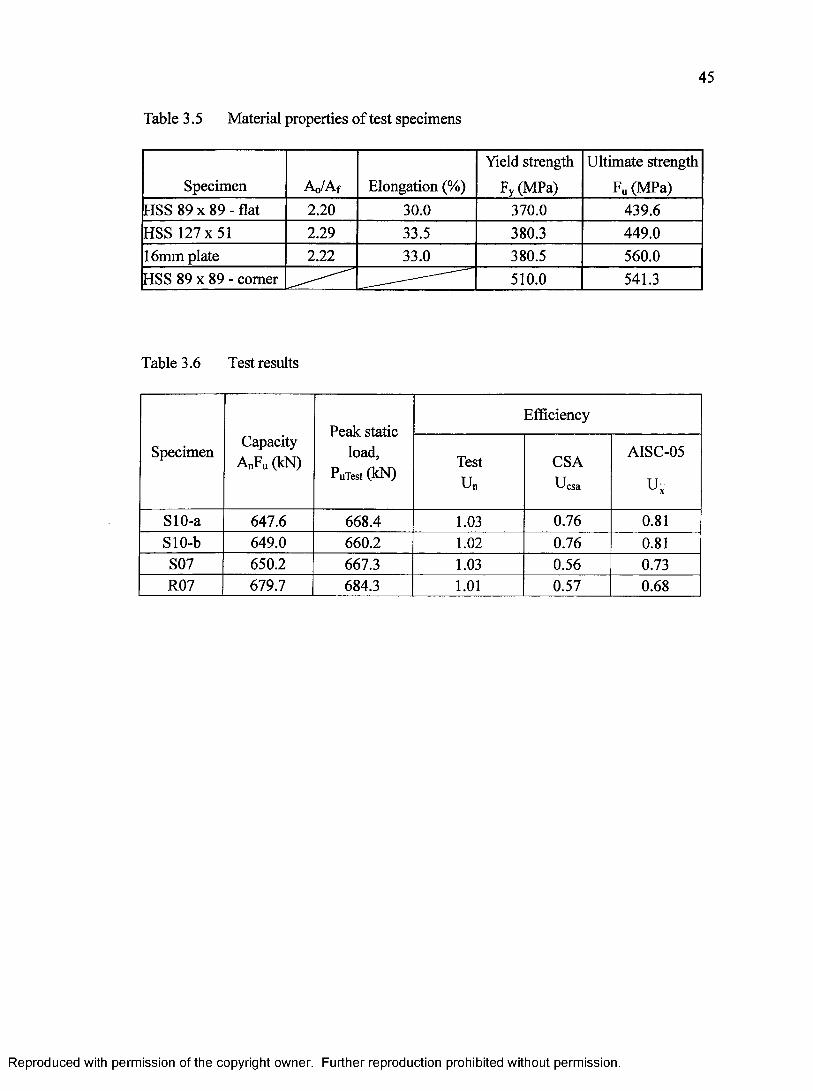
45
Table 3.5 Material properties o f test specimens
Specimen Ao/Af Elongation (%)
Yield strength
Fy (MPa)
Ultimate strength
Fu (MPa)HSS 89 x 89 - flat 2.20 30.0 370.0 439.6HSS 127x51 2.29 33.5 380.3 449.016mm plate 2.22 33.0 380.5 560.0HSS 89 x 89 - comer ^ 510.0 541.3
Table 3.6 Test results
SpecimenCapacity
AnFu (kN)
Peak static load,
P uTest (kN)
Efficiency
Testu n
CSAUcsa
AISC-05
Ux
SlO-a 647.6 668.4 1.03 0.76 0.81SlO-b 649.0 660.2 1.02 0.76 0.81S07 650.2 667.3 1.03 0.56 0.73R07 679.7 684.3 1.01 0.57 0.68
Reproduced with permission of the copyright owner. Further reproduction prohibited without permission.
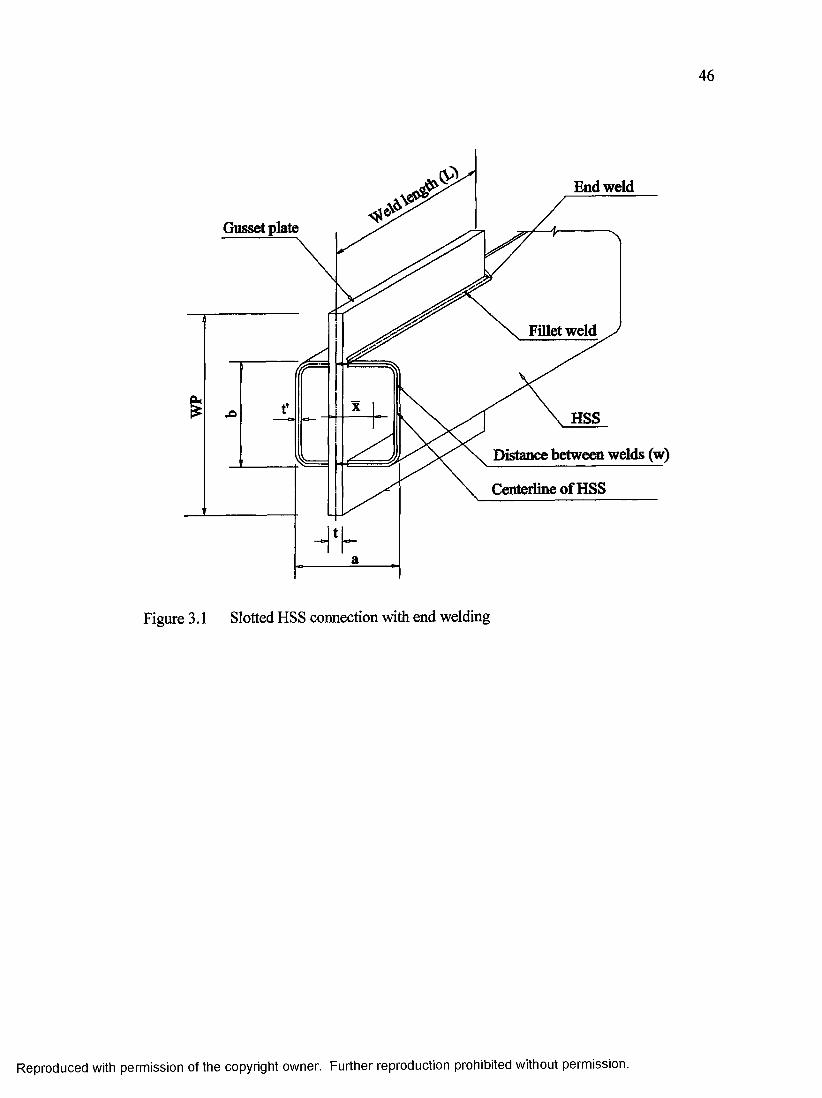
46
End weld
Gusset plate
Fillet weld
HSS
Distance between welds (w)
Centerline of HSS
Figure 3.1 Slotted HSS connection with end welding
Reproduced with permission of the copyright owner. Further reproduction prohibited without permission.
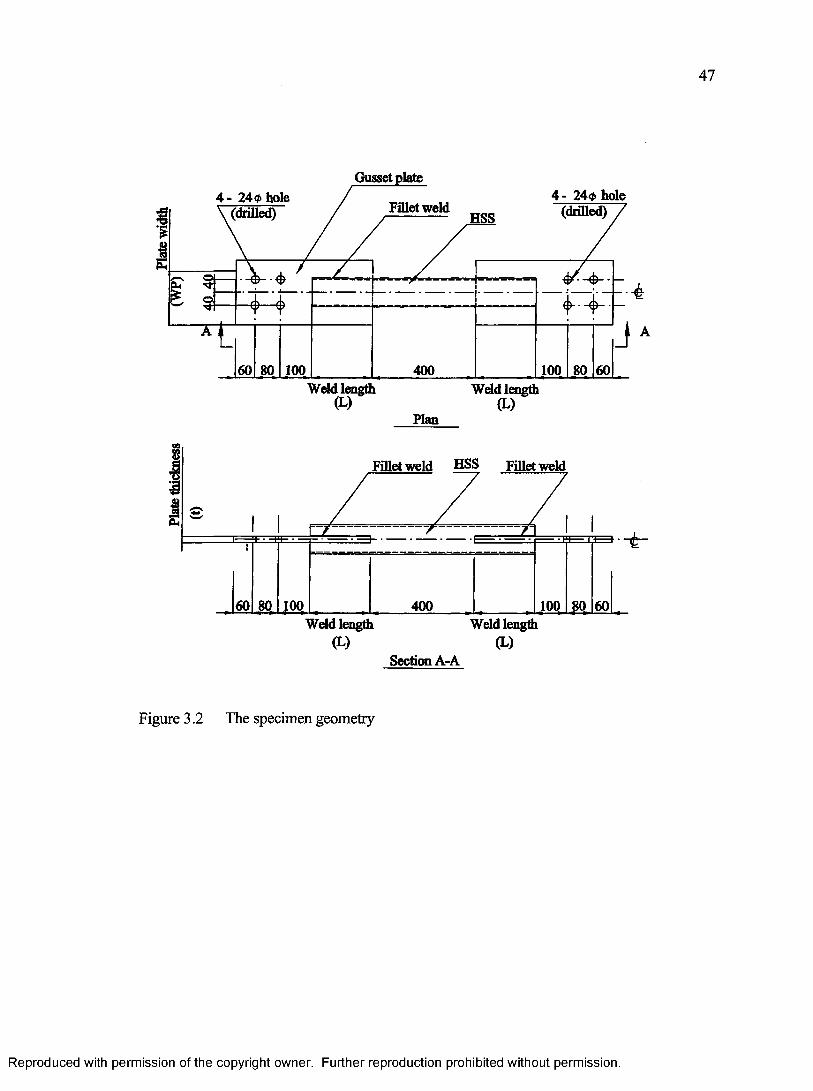
Plat
e w
idth
Gasset plate
Fillet weld4 - 24<j> h o le
(drilled)(drilled) HSS
o
100 4 0 0 100Weld length Weld length
Plan
Fillet weld HSS Fillet weld
100 4 0 0 100Weld length Weld length
(L ) (L )S ection A -A
Figure 3.2 The specimen geometry
Reproduced with permission of the copyright owner. Further reproduction prohibited without permission.
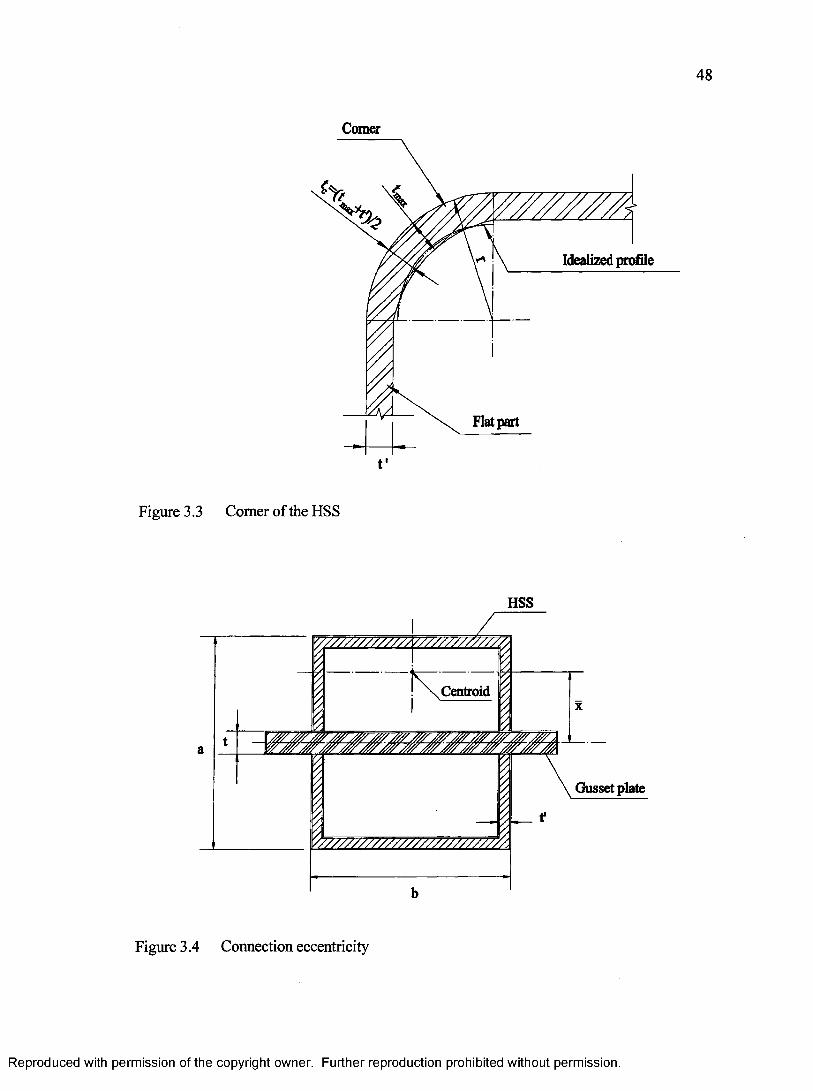
48
Comer
V /////////A -\ Idealized profile
Flat part
t'
Figure 3.3 Comer of the HSS
HSS
/ / / / / / / / / / / / 7 7 s7 7 /7 7 /7 /7 /7 /7 /
C entroid /
G usset p late
/ / / / / / / / / / / / / / / / / / 7 / / / / 7 7 7 Z 7 /
b
Figure 3.4 Connection eccentricity
Reproduced with permission of the copyright owner. Further reproduction prohibited without permission.

49
HSS
t*
Gusset plate
Figure 3.5 Definition of the distance between the welds (w)
Reproduced with permission of the copyright owner. Further reproduction prohibited without permission.
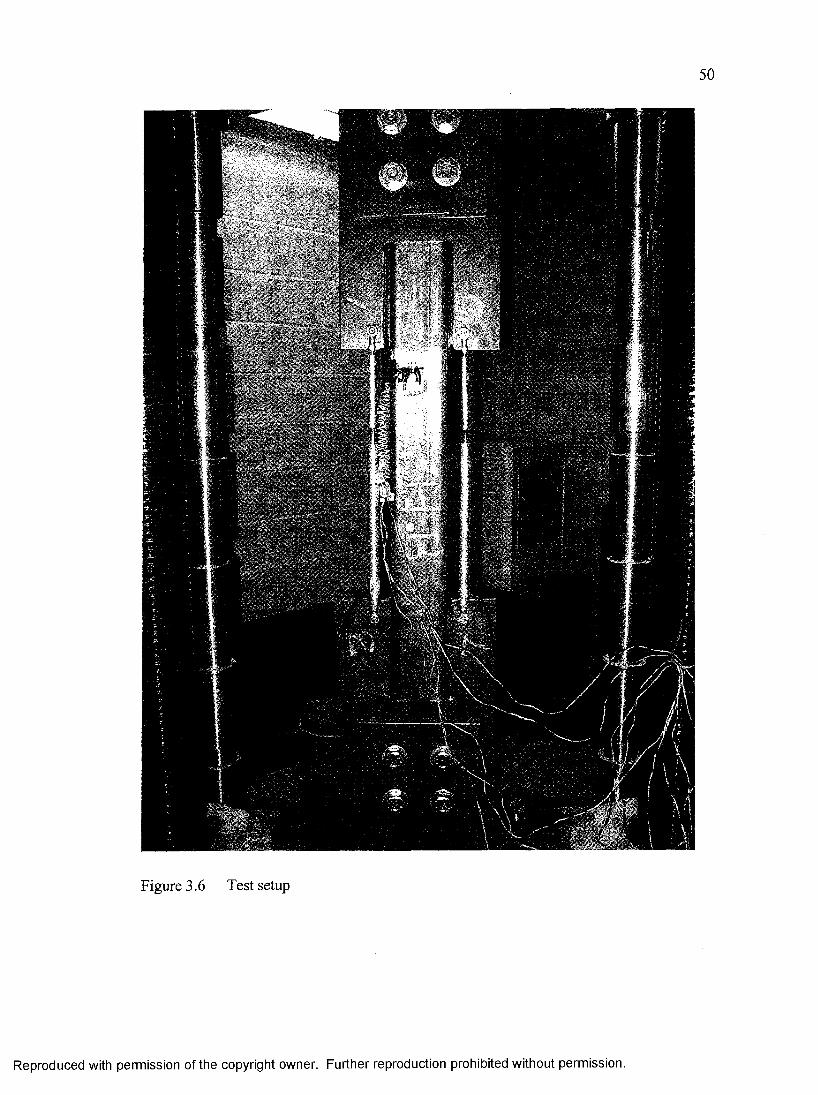
Figure 3.6 Test setup
Reproduced with permission of the copyright owner. Further reproduction prohibited without permission.
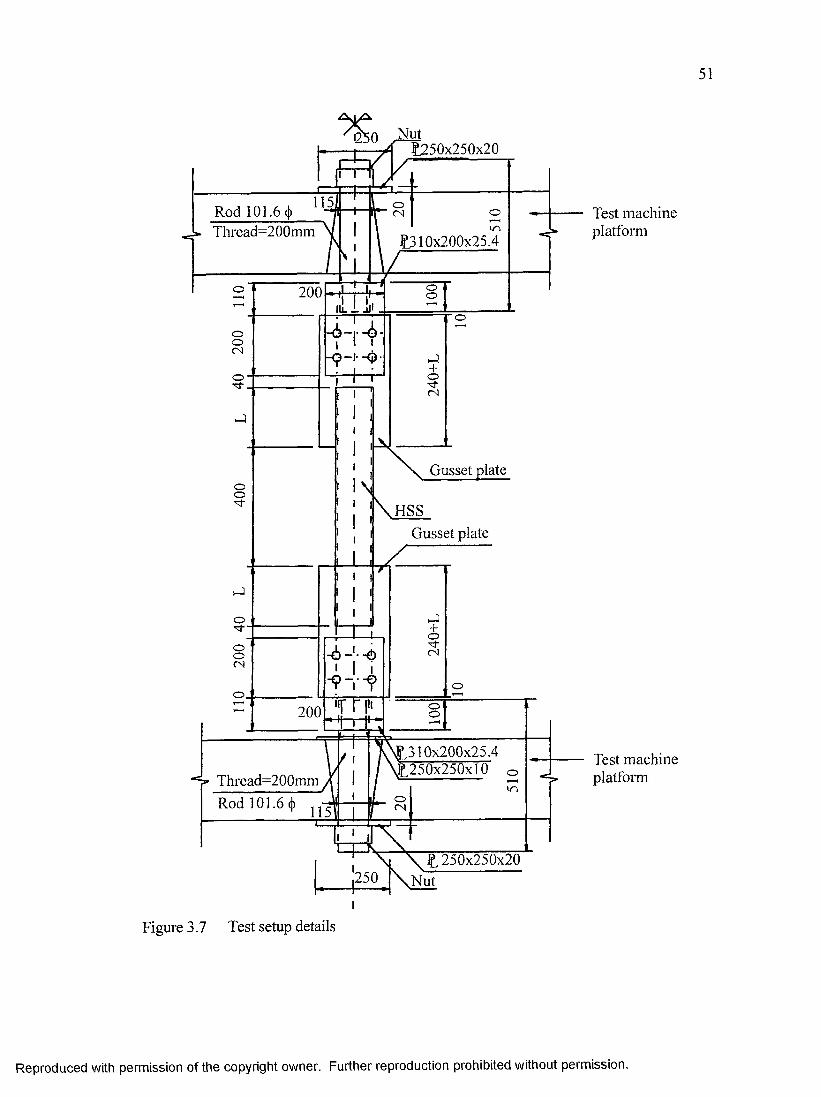
51
Nut
oCMRod 101.6 (> o
IC~>f 3 10x200x25.4
Thread=200mm
ooo 200
ooC M
o
Gusset platioo
\ h s s
Gusset plate
o
ooCM
o
oo200
\\JL310x200x25 V 250x250xl0
■ c m
of” Thread=200mmRod 101.6 cj)
f , 250x250x20250 Nut
Figure 3.7 Test setup details
Test machine platform
Test machine platform
Reproduced with permission of the copyright owner. Further reproduction prohibited without permission.
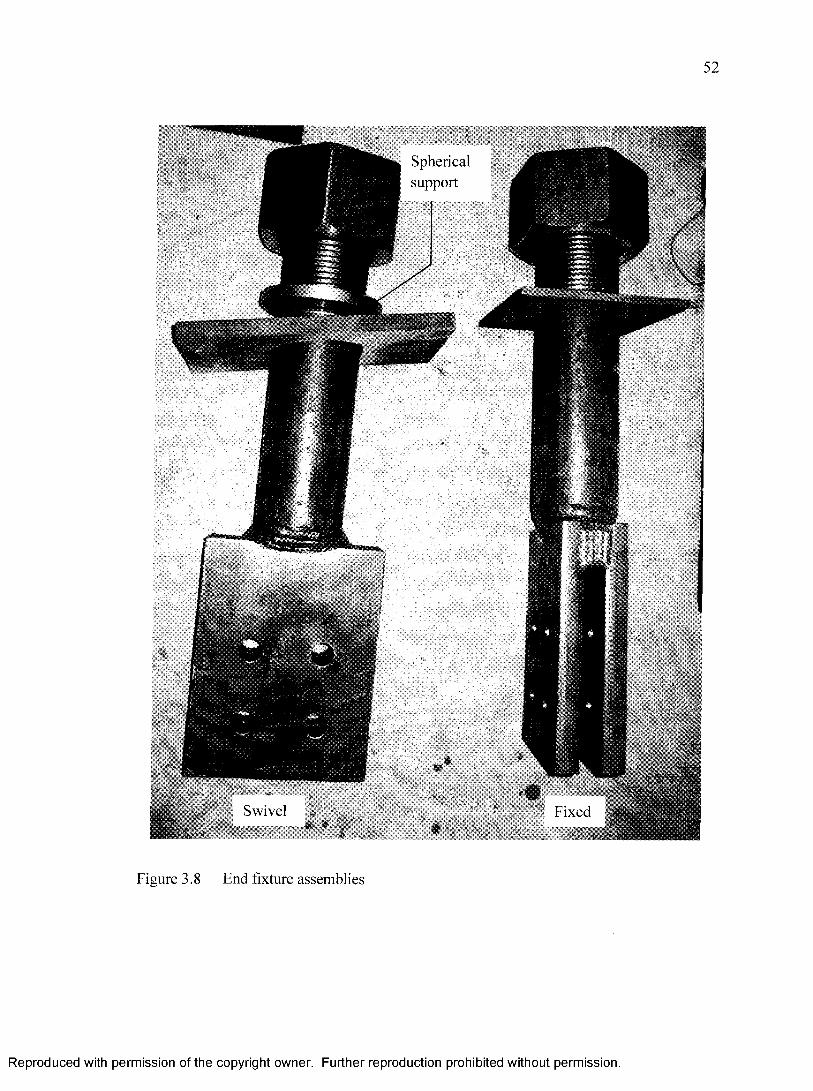
Figure 3.8 End fixture assemblies
Reproduced with permission of the copyright owner. Further reproduction prohibited without permission.

53
i- ■ © -
HSS
Gusset plate
5mm (j) small screw welded to the gusset plate
o Y _ LVDT
Connecting bar
LVDT
Connecting bar
oNGusset plate
5mm (j) small screw welded to the gusset plate
- 0 -
Figure 3.9 Locations o f LVDT.
Reproduced with permission of the copyright owner. Further reproduction prohibited without permission.
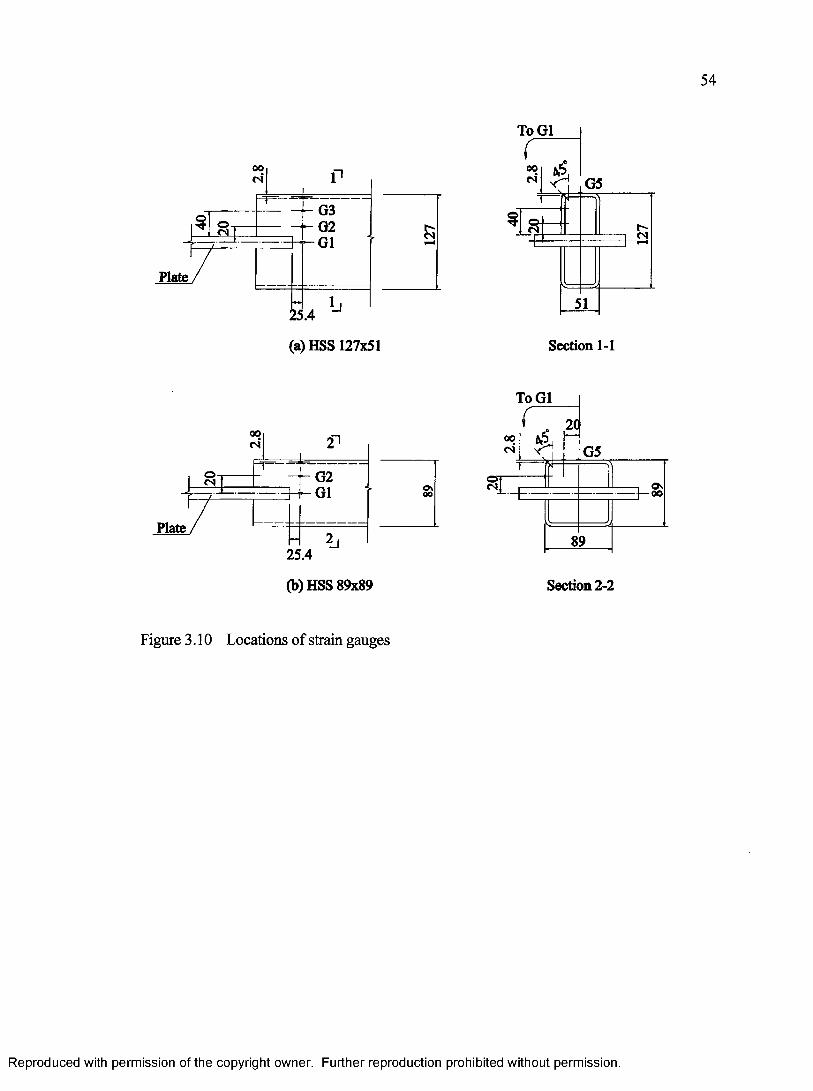
ToGl
G5
<N
Plate
(a)HSS 127x51 Section 1-1
ToGl
fN
Plate
25.4
(b) HSS 89x89
Figure 3.10 Locations of strain gauges
Section 2-2
Reproduced with permission of the copyright owner. Further reproduction prohibited without permission.
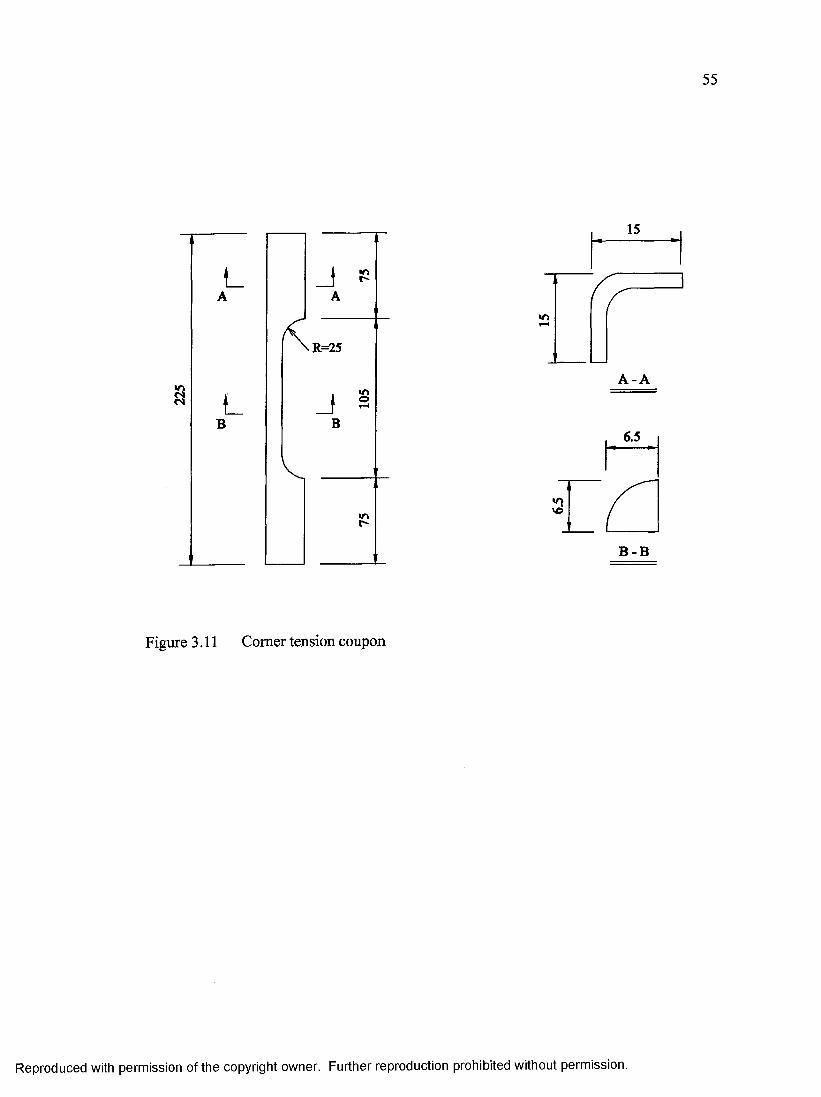
55
15
A -A
6.5
*0vd
B -B
Figure 3.11 Comer tension coupon
Reproduced with permission of the copyright owner. Further reproduction prohibited without permission.
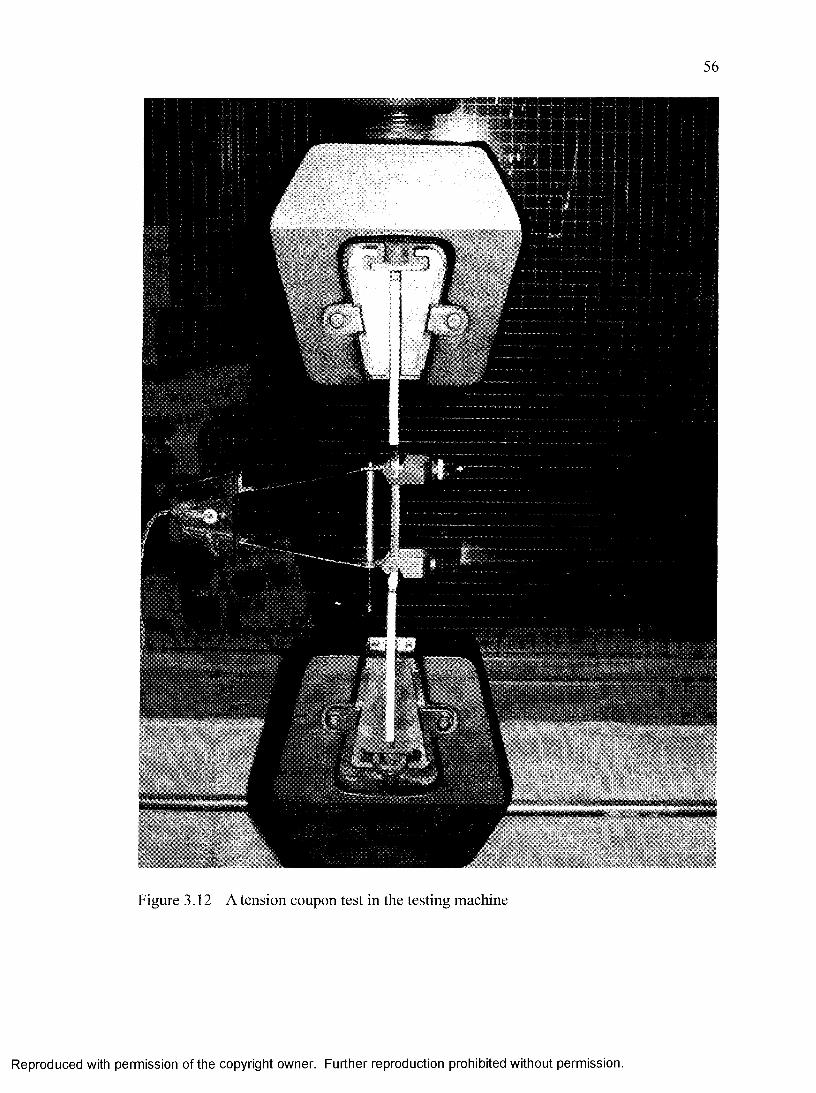
Figure 3.12 A tension coupon test in the testing machine
Reproduced with permission of the copyright owner. Further reproduction prohibited without permission.
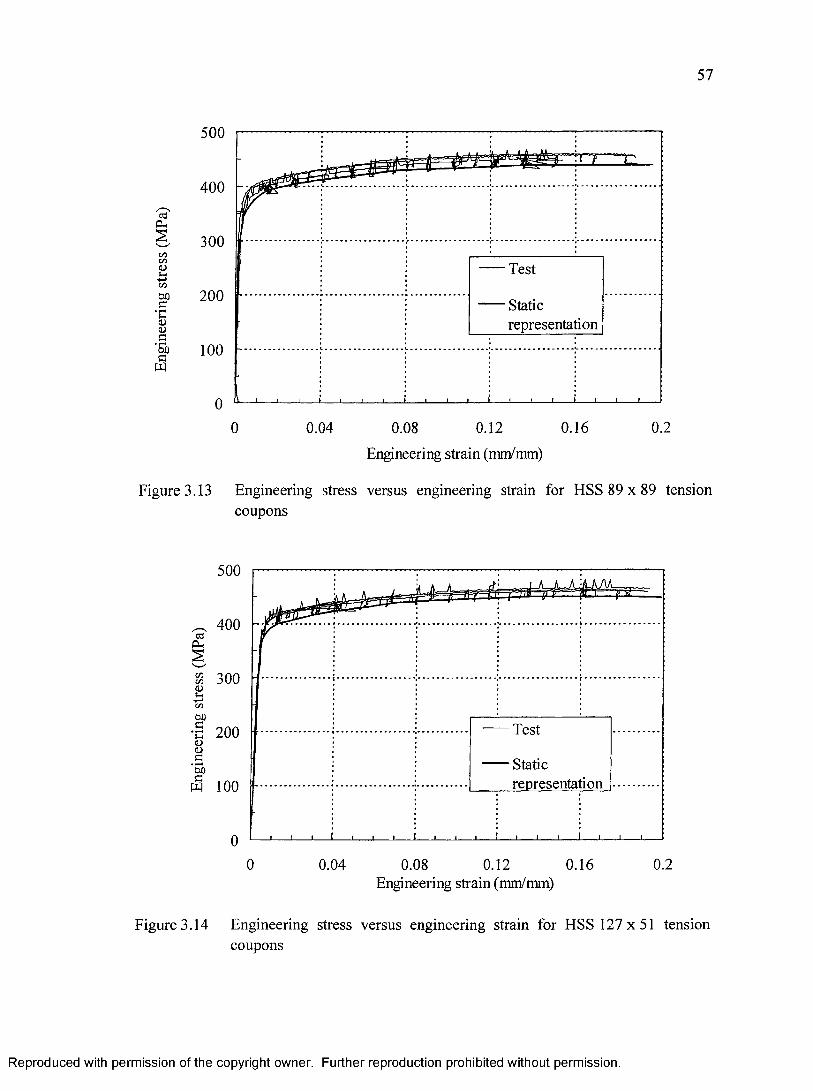
Engi
neer
ing
stres
s (M
Pa)
57
500
400
300
Test
200 Staticrepresentation
100
0.160.12 0.20 0.04 0.08
Engineering strain (mm/mm)
Figure 3.13 Engineering stress versus engineering strain for HSS 89 x 89 tension coupons
500M -
400
% 300<L>
Test•S 200
Staticrepresentation
OOa« 100
0 0.12 0.16 0.20.04 0.08Engineering strain (mm/mm)
Figure 3.14 Engineering stress versus engineering strain for HSS 127x51 tension coupons
Reproduced with permission of the copyright owner. Further reproduction prohibited without permission.
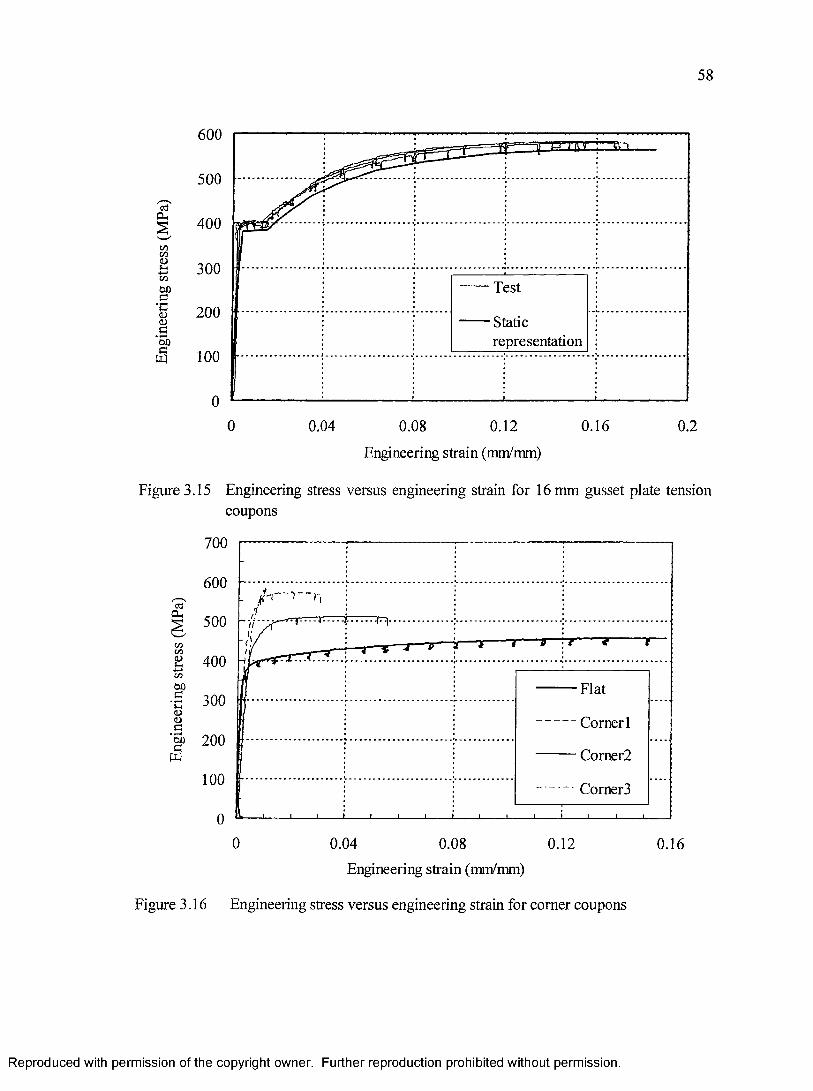
58
600
500
§ 400
300cn00g'C<u
Test
200 Staticrepresentation5b
100
0 0.160.04 0.08 0.12 0.2
Engineering strain (mm/mm)
Figure 3.15 Engineering stress versus engineering strain for 16 mm gusset plate tension coupons
700
600
1 ^OO2 400
Flat300J-H<L)
<L>C Corner 1
• r—<OOcW
200Corner2
100 Corner3
0 0.04 0.08 0.12 0.16
Engineering strain (mm/mm)
Figure 3.16 Engineering stress versus engineering strain for corner coupons
Reproduced with permission of the copyright owner. Further reproduction prohibited without permission.

Failure o f S-10a
Figure 3.17 A typical square HSS specimen failure at the mid-length
Reproduced with permission of the copyright owner. Further reproduction prohibited without permission
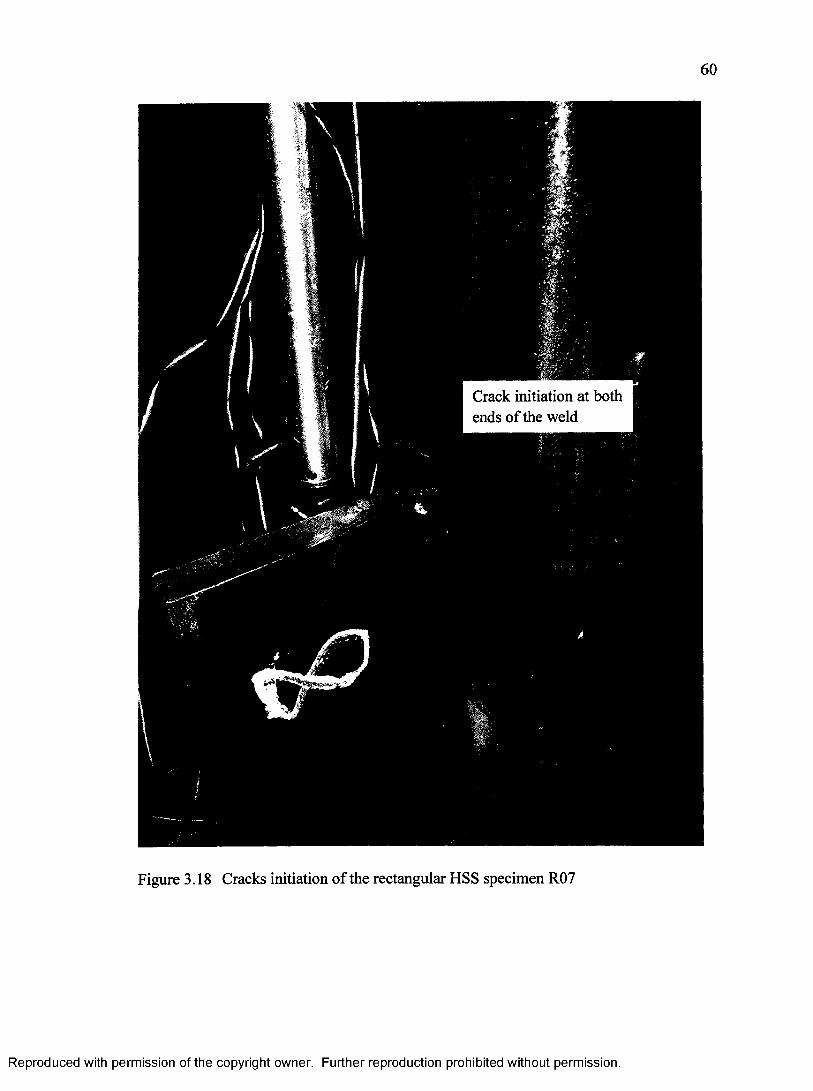
Figure 3.18 Cracks initiation o f the rectangular HSS specimen R07
Reproduced with permission of the copyright owner. Further reproduction prohibited without permission.

Figure 3.19 Failure of the rectangular HSS specimen R07
Reproduced with permission of the copyright owner. Further reproduction prohibited without permission.

62
800
600
xi 400cdOh -3
— S10-a • -SlO-b— S07
200
0 20 40 60 80Average LVDT (mm)
Figure 3.20 Load versus average LVDT displacement for HSS 89 x 89 specimens
800
600
R07
200
0 10 20 30 40 50Average LVDT (mm)
Figure 3.21 Load versus average LVDT displacement for the HSS 127 x 51 specimen
Reproduced with permission of the copyright owner. Further reproduction prohibited without permission.
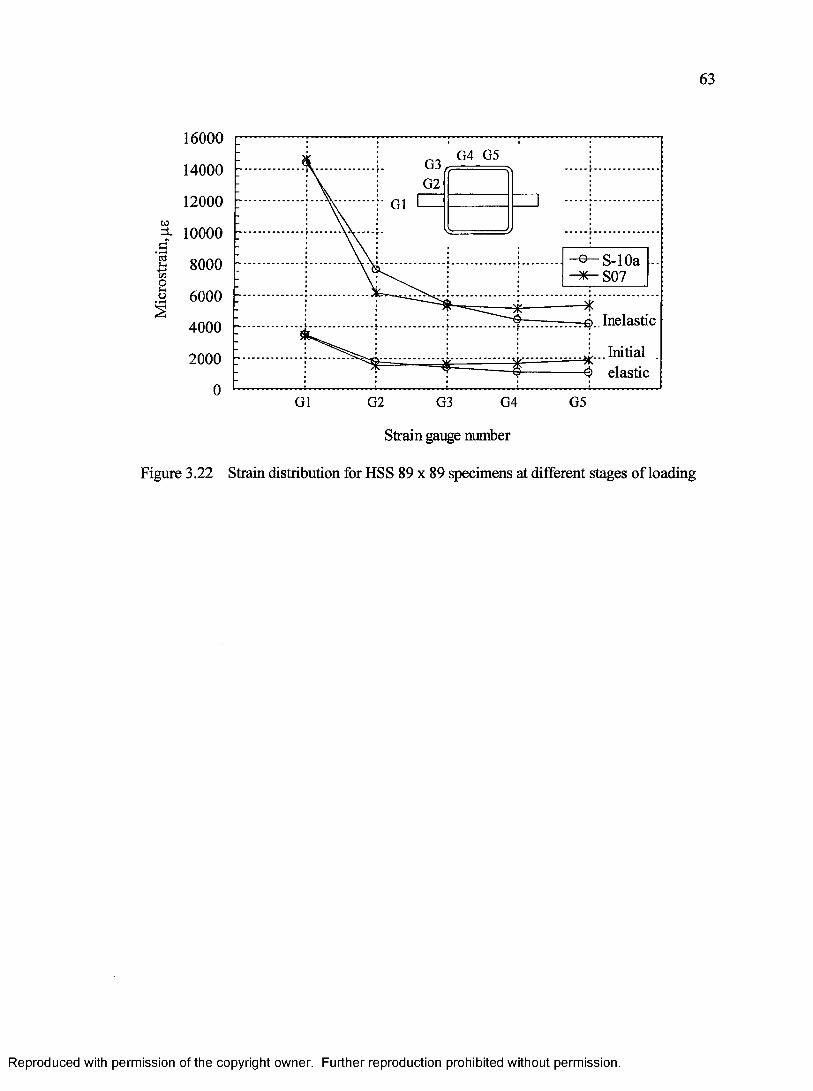
Mic
rost
rain
, p.g
63
16000G4 G5
G3
G214000
12000 G1
10000
8000
6000i Inelastic4000
.. Initial 4 elastic
2000
G4 G5G1 G2 G3
Strain gauge number
Figure 3.22 Strain distribution for HSS 89 x 89 specimens at different stages o f loading
Reproduced with permission of the copyright owner. Further reproduction prohibited without permission.
CHAPTER 4 MATERIAL PROPERTIES
In a numerical simulation, gusset plates and HSS members are assumed to deform
according to the incremental flow plasticity theory with isotropic hardening. Thus, the
true stress versus true plastic strain relationship up to the instant o f fracture is needed in
order to carry out the finite element analysis to assess the performance of the connection.
Procedures to determine the material true stress versus true strain plastic relationship o f the
gusset plate and HSS are discussed.
The following elastic modulus (E) and Poisson’s ratio (v) are used in all numerical
analyses.
E = 200000 MPa, and
v = 0.3.
It should be noted that the extensometer used in the tension coupon test is not sensitive
enough to measure the very small linear elastic deformation o f the tension coupon
accurately. But the extensometer has no problem measuring the remaining plastic
deformation o f the coupon when the deformation is large. This can be seen in the
consistency of the engineering stress versus engineering strain curves after yielding as
shown in Figures 3.14 and 3.15. It is well established that the elastic modulus o f steel is
around 200000 MPa. For this reason, the elastic modulus is simply taken as 200000 MPa
in all analyses. The exact value of the elastic modulus is not important since the finite
element analysis involved significant plastic deformation that greatly exceeds the strain at
the elastic proportional limit.
64
Reproduced with permission of the copyright owner. Further reproduction prohibited without permission.
65
4.1 True stress versus true strain curve
In a standard tension coupon test, measurements of the axial deformation versus
load only allow the true stress versus true plastic strain relationship to be calculated up to
the peak load. In this study, an interactive procedure is adopted to determine the true
stress versus true plastic strain relationship of the material beyond the peak load. This
procedure uses the function proposed by Naqvi and Khoo (2004) to define the true stress
versus true plastic strain curve beyond the peak load. Similar to Metic (1985), the
function is corrected iteratively until results of the numerical simulation o f the tension
coupon matches that of the test. The adopted procedure is discussed in the following
sections.
4.1.1 True stress versus true strain curve up to the peak load
Up to the peak load, the true stress versus true strain relationship can be converted
directly from the engineering stress versus engineering strain data o f a standard tension
coupon test. The engineering stress (cre) and engineering strain ( s e) over a gauge length
are defined as
a e = — , and (4.1)A„
where
F = load,
A g = original cross-section area,
L = current length o f the gauge, and
Reproduced with permission of the copyright owner. Further reproduction prohibited without permission.
66
L0 = original gauge length.
Since the cross-section is in an uniaxial state of stress and by assuming that there is no
volume change in plastic deformation, the true stress ( g ‘ ) and true plastic strain ( s p ) can
be written in terms of engineering stress and strain as
cr' =cre(l + £e), and (4.3)
s p = s ' - — , with (4.4)E
s ' =ln(l + s e), (4.5)
where
sl = true strain, and
E = elastic modulus
4.1.2 True stress versus true strain curve after the peak load
Khoo et al. (2000) has shown that the relationship of load versus axial deformation
is sensitive to any slight geometric variation after the peak load is reached. On the other
hand, the load versus transverse deformation relationship was found to be insensitive to a
small geometric variation. Therefore, load versus transverse deformation data are more
reliable in representing the material response in large strain.
After the peak load, an iterative numerical method is used in obtaining the true
stress versus true strain relationship. The trial true stress versus true strain relationship is
adjusted iteratively until the numerical simulation agrees with the engineering stress versus
cross sectional deformation data o f the tension coupon test. The version o f power-law
stress versus strain function proposed by Naqvi and Khoo (2004) is adopted in generating
Reproduced with permission of the copyright owner. Further reproduction prohibited without permission.
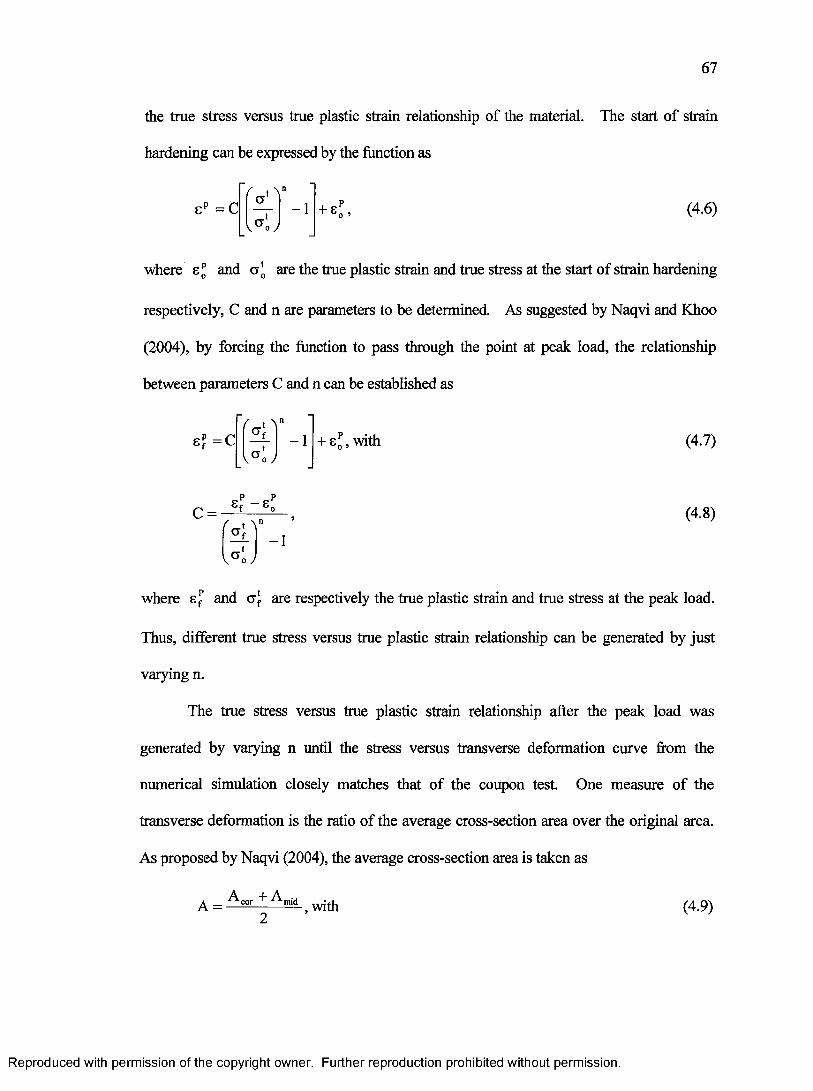
67
the true stress versus true plastic strain relationship of the material. The start o f strain
hardening can be expressed by the function as
where eo and a ' are the true plastic strain and true stress at the start of strain hardening
respectively, C and n are parameters to be determined. As suggested by Naqvi and Khoo
(2004), by forcing the function to pass through the point at peak load, the relationship
between parameters C and n can be established as
Thus, different true stress versus true plastic strain relationship can be generated by just
varying n.
The true stress versus true plastic strain relationship after the peak load was
generated by varying n until the stress versus transverse deformation curve from the
numerical simulation closely matches that o f the coupon test. One measure o f the
transverse deformation is the ratio o f the average cross-section area over the original area.
As proposed by Naqvi (2004), the average cross-section area is taken as
(4.6)
S f =C - 1 + s£ ,w ith (4.7)
-1
(4.8)
where and aj- are respectively the true plastic strain and true stress at the peak load.
(4.9)
Reproduced with permission of the copyright owner. Further reproduction prohibited without permission.
68
A cor= t corwcor,and
inid — mid mid >
where wcor and tcor are the width and thickness at the comers, wmjd and tmid are the width
and thickness at the mid-point o f the sides, as shown in Figure 2.5. Up to peak load, Acor
and Amid are equal. Naqvi (2004) has shown that using the average area defined by (4.9),
the load versus transverse deformation curve of a rectangular tension coupon up to a width
to thickness ratio of 6 was almost identical to that of a circular coupon. For this reason, a
finite element model o f a circular tension coupon is used for the numerical simulation
instead o f a rectangular coupon. Because of symmetry, only one-half o f the coupon has to
be modeled. The axisymmetric finite element model of the coupon used in the simulation
is shown in Figure 4.1. A bi-quadratic reduced integration axisymmetric element
(CAX8R) is used in the modeling. In the simulation, the elastic modulus and Poisson’s
ratio were taken as 200000 MPa and 0.3 respectively. The detailed iterative procedure
used in refining the true stress versus true plastic strain relationship o f the material is
illustrated in Appendix D. The simulated engineering stress versus transverse
deformation curves based on the selected true stress versus hue plastic strain relationship,
as well as the test results, are shown in Figures 4.2 to 4.7. The selected hue stress versus
true plastic strain curves for all test materials are shown in Figures 4.8 to 4.9.
4.2 Determining failure limit of the material
In a tension coupon test, the large localized strain in the necking region caused crack
initiation and fracture. Thus, it seems appropriate to use the plastic strain at fracture as the
failure limit o f the material. Khoo et al. (1997) and Willibald et al. (2004) showed that the
Reproduced with permission of the copyright owner. Further reproduction prohibited without permission.
69
equivalent plastic strain at fracture can be used successfully as the failure limit o f the
material to predict the performance o f slotted circular HSS connections. As defined by
(2.25), the equivalent plastic strain is a measure o f the state o f the plastic deformation of
the material. But it should be noted that equivalent plastic strain at fracture is not a
material constant. Bridgman (1947) has shown that plastic strain at fracture is dependent
of the level o f hydrostatic stress.
The tension coupon test specimen o f the HSS has a width to thickness ratio o f close
to three. Thus during necking, the deformation of the coupon in terms of its ratio relative
to its original dimension is mainly in the direction o f thickness and not the width. This is
similar to the observed failure in the slotted HSS connection specimen where the localized
deformation prior to fracture is in the direction of the wall thickness and not in the
circumferential direction. Therefore, the level of hydrostatic stress that affect the failure
strain limit o f the connection can be assumed to be similar to that for the tension coupn
HSS. For this reason, the measured equivalent plastic strain at fracture from a coupon test
o f HSS is used as the critical equivalent plastic strain limit (e£) that signifies the onset of
local failure in the connection.
In this testing program, the cross-section dimensions of the coupon were measured
regularly during the tension coupon test. If the state of stress is uniaxial, the equivalent
plastic strain can be calculated as
where A0 is the original cross-section area and A is the current average cross-section area.
Although the state o f stress is not uniaxial at the region o f necking, (4.10) or a variation of
Reproduced with permission of the copyright owner. Further reproduction prohibited without permission.
70
it can still be used to estimate of the equivalent plastic strain. Table 4.1 lists averages of
the cross-section area ratios based on last measurement before the coupon fractured.
Three ratios of Ao/Af, A J A f mr, Ao/Afmid and their natural logarithmic values are shown in
Table 4.1. Af, After and Afmid are respectively the average area, the comer area and the
mid-point area calculated according to (4.9) based on the last cross-section measurement.
In a tension coupon test, the last manual measurement of the cross-section dimension was
not at the instance o f fracture. Since the actual cross-section area continues to decrease
after the last measurement until fracture occurred, values reported in Table 4.1 are always
lower and more conservative compared to the actual values at fracture. After necking, the
cross-section deformation o f the coupon mainly occurred by the thickness reduction at the
mid half o f the long side of the coupon, which was also the location o f fracture initiation.
Thus, the deformation that can better characterize strain at fracture was given by the
mid-point cross-section area ratio of Ao/Afmid rather than Ao/Af or Ao/AfCOr. It follows that
the critical equivalent plastic strain limit be taken as
s ? = l n ' A . 'V ^ f i n i d J
(4.11)
Table 4.1 gives the measured critical equivalent plastic strain value ( s£ ) that varies
between 0.8 and 1.0 for all HSS and gusset plates. Taking the medium of this range, a
critical equivalent plastic strain limit ( s£) o f 0.9 was selected to represent all materials in
the numerical simulation. The only exception being the comer o f HSS, which was
assumed to have a different limit. This is discussed in the next section. The effect of
varying the limit between 0.8 to 1.0 in the numerical simulating is discussed in Chapter 5.
Reproduced with permission of the copyright owner. Further reproduction prohibited without permission.
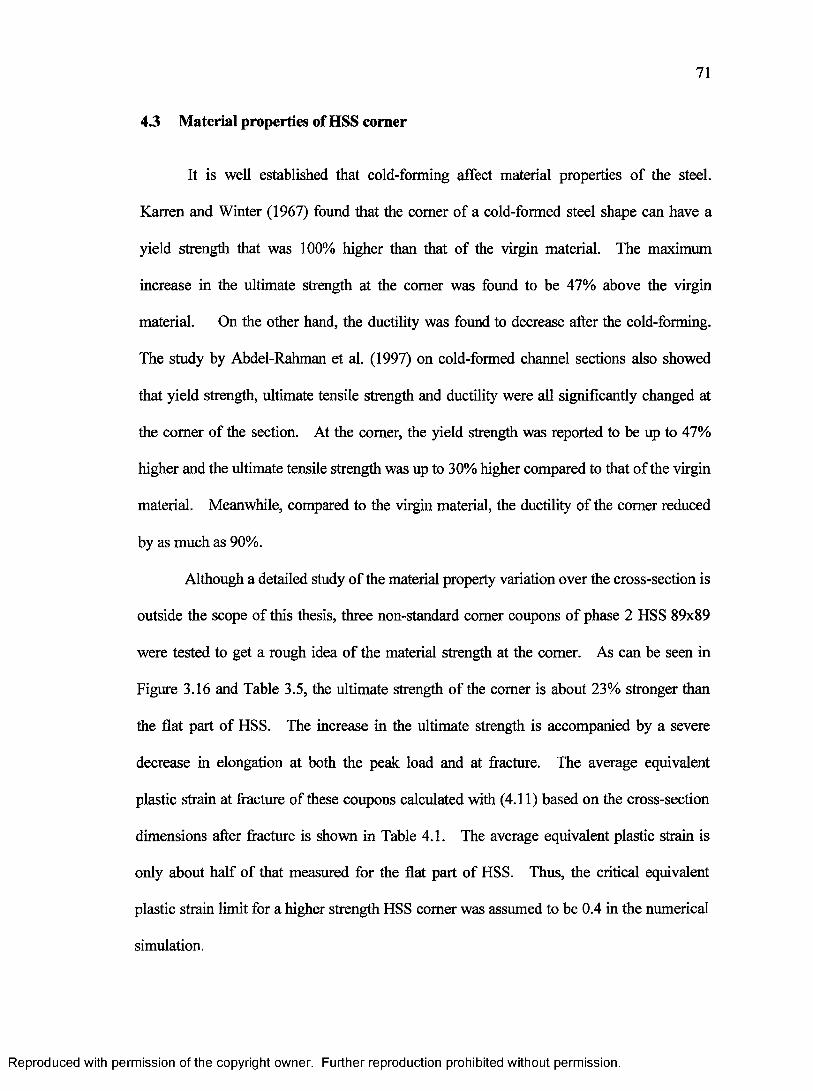
71
4.3 Material properties of HSS corner
It is well established that cold-forming affect material properties o f the steel.
Karren and Winter (1967) found that the comer of a cold-formed steel shape can have a
yield strength that was 100% higher than that of the virgin material. The maximum
increase in the ultimate strength at the comer was found to be 47% above the virgin
material. On the other hand, the ductility was found to decrease after the cold-forming.
The study by Abdel-Rahman et al. (1997) on cold-formed channel sections also showed
that yield strength, ultimate tensile strength and ductility were all significantly changed at
the comer of the section. At the comer, the yield strength was reported to be up to 47%
higher and the ultimate tensile strength was up to 30% higher compared to that o f the virgin
material. Meanwhile, compared to the virgin material, the ductility of the comer reduced
by as much as 90%.
Although a detailed study o f the material property variation over the cross-section is
outside the scope of this thesis, three non-standard comer coupons o f phase 2 HSS 89x89
were tested to get a rough idea o f the material strength at the comer. As can be seen in
Figure 3.16 and Table 3.5, the ultimate strength o f the comer is about 23% stronger than
the flat part o f HSS. The increase in the ultimate strength is accompanied by a severe
decrease in elongation at both the peak load and at fracture. The average equivalent
plastic strain at fracture of these coupons calculated with (4.11) based on the cross-section
dimensions after fracture is shown in Table 4.1. The average equivalent plastic strain is
only about half o f that measured for the flat part o f HSS. Thus, the critical equivalent
plastic strain limit for a higher strength HSS comer was assumed to be 0.4 in the numerical
simulation.
Reproduced with permission of the copyright owner. Further reproduction prohibited without permission.
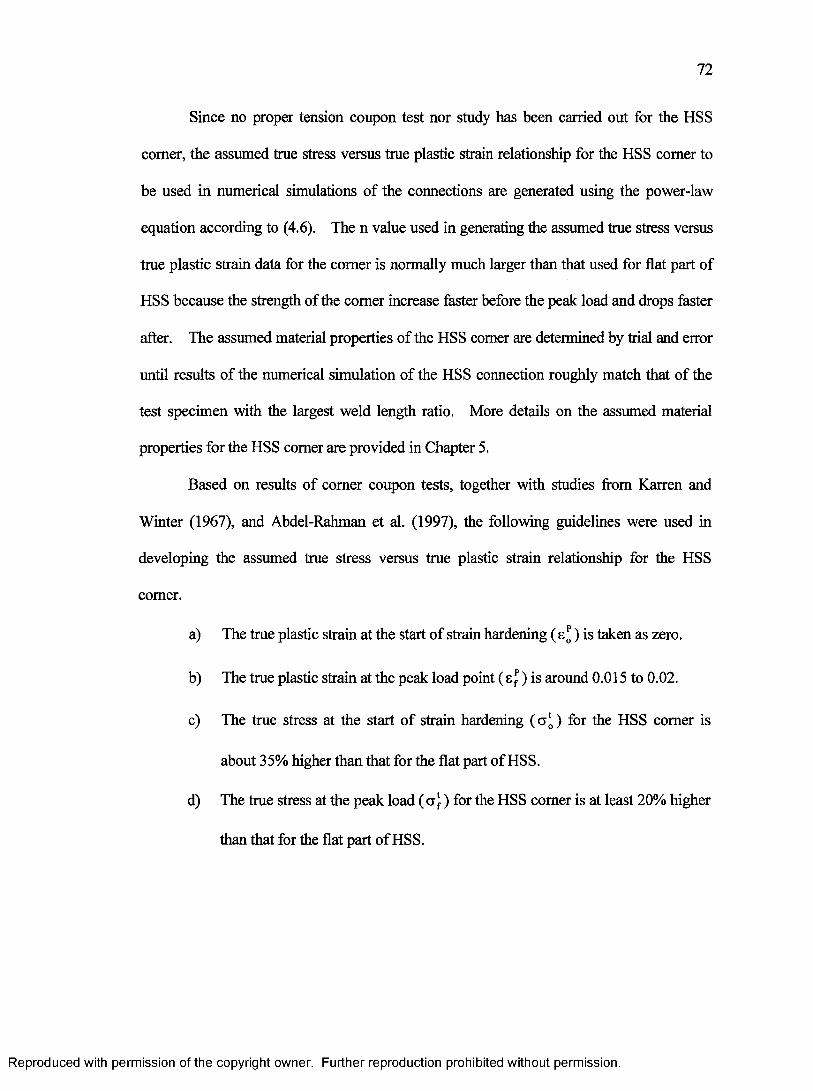
72
Since no proper tension coupon test nor study has been carried out for the HSS
comer, the assumed true stress versus true plastic strain relationship for the HSS comer to
be used in numerical simulations o f the connections are generated using the power-law
equation according to (4.6). The n value used in generating the assumed true stress versus
true plastic strain data for the comer is normally much larger than that used for flat part of
HSS because the strength of the comer increase faster before the peak load and drops faster
after. The assumed material properties of the HSS comer are determined by trial and error
until results of the numerical simulation o f the HSS connection roughly match that of the
test specimen with the largest weld length ratio. More details on the assumed material
properties for the HSS comer are provided in Chapter 5.
Based on results of comer coupon tests, together with studies from Karren and
Winter (1967), and Abdel-Rahman et al. (1997), the following guidelines were used in
developing the assumed hue stress versus true plastic strain relationship for the HSS
comer.
a) The true plastic strain at the start of strain hardening ( ) is taken as zero.
b) The true plastic strain at the peak load point ( s f ) is around 0.015 to 0.02.
c) The hue stress at the start o f strain hardening ( a ^ ) for the HSS comer is
about 35% higher than that for the flat part o f HSS.
d) The true stress at the peak load ( ctJ-) for the HSS comer is at least 20% higher
than that for the flat part o f HSS.
Reproduced with permission of the copyright owner. Further reproduction prohibited without permission.

73
Table 4.1 Cross-section area ratios o f test materials
MaterialCross section area ratio Natural logarithmic values
Ao/Af Ao/AfCor Ao/Afinid ln(A0/Af) ln(Ao/Afmid) ln(Ao/Afcor)
HSS 89 x 89 (phase 1)
2.11 1.94 2.31 0.75 0.66 0.84
HSS 89 x 89 (phase 2)
2.20 1.95 2.53 0.79 0.68 0.93
HSS 127x51 2.29 2.04 2.62 0.83 0.71 0.9612 mm plate (phase 1)
2.14 2.06 2.24 0.76 0.72 0.81
16 mm plate (phase 1)
2.41 2.22 2.62 0.88 0.80 0.96
16 mm plate (phase 2)
2.25 2.08 2.47 0.81 0.73 0.90
20 mm plate (phase 1)
2.14 1.98 2.34 0.76 0.68 0.85
Reproduced with permission of the copyright owner. Further reproduction prohibited without permission.
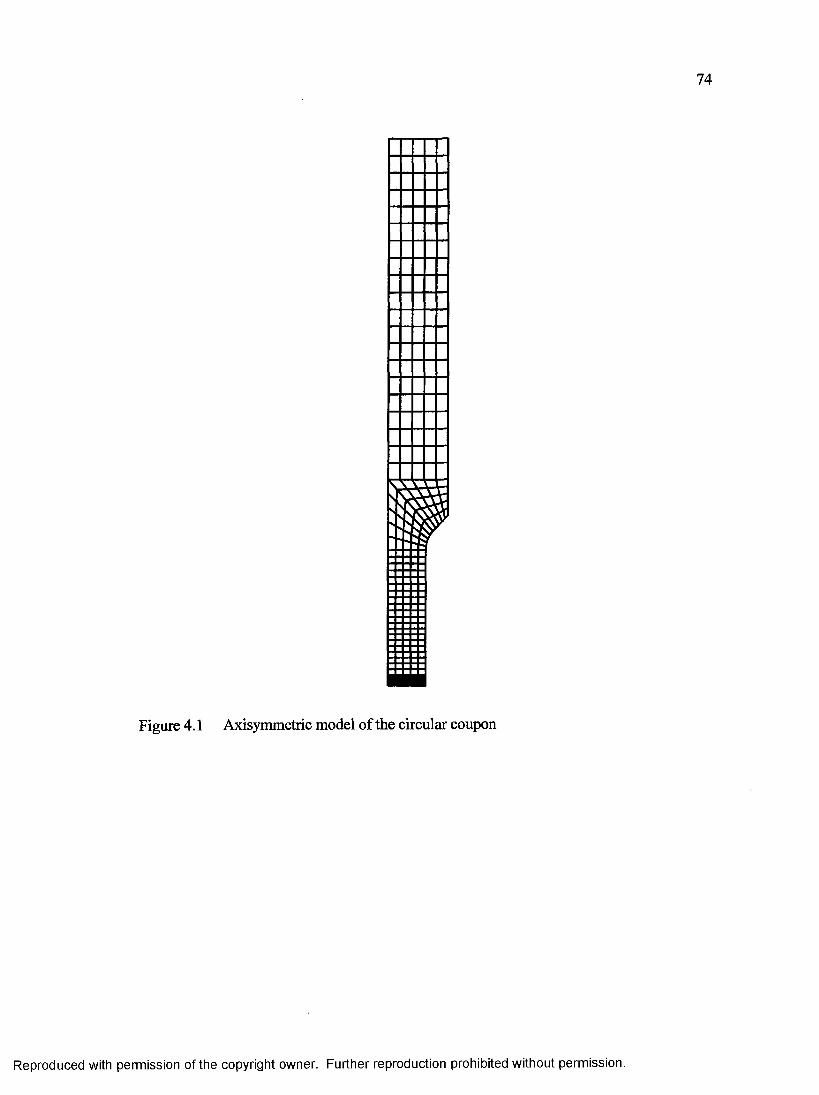
Figure 4.1 Axisymmetric model of the circular coupon
Reproduced with permission of the copyright owner. Further reproduction prohibited without permission.

75
600
500
I 400C/3<u£ 300(50C
g 200• **H
s 'W
100
S-12
S-16
S-20
Simulation
0 0.2 0.3 0.4 0.5 0.60.1Cross-section area change (1-A/Ao)
Figure 4.2 Engineering stress versus change in cross-section area for HSS 89 x 89 (phase 1) tension coupons
P h
'w '(Z)C/3<L>
a<3Ca*w
500
400
300R2
R4
R5
Simulation
200
100
00 0.1 0.2 0.3 0.4 0.5 0.6
Cross-section area change (1-A/Ao)
Figure 4.3 Engineering stress versus change in cross-section area for HSS 127 x 51 tensions coupons
Reproduced with permission of the copyright owner. Further reproduction prohibited without permission.
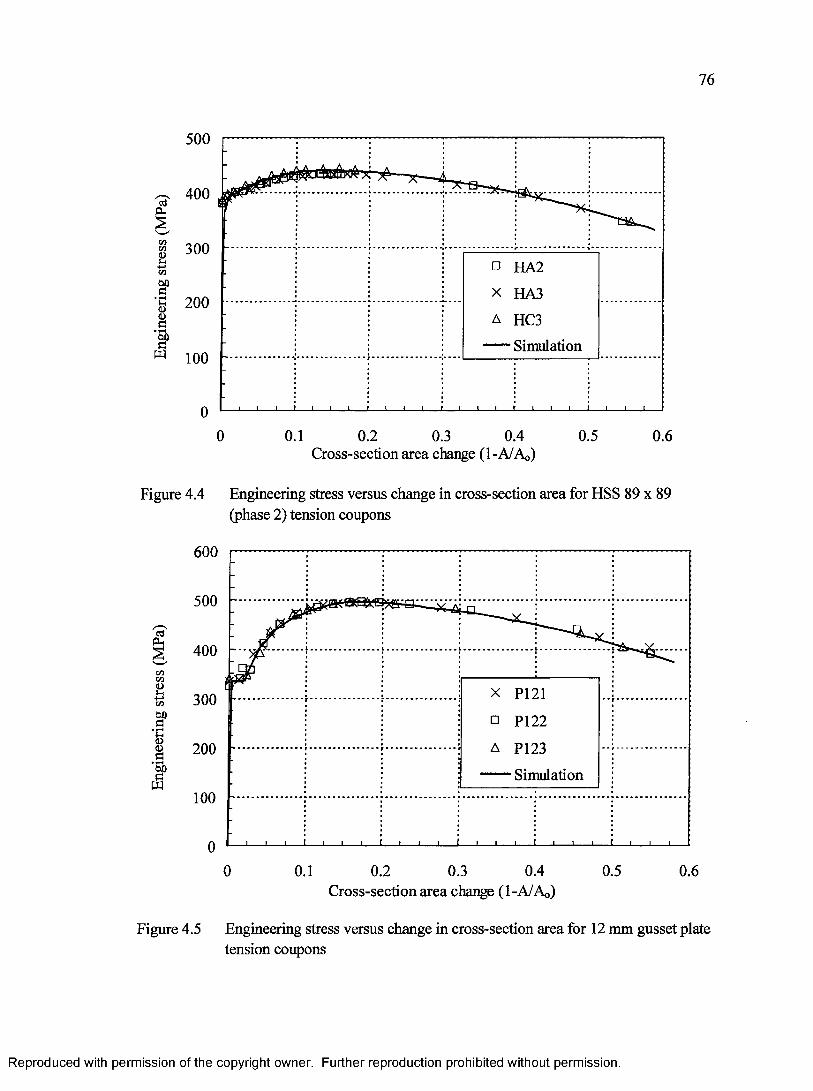
76
500
400
300HA2
HA3
HC3
Simulation
ao| 200 § f?w 100
0.2 0.4 0.5 0.60 0.1 0.3Cross-section area change (1-A/Ao)
Figure 4.4 Engineering stress versus change in cross-section area for HSS 89 x 89 (phase 2) tension coupons
aP h
COCO<D
00-S<L><Da
w
600
500
400
P121300PI 22
P123200
Simulation100
00.40 0.1 0.2 0.5 0.60.3
Cross-section area change (1-A/Ao)
Figure 4.5 Engineering stress versus change in cross-section area for 12 mm gusset plate tension coupons
Reproduced with permission of the copyright owner. Further reproduction prohibited without permission.
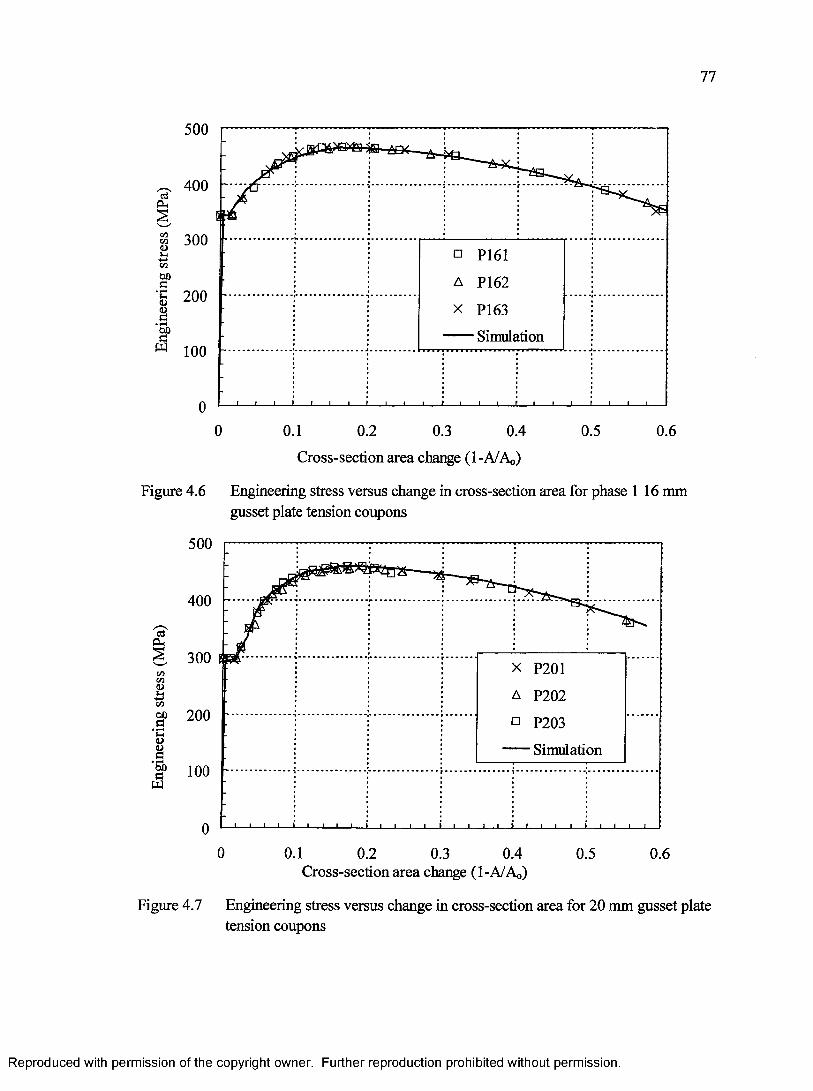
77
500
400C3Pns
300P161
Of)
I 200 §
P162
P163
Simulation100
0 0.1 0.2 0.3 0.4 0.5 0.6
Cross-section area change (1-A/Ao)
Figure 4.6 Engineering stress versus change in cross-section area for phase 116 mm gusset plate tension coupons
500
400
P201
P202200 P203
U<L>Simulation
g> 100 a
0 0.1 0.2 0.3 0.4 0.5 0.6Cross-section area change (1-A/Ao)
Figure 4.7 Engineering stress versus change in cross-section area for 20 mm gusset plate tension coupons
Reproduced with permission of the copyright owner. Further reproduction prohibited without permission.
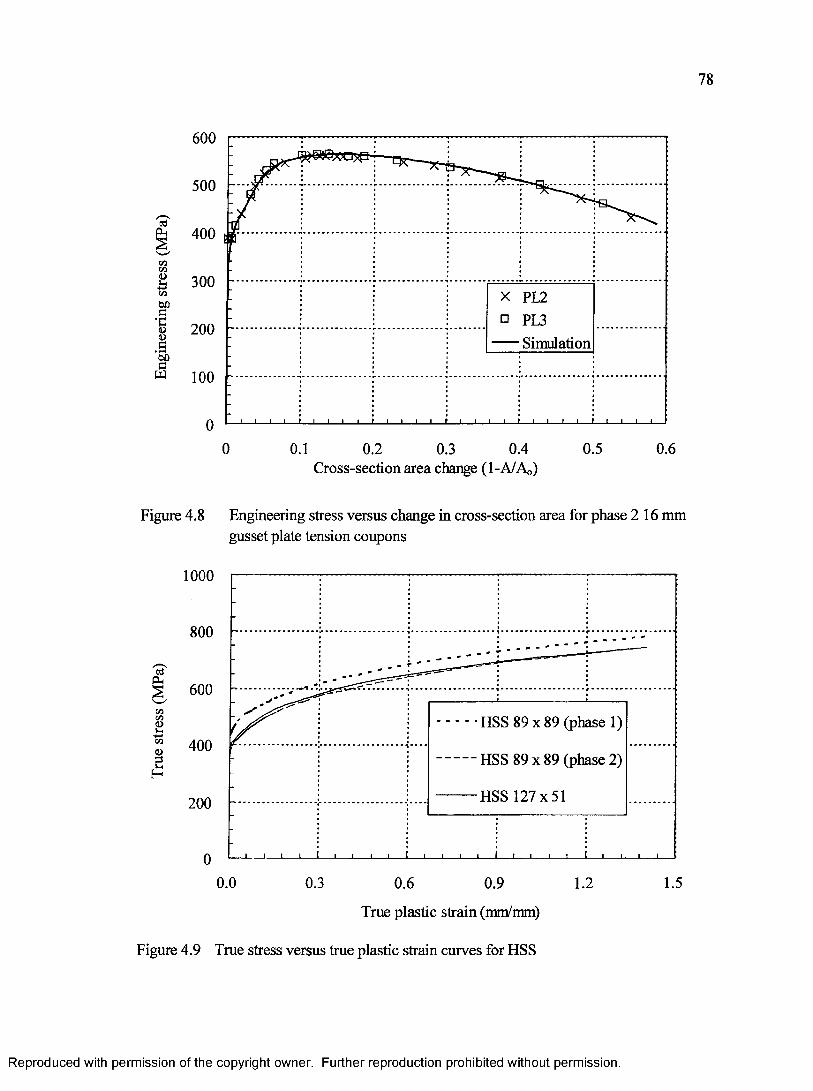
78
600
500
400
B 300</i
is
x PL2
□ PL3— Simulation
200
100
0 0.5 0.60.1 0.2 0.3 0.4Cross-section area change (1-A/Ao)
Figure 4.8 Engineering stress versus change in cross-section area for phase 216 mm gusset plate tension coupons
1000
800
- ■ HSS 89 x 89 (phase 1)
HSS 8 9 x89 (phase 2)
HSS 127x51200
0.0 0.3 0.6 0.9 1.51.2
True plastic strain (mm/mm)
Figure 4.9 True stress versus true plastic strain curves for HSS
Reproduced with permission of the copyright owner. Further reproduction prohibited without permission.
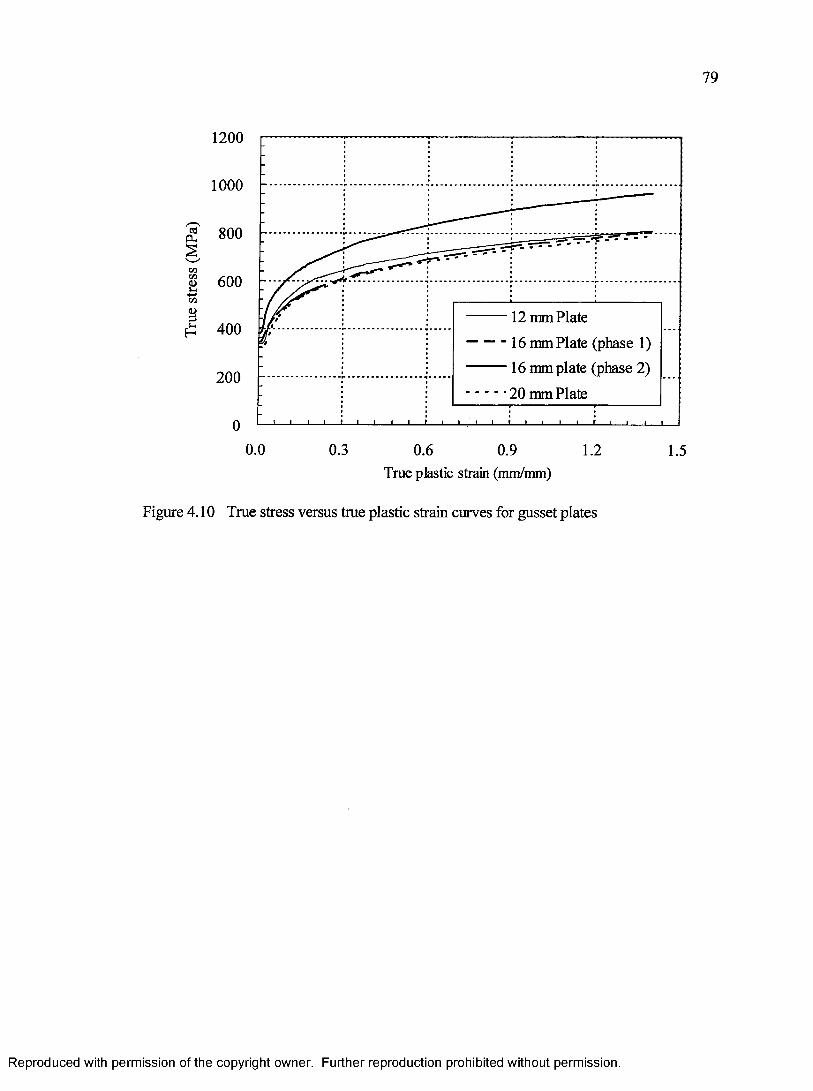
79
1200
1000
800
COCO<DSh 600
-1 2 mm Plate
■ 16 mm Plate (phase 1)
~ 16 mm plate (phase 2)
■ 20 mm Plate
400
200
0.0 0.3 0.6 0.9 1.2 1.5True plastic strain (mm/mm)
Figure 4.10 True stress versus true plastic strain curves for gusset plates
Reproduced with permission of the copyright owner. Further reproduction prohibited without permission.
CHAPTER 5 FINITE ELEMENT MODELING AND VERIFICATION
Finite element models are developed based on geometries of test specimens to carry
out numerical simulations o f the slotted square and rectangular connections. The
developed finite element models are validated against test results o f HSS connections.
Studies on the element type, equivalent plastic strain limit and mesh size are carried out
before validating the finite element models. The purpose o f these studies is to develop
reliable finite element models that can simulate the strength and behavior o f square and
rectangular HSS connections. In Chapter 6, a parametric study for HSS connections is
conducted using the validated finite element models
5.1 Finite Element Model
The numerical study is carried out with the finite element program
ABAQUS (2003). A geometrical and material non-linear analysis is performed in this
study. The model for the HSS connection is constructed with both the four-node, bi-linear
shell element (S4) and the eight-node tri-linear solid element (C3D8). Only one eighth of
the specimen is modeled due to symmetry. The fillet weld between the hollow section
wall and the gusset plate is not explicitly modeled. Instead, the weld is modeled by
constraining displacements and rotations o f the node on the HSS wall to the corresponding
node on the gusset plate. In the finite element analysis, it is assumed that no failure
occurred in the fillet weld. This implies that the weld capacity will not govern the
strength of the connection. With this assumption, the shear deformation of the fillet weld
in the longitudinal direction will be quite small compared to the overall deformation.
80
Reproduced with permission of the copyright owner. Further reproduction prohibited without permission.
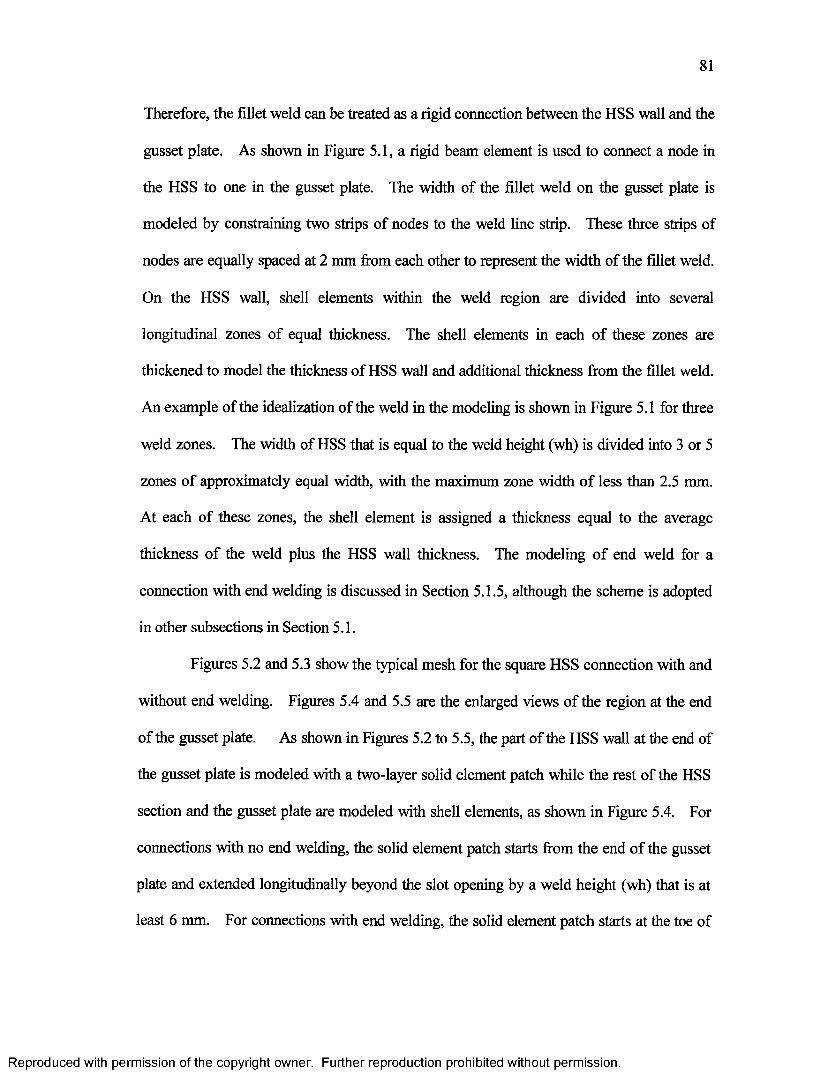
81
Therefore, the fillet weld can be treated as a rigid connection between the HSS wall and the
gusset plate. As shown in Figure 5.1, a rigid beam element is used to connect a node in
the HSS to one in the gusset plate. The width of the fillet weld on the gusset plate is
modeled by constraining two strips of nodes to the weld line strip. These three strips of
nodes are equally spaced at 2 mm from each other to represent the width of the fillet weld.
On the HSS wall, shell elements within the weld region are divided into several
longitudinal zones o f equal thickness. The shell elements in each of these zones are
thickened to model the thickness o f HSS wall and additional thickness from the fillet weld.
An example o f the idealization o f the weld in the modeling is shown in Figure 5.1 for three
weld zones. The width of HSS that is equal to the weld height (wh) is divided into 3 or 5
zones o f approximately equal width, with the maximum zone width o f less than 2.5 mm.
At each of these zones, the shell element is assigned a thickness equal to the average
thickness o f the weld plus the HSS wall thickness. The modeling o f end weld for a
connection with end welding is discussed in Section 5.1.5, although the scheme is adopted
in other subsections in Section 5.1.
Figures 5.2 and 5.3 show the typical mesh for the square HSS connection with and
without end welding. Figures 5.4 and 5.5 are the enlarged views of the region at the end
o f the gusset plate. As shown in Figures 5.2 to 5.5, the part o f the HSS wall at the end of
the gusset plate is modeled with a two-layer solid element patch while the rest o f the HSS
section and the gusset plate are modeled with shell elements, as shown in Figure 5.4. For
connections with no end welding, the solid element patch starts from the end o f the gusset
plate and extended longitudinally beyond the slot opening by a weld height (wh) that is at
least 6 mm. For connections with end welding, the solid element patch starts at the toe of
Reproduced with permission of the copyright owner. Further reproduction prohibited without permission.
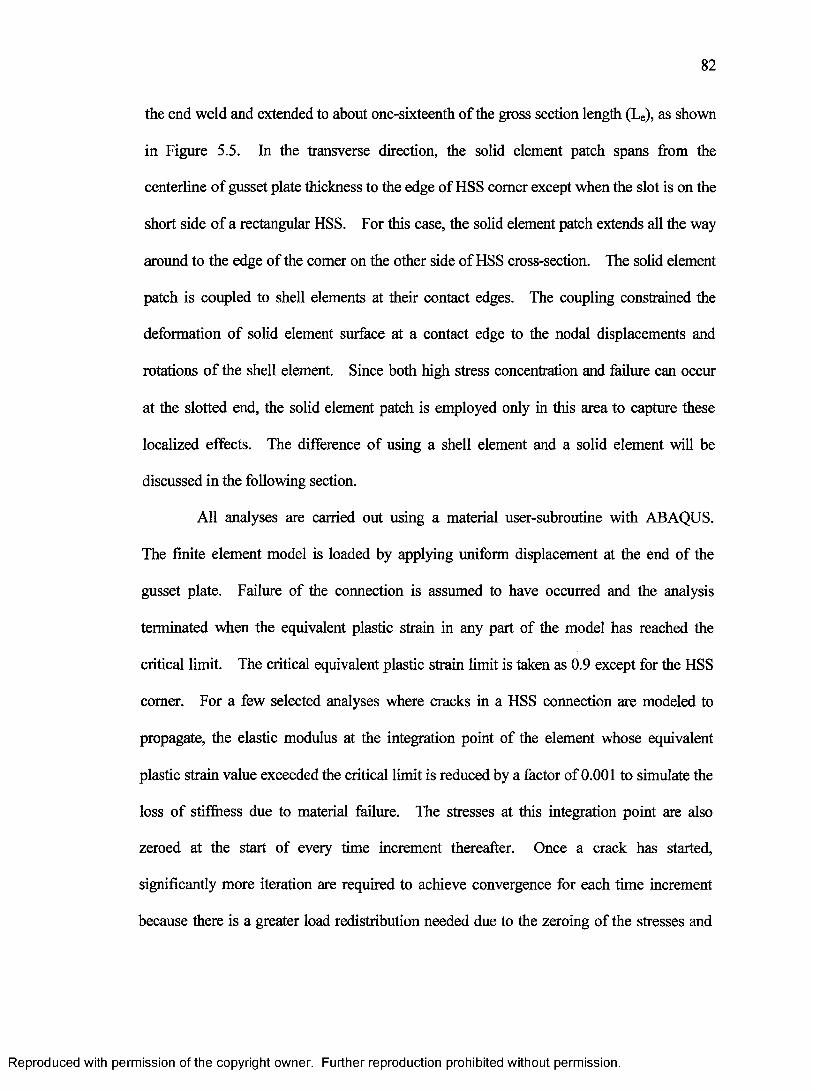
82
the end weld and extended to about one-sixteenth o f the gross section length (Le), as shown
in Figure 5.5. In the transverse direction, the solid element patch spans from the
centerline o f gusset plate thickness to the edge o f HSS comer except when the slot is on the
short side o f a rectangular HSS. For this case, the solid element patch extends all the way
around to the edge of the comer on the other side of HSS cross-section. The solid element
patch is coupled to shell elements at their contact edges. The coupling constrained the
deformation o f solid element surface at a contact edge to the nodal displacements and
rotations o f the shell element. Since both high stress concentration and failure can occur
at the slotted end, the solid element patch is employed only in this area to capture these
localized effects. The difference o f using a shell element and a solid element will be
discussed in the following section.
All analyses are carried out using a material user-subroutine with ABAQUS.
The finite element model is loaded by applying uniform displacement at the end of the
gusset plate. Failure of the connection is assumed to have occurred and the analysis
terminated when the equivalent plastic strain in any part o f the model has reached the
critical limit. The critical equivalent plastic strain limit is taken as 0.9 except for the HSS
comer. For a few selected analyses where cracks in a HSS connection are modeled to
propagate, the elastic modulus at the integration point of the element whose equivalent
plastic strain value exceeded the critical limit is reduced by a factor of 0.001 to simulate the
loss o f stiffness due to material failure. The stresses at this integration point are also
zeroed at the start of every time increment thereafter. Once a crack has started,
significantly more iteration are required to achieve convergence for each time increment
because there is a greater load redistribution needed due to the zeroing o f the stresses and
Reproduced with permission of the copyright owner. Further reproduction prohibited without permission.
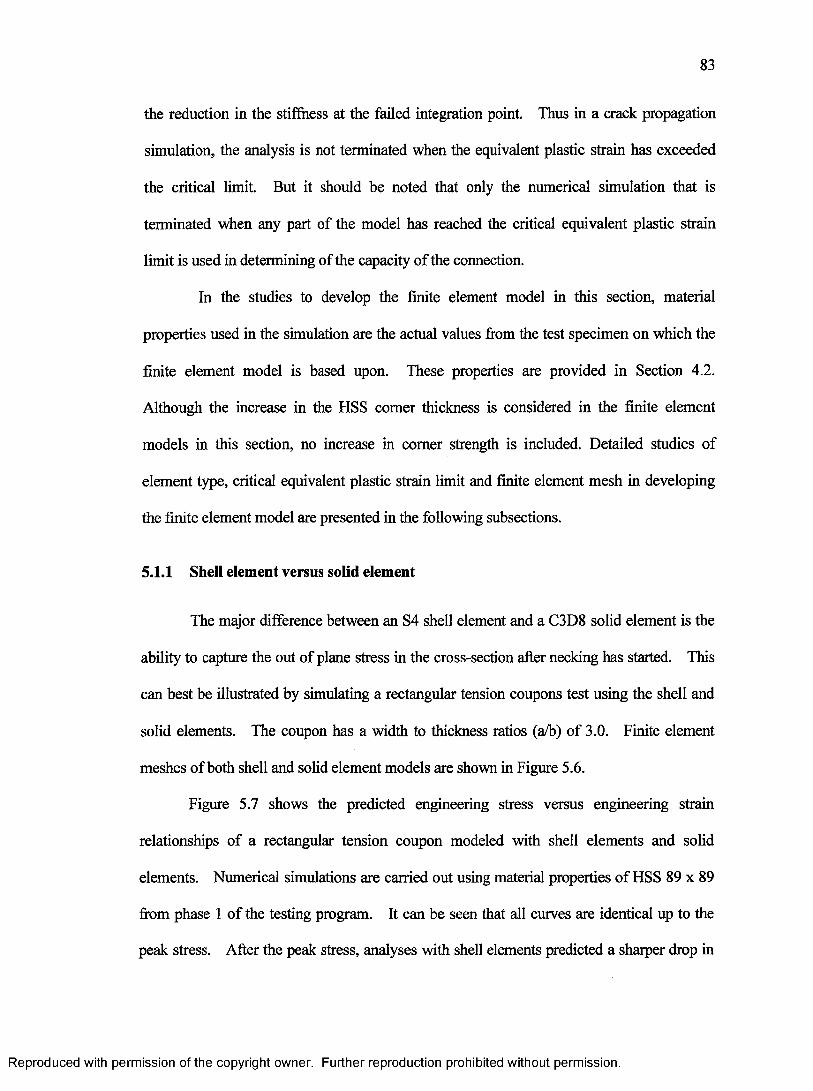
83
the reduction in the stiffness at the failed integration point. Thus in a crack propagation
simulation, the analysis is not terminated when the equivalent plastic strain has exceeded
the critical limit. But it should be noted that only the numerical simulation that is
terminated when any part of the model has reached the critical equivalent plastic strain
limit is used in determining of the capacity o f the connection.
In the studies to develop the finite element model in this section, material
properties used in the simulation are the actual values from the test specimen on which the
finite element model is based upon. These properties are provided in Section 4.2.
Although the increase in the HSS comer thickness is considered in the finite element
models in this section, no increase in comer strength is included. Detailed studies of
element type, critical equivalent plastic strain limit and finite element mesh in developing
the finite element model are presented in the following subsections.
5.1.1 Shell element versus solid element
The major difference between an S4 shell element and a C3D8 solid element is the
ability to capture the out of plane stress in the cross-section after necking has started. This
can best be illustrated by simulating a rectangular tension coupons test using the shell and
solid elements. The coupon has a width to thickness ratios (a/b) of 3.0. Finite element
meshes of both shell and solid element models are shown in Figure 5.6.
Figure 5.7 shows the predicted engineering stress versus engineering strain
relationships o f a rectangular tension coupon modeled with shell elements and solid
elements. Numerical simulations are carried out using material properties o f HSS 89 x 89
from phase 1 o f the testing program. It can be seen that all curves are identical up to the
peak stress. After the peak stress, analyses with shell elements predicted a sharper drop in
Reproduced with permission of the copyright owner. Further reproduction prohibited without permission.

84
the load than that with solid elements. The sharper drop of load carrying capacity with
respect to axial deformation is due to the inability o f the shell element to capture the out o f
plane stress associated with necking.
After the peak load, the state of stress in the cross-section o f a coupon at the region
o f necking transforms from uniaxial to multiaxial. Consequently, an out o f plane tensile
stress is generated due to the necking geometry. This out o f plane tensile stress stiffens
the cross-section. As a result, the cross-section thickness reduction is slowed down with
respect to the axial deformation. However, a shell element with no out o f plane stress
cannot model this stiffening effect. Therefore, a shell element is not suitable to be used in
a region where significantly localized through thickness necking is expected, but can be
used in other regions of the connection.
5.1.2 Element type comparison on the slotted HSS connection model
Comparison o f the ultimate strength o f the analyses with models based on the
geometry o f square HSS specimens with no end welding, SM5G05P20 and SM3G05P20,
using the solid element patch and entirely shell element are shown in Table 5.1. It should
be noted that in these simulations, no critical equivalent plastic strain limit is used.
SM5G05P20 and SM3G05P20 have weld length ratios o f 1.33 and 0.79 respectively. The
mesh used in the analysis is based on the mesh configuration selected in Section 5.1.3.
The load versus displacement curves from both the solid element patch and the full shell
element models are shown in Figure 5.8. The mesh designs are identical for both model
types in terms o f the element size.
It can be seen in Figure 5.8 and Table 5.1 that the solid element patch and the full
shell element models predicted the same maximum load when the weld length ratio (L/w)
Reproduced with permission of the copyright owner. Further reproduction prohibited without permission.
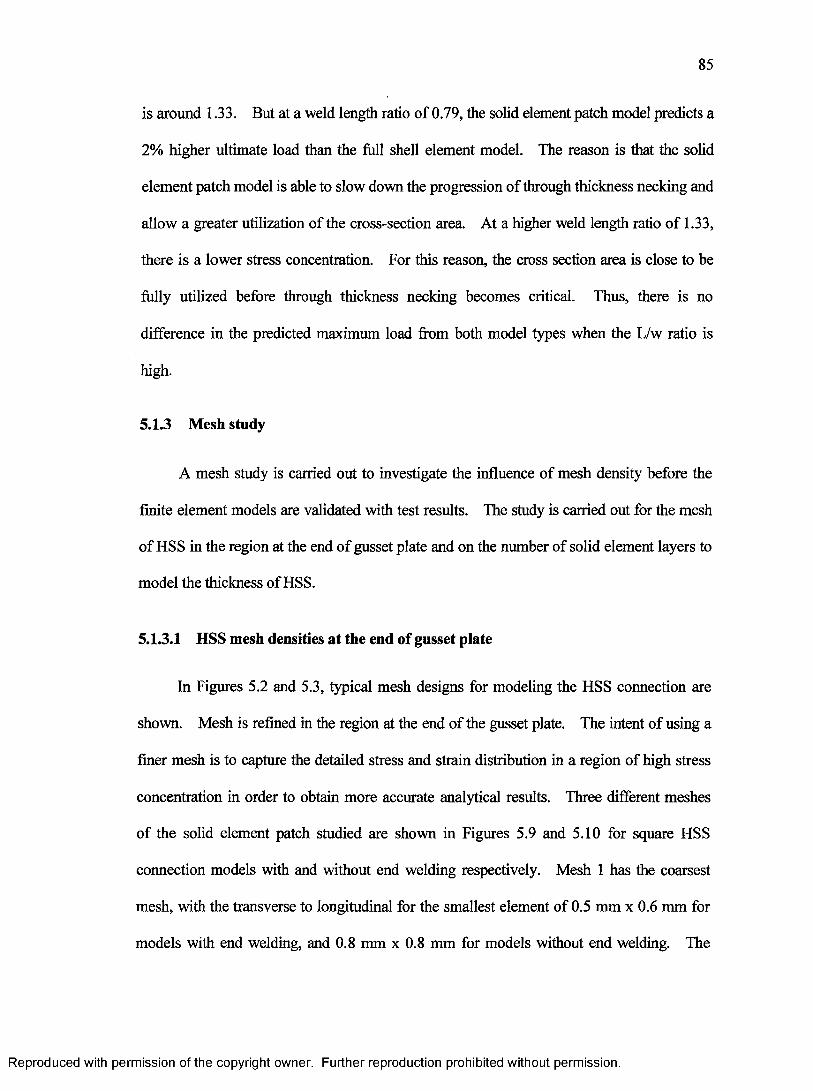
85
is around 1.33. But at a weld length ratio o f 0.79, the solid element patch model predicts a
2% higher ultimate load than the full shell element model. The reason is that the solid
element patch model is able to slow down the progression of through thickness necking and
allow a greater utilization of the cross-section area. At a higher weld length ratio o f 1.33,
there is a lower stress concentration. For this reason, the cross section area is close to be
fully utilized before through thickness necking becomes critical. Thus, there is no
difference in the predicted maximum load from both model types when the L/w ratio is
high.
5.1.3 Mesh study
A mesh study is carried out to investigate the influence o f mesh density before the
finite element models are validated with test results. The study is carried out for the mesh
of HSS in the region at the end o f gusset plate and on the number of solid element layers to
model the thickness of HSS.
5.1.3.1 HSS mesh densities at the end of gusset plate
In Figures 5.2 and 5.3, typical mesh designs for modeling the HSS connection are
shown. Mesh is refined in the region at the end of the gusset plate. The intent o f using a
finer mesh is to capture the detailed stress and strain distribution in a region of high stress
concentration in order to obtain more accurate analytical results. Three different meshes
of the solid element patch studied are shown in Figures 5.9 and 5.10 for square HSS
connection models with and without end welding respectively. Mesh 1 has the coarsest
mesh, with the transverse to longitudinal for the smallest element o f 0.5 mm x 0.6 mm for
models with end welding, and 0.8 mm x 0.8 mm for models without end welding. The
Reproduced with permission of the copyright owner. Further reproduction prohibited without permission.
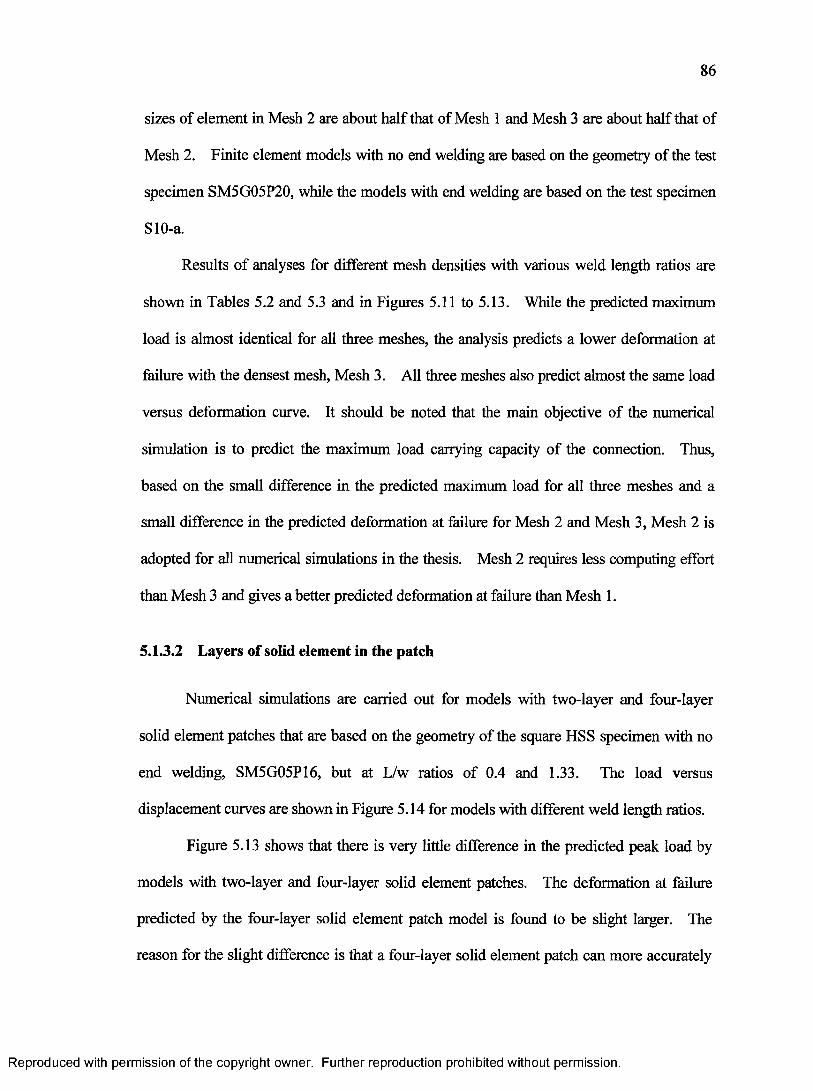
86
sizes of element in Mesh 2 are about half that of Mesh 1 and Mesh 3 are about half that of
Mesh 2. Finite element models with no end welding are based on the geometry of the test
specimen SM5G05P20, while the models with end welding are based on the test specimen
SlO-a.
Results o f analyses for different mesh densities with various weld length ratios are
shown in Tables 5.2 and 5.3 and in Figures 5.11 to 5.13. While the predicted maximum
load is almost identical for all three meshes, the analysis predicts a lower deformation at
failure with the densest mesh, Mesh 3. All three meshes also predict almost the same load
versus deformation curve. It should be noted that the main objective of the numerical
simulation is to predict the maximum load carrying capacity of the connection. Thus,
based on the small difference in the predicted maximum load for all three meshes and a
small difference in the predicted deformation at failure for Mesh 2 and Mesh 3, Mesh 2 is
adopted for all numerical simulations in the thesis. Mesh 2 requires less computing effort
than Mesh 3 and gives a better predicted deformation at failure than Mesh 1.
5.1.3.2 Layers of solid element in the patch
Numerical simulations are carried out for models with two-layer and four-layer
solid element patches that are based on the geometry o f the square HSS specimen with no
end welding, SM5G05P16, but at L/w ratios of 0.4 and 1.33. The load versus
displacement curves are shown in Figure 5.14 for models with different weld length ratios.
Figure 5.13 shows that there is very little difference in the predicted peak load by
models with two-layer and four-layer solid element patches. The deformation at failure
predicted by the four-layer solid element patch model is found to be slight larger. The
reason for the slight difference is that a four-layer solid element patch can more accurately
Reproduced with permission of the copyright owner. Further reproduction prohibited without permission.
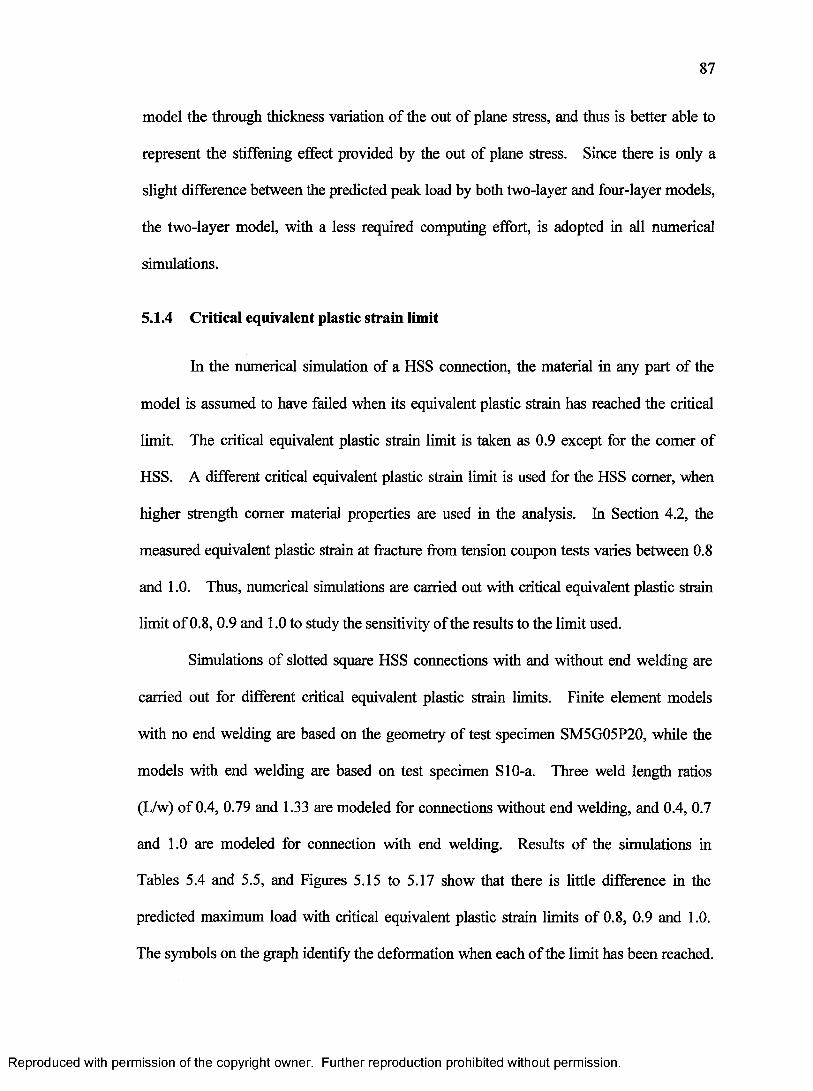
87
model the through thickness variation o f the out o f plane stress, and thus is better able to
represent the stiffening effect provided by the out of plane stress. Since there is only a
slight difference between the predicted peak load by both two-layer and four-layer models,
the two-layer model, with a less required computing effort, is adopted in all numerical
simulations.
5.1.4 Critical equivalent plastic strain limit
In the numerical simulation of a HSS connection, the material in any part of the
model is assumed to have failed when its equivalent plastic strain has reached the critical
limit. The critical equivalent plastic strain limit is taken as 0.9 except for the comer of
HSS. A different critical equivalent plastic strain limit is used for the HSS comer, when
higher strength comer material properties are used in the analysis. In Section 4.2, the
measured equivalent plastic strain at fracture from tension coupon tests varies between 0.8
and 1.0. Thus, numerical simulations are carried out with critical equivalent plastic strain
limit o f 0.8,0.9 and 1.0 to study the sensitivity o f the results to the limit used.
Simulations of slotted square HSS connections with and without end welding are
carried out for different critical equivalent plastic strain limits. Finite element models
with no end welding are based on the geometry of test specimen SM5G05P20, while the
models with end welding are based on test specimen SlO-a. Three weld length ratios
(L/w) o f 0.4, 0.79 and 1.33 are modeled for connections without end welding, and 0.4, 0.7
and 1.0 are modeled for connection with end welding. Results o f the simulations in
Tables 5.4 and 5.5, and Figures 5.15 to 5.17 show that there is little difference in the
predicted maximum load with critical equivalent plastic strain limits o f 0.8, 0.9 and 1.0.
The symbols on the graph identify the deformation when each o f the limit has been reached.
Reproduced with permission of the copyright owner. Further reproduction prohibited without permission.

88
Most specimens attain their maximum loads before the large local strain at the end of
gusset plate reaches the critical equivalent plastic strain limit. Since anyone o f these
limits can be used without significantly affecting the predicted maximum load, the average
measured limit of 0.9 is thus used for all numerical simulations.
5.1.5 Modeling end weld
For a slotted HSS connection with end welding, the weld height reduces gradually
away from the end of the gusset plate. Figure 5.18 shows two schemes of modeling for
the end weld. The thinner line represents the change in weld thickness in the modeling
for different weld zones as described in Section 5.1. Scheme B is a more accurate
representation of the end weld compared to Scheme A. In Scheme A, the longitudinal
weld is modeled to extend all the way to the end. Numerical simulation of the slotted
square HSS connections based on the geometry o f the test specimen SlO-a for L/w ratio
o f 0.4 and 1.0 are carried out for both schemes. Figure 5.19 shows that there is hardly
any difference between results for both schemes. Thus for ease o f modeling, Scheme A
is adopted for all numerical simulations in this study.
5.2 Validation of the models
In order to validate the developed finite element models, numerical simulations are
carried out on the actual test specimens. Specimens from both Korol (1996) and the
current testing program are modeled. Two sets o f numerical simulations are carried out.
One set using material properties o f the flat part of HSS applied entirely over the whole
HSS cross-section and another set assuming the comer of HSS has a higher strength. The
simulation is terminated and the connection is assumed to have failed when the critical
Reproduced with permission of the copyright owner. Further reproduction prohibited without permission.
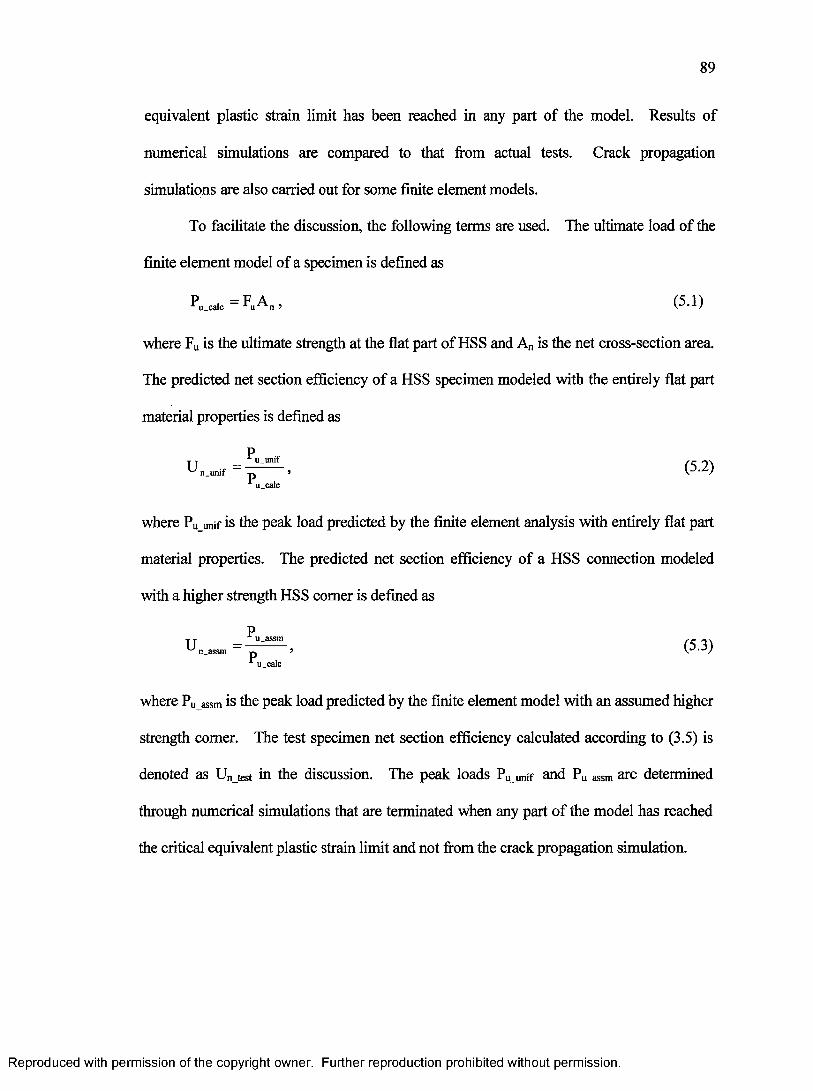
89
equivalent plastic strain limit has been reached in any part o f the model. Results of
numerical simulations are compared to that from actual tests. Crack propagation
simulations are also carried out for some finite element models.
To facilitate the discussion, the following terms are used. The ultimate load o f the
finite element model of a specimen is defined as
Pu.calc=FuAn, (5.1)
where Fu is the ultimate strength at the flat part o f HSS and An is the net cross-section area.
The predicted net section efficiency o f a HSS specimen modeled with the entirely flat part
material properties is defined as
(5-2)u_calc
where Pu_unif is the peak load predicted by the finite element analysis with entirely flat part
material properties. The predicted net section efficiency o f a HSS connection modeled
with a higher strength HSS comer is defined as
P U_assm n_assm p *
u.calc
where Pu assm is the peak load predicted by the finite element model with an assumed higher
strength comer. The test specimen net section efficiency calculated according to (3.5) is
denoted as Un test in the discussion. The peak loads Pu Umf and Pu assm are determined
through numerical simulations that are terminated when any part o f the model has reached
the critical equivalent plastic strain limit and not from the crack propagation simulation.
Reproduced with permission of the copyright owner. Further reproduction prohibited without permission.
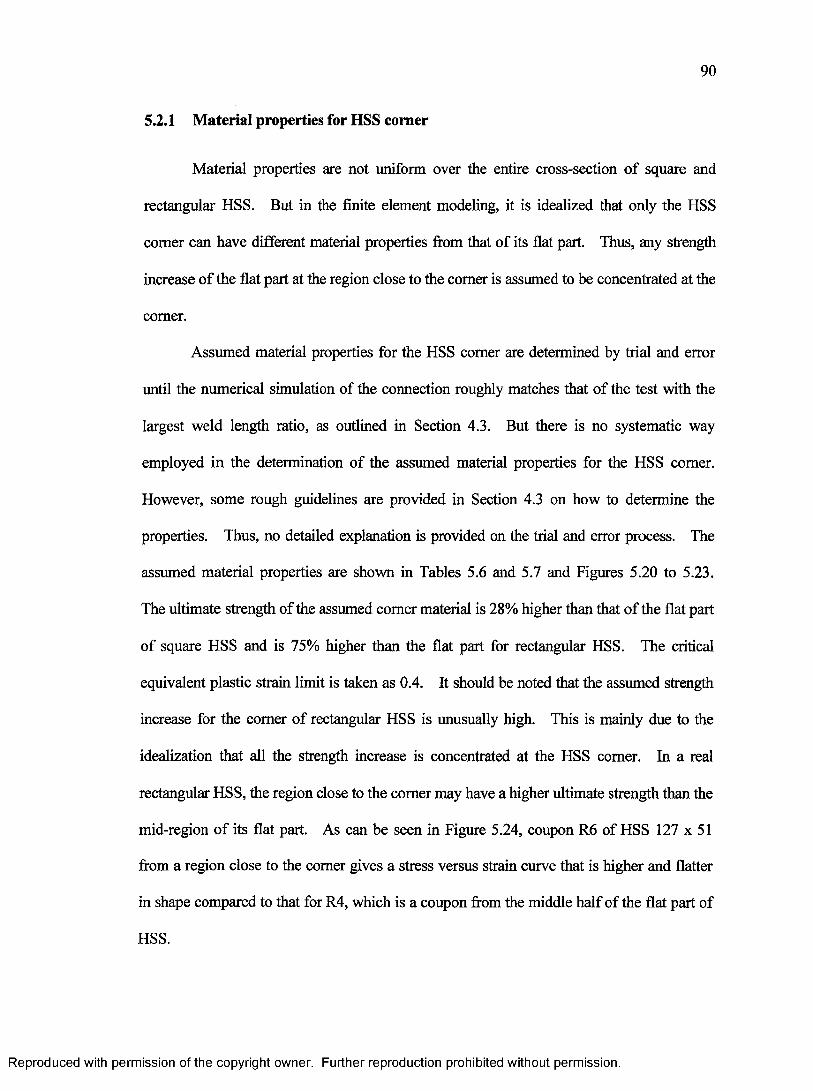
90
5.2.1 Material properties for HSS corner
Material properties are not uniform over the entire cross-section o f square and
rectangular HSS. But in the finite element modeling, it is idealized that only the HSS
comer can have different material properties from that o f its flat part. Thus, any strength
increase o f the flat part at the region close to the comer is assumed to be concentrated at the
comer.
Assumed material properties for the HSS comer are determined by trial and error
until the numerical simulation o f the connection roughly matches that o f the test with the
largest weld length ratio, as outlined in Section 4.3. But there is no systematic way
employed in the determination o f the assumed material properties for the HSS comer.
However, some rough guidelines are provided in Section 4.3 on how to determine the
properties. Thus, no detailed explanation is provided on the trial and error process. The
assumed material properties are shown in Tables 5.6 and 5.7 and Figures 5.20 to 5.23.
The ultimate strength of the assumed comer material is 28% higher than that o f the flat part
o f square HSS and is 75% higher than the flat part for rectangular HSS. The critical
equivalent plastic strain limit is taken as 0.4. It should be noted that the assumed strength
increase for the comer o f rectangular HSS is unusually high. This is mainly due to the
idealization that all the strength increase is concentrated at the HSS comer. In a real
rectangular HSS, the region close to the comer may have a higher ultimate strength than the
mid-region of its flat part. As can be seen in Figure 5.24, coupon R6 of HSS 127 x 51
from a region close to the comer gives a stress versus strain curve that is higher and flatter
in shape compared to that for R4, which is a coupon from the middle half of the flat part of
HSS.
Reproduced with permission of the copyright owner. Further reproduction prohibited without permission.
91
5.2.2 Crack propagation analyses
A limited number of numerical simulations that consider crack propagation are
carried out to predict the descending branch of the load versus deformation curve. In
crack propagation analyses, material failure is assumed to have occurred when the critical
equivalent plastic strain limit has been reached at an integration point. But instead of
terminating the simulation, the elastic modulus is artificially reduced by a factor o f 0.001 to
simulate crack and material failure at that integration point. This analysis is carried out
using a material user-subroutine with ABAQUS.
Due to the symmetry in the finite element modeling, the deformation in the
simulation is half o f that of the actual specimen. However, strain localization, and crack
initiation and propagation normally occur at only one end. Thus when comparing to the
experimental load versus deformation curves, the predicted LVDT displacement is doubled
up to the point o f peak load, but no doubling thereafter since the deformation occurs only at
one end of the specimen.
5.2.3 HSS connections with no end welding - phase 1 testing program
Finite element models o f slotted square and rectangular HSS connections with no
end welding are validated with phase 1 test results. Comparisons are made in terms of the
net section efficiency and load versus deformation curve. The load versus deformation
curve is obtained only from the simulation that incorporates material properties o f an
assumed higher strength HSS comer.
On the rectangular HSS specimens slotted on the short side, the fillet weld on the
test specimen was found to have extended into the comer of HSS. In a HSS, cold-forming
Reproduced with permission of the copyright owner. Further reproduction prohibited without permission.
92
increases its ultimate strength at the comer. But this increase in strength will be lost if the
steel is reheated. Welding involves fusion o f metal at high temperature. Thus, welding
into the comer of HSS has a similar effect as reheating and normalizing the steel. For this
reason, when the higher comer strength is incorporated in the simulation, the region of HSS
comer where the fillet weld has extended into is modeled with material properties of the
flat part o f HSS rather than the higher strength material properties o f the comer.
5.2.3.1 Net section efficiency
Numerical simulations are carried out with both the HSS having an entirely flat part
material properties and the HSS comer having the assumed higher strength material
properties, as described in Section 5.2.1. Comparisons of test and simulated results are
shown in Table 5.8 for simulations with the entirely flat part material properties and Table
5.9 for simulations with the higher strength HSS comer.
As shown in Table 5.8, the simulation with the entirely flat part material properties
predicts a lower net section efficiency than the test. The lower predicted efficiency is the
result o f neglecting the higher comer material strength in the finite element model. For
the square HSS specimens, denoted with prefix SM, the discrepancy between the test and
predicted efficiency is 5% to 6% for specimens with weld length ratios (L/w) larger than
1.0, and 2 % to 3% for weld length ratios (L/w) around 0.79. For rectangular specimens,
denoted with prefix RS and RL, the discrepancy between the test and predicted efficiency
is more than 10% for specimens with weld length ratios (L/w) larger than 1.0, and 5% to
9% for the specimens with L/w ratios around 0.79. The larger discrepancy noticed for the
rectangular specimen implies that the increase in the ultimate strength o f the HSS comer
over its flat part is much higher for the rectangular HSS than the square HSS.
Reproduced with permission of the copyright owner. Further reproduction prohibited without permission.
93
Simulation results for HSS connections with an assumed higher strength comer
material are compared to test efficiencies in Table 5.9. For most cases, the difference
between the test and predicted net section efficiency is within 2%. Only for
SM3G50P16R, does the difference exceed 2%. It should be pointed out that specimen
RS4G05P16 is modeled with a weld height o f 11 mm according to the actual measurement.
For other rectangular HSS specimens slotted on the short side, the weld heights were found
to be around 9 mm. Since the overall simulation results are in good agreement with the
test, the assumed material properties for the HSS comer and the idealization that the
strength increase is concentrated only at the comer, can be considered as a reasonable
representation o f the HSS in the numerical simulation.
5.2.3.2 Load versus displacement curve
The test and predicted load versus LVDT displacement curves for some specimens
are shown in Figures 5.25 to 5.28. On the same figure, the point where the critical
equivalent plastic strain limit has first been reached is also identified. The load versus
LVDT displacement curve is obtained through the numerical simulation that considers
crack propagation.
For all specimens, the initial predicted load versus LVDT displacement curve has
a steeper slope than that from the test. The reason for this discrepancy is mainly due to
the residual stress in the HSS from the manufacturing process. The residual stress
manifests itself in the shape o f every metal strip that is cut from the HSS to form the
tension coupon. Each strip cut from the HSS curled in both directions along the width and
length o f the strip. However, the residual stress is neglected in the finite element model.
Due to the residual stress, yielding o f the cross-section occurred earlier in the test. For
Reproduced with permission of the copyright owner. Further reproduction prohibited without permission.

94
this reason, the measured load versus displacement curve of the test deviates from the
straight line at a lower displacement than in a simulation.
Other than at the initial displacement, there is a good agreement between the test
and predicted load versus displacement curves up to the peak load. In general, the
numerical simulation is able to give a reasonably close prediction o f the displacement at
peak load. The crack propagation analysis can also capture the general shape o f the
descending branch o f the load versus displacement curve except for a rectangular specimen
slotted at the short side, as shown in Figure 5.28.
In the test, the load dropped smoothly with the displacement. But in the
simulation, the load drops in steps. This is due to the procedure adopted in modeling
crack propagation. Failure o f the material is checked and the contribution of that
integration point is eliminated only at the beginning of each time increment. Thus during
a time increment, many elements may have failed but these elements are only eliminated at
the next time increment. This causes a large load drop in the next time increment that
shows up as steps in the load versus displacement curve.
Figure 5.28 for rectangular HSS slotted at the short side shows that predicted load
drop is much steeper than that for the test. One reason is that the comer o f HSS is very
close to the slot opening and the area o f stress concentration. Once crack has been
initiated at the slot opening, it propagates immediately into the comer. In the modeling,
all the strength increase is assumed to be concentrated at the HSS comer. As a result, the
assumed material for the HSS comer is stronger than what it actually is. Thus, when a
crack propagates into the comer, the strength drop of the specimen is also steeper. This
may partly explain why the simulation predicts a steeper load drop when compared to the
Reproduced with permission of the copyright owner. Further reproduction prohibited without permission.
95
experimental load versus deformation curve. Nevertheless, this does not affect the
validity o f using the finite element model to assess the capacity o f a slotted HSS connection
since there is a good agreement between the measured and predicted peak load.
Crack propagation simulation shows that there is hardly any load increase once a
crack has been initiated. Thus when predicting the maximum load carrying capacity o f a
HSS connection, the numerical simulation can be terminated once the critical equivalent
plastic strain limit is reached without any lose o f the accuracy.
5.2.4 HSS connections with end welding - phase 2 testing program
All numerical simulations of HSS connection with end welding are terminated once
the critical equivalent plastic strain limit has been reached in any part of the model. Both
models that assumed the HSS having the entirely flat part material properties and having a
stronger comer are considered.
As shown in Table 5.10, for square HSS specimens, net section efficiencies
predicted by the numerical model with the entirely flat part material are 3% lower than that
for the test. However, finite element numerical models with an assumed stronger comer
predict net section efficiencies that are in good agreement with the test. For square HSS
specimens, the assumed comer material properties are determined by matching the
simulation result to that o f the test. Thus, it is no surprise that there is a good agreement
in the predicted efficiency for the square HSS specimens. However, it should be pointed
out that the stress versus strain curve o f the assumed HSS comer is within the range of the
measured values o f comer coupons, as shown in Figure 5.23.
Figure 5.29 shows that the predicted load versus displacement curve for the square
HSS connection with an assumed comer material is in good agreement with that from the
Reproduced with permission of the copyright owner. Further reproduction prohibited without permission.

96
test. Since the failure is due to gross section fracture at the mid-length of the specimen,
the deformation at the start of gross section necking is greatly influenced by imperfection.
Thus, the numerical simulation is not expected to predict the start of load reduction
accurately for S10 and S07. However, the numerical simulation correctly predicts the
failure location, which is at the mid-length of the square HSS. The predicted deformed
shape at fracture for S10 is shown in Figure 5.30. It can be clearly seen that there is
considerable necking at the mid-length of the HSS.
Simulations of two finite element models of rectangular HSS connection are carried
out. Model R07 has a weld length ratio similar to the test specimen R07, while model
R075 has a slightly higher weld length ratio at 0.75. The predicted peak load for R07 is
shown in Table 5.10. With the entirely flat part material properties, the numerical
simulation of R07 under predicts the capacity by 1%. But with the assumed comer
material, the numerical simulation over predicts the capacity by 6%. This over prediction
maybe due to the fact that the ultimate strength of the assumed comer material may have
been too high. Another possible reason is the premature failure at the fillet weld. But
since only one rectangular HSS specimen with end welding was tested, it is difficult to be
certain about the exact cause of the over prediction. However, no further adjustment is
made on the assumed comer material properties for the rectangular HSS in order to
improve on the peak load.
Predicted and test load versus displacement curves for the rectangular specimen are
shown in Figure 5.31. The numerical simulation of R07 predicts the failure at the slotted
end, similar to that observed in the test. However, if the weld length ratio is increased by
0.05, the failure shifts from the slotted end to the mid-length o f the HSS. This is
Reproduced with permission of the copyright owner. Further reproduction prohibited without permission.
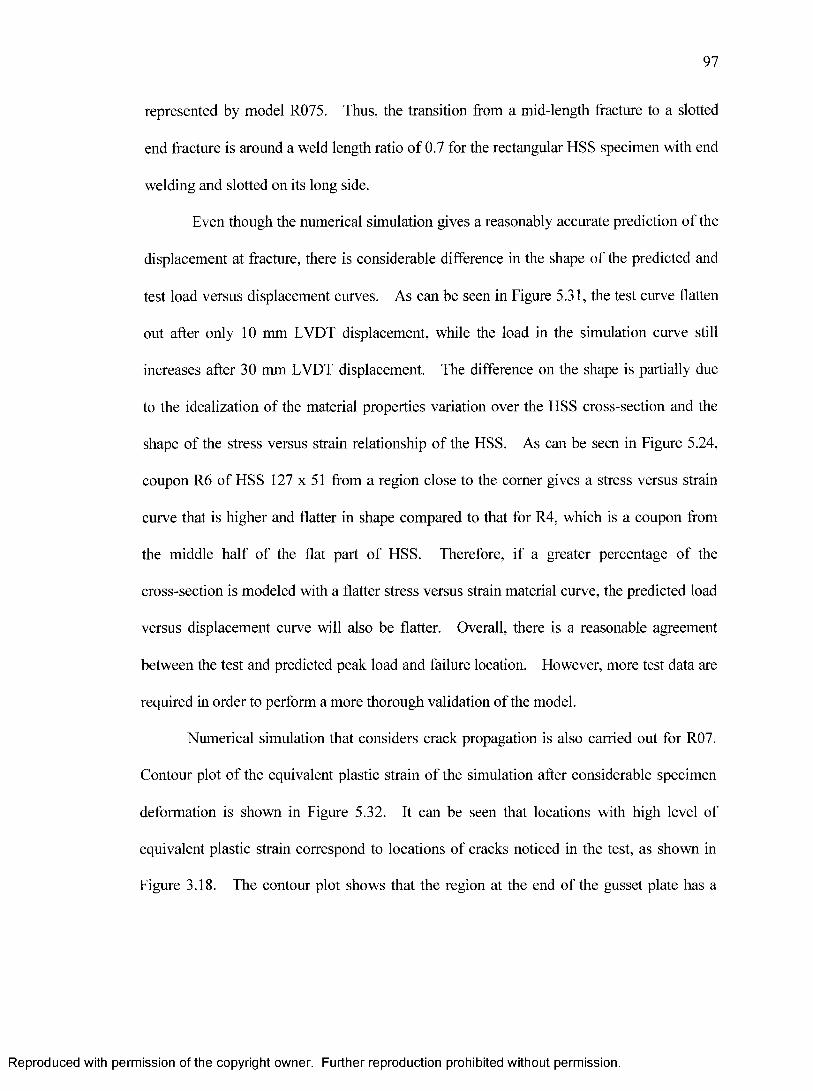
97
represented by model R075. Thus, the transition from a mid-length fracture to a slotted
end fracture is around a weld length ratio of 0.7 for the rectangular HSS specimen with end
welding and slotted on its long side.
Even though the numerical simulation gives a reasonably accurate prediction of the
displacement at fracture, there is considerable difference in the shape o f the predicted and
test load versus displacement curves. As can be seen in Figure 5.31, the test curve flatten
out after only 10 mm LVDT displacement, while the load in the simulation curve still
increases after 30 mm LVDT displacement. The difference on the shape is partially due
to the idealization of the material properties variation over the HSS cross-section and the
shape of the stress versus strain relationship of the HSS. As can be seen in Figure 5.24,
coupon R6 of HSS 127 x 51 from a region close to the corner gives a stress versus strain
curve that is higher and flatter in shape compared to that for R4, which is a coupon from
the middle half of the flat part o f HSS. Therefore, if a greater percentage o f the
cross-section is modeled with a flatter stress versus strain material curve, the predicted load
versus displacement curve will also be flatter. Overall, there is a reasonable agreement
between the test and predicted peak load and failure location. However, more test data are
required in order to perform a more thorough validation of the model.
Numerical simulation that considers crack propagation is also carried out for R07.
Contour plot o f the equivalent plastic strain of the simulation after considerable specimen
deformation is shown in Figure 5.32. It can be seen that locations with high level of
equivalent plastic strain correspond to locations of cracks noticed in the test, as shown in
Figure 3.18. The contour plot shows that the region at the end of the gusset plate has a
Reproduced with permission of the copyright owner. Further reproduction prohibited without permission.
98
higher equivalent plastic strain than the end of HSS. This implies that the material failure
occurs first at the end of the gusset plate.
5.2.5 HSS specimens tested by Korol (1996)
Numerical simulations are also carried out on HSS specimens tested by Korol
(1996). Since material properties reported for Korol’s test specimens are incomplete,
material properties in this testing program for phase 1 HSS 89 x 89 and HSS 127 x 51 are
used in the simulations for square and rectangular HSS specimens respectively. Material
properties o f 16 mm gusset plate for phase 1 are used in modeling the gusset plate of
Korol’s test specimens. It has been found that using different material properties affect
the peak load and the load versus displacement curve of the numerical simulation, but
have little effect on the net section efficiency. Therefore, the comparison between the
simulation and test is carried out using the net section efficiency.
Figures 5.33 to 5.35 show the test and predicted net section efficiency versus weld
length ratio (L/w) plot for Korol’s test. Results from simulations with an entirely flat
part material is denoted as Flat and results with a higher strength comer material as
Comer. Intermediate weld length ratios are also modeled in order to obtain a smoother
predicted curve. In Korol’s test program, the static reading is not mentioned specifically
as being used in calculating the efficiency. But according to Mirza (1994), it may be
deduced that the HSS specimen was loaded slowly with a stoppage at every load
increment. Thus, the load recorded in the HSS specimen test may be considered to be
the static load. However, the ultimate strength of the material is obtained from the
tension coupon tested according to ASTM-E8-04 (2004), which does not require any
static reading to be taken. Thus, the reported material ultimate strength may be around 5
Reproduced with permission of the copyright owner. Further reproduction prohibited without permission.
99
to 10% higher than the static ultimate strength. For this reason, the efficiency reported
for Korol’s test may have been underestimated by around 5 to 10%. Test results from
Korol’s test program are shown in Appendix E. This can be seen in Figure 5.33, where
the measured net section efficiencies for the square HSS at the weld length ratio (L/w) of
around 1.0 are 0.95 and 1.00, while the net section efficiency of a square HSS specimen
with the same weld length ratio in the current testing program is around 1.07.
Figures 5.33 to 5.35 show that assuming a stronger HSS comer only affects the
capacity at high L/w ratios for square HSS and rectangular HSS slotted on its long side.
Due to the high stress concentration at low L/w ratios, HSS comer is not being fully
utilized because the deformation is concentrated at the opening. For a rectangular HSS
slotted on the short side, the contribution of a stronger comer is still significant at a low
ratio because of its proximity to the slot. The predicted net section efficiency plot also
shows that the net section efficiency is proportional to the weld length ratio (L/w) up to
around 0.9 before plateauing out thereafter. The net section efficiencies predicted by
numerical models with the entirely flat part material properties are consistently lower than
that with an assumed stronger comer. It should be noted that there is considerable scatter
in the test results by Korol compared to the current testing program. In Korol’s test, the
specimen with the same geometry can have an efficiency difference of 6%. Nevertheless,
there is a good agreement between the test and predicted shape o f the efficiency versus
weld length ratio curve except at the low L/w ratio for a rectangular HSS slotted on the
long side. As expected, the model with an entirely flat part material properties predicts
the efficiency that is closer to the test, since it is assumed that the efficiency in Korol’s test
Reproduced with permission of the copyright owner. Further reproduction prohibited without permission.
100
may have been under reported by 5 to 10% due to the non-static ultimate strength of the
material being used in calculating the efficiency.
In Figure 5.35, for rectangular HSS connections slotted on the long side, the
simulation predicts an efficiency that is about 5% higher than the test at the L/w of 0.5.
However, it should be viewed in the context that this error is within the range of scatter in
the test result, and as well as the possible under reporting of the test efficiency by Korol.
Thus, overall, it can be concluded that numerical simulations with the developed finite
element models can be used to predict the efficiency of the slotted HSS connection.
Reproduced with permission of the copyright owner. Further reproduction prohibited without permission.
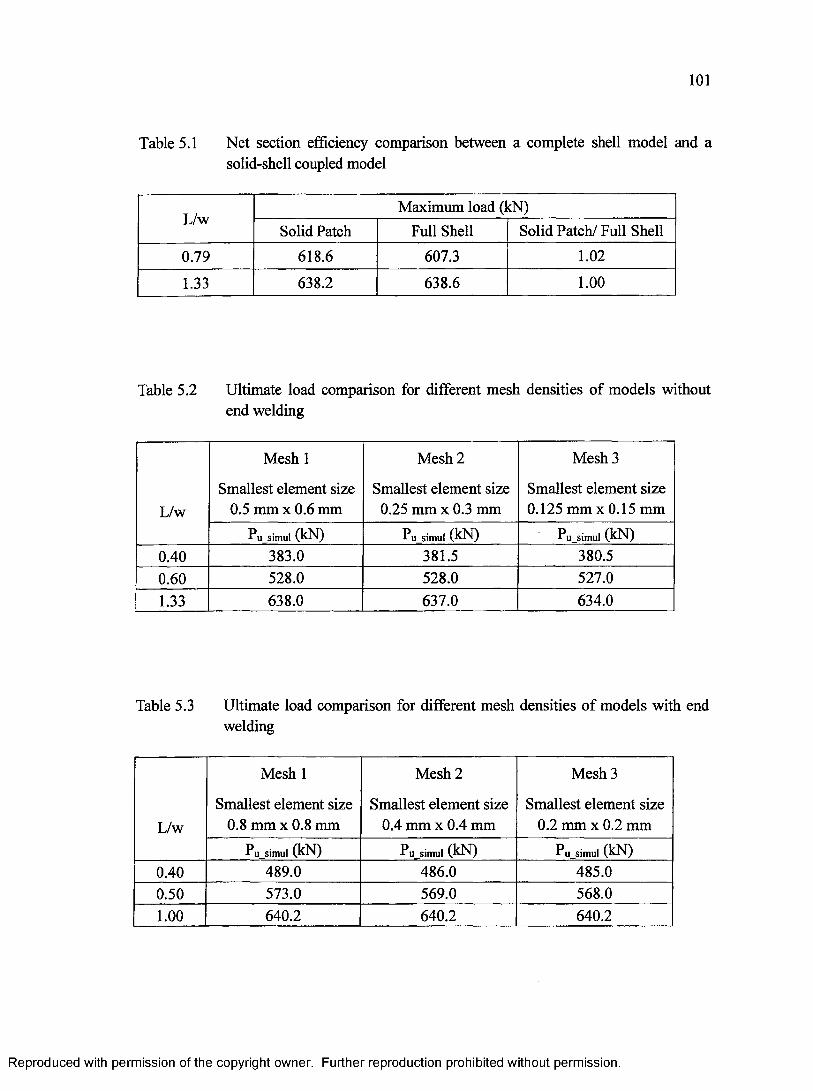
101
Table 5.1 Net section efficiency comparison between a complete shell model and a solid-shell coupled model
L/wMaximum load (kN)
Solid Patch Full Shell Solid Patch/Full Shell
0.79 618.6 607.3 1.02
1.33 638.2 638.6 1.00
Table 5.2 Ultimate load comparison for different mesh densities o f models without end welding
L/w
Mesh 1
Smallest element size 0.5 mm x 0.6 mm
Mesh 2
Smallest element size 0.25 mm x 0.3 mm
Mesh 3
Smallest element size 0.125 mm x 0.15 mm
Pusim ul (kN) Pu simul (kN) Pu_simul (kN)0.40 383.0 381.5 380.50.60 528.0 528.0 527.01.33 638.0 637.0 634.0
Table 5.3 Ultimate load comparison for different mesh densities o f models with end welding
Mesh 1 Mesh 2 Mesh 3
L/wSmallest element size
0.8 mm x 0.8 mmSmallest element size
0.4 mm x 0.4 mmSmallest element size
0.2 mm x 0.2 mm
P u simul (kN) P u simul (kN) P u simul (kN)0.40 489.0 486.0 485.00.50 573.0 569.0 568.01.00 640.2 640.2 640.2
Reproduced with permission of the copyright owner. Further reproduction prohibited without permission.
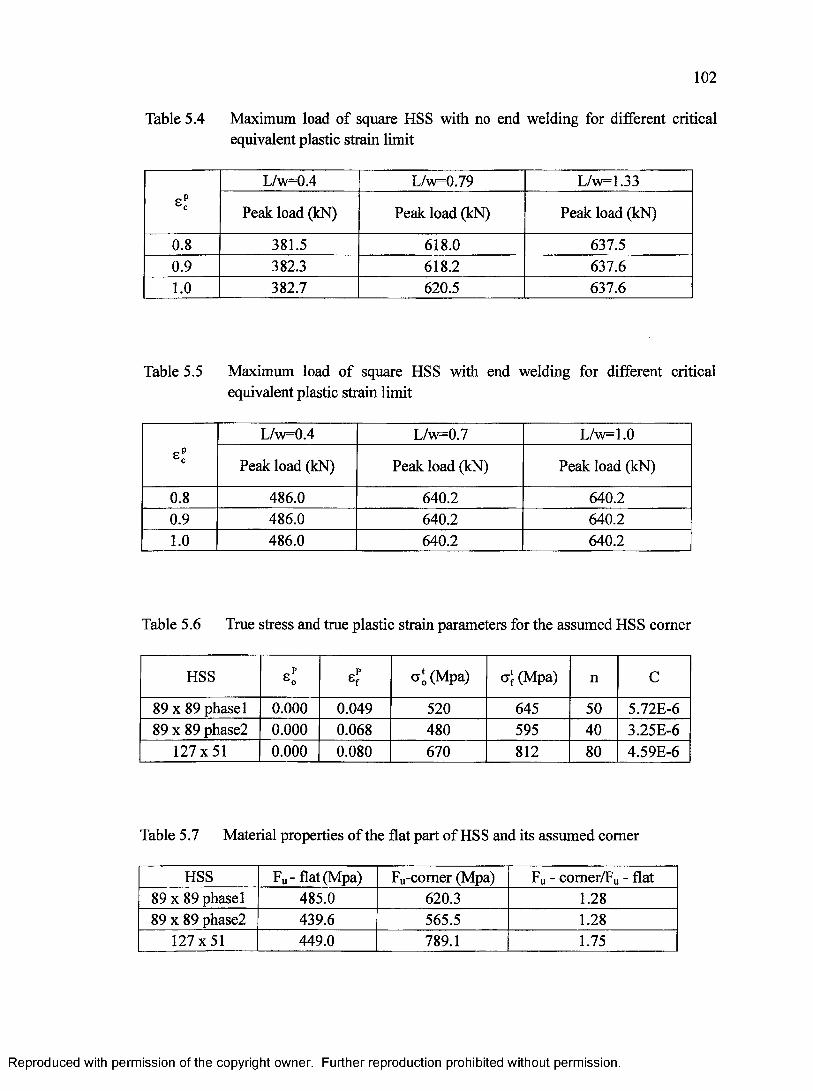
102
Table 5.4 Maximum load o f square HSS with no end welding for different critical equivalent plastic strain limit
ScP
L/w=0.4 L/w=0.79 L/w=1.33
Peak load (kN) Peak load (kN) Peak load (kN)
0.8 381.5 618.0 637.50.9 382.3 618.2 637.61.0 382.7 620.5 637.6
Table 5.5 Maximum load of square HSS with end welding for different critical equivalent plastic strain limit
Q. OCO!
L/w=0.4 L/w=0.7 L/w=1.0
Peak load (kN) Peak load (kN) Peak load (kN)
0.8 486.0 640.2 640.20.9 486.0 640.2 640.21.0 486.0 640.2 640.2
Table 5.6 True stress and true plastic strain parameters for the assumed HSS comer
HSS *1 sfp < (Mpa) c j (Mpa) n C
89 x 89 phase 1 0.000 0.049 520 645 50 5.72E-689 x 89 phase2 0.000 0.068 480 595 40 3.25E-6
127x51 0.000 0.080 670 812 80 4.59E-6
Table 5.7 Material properties o f the flat part o f HSS and its assumed corner
HSS Fu - flat (Mpa) Fu-comer (Mpa) Fu - comer/Fu - flat89 x 89 phasel 485.0 620.3 1.2889 x 89 phase2 439.6 565.5 1.28
127x51 449.0 789.1 1.75
Reproduced with permission of the copyright owner. Further reproduction prohibited without permission.
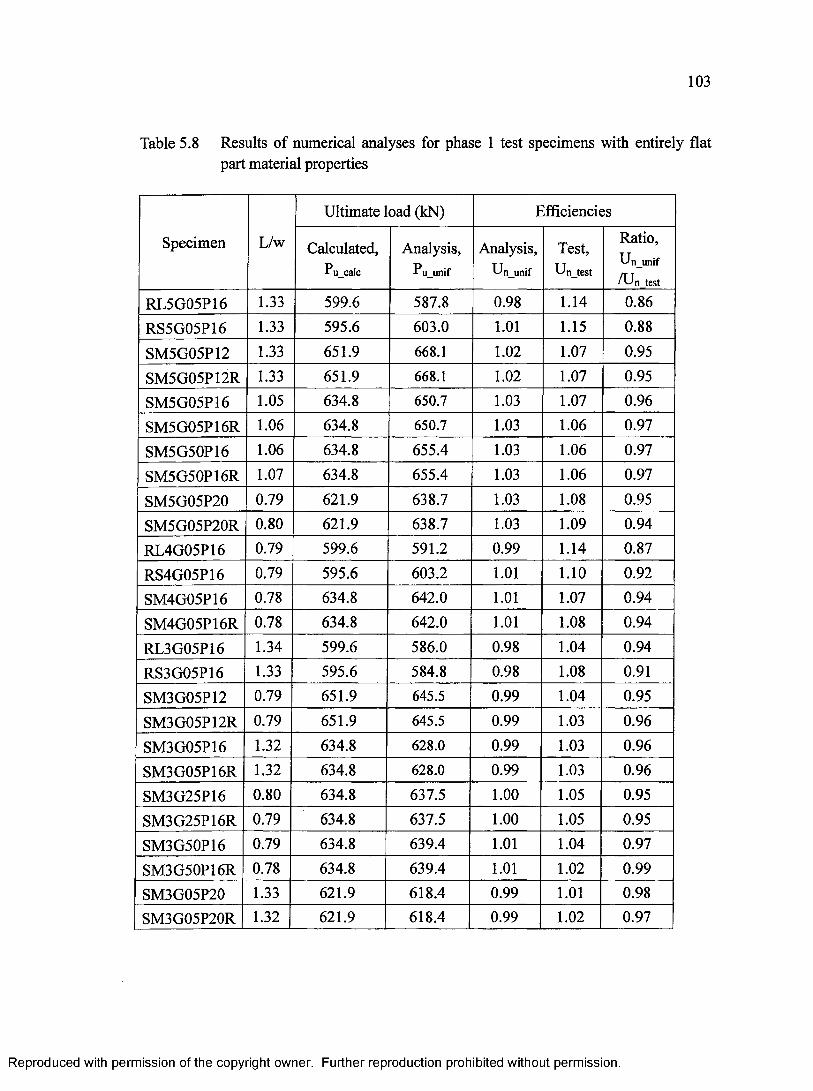
103
Table 5.8 Results of numerical analyses for phase 1 test specimens with entirely flat part material properties
Specimen L/w
Ultimate load (kN) Efficiencies
Calculated,P u_calc
Analysis, P u u n if
Analysis,Un_unif
Test,U n_test
Ratio, U n_unif
/U n test
RL5G05P16 1.33 599.6 587.8 0.98 1.14 0.86
RS5G05P16 1.33 595.6 603.0 1.01 1.15 0.88
SM5G05P12 1.33 651.9 668.1 1.02 1.07 0.95
SM5G05P12R 1.33 651.9 668.1 1.02 1.07 0.95
SM5G05P16 1.05 634.8 650.7 1.03 1.07 0.96
SM5G05P16R 1.06 634.8 650.7 1.03 1.06 0.97
SM5G50P16 1.06 634.8 655.4 1.03 1.06 0.97
SM5G50P16R 1.07 634.8 655.4 1.03 1.06 0.97
SM5G05P20 0.79 621.9 638.7 1.03 1.08 0.95
SM5G05P20R 0.80 621.9 638.7 1.03 1.09 0.94
RL4G05P16 0.79 599.6 591.2 0.99 1.14 0.87
RS4G05P16 0.79 595.6 603.2 1.01 1.10 0.92
SM4G05P16 0.78 634.8 642.0 1.01 1.07 0.94
SM4G05P16R 0.78 634.8 642.0 1.01 1.08 0.94
RL3G05P16 1.34 599.6 586.0 0.98 1.04 0.94
RS3G05P16 1.33 595.6 584.8 0.98 1.08 0.91
SM3G05P12 0.79 651.9 645.5 0.99 1.04 0.95
SM3G05P12R 0.79 651.9 645.5 0.99 1.03 0.96
SM3G05P16 1.32 634.8 628.0 0.99 1.03 0.96
SM3G05P16R 1.32 634.8 628.0 0.99 1.03 0.96
SM3G25P16 0.80 634.8 637.5 1.00 1.05 0.95
SM3G25P16R 0.79 634.8 637.5 1.00 1.05 0.95
SM3G50P16 0.79 634.8 639.4 1.01 1.04 0.97
SM3G50P16R 0.78 634.8 639.4 1.01 1.02 0.99
SM3G05P20 1.33 621.9 618.4 0.99 1.01 0.98
SM3G05P20R 1.32 621.9 618.4 0.99 1.02 0.97
Reproduced with permission of the copyright owner. Further reproduction prohibited without permission.

104
Table 5.9 Results of numerical analyses for phase 1 test specimens with an assumed stronger HSS comer
Specimen L/w
Ultimate load (kN) Efficiencies
Calculated,P ucalc
Analysis, P u_assm
Analysis,U nassm
Test,Un_test
Ratio,Un_assm
/ U n test
RL5G05P16 1.33 599.6 683.7 1.14 1.14 1.00
RS5G05P16 1.33 595.6 676.4 1.14 1.15 0.99
SM5G05P12 1.33 651.9 697.3 1.07 1.07 1.00
SM5G05P12R 1.33 651.9 697.3 1.07 1.07 1.00
SM5G05P16 1.05 634.8 681.5 1.07 1.07 1.00
SM5G05P16R 1.06 634.8 681.5 1.07 1.06 1.01
SM5G50P16 1.06 634.8 682.2 1.07 1.06 1.01
SM5G50P16R 1.07 634.8 682.2 1.07 1.06 1.01
SM5G05P20 0.79 621.9 672.8 1.08 1.08 1.00
SM5G05P20R 0.80 621.9 672.8 1.08 1.09 0.99
RL4G05P16 0.79 599.6 679.9 1.13 1.14 0.99
RS4G05P16 0.79 595.6 670.4 1.11 1.10 1.01
SM4G05P16 0.78 634.8 678.0 1.07 1.07 1.00
SM4G05P16R 0.78 634.8 678.0 1.07 1.08 0.99
RL3G05P16 1.34 599.6 611.6 1.02 1.04 0.98
RS3G05P16 1.33 595.6 652.4 1.10 1.08 1.02
SM3G05P12 0.79 651.9 672.1 1.03 1.04 0.99
SM3G05P12R 0.79 651.9 672.1 1.03 1.03 1.00
SM3G05P16 1.32 634.8 655.6 1.03 1.03 1.00
SM3G05P16R 1.32 634.8 655.6 1.03 1.03 1.00
SM3G25P16 0.80 634.8 665.4 1.05 1.05 1.00
SM3G25P16R 0.79 634.8 665.4 1.05 1.05 1.00
SM3G50P16 0.79 634.8 668.4 1.05 1.04 1.01
SM3G50P16R 0.78 634.8 668.4 1.05 1.02 1.03
SM3G05P20 1.33 621.9 642.6 1.03 1.01 1.02
SM3G05P20R 1.32 621.9 642.6 1.03 1.02 1.01
Reproduced with permission of the copyright owner. Further reproduction prohibited without permission.
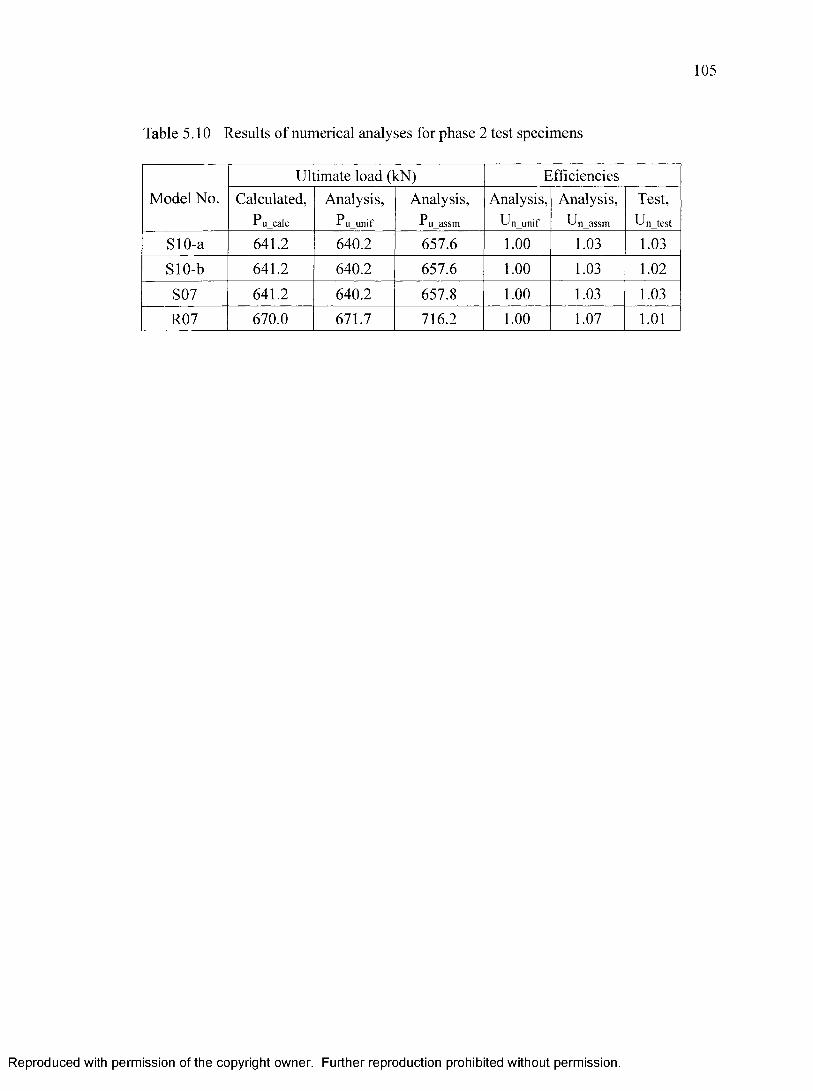
Table 5.10 Results of numerical analyses for phase 2 test specimens
Model No.Ultimate load (kN) Efficiencies
Calculated,Pu calc
Analysis,P u u n if
Analysis,P u a ssm
Analysis, U n unif
Analysis,U n assm
Test, U n test
SlO-a 641.2 640.2 657.6 1.00 1.03 1.03
SlO-b 641.2 640.2 657.6 1.00 1.03 1.02
S07 641.2 640.2 657.8 1.00 1.03 1.03
R07 670.0 671.7 716.2 1.00 1.07 1.01
Reproduced with permission of the copyright owner. Further reproduction prohibited without permission.
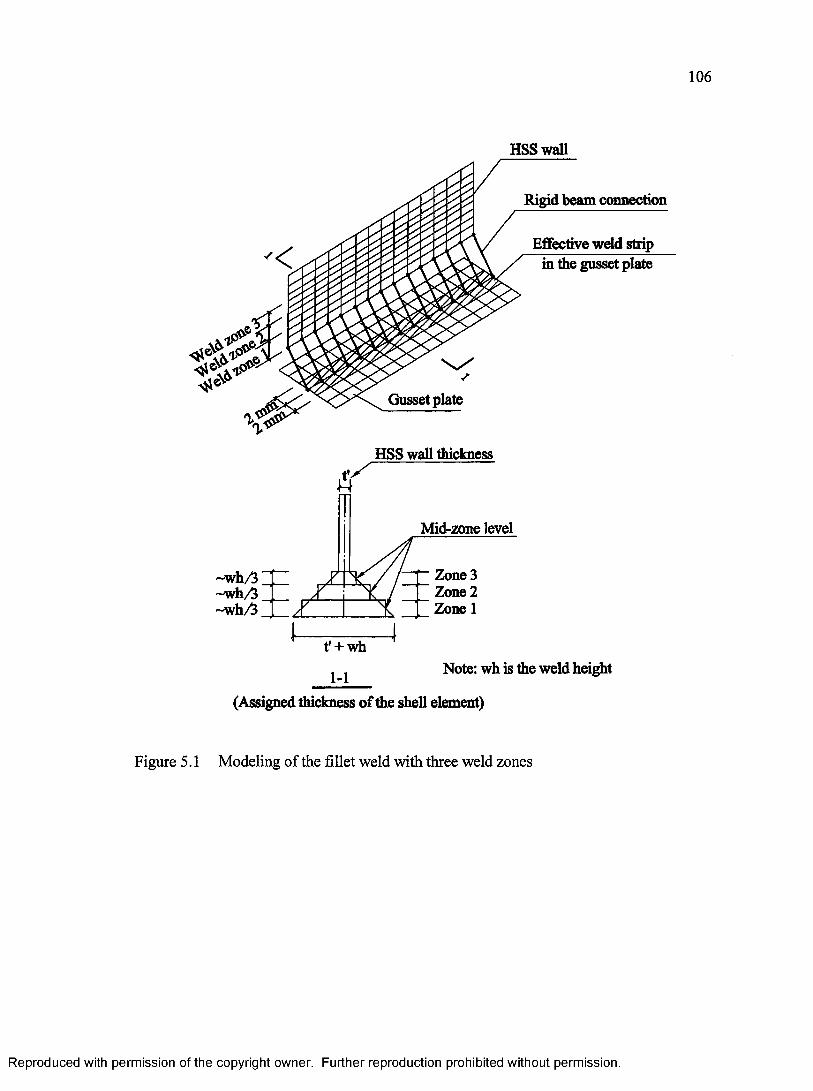
106
HSS wall
Rigid beam connection
Effective weld strip in the gusset plate
HSS wall thickness
Mid-zone level
Zone 3 Zone 2 Zone 1
~wh/3~wh/3~wh/3
t' + wh1 t Note: wh is the weld height
(Assigned thickness of the shell element)
Figure 5.1 Modeling of the fillet weld with three weld zones
Gusset plate
Reproduced with permission of the copyright owner. Further reproduction prohibited without permission.
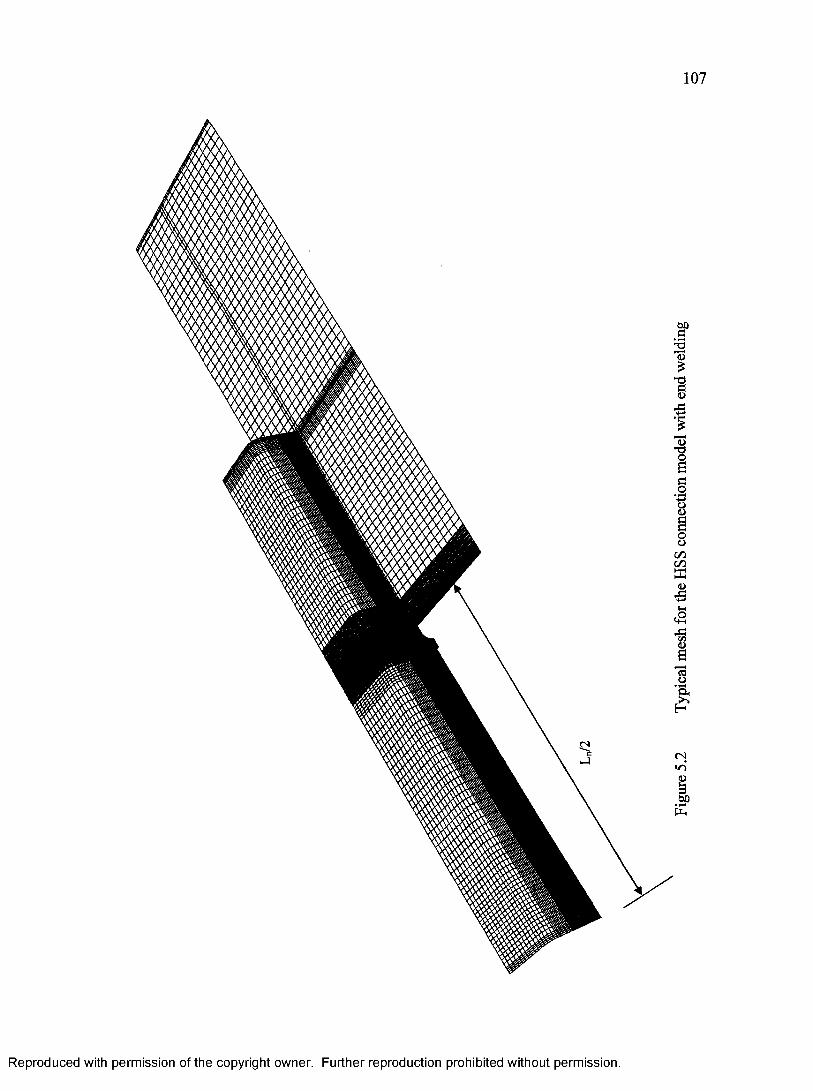
Reproduced with permission o f the copyright owner. Further reproduction prohibited w ithout permission.

Reproduced with permission o f the copyright owner. Further reproduction prohibited w ithout permission.
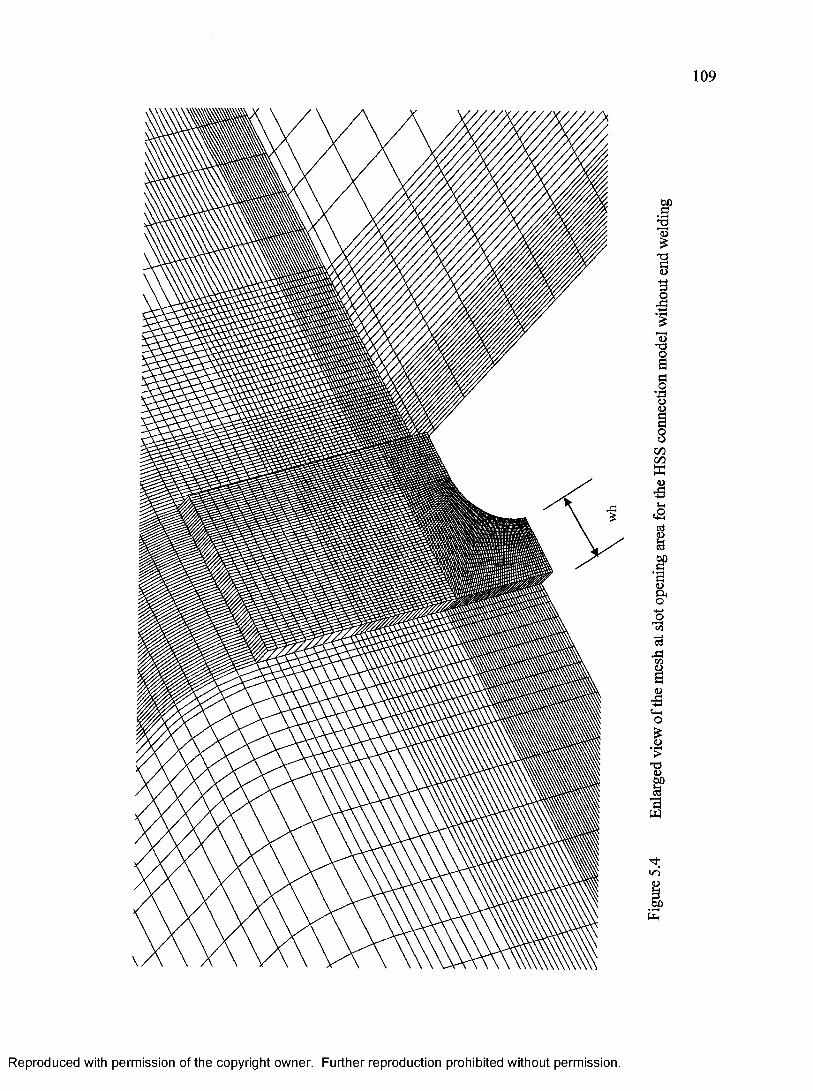
Reproduced with permission o f the copyright owner. Further reproduction prohibited w ithout permission.
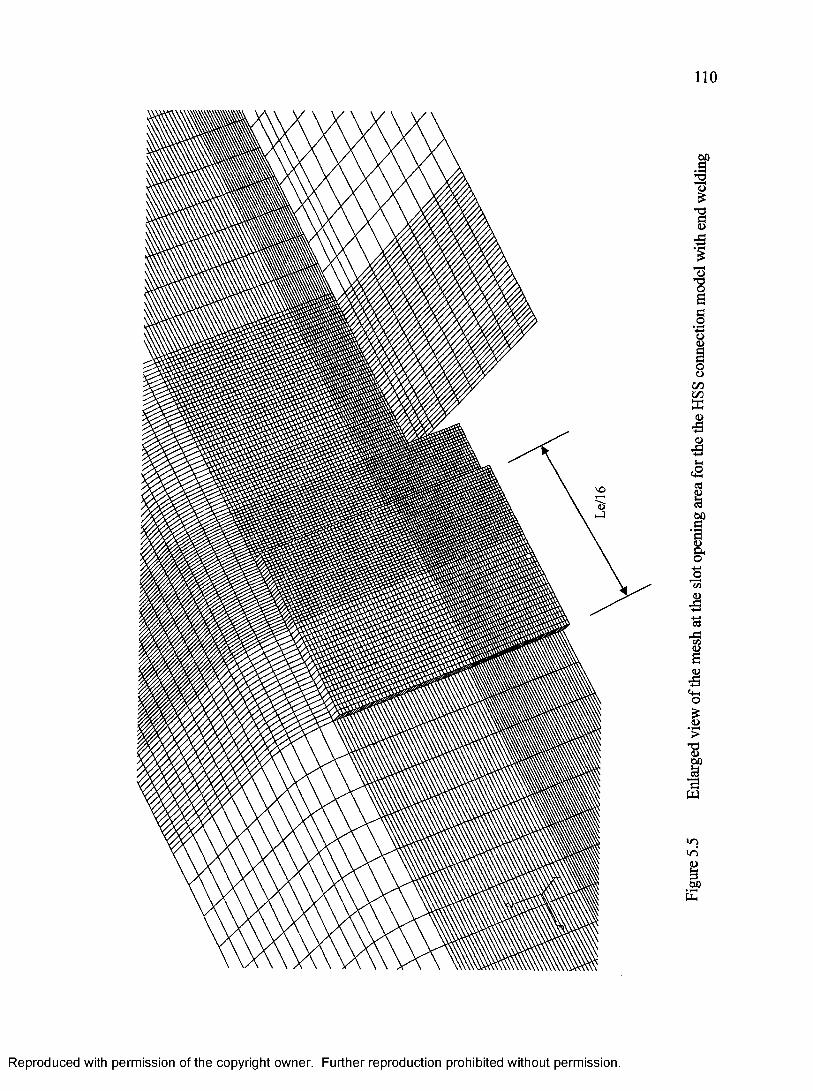
Reproduced with permission o f the copyright owner. Further reproduction prohibited w ithout permission.
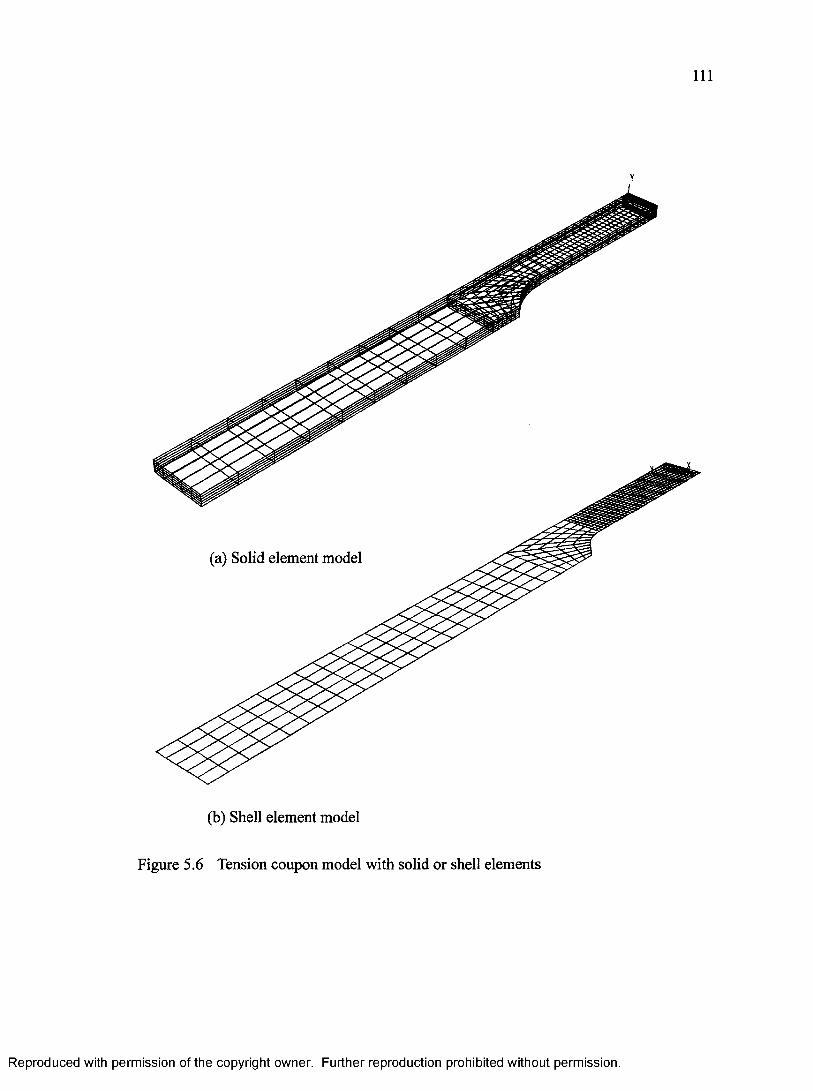
(a) Solid element model
(b) Shell element model
Figure 5.6 Tension coupon model with solid or shell elements
Reproduced with permission of the copyright owner. Further reproduction prohibited without permission.
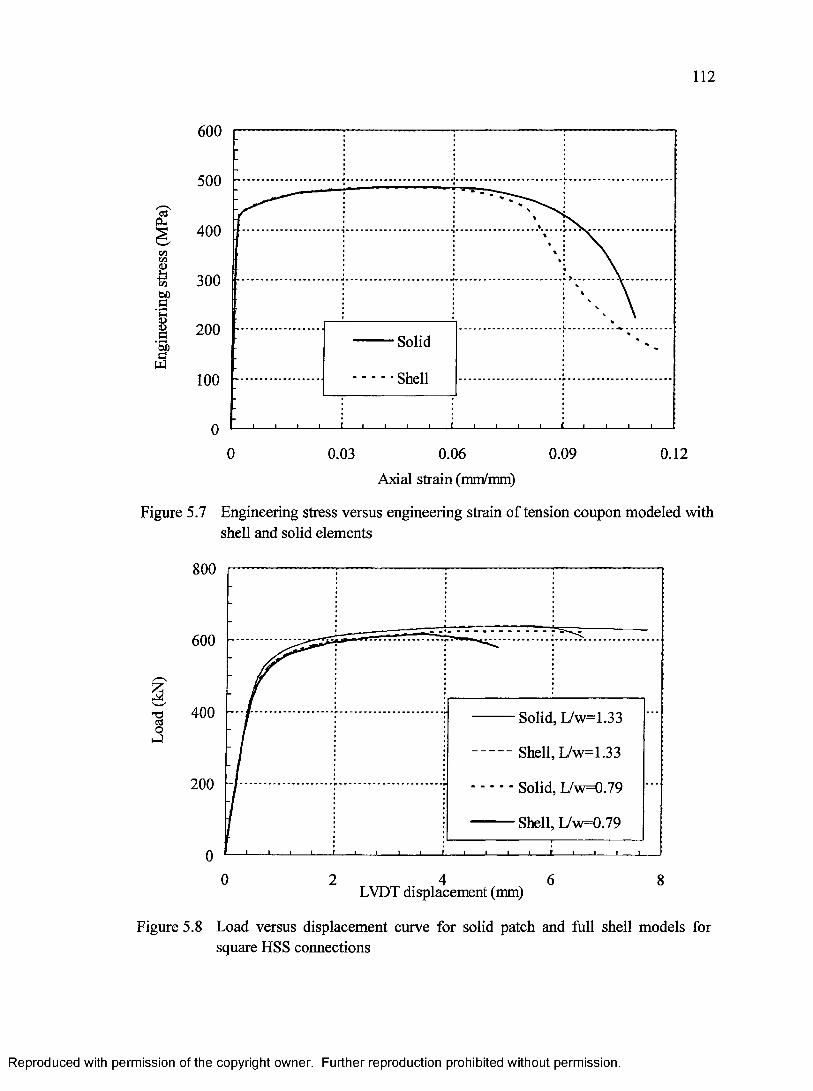
112
c3O h
GOC/D0)
DOa• Vh
CD
a‘5bS3W
600
500
400
300
200Solid
■ - ■ Shell100
0
0 0.03 0.06 0.09 0.12
Axial strain (mm/mm)
Figure 5.7 Engineering stress versus engineering strain o f tension coupon modeled with shell and solid elements
800
600
40013ohJSolid, L/w=1.33
Shell, L/w=1.33
200 Solid, L/w=0.79
Shell, L/w=0.79
0 2 4LVDT displacement (mm)
6 8
Figure 5.8 Load versus displacement curve for solid patch and full shell models for square HSS connections
Reproduced with permission of the copyright owner. Further reproduction prohibited without permission.

"3w Saj £313■«->CO o<D X
'a < o
3Vi
d
Mes
h 2
Smal
lest
elem
ent
0.25
x 0.3
m
m
a_o%->oi>
ro <u ^
ooViViadl-l
<2xocSa,e<D
•213
oco
£O ao t/a ,B
.ts 13M Sa > ^ s^ 2co O
8 InS IQ 3
OsinvJ-H
§>fa
Rep
rodu
ced
with
pe
rmis
sion
of
the
copy
right
ow
ner.
Furth
er
repr
oduc
tion
proh
ibite
d w
ithou
t pe
rmis
sion
.

114
Mesh 1 Smallest element
0.8 x 0.8 mm
Mesh 2 Smallest element
0.4 x 0.4 mm
Mesh 3 Smallest element
0.2 x 0.2 mm
Figure 5.10 Different mesh densities o f the solid element patch for a HSS connection model with end welding
Reproduced with permission of the copyright owner. Further reproduction prohibited without permission.

115
800
600L/w =1.33
L/w = 0.60
400
L/w =0.40 - -o- - Mesh 1 —b— Mesh 2 -•A --M esh 3200
80 2 10 124 6LVDT displacement (mm)
Figure 5.11 Load versus LVDT displacement curves of HSS 89 x 89 models without end welding for different mesh densities
•3ohJ
800
L/w = 0.50 — S i to600
L/w = 0.40400
— ©— Mesh 1 - B - - M e s h 2 ---A--- Mesh 3
200
00 4 8 12 16 20
LVDT displacement (mm)
Figure 5.12 Load versus LVDT displacement curves o f HSS 89 x 89 models with end welding for different mesh densities at L/w = 0.4 and 0.5
Reproduced with permission of the copyright owner. Further reproduction prohibited without permission.
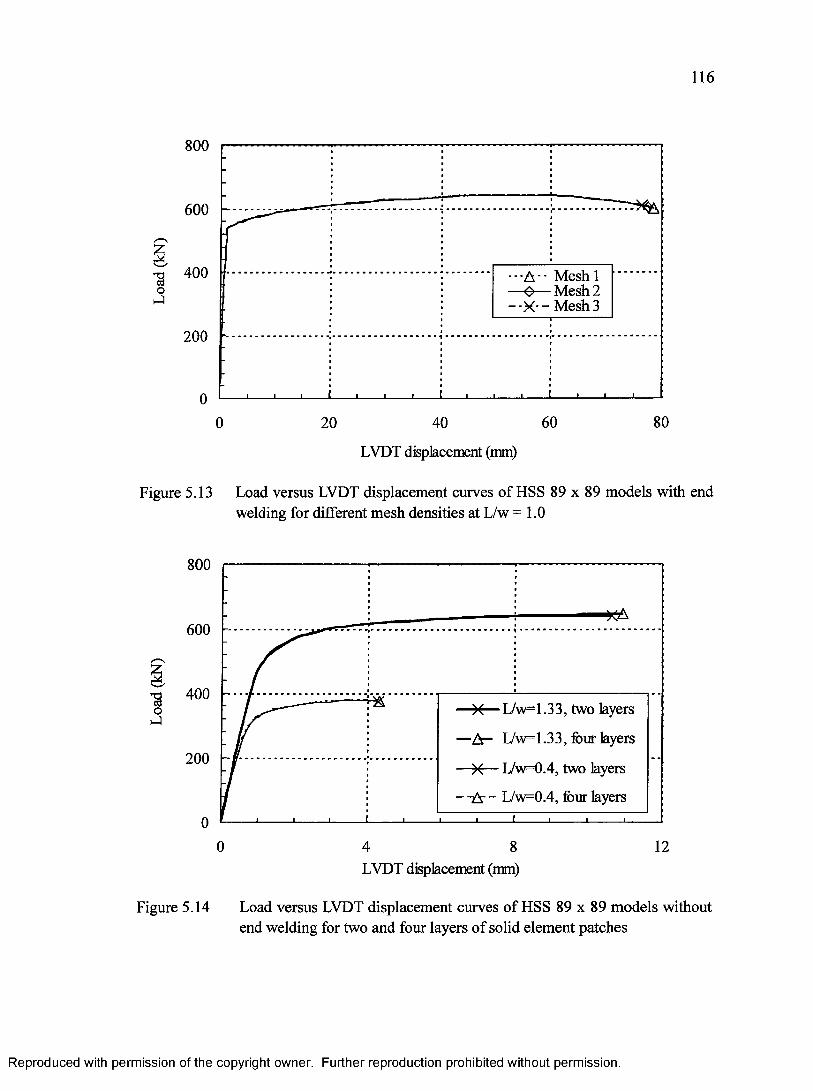
116
800
600
•a 400GjO>-)
200
0
i I I
■ • • A - - Mesh 1 — 0 — Mesh 2 - - X - - Mesh 3
i i i J L .
20 40 60
LVDT displacement (mm)
80
Figure 5.13 Load versus LVDT displacement curves of HSS 89 x 89 models with end welding for different mesh densities at L/w =1.0
800
600 -
400
200
-*A
—X— L/w=1.33, two layers
—A - L/w=l.33, four layers
—X— L/w=0.4, two layers
- -A- - L/w=0.4, four layers
8 12LVDT displacement (mm)
Figure 5.14 Load versus LVDT displacement curves o f HSS 89 x 89 models without end welding for two and four layers o f solid element patches
Reproduced with permission of the copyright owner. Further reproduction prohibited without permission.
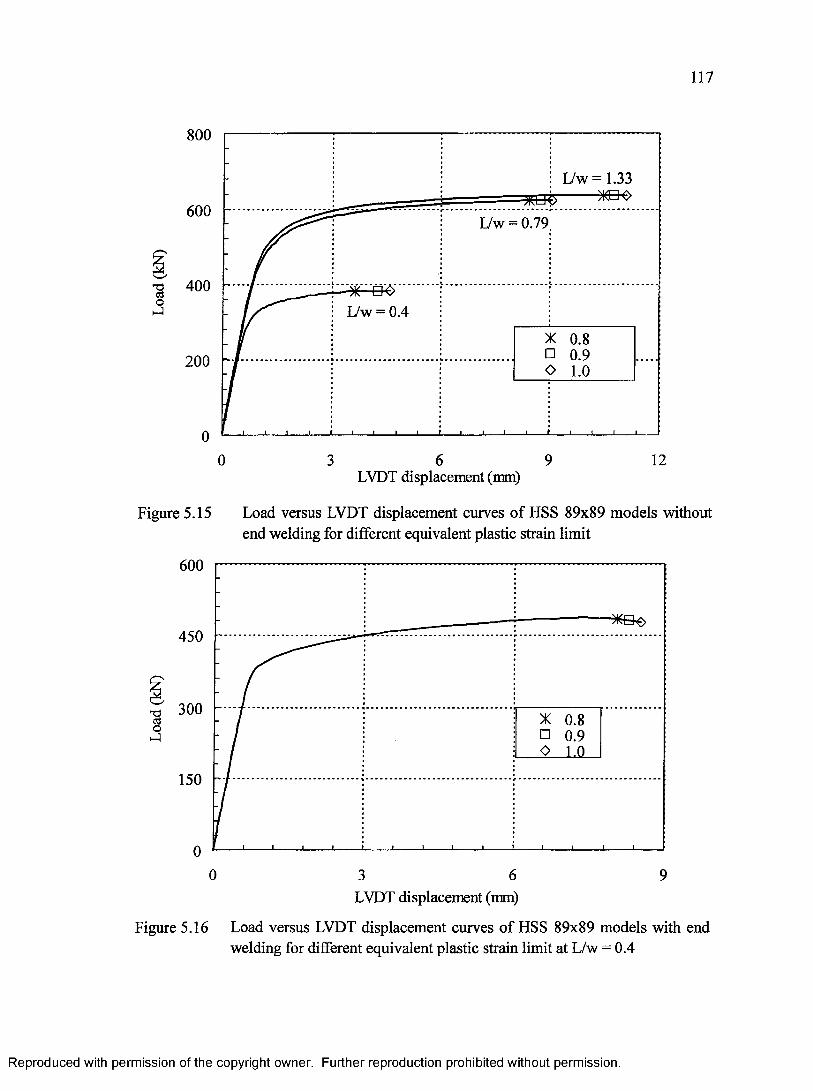
117
800
L/w = 1.33
600L/w = 0.79
•so - D1# I7w = 0.4
200
6 90 3 12LVDT displacement (mm)
Figure 5.15 Load versus LVDT displacement curves o f HSS 89x89 models without end welding for different equivalent plastic strain limit
600
450
300
150
00 6 93
LVDT displacement (mm)
Figure 5.16 Load versus LVDT displacement curves o f HSS 89x89 models with end welding for different equivalent plastic strain limit at L/w = 0.4
Reproduced with permission of the copyright owner. Further reproduction prohibited without permission.
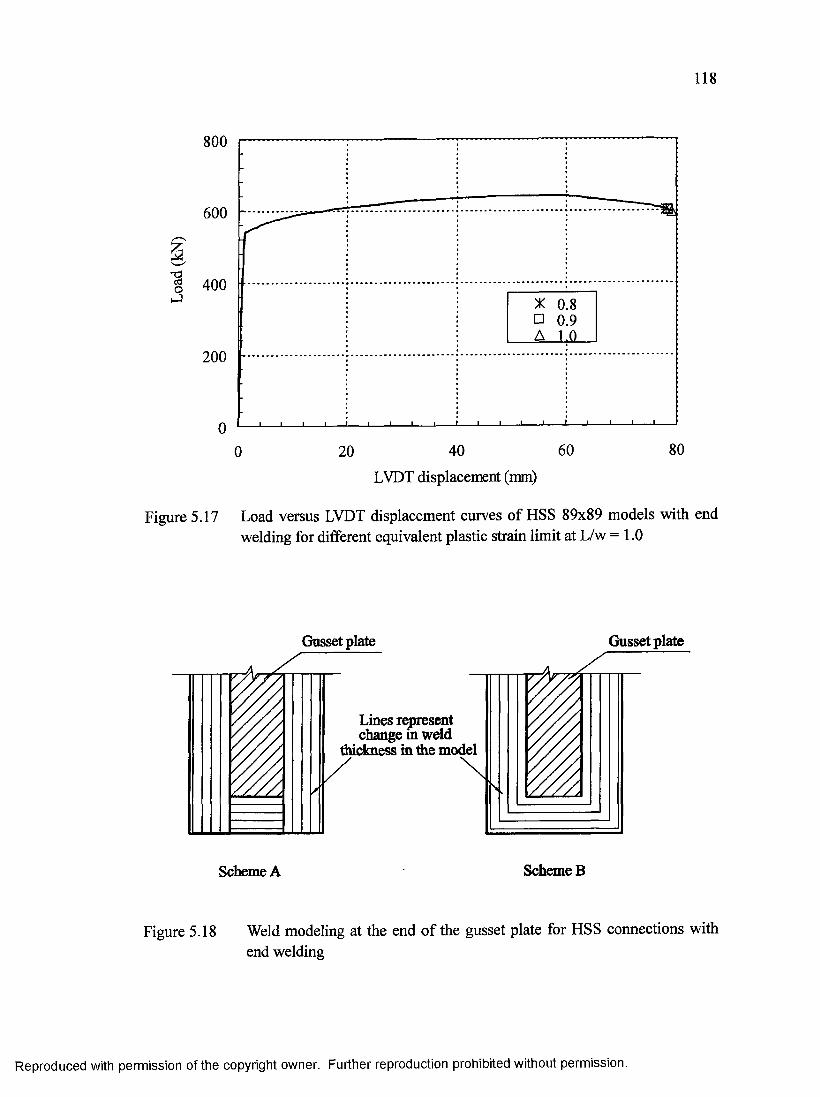
Load
(k
N)
118
800
600
400
200
0806040200
LVDT displacement (mm)
Figure 5.17 Load versus LVDT displacement curves o f HSS 89x89 models with end welding for different equivalent plastic strain limit at L/w = 1.0
Gusset plate Gusset plate
Lines represent change m weld
thickness in the model
Scheme BScheme A
Figure 5.18 Weld modeling at the end o f the gusset plate for HSS connections with end welding
Reproduced with permission of the copyright owner. Further reproduction prohibited without permission.
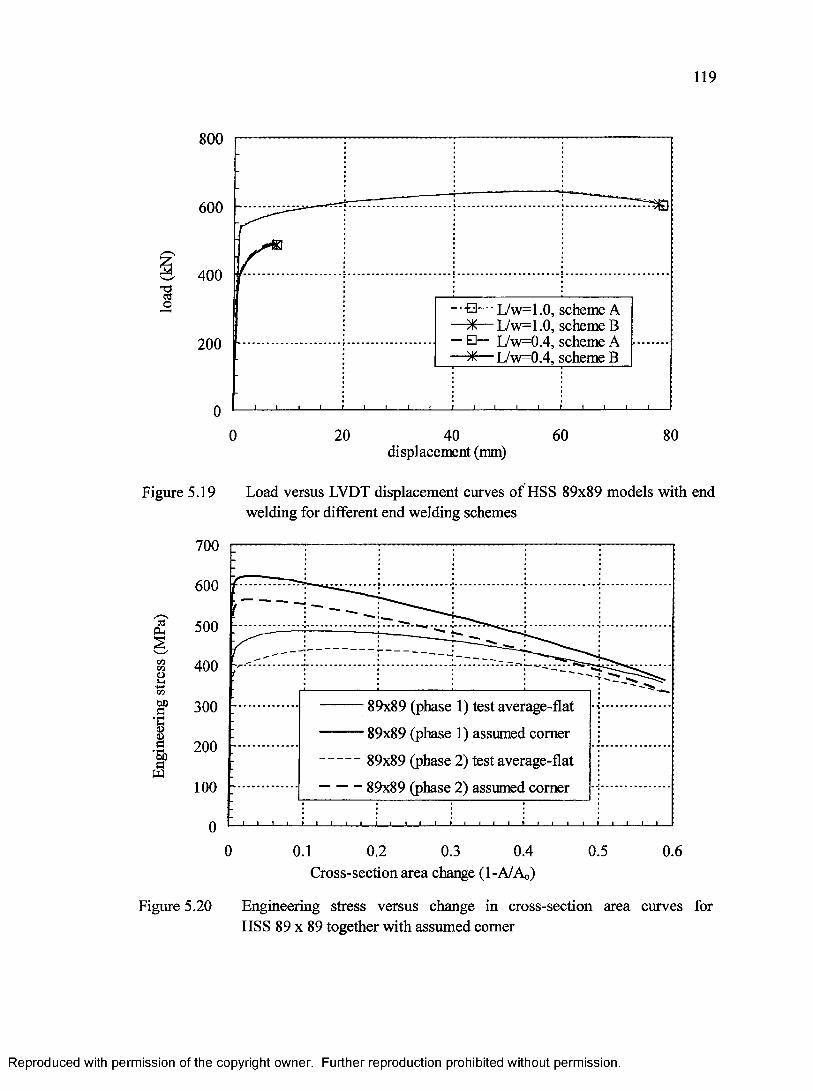
119
800
600
400
------- L/w=l .0, scheme A—^ — L/w=T .0, scheme B — EH— L/w=0.4, scheme A — L/w=0.4, scheme B
200
020 60 800 40
displacement (mm)
Figure 5.19
700
600
aOh
COCO
u
00a• (-C<D
w
Load versus LVDT displacement curves of HSS 89x89 models with end welding for different end welding schemes
500
400
300
200
100
0
89x89 (phase 1) test average-flat
89x89 (phase 1) assumed corner
89x89 (phase 2) test average-flat
89x89 (phase 2) assumed comer
I I 1 I- t I i I I I I I I I > < I I I » I I I I t I . J I L
0 0.1 0.2 0.3 0.4 0.5 0.6Cross-section area change (1-A/Ao)
Figure 5.20 Engineering stress versus change in cross-section area curves for HSS 89 x 89 together with assumed comer
Reproduced with permission of the copyright owner. Further reproduction prohibited without permission.
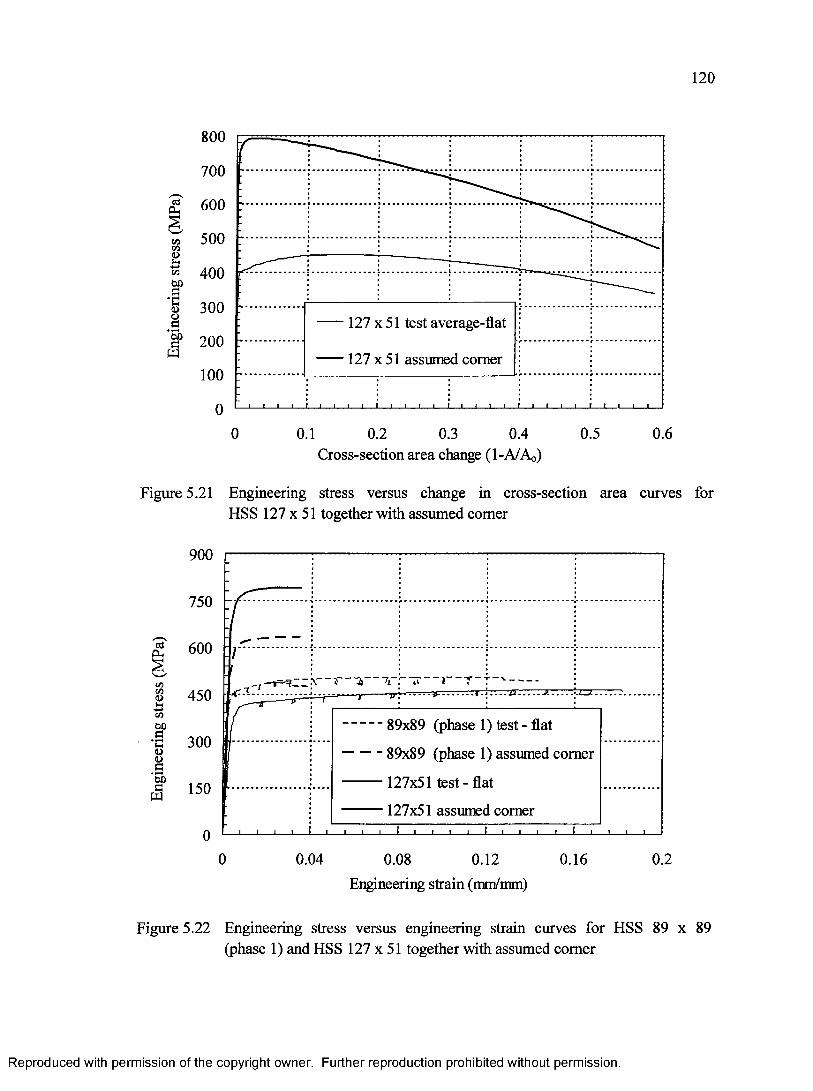
120
800
700
500
400• *—< J—(<D<L>C3•(soEhW
300127 x 51 test average-flat
200 127 x 51 assumed corner
100
0.5 0.60 0.1 0.2 0.3 0.4Cross-section area change (1-A/Ao)
Figure 5.21 Engineering stress versus change in cross-section area curves for HSS 127 x 51 together with assumed comer
Ph
ViVi0)
.£?‘Gu§
900
750
600
450
300
S 150
-4T ---rtji:__ J>-.
89x89 (phase 1) test - flat
89x89 (phase 1) assumed corner
127x51 test - flat
: 127x51 assumed corner_ J I I I 1 I I I I 1 I I I I 1 I I I I 1 I 1 I L -
0.04 0.08 0.12
Engineering strain (mm/mm)
0.16 0.2
Figure 5.22 Engineering stress versus engineering strain curves for HSS 89 x 89 (phase 1) and HSS 127 x 51 together with assumed comer
Reproduced with permission of the copyright owner. Further reproduction prohibited without permission.
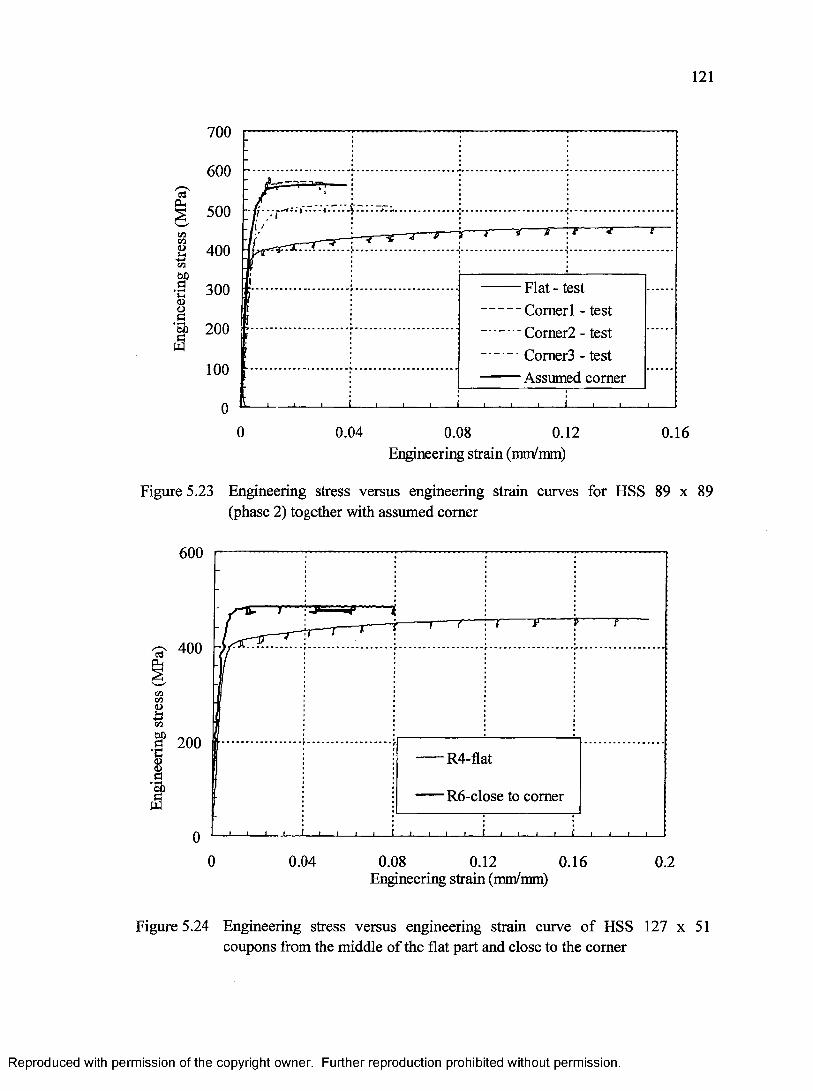
121
700
600
I * »CO
^ 400
Flat - test— Corner 1 - test— Corner2 - test— Corner3 - test Assumed corner100
0 0.04 0.12 0.160.08Engineering strain (mm/mm)
Figure 5.23 Engineering stress versus engineering strain curves for HSS 89 x 89 (phase 2) together with assumed comer
600
a
c 5■ 200
R4-flat<3ci
R6-close to corner
0 0.04 0.08 0.12 0.16 0.2Engineering strain (mm/mm)
Figure 5.24 Engineering stress versus engineering strain curve o f HSS 127 x 51 coupons from the middle of the flat part and close to the comer
Reproduced with permission of the copyright owner. Further reproduction prohibited without permission.

122
800
600
SM3G05P20
SM3G05P20R
Simulation
X Failure point
200
159 120 3 6LVDT displacement (mm)
Figure 5.25 Test and simulation load versus LVDT displacement curves for SM3G05P20 and SM3G05P20R at L/w = 0.79
800
600
SM5G05P20
SM5G05P20R
Simulation
X Failure point
200
0 3 6 9 12 15LVDT displacement (mm)
Figure 5.26 Test and simulation load versus LVDT displacement curves for SM5G05P20 and SM5G05P20R at L/w = 1.33
Reproduced with permission of the copyright owner. Further reproduction prohibited without permission.
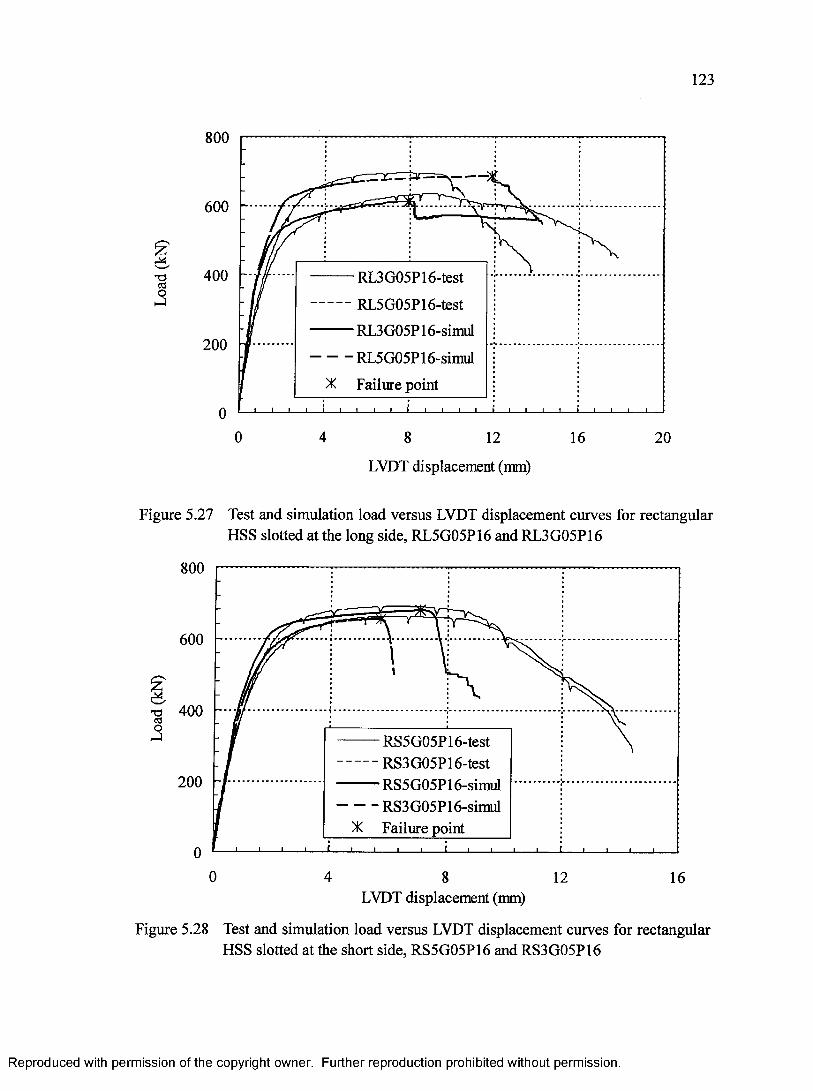
123
800
600
400 RL3G05P16-test
RL5G05P16-test
RL3G05P16-simul200
RL5G05P16-simul
X Failure point
0 4 8 12 16 20
LVDT displacement (mm)
Figure 5.27 Test and simulation load versus LVDT displacement curves for rectangular HSS slotted at the long side, RL5G05P16 and RL3G05P16
ao
800
600
400
RS5G05P16-test RS3G05P 16-test RS5G05P16-simul- - RS3G05P16-simul X Failure point
200
00 4 8 12 16
LVDT displacement (mm)
Figure 5.28 Test and simulation load versus LVDT displacement curves for rectangular HSS slotted at the short side, RS5G05P16 and RS3G05P16
Reproduced with permission of the copyright owner. Further reproduction prohibited without permission.
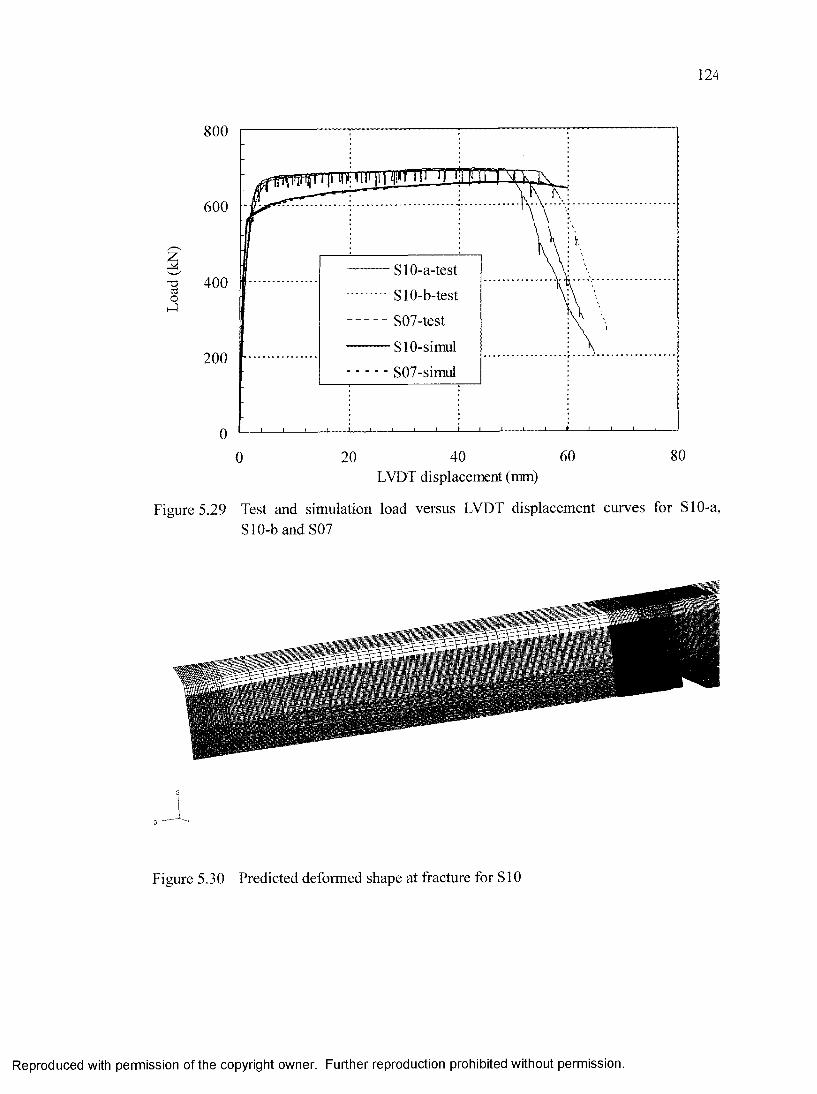
124
800
600
2 S10-a-test
SlO-b-test
S07-test
SlO-simul
S07-simul
400T3cGO
200
806040200LVDT displacement (mm)
Figure 5.29 Test and simulation load versus LVDT displacement curves for SlO-a, SlO-b and S07
213— S
Figure 5.30 Predicted deformed shape at fracture for S10
Reproduced with permission of the copyright owner. Further reproduction prohibited without permission.
40
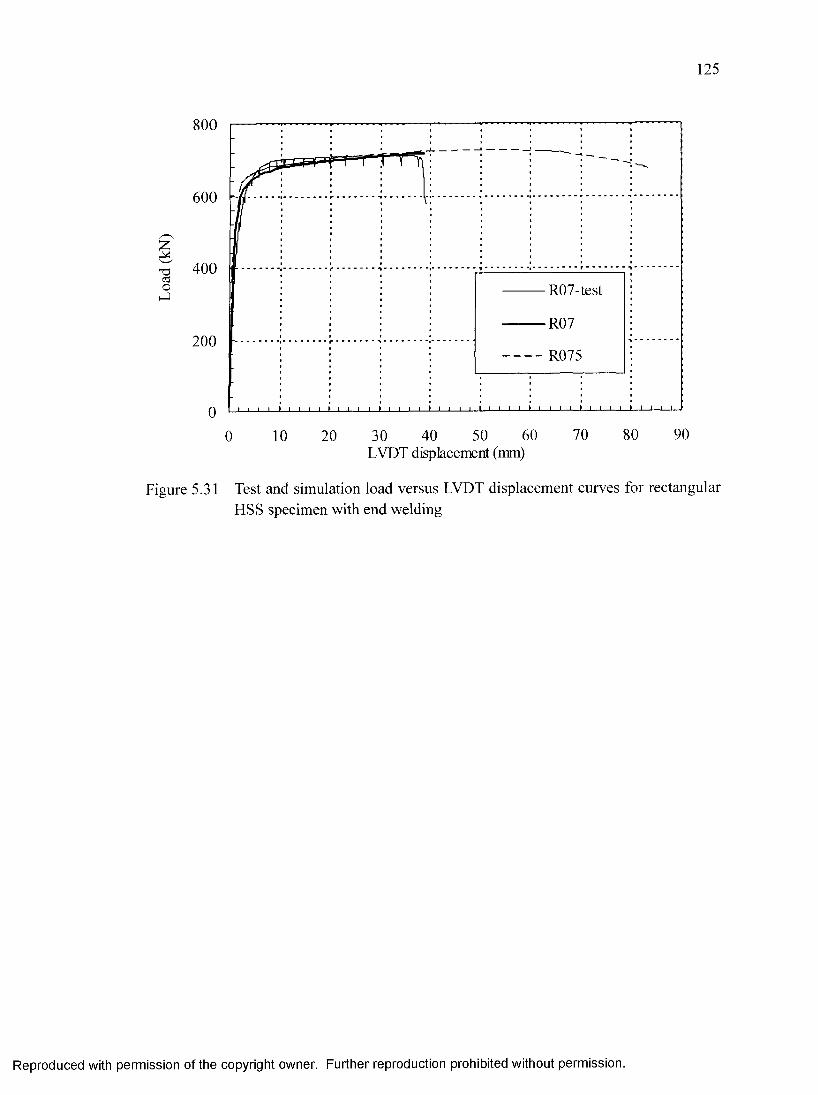
Load
(k
N)
125
800
600
400R07-test
R07200
- - R075
9070 806040 5020 300 10LVDT displacement (mm)
Figure 5.31 Test and simulation load versus LVDT displacement curves for rectangular HSS specimen with end welding
Reproduced with permission of the copyright owner. Further reproduction prohibited without permission.
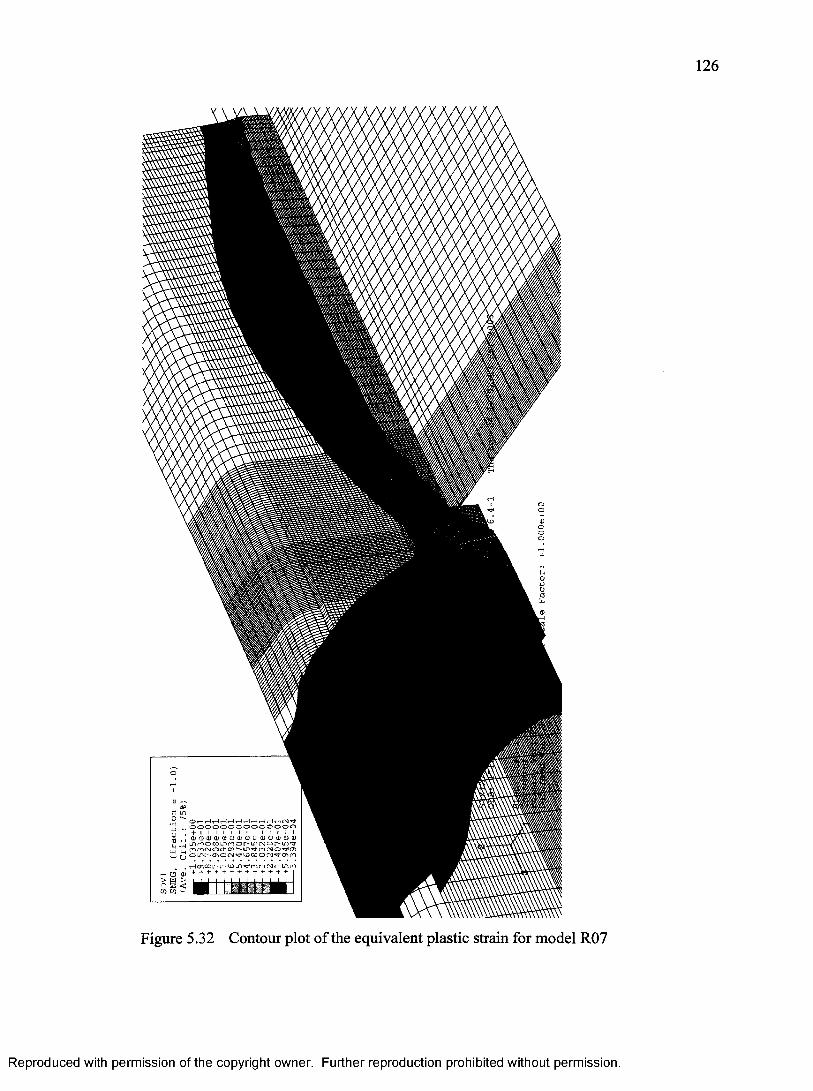
SDV
ISN
EG,
(fra
ctio
n
fAve
. C
rit.
: 75
%
126
O r I rHtH <— —I *—i rHrH t—I tH r* OJTj"o o o o o o o o o o o o o o+ I I I I I I 1 I I I I • I (UO(Ua)<DOiL'(Ua!CDOU.'(DQ) uv^ocoLnroor-inrgor-ir)^ m m cm o tTi cr> r- m ro rN o o ■/»o-i o cm <cr co o rv) a> m
Figure 5.32 Contour plot of the equivalent plastic strain for model R07
Reproduced with permission of the copyright owner. Further reproduction prohibited without permission.
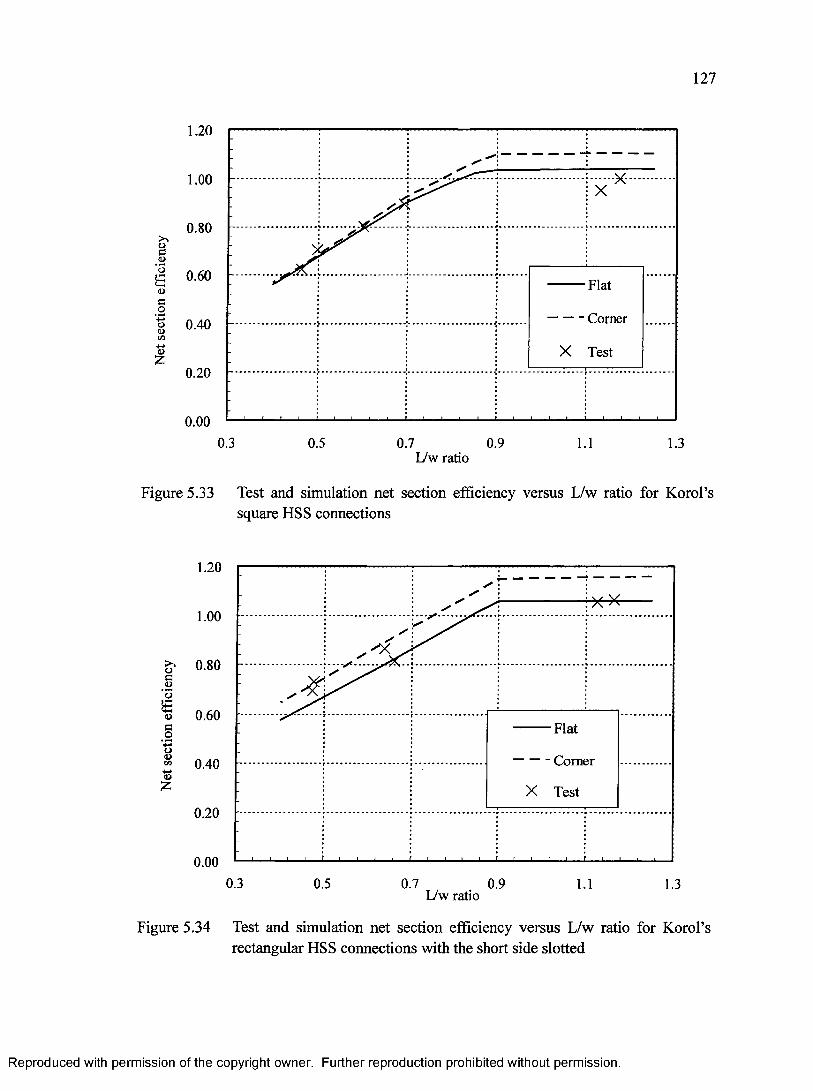
127
1.20
1.00
0.80>%0 c .a>1 0.60<DC
I 0.40(/>
Flat
Corner
X Test0.20
0.000.3 0.5 0.7 0.9 1.3
L/w ratio
Figure 5.33 Test and simulation net section efficiency versus L/w ratio for Korol’s square HSS connections
1.20
1.00
0.80 ■ x
0.60Flat
Comer0.40
X Test0.20
0.000.3 0.5 0.7 0.9 1.1 1.3
L/w ratio
Figure 5.34 Test and simulation net section efficiency versus L/w ratio for Korol’s rectangular HSS connections with the short side slotted
Reproduced with permission of the copyright owner. Further reproduction prohibited without permission.
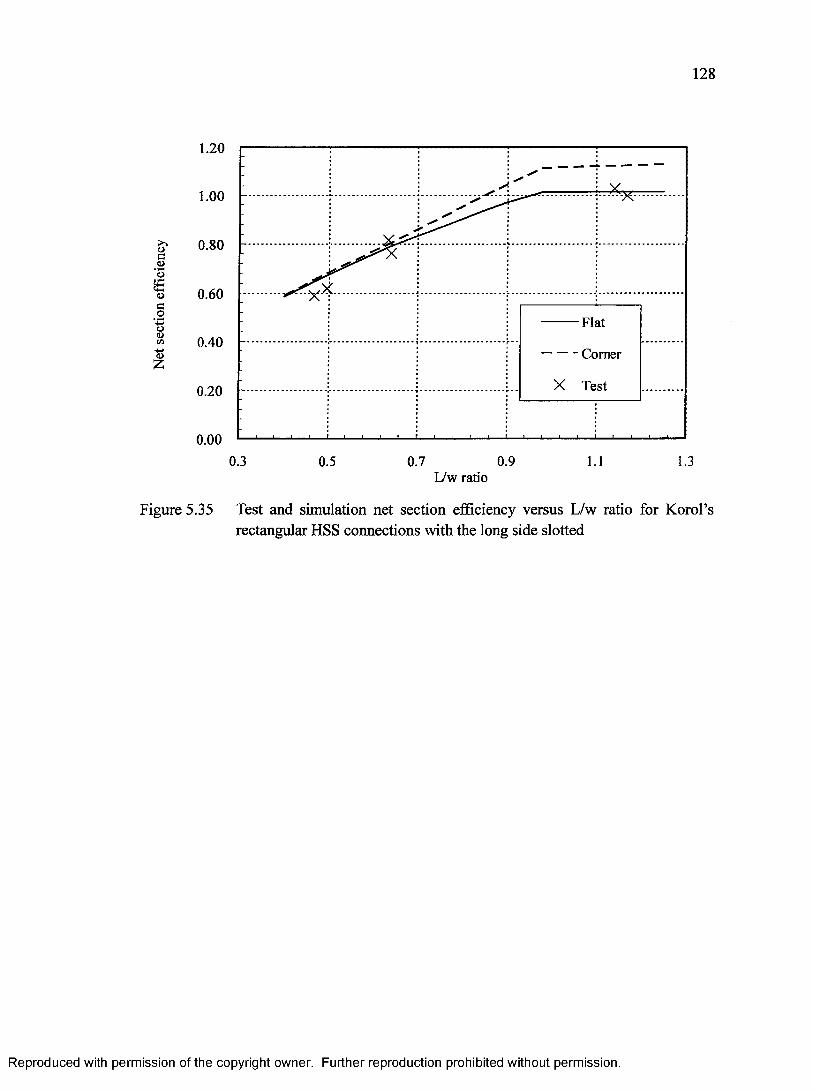
Net
sect
ion
effi
cien
cy
128
1.20
1.00
0.80
0.60
Flat0.40
- Corner
X Test0.20
0.000.3 1 . 1 1.30.5 0.7 0.9
L/w ratio
Figure 5.35 Test and simulation net section efficiency versus L/w ratio for Korol’s rectangular HSS connections with the long side slotted
Reproduced with permission of the copyright owner. Further reproduction prohibited without permission.

CHAPTER 6 PARAMETRIC STUDY
In chapter 5, finite element models for slotted tension square and rectangular HSS
were developed and validated. The good agreement between test and predicted peak load
shows that finite element analyses can be used to predict the strength o f a slotted HSS
connection. Based on these models, a finite element analyses parametric study is carried
out to investigate effects o f various parameters on the strength of HSS connections. Both
HSS connections with and without end welding are examined in the study. Results of this
parametric study are used in developing guidelines for designing an economical
full-strength HSS connection, and to provide recommendations on improving the
provisions for shear lag on slotted HSS connections in design standards.
6.1 Parameters considered in the parametric study
Previous studies have shown that geometrical parameters such as weld length (in
terms of weld length ratio, L/w), gusset plate thickness, size of slot opening and slot
orientation (in terms o f aspect ratio, a/b) could affect the strength o f HSS connections.
Thus, in addition to these parameters, weld height, size factor and HSS wall thickness are
investigated in this study. The parametric study is carried out on one parameter at a time,
while other parameters are held constant. The baseline model for the parametric study is
HSS 89 x 89 x 4.8 with 12 mm thick gusset plate and 6 mm fillet weld. For models
without end welding, the baseline model has a straight segment length (GS) o f 5 mm at the
slot opening. Figure 6.1 shows the straight segment o f the opening (GS) with respect to
the overall opening. Since the weld length ratio (L/w) has been identified as the most
129
Reproduced with permission of the copyright owner. Further reproduction prohibited without permission.
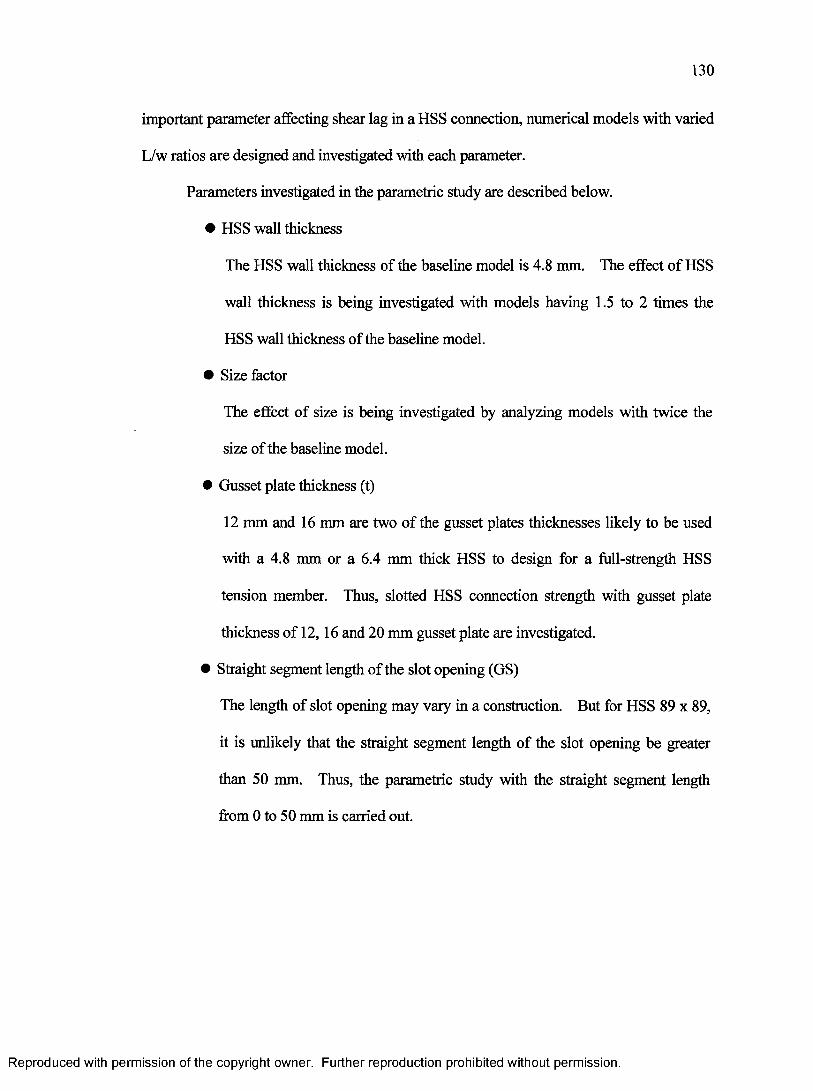
130
important parameter affecting shear lag in a HSS connection, numerical models with varied
L/w ratios are designed and investigated with each parameter.
Parameters investigated in the parametric study are described below.
• HSS wall thickness
The HSS wall thickness of the baseline model is 4.8 mm. The effect o f HSS
wall thickness is being investigated with models having 1.5 to 2 times the
HSS wall thickness o f the baseline model.
• Size factor
The effect o f size is being investigated by analyzing models with twice the
size of the baseline model.
• Gusset plate thickness (t)
12 mm and 16 mm are two of the gusset plates thicknesses likely to be used
with a 4.8 mm or a 6.4 mm thick HSS to design for a full-strength HSS
tension member. Thus, slotted HSS connection strength with gusset plate
thickness o f 12,16 and 20 mm gusset plate are investigated.
• Straight segment length of the slot opening (GS)
The length of slot opening may vary in a construction. But for HSS 89 x 89,
it is unlikely that the straight segment length o f the slot opening be greater
than 50 mm. Thus, the parametric study with the straight segment length
from 0 to 50 mm is carried out.
Reproduced with permission of the copyright owner. Further reproduction prohibited without permission.
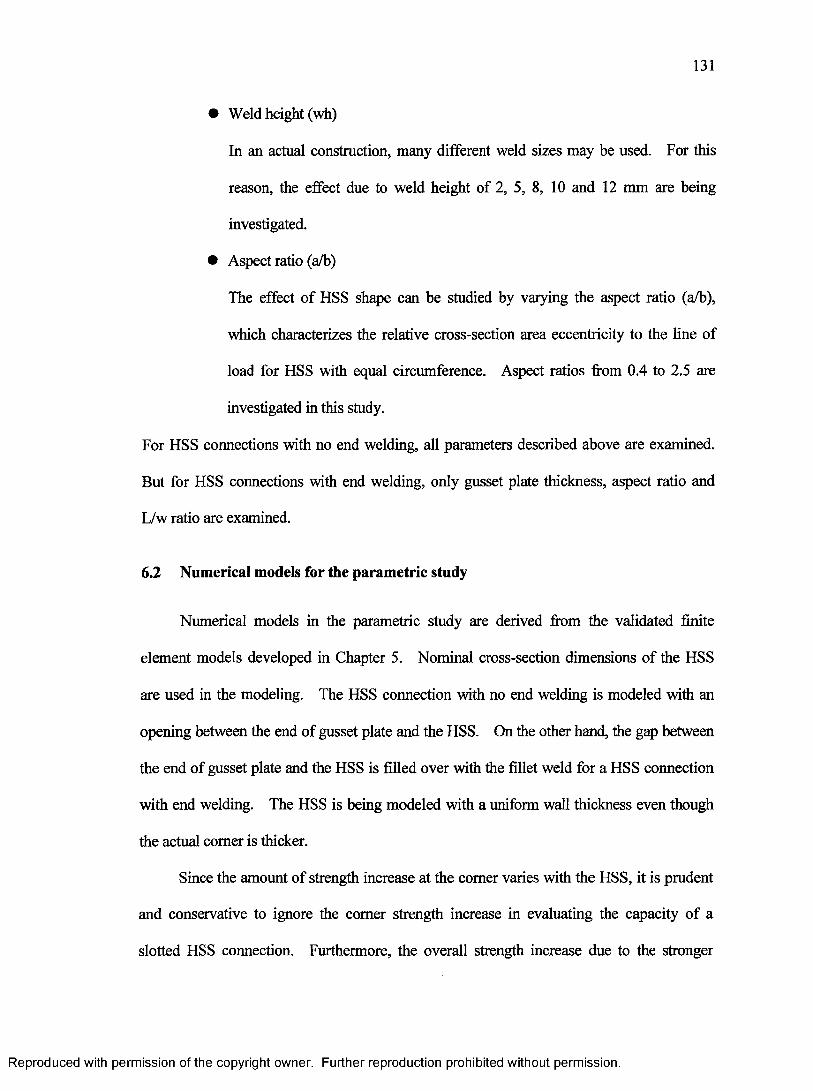
131
• Weld height (wh)
In an actual construction, many different weld sizes may be used. For this
reason, the effect due to weld height of 2, 5, 8, 10 and 12 mm are being
investigated.
• Aspect ratio (a/b)
The effect o f HSS shape can be studied by varying the aspect ratio (a/b),
which characterizes the relative cross-section area eccentricity to the line of
load for HSS with equal circumference. Aspect ratios from 0.4 to 2.5 are
investigated in this study.
For HSS connections with no end welding, all parameters described above are examined.
But for HSS connections with end welding, only gusset plate thickness, aspect ratio and
L/w ratio are examined.
6.2 Numerical models for the parametric study
Numerical models in the parametric study are derived from the validated finite
element models developed in Chapter 5. Nominal cross-section dimensions o f the HSS
are used in the modeling. The HSS connection with no end welding is modeled with an
opening between the end o f gusset plate and the HSS. On the other hand, the gap between
the end of gusset plate and the HSS is filled over with the fillet weld for a HSS connection
with end welding. The HSS is being modeled with a uniform wall thickness even though
the actual comer is thicker.
Since the amount o f strength increase at the comer varies with the HSS, it is prudent
and conservative to ignore the comer strength increase in evaluating the capacity o f a
slotted HSS connection. Furthermore, the overall strength increase due to the stronger
Reproduced with permission of the copyright owner. Further reproduction prohibited without permission.

132
comer for square HSS specimens is only about 4% in this study. Material properties from
specimens in the testing program are used in the parametric study. All square HSS
connections are modeled with phase 1 HSS 89 x 89 material properties and all rectangular
HSS specimens are modeled with HSS 127 x 51 material properties. The exception is in
the study on the effect o f the aspect ratio (a/b). In the study on the aspect ratio, all HSS
specimens without end welding are modeled with HSS 127 x 51 material properties and all
HSS specimens with end welding are modeled with phase 1 HSS 89 x 89 material
properties. As noted in Section 5.2.5, material properties have little effect on the net
section efficiency. Thus, using two separate materials for with and without end welding
models will not affect results o f the aspect ratio study. A simulation is terminated when
the equivalent plastic strain limit o f 0.9 is reached in any part o f the model.
Finite element models for the investigation of each parameter are collected in one
group. The model configurations for each group of numerical models and results o f the
simulations are listed in Tables 6.1 to 6.7 for HSS connections with no end welding and in
Tables 6.8 to 6.10 for HSS connections with end welding.
6.3 Discussion of the parametric study results
Results o f the parametric study are discussed separately for HSS connections with
end welding and without end welding. The discussion will be based on the net section
efficiency o f the connection. To facilitate the discussion, the following terms are used.
The ultimate load capacity o f the numerical model is defined as
Pu.calc = FuAn » (6-1)
Reproduced with permission of the copyright owner. Further reproduction prohibited without permission.
133
where Fu is the ultimate tensile strength of the flat part o f HSS. For HSS connections with
no end welding, A„ is the net cross-section area (excluding the area o f slot opening), and
for HSS connections with end welding, An is the gross cross-section area. The predicted
net section efficiency by the numerical model is defined as
u . = £ = ! - , (6.2)u _ c a lc
where P u _ p r e d is the peak load predicted by the finite element model. In order to remove
the influence o f the weld length ratio when discussing the effect o f each parameter, the
predicted net section efficiency is sometimes normalized with respect to that o f the baseline
model. The normalized efficiency is defined as
U , _ = ^ p , (6.3)b a se
where Ubase is the predicted net section efficiency of the baseline model and Uparam is the
predicted net section efficiency of the other model.
6.3.1 Parametric study for HSS connections with no end welding
The discussion o f the results of the parametric study is grouped into HSS wall
thickness, size factor, gusset plate thickness, straight segment length o f the slot opening,
weld height, aspect ratio and weld length ratio.
6.3.1.1 HSS wall thickness
Numerical models with different HSS wall thicknesses are studied. HSS wall
thickness o f the baseline model is increased by 1.5 and 2.0 times in the parametric study.
The model configurations and results of the simulations are shown in Table 6.1. Figure
Reproduced with permission of the copyright owner. Further reproduction prohibited without permission.
134
6.2 shows the normalized efficiency versus L/w ratio for different HSS wall thicknesses.
It can be seen that the normalized efficiencies are close to 1, which suggests that the HSS
wall thickness has little effect on the net section efficiency. Therefore, the net section
efficiency for the baseline model can be applied to other HSS wall thicknesses.
6.3.1.2 Size factor
Numerical models with twice the size o f the baseline model are used in studying
the effect o f scaling. Every dimension o f the baseline model is doubled in the scaled-up
model. Table 6.2 shows the relative dimension of both models and results o f the
simulations. Again, the net section efficiency of the scaled-up model is normalized with
respect to that of the baseline model. Figure 6.3 shows L/w ratio versus normalized
efficiency, which is close to 1. This shows that scaling the dimension of HSS connection
proportionally has little effect on the net section efficiency of the HSS connection. Thus,
the predicted net section efficiency by the baseline model can be extended to other HSS
connections with a similar geometric proportion.
6.3.1.3 Gusset plate thickness (t)
Other than 12 mm gusset plate in the baseline model, models with two other
gusset plate thicknesses o f 16 and 20 mm are also investigated. Finite element models
and results o f the simulations for different gusset plate thickness are shown in Table 6.3.
The predicted net section efficiency for each o f the model with 16 or 20 mm gusset plate is
normalized with respect to that of the baseline model. The normalized efficiency versus
L/w ratio is shown in Figure 6.4. In Figure 6.4, the normalized efficiency with a gusset
Reproduced with permission of the copyright owner. Further reproduction prohibited without permission.

135
plate thicker than 12 mm are found to be slightly greater than 1. The difference is within
1% for the 16 mm gusset plate and within 1.5% for the 20 mm gusset plate when the weld
length ratio is less than 0.75.
As the gusset plate thickness increases, the ratio of the eccentricity from the face
o f the gusset plate over the distance between the welds (w) o f the outstanding HSS
cross-section area reduces. Thus in general, for the same weld length ratio (L/w), a model
with a thicker gusset plate have a slightly better efficiency than that with a thinner gusset
plate. However, this difference is small for the range of gusset plate thickness that is to be
used with the size o f HSS in this study. Therefore for practical purposes, the effect o f the
gusset plate thickness on the net section efficiency can be ignored.
6.3.1.4 Straight segment length of the slot-opening (GS)
In the baseline model, the straight segment length of the slot opening is 5 mm. In
the parametric study, straight segment lengths from 0 to 50 mm are being considered.
This is the practical range of the slot opening size that is likely to be used in practice with
the size of HSS in the study. The model configurations and results o f the simulations are
listed in Table 6.4. Figure 6.5 shows the net section efficiency versus the straight segment
length plot for different L/w ratios. The numerical value of the group number is the weld
length ratio in percentage. It can be seen that for every L/w ratio, the 0 and 2 mm straight
segment length models have net section efficiencies consistently lower than those with
longer straight segment lengths by about 2% to 3%. It should be noted that even with a
large weld length ratio (L/w) of 1.25 and 1.5, the net section efficiency of a 0 or 2 mm
Reproduced with permission of the copyright owner. Further reproduction prohibited without permission.
136
straight segment length model still does not improve to the level for models with longer
opening length.
The failure of the connection with no end welding occurs at the slot opening
region due to stress concentration (strain localization). Thus, the ability of a connection to
utilize the outstanding cross-section area of the HSS is dependant on the deformation limit
of the HSS at the slot opening. It requires a larger deformation to induce the same strain if
a point is further away. In this study, 0 and 2 mm straight segment lengths are not
sufficiently long to provide the deformation required to allow the net section area to be
fully utilized before failure occurs.
For a short straight segment length specimen, one possible way to improve the net
section efficiency is to extend the fillet weld by 5 mm beyond the end of the gusset plate.
For the case with 0 mm straight segment length, the additional 5 mm weld extends the
weld into a section that has a bigger net section area, thus improving the load carrying
capacity o f the connection. Results o f the analyses with an extended 5 mm weld length
for 0 mm straight segment length models are also plotted in Figure 6.5. There is an
improvement in the efficiency o f about 3% with the weld extension. But mainly, this
extension allows the connection with 0 mm straight segment length to achieve the same
maximum efficiency as those with longer straight segment lengths. For this reason, the
ratio o f straight segment length to the distance between welds (GS/w) should be
maintained at 1/40 based on results o f 5 mm straight segment length o f the slot opening in
the parametric study or the weld length should be extended by 5 mm beyond the end of
the gusset plate for a slotted HSS connection with no end welding. For HSS of different
sizes, this requirement can be scaled proportionally.
Reproduced with permission of the copyright owner. Further reproduction prohibited without permission.

137
6.3.1.5 Weld height (wh)
The weld height of the baseline model is 6 mm. Since other weld heights may be
used in the connection, weld heights o f 2, 5, 8, 10 and 12 mm are also investigated.
Results o f simulations and models for studying the effect of weld height are listed in
Table 6.5.
Figure 6.6 shows the weld height versus net section efficiency plot for different
L/w ratios. The numerical number in the legend denotes the weld length ratio in
percentage. It can be seen that at low L/w ratios, the net section efficiency increases with
the weld height. But when the L/w ratio is greater than 1, there is little change in the net
section efficiency with the weld height larger than 2 mm. A larger weld height is able to
even out the stress concentration at the slot opening over a wider area, and effectively
reduces its effect. At a low L/w ratio, the stress concentration is high. Thus, a larger
weld height reduces the stress concentration and delays the failure so that a higher overall
cross-section strength can be attained. However, the stress concentration is low when the
L/w ratio is high. Thus a small weld height together with a high L/w ratio can still
achieved the full net section area utilization before the failure occurs. Figure 6.6 shows
that the maximum strength of the HSS connection can still be achieved at a L/w ratio o f 1.0
with the weld height greater than 5 mm. This suggests that the net section efficiency is
not affected by the weld height when the L/w ratio is greater than 1 as long as the required
minimum fillet weld height is provided. Although the efficiency reduces with the weld
height, a 6 mm fillet weld is selected for the baseline model rather than a smaller weld in
order to represent a weld height that is likely to be used with HSS 89 x 89 x 4.8. A 6 mm
fillet weld has the effective throat width that is close to the HSS wall thickness. The net
Reproduced with permission of the copyright owner. Further reproduction prohibited without permission.
138
section efficiency difference between 5 mm and 6 mm fillet weld models is only bout 0.02
when the weld length ratio is less than 0.75.
6.3.1.6 Aspect ratio (a/b)
The definition o f parameters a and b are shown in Figure 3.2. Parameter a is the
dimension o f the side to which the gusset plate is connected to or the side HSS is slotted,
and parameter b is the other side of the HSS. The aspect ratio (a/b) characterizes the
relative cross-section area eccentricity with respect to the line o f load for HSS with equal
circumference. For example, a low aspect ratio (a/b) suggests that the tributary net section
area o f the HSS is closer to the gusset plate than that with a high aspect ratio. In other
words, an aspect ratio (a/b) less than 1 corresponds to the configuration with the gusset
plate connected to the short side o f the rectangular HSS and the aspect ratio (a/b) greater
than 1 corresponds to the configuration with the gusset plate connected to its long side. In
this study, three shapes o f HSS 89 x 89 x 4.8, HSS 125 x 51x 4.8 and HSS 102 x 76 x 4.8
are modeled. Aspect ratios (a/b) o f 0.4, 0.75, 1.0, 1.34 and 2.5 are investigated by
connecting the gusset plate to either the long or short side o f the rectangular HSS.
Figure 6.7 shows the aspect ratio (a/b) versus net section efficiency plot for
different L/w ratios. The numerical number in the legend denotes the weld length ratio in
percentage. Results o f the simulations and model configuration are listed in Table 6.6.
To facilitate the discussion, the simulation results are sorted into three groups in accordance
to the L/w ratio. The first group is for L/w ratios o f 1.0 and above, the second group is for
L/w ratios of 0.6, 0.75 and 0.85 and the third group is for a L/w ratio o f 0.4. It can be seen
that for models in each group, the net section efficiency decreases as the a/b ratio increases,
Reproduced with permission of the copyright owner. Further reproduction prohibited without permission.

139
but the descending rate o f the net section efficiency is not uniform. The rate o f the net
section efficiency reduction is higher between the ratios of 0.4 to 1.34 than when ratio is
greater than 1.34. This suggests that a higher net section efficiency can be obtained with a
lower cross-section area eccentricity o f the HSS connection.
It can be explained by looking at the effectiveness of the constraint provided by
gusset plate against the transverse contraction of the HSS section for different aspect ratios.
When the HSS is loaded in tension, the cross-section contracts due to Poisson’s effect.
But as can be seen in Figure 6.8, the contraction of the unconnected sides o f HSS is
restrained by the gusset plate through bending of the connected side. This constraining
effect generates transverse tension stress that increases the effective stiffness and strength
o f the unconnected side, and the overall connection strength. Since the bending stiffness
increases as the connected side decreases in length, a connection with a lower aspect ratio
has a higher bending stiffness with its shorter connected side than the one with a higher
aspect ratio. For this reason, the reduction in the aspect ratio increases the bending
stiffness and the net section efficiency. Consequently, the net section efficiency increases
when the aspect ratio decreases below 1.34. When the gusset plate is connected to the
long side of the HSS, for a/b ratios such as 1.34 and 2.5, the unconnected side is further
away from the gusset plate. Therefore, the net section efficiency for models with a/b
ratios o f 1.34 and 2.5 are lower. Furthermore, a connection with a higher aspect ratio also
has a higher net section eccentricity. This generates a higher stress concentration at the
slotted end and reduces the strength of the connection.
As can be seen in Figure 6.7, the rate o f efficiency reduction is lower when the
weld length ratio is above 1.0 or at 0.4. For these weld length ratio ranges, there is little
Reproduced with permission of the copyright owner. Further reproduction prohibited without permission.
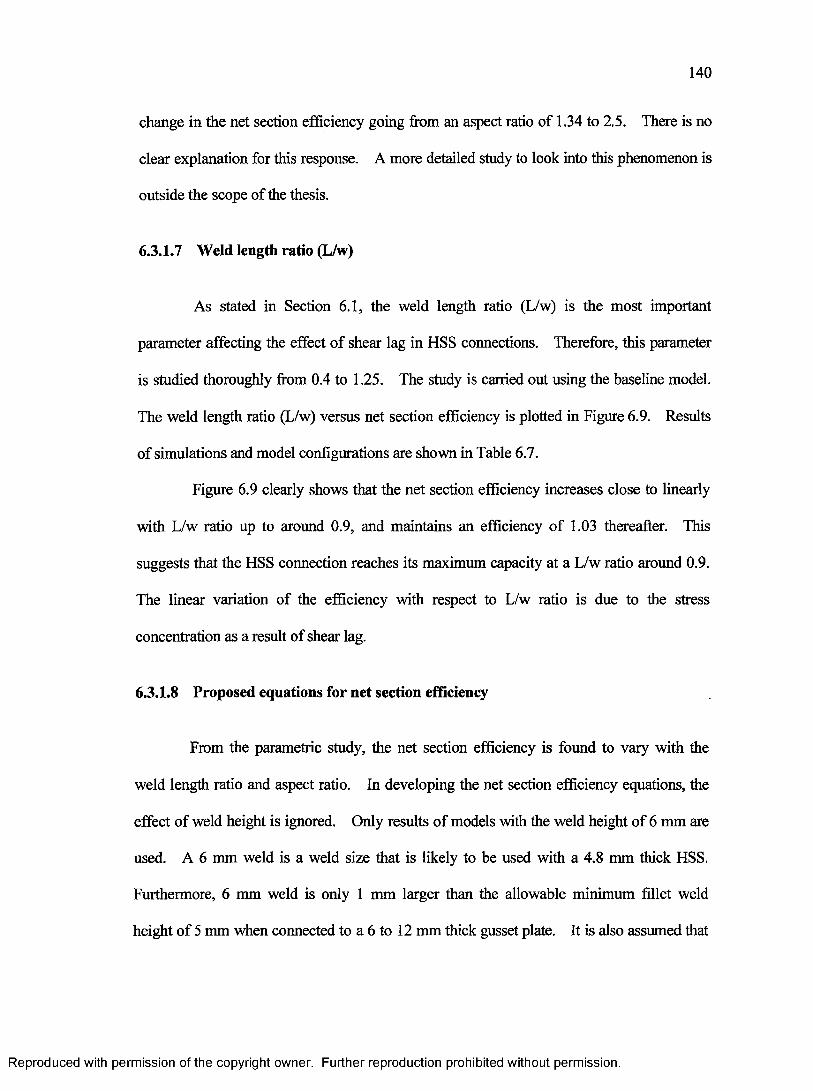
140
change in the net section efficiency going from an aspect ratio of 1.34 to 2.5. There is no
clear explanation for this response. A more detailed study to look into this phenomenon is
outside the scope of the thesis.
6.3.1.7 Weld length ratio (L/w)
As stated in Section 6.1, the weld length ratio (L/w) is the most important
parameter affecting the effect o f shear lag in HSS connections. Therefore, this parameter
is studied thoroughly from 0.4 to 1.25. The study is carried out using the baseline model.
The weld length ratio (L/w) versus net section efficiency is plotted in Figure 6.9. Results
o f simulations and model configurations are shown in Table 6.7.
Figure 6.9 clearly shows that the net section efficiency increases close to linearly
with L/w ratio up to around 0.9, and maintains an efficiency o f 1.03 thereafter. This
suggests that the HSS connection reaches its maximum capacity at a L/w ratio around 0.9.
The linear variation o f the efficiency with respect to L/w ratio is due to the stress
concentration as a result of shear lag.
6.3.1.8 Proposed equations for net section efficiency
From the parametric study, the net section efficiency is found to vary with the
weld length ratio and aspect ratio. In developing the net section efficiency equations, the
effect of weld height is ignored. Only results o f models with the weld height o f 6 mm are
used. A 6 mm weld is a weld size that is likely to be used with a 4.8 mm thick HSS.
Furthermore, 6 mm weld is only 1 mm larger than the allowable minimum fillet weld
height o f 5 mm when connected to a 6 to 12 mm thick gusset plate. It is also assumed that
Reproduced with permission of the copyright owner. Further reproduction prohibited without permission.
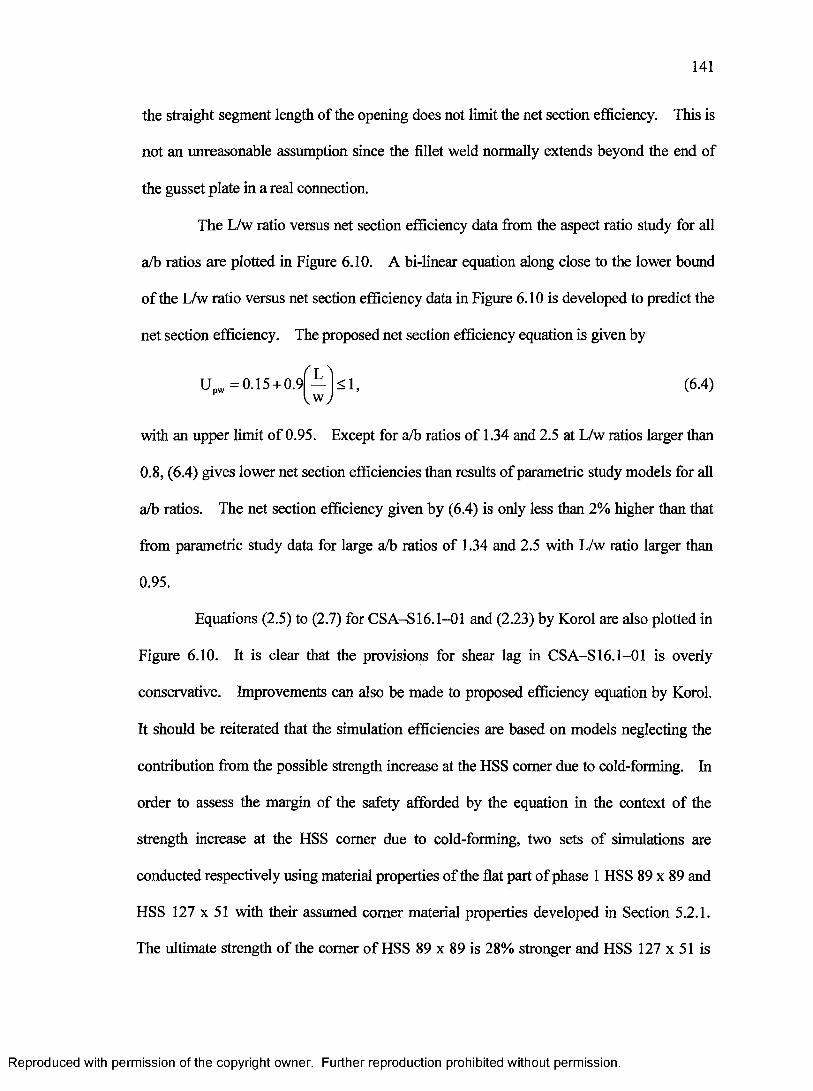
141
the straight segment length of the opening does not limit the net section efficiency. This is
not an unreasonable assumption since the fillet weld normally extends beyond the end of
the gusset plate in a real connection.
The L/w ratio versus net section efficiency data from the aspect ratio study for all
with an upper limit o f 0.95. Except for a/b ratios o f 1.34 and 2.5 at L/w ratios larger than
0.8, (6.4) gives lower net section efficiencies than results o f parametric study models for all
a/b ratios. The net section efficiency given by (6.4) is only less than 2% higher than that
from parametric study data for large a/b ratios o f 1.34 and 2.5 with L/w ratio larger than
Equations (2.5) to (2.7) for CSA-S16.1-01 and (2.23) by Korol are also plotted in
Figure 6.10. It is clear that the provisions for shear lag in CSA-S16.1-01 is overly
conservative. Improvements can also be made to proposed efficiency equation by Korol.
It should be reiterated that the simulation efficiencies are based on models neglecting the
contribution from the possible strength increase at the HSS comer due to cold-forming. In
order to assess the margin of the safety afforded by the equation in the context o f the
strength increase at the HSS comer due to cold-forming, two sets o f simulations are
conducted respectively using material properties o f the flat part o f phase 1 HSS 89 x 89 and
HSS 127 x 51 with their assumed comer material properties developed in Section 5.2.1.
The ultimate strength of the comer o f HSS 89 x 89 is 28% stronger and HSS 127 x 51 is
a/b ratios are plotted in Figure 6.10. A bi-linear equation along close to the lower bound
o f the L/w ratio versus net section efficiency data in Figure 6.10 is developed to predict the
net section efficiency. The proposed net section efficiency equation is given by
(6.4)
0.95.
Reproduced with permission of the copyright owner. Further reproduction prohibited without permission.

142
75% stronger than their corresponding flat parts. Results o f these simulations are in
Appendix F and are also plotted in Figures 6.11 and 6.12. It can be seen (6.4) is
conservative even for a connection with only 28% strength increase in the HSS comer
compared to its flat part.
Previous studies have shown that the shear lag effect can also be characterized by
the net section eccentricity ratio (x/L). The net section eccentricity (x ) is calculated
according to (2.18) as specified by ANSI/AISC 360-05. It should be pointed out that
when a/b ratio is less than 1, the net section eccentricity (x ) calculated by (2.18) cannot
realistically characterize the cross-section area eccentricity tributary to the line o f weld.
Huang (2005) proposed that the eccentricity o f a square HSS with an equal circumferential
length be used as the lower limit. This limit is adopted when calculating the net section
eccentricity. The aspect ratio is less than 1 when HSS 127 x 51 is slotted on its short side.
For this situation, the net section eccentricity (x ) o f HSS 89 x 89 is used instead. The net
section eccentricity for each o f the HSS in the study is listed in the Appendix G.
The net section efficiency versus net section eccentricity ratio (x /L ) data for all
a/b ratios are plotted in Figure 6.13. It can be seen that the net section efficiency
decreases with an increase in x/L. A bi-linear equation is developed to define the net
section efficiency with respect to the net section eccentricity ratio. The proposed equation
models studied except for large a/b ratios o f 1.34 and 2.5 at a x /L ratio less than 0.2.
Similar to (6.4), the net section efficiency given by (6.5) is also only less than 2% higher
is given by
(6.5)
with an upper limit o f 1. Figure 6.13 shows the proposed equation is conservative for all
Reproduced with permission of the copyright owner. Further reproduction prohibited without permission.
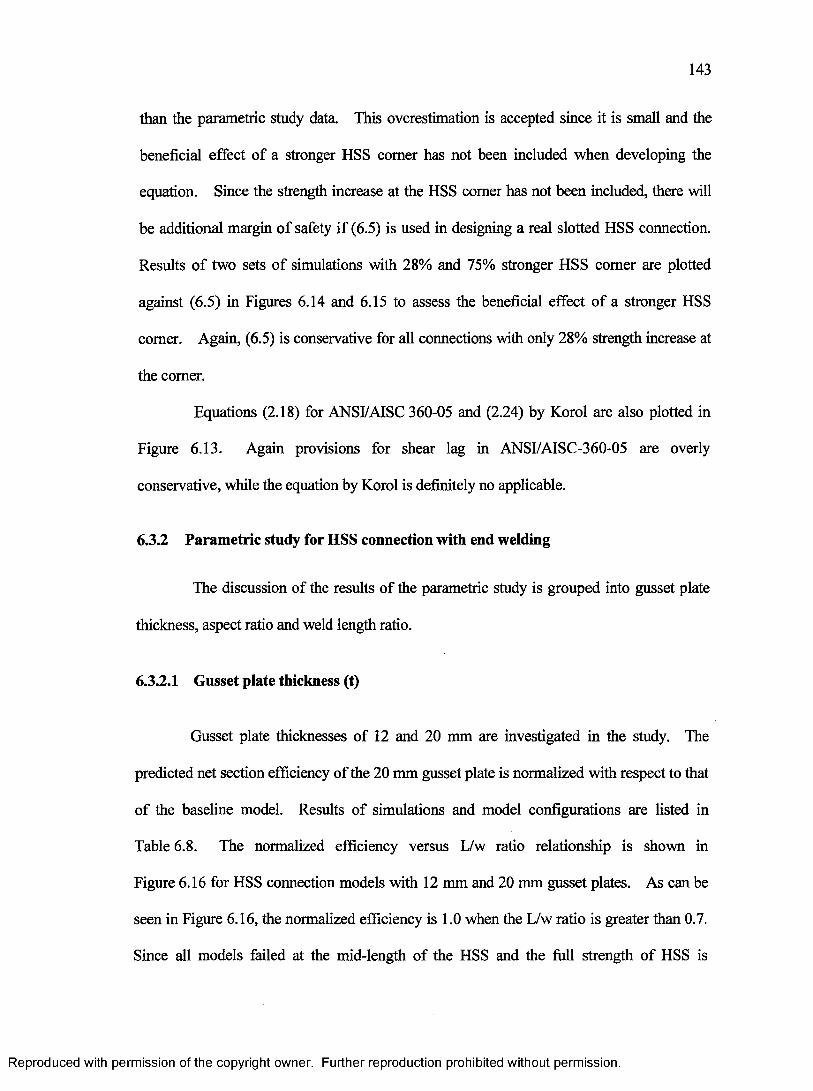
143
than the parametric study data. This overestimation is accepted since it is small and the
beneficial effect of a stronger HSS comer has not been included when developing the
equation. Since the strength increase at the HSS comer has not been included, there will
be additional margin o f safety if (6.5) is used in designing a real slotted HSS connection.
Results o f two sets o f simulations with 28% and 75% stronger HSS comer are plotted
against (6.5) in Figures 6.14 and 6.15 to assess the beneficial effect o f a stronger HSS
comer. Again, (6.5) is conservative for all connections with only 28% strength increase at
the comer.
Equations (2.18) for ANSI/AISC 360-05 and (2.24) by Korol are also plotted in
Figure 6.13. Again provisions for shear lag in ANSI/AISC-360-05 are overly
conservative, while the equation by Korol is definitely no applicable.
6.3.2 Parametric study for HSS connection with end welding
The discussion of the results o f the parametric study is grouped into gusset plate
thickness, aspect ratio and weld length ratio.
6.3.2.1 Gusset plate thickness (t)
Gusset plate thicknesses of 12 and 20 mm are investigated in the study. The
predicted net section efficiency of the 20 mm gusset plate is normalized with respect to that
o f the baseline model. Results of simulations and model configurations are listed in
Table 6.8. The normalized efficiency versus L/w ratio relationship is shown in
Figure 6.16 for HSS connection models with 12 mm and 20 mm gusset plates. As can be
seen in Figure 6.16, the normalized efficiency is 1.0 when the L/w ratio is greater than 0.7.
Since all models failed at the mid-length o f the HSS and the full strength o f HSS is
Reproduced with permission of the copyright owner. Further reproduction prohibited without permission.
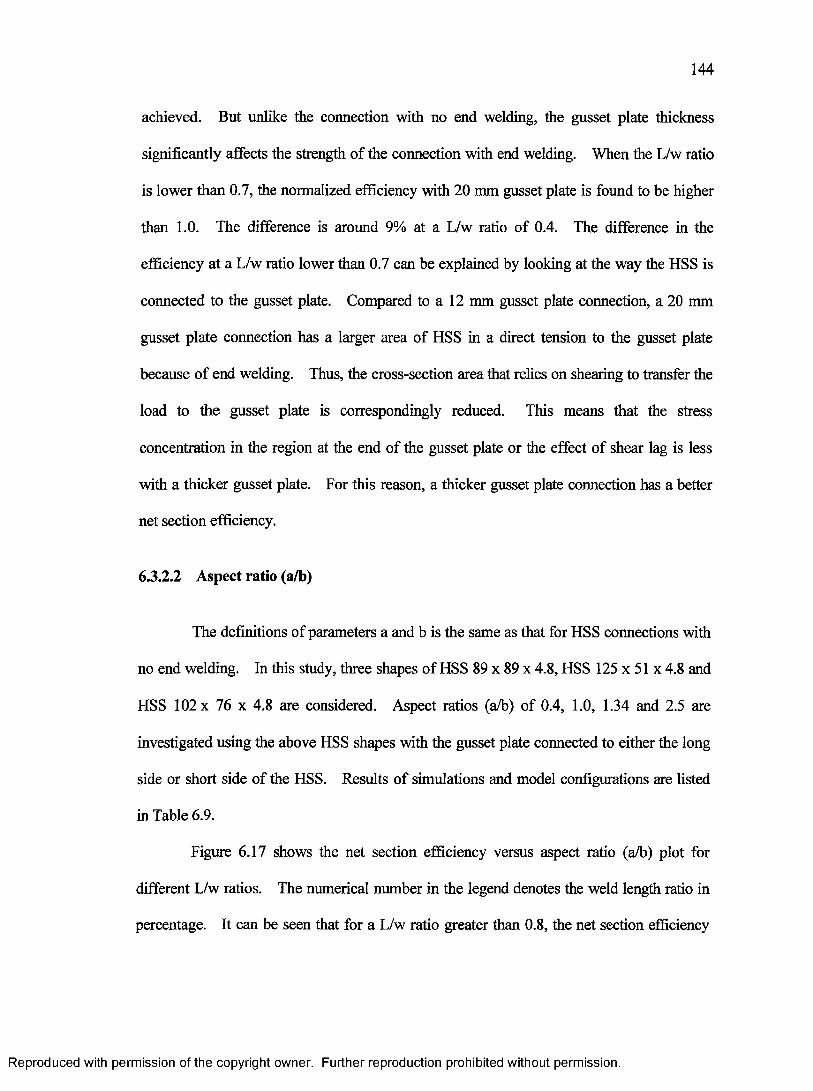
144
achieved. But unlike the connection with no end welding, the gusset plate thickness
significantly affects the strength o f the connection with end welding. When the L/w ratio
is lower than 0.7, the normalized efficiency with 20 mm gusset plate is found to be higher
than 1.0. The difference is around 9 % at a L/w ratio of 0.4. The difference in the
efficiency at a L/w ratio lower than 0.7 can be explained by looking at the way the HSS is
connected to the gusset plate. Compared to a 12 mm gusset plate connection, a 20 mm
gusset plate connection has a larger area of HSS in a direct tension to the gusset plate
because o f end welding. Thus, the cross-section area that relies on shearing to transfer the
load to the gusset plate is correspondingly reduced. This means that the stress
concentration in the region at the end o f the gusset plate or the effect o f shear lag is less
with a thicker gusset plate. For this reason, a thicker gusset plate connection has a better
net section efficiency.
6.3.2.2 Aspect ratio (a/b)
The definitions o f parameters a and b is the same as that for HSS connections with
no end welding. In this study, three shapes of HSS 89 x 89 x 4.8, HSS 125 x 51 x 4.8 and
HSS 102 x 76 x 4.8 are considered. Aspect ratios (a/b) of 0.4, 1.0, 1.34 and 2.5 are
investigated using the above HSS shapes with the gusset plate connected to either the long
side or short side o f the HSS. Results o f simulations and model configurations are listed
in Table 6.9.
Figure 6.17 shows the net section efficiency versus aspect ratio (a/b) plot for
different L/w ratios. The numerical number in the legend denotes the weld length ratio in
percentage. It can be seen that for a L/w ratio greater than 0.8, the net section efficiency
Reproduced with permission of the copyright owner. Further reproduction prohibited without permission.

145
o f 1.0 is achieved for all a/b ratios because failure occurs at the mid-length o f HSS. This
suggests that a HSS connection with end welding achieves its full strength for all a/b ratios
when the L/w ratio is larger than 0.8. Similar to the connection with no end welding, a
higher a/b ratio signifies a higher net section eccentricity, which implies that a greater stress
concentration is induced in the region at the end of gusset plate. Thus, the net section
efficiency reduces with the increase in the aspect ratio.
6.3.2.3 Weld length ratio (L/w)
Weld length ratios (L/w) of 0.4, 0.55, 0.65, 0.7, 0.75, 1.0 and 1.1 are investigated
for the baseline model using HSS 89 x 89 x 4.8 with end welding. The net section
efficiency versus weld length ratio (L/w) is plotted in Figure 6.18. Results o f simulations
and model configurations are listed in Table 6.10. Similar to the connection with no end
welding, the net section efficiency can be represented by a bi-linear equation. The net
section efficiency increases close to linearly up to around 0.7, and reaches a constant
efficiency of 1 thereafter. This suggests that the connection achieves its full strength at a
L/w ratio of 0.7.
In general, the connection with end welding achieves a better net section
efficiency compared to that without end welding for an equal weld length ratio. The
reason being that with end welding, the stress concentration is evened out over a wider area,
thus the intensity o f stress concentration is reduced. In addition, there is the beneficial
effect o f having a part o f HSS is connected to the gusset plate in tension. As a result, the
connection with end welding has a better efficiency. The maximum efficiency is achieved
at a L/w ratio o f 0.7 for the connection with end welding and 0.9 for the one without. It
Reproduced with permission of the copyright owner. Further reproduction prohibited without permission.
146
should be noted that although the maximum net section efficiency of a connection with no
end welding can be greater than 1.0, its actual capacity is always less than that with end
welding for the same weld length ratio.
6.3.2.4 Comparison to the proposed net section efficiency equation
Results o f the connections with end welding from the aspect ratio study are plotted
in Figure 6.19 against (6.4), the proposed net section efficiency equation in Section 6.3.1.8.
Simulations with an assumed 28% stronger comer for phase 1 HSS 89 x 89 material
properties developed in Section 5.2.1 are also conducted. Results o f these simulations are
listed in Appendix F and plotted in Figure 6.20 against the proposed net section efficiency.
It can be seen that in both figures, the proposed net section efficiency is valid for a slotted
HSS connection with end welding, although it is rather conservative.
6.4 Net section efficiency based on outstanding area
In a connection with end welding, the part o f HSS that is immediately behind the
gusset plate and the fillet weld in the longitudinal direction is under direct tension, while
the other outstanding part o f HSS relies on shearing to transfer the load. However the
ultimate strength (P u calc) o f the finite element model, as defined by (6.1), is calculated
based on overall net section area An. Thus, (6.1) does not correctly reflect the load
transfer mechanism on different parts o f the HSS for a slotted connection with end welding.
Since the part o f HSS immediately behind the gusset plate and the fillet weld is in direct
tension, this part of HSS can be ignored in calculating the net section efficiency due to
shear lag. Thus, the ultimate strength o f the outstanding part of HSS for the model can be
Reproduced with permission of the copyright owner. Further reproduction prohibited without permission.
147
defined as
Pu.outsd = FuAn - Fu Ad, and (6.6)
A d = 2(W, + 2w h)t', with end welding or (6.7)
A d = 4(w h)t', with no end welding, (6.8)
where Fu is the ultimate tensile strength of the flat part of HSS, An is the net section area,
Ad is part o f the cross-section area under direct tension, Wt is the width o f the gusset plate,
where Pu_pred is the peak load predicted by the numerical model. It is assumed that the
between the welds (w) is taken as the circumferential distance from the toe of the weld
along the centreline o f the outstanding part.
The net section efficiency versus weld length ratio relationships from parametric
study for 12 mm and 20 mm gusset plates in sections 6.3.1.3 and 6.3.2.1 are plotted in
Figure 6.21. The net section efficiency of outstanding HSS versus outstanding part L/w
ratio is plotted in Figure 6.22. All the results are based on HSS 89 x 89 x 4.8 models
consist entirely of the material properties o f the flat part o f HSS. It can be seen that there
is a better correlation between net section efficiency and the weld length ratio in Figure
6.22 compared to Figure 6.21. There is slight improvement for connections with no end
welding, but a significant improvement can be observed for connections with end welding.
Overall, there is an improvement in characterizing the net section efficiency with L/w ratio
wh is the height o f the weld and t’ is the wall thickness of HSS. The predicted net section
efficiency for the outstanding part can be defined as
(6.9)
ultimate strength of the material is developed for the part in direct tension. The distance
Reproduced with permission of the copyright owner. Further reproduction prohibited without permission.
148
using (6.9). For example, at a L/w ratio of 0.6, the difference in the net section efficiency
between 12 and 20 mm gusset plate connections with end welding reduces from 0.096 to
almost zero by considering just the outstanding HSS section area. Similarly at the L/w
ratio o f 0.6, the difference in the net section efficiency for 12 mm gusset plate connections
with and without end welding reduces from 13% to 9%. Figures 6.23 and 6.24 also show
results o f the net section efficiency calculated using both (6.2) and (6.9) for different weld
heights from Section 6.3.1.5 of the parametric study for a connection with no end welding.
Again, it can be seen that there is a better correlation when the efficiency calculation is
based on the outstanding HSS section area alone.
Even though the shear lag effect on the net section efficiency can be better
characterized by the weld length ratio when applied to the outstanding part of the HSS
alone, using the distance between welds from the face o f the gusset plate or the centerline
o f the gusset plate thickness is still preferred for the ease o f its application when designing.
However, (6.6) to (6.9) may be used in conjunction with (6.4) to estimate a more precise
net section efficiency. It should be noted that the baseline model used in developing the
proposed efficiency equation has a 12 mm gusset plate and a 6 mm weld height.
6.5 Guidelines to Design Full-Strength Slotted HSS Members
One of the objectives o f this thesis is to develop guidelines for designing an
economical full-strength square or rectangular HSS connection. Results of the parametric
study are used in developing the following guidelines.
In order to develop the full strength o f the member according to CSA-S16.1-01, the
limit state should be governed by the gross section yielding rather than the net section
fracture. In other words, the connection should be designed with the net section fracture
Reproduced with permission of the copyright owner. Further reproduction prohibited without permission.

149
strength being greater than its gross section yielding strength. This can be achieved by
ensuring that
0.85AneFu > A gFy, (6.10)
where Fy is the yield strength, A ne is the effective net cross-section area, Fu is the ultimate
strength and Ag is the gross cross-section area. The effective net section area (A ne) is
given by
A ne = U„An, (6.11)
the product o f the net section efficiency (U„) and net section area (An). Thus (6.10) can be
rearranged into
A IT A F= ---- I— = 0.915, (6.12)
A g Ag 0.85FU
by substituting Fy with 350 MPa and Fu with 450 MPa, the minimum nominal yield and
ultimate strength for grade 350W steel respectively. The strengths o f grade 350W steel
are substituted into (6.10) because it is the most common grade o f steel for HSS used in the
construction. Replacing Unin (6.12) with the proposed efficiency Upwin (6.4), (6.12) can
be rearranged into
( a V 1— >1.017 w
A.
vA 8,-0 .1 6 7 , (6.13)
with the limit of maximum An/Ag being 1, and the maximum net section efficiency is
achieved when L/w is 0.95. Figure 6.25 give a feasible combinations of the weld length
ratio (L/w) and the net to gross area ratio An/Agfor a full strength slotted HSS connection.
The feasible combination is above and to the right o f the equation. In essence, the
minimum An/Ag ratio is limited to 0.915 or the maximum gusset plate thickness is roughly
Reproduced with permission of the copyright owner. Further reproduction prohibited without permission.
150
limited to 4.25% of the circumference along the centerline o f HSS. However, this limit
may be increased to 6.5 % if a strength increase at the HSS comer is considered. The net
section efficiency is 1.05 at L/w o f 1.0 when a 28% strength increase at the comer is
included, as indicated in Appendix F. Another option of achieving the full strength of
HSS is by providing end welding and a ratio of L/w greater than 0.8. In parametric study,
all models with end welding and a weld length ratio greater than 0.8 fail at the mid-length
of the HSS.
The parametric study also shows that other factors such as straight segment length
o f the slot opening, weld height and aspect ratio could affect the net section efficiency of
the HSS connection. The following guidelines are recommended when designing a
full-strength HSS connection with no end welding.
a) The straight segment length o f the slot opening should be at least half of the
gusset plate thickness or the width of the slot opening. If the specified
straight segment length cannot be guaranteed, an extended fillet weld beyond
the gusset plate equals to the weld height should be provided. This is to
ensure that there is sufficient ductility at the region around the opening to
fully utilize the cross-section,
b) The weld height should be at least 1.3 times o f the HSS wall thickness and
1.7% of the HSS circumference along the centreline. This is based on the
weld height and the size o f HSS used in developing the proposed net section
efficiency equation. But this requirement can be waived if a weld length
ratio (L/w) greater than 1.0 can be provided. When the L/w ratio is greater
Reproduced with permission of the copyright owner. Further reproduction prohibited without permission.
151
than 1.0, the strength o f the HSS connection no longer varies with the weld
height.
c) I f possible, the rectangular HSS should always be slotted on its short side.
A rectangular HSS connected to its short side can have an efficiency up to
5% higher than the one connected to its long side.
Reproduced with permission of the copyright owner. Further reproduction prohibited without permission.

152
Table 6.1 Parametric study models for HSS wall thickness with no end welding
Group Model HSS
Weld length
ratio,
L/w
HSS wall
thickness,
t(mm)
Net section
efficiency,
Un
l.Ot’
W40t48 89 x 89 x 4.8 0.40 4.8 0.55W75t48 89 x 89 x 4.8 0.75 4.8 0.93
W100t48 89 x 89 x 4.8 1.00 4.8 1.01W125t48 89 x 89 x 4.8 1.25 4.8 1.02
1.5t’
W40t72 8 9 x 8 9 x 7 .2 0.40 7.2 0.55W75t72 89 x 89 x 7.2 0.75 7.2 0.93
W100t72 8 9 x 8 9 x 7 .2 1.00 7.2 1.02W125t72 89 x 89 x 7.2 1.25 7.2 1.02
2.0t’
W40t96 89 x 89 x 9.6 0.40 9.6 0.55W75t96 89 x 89 x 9.6 0.75 9.6 0.92
W100t96 89 x 89 x 9.6 1.00 9.6 1.02W125t96 89 x 89 x 9.6 1.25 9.6 1.02
Table 6.2 Parametric study models for size factor with no end welding
Group Model HSS
Weld length
ratio,
L/w
Gusset plate
thickness,
t(mm)
Opening
length,
GS (mm)
Net section
efficiency,
u„
Doubled
D40 178x 178x9.6 0.40 24 10 0.55D75 178 x 178 x 9.6 0.75 24 10 0.92
D100 178x 178x9.6 1.00 24 10 1.01B125 178 x 178 x 9.6 1.25 24 10 1.02
Baseline
B40 89 x 89 x 4.8 0.40 12 5 0.55B75 89 x 89 x 4.8 0.75 12 5 0.93
B100 89 x 89 x 4.8 1.00 12 5 1.01B125 89 x 89 x 4.8 1.25 12 5 1.02
Reproduced with permission of the copyright owner. Further reproduction prohibited without permission.
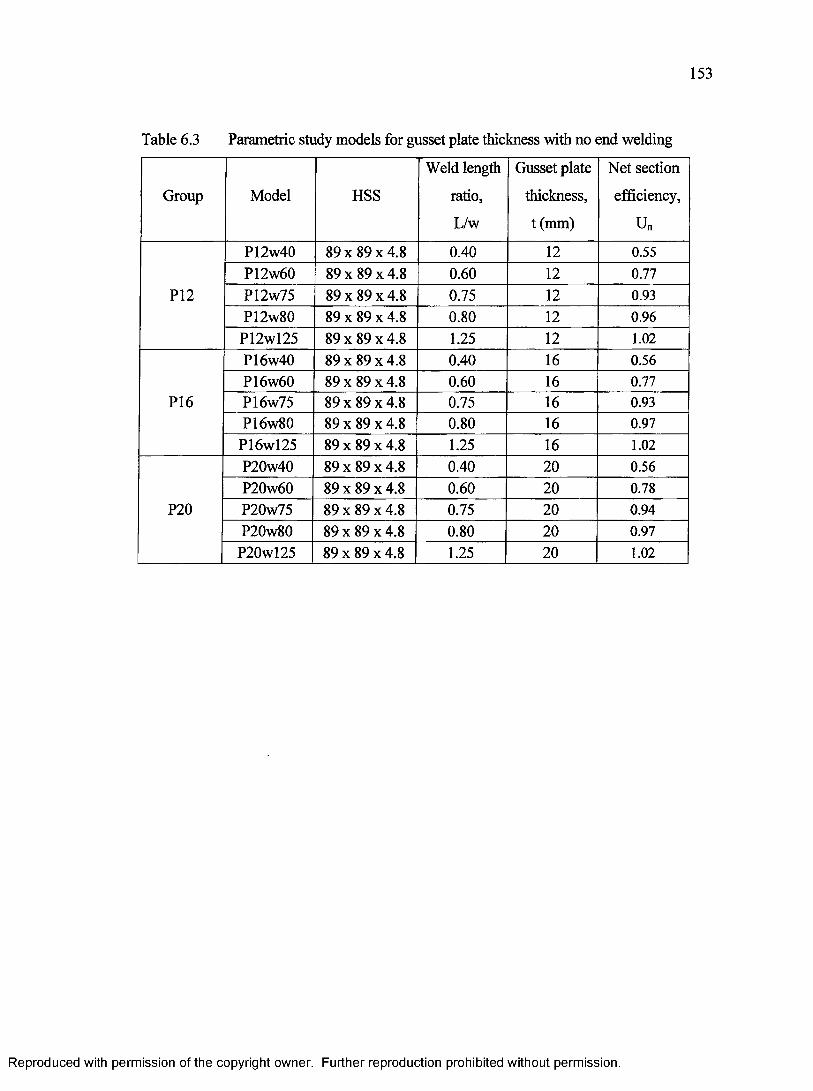
153
Table 6.3 Parametric study models for gusset plate thickness with no end welding
Group Model HSS
Weld length
ratio,
L/w
Gusset plate
thickness,
t (mm)
Net section
efficiency,
Un
P12
P12w40 89 x 89 x 4.8 0.40 12 0.55P12w60 89 x 89 x 4.8 0.60 12 0.77P12w75 89 x 89 x 4.8 0.75 12 0.93P12w80 89 x 89 x 4.8 0.80 12 0.96
P12wl25 89 x 89 x 4.8 1.25 12 1.02
P16
P16w40 89 x 89 x 4.8 0.40 16 0.56P16w60 89 x 89 x 4.8 0.60 16 0.77P16w75 89 x 89 x 4.8 0.75 16 0.93P16w80 89 x 89 x 4.8 0.80 16 0.97
P16wl25 89 x 89 x 4.8 1.25 16 1.02
P20
...
P20w40 89 x 89 x 4.8 0.40 20 0.56P20w60 89 x 89 x 4.8 0.60 20 0.78P20w75 89 x 89 x 4.8 0.75 20 0.94P20w80 89 x 89 x 4.8 0.80 20 0.97
P20wl25 89 x 89 x 4.8 1.25 20 1.02
Reproduced with permission of the copyright owner. Further reproduction prohibited without permission.

154
Table 6.4 Parametric study models for straight segment length of slot opening with no
end welding
Group Model HSS
Weld length
ratio,
L/w
Opening
length,
GS (mm)
Net section
efficiency,
u„
W40
W40s0 89 x 89 x 4.8 0.40 0 0.53W40s2 89 x 89 x 4.8 0.40 2 0.54W40s5 89 x 89 x 4.8 0.40 5 0.55
W 40sl0 89 x 89 x 4.8 0.40 10 0.56W40s25 89 x 89 x 4.8 0.40 25 0.56W40s50 8 9 x 8 9 x 4 .8 0.40 50 0.56
W75
W75s0 8 9 x 8 9 x 4 .8 0.75 0 0.87W75s2 89 x 89 x 4.8 0.75 2 0.90W75s5 89 x 89 x 4.8 0.75 5 0.92
W75sl0 8 9 x 8 9 x 4 .8 0.75 10 0.93W75s25 89 x 89 x 4.8 0.75 25 0.94W75s50 89 x 89 x 4.8 0.75 50 0.94
W125
W125s0 89 x 89 x 4.8 1.25 0 0.98W125s2 89 x 89 x 4.8 1.25 2 1.01W125s5 89 x 89 x 4.8 1.25 5 1.02
W125sl0 89 x 89 x 4.8 1.25 10 1.02W125s25 89 x 89 x 4.8 1.25 25 1.02W125s50 89 x 89 x 4.8 1.25 50 1.02
W150
W150s0 89 x 89 x 4.8 1.50 0 0.98W150s2 89 x 89 x 4.8 1.50 2 1.01W150s5 89 x 89 x 4.8 1.50 5 1.02
W150sl0 89 x 89 x 4.8 1.50 10 1.02W150s25 89 x 89 x 4.8 1.50 25 1.02W150s50 89 x 89 x 4.8 1.50 50 1.02
Reproduced with permission of the copyright owner. Further reproduction prohibited without permission.
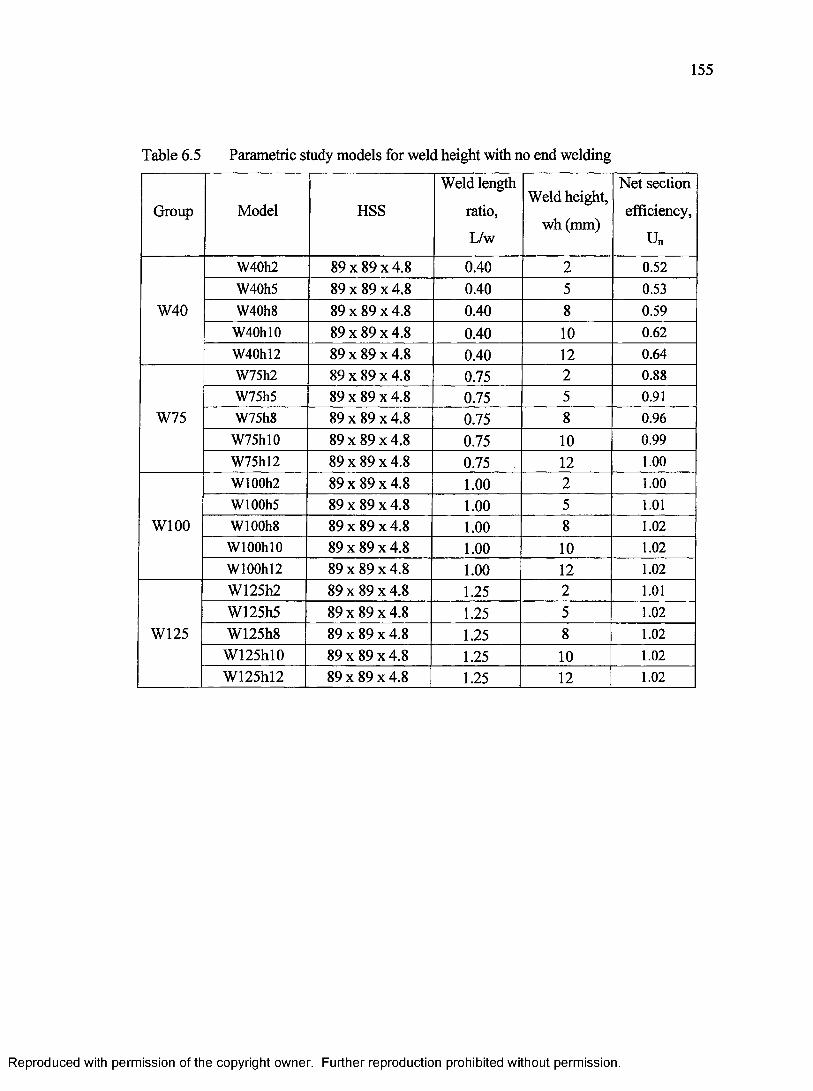
155
Table 6.5 Parametric study models for weld height with no end welding
Group Model HSS
Weld length
ratio,
L/w
Weld height,
wh(mm)
Net section
efficiency,
u„
W40
W40h2 89 x 89 x 4.8 0.40 2 0.52W40h5 89 x 89 x 4.8 0.40 5 0.53W40h8 89 x 89 x 4.8 0.40 8 0.59
W40hl0 89 x 89 x 4.8 0.40 10 0.62W40hl2 89 x 89 x 4.8 0.40 12 0.64
W75
W75h2 89 x 89 x 4.8 0.75 2 0.88W75h5 89 x 89 x 4.8 0.75 5 0.91W75h8 89 x 89 x 4.8 0.75 8 0.96
W75hl0 89 x 89 x 4.8 0.75 10 0.99W75hl2 89 x 89 x 4.8 0.75 12 1.00
W100
W100h2 89 x 89 x 4.8 1.00 2 1.00W100h5 89 x 89 x 4.8 1.00 5 1.01W100h8 89 x 89 x 4.8 1.00 8 1.02WlOOhlO 89 x 89 x 4.8 1.00 10 1.02W100hl2 8 9 x 8 9 x 4 .8 1.00 12 1.02
W125
W125h2 89 x 89 x 4.8 1.25 2 1.01W125h5 89 x 89 x 4.8 1.25 5 1.02W125h8 89 x 89 x 4.8 1.25 8 1.02
W125hl0 89 x 89 x 4.8 1.25 10 1.02W125hl2 89 x 89 x 4.8 1.25 12 1.02
Reproduced with permission of the copyright owner. Further reproduction prohibited without permission.
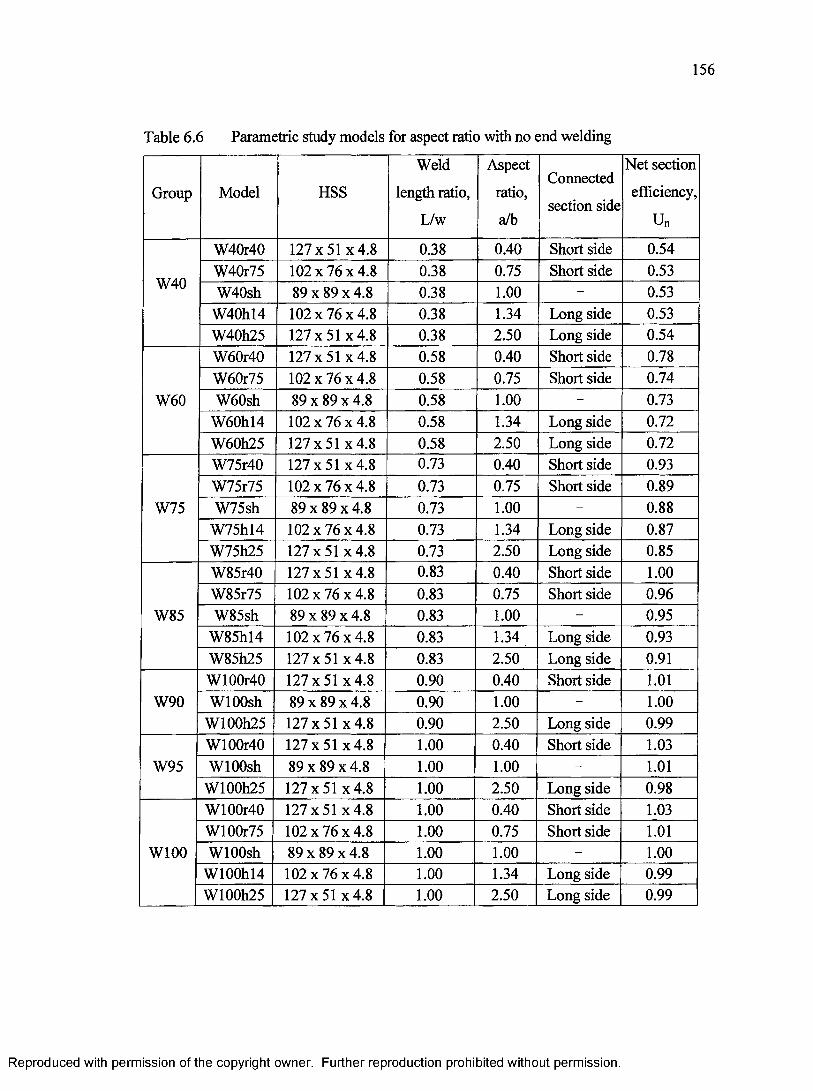
156
Table 6.6 Parametric study models for aspect ratio with no end welding
Group Model HSS
Weld
length ratio,
L/w
Aspect
ratio,
a/b
Connected
section side
Net section
efficiency,
Un
W40
W40r40 127x51 x 4.8 0.38 0.40 Short side 0.54W40r75 1 02x76x4 .8 0.38 0.75 Short side 0.53W40sh 89 x 89 x 4.8 0.38 1.00 - 0.53
W 40hl4 102x76x4 .8 0.38 1.34 Long side 0.53W40h25 127x51 x 4.8 0.38 2.50 Long side 0.54
W60
W60r40 127x51 x 4.8 0.58 0.40 Short side 0.78W60r75 102x76x4 .8 0.58 0.75 Short side 0.74W60sh 89 x 89 x 4.8 0.58 1.00 - 0.73
W 60hl4 102x76x4 .8 0.58 1.34 Long side 0.72W60h25 127x51x4 .8 0.58 2.50 Long side 0.72
W75
W75r40 127x51 x 4.8 0.73 0.40 Short side 0.93W75r75 1 02x76x4 .8 0.73 0.75 Short side 0.89W75sh 89 x 89 x 4.8 0.73 1.00 - 0.88
W 75hl4 102x76x4 .8 0.73 1.34 Long side 0.87W75h25 127x51 x 4.8 0.73 2.50 Long side 0.85
W85
W85r40 127x51 x 4.8 0.83 0.40 Short side 1.00W85r75 102 x 76 x 4.8 0.83 0.75 Short side 0.96W85sh 89 x 89 x 4.8 0.83 1.00 - 0.95
W 85hl4 102 x 76 x 4.8 0.83 1.34 Long side 0.93W85h25 127x51 x4.8 0.83 2.50 Long side 0.91
W90W100r40 127x51 x 4.8 0.90 0.40 Short side 1.01WlOOsh 89 x 89 x 4.8 0.90 1.00 - 1.00
W100h25 127x51 x 4.8 0.90 2.50 Long side 0.99
W95W100r40 1 2 7 x51x4 .8 1.00 0.40 Short side 1.03WlOOsh 89 x 89 x 4.8 1.00 1.00 - 1.01
W100h25 127x51 x 4.8 1.00 2.50 Long side 0.98
W100
W100r40 127x51 x 4.8 1.00 0.40 Short side 1.03W100r75 102 x 76 x 4.8 1.00 0.75 Short side 1.01WlOOsh 89 x 89 x 4.8 1.00 1.00 - 1.00
W100hl4 1 0 2 x 7 6 x 4 .8 1.00 1.34 Long side 0.99W100h25 127x51 x 4.8 1.00 2.50 Long side 0.99
Reproduced with permission of the copyright owner. Further reproduction prohibited without permission.
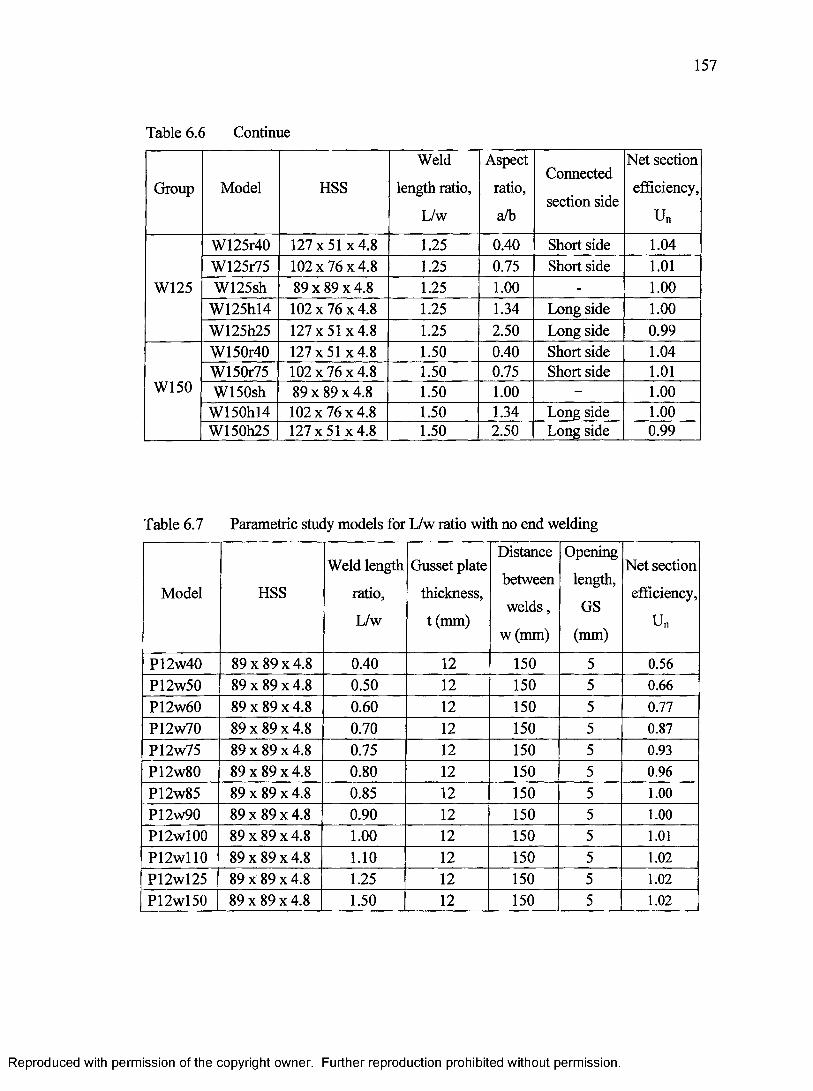
157
Table 6.6 Continue
Group Model HSS
Weld
length ratio,
L/w
Aspect
ratio,
a/b
Connected
section side
Net section
efficiency,
Un
W125
W125r40 127 x 51 x4.8 1.25 0.40 Short side 1.04W125r75 102x76x4 .8 1.25 0.75 Short side 1.01W125sh 89 x 89 x 4.8 1.25 1.00 - 1.00
W 125hl4 102 x 76 x 4.8 1.25 1.34 Long side 1.00W125h25 127x51x4 .8 1.25 2.50 Long side 0.99
W150
W150r40 127x51x4 .8 1.50 0.40 Short side 1.04W150r75 102x76x4 .8 1.50 0.75 Short side 1.01W150sh 89 x 89 x 4.8 1.50 1.00 - 1.00
W150hl4 102 x 76x4.8 1.50 1.34 Long side 1.00W150h25 127x51x4 .8 1.50 2.50 Long side 0.99
Table 6.7 Parametric study models for L/w ratio with no end welding
Model HSS
Weld length
ratio,
L/w
Gusset plate
thickness,
t (mm)
Distance
between
w elds,
w (mm)
Opening
length,
GS
(mm)
Net section
efficiency,
Un
P12w40 8 9 x 8 9 x 4 .8 0.40 12 150 5 0.56P12w50 8 9 x 8 9 x 4 .8 0.50 12 150 5 0.66P12w60 89 x 89 x 4.8 0.60 12 150 5 0.77P12w70 89 x 89 x 4.8 0.70 12 150 5 0.87P12w75 89 x 89 x 4.8 0.75 12 150 5 0.93P12w80 89 x 89 x 4.8 0.80 12 150 5 0.96P12w85 89 x 89 x 4.8 0.85 12 150 5 1.00P12w90 89 x 89 x 4.8 0.90 12 150 5 1.00P12wl00 89 x 89x4.8 1.00 12 150 5 1.01P12w ll0 89 x 89 x 4.8 1.10 12 150 5 1.02P12wl25 89 x 89 x 4.8 1.25 12 150 5 1.02P12wl50 89 x 89 x 4.8 1.50 12 150 5 1.02
Reproduced with permission of the copyright owner. Further reproduction prohibited without permission.
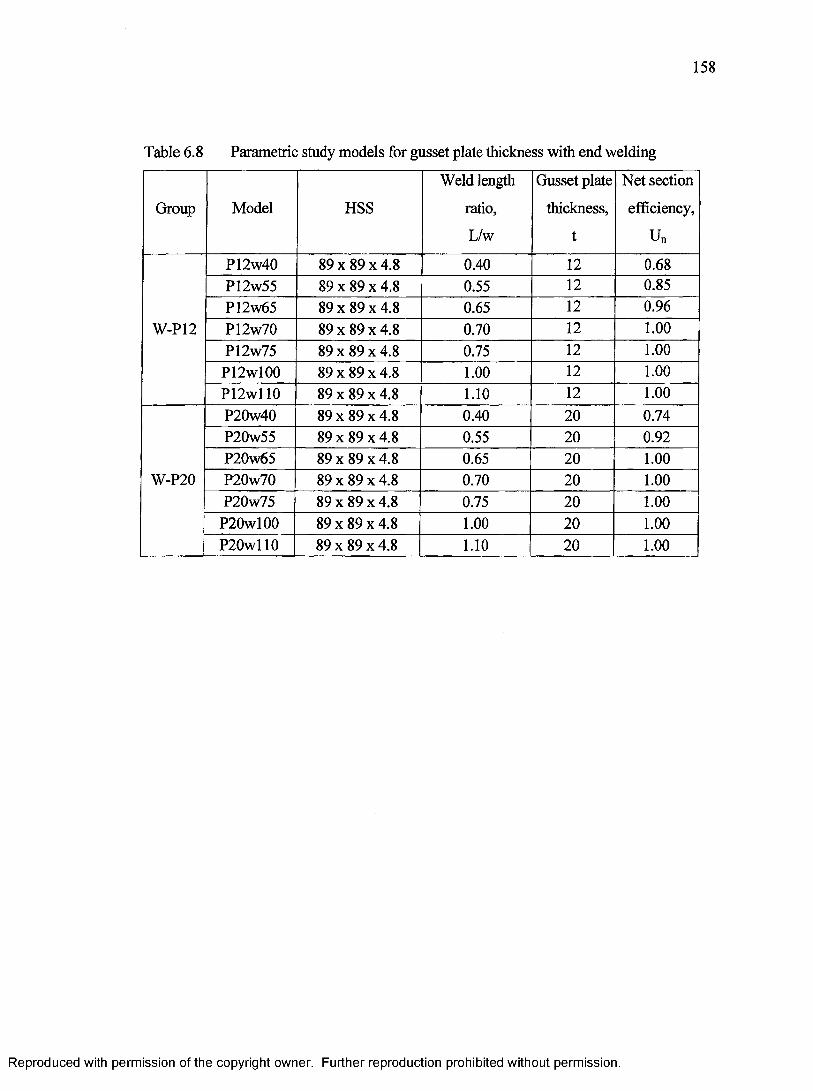
158
Table 6.8 Parametric study models for gusset plate thickness with end welding
Group Model HSS
Weld length
ratio,
L/w
Gusset plate
thickness,
t
Net section
efficiency,
Un
W-P12
P12w40 89 x 89 x 4.8 0.40 12 0.68P12w55 89 x 89 x 4.8 0.55 12 0.85P12w65 89 x 89 x 4.8 0.65 12 0.96P12w70 89 x 89 x 4.8 0.70 12 1.00P12w75 8 9 x 8 9 x 4 .8 0.75 12 1.00
P12wl00 89 x 89 x 4.8 1.00 12 1.00P12wl 10 89 x 89 x 4.8 1.10 12 1.00
W-P20
P20w40 89 x 89 x 4.8 0.40 20 0.74P20w55 89 x 89 x 4.8 0.55 20 0.92P20w65 89 x 89 x 4.8 0.65 20 1.00P20w70 89 x 89 x 4.8 0.70 20 1.00P20w75 89 x 89 x 4.8 0.75 20 1.00
P20wl00 89 x 89 x 4.8 1.00 20 1.00P20w ll0 89 x 89 x 4.8 1.10 20 1.00
Reproduced with permission of the copyright owner. Further reproduction prohibited without permission.
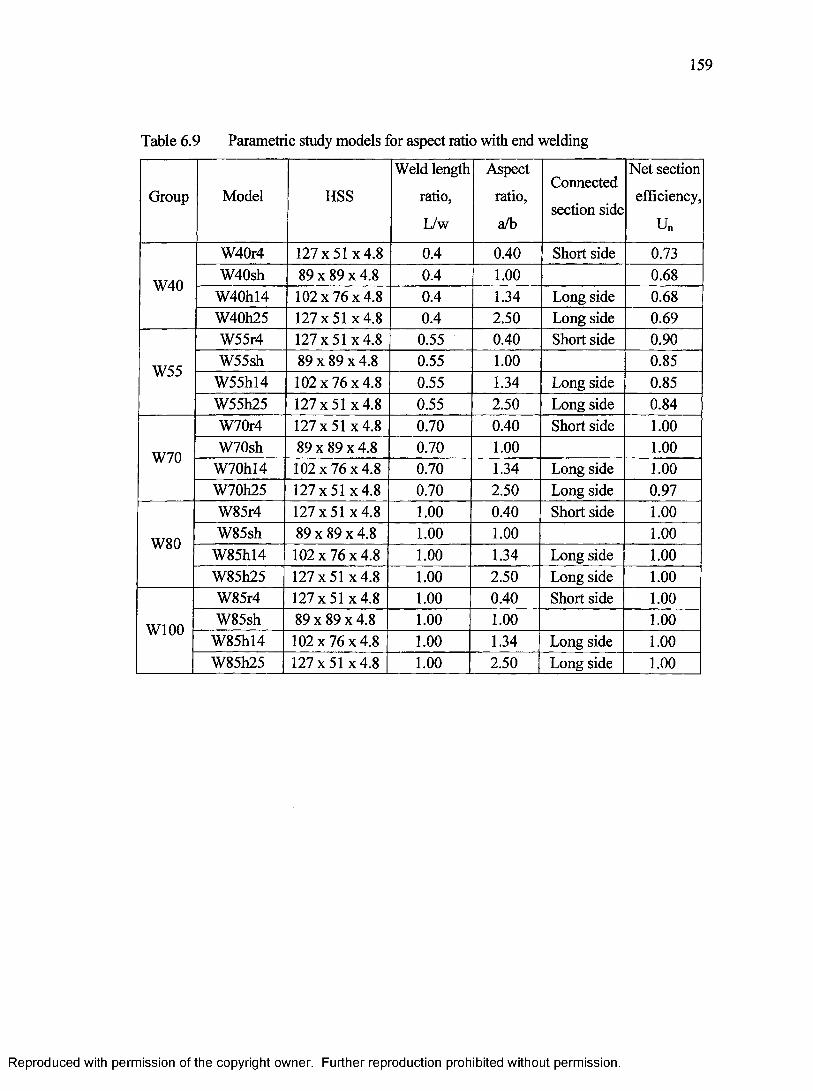
Table 6.9 Parametric study models for aspect ratio with end welding
159
Group Model HSS
Weld length
ratio,
L/w
Aspect
ratio,
a/b
Connected
section side
Net section
efficiency,
Un
W40
W40r4 127x51 x 4.8 0.4 0.40 Short side 0.73W40sh 89 x 89 x 4.8 0.4 1.00 0.68
W 40hl4 102x76x4 .8 0.4 1.34 Long side 0.68W40h25 127x51x4 .8 0.4 2.50 Long side 0.69
W55
W55r4 127x51x4 .8 0.55 0.40 Short side 0.90W55sh 89 x 89 x 4.8 0.55 1.00 0.85
W 55hl4 102x76x4 .8 0.55 1.34 Long side 0.85W55h25 127x51x4 .8 0.55 2.50 Long side 0.84
W70
W70r4 127x51x4 .8 0.70 0.40 Short side 1.00W70sh 89 x 89 x 4.8 0.70 1.00 1.00
W 70hl4 102x76x4 .8 0.70 1.34 Long side 1.00W70h25 127x51x4 .8 0.70 2.50 Long side 0.97
W80
W85r4 127x51x4 .8 1.00 0.40 Short side 1.00W85sh 89 x 89 x 4.8 1.00 1.00 1.00
W 85hl4 102 x 76 x 4.8 1.00 1.34 Long side 1.00W85h25 127x51 x 4.8 1.00 2.50 Long side 1.00
W100
W85r4 127x51 x 4.8 1.00 0.40 Short side 1.00W85sh 89 x 89 x 4.8 1.00 1.00 1.00
W 85hl4 102x76x4 .8 1.00 1.34 Long side 1.00W85h25 127x51 x 4.8 1.00 2.50 Long side 1.00
Reproduced with permission of the copyright owner. Further reproduction prohibited without permission.
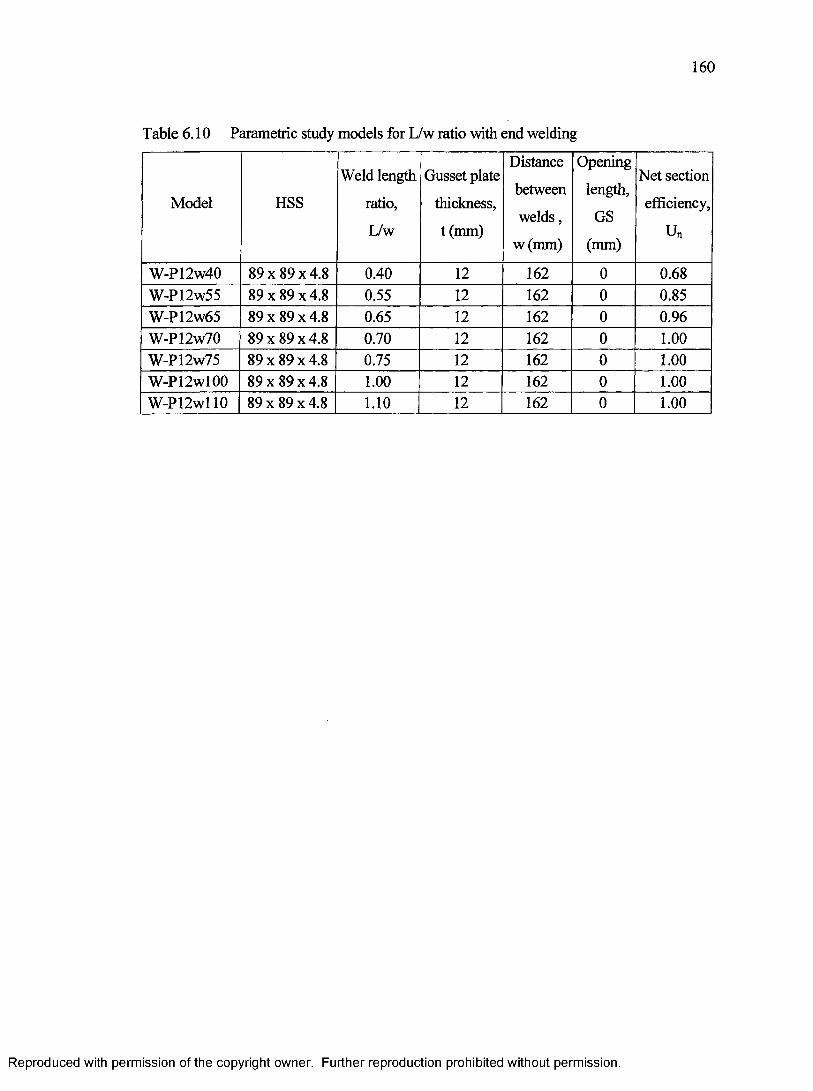
160
Table 6.10 Parametric study models for L/w ratio with end welding
Model HSS
Weld length
ratio,
L/w
Gusset plate
thickness,
t (mm)
Distance
between
w elds,
w(mm)
Opening
length,
GS
(mm)
Net section
efficiency,
Un
W-P12w40 89 x 89 x 4.8 0.40 12 162 0 0.68W-P12w55 8 9 x 8 9 x 4 .8 0.55 12 162 0 0.85W-P12w65 89 x 89 x 4.8 0.65 12 162 0 0.96W-P12w70 8 9 x 8 9 x 4 .8 0.70 12 162 0 1.00W-P12w75 89 x 89 x 4.8 0.75 12 162 0 1.00W-P12wl00 89 x 89 x 4.8 1.00 12 162 0 1.00W-P12wl 10 8 9 x 8 9 x 4 .8 1.10 12 162 0 1.00
Reproduced with permission of the copyright owner. Further reproduction prohibited without permission.
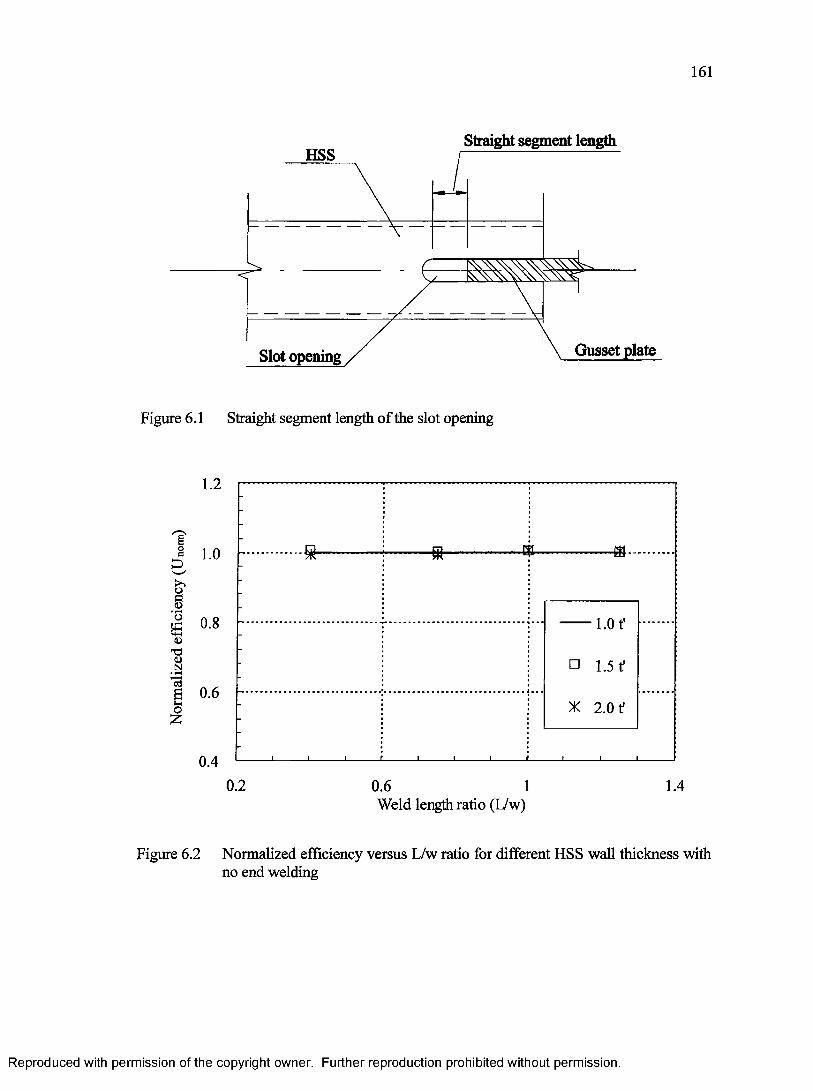
161
Straight segment lengthHSS
Gusset plate
Figure 6.1 Straight segment length o f the slot opening
’8<u730)
N•
13
1.2
1.0
0.8
S 0.6
0.40.2
-*■ ■s-
0.6 1 Weld length ratio (L/w)
- 1 . 0 1'
□ 1.5 f
X 2.0 f
-I____ I____ I____ £____ I____ I____ 1____ £____ I____ !_
1.4
Figure 6.2 Normalized efficiency versus L/w ratio for different HSS wall thickness with no end welding
Reproduced with permission of the copyright owner. Further reproduction prohibited without permission.
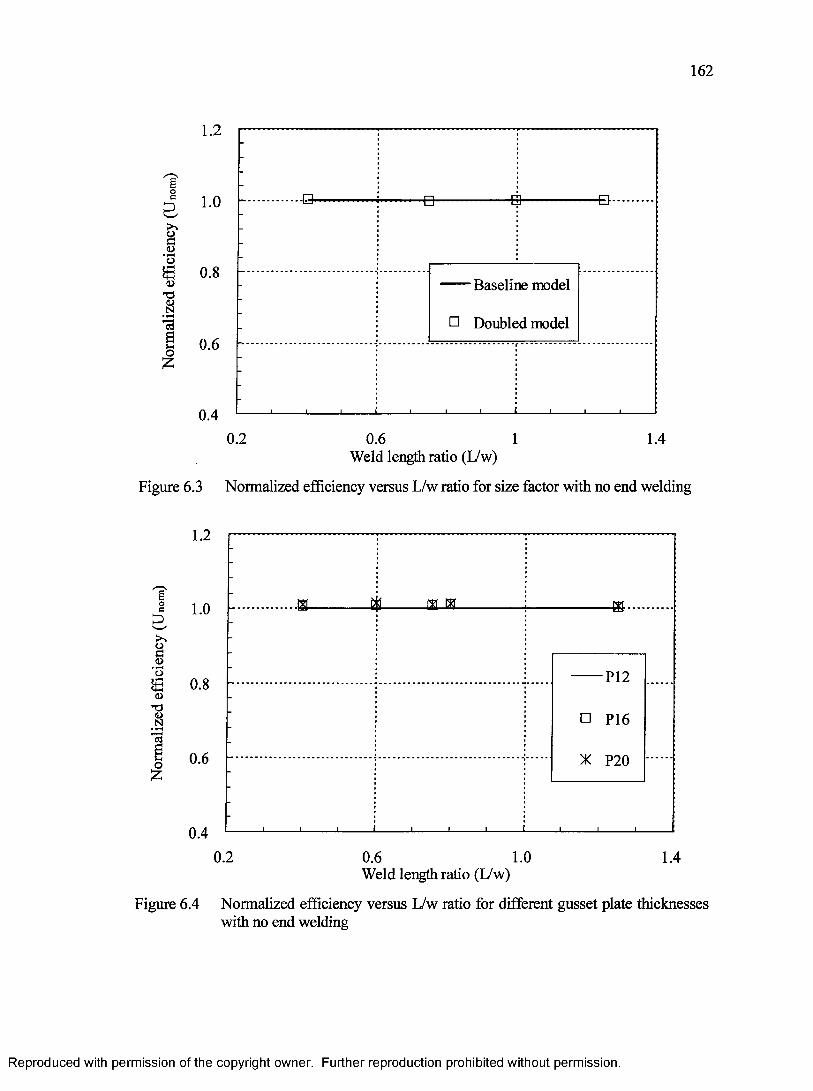
162
1.2
1.0
0.8
0.6
0.40.2 0.6 1 1.4
Weld length ratio (L/w)
Figure 6.3 Normalized efficiency versus L/w ratio for size factor with no end welding
<Do
£<L>T3<UN
aoz
Baseline model
□ Doubled model
C
''w '
0>• Ho(U
'TS<UN• T—I
oZ
1.2
1.0
P120.8
□ P16
0.6 X P20
0.40.2 1.00.6 1.4
Weld length ratio (L/w)
Figure 6.4 Normalized efficiency versus L/w ratio for different gusset plate thicknesses with no end welding
Reproduced with permission of the copyright owner. Further reproduction prohibited without permission.
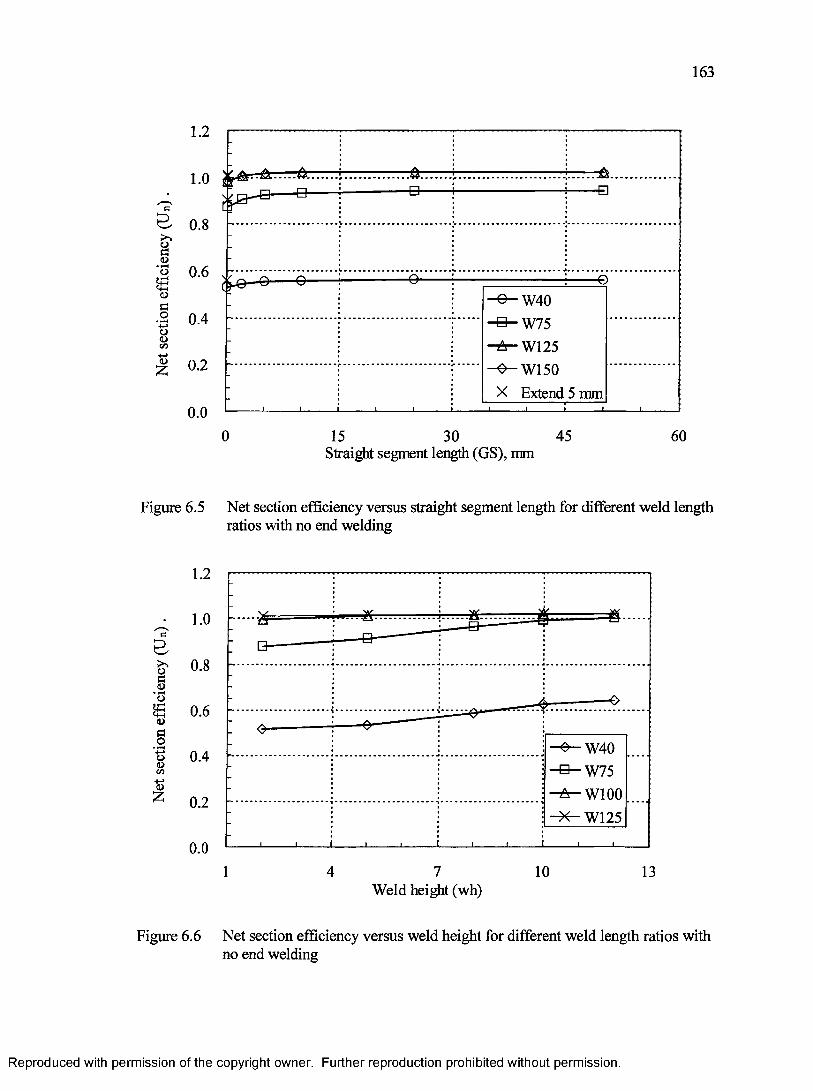
163
G
1.2
1.0
0.8
0.0
EF'0'>.<D
'£ 0 6 U-i 0JS3
■2 0.48C/D
3 0-2
-B-T&7-B-
7& .-0
—© -W 40—
-H -W 7 5-A -W 1 2 5
-S -W 1 5 0X Extend 5 mm
_l______ I______ 1______ l_
15 30 45Straight segment length (GS), mm
60
Figure 6.5 Net section efficiency versus straight segment length for different weld length ratios with no end welding
c<L>O
IS<DGo
■+-»o<uCOuz
1.2
1.0
0.8
0.6
■O— W40 B -W 7 5■a —W100 X — W125
0.4
0.2
0.01 7 10 134
Weld height (wh)
Figure 6.6 Net section efficiency versus weld height for different weld length ratios with no end welding
Reproduced with permission of the copyright owner. Further reproduction prohibited without permission.
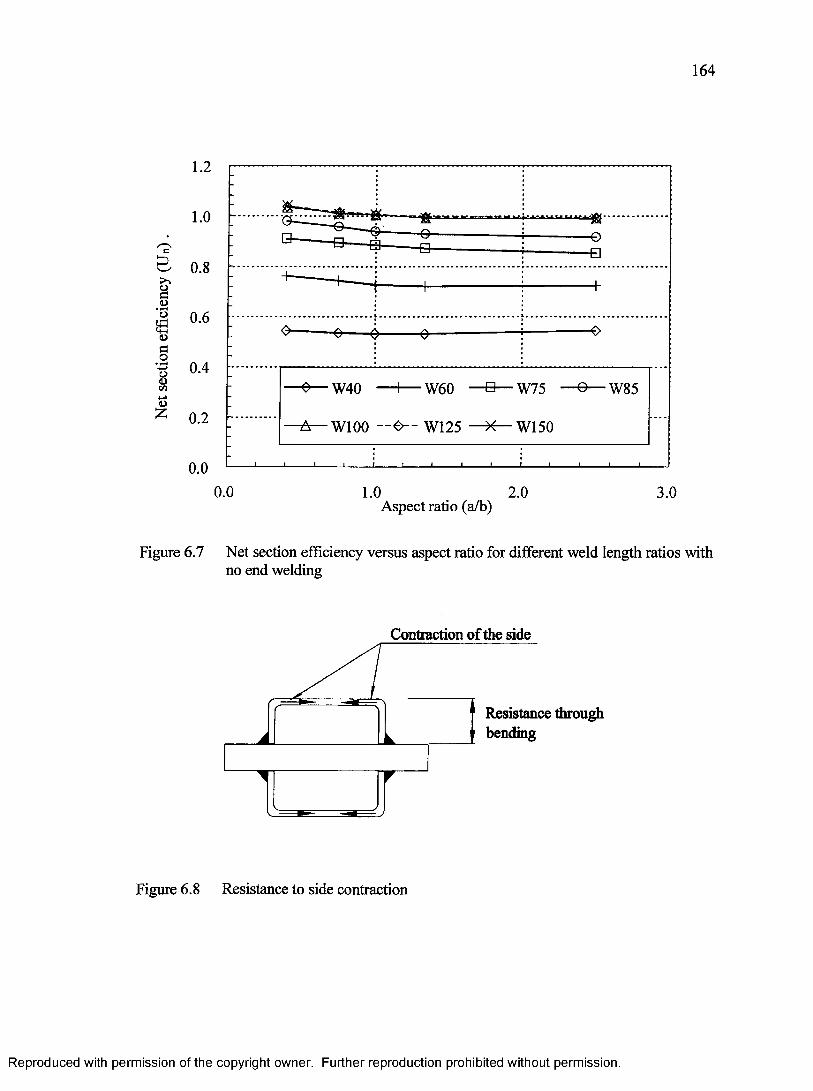
Net
sect
ion
effic
ienc
y (U
n).
164
1.2
1.0
0.8
0.6
0.4— W40 W60 — B — W 7 5 O W85
0.2 W100 — e — W125 W150
0.00.0 1.0 2.0 3.0
Aspect ratio (a/b)
Figure 6.7 Net section efficiency versus aspect ratio for different weld length ratios with no end welding
Contraction of die side
Resistance through bending
Figure 6.8 Resistance to side contraction
Reproduced with permission of the copyright owner. Further reproduction prohibited without permission.

165
C
o<dao• r-<oa>
c / 5
a>£
.2
„ — A —-A1.0
0.8
0.6
0.4
0.21.71.3 1.51.10.90.5 0.70.3
Weld length ratio (L/w)
Figure 6.9 Net section efficiency versus weld length ratio for square HSS with no end welding
1.2
1.0
I1M 0.80m<a1 0.6oHi
C /5
"S0.4
0.2
CSA-S16.1-01
. i IKorol (2.23) ___
X a/b=2.50o a/b=1.34A a/b=l .00o a/b=0.75□ a/b=0.40
-Eq. (6.4)
0.3 0.5 0.7 0.9Weld length ratio (L/w)
1.1 1.3
Figure 6.10 Net section efficiency versus weld length ratio for aspect ratios without end welding and stronger HSS comer
Reproduced with permission of the copyright owner. Further reproduction prohibited without permission.

166
>,oc(L>■ rHos<UCo
•
o<DC/04->
%
1.2
1.0
0.8
0.6 A a/b=1.0
□ a/b=0.40.4
Eq. (6.4)
0.20.3 0.5 0.7 0.9 1.1 1.3
Weld length ratio (L/w)
Figure 6.11 Net section efficiency versus weld length ratio for the parametric study models with 28% stronger comer and no end welding
1.2
1.0
I 0.8o
<£h<D.2 0.6 +->O<uC/5aJ
Z, 0.4
0.20.3 0.5
J 1 I I I L_
0.7 0.9Weld length ratio (L/w)
X a/b=2.50o a/b=1.34A a/b=l .00o a/b=0.75□ a/b=0.40
■Eq. (6.4)
i > i i
1.1 1.3
Figure 6.12 Net section efficiency versus weld length ratio for the parametric study models with 75% stronger comer and no end welding
Reproduced with permission of the copyright owner. Further reproduction prohibited without permission.
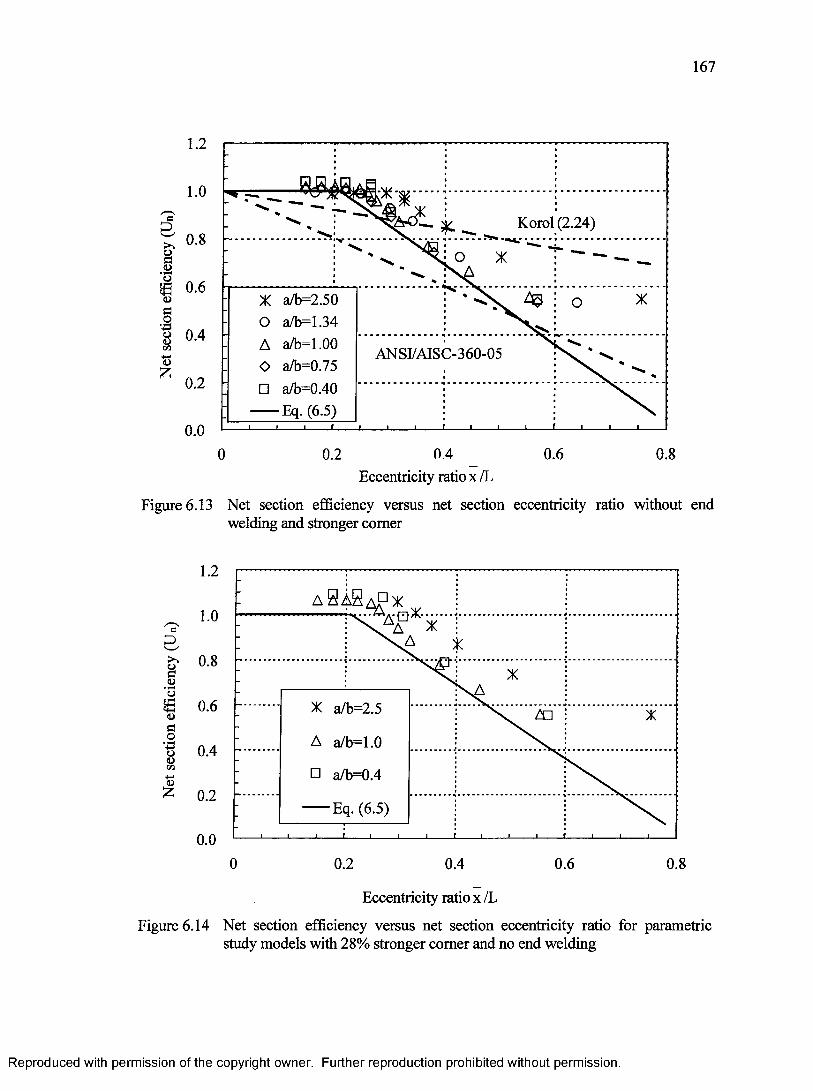
167
1.2
1.0/■“S
r; o.8M§ 0.6<D
1 0.41/5Id £ 0.2
0.0
* ^ —- . ** Korol (2.24)
% ^ s _ \ ' % !
**
1
•. .....
...i.
X aft=2.50 O a/b=1.34 A a/b=1.00 O a/b=0.75
: □ a/b=0.40 : ----- Eq.(6.5)
i i i f
> N
Xo_____!
ANSI/AIS<2-360-05 %\ s\ S.
i i i . ■ i i r 1 1 1
0.2 0.4Eccentricity ratio x /L
0.6 0.8
Figure 6.13 Net section efficiency versus net section eccentricity ratio without end welding and stronger comer
octDo<ufio
<u<73"S£
1.2
1.0
0.8
0.6 X a/b=2.5 / n
A a/b=l .00.4□ a/b=0.4
0.2 Eq. (6.5)
0.00 0.2 0.4 0.6 0.8
Eccentricity ratio x /L
Figure 6.14 Net section efficiency versus net section eccentricity ratio for parametric study models with 28% stronger comer and no end welding
Reproduced with permission of the copyright owner. Further reproduction prohibited without permission.
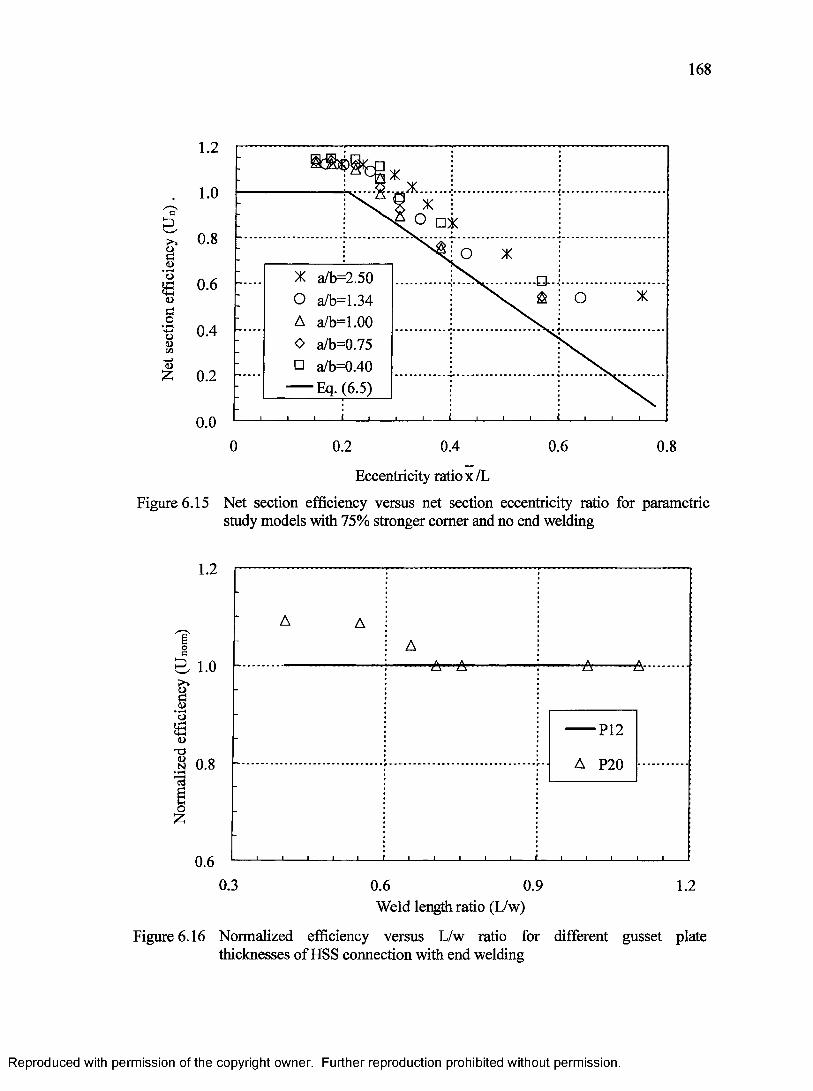
168
a<uovi(Ua
.2ouc/3
£
1.2
1.0
0.8
0.0
0.6 ___ X a/b=2.50o a/b-1.34
0.4A a/b=1.00O a/b=0.75
0.2- □ a/b=0.40” Eq. (6.5)
0.2 0.4
Eccentricity ratio x /L
0.6 0.8
Figure 6.15 Net section efficiency versus net section eccentricity ratio for parametric study models with 75% stronger comer and no end welding
1.2
£ 1.0
P12
A P200.8
0.60.3 0.6 0.9 1.2
Weld length ratio (L/w)
Figure 6.16 Normalized efficiency versus L/w ratio for different gusset plate thicknesses o f HSS connection with end welding
Reproduced with permission of the copyright owner. Further reproduction prohibited without permission.
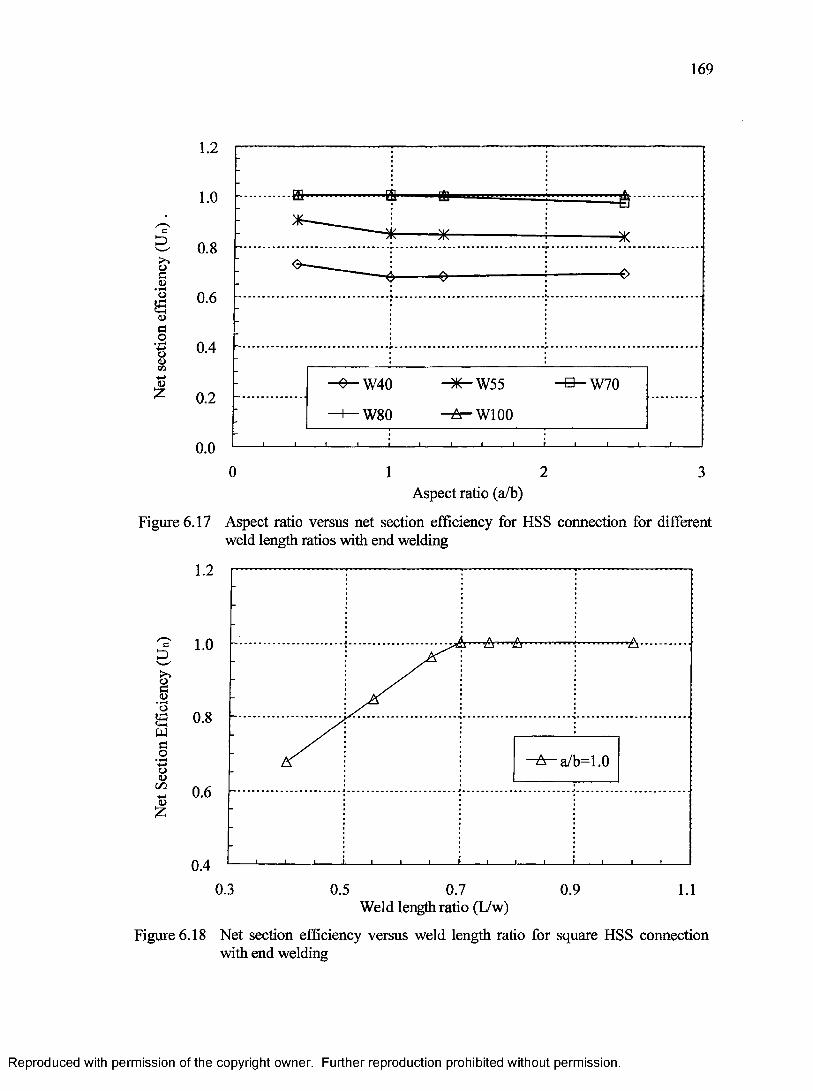
169
Gg ,
s<Do
U3ocoo0)CO+->
£
1.2
1.0
0.8
0.6
0.4
W700.2
W80 W100
0.00 1 2 3
Aspect ratio (a/b)
Figure 6.17 Aspect ratio versus net section efficiency for HSS connection for different weld length ratios with end welding
cg
§<u■ HO<&wco+-»O93
m+->
£
1.2
1.0
0.8
A — a/b=l .0
0.6
0.40.3 0.5 0.7 0.9 1.1
Weld length ratio (L/w)
Figure 6.18 Net section efficiency versus weld length ratio for square HSS connection with end welding
Reproduced with permission of the copyright owner. Further reproduction prohibited without permission.
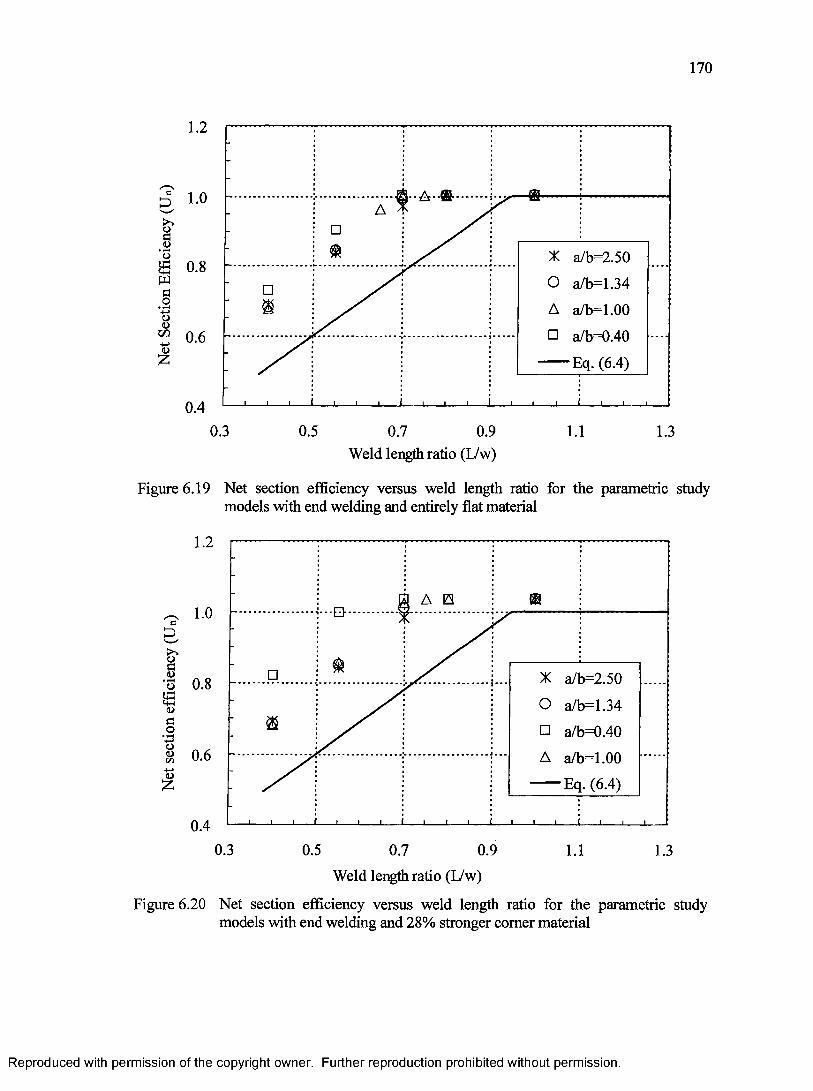
170
cg
<Do
ml«Wao
-4->oa>GOu
z
1.2
1.0
0.8
0.6
0.4
X a/b=2.50
o a/b=1.34
A a/b=1.00
□ a/b-0.40
Eq. (6.4)
_ j_______|_______ i_
0.3 0.5 0.7 0.9Weld length ratio (L/w)
1.1 1.3
Figure 6.19 Net section efficiency versus weld length ratio for the parametric study models with end welding and entirely flat material
C
g ,I<D
1.2
1.0
o 0.8o4h<US3o+->o<L>t /3
qS£
0.6
X a/b=2.50
O a/b=1.34□ a/b-0.40
A a/b=1.00
Eq. (6.4)
Q ^ I 1--------1-------- 1--------£_____ 1_____ 1_____ I_____ I_____ I_____ t_____ 1_____ £_____I_____ I_____ I— — t_____1_____ I I
0.3 0.5 0.7 0.9 1.1 1.3
Weld length ratio (L/w)
Figure 6.20 Net section efficiency versus weld length ratio for the parametric study models with end welding and 28% stronger comer material
Reproduced with permission of the copyright owner. Further reproduction prohibited without permission.

Net
secti
on
effic
ienc
y (U
n)1.2
1.0
0.8
-Q— PL12-end welded0.60 — PL 12-end open
■&— PL20-end welded0.4
PL20-end open
0.20.3 0.5 0.9 1 . 10.7 1.3
Weld length ratio (L/w)
Figure 6.21 Net section efficiency versus weld length ratio for different gusset plates
D —
2
I °-8•3<Dco 0.6 X 00 a
0 - PL12-end welded
■B- PL12-end open
■&— PL20-end welded0.4
-X r- PL20-end open
I0.2
0.4 0.6 1.0 1.2 1.40.8
Outstanding weld length ratio (L/w)
Figure 6.22 Outstanding HSS section efficiency versus outstanding weld length ratio for different gusset plates
Reproduced with permission of the copyright owner. Further reproduction prohibited without permission.
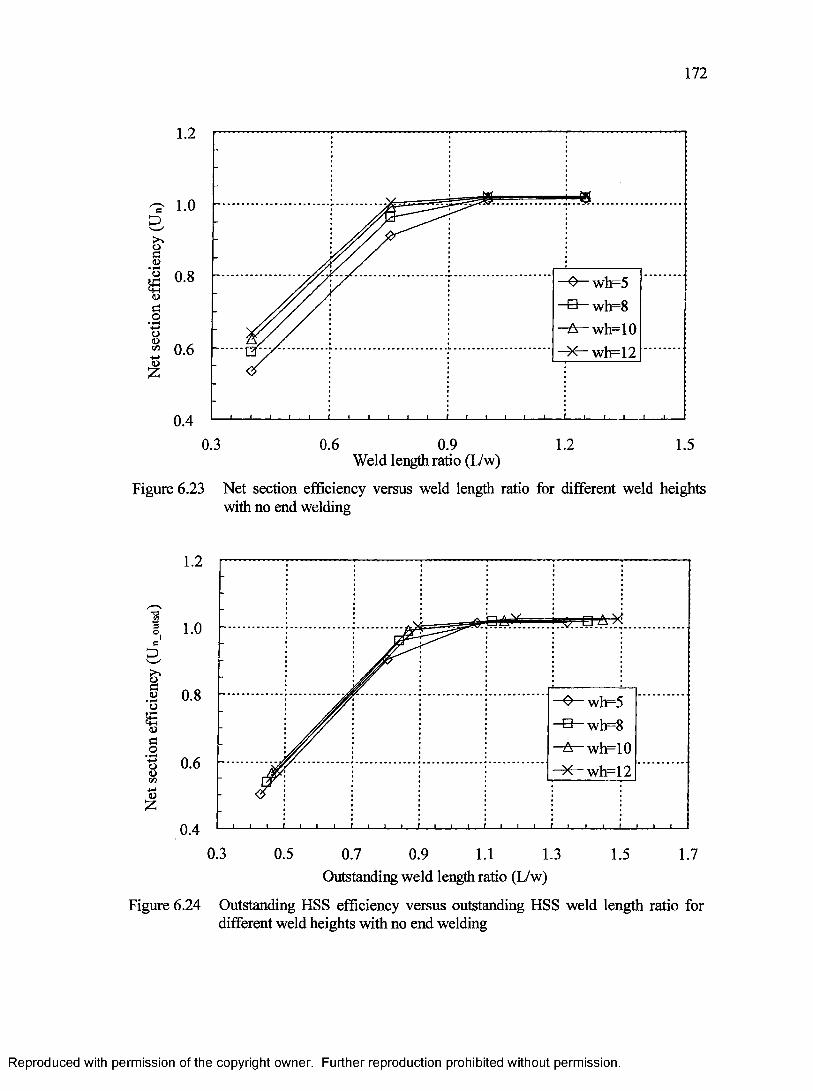
172
1.2
C
5*%<D3 0.8 wb=5
S — wh=8
A -w h = 1 0 wh=12
<uelo
8•» 0.6
0.40.3 0.6 0.9 1.2 1.5
Weld length ratio (L/w)
Figure 6.23 Net section efficiency versus weld length ratio for different weld heights with no end welding
-ai/ i3O,
0.8 wh=5 ■EL- wh=8
wh=10 ■X—wh=12
a
* 0.6
0.40.3 0.5 0.7 0.9 1.1 1.3 1.7
Outstanding weld length ratio (L/w)
Figure 6.24 Outstanding HSS efficiency versus outstanding HSS weld length ratio for different weld heights with no end welding
Reproduced with permission of the copyright owner. Further reproduction prohibited without permission.
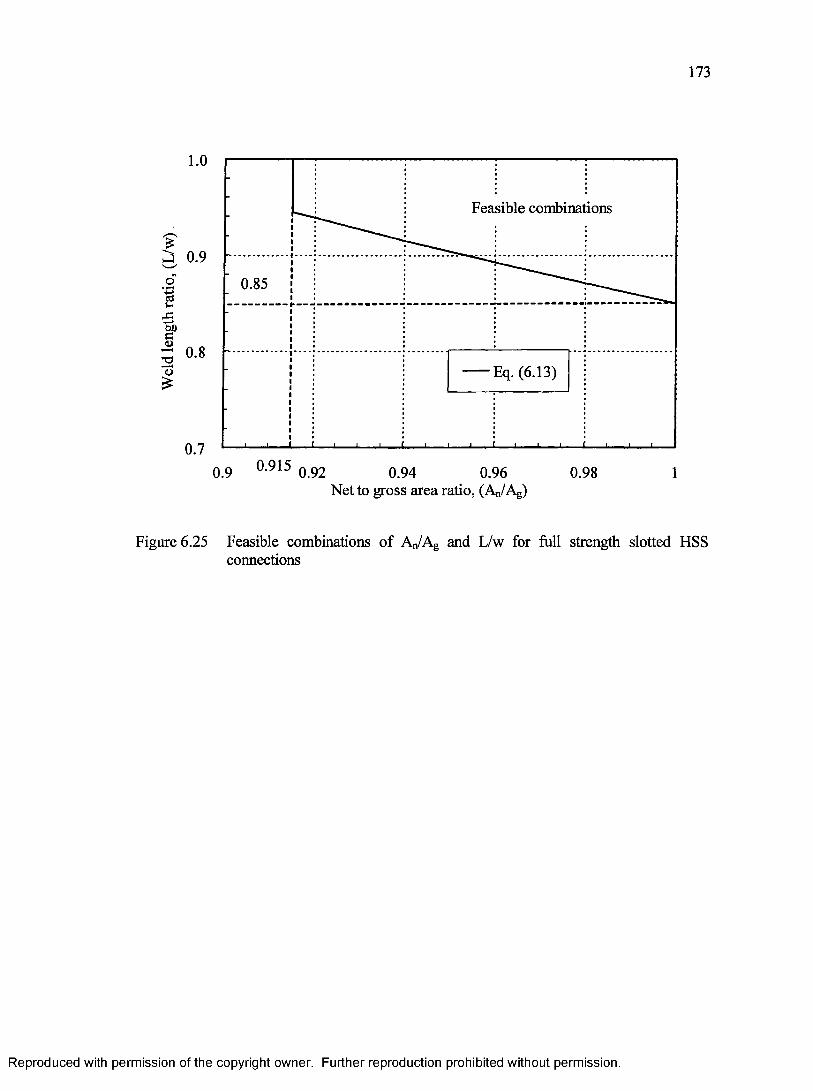
Weld
len
gth
ratio
, (L
/w)
173
.0
Feasible combinations
0.9
0.85
0.8 Eq. (6.13)
0.70.9 °-915 0.92 0.94 0.96 0.98
Net to gross area ratio, (An/Ag)
Figure 6.25 Feasible combinations o f An/Ag and L/w for full strength slotted HSS connections
Reproduced with permission of the copyright owner. Further reproduction prohibited without permission.
CHAPTER 7 SUMMARY, CONCLUSIONS AND RECOMMENDATIONS
7.1 Summary
A literature review on shear lag in the tension connections was carried out in
Chapter 2 with emphasis on slotted HSS connections. It was found that only a few studies
have so far been carried out to investigate the effect of shear lag on slotted square and
rectangular HSS connections. Results from these limited studies showed that provisions
to account for shear lag in the design standards are overly conservative when applied to a
slotted HSS connection. A few procedures to determine the true stress versus true strain
relationship o f the material were also discussed.
The overall testing program consisted o f slotted square and rectangular HSS
connections with and without end welding. Only four slotted HSS specimens with end
welding and three connection configurations were tested in this study. The other twenty
six HSS specimens with no end welding that formed a part o f the overall testing program
were tested by Huang (2005). Both HSS 89 x 89 x 4.8 and HSS 127 x 51 x 4.8 were
tested.
Tension coupons fabricated from the gusset plate and HSS were tested to obtain
material properties for analyzing the test results and performing finite element analyses.
Tension coupons from both the flat part and the comer of HSS were machined and tested.
The performance o f the HSS test specimen was evaluated using the actual material strength
obtained from coupon tests. The net section efficiency from the test was compared to the
efficiency calculated according to the provisions for shear lag on slotted tension member
in design standards.
174
Reproduced with permission of the copyright owner. Further reproduction prohibited without permission.
175
An iterative procedure was adopted to determine the true stress versus true plastic
strain relationship o f the material beyond the peak load. Since material properties vary
across the HSS section, the HSS was idealized as having two regions o f distinct material
properties with one region being the HSS comer and the other being the flat part o f HSS.
A true stress versus true plastic strain relationship for the HSS comer was assumed through
numerical simulations of the HSS connection. The average measured equivalent plastic
strain at fracture from tension coupon tests was used as the critical limit to signify the
material failure in the finite element analysis.
Studies on element type, critical equivalent plastic strain limit and finite element
mesh were carried out in developing the finite element models for slotted square and
rectangular HSS connections. Results of the numerical simulation were compared to test
results form the testing program and Korol (1996) to validate these models.
Based on the validated finite element models, a finite element analyses parametric
study was carried out to investigate effects o f various parameters have on the strength o f
HSS connections. Parameters such as weld length ratio, gusset plate thickness, size of slot
opening, slot orientation, weld height, size factor and HSS wall thickness were studied.
Slotted square and rectangular HSS connections with and without end welding were
examined in the study. Results from the parametric study were used in developing
guidelines for designing an economical full-strength HSS connection, and to provide
recommendations on improving the provisions for shear lag on slotted HSS connections in
design standards.
Reproduced with permission of the copyright owner. Further reproduction prohibited without permission.
176
7.2 Conclusions
The following conclusions can be drawn based on results o f the experiment and
finite element analyses.
1) This study confirmed findings from previous research that provisions for shear lag
prescribed in CSA SI6.1-01 and ANSI/AISC-360-05 are overly conservative when
applied to slotted square and rectangular HSS tension members with and without end
welding. Two equations for calculating the net section efficiency were proposed.
One equation is a function of the weld length ratio and the other is a function o f net
section eccentricity ratio. The net section efficiency has a better correlation with the
weld length ratio than with the net section eccentricity ratio.
2) The weld length is the main factor that affects shear lag. For a slotted HSS connection,
the maximum net section efficiency can be achieved with a L/w ratio greater than 0.95
for a connection without end welding and 0.8 for a connection with end welding, as
long as a fillet weld of reasonable height is provided. The net section capacity
increases almost linearly with the L/w ratio up to 0.95 for the connection without end
welding and 0.8 for the one with end welding, and remains constant thereafter. In
general, the net section efficiency o f unity is achieved after these limits.
3) Due to the cold-forming process, the comer has an increase in the ultimate strength but
a decrease in the ductility. The strength increase in the comer o f HSS contributes to
the measured net section efficiency from the test to exceeding unity.
4) The HSS connection with end welding is always stronger than the one without end
welding if other geometrical parameters being equal. Thus, providing end welding
and a ratio o f L/w greater than 0.8 ensure that full strength o f HSS can be developed.
Reproduced with permission of the copyright owner. Further reproduction prohibited without permission.
177
At a ratio greater than 0.8, the failure of a slotted HSS tension member with end
welding is at the mid-length and significant ductility can be achieved.
5) A connection with the rectangular HSS slotted on its short side has a better net section
efficiency than a rectangular HSS slotted on its long side or a square HSS. This is
attributed to the greater effectiveness of the restraint provided by the gusset plate
against transverse contraction o f the HSS. Thus, the rectangular HSS should always
be slotted on its short side to better utilize the strength.
6) The thickness o f gusset plate is found to have a minor effect on the net section
efficiency o f a slotted HSS connection without end welding but have a significant
effect on the connection with end welding. In the parametric study, the net section
efficiency of a square HSS connection with end welding and 20 mm gusset plate is 9 %
higher than the one with 12 mm gusset plate at a L/w ratio o f 0.4.
7) The straight segment length o f the slot opening is found to reduce the net section
efficiency o f a HSS connection without end welding when it is too short. This effect
can be ignored when the straight segment length of at least roughly half the gusset plate
thickness is provided or the fillet weld extends a weld height beyond the end of the
gusset plate.
8) The weld height is found to affect the net section efficiency o f a slotted HSS connection
when the weld length ratio is low. In general, it can be ignored when the weld length
ratio is greater than 1.0. As the weld height increases from 2 mm to 12 mm, the net
section efficiency increases by 12% for square HSS connections at weld length ratios of
0.4 and 0.75. Thus, a weld height of at least 1.3 times the HSS wall thickness and
Reproduced with permission of the copyright owner. Further reproduction prohibited without permission.
178
1.7% o f the circumference of HSS along the centreline should be used with the
proposed efficiency equations when the L/w ratio is less than 1.
9) Using thicker HSS wall or scaling up the HSS connection proportionally will not affect
the net section efficiency of the HSS connection.
10) The shear lag effect on the net section efficiency can be better characterized by
considering the part of the HSS outside the weld toe alone.
11) The minimum A„/Ag ratio is limited to 0.915 or the maximum gusset plate thickness is
limited to 4.25% of the circumference along the centreline of HSS in order to fully
utilize strength o f a slotted HSS tension member with no end welding in the design
based on CSA-S16.1-01 for a grade 350W steel. Alternatively, a weld length ratio o f
0.8 together with end welding are provided to ensure that failure occurs away from the
slotted end. For other grades o f steel and design standards, a more economical design
o f a full-strength slotted HSS tension member with and without end welding can also
be achieved by using the proposed net section efficiency equations.
7.3 Recommendations
1) The study has demonstrated that the material properties are not uniform over the entire
cross-section of square and rectangular HSS. The higher strength at the HSS comer
contributes significantly to the capacity o f the HSS connection. Thus, a thorough
study on the material properties variation over the HSS cross-section is needed in order
to better utilize the increased strength in the design.
2) It was found that a slotted HSS connection with end welding in general has a better net
section efficiency than the one without end welding with all other geometrical
parameters being equal. Thus, separate equations should be developed for
Reproduced with permission of the copyright owner. Further reproduction prohibited without permission.
179
connections with and without weld welding, or an improved unified equation may be
developed. This should be carried out in conjunction with testing o f more slotted
square and rectangular HSS specimens with end welding.
3) In the validation of the finite element model, there was some uncertainties with regards
to results reported by Korol (1996). Thus, a few more specimens at low weld length
ratios should be tested to clarify these uncertainties.
4) The parametric study shows that weld height affects the net section efficiency when
the weld length ratio is below 1. Thus, specimens with different weld height should
be tested to confirm results o f the parametric study since all specimens in this testing
program have roughly the same weld height.
5) The current testing program focuses only on cold-formed non-stress relieved sections.
Hot-formed and cold-formed stress relieved HSS specimens should be tested to verify
the validity of the proposed model.
Reproduced with permission of the copyright owner. Further reproduction prohibited without permission.
REFERENCES
1. ABAQUS (2003), “ABAQUS version 6.4 Standard User’s Manual”, Hibbitt,
Karlsson & Sorensen Inc., Pawtucket, R.I.
2. Abdel-Rahman, N. and Sivakumaran, K.S. (1997), “Material Properties Models
for Analysis of Cold-Formed Steel Members”, Journal o f Structural Engineering,
ASCE, Vol. 123, No. 9, pp. 1135-1143.
3. AISC (1999), “Load and Resistance Factor Design Specification for Structural
Steel Building”, American Institute o f Steel Construction, Chicago, Illinois.
4. AISC (2000), “Load and Resistance Factor Design Specification for Steel Hollow
Structural Sections”, American Institute o f Steel Construction, Chicago, Illinois.
5. ANSI/AISC 360-05 (2005), “Specification for Structural Steel Buildings”,
American Institute o f Steel Construction, Chicago, Illinois.
6. ANSYS version 5.7 (2000), ANSYS Inc. Canonsburg, PA, USA.
7. ASTM (2004), “Standard Test Methods for Tension Testing o f Metallic Materials
[Metric]”, ASTM-E8-04, American Society for Testing and Materials,
Philadelphia, Pennsylvania.
8. Bridgman, P.W. (1943), “The Stress Distribution At the Neck o f A tension
Specimen”, A.S.M. Transactions Vol. 32, pp. 553-574.
Reproduced with permission of the copyright owner. Further reproduction prohibited without permission.
181
9. Bridgman, P.W. (1947), “Fracture and Hydrostatic Pressure”, A.M.S. Fracturing
of Metals, The Twenty-Ninth National Metal Congress and Exposition, Chicago,
Oct, 1947.
10. Chakrabarti, S.K. and Bjorhovde, R. (1985), “Tests o f Full Size Gusset Plate
Connections”, ASCE, Journal o f Structural Engineering, Vol. I l l , No. 3, pp.
667-684.
11. Cheng, J.J.R., Khoo, H.A. and Lemenhe, A. (2002), “Discussion of Design
Provision o f Welded Tension Members in Design Standards”, 4th Structural
Specialty Conference, Proceedings o f the 2002 Annual CSCE Conference,
Montreal, Quebec, Canada, 10 pages, ST-125.
12. Cheng, J.J.R., Kulak, G.L., and Khoo, H. (1998), “Strength of slotted tubular
tension members”, Canadian Journal o f Civil Engineering, Vol. 25, pp. 982-991.
13. CSA (2004), “General Requirements for Rolled or Welded Structural Quality
Steel/Structural Quality Steel”, CAN/CSA-G40.20/G40.21-04, Canadian
Standards Association, Rexdale, Ontario, Canada.
14. CSA (2001), “Limit States Design of Steel Structures”, Standard
CAN/CSA-S16.1-01, Canadian Standards Association, Rexdale, Ontario,
Canada.
15. Davis, R.P. and Boomsliter, G.P. (1934), “Tensile Tests o f Welded and Riveted
Structural Members”, Journal o f the American Welding Society, Vol. 13, No. 4,
pp. 21-27.
Reproduced with permission of the copyright owner. Further reproduction prohibited without permission.
182
16. Easterling, W.S. and Giroux L.G. (1993), “Shear Lag Effects in Steel Tension
Members”, Engineering Journal of the American Institute o f Steel Construction,
Vol. 30, pp. 77-89.
17. Huang, R.F. (2005), “An Experimental and Numerical Study o f Square and
Rectangular HSS Connections”, Masters Thesis, Carleton University, Ottawa,
Ontario, Canada.
18. Gaylord Jr., E.H., Gaylord, C.N. and Stallmeyer, J.E. (1992), “Design O f Steel
Structures”, 3rd Edition, McGraw-Hill Inc.
19. Gibson, G J. and Wake, B.T. (1942), “An Investigation o f Welded Connections
for Angel Tension Members”, Journal of the American Welding Society, Welding
Research Supplement, Vol. 21, No. 1, pp. 44-49.
20. Girard, C., Picard, A. and Fafard, M. (1995), “Finite Element Modeling o f the
Shear-Lag Effects in an HSS Welded to a Gusset Plate”, Canadian Journal o f
Civil Engineering, Vol. 22, No.4, pp. 651-659.
21. Gupta, M. and Gupta, L.M. (2004), “Evaluation o f Stress Distribution in Bolted
Steel Angles under Tension”, Electronic Journal o f Structural Engineering, No. 4,
pp. 17-27.
22. Hardash, S.G. and Bjorhovde, R. (1985), “New Design Criteria for Gusset Plates
in Tension”, Engineering Journal, AISC, Vol. 22, No. 2, pp. 77-94.
23. Hollomon, J.H. (1945), “Tensile Deformation”, A.I.M.E. Trans Vol. 162,
pp.268-290.
Reproduced with permission of the copyright owner. Further reproduction prohibited without permission.

183
24. Karren, K.W. and Winter, G. (1967), “Effects of Cold-forming on Light-Gage
Steel Members”, Journal o f Structural Division, ASCE, Vol. 93, No. ST1, Proc.
Paper 5113, February, 1967, pp. 433-469.
25. Khoo, H.A. Cheng, J.J.R. and Hrudey, T.M. (2002), “Determine Steel Properties
for Large Strain from a Standard Tension Test”, 2nd Material Specialty
Conference of the Canadian Society for Civil Engineering, Montreal, Quebec,
Canada, 10 pages, MA-029.
26. Korol, R.M., Mirza, F.A. and Mirza, M.Y. (1994), “Investigation o f Shear Lag in
Slotted HSS Tension Members,” Proceedings o f the Vlth International
Symposium on Tubular Structures, Melbourne, Australia, pp. 473—482.
27. Korol, R.M. (1996), “Shear Lag in Slotted HSS Tension Members”, Canadian
Journal o f Civil Engineering, Vol.22, No.6, pp. 1350-1354.
28. Kulak, G.L. and Wu, E.Y. (1997), “Shear Lag in Bolted Angle Tension members”,
Journal o f Structural Engineering, Vol. 123, No. 9, pp. 1144-1152.
29. Kulak, G.L., Fisher, J.W. and Struik, J.H.A. (1987), “Guide to Design Criteria for
Bolted and Riveted Joints”, 2nd Edition, John Wiley & Sons. Inc.
30. Le Roy, G., Embury, J.D., Edwards, G. and Ashby, M.F., (1981), “A Model of
Ductile Fracture Based on the Nucleation and Growth of Voids”, Acta Metall. 29,
1509-1522.
31. Madugula, M.K.S. and Mohan, S. (1988), “Angles in Eccentric Tension”, Journal
o f Structural Engineering, Vol. 114, No. 10, pp. 2387-2396.
Reproduced with permission of the copyright owner. Further reproduction prohibited without permission.
184
32. Matic, P. (1985), “Numerical Predicting Ductile Material Behavior from Tensile
Specimen Response”, Theoretical and Applied Facture Mechanics 4 (1985)
13-28.
33. Munse, W.H. and Chesson, E. (1963), “Riveted and Bolted Joints: Net Section
Design”, ASCE Journal o f the Structural Division, Vol. 89, No. ST 1, pp.
107-126.
34. Chesson, E. and Munse, W.H. (1963), “Riveted and Bolted Joints: Truss-type
Tensile Connections”, Journal o f the Structural Division, Vol. 89, No. ST 1, pp.
67-106.
35. Naqvi, Z. (2004), “Constitutive Properties o f Weld Metal and Heat-Affected Zone
at a Butt Weld”, Masters Thesis, Carleton University, Ottawa, Ontario, Canada.
36. Naqvi, Z. and Khoo, H. (2004), “Constitutive Properties o f Weld Metal and
Heat-Affected Zone at a Butt Weld” , Proceedings o f the 5th Structural Specialty
Conference of the Canadian Society for Civil Engineering, Saskatoon,
Saskatchewan, Canada, 10 pages, ST-150.
37. Uzoegbo, H.C. (1998), “Shear Lag in Steel Angles: an Investigation o f the South
African Standards”, Journal o f Constructional Steel Research, Vol. 46, No. 1-3,
Paper No. 348.
38. Willibald, S., Packer, J.A., Saucedo, G. Ma and Puthli, R.S. (2004), “Shear Lag in
Slotted Gusset Plate Connections to Tubes”, ECCS / AISC Workshop,
Reproduced with permission of the copyright owner. Further reproduction prohibited without permission.
185
Connections in Steel Structures V: Innovative Steel Connections, Amsterdam,
The Netherlands, 11 pages.
39. Wu, Y. and Kulak, G.L. (1993), “Shear Lag in Bolted Single and Double Angle
Tension Members”, Structural Engineering Report No. 187, Department o f
Civil Engineering, University o f Alberta, Edmonton, Canada.
40. Zhang, Z.L., Hauge, M., Odegard, J., Thaulow, C. (1999), “Determining Material
True Stress-Strain Curve From Tensile Specimens with Rectangular
Cross-Section”, International Journal o f Solids and Structures 36 (1999), pp.
3497-3516.
Reproduced with permission of the copyright owner. Further reproduction prohibited without permission.
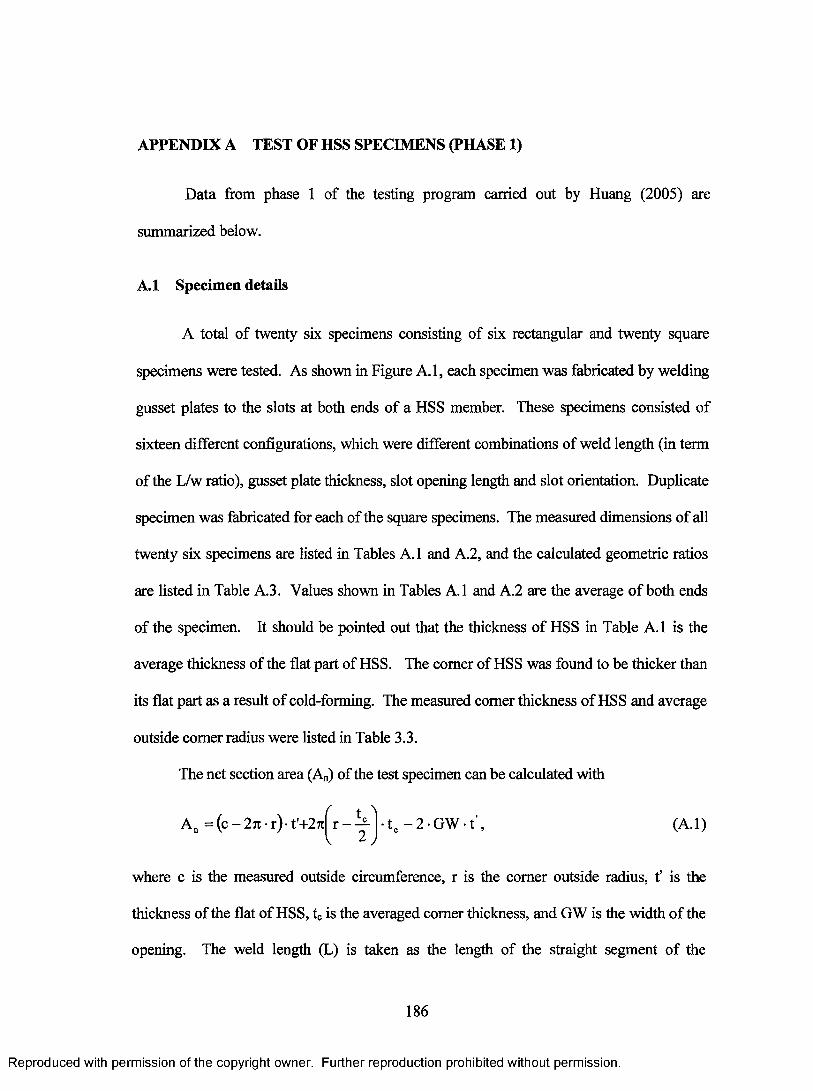
APPENDIX A TEST OF HSS SPECIMENS (PHASE 1)
Data from phase 1 of the testing program carried out by Huang (2005) are
summarized below.
A.1 Specimen details
A total o f twenty six specimens consisting of six rectangular and twenty square
specimens were tested. As shown in Figure A.1, each specimen was fabricated by welding
gusset plates to the slots at both ends of a HSS member. These specimens consisted of
sixteen different configurations, which were different combinations of weld length (in term
of the L/w ratio), gusset plate thickness, slot opening length and slot orientation. Duplicate
specimen was fabricated for each of the square specimens. The measured dimensions o f all
twenty six specimens are listed in Tables A.1 and A.2, and the calculated geometric ratios
are listed in Table A.3. Values shown in Tables A.1 and A.2 are the average o f both ends
of the specimen. It should be pointed out that the thickness o f HSS in Table A.1 is the
average thickness of the flat part o f HSS. The comer of HSS was found to be thicker than
its flat part as a result o f cold-forming. The measured comer thickness o f HSS and average
outside comer radius were listed in Table 3.3.
The net section area (An) of the test specimen can be calculated with
A n = (c - 271 • r) • t'+27t( or - —
v 2 ,• tc - 2 - G W - t , (A.1)
where c is the measured outside circumference, r is the comer outside radius, t’ is the
thickness of the flat of HSS, tc is the averaged comer thickness, and GW is the width o f the
opening. The weld length (L) is taken as the length o f the straight segment o f the
186
Reproduced with permission of the copyright owner. Further reproduction prohibited without permission.
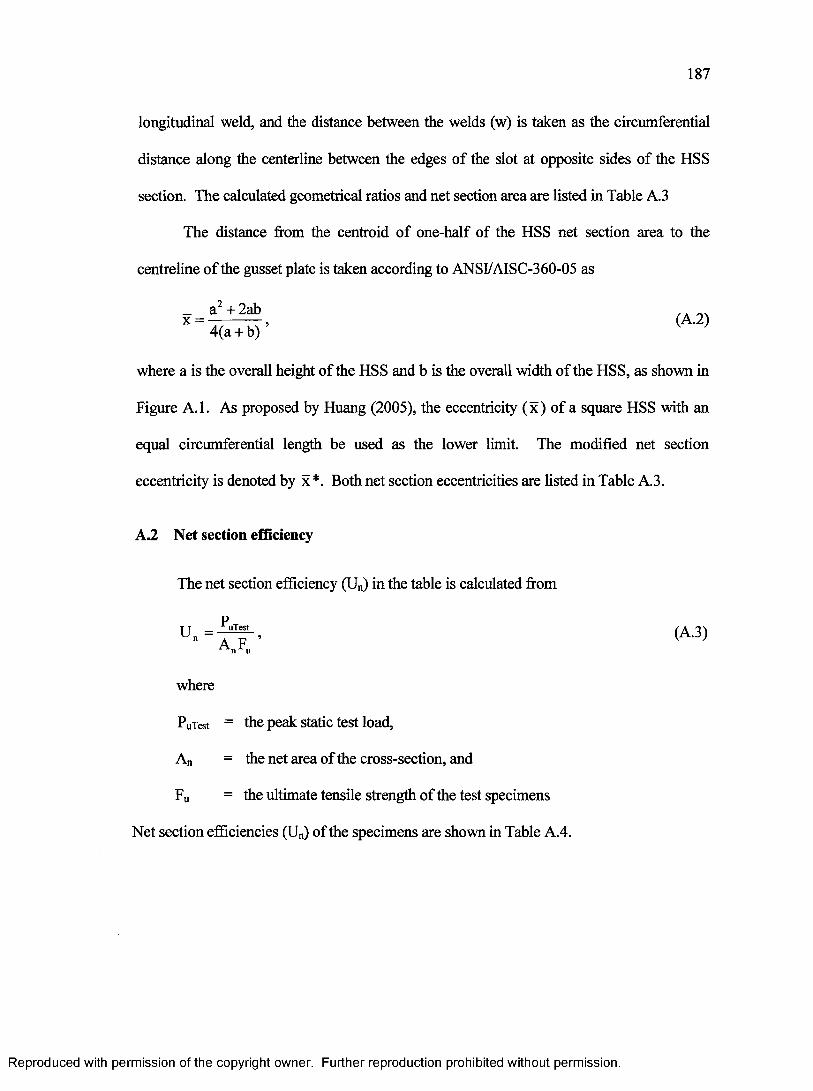
187
longitudinal weld, and the distance between the welds (w) is taken as the circumferential
distance along the centerline between the edges o f the slot at opposite sides o f the HSS
section. The calculated geometrical ratios and net section area are listed in Table A.3
The distance from the centroid o f one-half of the HSS net section area to the
centreline o f the gusset plate is taken according to ANSI/AISC-360-05 as
x = a +2ab (A.2)4(a + b)
where a is the overall height o f the HSS and b is the overall width o f the HSS, as shown in
Figure A .I. As proposed by Huang (2005), the eccentricity ( x ) o f a square HSS with an
equal circumferential length be used as the lower limit. The modified net section
eccentricity is denoted by x *. Both net section eccentricities are listed in Table A.3.
A.2 Net section efficiency
The net section efficiency (Un) in the table is calculated from
U „ = ^ - , (A.3)A nFu
where
PuTest = the peak static test load,
An = the net area o f the cross-section, and
Fu = the ultimate tensile strength of the test specimens
Net section efficiencies (Un) of the specimens are shown in Table A.4.
Reproduced with permission of the copyright owner. Further reproduction prohibited without permission.
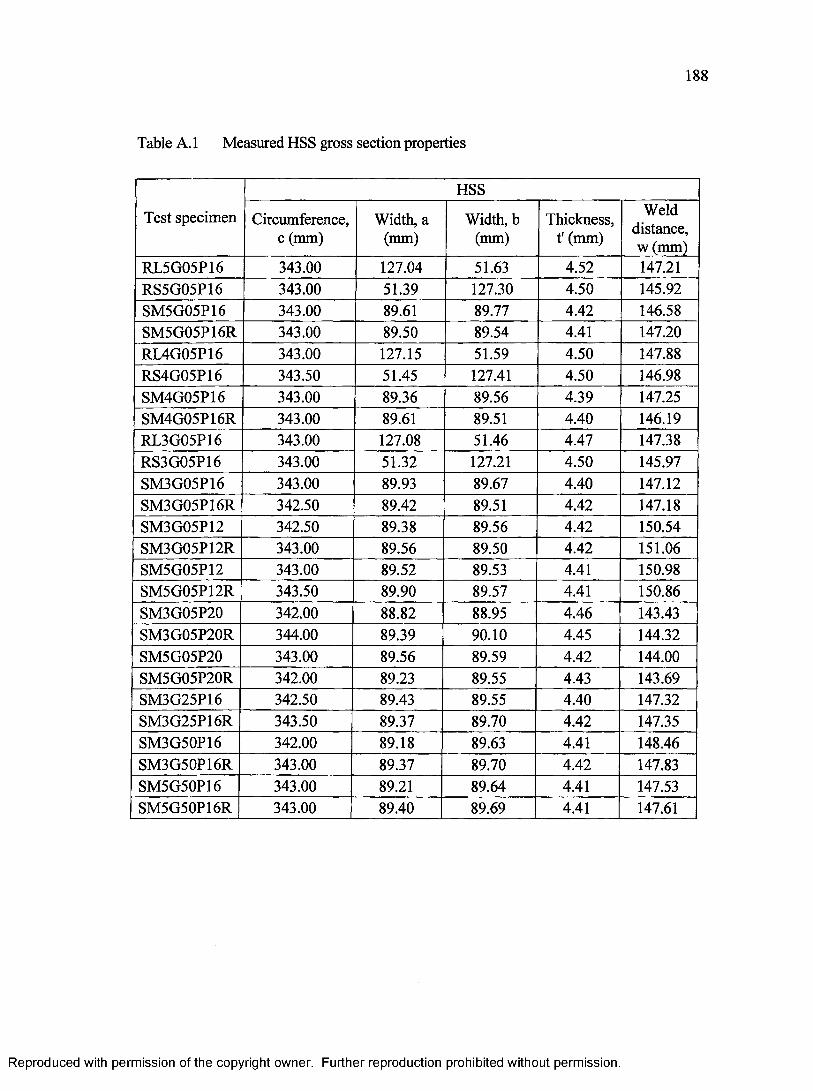
188
Table A. 1 Measured HSS gross section properties
Test specimen
HSS
Circumference, c (mm)
Width, a (mm)
Width, b (mm)
Thickness, t' (mm)
Weld distance, w (mm)
RL5G05P16 343.00 127.04 51.63 4.52 147.21RS5G05P16 343.00 51.39 127.30 4.50 145.92SM5G05P16 343.00 89.61 89.77 4.42 146.58SM5G05P16R 343.00 89.50 89.54 4.41 147.20RL4G05P16 343.00 127.15 51.59 4.50 147.88RS4G05P16 343.50 51.45 127.41 4.50 146.98SM4G05P16 343.00 89.36 89.56 4.39 147.25SM4G05P16R 343.00 89.61 89.51 4.40 146.19RL3G05P16 343.00 127.08 51.46 4.47 147.38RS3G05P16 343.00 51.32 127.21 4.50 145.97SM3G05P16 343.00 89.93 89.67 4.40 147.12SM3G05P16R 342.50 89.42 89.51 4.42 147.18SM3G05P12 342.50 89.38 89.56 4.42 150.54SM3G05P12R 343.00 89.56 89.50 4.42 151.06SM5G05P12 343.00 89.52 89.53 4.41 150.98SM5G05P12R 343.50 89.90 89.57 4.41 150.86SM3G05P20 342.00 88.82 88.95 4.46 143.43SM3G05P20R 344.00 89.39 90.10 4.45 144.32SM5G05P20 343.00 89.56 89.59 4.42 144.00SM5G05P20R 342.00 89.23 89.55 4.43 143.69SM3G25P16 342.50 89.43 89.55 4.40 147.32SM3G25P16R 343.50 89.37 89.70 4.42 147.35SM3G50P16 342.00 89.18 89.63 4.41 148.46SM3G50P16R 343.00 89.37 89.70 4.42 147.83SM5G50P16 343.00 89.21 89.64 4.41 147.53SM5G50P16R 343.00 89.40 89.69 4.41 147.61
Reproduced with permission of the copyright owner. Further reproduction prohibited without permission.
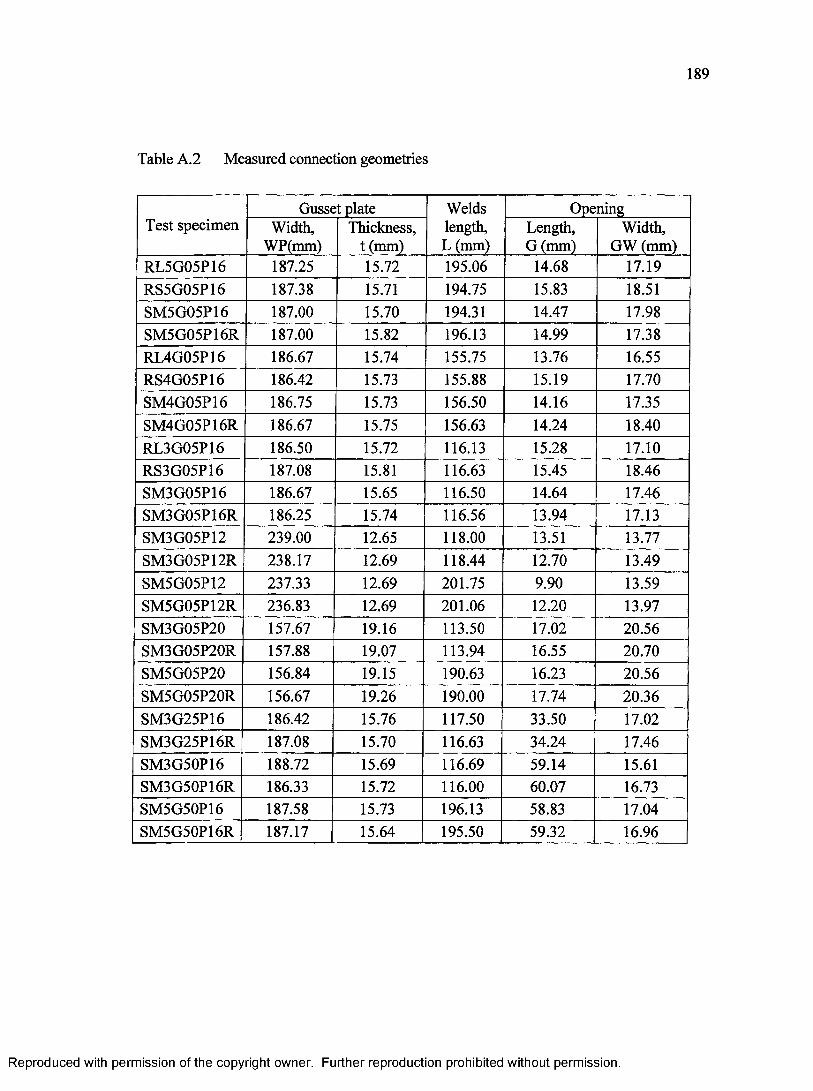
189
Table A.2 Measured connection geometries
Test specimenGusset plate Welds
length, L (mm)
OpeningWidth,
WP(mm)Thickness,
t (mm)Length, G (mm)
Width, GW (mm)
RL5G05P16 187.25 15.72 195.06 14.68 17.19RS5G05P16 187.38 15.71 194.75 15.83 18.51SM5G05P16 187.00 15.70 194.31 14.47 17.98SM5G05P16R 187.00 15.82 196.13 14.99 17.38RL4G05P16 186.67 15.74 155.75 13.76 16.55RS4G05P16 186.42 15.73 155.88 15.19 17.70SM4G05P16 186.75 15.73 156.50 14.16 17.35SM4G05P16R 186.67 15.75 156.63 14.24 18.40RL3G05P16 186.50 15.72 116.13 15.28 17.10RS3G05P16 187.08 15.81 116.63 15.45 18.46SM3G05P16 186.67 15.65 116.50 14.64 17.46SM3G05P16R 186.25 15.74 116.56 13.94 17.13SM3G05P12 239.00 12.65 118.00 13.51 13.77SM3G05P12R 238.17 12.69 118.44 12.70 13.49SM5G05P12 237.33 12.69 201.75 9.90 13.59SM5G05P12R 236.83 12.69 201.06 12.20 13.97SM3G05P20 157.67 19.16 113.50 17.02 20.56SM3G05P20R 157.88 19.07 113.94 16.55 20.70SM5G05P20 156.84 19.15 190.63 16.23 20.56SM5G05P20R 156.67 19.26 190.00 17.74 20.36SM3G25P16 186.42 15.76 117.50 33.50 17.02SM3G25P16R 187.08 15.70 116.63 34.24 17.46SM3G50P16 188.72 15.69 116.69 59.14 15.61SM3G50P16R 186.33 15.72 116.00 60.07 16.73SM5G50P16 187.58 15.73 196.13 58.83 17.04SM5G50P16R 187.17 15.64 195.50 59.32 16.96
Reproduced with permission of the copyright owner. Further reproduction prohibited without permission.
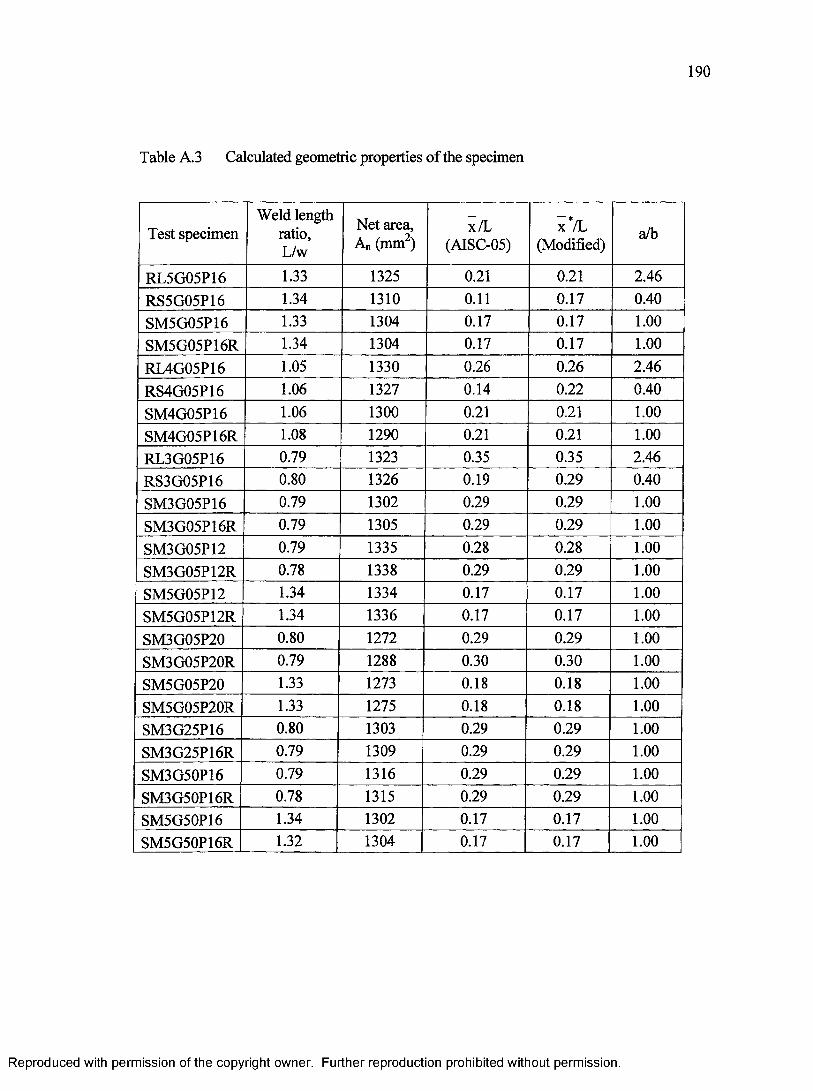
190
Table A.3 Calculated geometric properties of the specimen
Test specimenWeld length
ratio, L/w
Net area, An (mm2)
x/L(AISC-05)
x */l(Modified)
a/b
RL5G05P16 1.33 1325 0.21 0.21 2.46
RS5G05P16 1.34 1310 0.11 0.17 0.40SM5G05P16 1.33 1304 0.17 0.17 1.00
SM5G05P16R 1.34 1304 0.17 0.17 1.00
RL4G05P16 1.05 1330 0.26 0.26 2.46
RS4G05P16 1.06 1327 0.14 0.22 0.40
SM4G05P16 1.06 1300 0.21 0.21 1.00
SM4G05P16R 1.08 1290 0.21 0.21 1.00
RL3G05P16 0.79 1323 0.35 0.35 2.46
RS3G05P16 0.80 1326 0.19 0.29 0.40
SM3G05P16 0.79 1302 0.29 0.29 1.00
SM3G05P16R 0.79 1305 0.29 0.29 1.00SM3G05P12 0.79 1335 0.28 0.28 1.00SM3G05P12R 0.78 1338 0.29 0.29 1.00SM5G05P12 1.34 1334 0.17 0.17 1.00SM5G05P12R 1.34 1336 0.17 0.17 1.00SM3G05P20 0.80 1272 0.29 0.29 1.00SM3G05P20R 0.79 1288 0.30 0.30 1.00SM5G05P20 1.33 1273 0.18 0.18 1.00SM5G05P20R 1.33 1275 0.18 0.18 1.00SM3G25P16 0.80 1303 0.29 0.29 1.00SM3G25P16R 0.79 1309 0.29 0.29 1.00
SM3G50P16 0.79 1316 0.29 0.29 1.00SM3G50P16R 0.78 1315 0.29 0.29 1.00SM5G50P16 1.34 1302 0.17 0.17 1.00SM5G50P16R 1.32 1304 0.17 0.17 1.00
Reproduced with permission of the copyright owner. Further reproduction prohibited without permission.
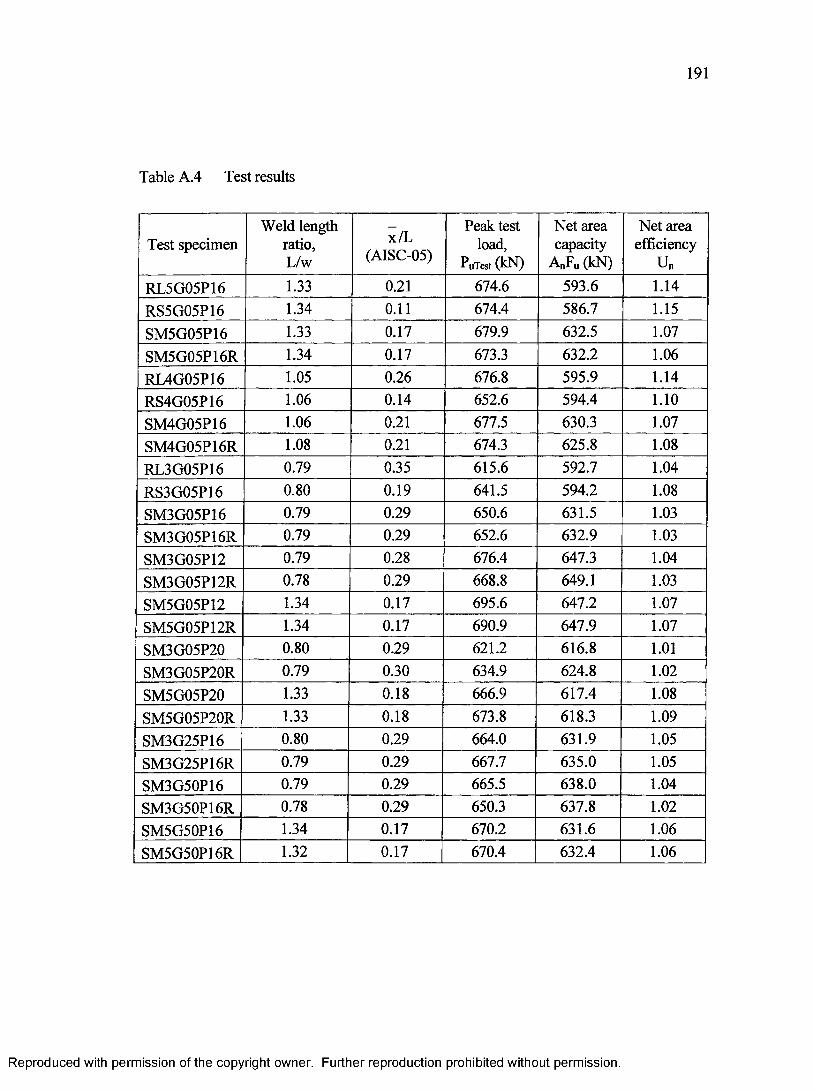
191
Table A.4 Test results
Test specimenWeld length
ratio, L/w
x/L(AISC-05)
Peak test load,
PuTest (kN)
Net area capacity
A„Fu (kN)
Net area efficiency
u„RL5G05P16 1.33 0.21 674.6 593.6 1.14
RS5G05P16 1.34 0.11 674.4 586.7 1.15
SM5G05P16 1.33 0.17 679.9 632.5 1.07
SM5G05P16R 1.34 0.17 673.3 632.2 1.06
RL4G05P16 1.05 0.26 676.8 595.9 1.14
RS4G05P16 1.06 0.14 652.6 594.4 1.10
SM4G05P16 1.06 0.21 677.5 630.3 1.07
SM4G05P16R 1.08 0.21 674.3 625.8 1.08
RL3G05P16 0.79 0.35 615.6 592.7 1.04
RS3G05P16 0.80 0.19 641.5 594.2 1.08
SM3G05P16 0.79 0.29 650.6 631.5 1.03
SM3G05P16R 0.79 0.29 652.6 632.9 1.03SM3G05P12 0.79 0.28 676.4 647.3 1.04
SM3G05P12R 0.78 0.29 668.8 649.1 1.03SM5G05P12 1.34 0.17 695.6 647.2 1.07SM5G05P12R 1.34 0.17 690.9 647.9 1.07SM3G05P20 0.80 0.29 621.2 616.8 1.01
SM3G05P20R 0.79 0.30 634.9 624.8 1.02
SM5G05P20 1.33 0.18 666.9 617.4 1.08SM5G05P20R 1.33 0.18 673.8 618.3 1.09SM3G25P16 0.80 0.29 664.0 631.9 1.05SM3G25P16R 0.79 0.29 667.7 635.0 1.05SM3G50P16 0.79 0.29 665.5 638.0 1.04
SM3G50P16R 0.78 0.29 650.3 637.8 1.02SM5G50P16 1.34 0.17 670.2 631.6 1.06SM5G50P16R 1.32 0.17 670.4 632.4 1.06
Reproduced with permission of the copyright owner. Further reproduction prohibited without permission.
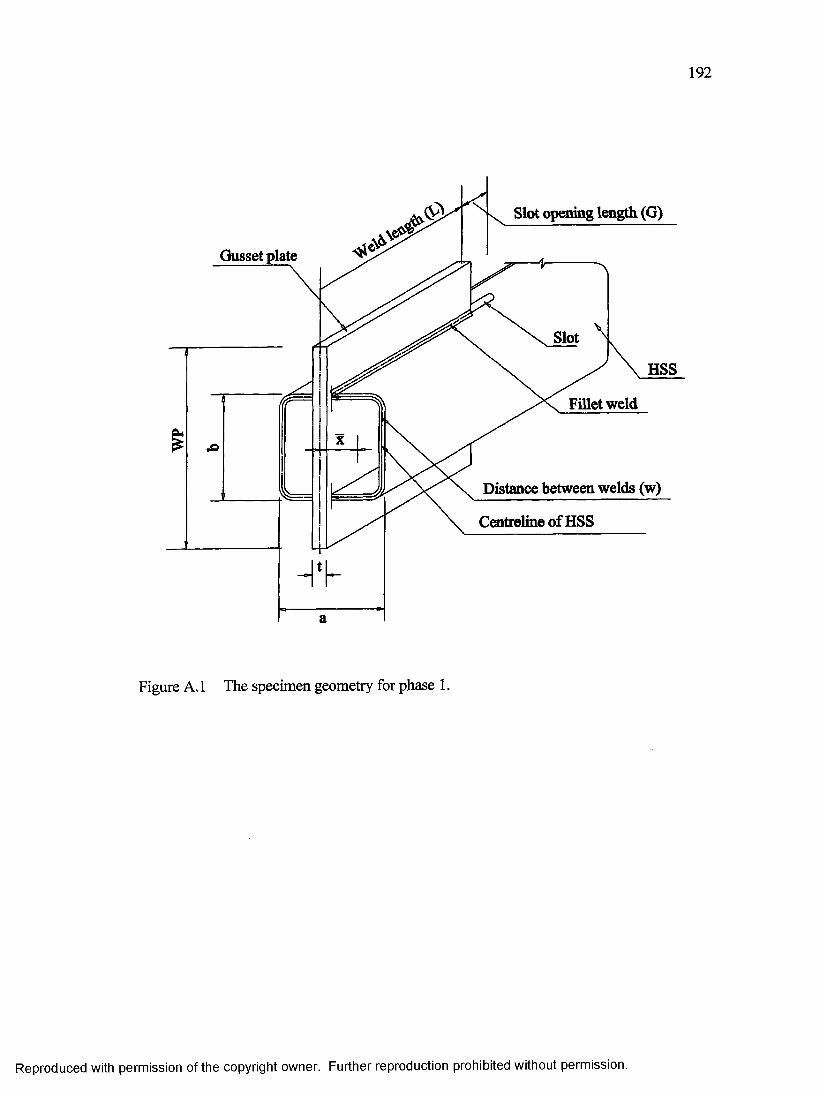
192
Slot opening length (G)
Gusset plate
Slot
HSS
Fillet weld
Distance between welds (w)
Centreline of HSS
Figure A. 1 The specimen geometry for phase 1.
Reproduced with permission of the copyright owner. Further reproduction prohibited without permission.
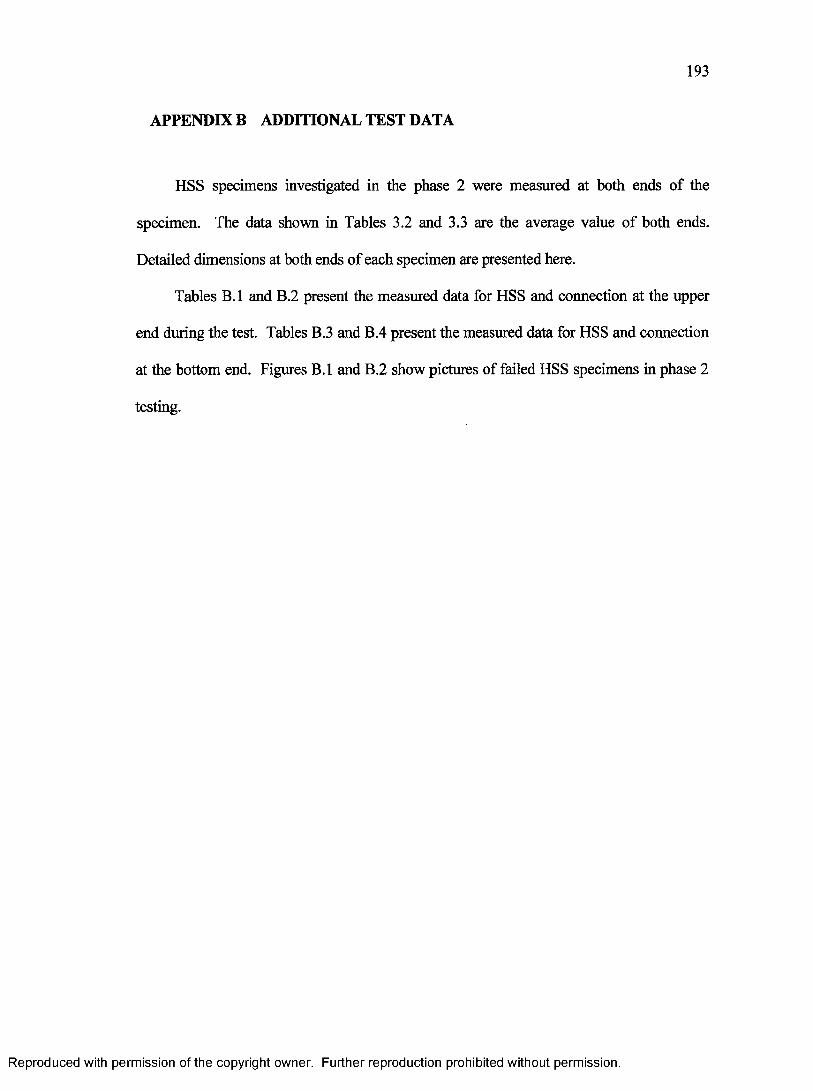
193
APPENDIX B ADDITIONAL TEST DATA
HSS specimens investigated in the phase 2 were measured at both ends of the
specimen. The data shown in Tables 3.2 and 3.3 are the average value o f both ends.
Detailed dimensions at both ends o f each specimen are presented here.
Tables B .l and B.2 present the measured data for HSS and connection at the upper
end during the test. Tables B.3 and B.4 present the measured data for HSS and connection
at the bottom end. Figures B .l and B.2 show pictures of failed HSS specimens in phase 2
testing.
Reproduced with permission of the copyright owner. Further reproduction prohibited without permission.
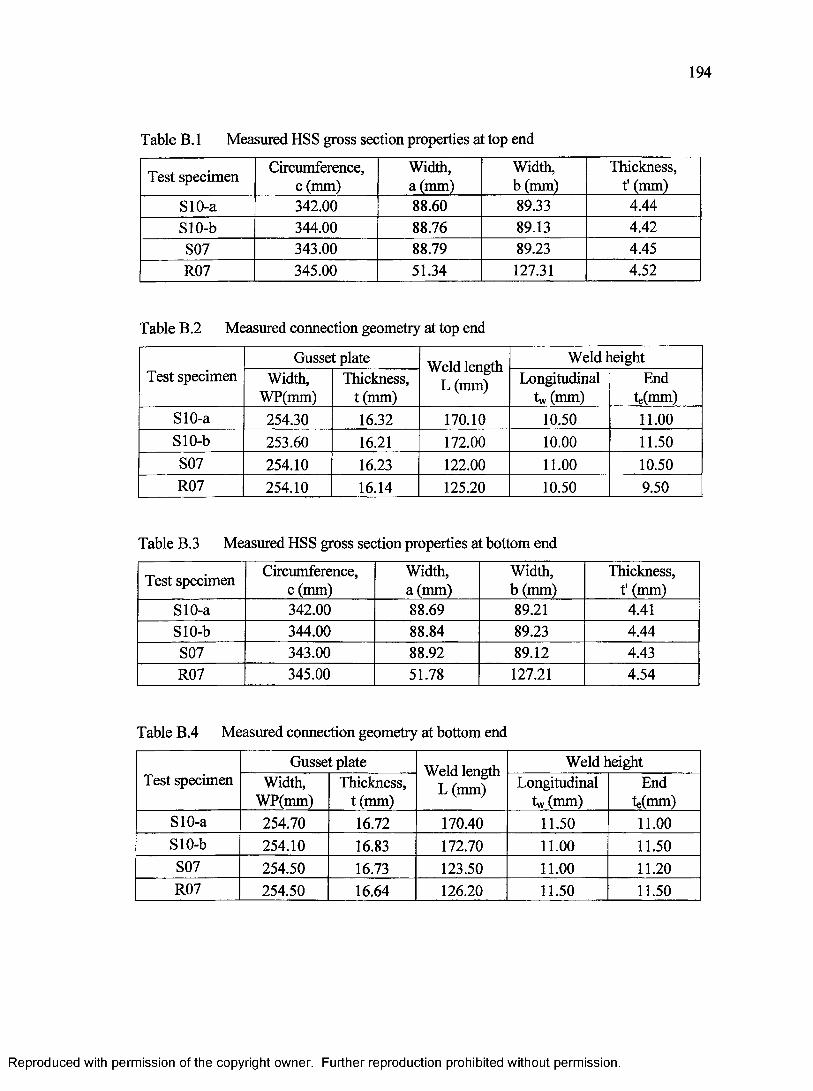
194
Table B. 1 Measured HSS gross section properties at top end
Test specimen Circumference, c (mm)
Width, a (mm)
Width, b (mm)
Thickness, t' (mm)
SlO-a 342.00 88.60 89.33 4.44SlO-b 344.00 88.76 89.13 4.42S07 343.00 88.79 89.23 4.45R07 345.00 51.34 127.31 4.52
Table B.2 Measured connection geometry at top end
Test specimenGusset plate Weld length
L (mm)
Weld heightWidth,
WP(mm)Thickness,
t(m m)Longitudinal
tw (mm)End
te(mm)SlO-a 254.30 16.32 170.10 10.50 11.00SlO-b 253.60 16.21 172.00 10.00 11.50S07 254.10 16.23 122.00 11.00 10.50R07 254.10 16.14 125.20 10.50 9.50
Table B.3 Measured HSS gross section properties at bottom end
Test specimen Circumference, c (mm)
Width, a (mm)
Width,b(m m )
Thickness, t' (mm)
SlO-a 342.00 88.69 89.21 4.41SlO-b 344.00 88.84 89.23 4.44S07 343.00 88.92 89.12 4.43R07 345.00 51.78 127.21 4.54
Table B.4 Measured connection geometry at bottom end
Test specimenGusset plate Weld length
L (mm)
Weld heightWidth,
WP(mm)Thickness,
t (mm)Longitudinal
tw (mm)End
te(mm)SlO-a 254.70 16.72 170.40 11.50 11.00SlO-b 254.10 16.83 172.70 11.00 11.50S07 254.50 16.73 123.50 11.00 11.20R07 254.50 16.64 126.20 11.50 11.50
Reproduced with permission of the copyright owner. Further reproduction prohibited without permission.
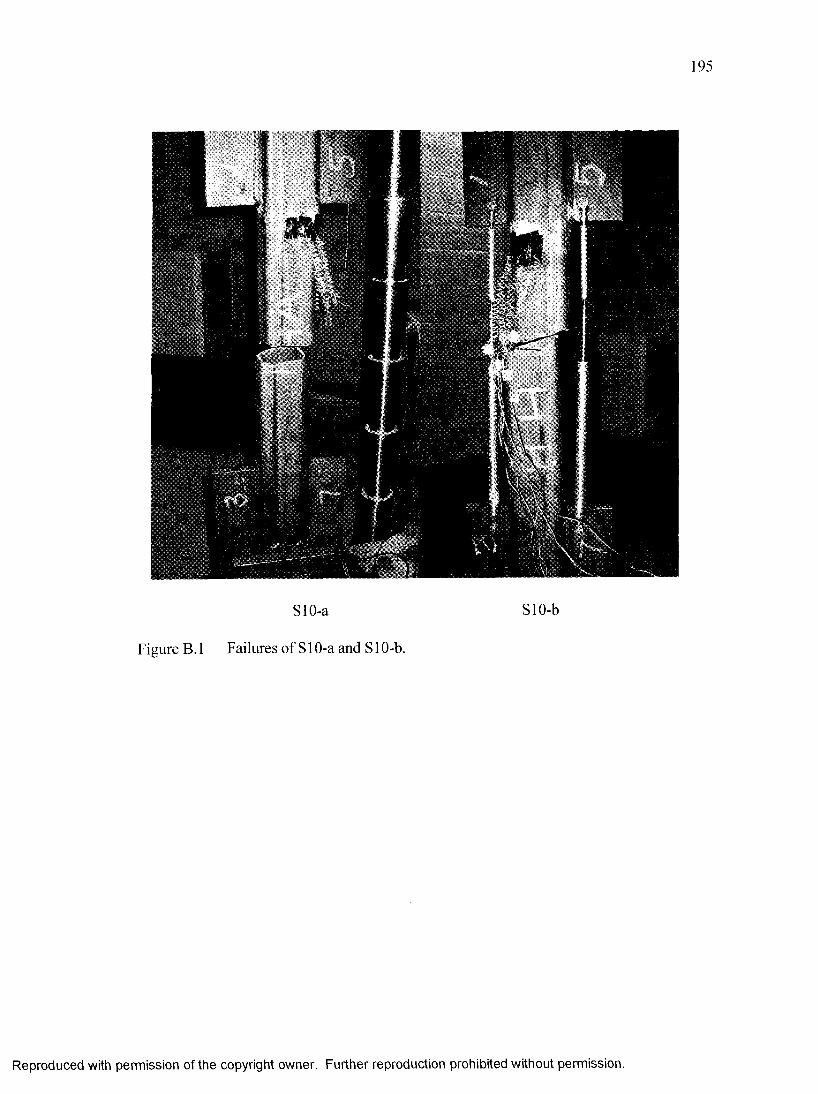
Figure B.l
SlO-a
Failures of S10-a and S10-b.
SlO-b
Reproduced with permission of the copyright owner. Further reproduction prohibited without permission.
196
S07 R07
Figure B.2 Failures of S07 and R07.
Reproduced with permission of the copyright owner. Further reproduction prohibited without permission.
197
APPENDIX C TENSION COUPON TEST
Tension coupon tests were carried out to obtain material properties of the test
specimen. Tests of tension coupons for phase 1 materials were carried out by
Huang (2005). Since tension coupons o f cold-formed HSS have no well defined yield
plateau, the yield strength of the HSS is calculated using the 0.2% offset method. The
definitions o f yield strength (Fy) and ultimate strength (Fu) for HSS coupons are shown in
Figure C. 1. The yield strength of the gusset plate is taken as the proportional limit or the
end o f the yield plateau of the engineering stress versus engineering strain curve. The yield
strength (Fy) and ultimate strength (F„) o f all the tested tension coupons for both phases of
tests are listed in Table C.l.
Two material ductility values are also reported. One is the percentage elongation
over a 50.0 mm gauge length o f the coupon at fracture. The other is the ratio o f the original
cross-section area over the cross-section area at fracture, Ao/Af. Ao is the original cross-
section area and Af is the cross-section area of the coupon at fracture. Three cross-section
areas at fracture (Af, AfCor and Afmid) are presented in Table C .l. A typical cross-section of
a rectangular coupon at the necking region was shown in Figure 2.5. The cross-section
area A, Acor and Amid at the necking region are defined by (2.33) in Section 2.4.
The engineering stress versus extensometer strain curves o f coupons for phase 1
materials are shown in Figures C.2 to C.5 except that for the rectangular HSS. The
engineering stress versus extensometer strain curve of rectangular HSS is presented in
Figure 3.14 because the rectangular HSS used in both testing phases have the same material
properties. The sudden termination o f the stress versus extensometer strain curve
immediately after the peak stress is because the extensometer was removed after that point
Reproduced with permission of the copyright owner. Further reproduction prohibited without permission.
198
and not due to coupon fracture. True stress versus true plastic strain relationship for each
material is in Tables C.2 and C.3.
Reproduced with permission of the copyright owner. Further reproduction prohibited without permission.
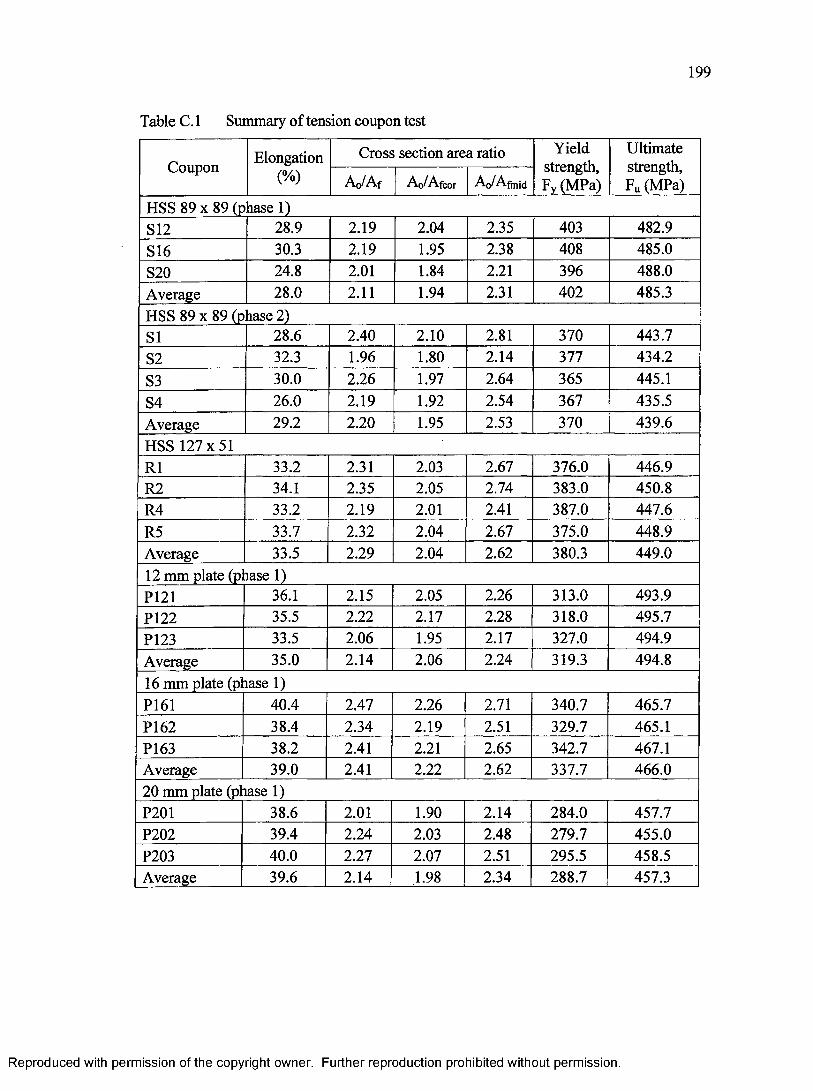
199
Table C. 1 Summary of tension coupon test
Coupon Elongation(%)
Cross section area ratio Yield strength, Fy (MPa)
Ultimate strength, Fu (MPa)Ao/Af A0/AfCor Aq/Afmid
HSS 89 x 89 (phase 1)S12 28.9 2.19 2.04 2.35 403 482.9S16 30.3 2.19 1.95 2.38 408 485.0S20 24.8 2.01 1.84 2.21 396 488.0Average 28.0 2.11 1.94 2.31 402 485.3HSS 89 x 89 (p rase 2)SI 28.6 2.40 2.10 2.81 370 443.7S2 32.3 1.96 1.80 2.14 377 434.2
S3 30.0 2.26 1.97 2.64 365 445.1S4 26.0 2.19 1.92 2.54 367 435.5Average 29.2 2.20 1.95 2.53 370 439.6HSS 127x51R1 33.2 2.31 2.03 2.67 376.0 446.9R2 34.1 2.35 2.05 2.74 383.0 450.8R4 33.2 2.19 2.01 2.41 387.0 447.6R5 33.7 2.32 2.04 2.67 375.0 448.9Average 33.5 2.29 2.04 2.62 380.3 449.012 mm plate (p rase 1)P121 36.1 2.15 2.05 2.26 313.0 493.9P122 35.5 2.22 2.17 2.28 318.0 495.7P123 33.5 2.06 1.95 2.17 327.0 494.9Average 35.0 2.14 2.06 2.24 319.3 494.816 mm plate (p lase 1)P161 40.4 2.47 2.26 2.71 340.7 465.7P162 38.4 2.34 2.19 2.51 329.7 465.1P163 38.2 2.41 2.21 2.65 342.7 467.1Average 39.0 2.41 2.22 2.62 337.7 466.020 mm plate (p Lase 1)P201 38.6 2.01 1.90 2.14 284.0 457.7P202 39.4 2.24 2.03 2.48 279.7 455.0P203 40.0 2.27 2.07 2.51 295.5 458.5Average 39.6 2.14 1.98 2.34 288.7 457.3
Reproduced with permission of the copyright owner. Further reproduction prohibited without permission.
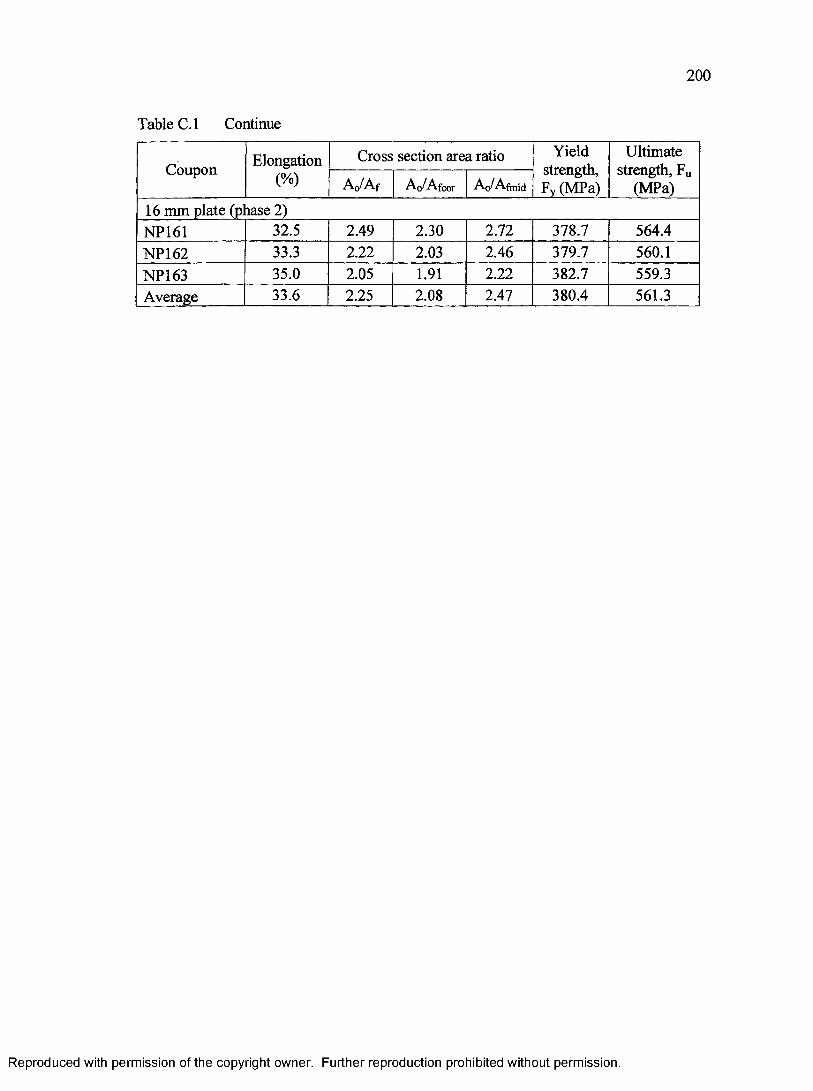
200
Table C. 1 Continue
Coupon Elongation(%)
Cross section area ratio Yield strength, Fv (MPa)
Ultimate strength, Fu
(MPa)Ao/Af Ao/Afcor Aq/ Afraid
16 mm plate (p lase 2)NP161 32.5 2.49 2.30 2.72 378.7 564.4NP162 33.3 2.22 2.03 2.46 379.7 560.1NP163 35.0 2.05 1.91 2.22 382.7 559.3Average 33.6 2.25 2.08 2.47 380.4 561.3
Reproduced with permission of the copyright owner. Further reproduction prohibited without permission.
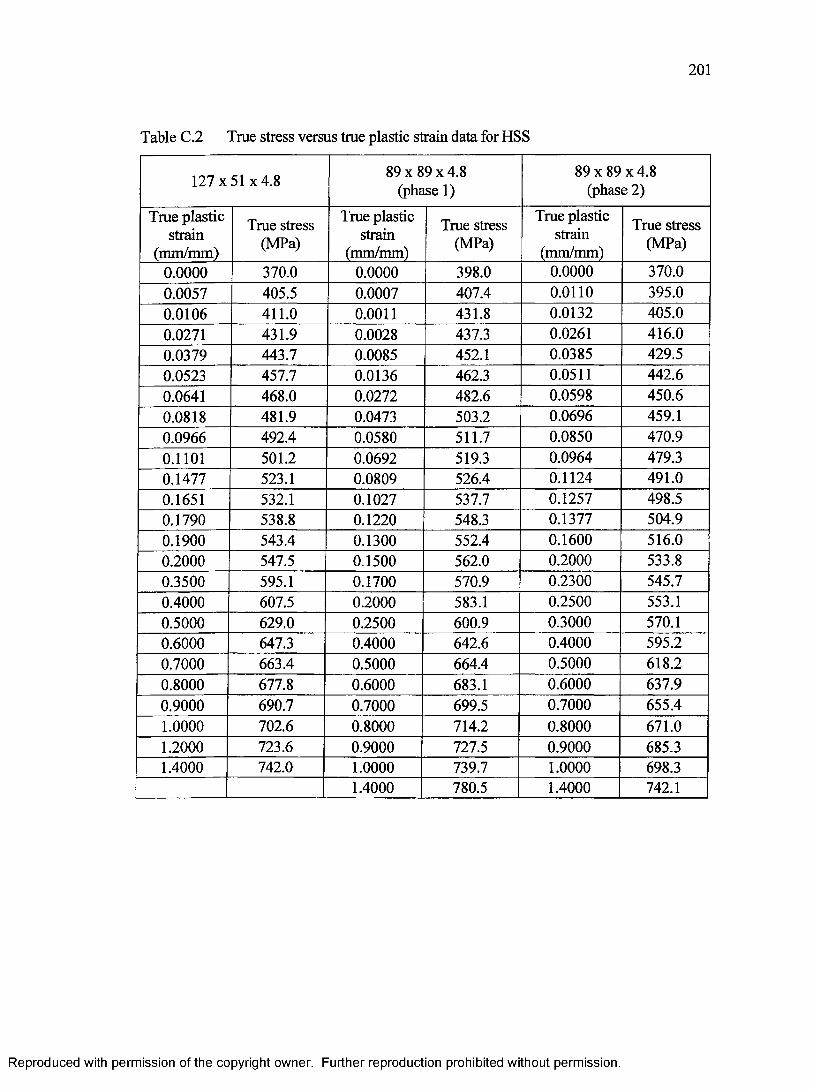
201
Table C.2 True stress versus true plastic strain data for HSS
127x51 x 4.8 89 x 89 x 4.8 89 x 89 x 4.8(phase 1) (phase 2)
True plastic strain
(mm/mm)
True stress (MPa)
True plastic strain
(mm/mm)
True stress (MPa)
True plastic strain
(mm/mm)
True stress (MPa)
0.0000 370.0 0.0000 398.0 0.0000 370.00.0057 405.5 0.0007 407.4 0.0110 395.00.0106 411.0 0.0011 431.8 0.0132 405.00.0271 431.9 0.0028 437.3 0.0261 416.00.0379 443.7 0.0085 452.1 0.0385 429.50.0523 457.7 0.0136 462.3 0.0511 442.60.0641 468.0 0.0272 482.6 0.0598 450.60.0818 481.9 0.0473 503.2 0.0696 459.10.0966 492.4 0.0580 511.7 0.0850 470.90.1101 501.2 0.0692 519.3 0.0964 479.30.1477 523.1 0.0809 526.4 0.1124 491.00.1651 532.1 0.1027 537.7 0.1257 498.50.1790 538.8 0.1220 548.3 0.1377 504.90.1900 543.4 0.1300 552.4 0.1600 516.00.2000 547.5 0.1500 562.0 0.2000 533.80.3500 595.1 0.1700 570.9 0.2300 545.70.4000 607.5 0.2000 583.1 0.2500 553.10.5000 629.0 0.2500 600.9 0.3000 570.10.6000 647.3 0.4000 642.6 0.4000 595.20.7000 663.4 0.5000 664.4 0.5000 618.20.8000 677.8 0.6000 683.1 0.6000 637.90.9000 690.7 0.7000 699.5 0.7000 655.41.0000 702.6 0.8000 714.2 0.8000 671.01.2000 723.6 0.9000 727.5 0.9000 685.31.4000 742.0 1.0000 739.7 1.0000 698.3
1.4000 780.5 1.4000 742.1
Reproduced with permission of the copyright owner. Further reproduction prohibited without permission.
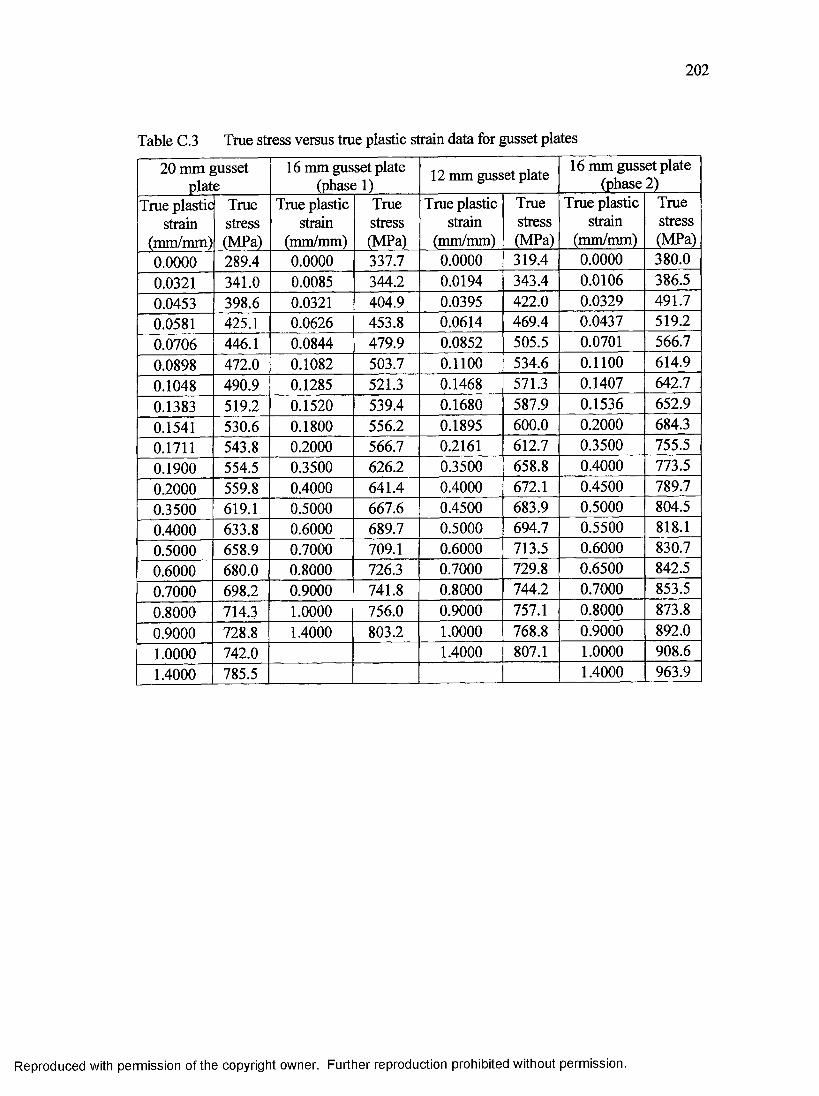
202
Table C.3 True stress versus true plastic strain data for gusset plates
20 mm gusset plate
16 mm gusset plate (phase 1)
12 mm gusset plate 16 mm gusset plate (phase 2)
True plastic True Tme plastic True True plastic Tme Tme plastic Tmestrain stress strain stress strain stress strain stress
(mm/mm) (MPa) (mm/mm) (MPa) (mm/mm) (MPa) (mm/mm) (MPa)0.0000 289.4 0.0000 337.7 0.0000 319.4 0.0000 380.0
0.0321 341.0 0.0085 344.2 0.0194 343.4 0.0106 386.50.0453 398.6 0.0321 404.9 0.0395 422.0 0.0329 491.70.0581 425.1 0.0626 453.8 0.0614 469.4 0.0437 519.2
0.0706 446.1 0.0844 479.9 0.0852 505.5 0.0701 566.7
0.0898 1 472.0 0.1082 503.7 0.1100 534.6 0.1100 614.9
0.1048 490.9 0.1285 521.3 0.1468 571.3 0.1407 642.7
0.1383 519.2 0.1520 539.4 0.1680 587.9 0.1536 652.90.1541 530.6 0.1800 556.2 0.1895 600.0 0.2000 684.30.1711 543.8 0.2000 566.7 0.2161 612.7 0.3500 755.50.1900 554.5 0.3500 626.2 0.3500 658.8 0.4000 773.50.2000 559.8 0.4000 641.4 0.4000 672.1 0.4500 789.70.3500 619.1 0.5000 667.6 0.4500 683.9 0.5000 804.50.4000 633.8 0.6000 689.7 0.5000 694.7 0.5500 818.10.5000 658.9 0.7000 709.1 0.6000 713.5 0.6000 830.70.6000 680.0 0.8000 726.3 0.7000 729.8 0.6500 842.50.7000 698.2 0.9000 741.8 0.8000 744.2 0.7000 853.50.8000 714.3 1.0000 756.0 0.9000 757.1 0.8000 873.80.9000 728.8 1.4000 803.2 1.0000 768.8 0.9000 892.01.0000 742.0 1.4000 807.1 1.0000 908.61.4000 785.5 1.4000 963.9
Reproduced with permission of the copyright owner. Further reproduction prohibited without permission.
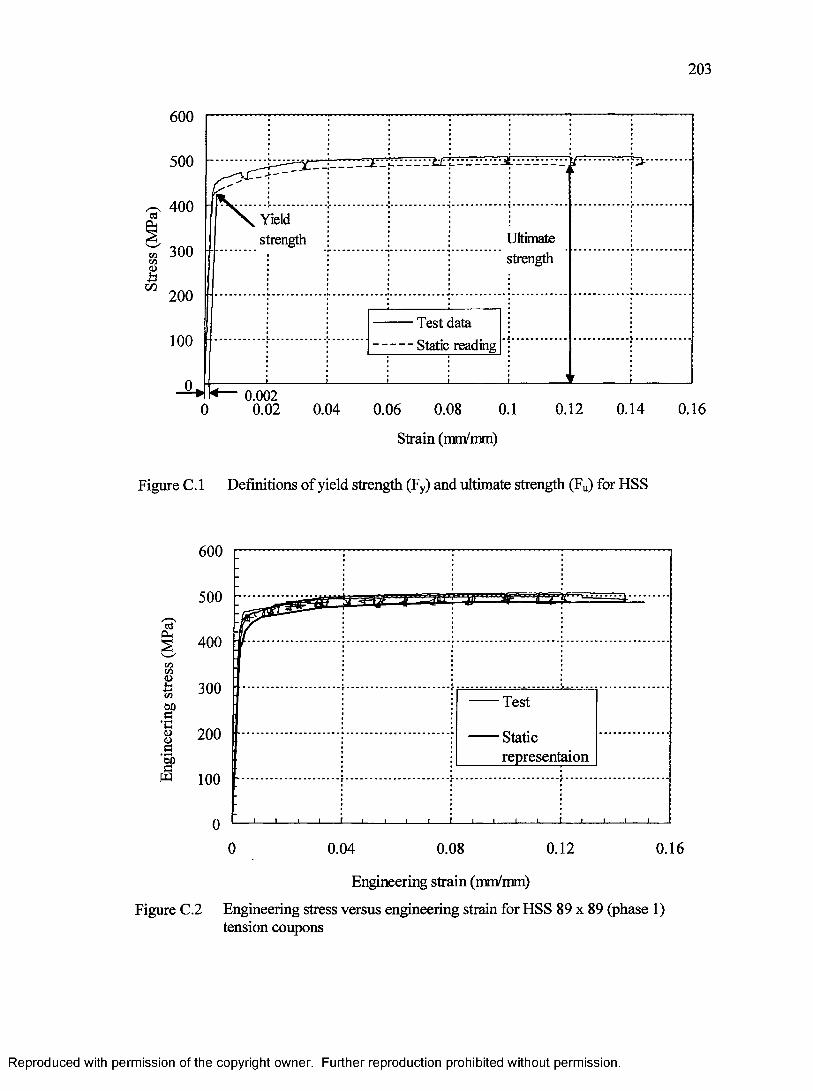
203
600
500
400Yieldstrength Ultimate
strength300COQ
200
Test data
Static reading100
0.0020.02 0.14 0.160.04 0.06 0.08 0.1 0.120
Strain (mm/mm)
Figure C. 1 Definitions o f yield strength (Fy) and ultimate strength (Fu) for HSS
600
500
§ 400
I 30000c
200
Test
Staticrepresentaion
100
0 0.12 0.160.04 0.08
Engineering strain (mm/mm)
Figure C.2 Engineering stress versus engineering strain for HSS 89 x 89 (phase 1) tension coupons
Reproduced with permission of the copyright owner. Further reproduction prohibited without permission.
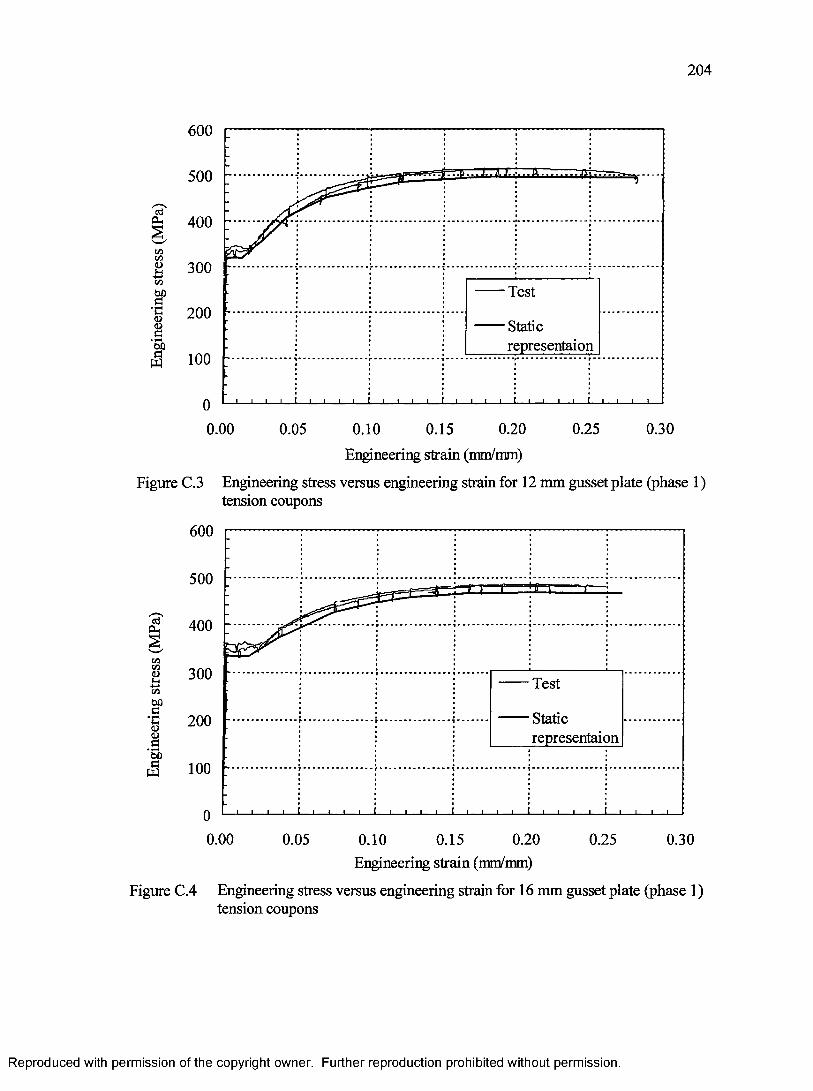
204
Cti
C/3C/30)
‘S§
w
600
500
400
300Test
200 Static
representaion100
00.300.00 0.05 0.10 0.15 0.20 0.25
Engineering strain (mm/mm)
Figure C.3 Engineering stress versus engineering strain for 12 mm gusset plate (phase 1) tension coupons
(3Ph
C/3C/3<DJ -ls-»c/3
-S*n0><DaDORW
600
500
400
300 Test
Staticrepresentaion
200
100
00.00 0.05 0.20 0.250.10 0.15 0.30
Engineering strain (mm/mm)
Figure C.4 Engineering stress versus engineering strain for 16 mm gusset plate (phase 1) tension coupons
Reproduced with permission of the copyright owner. Further reproduction prohibited without permission.

Engi
neer
ing
stres
s (M
Pa)
205
600
500
400
300 Test
Staticrepresentaion
200
100
00.00 0.05 0.150.10 0.20 0.25
Engineering strain (mm/mm)
Figure C.5 Engineering stress versus engineering strain for 20 mm gusset plate (phase 1) tension coupons
Reproduced with permission of the copyright owner. Further reproduction prohibited without permission.
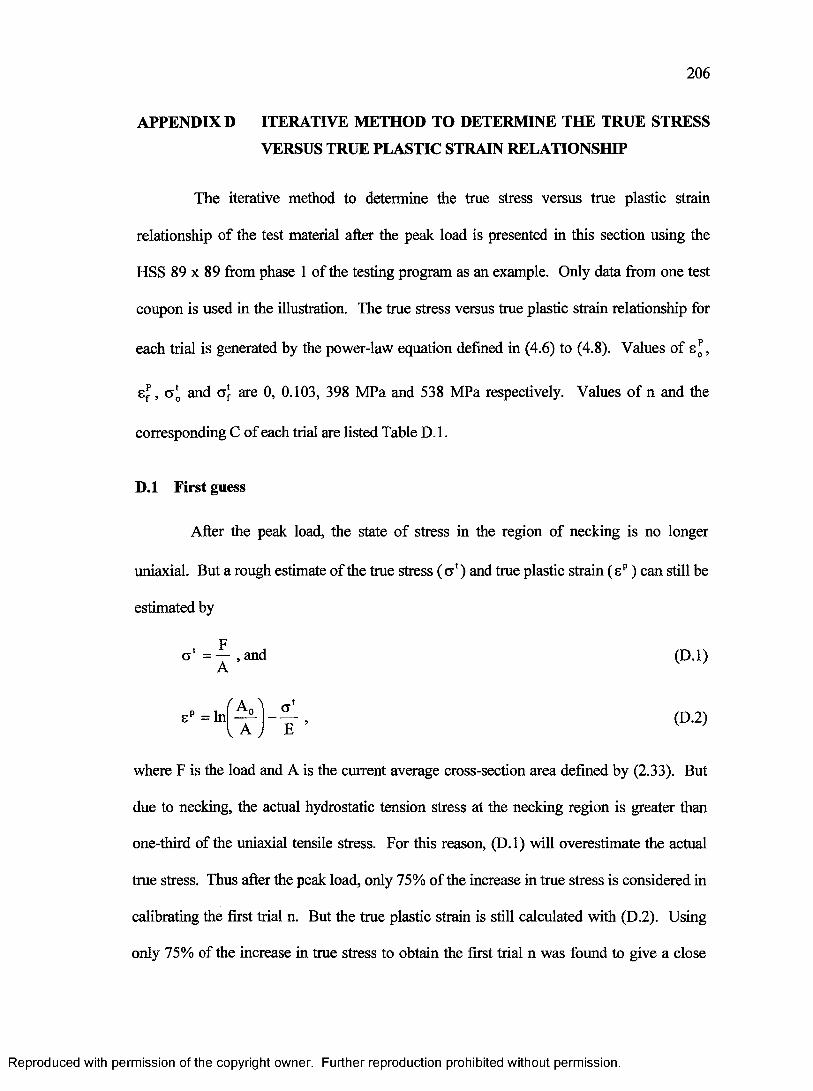
206
APPENDIX D ITERATIVE METHOD TO DETERMINE THE TRUE STRESS
VERSUS TRUE PLASTIC STRAIN RELATIONSHIP
The iterative method to determine the true stress versus true plastic strain
relationship of the test material after the peak load is presented in this section using the
HSS 89 x 89 from phase 1 of the testing program as an example. Only data from one test
coupon is used in the illustration. The true stress versus true plastic strain relationship for
each trial is generated by the power-law equation defined in (4.6) to (4.8). Values of ,
S f, Og and af. are 0, 0.103, 398 MPa and 538 MPa respectively. Values o f n and the
corresponding C o f each trial are listed Table D. 1.
D .l First guess
After the peak load, the state o f stress in the region of necking is no longer
uniaxial. But a rough estimate of the true stress (<j ‘) and true plastic strain ( e p) can still be
estimated by
due to necking, the actual hydrostatic tension stress at the necking region is greater than
one-third of the uniaxial tensile stress. For this reason, (D .l) will overestimate the actual
true stress. Thus after the peak load, only 75% of the increase in true stress is considered in
calibrating the first trial n. But the true plastic strain is still calculated with (D.2). Using
only 75% of the increase in true stress to obtain the first trial n was found to give a close
a 1 = — , and A
(D .l)
(D.2)
where F is the load and A is the current average cross-section area defined by (2.33). But
Reproduced with permission of the copyright owner. Further reproduction prohibited without permission.

207
estimate o f the final n value. The first trial value o f n is determined by matching the 75%
true stress data as illustrated in Figure D .l. Result of the numerical simulation using values
from the first estimate is shown in Figure D.2.
D.2 Iterative procedure
The last test data point o f the coupon test has an engineering stress ( ) of
389.5 MPa and the change in cross-section area (l-A/Ao)f of 0.535. Figure D.2 shows that
the simulation results with the first trial n overestimates the engineering stress of last test
data point at (l-A/Ao)f o f 0.535 by 1 MPa. It should be noted that the trial curve shown in
Figure D.2 is exaggerated for clarity. Thus, the second trial n is adjusted until the
generated true stress versus true plastic strain curve has a stress decrease by 2 MPa at the
true plastic strain of 0.76 corresponding to the last test data point. The correction in true
stress is doubled the discrepancy of engineering stress in the first trial. Results of the
numerical simulation with the second trial n are shown in Figure D.2. The simulation with
the second trial n underestimates the engineering stress of the last test data point by 1 MPa.
The subsequent trial value of n is interpolated from the previous last two trial values by
n j+1 = --------- ^ ■~1 ( a fe - O + m , (D.3)((Tf Cj ) (CJf O j_ ,)
where
c>f = engineering stress at close to fracture,
af_, = predicted stress at close to fracture at iteration i-1, and
a® = predicted stress at close to fracture at iteration i.
Reproduced with permission of the copyright owner. Further reproduction prohibited without permission.

208
All a® ,a®_, and a® are the stress at the same deformation of l-(A/Ao)f and are listed in
Table D .l . It should be noted that in an actual calculation for a material, a® and (1-A/A0)f
are the selected values that represent data from a number coupon tests and not the last test
data point from one single test coupon. The third trial n is interpolated from the last two
trial values based on (D.3). Figure D.2 shows the simulation stress versus change in cross-
section area curve o f the third trial matches that o f the test. Therefore, the iteration can be
stopped and n is accepted.
Reproduced with permission of the copyright owner. Further reproduction prohibited without permission.
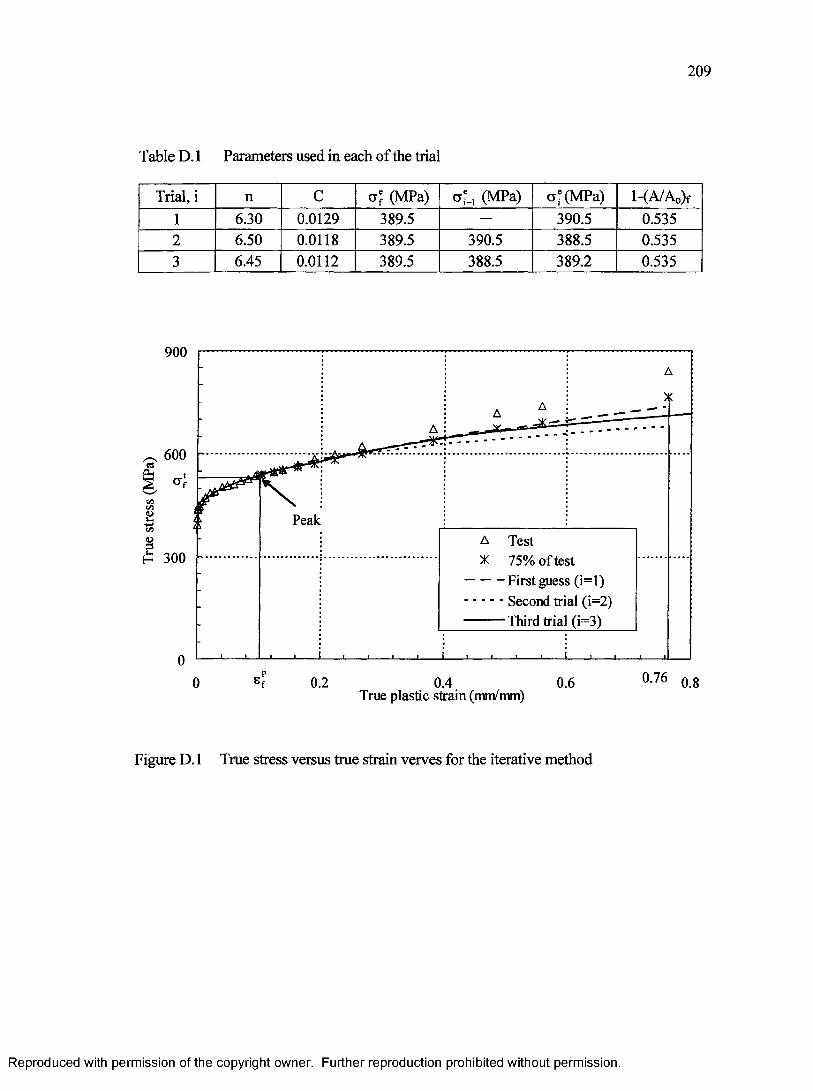
209
Table D. 1 Parameters used in each of the trial
Trial, i n C o* (MPa) (MPa) a® (MPa) l-(A/Ao)f1 6.30 0.0129 389.5 390.5 0.5352 6.50 0.0118 389.5 390.5 388.5 0.5353 6.45 0.0112 389.5 388.5 389.2 0.535
900
600
Peakc/5<U>£ 300
A Test x 75% of test First guess (i=l)■ - ■ Second trial (i=2) Third trial (i=3)
0.20 0.4 0.6True plastic strain (mm/mm)
Figure D. 1 True stress versus true strain verves for the iterative method
Reproduced with permission of the copyright owner. Further reproduction prohibited without permission.
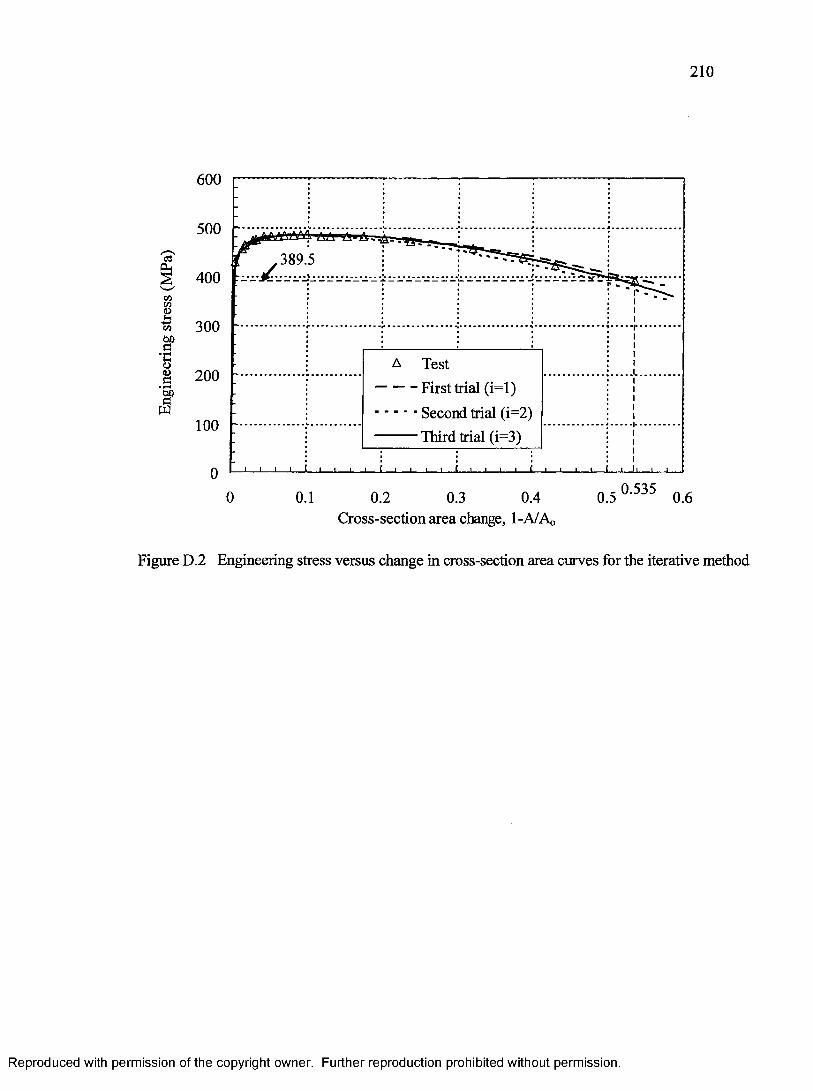
Engi
neer
ing
stres
s (M
Pa)
210
600
500
400
300
A Test
First trial (i=l)
■ ■ ■ Second trial (i=2) Third trial (i=3)
200
100
00.5350 0.1 0.2 0.4 0.5 0.60.3
Cross-section area change, 1-A/Ao
Figure D.2 Engineering stress versus change in cross-section area curves for the iterative method
Reproduced with permission of the copyright owner. Further reproduction prohibited without permission.
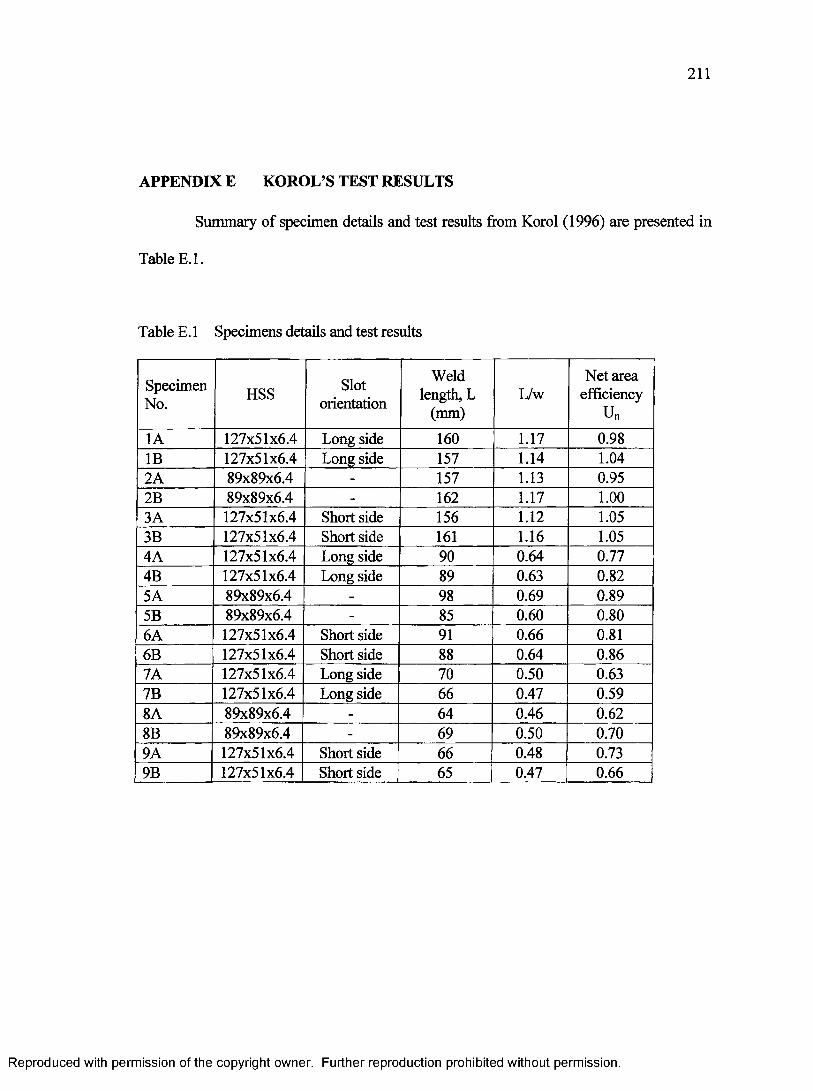
211
APPENDIX E KOROL’S TEST RESULTS
Summary of specimen details and test results from Korol (1996) are presented in
Table E.l.
Table E. 1 Specimens details and test results
SpecimenNo. HSS Slot
orientation
Weld length, L
(mm)L/w
Net area efficiency
Un
1A 127x51x6.4 Long side 160 1.17 0.98IB 127x51x6.4 Long side 157 1.14 1.042A 89x89x6.4 - 157 1.13 0.952B 89x89x6.4 - 162 1.17 1.003A 127x51x6.4 Short side 156 1.12 1.053B 127x51x6.4 Short side 161 1.16 1.054A 127x51x6.4 Long side 90 0.64 0.774B 127x51x6.4 Long side 89 0.63 0.825A 89x89x6.4 - 98 0.69 0.895B 89x89x6.4 - 85 0.60 0.806A 127x51x6.4 Short side 91 0.66 0.816B 127x51x6.4 Short side 88 0.64 0.867A 127x51x6.4 Long side 70 0.50 0.637B 127x51x6.4 Long side 66 0.47 0.598A 89x89x6.4 - 64 0.46 0.628B 89x89x6.4 - 69 0.50 0.709A 127x51x6.4 Short side 66 0.48 0.739B 127x51x6.4 Short side 65 0.47 0.66
Reproduced with permission of the copyright owner. Further reproduction prohibited without permission.
212
APPENDIX F ADDITONAL RESULTS FROM PARAMETRIC STUDY
Results of simulations for parametric study using flat part material properties of
phase 1 HSS 89 x 89 and HSS 127 x 51 with their corresponding assumed comer material
properties developed in Section 5.2.1 are listed in Tables F.l and F.2. Results of
simulations for finite element models with no end welding in Section 6.3.1.8 are listed in
Table F .l and for finite element models with end welding in Section 6.3.2.4 are listed in
Table F.2. The net section efficiency for the model with material properties of
HSS 127x51 and 75% stronger comer is denoted as Un_75, and that with material
properties o f HSS 89 x 89 and 28% stronger comer is denoted as U„_28. Results o f the
outstanding HSS efficiency are listed in Tables F.3 to F.5.
Reproduced with permission of the copyright owner. Further reproduction prohibited without permission.

213
Table F.l Results of simulation using different comer strength for parametric study
models with no end welding
Group Model HSS
Weld
length
ratio,
L/w
Aspect
ratio,
a/b
Net
section
efficiency,
Un_28
Net
section
efficiency,
U„_75
W40
W40r40 127x51x4 .8 0.38 0.40 0.55 0.61W40r75 102x76x4 .8 0.38 0.75 - 0.54W40sh 89 x 89 x 4.8 0.38 1.00 0.54 0.54
W40hl4 102 x 76 x 4.8 0.38 1.34 - 0.54W40h25 127x51x4 .8 0.38 2.50 0.54 0.54
W60
W60r40 127x51 x 4.8 0.58 0.40 0.79 0.86W60r75 102x76x4 .8 0.58 0.75 - 0.77W60sh 89 x 89 x 4.8 0.58 1.00 0.74 0.75
W60hl4 102x76x4 .8 0.58 1.34 - 0.73W60h25 127x51x4 .8 0.58 2.50 0.73 0.73
W75
W75r40 127x51 x 4.8 0.73 0.40 0.97 0.98W75r75 102 x 76 x 4.8 0.73 0.75 - 0.92W75sh 8 9 x 8 9 x 4 .8 0.73 1.00 0.89 0.90
W 75hl4 102x76x4 .8 0.73 1.34 - 0.88W75h25 127x51 x 4.8 0.73 2.50 0.85 0.86
W85
W85r40 127x51x4 .8 0.83 0.40 1.05 1.05W85r75 102 x 76 x 4.8 0.83 0.75 - 1.02W85sh 89 x 89 x 4.8 0.83 1.00 0.99 0.99
W 85hl4 102x76x4 .8 0.83 1.34 - 0.97W85h25 127x51x4 .8 0.83 2.50 0.94 0.95
W100
W100r40 127x51x4 .8 1.00 0.40 1.09 1.14W100r75 102 x 76 x 4.8 1.00 0.75 - 1.12WlOOsh 89 x 89 x 4.8 1.00 1.00 1.05 1.10
W100hl4 102x76x4 .8 1.00 1.34 - 1.09W100h25 127x51x4 .8 1.00 2.50 1.05 1.07
W125
W125r40 127x51x4 .8 1.25 0.40 1.09 1.14W125r75 102x76x4 .8 1.25 0.75 - 1.14W125sh 89 x 89 x 4.8 1.25 1.00 1.06 1.12
W125hl4 102 x 76 x 4.8 1.25 1.34 - 1.11W125h25 127x51x4 .8 1.25 2.50 1.06 1.11
Reproduced with permission of the copyright owner. Further reproduction prohibited without permission.
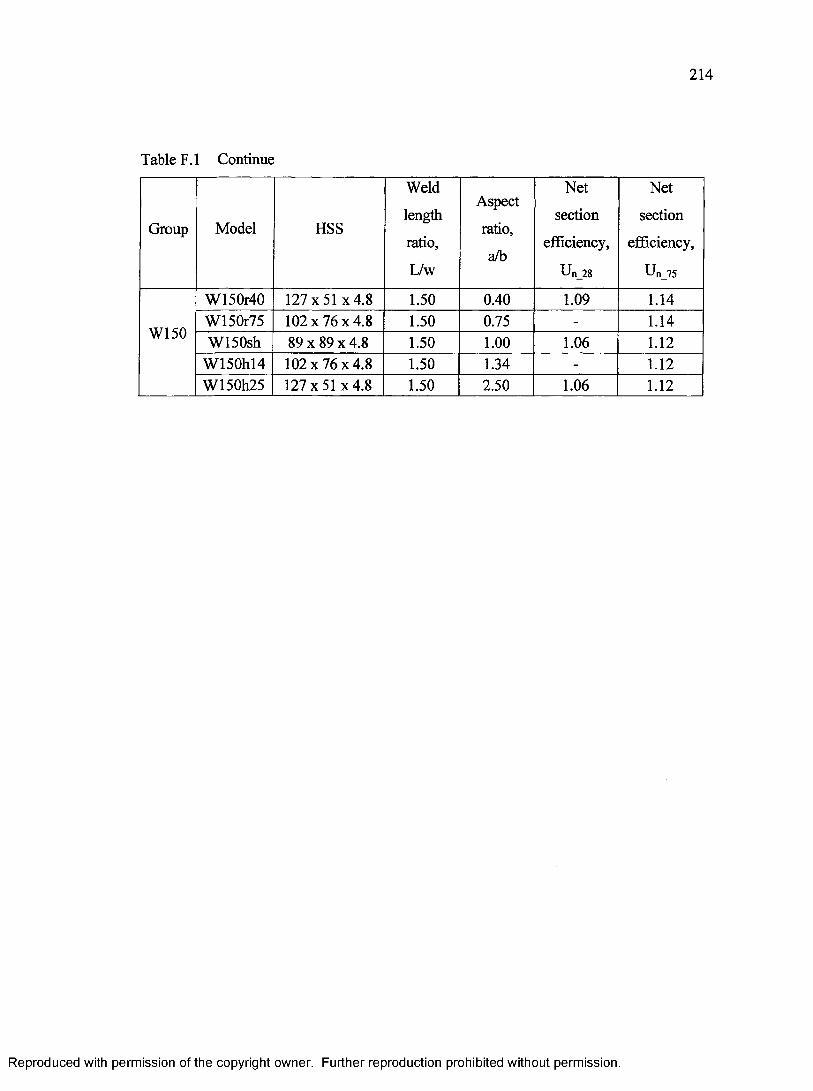
214
Table F.l Continue
Group Model HSS
Weld
length
ratio,
L/w
Aspect
ratio,
a/b
Net
section
efficiency,
U„_28
Net
section
efficiency,
U n_75
W150
W150r40 127x51x4 .8 1.50 0.40 1.09 1.14W150r75 102 x 76 x 4.8 1.50 0.75 - 1.14W150sh 89 x 89 x 4.8 1.50 1.00 1.06 1.12
W 150hl4 102x76x4 .8 1.50 1.34 - 1.12W150h25 127x51 x 4.8 1.50 2.50 1.06 1.12
Reproduced with permission of the copyright owner. Further reproduction prohibited without permission.

215
Table F.2 Results of simulation using different comer strength for parametric study
models with end welding
Group Model HSS
Weld length
ratio,
L/w
Aspect ratio,
a/b
Net section
efficiency,
Un_28
W40
W40r40 127x51 x 4.8 0.40 0.40 0.82W40sh 8 9 x 8 9 x 4 .8 0.40 1.00 0.68
W40hl4 102x76x4 .8 0.40 1.34 0.69W40h25 127x51x4 .8 0.40 2.50 0.69
W55
W40r40 127x51 x4.8 0.55 0.40 1.00W40sh 89 x 89 x 4.8 0.55 1.00 0.86
W40hl4 102 x 76 x 4.8 0.55 1.34 0.85W40h25 127x51 x 4.8 0.55 2.50 0.84
W70
W40r40 127x51 x 4.8 0.70 0.40 1.04W40sh 89 x 89 x 4.8 0.70 1.00 1.03
W40hl4 102x76x4 .8 0.70 1.34 1.01W40h25 127x51 x4.8 0.70 2.50 0.98
W80
W40r40 1 27x51x4 .8 0.80 0.40 1.04W40sh 8 9 x 8 9 x 4 .8 0.80 1.00 1.04
W40hl4 102x76x4 .8 0.80 1.34 1.02W40h25 127x51x4 .8 0.80 2.50 1.00
W100
W40r40 127x51x4 .8 1.00 0.40 1.04W40sh 89 x 89 x 4.8 1.00 1.00 1.04
W40hl4 102x76x4 .8 1.00 1.34 1.04W40h25 127x51x4 .8 1.00 2.50 1.03
Reproduced with permission of the copyright owner. Further reproduction prohibited without permission.
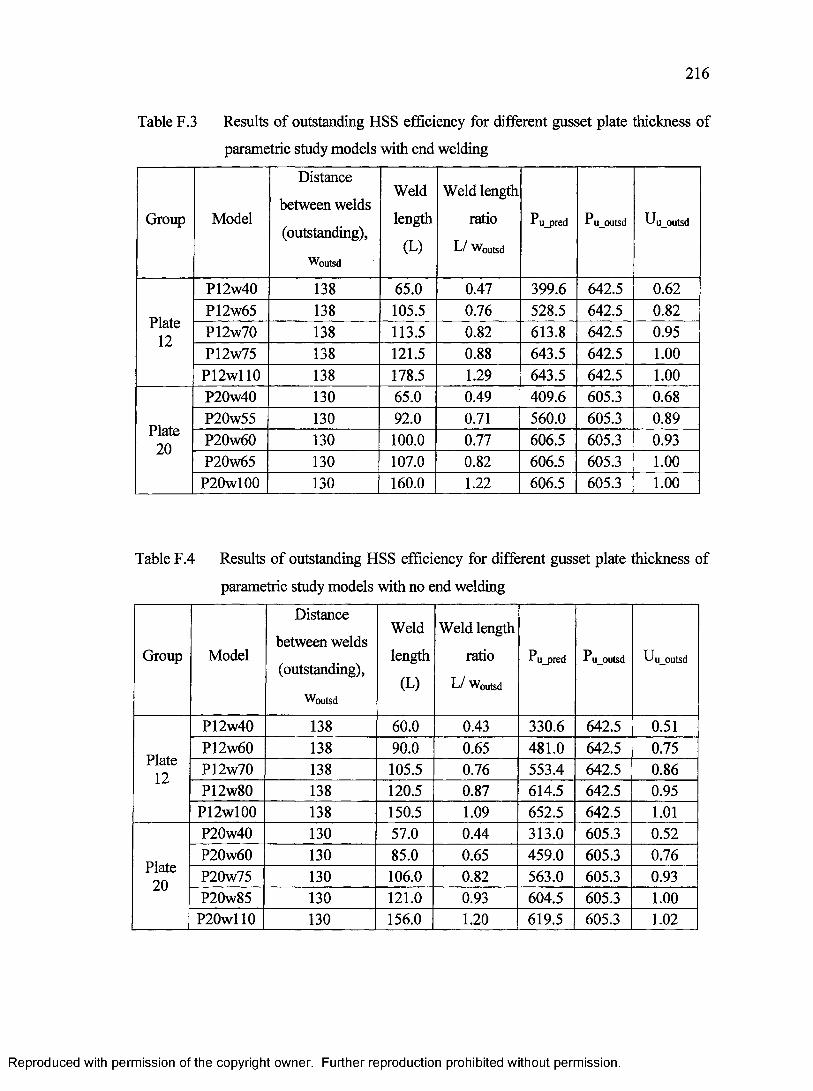
216
Table F.3 Results of outstanding HSS efficiency for different gusset plate thickness of
parametric study models with end welding
Group Model
Distance
between welds
(outstanding),
W0utsd
Weld
length
( L )
Weld length
ratio
L / Woutsd
P u_pred P u_outsd Uu_outsd
Plate12
P12w40 138 65.0 0.47 399.6 642.5 0.62P12w65 138 105.5 0.76 528.5 642.5 0.82P12w70 138 113.5 0.82 613.8 642.5 0.95P12w75 138 121.5 0.88 643.5 642.5 1.00
P12wll0 138 178.5 1.29 643.5 642.5 1.00
Plate20
P20w40 130 65.0 0.49 409.6 605.3 0.68P20w55 130 92.0 0.71 560.0 605.3 0.89P20w60 130 100.0 0.77 606.5 605.3 0.93P20w65 130 107.0 0.82 606.5 605.3 1.00
P20wl00 130 160.0 1.22 606.5 605.3 1.00
Table F.4 Results o f outstanding HSS efficiency for different gusset plate thickness of
parametric study models with no end welding
Group Model
Distance
between welds
(outstanding),
W 0utsd
Weld
length
(L)
Weld length
ratio
L/ Woutsd
Pu_pred P u_outsd U u_outsd
Plate12
P12w40 138 60.0 0.43 330.6 642.5 0.51P12w60 138 90.0 0.65 481.0 642.5 0.75P12w70 138 105.5 0.76 553.4 642.5 0.86P12w80 138 120.5 0.87 614.5 642.5 0.95
P12wl00 138 150.5 1.09 652.5 642.5 1.01
Plate20
P20w40 130 57.0 0.44 313.0 605.3 0.52P20w60 130 85.0 0.65 459.0 605.3 0.76P20w75 130 106.0 0.82 563.0 605.3 0.93P20w85 130 121.0 0.93 604.5 605.3 1.00
P20wll0 130 156.0 1.20 619.5 605.3 1.02
Reproduced with permission of the copyright owner. Further reproduction prohibited without permission.

217
Table F.5 Results of outstanding HSS efficiency for different weld height of parametric
study models with no end welding
Group Model
Distance
between welds
(outstanding),
Woutsd
Weld
length
( L )
Weld
length
ratio
L / Wgutsd
P u_pred P u_outsd Uu_outsd
W40
W40h5 140 60.0 0.43 373.6 652.8 0.51W40h8 134 60.0 0.45 410.9 624.8 0.75
W40hl0 130 60.0 0.46 435.8 606.2 0.86W40hl2 126 60.0 0.48 448.2 587.6 0.95
W75
W75h5 140 112.5 0.80 637.9 652.8 0.52W75h8 134 112.5 0.84 673.8 624.8 0.76
W75hl0 130 112.5 0.87 693.8 606.2 0.93W75hl2 126 112.5 0.89 701.0 587.6 1.00
W100
W100h5 140 150.0 1.07 707.6 652.8 0.52W100h8 134 150.0 1.12 710.4 624.8 0.76
WlOOhlO 130 150.0 1.15 711.7 606.2 0.93W100hl2 126 150.0 1.19 713.2 587.6 1.00
W125
W125h5 140 188.0 1.34 709.8 652.8 0.52W125h8 134 188.0 1.40 709.9 624.8 0.76
W125hl0 130 188.0 1.45 712.6 606.2 0.93W125hl2 126 188.0 1.49 713.5 587.6 1.00
Reproduced with permission of the copyright owner. Further reproduction prohibited without permission.

218
APPENDIX G THE NET SECTION ECCENTRICITY CALCULATION
The net section eccentricity ( x ) o f the parametric study models with no end
welding for the a/b ratios are presented here. The net section eccentricity (x ) is calculated
according to (2.18) as specified by ANSI/AISC-360-05, and is denoted as x (AISC-05) in
Table G.l. The modified net section eccentricity ( x *) is determined by taking the
eccentricity of a square HSS with an equal circumferential length as the lower limit when
a/b ratio is less than 1. The modified net section eccentricity is denoted as x*. A more
accurate way to calculate the net section eccentricity is to take the distance from the
centroid o f one half of the HSS net cross-section area to the face o f the gusset plate rather
than to the centreline of the gusset plate as specified in ANSI/AISC-360-05. The distance
from the centroid o f one-half of the HSS net cross-section area to the face o f the gusset
plate ( x n) is taken as
_ _ 2(a - t'Xb - 11) + (a - t'-tX a - t'+ t) t Xn_ 4(a + b - 2 t ' - t ) 2
(a ~ t'Xa + 2b - 3t') - 1 2 t4(a + b - 2 t '- t) 2 '
Variables used in (G .l) are depicted in Figures 3.1. Again, a modified net section
eccentricity ( x ‘ ) is determined by taking the eccentricity ( x n) o f a square HSS with an
equal circumferential length as the lower limit when a/b ratio is less than 1. The values of
x n and x ’ for the parametric study models are also shown in Table G.l
Reproduced with permission of the copyright owner. Further reproduction prohibited without permission.
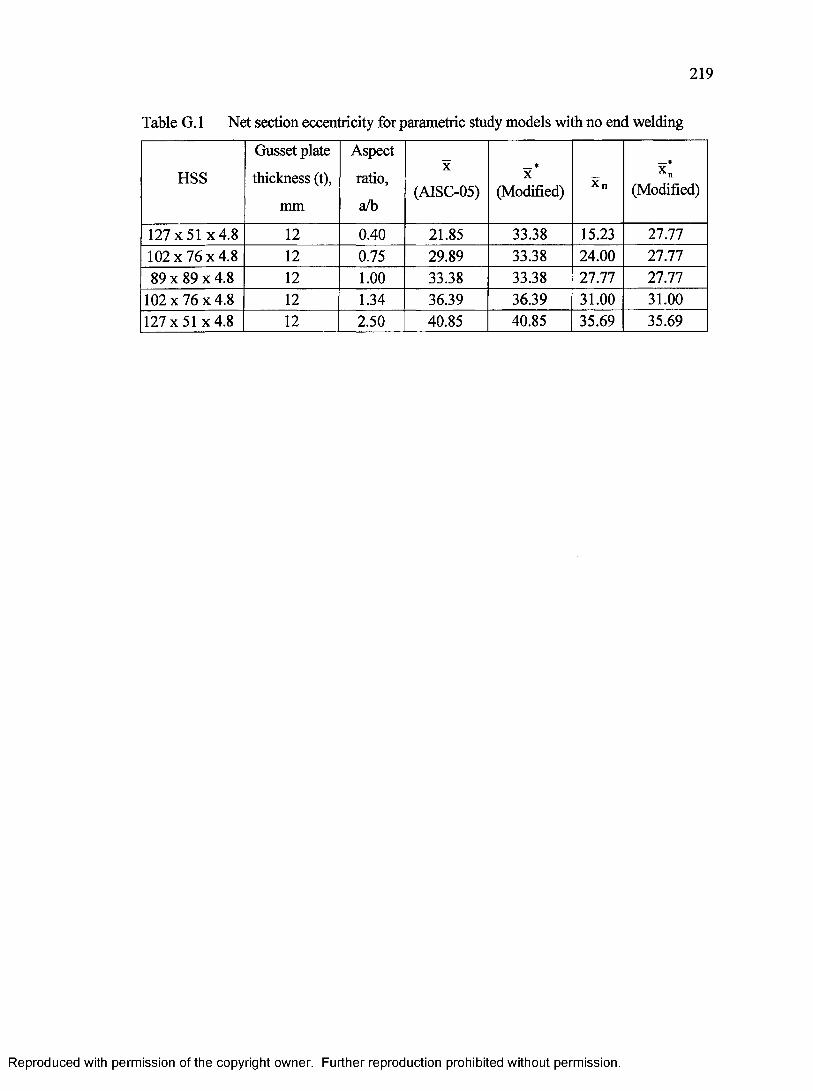
219
Table G. 1 Net section eccentricity for parametric study models with no end welding
HSS
Gusset plate
thickness (t),
mm
Aspect
ratio,
a/b
X
(AISC-05)
*X
(Modified) Xn (Modified)
127x51 x 4.8 12 0.40 21.85 33.38 15.23 27.771 0 2 x 7 6 x 4 .8 12 0.75 29.89 33.38 24.00 27.7789 x 89 x 4.8 12 1.00 33.38 33.38 27.77 27.77
1 0 2 x 7 6 x 4 .8 12 1.34 36.39 36.39 31.00 31.00127x51 x 4.8 12 2.50 40.85 40.85 35.69 35.69
Reproduced with permission of the copyright owner. Further reproduction prohibited without permission.


![[CIDECT DG3] -- Design Guide for Rectangular Hollow Section (RHS) Joints Under Predominantly Static Loading](https://static.fdocuments.net/doc/165x107/577d210a1a28ab4e1e94553f/cidect-dg3-design-guide-for-rectangular-hollow-section-rhs-joints-under.jpg)