A STUDY ON FINANCIAL PERFORMANCE USING RATIO ANALYSIS …
10
www.tjprc.org [email protected] A STUDY ON FINANCIAL PERFORMANCE USING RATIO ANALYSIS OF GSFC LTD. & GNFC LTD., GUJARAT Dr. MEHUL PATEL 1 , Dr. R. D. MODI 2 & Dr. S. M. PILLAI 3 1 Assistant Professor, C. P. Patel & F. H. Shah Commerce College, Anand, Gujarat, India 2 Principal, C. P. Patel & F. H. Shah Commerce College, Anand, Gujarat, India 3 IQAC Co-Ordinator, C. P. Patel & F. H. Shah Commerce College, Anand, Gujarat, India ABSTRACT The present study of the research title on “A Study on Financial Performance using Ratio Analysis of GSFC ltd. & GNFC ltd”. Gujarat Financial Associate in tending analysis cited budget analysis or accounting analysis refers to an assessment of the viability, stability and profitableness of a business, sub-business or project. The most plans behind this study are to research the money operative position of the corporate. This analysis is completed to facilitate of secondary information that is gathered from the annual report of the corporate. The financial performance is measured by exploitation numerous money tools like profitableness magnitude relation, financial condition magnitude relation, comparative statement, etc. supported the analysis, findings are arrived that the corporate possesses enough funds to satisfy its debts & liabilities, the profit-and-loss statement of the corporate shows sales of the corporate inflated once a year at sensible rate and profit conjointly increased once a year. KEYWORDS: Financial Analysis, Ratio Analysis, Profitability Ratio, Liquidity & Indebtedness Received: Sep 21, 2019; Accepted: Oct 12, 2019; Published: Nov 04, 2019; Paper Id.: IJAFMRDEC20194 INTRODUCTION AND MANAGEMENT ABOUT GSFC LTD. & GNFC LTD. The GSFC Ltd. was incorporated on 15 February 1962, in Gujarat. The company manufactures chemical fertilisers, petrochemicals and alternative allied merchandise like organic compound, ammonia salt, diammonium phosphate, ammonia, vitriol, caprolactam, argon gas, etc., and nylon-chips and alkali. The GNFC Ltd. Corporation was built-in on 10 th May, in Bharuch, Gujarat. The Company was promoted by Government of Gujarat and Gujarat State Fertilisers Co., Ltd. (GSFC). The corporate manufactures chemical fertilisers, notably ammonia and organic compound and petrochemicals. Table 1 Designation GSFC Ltd. GNFC Ltd. Chairman J N Singh J N Singh Director Vasant P Gandhi Vijai Kapoor Arvind Agrawal Ajay N Shah Geeta Goradia D C Anjaria Mamta Verma Piruz Khambatta Arvind Sahay Sunil Parekh Managing Director Sujit Gulati M S Dagur Additional Director Arvind Agarwal Sujit Gulati Original Article International Journal of Accounting and Financial Management Research (IJAFMR) ISSN (P): 2249–6882; ISSN (E): 2249–7994 Vol. 9, Issue 2, Dec 2019, 29–38 © TJPRC Pvt. Ltd.
Transcript of A STUDY ON FINANCIAL PERFORMANCE USING RATIO ANALYSIS …
www.tjprc.org [email protected]
A STUDY ON FINANCIAL PERFORMANCE USING RATIO ANALYS IS OF GSFC
LTD. & GNFC LTD., GUJARAT
Dr. MEHUL PATEL 1, Dr. R. D. MODI2 & Dr. S. M. PILLAI 3 1Assistant Professor, C. P. Patel & F. H. Shah Commerce College, Anand, Gujarat, India
2Principal, C. P. Patel & F. H. Shah Commerce College, Anand, Gujarat, India 3IQAC Co-Ordinator, C. P. Patel & F. H. Shah Commerce College, Anand, Gujarat, India
ABSTRACT
The present study of the research title on “A Study on Financial Performance using Ratio Analysis of GSFC ltd.
& GNFC ltd”. Gujarat Financial Associate in tending analysis cited budget analysis or accounting analysis
refers to an assessment of the viability, stability and profitableness of a business, sub-business or project. The
most plans behind this study are to research the money operative position of the corporate. This analysis is
completed to facilitate of secondary information that is gathered from the annual report of the corporate. The
financial performance is measured by exploitation numerous money tools like profitableness magnitude relation,
financial condition magnitude relation, comparative statement, etc. supported the analysis, findings are arrived
that the corporate possesses enough funds to satisfy its debts & liabilities, the profit-and-loss statement of the
corporate shows sales of the corporate inflated once a year at sensible rate and profit conjointly increased once a
year.
KEYWORDS: Financial Analysis, Ratio Analysis, Profitability Ratio, Liquidity & Indebtedness
Received: Sep 21, 2019; Accepted: Oct 12, 2019; Published: Nov 04, 2019; Paper Id.: IJAFMRDEC20194
INTRODUCTION AND MANAGEMENT ABOUT GSFC LTD. & GNFC LTD.
The GSFC Ltd. was incorporated on 15 February 1962, in Gujarat. The company manufactures chemical fertilisers,
petrochemicals and alternative allied merchandise like organic compound, ammonia salt, diammonium phosphate,
ammonia, vitriol, caprolactam, argon gas, etc., and nylon-chips and alkali.
The GNFC Ltd. Corporation was built-in on 10th May, in Bharuch, Gujarat. The Company was promoted
by Government of Gujarat and Gujarat State Fertilisers Co., Ltd. (GSFC). The corporate manufactures chemical
fertilisers, notably ammonia and organic compound and petrochemicals.
Table 1 Designation GSFC Ltd. GNFC Ltd.
Chairman J N Singh J N Singh
Director
Vasant P Gandhi Vijai Kapoor Arvind Agrawal Ajay N Shah Geeta Goradia D C Anjaria
Mamta Verma Piruz Khambatta Arvind Sahay Sunil Parekh
Managing Director Sujit Gulati M S Dagur
Additional Director Arvind Agarwal Sujit Gulati
Original A
rticle International Journal of Accounting and Financial Management Research (IJAFMR) ISSN (P): 2249–6882; ISSN (E): 2249–7994 Vol. 9, Issue 2, Dec 2019, 29–38 © TJPRC Pvt. Ltd.

30 Dr. Mehul Patel, Dr. R. D. Modi & Dr. S. M. Pillai
www.tjprc.org [email protected]
OBJECTIVES OF STUDY
To identify the money fluctuations of gain, liquidity position within the selected companies.
• To know the profit level of the selected company.
• To identify any consistent results or trends by victimization analytic thinking.
• To identify the money performance and distribution of selected.
SCOPE OF THE STUDY
The main aim of the study is to investigate the monetary position of the corporate victimization monetary tool like
magnitude relation analysis. This is often principally worn out order to search out the monetary soundness of the corporate.
Normally the study focuses on the monetary position of the corporate.
LIMITATION OF THE STUDY
The study suffers from bound limitations and a few of those area unit mentioned below in order that finding of the study
may be understood during a correct perspective. The restrictions of the study are as follows:
• The study time is forbidden to 5 year solely.
• The study is predicated on secondary information collected from websites.
• The information is accessible on company’s websites.
• To suggest effective measures in the existing system of the company.
REVIEW OF LITERATURE
Dr. S. Vijayalakshmi, Sowndarya. K & Sowndharya. K (2017), Authors published article on “A Study on Financial
Performance Analysis of Bharti Airtel Limited”. Financial performance is finished to judge the capability, stability and
gain of the corporate. Money analysis helps investors to appraise whether or not they ought to invest during an explicit
company or not. The most objective of this study is to grasp the short term and long run money position of the corporate
and to grasp the profit level of the corporate. it's analyzed mistreatment short term, long run and gain ratios for the amount
2011–2016, supported the secondary knowledge that's record and profit/loss account. The corporate has got to stabilize its
financial gain while not a lot of increase in operational expenses.
Jyotirmoy Koley (2019), Studied on “ Analysis of Financial Position and Performance of Public and Private
Sector Banks in India: A Comparative Study on SBI and HDFC Bank”. The current study is created to live the funds
position, performance and potency of the biggest public sector bank (SBI) and personal sector bank (HDFC). The target
of the study is to spot the money position and performance of the chosen banks and to look at whether or not any
important distinction exists in their performance. The study is predicated on secondary information that has been
collected from annual reports of the chosen banks covering an amount of 5 years from 2013–2014 to 2017–2018. The
camel model has been accustomed to assess the money strength of the chosen banks. T-test has been used on the vital
parameters like capital adequacy, plus quality, management potency, earnings ability and liquidity to draw the
conclusion of the study.

A Study on Financial Performance using Ratio Analysis
Impact Factor (JCC): 7.1593
DATA ANALYSIS & INTERPRETATION
Data analysis and interpretation is the process of assigning meaning to the collected information and determining the
conclusions, significance and implications of the findings. It is an important and exciting step in the process of research.
all research studies, analysis follows data collection.
Operating Profit Ratio
Operating net profit ratio is considered by dividing the operating net profit by sales. This ratio helps in formative the abi
of the management in running the industry.
Operating Profit Ratio = (Operating profit / Net sales) × 100
Table 2Financial Year
2014-20152015-20162016-20172017-20182018-2019
TotalAverage
Graph
Interpretation
Table 1 point out the Operating Profit Ratio of selected companies from 2014
Ltd., as a whole, the table reveals as decreasing trend. The
2014–2015 and the least of Operating profit Ration ratio 8.81% in 2018
table reveals as Fluctuating trend. The highest Operating profit ratio of
of Operating profit Ration ratio 6.66% in 2014
Gross Profit Ratio
Gross profit quantitative relation is the quantitative relation of net to income i.e. sales less sales returns. The quantitative
relation therefore reflects the margin of profit that a priority
sing Ratio Analysis of GSFC Ltd. & GNFC Ltd., Gujarat
DATA ANALYSIS & INTERPRETATION
analysis and interpretation is the process of assigning meaning to the collected information and determining the
conclusions, significance and implications of the findings. It is an important and exciting step in the process of research.
udies, analysis follows data collection.
Operating net profit ratio is considered by dividing the operating net profit by sales. This ratio helps in formative the abi
of the management in running the industry.
(Operating profit / Net sales) × 100
2: Operating Profit Ratio of Selected Companies Financial Year GSFC Ltd. GNFC Ltd. Total Average
2015 11.12 6.66 17.8 8.89 2016 10.75 17.68 28.4 14.2152017 9.28 14.22 23.5 11.75 2018 9.01 23.82 32.8 16.4152019 8.81 14.72 23.5 11.765
Total 48.97 77.1 Average 9.794 15.42
1: Operating Profit Ratio of Selected Companies.
Operating Profit Ratio of selected companies from 2014–2015 to 2018
s a whole, the table reveals as decreasing trend. The highest Operating profit ratio of GSFC Ltd. was 11.12% in
2015 and the least of Operating profit Ration ratio 8.81% in 2018–2019. In the case of GNFC Ltd.
table reveals as Fluctuating trend. The highest Operating profit ratio of GSFC Ltd. was 23.82% in 2017
of Operating profit Ration ratio 6.66% in 2014–2015.
the quantitative relation of net to income i.e. sales less sales returns. The quantitative
relation therefore reflects the margin of profit that a priority in a position to earn on its commerce and producing activity.
31
NAAS Rating: 3.17
analysis and interpretation is the process of assigning meaning to the collected information and determining the
conclusions, significance and implications of the findings. It is an important and exciting step in the process of research. In
Operating net profit ratio is considered by dividing the operating net profit by sales. This ratio helps in formative the ability
Average
14.215
16.415 11.765
15 to 2018–2019. In the case of GSFC
highest Operating profit ratio of GSFC Ltd. was 11.12% in
2019. In the case of GNFC Ltd., as a whole, the
GSFC Ltd. was 23.82% in 2017–2018 and the least
the quantitative relation of net to income i.e. sales less sales returns. The quantitative
in a position to earn on its commerce and producing activity.
32
www.tjprc.org
It’s the foremost ordinarily calculated quantitative relation. It’s utilized for inter
business results.
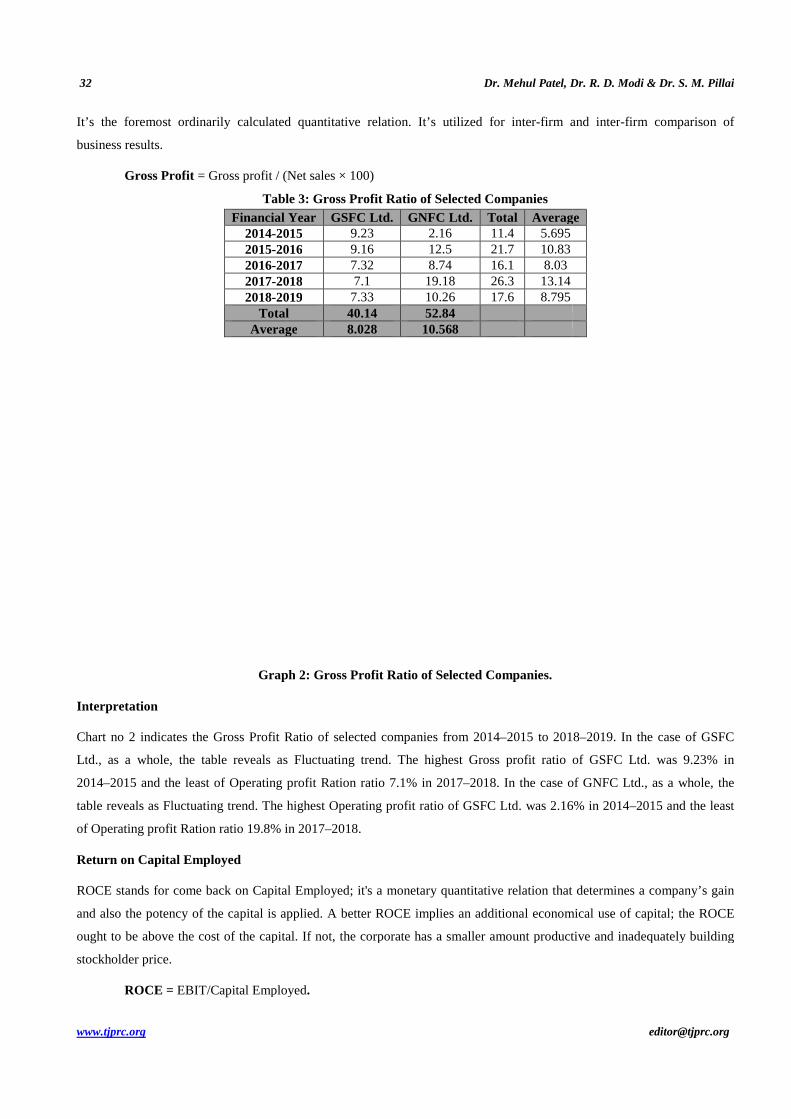
Gross Profit = Gross profit / (Net sales × 100)
Table Financial Year
2014-20152015-20162016-20172017-20182018-2019
TotalAverage
Graph
Interpretation
Chart no 2 indicates the Gross Profit Ratio of selected companies from 2014
Ltd., as a whole, the table reveals as Fluctuating trend. The highest Gross profit ratio of GSFC Ltd. was 9.23% in
2014–2015 and the least of Operating profit Ration ratio 7.1% in 2017
table reveals as Fluctuating trend. The highest Operating profit ratio of GSFC Ltd. was 2.16% in 2014
of Operating profit Ration ratio 19.8% i
Return on Capital Employed
ROCE stands for come back on Capital Employed; it's a monetary quantitative relation that determines a company’s gain
and also the potency of the capital is applied. A better ROCE implies an additional economical use of capital; the ROCE
ought to be above the cost of the capital. If not, the corporate
stockholder price.
ROCE = EBIT/Capital Employed
Dr. Mehul Patel, Dr. R. D. Modi & Dr. S. M. Pillai
ated quantitative relation. It’s utilized for inter-firm and inter
= Gross profit / (Net sales × 100)
Table 3: Gross Profit Ratio of Selected Companies Financial Year GSFC Ltd. GNFC Ltd. Total Average
2015 9.23 2.16 11.4 5.695 2016 9.16 12.5 21.7 10.83 2017 7.32 8.74 16.1 8.03 2018 7.1 19.18 26.3 13.14 2019 7.33 10.26 17.6 8.795
Total 40.14 52.84 Average 8.028 10.568
Graph 2: Gross Profit Ratio of Selected Companies.
Gross Profit Ratio of selected companies from 2014–2015 to 2018
s a whole, the table reveals as Fluctuating trend. The highest Gross profit ratio of GSFC Ltd. was 9.23% in
Operating profit Ration ratio 7.1% in 2017–2018. In the case of GNFC Ltd.
table reveals as Fluctuating trend. The highest Operating profit ratio of GSFC Ltd. was 2.16% in 2014
of Operating profit Ration ratio 19.8% in 2017–2018.
ROCE stands for come back on Capital Employed; it's a monetary quantitative relation that determines a company’s gain
the capital is applied. A better ROCE implies an additional economical use of capital; the ROCE
capital. If not, the corporate has a smaller amount productive and inadequately building
Employed.
Dr. R. D. Modi & Dr. S. M. Pillai
firm and inter-firm comparison of
Average
15 to 2018–2019. In the case of GSFC
s a whole, the table reveals as Fluctuating trend. The highest Gross profit ratio of GSFC Ltd. was 9.23% in
2018. In the case of GNFC Ltd., as a whole, the
table reveals as Fluctuating trend. The highest Operating profit ratio of GSFC Ltd. was 2.16% in 2014–2015 and the least
ROCE stands for come back on Capital Employed; it's a monetary quantitative relation that determines a company’s gain
the capital is applied. A better ROCE implies an additional economical use of capital; the ROCE
s a smaller amount productive and inadequately building
A Study on Financial Performance using Ratio Analysis
Impact Factor (JCC): 7.1593
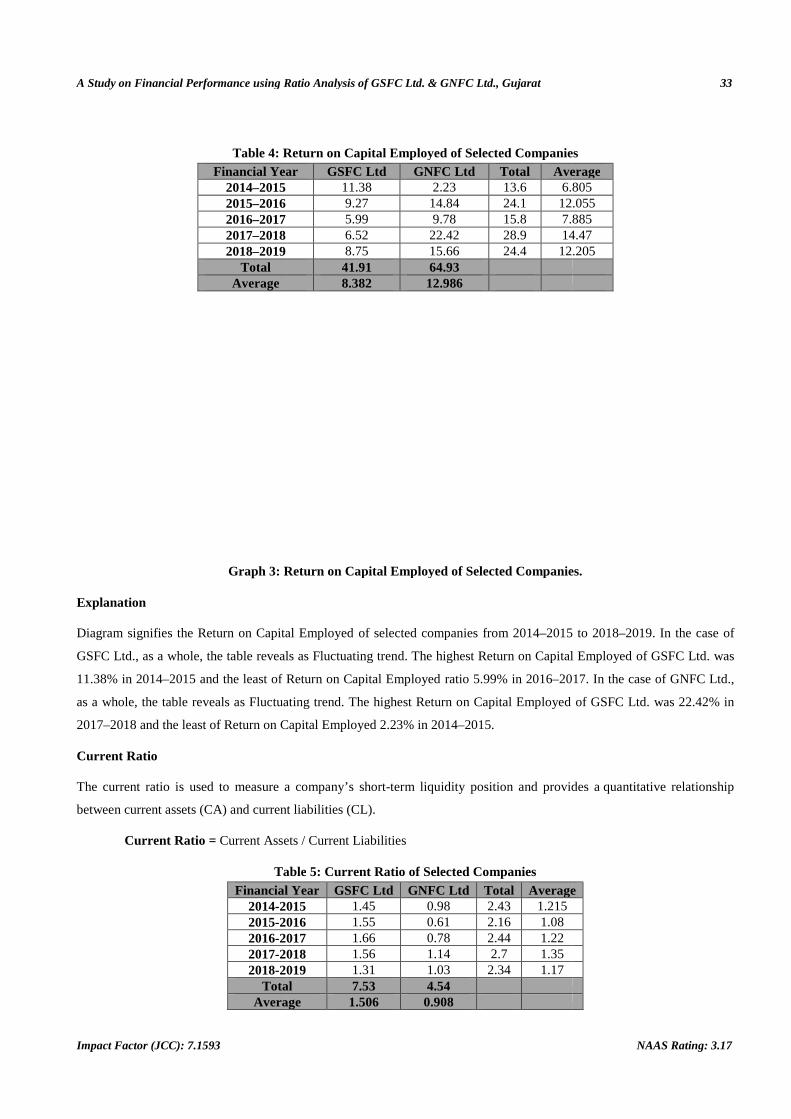
Table 4: Return on Capital EmployedFinancial Year
2014–2015 2015–2016 2016–2017 2017–2018 2018–2019
Total Average
Graph 3: Return on Capital Employed
Explanation
Diagram signifies the Return on Capital Employed
GSFC Ltd., as a whole, the table reveals as Fluctuating trend. The
11.38% in 2014–2015 and the least of Return on Capital Employed
as a whole, the table reveals as Fluctuating trend. The highest Return on Capital Em
2017–2018 and the least of Return on Capital Employed
Current Ratio
The current ratio is used to measure a company’s short
between current assets (CA) and current liabilities (CL)
Current Ratio = Current Assets / Current Liabilities
TableFinancial Year
2014-20152015-20162016-20172017-20182018-2019
TotalAverage
sing Ratio Analysis of GSFC Ltd. & GNFC Ltd., Gujarat
Return on Capital Employed of Selected CompaniesFinancial Year GSFC Ltd GNFC Ltd Total Average
11.38 2.23 13.6 6.805 9.27 14.84 24.1 12.055 5.99 9.78 15.8 7.885 6.52 22.42 28.9 14.47 8.75 15.66 24.4 12.205
41.91 64.93 8.382 12.986
Return on Capital Employed of Selected Companies.
Return on Capital Employed of selected companies from 2014–2015 to 2018
s a whole, the table reveals as Fluctuating trend. The highest Return on Capital Employed
2015 and the least of Return on Capital Employed ratio 5.99% in 2016–2017. In the case of GNFC Ltd.
s a whole, the table reveals as Fluctuating trend. The highest Return on Capital Employed
2018 and the least of Return on Capital Employed 2.23% in 2014–2015.
The current ratio is used to measure a company’s short-term liquidity position and provides a
current liabilities (CL).
Current Assets / Current Liabilities
Table 5: Current Ratio of Selected Companies Financial Year GSFC Ltd GNFC Ltd Total Average
2015 1.45 0.98 2.43 1.215 2016 1.55 0.61 2.16 1.08 2017 1.66 0.78 2.44 1.22 2018 1.56 1.14 2.7 1.35 2019 1.31 1.03 2.34 1.17
Total 7.53 4.54 Average 1.506 0.908
33
NAAS Rating: 3.17
of Selected Companies Average
6.805 12.055 7.885 14.47 12.205
of Selected Companies.
15 to 2018–2019. In the case of
highest Return on Capital Employed of GSFC Ltd. was
2017. In the case of GNFC Ltd.,
of GSFC Ltd. was 22.42% in
term liquidity position and provides a quantitative relationship
Average
34
www.tjprc.org
Graph
Interpretation
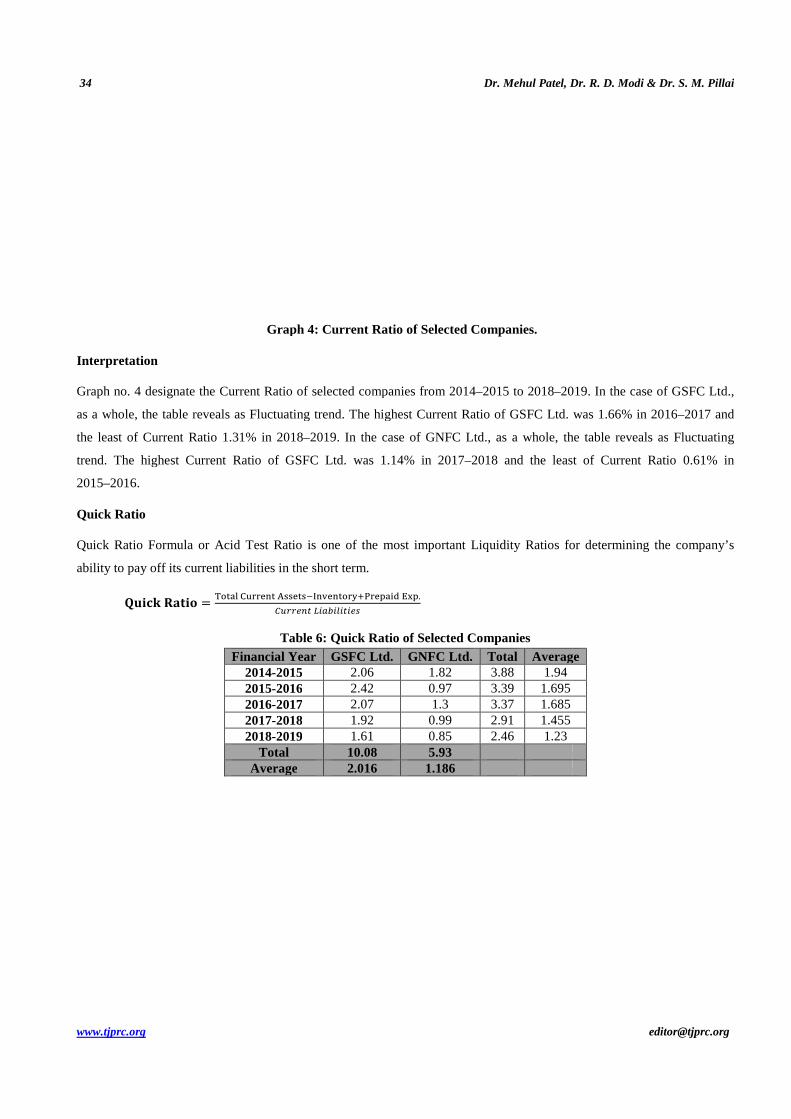
Graph no. 4 designate the Current Ratio of selected companies from 2014
as a whole, the table reveals as Fluctuating trend. The highest Current Ratio of GSFC Ltd. was 1.66% in 2016
the least of Current Ratio 1.31% in 2018
trend. The highest Current Ratio of GSFC Ltd. was 1.14% in 2017
2015–2016.
Quick Ratio
Quick Ratio Formula or Acid Test Ratio is one of the most important Liquidity Ratios for
ability to pay off its current liabilities in the short term.
�������� �� ����������������
�������
TableFinancial Year
2014-20152015-20162016-20172017-20182018-2019
TotalAverage
Dr. Mehul Patel, Dr. R. D. Modi & Dr. S. M. Pillai
Graph 4: Current Ratio of Selected Companies.
Current Ratio of selected companies from 2014–2015 to 2018–20
s a whole, the table reveals as Fluctuating trend. The highest Current Ratio of GSFC Ltd. was 1.66% in 2016
the least of Current Ratio 1.31% in 2018–2019. In the case of GNFC Ltd., as a whole, the table reveals as
trend. The highest Current Ratio of GSFC Ltd. was 1.14% in 2017–2018 and the least of Current Ratio
Quick Ratio Formula or Acid Test Ratio is one of the most important Liquidity Ratios for
ability to pay off its current liabilities in the short term.
��������� ��� �!"#��$�%&'($.
�������*+,-+.+�+�/
Table 6: Quick Ratio of Selected Companies Financial Year GSFC Ltd. GNFC Ltd. Total Average
2015 2.06 1.82 3.88 1.94 2016 2.42 0.97 3.39 1.695 2017 2.07 1.3 3.37 1.685 2018 1.92 0.99 2.91 1.455 2019 1.61 0.85 2.46 1.23
Total 10.08 5.93 Average 2.016 1.186
Dr. R. D. Modi & Dr. S. M. Pillai
2019. In the case of GSFC Ltd.,
s a whole, the table reveals as Fluctuating trend. The highest Current Ratio of GSFC Ltd. was 1.66% in 2016–2017 and
s a whole, the table reveals as Fluctuating
2018 and the least of Current Ratio 0.61% in
Quick Ratio Formula or Acid Test Ratio is one of the most important Liquidity Ratios for determining the company’s
Average
A Study on Financial Performance using Ratio Analysis
Impact Factor (JCC): 7.1593
Graph
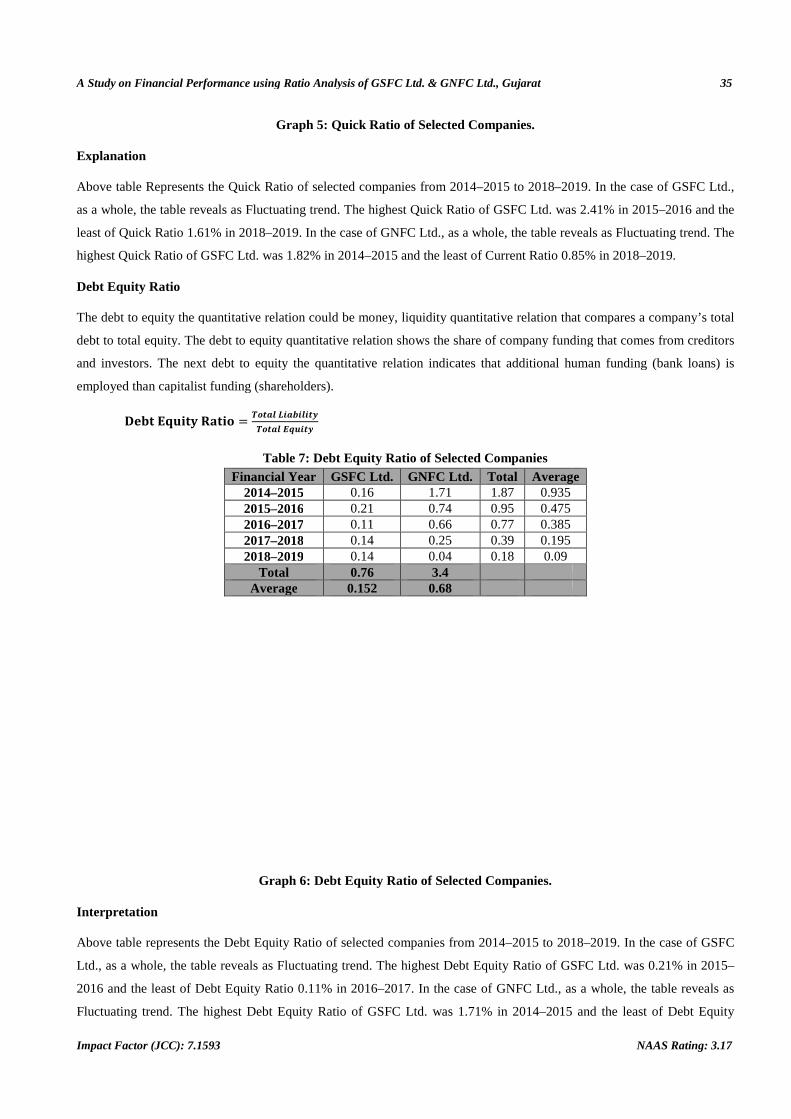
Explanation
Above table Represents the Quick Ratio of selected companies from 2014
as a whole, the table reveals as Fluctuating trend. The highest Quick Ratio of GSFC Ltd. was 2.41% in 2015
least of Quick Ratio 1.61% in 2018–2019. In the case of GNFC Ltd.
highest Quick Ratio of GSFC Ltd. was 1.82% in 2014
Debt Equity Ratio
The debt to equity the quantitative relation could be money, liquidity quantitative relation that compares a company’s total
debt to total equity. The debt to equity quantitative relation shows the share of company funding that comes from creditors
and investors. The next debt to equity
employed than capitalist funding (shareholders).
01234��5��� �6789:;<9=<:<8>
6789:?@A<8>
TableFinancial Year
2014–20152015–20162016–20172017–20182018–2019
TotalAverage
Graph
Interpretation
Above table represents the Debt Equity Ratio of selected companies from 2014
Ltd., as a whole, the table reveals as Fluctuating trend. The highest Debt Equity Ratio of GSFC Ltd. was 0.21% in 2015
2016 and the least of Debt Equity Ratio 0
Fluctuating trend. The highest Debt Equity Ratio of GSFC Ltd. was 1.71% in 2014
sing Ratio Analysis of GSFC Ltd. & GNFC Ltd., Gujarat
Graph 5: Quick Ratio of Selected Companies.
Quick Ratio of selected companies from 2014–2015 to 2018–20
s a whole, the table reveals as Fluctuating trend. The highest Quick Ratio of GSFC Ltd. was 2.41% in 2015
2019. In the case of GNFC Ltd., as a whole, the table reveals as
highest Quick Ratio of GSFC Ltd. was 1.82% in 2014–2015 and the least of Current Ratio 0.85% in 2018
quantitative relation could be money, liquidity quantitative relation that compares a company’s total
debt to total equity. The debt to equity quantitative relation shows the share of company funding that comes from creditors
o equity the quantitative relation indicates that additional human funding (bank loans) is
employed than capitalist funding (shareholders).
;<9=<:<8>
?@A<8>
Table 7: Debt Equity Ratio of Selected Companies Financial Year GSFC Ltd. GNFC Ltd. Total Average
2015 0.16 1.71 1.87 0.935 2016 0.21 0.74 0.95 0.475 2017 0.11 0.66 0.77 0.385 2018 0.14 0.25 0.39 0.195 2019 0.14 0.04 0.18 0.09
Total 0.76 3.4 Average 0.152 0.68
Graph 6: Debt Equity Ratio of Selected Companies.
Debt Equity Ratio of selected companies from 2014–2015 to 2018
s a whole, the table reveals as Fluctuating trend. The highest Debt Equity Ratio of GSFC Ltd. was 0.21% in 2015
2016 and the least of Debt Equity Ratio 0.11% in 2016–2017. In the case of GNFC Ltd., as a whole, the table reveals as
Fluctuating trend. The highest Debt Equity Ratio of GSFC Ltd. was 1.71% in 2014–2015 and the least of Debt Equity
35
NAAS Rating: 3.17
2019. In the case of GSFC Ltd.,
s a whole, the table reveals as Fluctuating trend. The highest Quick Ratio of GSFC Ltd. was 2.41% in 2015–2016 and the
s a whole, the table reveals as Fluctuating trend. The
0.85% in 2018–2019.
quantitative relation could be money, liquidity quantitative relation that compares a company’s total
debt to total equity. The debt to equity quantitative relation shows the share of company funding that comes from creditors
quantitative relation indicates that additional human funding (bank loans) is
Average
15 to 2018–2019. In the case of GSFC
s a whole, the table reveals as Fluctuating trend. The highest Debt Equity Ratio of GSFC Ltd. was 0.21% in 2015–
s a whole, the table reveals as
2015 and the least of Debt Equity

36 Dr. Mehul Patel, Dr. R. D. Modi & Dr. S. M. Pillai
www.tjprc.org [email protected]
Ratio 0.04% in 2018–2019.
FINDINGS
• Operating profit ratio of GNFC Ltd. was better compare to GSFC Ltd. during the study period, Therefore GSFC
Ltd. improve the growth rate.
• The average operating profit ratio of GSFC Ltd. was 9.794 and GNFC Ltd was 15.42% during the study period
from 2014–2015 to 2018–2019. Hence, the performance of GNFC Ltd. was better than the GSFC Ltd.
• The Gross profit ratio of GSFC Ltd. was 8.028% and GNFC Ltd was 10.56% during the study period from 2014–
2015 to 2018–2019. Hence, the performance of GNFC Ltd. was superior to the GSFC Ltd.
• Return on Capital Employed of GSFC Ltd. was 8.38% and GNFC Ltd was 12.98% during the study period.
Hence, the performance of GNFC Ltd. is better than GSFC Ltd.
• Current ratio of GSFC Ltd was 1.56 and GNFC Ltd was 0.90 score during the study period. Hence, the
performance of GNFC Ltd. is good when compared to GSFC Ltd.
• Quick Ratio of GSFC Ltd. was 2.01 and GNFC Ltd was 1.18 mark during the study period hence the performance
of GSFC Ltd. is better than GNFC Ltd.
SUGGESTIONS
•••• Operating Profit Ratio, Gross Profit Ratio, Return on Capital Employed was GNSF Ltd. was better to compare
with GSFC Ltd. during the study period, Therefore, GSFC Ltd. maintain a growth rate.
•••• Current ratio or Quick Ratio was GSFC Ltd. was better to compare GNFC Ltd. during study period there for
GNFC Ltd take required steps for improve it.
CONCLUSIONS
From the above research and data analysis and interpretation, following conclusion can be made. Finance is the life blood
of modern business, without finance business is not possible. The income analysis can show the investment and funding
operational activities of the corporate and conjointly the money increase in decrease within the money. The money
payment for the sales of products and repair received from the debtor's payment purchased from the acquisition of
inventories and money payment for the creditors. Long term assets, non-operating current assets, and investments. Net
effects of influx and outflow of money about these funding activities has set the income statements.
REFERENCES
1. Annual Report of GNFC Ltd from 2014–2019.
2. Annual Report of GSFC Ltd. From 2014–2019.
3. Dr. S. Vijayalakshmi, Sowndarya. K & Sowndharya. K (2017), “A Study on Financial Performance Analysis of Bharti Airtel
Limited” International Journal of Business Marketing and Management (IJBMM) Volume 2 Issue 3 March 2017, P. P.27–32.
4. Tamilselvan, M., & Manjula, V. (2016). Price earnings ratio and financial performance Nexus using panel data regression
model: The case of Oman. International Journal of Business Management & Research (IJBMR), 6(2), 79–84.
A Study on Financial Performance using Ratio Analysis of GSFC Ltd. & GNFC Ltd., Gujarat 37
Impact Factor (JCC): 7.1593 NAAS Rating: 3.17
5. Jyotirmoy Koley (2019), Analysis of Financial Position and Performance of Public and Private Sector Banks in India: A
Comparative Study on SBI and HDFC Bank, A multidisciplinary Online Journal of Netaji Subhas Open University, India,
Vol.2 No.1.
6. Hosain, M. D. (2017). The impact of E-HRM on organizational performance: Evidence from selective service sectors of
Bangladesh. International Journal of Human Resources Management (IJHRM) ISSN (P), 2319–4936.
7. Moneycontrol.com.
8. Lele, U. P. E. N. D. R. A. (2016). Impact of Oil Prices on Revenue Growth and Profitability of Saudi Listed Companies in Non-
Financial Sectors. International Journal of Management, Information Technology and Engineering, 4(6), 13–20.
AUTHOR'S PROFILE
Dr. Mehul Patel is the person who has knowledge of various subjects. He has completed his Ph. D, MBA, MCA and M.
Sc in Value Education & Spirituality and Various Certificate Courses. Presently he is serving in C.P. Patel & F.H. Shah
Commerce College, ANAND since 3 Years. He has 20 years experience in various categories like research, system
analysis, and customization at user end. He taught various faculties like computer science, management, statistics, and
mathematics and operation research. He produced 04 National Research Papers, 24 International Research papers, 3
books published and attended 29 Seminar/Workshops. He is actively review member in various international journals like
JETIR, IJCRT, IARA and IJSRSET. As well as Editor in International Journal of Scientific Research in Science,
Engineering and Technology (IJSRSET), Print ISSN: 2395-1990, Online ISSN : 2394-4099, Associate Editor
of International Journal of Advance & Innovative Research (ISSN: 2394-7780) and International Journal of Research
in Management and Social Sciences (ISSN: 2322 – 0899). Associate Editor of International Journal of Commerce &
Management Research ISSN: 2455-1627, Associate Editor of National Journal of Multidisciplinary Research &
Development ISSN: 2455-9040, and Editorial Member in International Journal for Innovative Research in
Multidisciplinary Field (ISSN: 2455-0620) & International Journal of Research Culture Society (ISSN: 2456-6683). All
are UGC Approved.
Dr. R. D. Modi is the person who has deep knowledge of Economics subjects. He has completed his Ph. D, M.A in

38 Dr. Mehul Patel, Dr. R. D. Modi & Dr. S. M. Pillai
www.tjprc.org [email protected]
Economics. Presently He is serving in C.P. Patel & F.H. Shah Commerce College, ANAND as a Principal since 2012. He
has 29 years experience in academic and other administrative activities. He Involved in college development activities like
academic planning, examinations, preparation of Standard Inspection Form & Mandatory Disclosure for UGC and
purchase of equipments at C P Patel & F H Shah Commerce College, Anand , Actively involved in preparation of
documents required for UGC, NAAC, AAA accreditation at C P Patel & F H Shah Commerce College, Anand, Actively
engaged in organizing cultural events, sports week, annual day celebrations, teachers’ day celebrations etc. Members of
various committees in Sardar Patel University, V. V. Nagar Was part of the AAA Peer Team (Senior Member) appointed
by the Govt to assess Colleges at Gujarat Level Was invited to perform duties as an Observer at the NEET Examination
held all over India Have been appointed as a NAAC Peer Team Member to assess Colleges in India Actively involved in
publication of college brochure and College Magazine; organizing seminars, conferences and guest lectures at the institute.
Involved in organizing health camps, blood donation camps, Drought Relief Camps and Earth Quake Relief Camps, etc.
Invited as resource person by various institutes and delivers guest lecturers as well made several academic related
presentation. He did three minor research project. He Produced 18 Research papers, 09 books published and edit 5 books
as well as attended 40 Seminar/Workshops. He is Co-ordinator in NAAC Committee. He is actively members in Forum of
the Economics Teachers of the Veer Narmad South Gujarat University , South Gujarat College and Teachers’ Association,
Gujarat Principal Association, Mehsana Mitra Mandal, Executive Member, Uttar Gujarat Modh Modi Samaj
Dr. S.M.PILLAI is the person who has deep knowledge of Economics subjects. She has completed his Ph. D, M.Com in
Economics. Presently she is serving in C.P.Patel & F.H.Shah Commerce College, ANAND since 27 Years. She has 20
years experience in various categories like research, IQAC, teaching and other administrative activities. She Produced 08
Research papers, 04 books published and attended 40 Seminar/Workshops. She got 04 awards. She is Co-ordinator in
IQAC Committee. Research Centre Coordinator In Sardar Patel Education Trust, Anand, Life Member In Indian Economic
Association, Gujarat Economic Association And International Society For Applied Commerce Issac. Board of Studies,
Management, Sardar Patel University, Vallabh Vidhyanagar, Board of Studies, Economics, Sardar Patel University,
Vallabh Vidhyanagar, Task Force, Syllabus Framing S (Bba & Bcom) Sardar Patel University, Vallabh Vidhyanagar,
Board of Studies, Economics (Bvoc & CC), Nirf Nodal Officer In C.P.Patel & F.H.Shah Commerce College, Anand, Aaa
Coordinator In C.P.Patel & F.H.Shah Commerce College, Anand, Prepared Re-Accreditation Report of C.P.Patel &
F.H.Shah Commerce College, Anand.
Appointed as Expert of NAAC for carrying out Academic Audit of C.P.Patel & F.H.Shah Commerce college, Anand.
Invited as Resource Person for Administrative Staff Development Program. Invited as an expert of NAAC for Academic
and Administrative Audit of C.P.Patel & F.H.Shah Commerce college, Anand