A study of the nucleate boiling of liquid nitrogen, liquid ...
73
Scholars' Mine Scholars' Mine Masters Theses Student Theses and Dissertations 1969 A study of the nucleate boiling of liquid nitrogen, liquid argon, and A study of the nucleate boiling of liquid nitrogen, liquid argon, and liquid carbon monoxide from atmospheric to near the critical liquid carbon monoxide from atmospheric to near the critical pressure pressure Craig Bauer Johler Follow this and additional works at: https://scholarsmine.mst.edu/masters_theses Part of the Chemical Engineering Commons Department: Department: Recommended Citation Recommended Citation Johler, Craig Bauer, "A study of the nucleate boiling of liquid nitrogen, liquid argon, and liquid carbon monoxide from atmospheric to near the critical pressure" (1969). Masters Theses. 5306. https://scholarsmine.mst.edu/masters_theses/5306 This thesis is brought to you by Scholars' Mine, a service of the Missouri S&T Library and Learning Resources. This work is protected by U. S. Copyright Law. Unauthorized use including reproduction for redistribution requires the permission of the copyright holder. For more information, please contact [email protected].
Transcript of A study of the nucleate boiling of liquid nitrogen, liquid ...

Scholars' Mine Scholars' Mine
Masters Theses Student Theses and Dissertations
1969
A study of the nucleate boiling of liquid nitrogen, liquid argon, and A study of the nucleate boiling of liquid nitrogen, liquid argon, and
liquid carbon monoxide from atmospheric to near the critical liquid carbon monoxide from atmospheric to near the critical
pressure pressure
Craig Bauer Johler
Follow this and additional works at: https://scholarsmine.mst.edu/masters_theses
Part of the Chemical Engineering Commons
Department: Department:
Recommended Citation Recommended Citation Johler, Craig Bauer, "A study of the nucleate boiling of liquid nitrogen, liquid argon, and liquid carbon monoxide from atmospheric to near the critical pressure" (1969). Masters Theses. 5306. https://scholarsmine.mst.edu/masters_theses/5306
This thesis is brought to you by Scholars' Mine, a service of the Missouri S&T Library and Learning Resources. This work is protected by U. S. Copyright Law. Unauthorized use including reproduction for redistribution requires the permission of the copyright holder. For more information, please contact [email protected].

A STUDY OF THE
NUCLEATE BOILING OF LIQUID :N'"ITP..OGEN,
LIQUID ARGON , AND L~:r~l1ID CARBON MONOXIDE
FROH AT~10SPHERIC TO NZAR Tl-IE CRITICAL PRESSURE
BY 70~ CRAIG BAUER JOHI,ER \ \
A
THE SI S
submitted to the faculty of
THE UtHVERSI.TY OF MISSOlHU ··· ROLLA
in partial fu l fi llment of t he requireme nts f or the
DeL;ree of
MASTER OF SCIENCE IN CiiENICAL ENGINEERING
Roll a. , ~Iissouri
1963
ii
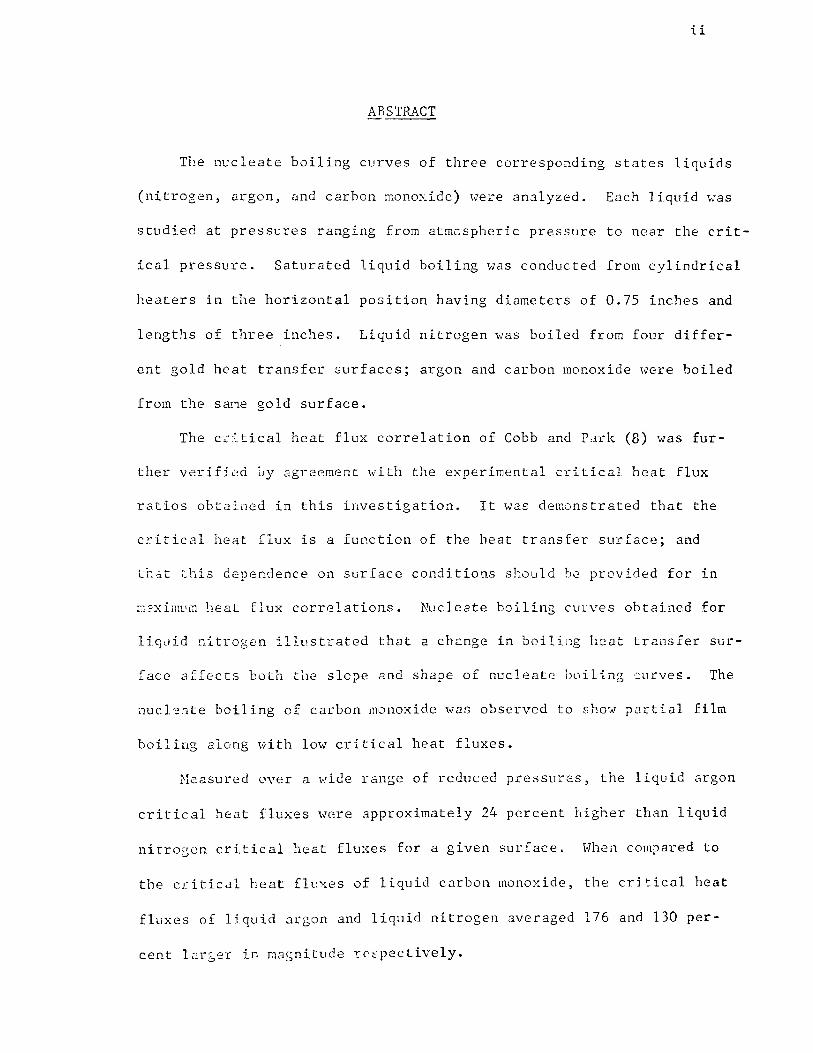
ABSTRACT
The nucleate boiling curves of three corresponding states liquids
(nitrogen, argon, and carbon monoxide) were analyzed. Each liquid was
studied at pressures ranging from atmospheric pressure to near the crit
ical pressure. Saturated liquid boiling was conducted from cylindrical
heaters in the horizontal position having diameters of 0.75 inches and
lengths of three inches. Liquid nitrogen was boiled from four differ
ent gold heat transfer surfaces; argon and carbon monoxide were boiled
from the same gold surface.
The c~itical heat flux correlation of Cobb and Park (8) was fur
ther verified ~y ~greement with the experimental critical heat flux
ratios obtained in this investigation. It was demonstrated that the
critical heat flux is a function of the heat transfer surface; and
Lnat this dependence on surface conditions should be provided for in
n:iximum heat flux correlations. Nucleate boiling curyes obtained for
liquid nitrogen illustrated that 2 chc:cnge in boiling heat transfer sur
face affects both the slope and shape of nucleat~; boil i..ng .~urves. The
nucl~~te boiling of carbon monoxide was observed to sho~ partial film
boiling along with low critical heat fluxes.
Measured over a wide range of reduced pressures, the liquid argon
critical heat fluxes were approximately 24 percent higher than liquid
nitrogen critical heat fluxes for a given surface. When compared to
the critical heat fluxes of liquid carbon monoxide, the critical heat
fluxes of liquid argon and liqt1id nitrogen averaged 176 and 130 per
cent larger i~ magnitude rcEpectively.
iii
ACKJ\OHLEDGEHENTS
The author wishes to thank the following individuals and organi
zations without whose help this study could not have been made.
Dr. E. L. Park for his great interest and ever present willing
ness to help.
Dr. 0. K. Crosser for his constructive and knowledgeable comments
in the writing of this dissertation.
Mr. G. J. Capone for his dedicated and persistent efforts towards
the finishing of this investigation.
Mr. R. T. Hontgomery for his helpful suggestions during the use
of his laboratory.
The American Chemical Society, Petroleum Research Fund, and the
N2tional 8r::ience f-oundation \vhich provided financial assistance both
to the author and to tl1e purcha8ing of the necessary equipment for
this study.

iv
TABLE OF CONTENTS
Page
ABSTRACT • • • • • ii
ACl0\l'mvLEDGEHENTS • . . iii
LIST OF ILLUSTRATIONS. v
LIST OF TABLES . • • • v
Chapter
INTRODUCTION 1
II. ::(EVIEw OF LI.TER.ATURE 4
12
IV. EXPERli\~E:t-;"'TA!~ PROCEDURE 17
v. Imsm:rs. . 19
VI. DISCUSSION • 25
Critical Heat Flux and Haximum Temperature Difference Correlations . . . . . . • • . . . . • . • . . 25
Heat Transfer Surface Effects on Nucleate Boiling. 32
Nucle:1tc Boiling of Carbon Honoxidc. . 35
VII. CONCLUSIONS. 38
39
BI BLlOC!~\ PHY 40
APPENDICi·;.';
A. CAJ,CULATK!l DATA . •
B. EXPE~IME~TAL ERROrrS 64
Vl'L\ 66

v
LIST OF ILLUSTRATIONS
Figure Page
1. A Typical Boiling Heat Transfer Curve ...... . 3
2. Pressure and Condensing System - Schematic Diagram ....... 13
3. Heat Transfer Element . . . . . . . 14
4. Reproduction of a Liquid Nitrogen Nucleate Boiling Curve at 0.1 Pr on Surface Number 4 . . . . . ..... 16A
5. Nucleate Boiling Curves fo~ Liquid ~itrogen on Heat Transfer Surface Number 1. . . . . . . . . . . . . . . 21
6. Nucleate Boiling Curves for Liquid Nitrogen on Heat Transfer Surface Number 2. . . . . . . . ....... 22
7. Nucleate Boiling Curves for Liquid Argon on Heat Transfer Surface Number 2 •.••••••••••••••• 23
8. Nuc I eate Boi 1 ing Curves fo.c Liquid C2rbon Monoxide on Heat Transfer Surface Number 2 ...•...••.. 24
9. C:::>bb and Park Maximum Heat Flux Correlation . . • • • . 26
10. Maximum Ileat Flux Correlations for Liquid Nitrogen ....... 29
11. Maximum Heat Flux Correlations for Liquid Argon . . . ... 30
12. Gen2ralized Naxirnum Temperature Difference Correlation. 31
13. Nucleate Boiling Curves for Liquid Nti:rogen on Different H2at Transfers Surfaces at 0.1 Pr . . . . . . . . . . .. 33
14. Nucleate Boiling Curves for Liquid Carbon Monoxide on Heat Transfer Surface Number 2 ................. 37
Table Page
1. Heat Tra~sfer Surfaces ...........••........ 20

1
I. INTRODUCTION
When heat is supplied to a saturated liquid, vapor begins to form
at the free surface above the liquid; and convective currents start
to circulate the heated liquid. A further increase in heat flux
causes vapor bubbles to form at specific locations on the heated sur
face. These discrete bubbles are intermittently released from the
heated surface and rise to the vapor-liquid interface. The vapor
bubbles are formed on surface anomalies called nuclei, and this phe
nomenon is known as nucleate boiling.
The nucleate boiling region is of great importance to the engi
neer because in this region large quantities of heat can be removed
with relatively low temperature difference. Nucleate boiling has
been widely used in the power industry, in refrigeration, and in re
actor cooling.
To date, there is no general correlation which will predict nucle
ate boiling behavior. It is knm11n that increased bubble production
increases the heat flux greatly, \17hile the temperature difference be
tween the boiling surface and the saturated liquid remains relatively
small. At higher temperature differences the bubble population in
creases to such an extent that the bubbles coalesce and completely
cover the surrounding surface with an unstable vapor film. This
added film resistance greatly decreases the heat transfer rate. The
maximum heat flux attained before the onset of this film boiling is
known as the critical heat flux (burnout point) because the decreased
heat transfer rate characteristic of film boiling may cause the metal
surface temperature to suddenly rise \vell above the me 1 ting point.

2
It is this dangerous situation that has caused wide interest in an
accurate prediction of the critical heat flux.
Nukiya~a (31) summarized the relationship between heat flux and
temperature difference by separation of the boiling curve into four
distinct heat transfer regions: 1) convective, 2) nucleate boiling,
3) unstable film boiling, and 4) film boiling. The four regions
are graphically illustrated in Figure 1.

r ~
I • . !
<t: -0'
X ::l ...... ~
4.1 co <lJ :I: 00 0
...:I
Convection Nucleate Boiling
A
Unstable Film Boiling
Film Boiling
Log Tempe:::-ature Difference,~ T
Figure 1 A Typical Boiling Heat Transfer Curve
' ~ ~
I t ~ ~
I I I I
1,..0

4
II. REVIEW OF LITERATURE
In order to provide a background in the field of nucleate boil
ing, the principle a~eas of study in this field have been reviewed.
Emphasis has been given to the study of the critical heat flux, but
developments in the areas of nucleation sites, bubble dynamics, mech
anisms of boiling heat transfer, and surface effects have also been
examined.
It is known that bubbles originating from nucleation sites are
a distinguishing feature of boiling heat transfer. Jacob (19) pointed
out that the boiling liquid is always slightly superheated at the
liquid-vapor interface. It is this small temperature difference be
tween the tv10 phases that causes evaporation at the interface. By
using the· analogy of a capillary tube, Jacob (19) shmved that boiling
would not start unless finite curvatures (nucleation sites) were
present.
Bankoff (2) stated that in practically all cases the appearance
of bubbles is controlled by minute quantities of gas, usually en
trapped on the solid heat transfer surface. Theoretical arguments
by Bankoff (1, 2) specify the activity of nucleation sites on the basis
of cavity geometry and liquid solid-contact angle. By studying nucle
ation from a single cavity, Griffith and Wallis (16) determined the
importance of cavity geometry. The cavity mouth dimneters defined
the superheat needed to initate boiling and the cavity shape deter
mined stability once boiling had begun. Studying nucleation from
artificial cavities, Denny (11) concluded that steep-walled cavities
with a depth-to-dimneter ratio greater than one were the most active

5
nucleation centers. Kosky (22) proposed three mechanisms \Jhich could
drive a liquid plug into a vapor nucleation site, causing the site to
be de-activated.
Clark, Strange, and Westwater (6) boiled ether and pentane from
zinc and aluminum alloys. They presented photographic evidence iden
tifying nucleation sites and found these sites to be pits with dia
meters of 0.0003 to 0.003 inches. Experimental techniques involving
scale deposits by Heled and Orell (17) facilitated the identification
and location of active sites. By use of nickel salts, Gaertner and
Westwater (14) counted active nucleation sites, and a maximum of 1130
sites per square inch was counted for sub-maximum heat fluxes. Wei
and Preckshot (40) showed detailed evidence of bubble growth from
glass capillary tubes with the capillaries serving as artificial
cavities.
Extensive study has been devoted to vapor bubbles and their re
lation to the high heat transfer coefficients found in nucleate boil
ing transfer. As stated, nucleation sites give rise to the develop
ment of bubbles. Jacob (19) found that the prod•Jct of bubble detach
ment diameter and frequency of bubble departure was essentially con
stant. Boiling with carbon tetrachloride, Denny (11) discovered that
bubble departure diameter increased significantly with increasing
temperature, while frequency remained practically constant. More
recently Ivey (18) showed that no single expression could correlate
frequency and bubble departure diameter and developed correlations
for three nucleate boiling regions: hydrodymanic region, transition
region, and thermodynamic region. Using a vibrating wire as a heat
ing surface, Nangia and Chon (30) reported shorter generating periods

6
for bubbles and smaller bubble diameters at breakoff.
Johnson, de la Pena, and Mesler (21) concluded that bubblds of
spherical shape have little contact area, small size, slow rate of
growth, and little or no delay time; while hemispherical bubbles
have large contact area, large size, fast rate of growth, and long
delay time. A change in surface position, from horizontal to verti
cal, ·h•as found by \-Jilliams and Mesler (41) to affect the delay time
of bubbles from an artificial site.
Various nucleate boiling heat transfer mechanisms have been
postulated as the result of previous studies concerning nucleation
sites and bubble dynamics. These theories are outlined by Cobb (7)
and Forster and Grief (13). Both studies dismissed the theories of
microconvection in the sublayer and latent heat transport by bubbles.
Forster and Grief favored the vapor-liquid exchange mechanism, how
ever Cobb considered the mechanism of mass transfer through the bubble
as p1·esented by Hoore and Hesler (29) to be the correct mechanism.
By substituting inert gas bubbles for bubbles produced in boil
ing, Ba~d and Leonard (3) indicated that heat transfer was most in
tensive during the time the bubble detaches from the surface. In con
trast, Chang and Snyder (4) reported that the high heat flux in nucle
ate boiling was caused by agitation due to bubble growth and not
bubble detachment.
Since nucleation sites have been found to play an important role
in boiling heat transfer, great attention has been directed toward
the condition of the heat transfer surface. Corty and Foust (9) dis
covered that for a roughened surface a significantly lower tempera
ture difference was required for a given heat flux when compared to
7
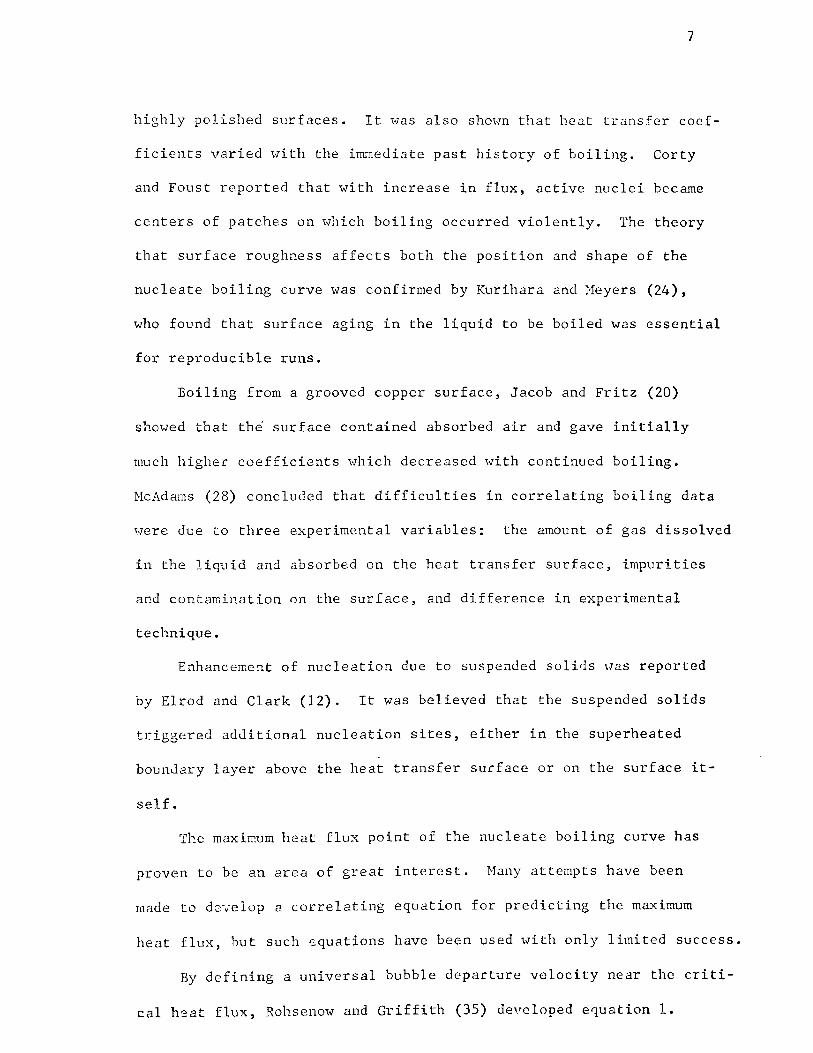
highly polished surfaces. It was also shown that heat transfer coef
ficients varied with the i~rrediate past history of boiling. Corty
and Foust reported that with increase in flux, active nuclei became
centers of patches on which boiling occurred violently. The theory
that surface roughness affects both the position and shape of the
nucleate boiling curve was confirmed by Kurihara and ~-1eyers (24),
who found that surface aging in the liquid to be boiled was essential
for reproducible runs.
Boiling from a grooved copper surface, Jacob and Fritz (20)
showed that the surface contained absorbed air and gave initially
much higher coefficients v1hich decreased \vith continued boiling.
McAdams (28) concluded that difficulties in correlating boiling data
Here due to three experimental variables: the amount of gas dissolved
in the liquid and absorbed on the heat transfer surface, impurities
and contamir~ation on the surface, and difference in experimental
technique.
Enhancement of nucleation due to suspended solids was reported
hy Elrod and Clark (12). It was believed that the suspended solids
triggered additional nucleation sites, either in the superheated
boundary layer above the heat transfer surface or on the surface it
self.
The maxiw.um heat flux point of the nucleate boiling curve has
proven to be an area of great interest. Many attempts have been
made to d2-.relop a. correlating equation for predicting the maximum
heat flux, but such r::qucttions have been used Hith only limited success.
By defining a universal bubble departure velocity near the criti
cal h2at flux, Rohsenow and Griffith (35) developed equation 1.

8
0.6 = 143 (1)
h%ere: L is the latent heat of vaporization
Pv is the vapor density
PL is the liquid density
Kutatladze (25) derived a similar equation independently by use
of dimensional analysis. It was pointed out by Zuber, Tribus, and
westwater (45) that both of the previously mentioned equations have
the same form as the equation for flooding in a bubble-cap column.
This correspondence is to be expected because of the similarity be-
tween burnout in heat transfer and flooding in mass transfer.
Zuber (43) presented equation 2, based on Helmholtz's instabil-
ity for two phase flmv involving liquid and vapor.
(Q/A)MAX 1t r PL - Pv Y4 r PL l~ = 10 g gc (2) Pv L 24 I_ Pv _I I PL+pv
~.fuere: a is the surface tension
g is the acceleration of gravity
Using experimental data from many organic liquids, Cichelli and
Bonilla (5) empirically developed equation 3.
(Q/A)MAX = Pr
Where: Pr is the reduced pressure
a is equal to 1 for clean surfaces
r:x is equal to 1.15 for "dirty" surfaces
Applying thermodynamic similarity and the Clausius Clapeyron
(3)
equation, Lienhard and Schrock (26) obtained an equation similar to
equation 3, involving the definition of a parachor.

9
Zuber (43) predicted a random scatter of ±14 percent f0r criti-
cal heat fluxes based on the hydrodynamic instability theory of un-
stable liquid wave lengths. It is interesting to note that Leinhard
and Schrock (26) reported a ±14 percent uncertainty in burnout heat
flux data, which they attributed to the inherent uncertainty in such
data as shown by Zuber (43). Gambill (15) likewise found a character-
istic randomness in critical heat fluxes which approximated that pre-
dieted by the hydrodynamic instability theory.
Contrary to these findings, Kosky (23), boiling with cryogenic
liquids, discovered peak nucleate boiling fluxes to be reproducible
+ to -1 percent about the mean critical flux. It was reported that a
dependence of the critical flux on the heat transfer surface shifted
fluxes 15 percent. The report suggested that inherent uncertainty in
pcedicting critical fluxes was in reality due only to surface varia-
bility. Sterman and Vilenma (37) also reproduced critical heat fluxes
to ±2.5 percent using diphenyl.
By use of surface deposits, Costello and Frea (10) noted that in-
creasing the wettability of the heat transfer surface reduced the base
radius of the departing surface bubbles, the deposits enabled more
li~uid to reach the heater and in turn increased the critical heat flux.
As discussed by Park (33) and Cobb (7), Frederking used a thermo-
dynamic appro&ch to predict the temperature difference at burnout. He
defined the degree of metastability as,
E = Temperature Difference at Burnout in Actual System
= (4) Theoretical Temperature Difference at Burnout
where the theoretical temperature difference at burnout might be ap-
preached in an ultraclean system.

10
Since the burnout temperature difference changes radically with
change in the microrouglmess of the surface, Park (33) extended
Frederking's work and established a reference value for each surface.
Eqcation 5 was obtained by limiting his work to corresponding states
liquids.
6 Tbo = 2.3 (l-Tr)0.64 (5)
6 Tbo reference Pr = 0.1
\Vhere: Tr is the reduced temperature.
As the critical heat flux has likewise been found to vary with
the microroughness of the surface, Cobb and Park (8) established the
reference value at a reduced pressure of one tenth and included it
in the correlation for the maximum heat flux. They made use of the
Clausis- Clapeyron equation and the assumption that the critical heat
flux is a function of the heat of vaporization which led to the devel-
opment of equation 6.
1.70 - 3.90 Tr - 0.048 :::
(Q/A)MAX
(Q/ A)~1AX p r 5 6 O.l + 5.20 Tr - 12.88 Tr
Tr 2 + 2.81 Tr3 + 2.48 Tr4
(6)
This correlation is a least squares fit of experimental nucleate
boiling results from various heat transfer surfaces and geometries
using several corresponding states fluids. The average deviation of
the correlation was reported to be 12.6 percent.
The results of studies in the areas of nucleation sites, bubble
dynamics, mechanisms of boiling heat transfer, and the critical heat
flux all point to the importance of the heat transfer surface associ-
ated with nucleate boiling. Attempts to develop a general nucleate
hailing heat transfer correlation have failed due to neglect of the

11
role of the heat transfer surface or to improper characteri~ation of
this surface. Cobb and Park (8) have eliminated the effect of the
heat transfer surface in their correlation of maximum heat flux ratios.
The purpose of this investigation is to further verify and extend
the Cobb and Park correlation by studying the nucleate boiling behavior
of the following corresponding states fluids: liquid nitrogen, liquid
argon, and liquid carbon monoxide. Specific attention will be given
to the role of the heat transfer surface on the critical heat fluxes
of these liquids. Several heat transfer surfaces 'vill be employed in
the investigation to emphasize the importance of the heat transfer
surface on the nucleate boiling curves of the previously mentioned
cryogenic liquids.

\,
12
III. ~XPERIHEi\11'AL EQUIPHENT
The experimental equipment was composed of four components: 1)
pressure and condensing system (Figure 2), 2) heating element (Figure
3), 3) electrical system, and 4) the temperature measuring system.
The pressure and condensing system used was similar to those de
scribed by Sciance (36) and Cobb (7). A one gallon autoclave, manu
factured by Autoclave Engineers, Inc., contained the heating element
and liquid pool. The vessel had a depth of twelve inches and an in
side diameter of five inches.
Pressure in the closed vessel was controlled by the amount of
vapor condensed outside the internal condenser as shown in Figure 2.
The condenser coolant, liquid nitrogen, was supplied at 235 pounds
per square inch gage from Linde LS-llOB and LS-156 dewars. A Heise
Bourdon tube ·gauge with a 16 inch dial graduated from 0 to 1000 pounds
per square inch measured the pressure of the system. The system was
protected from dangerously high pressures by a Black, Sivalls, and
Bryson rupture disc, rated at 960 pounds per square inch gauge at 72°F.
All connections shown in Figure 2 were made of 316 stainless steel.
The tubing was 0.25 inch outside diameter with a 0.065 inch wall thick
ness, and the valves were Hhitey No. 1 Series 0.25 inch valves number
IRS4-316.
Figure 3 shows the assembled heating element. Tungsten wire (0.020
inches in diameter) \vound on a 0.40 inch lava core \vith 18 threads per
inch provided the heat source. This core was insulated from the copper
cylinder by Sauereisen Electrical Resistor Cement No. 7 paste. The
copper cylinder measured 0.750 inches in outside diameter, 0.55 inches
inside diameter, and 3.00 inches in length. Tempe-rature distribution·

I I I I
Nitrogen Inlet
Nitrogen Inlet
Cooling Line
Fill Line
Cooling Coil
Autoclave
Rupture Disc
Figure 2. Pressure and Condensing System - Schematic Diagram
Preaaure Gauge
,...... w

Power Terminal
A
Copper Cylinder
ilesistor Cement 224~ungsten Resistance Winding
/. _ Lav<i Core
~hermocouple Well
Section A-A
Figure 3. Heat Tnmsfer Element
1
....... ~

15
in the heati::1g element was measured \vith three copper constanr:an thermo-
couples. These thermocouples were silver soldered into 1/16 inch holes
drilled axially into the heater wall. Positioning of the thermocouples
is clearly shown in Figure 3. A coating of metallic gold was electro-
plated onto the outer copper surface of the heater, and this gold coat-
ing served as the heat transfer surface.
Direct current power was provided by a Sorensen D.C. Power Source,
Model DCR 60-40A. The power source had an output voltage range of 0-60
volts with a current range of 0-40 amperes.
+ Voltage drop across the heating element was measured to - 0.2 per-
cent of the full scale reading of a Digitec Voltmeter, Model 201, mul-
tiple range (000.0 - 100.0 v.). Current input to the heating element
+ was measured to - 0.25 percent of the full scale reading of a Weston
Model 1 (class 50), 50 .?.mpere meter in series with the heating element.
Three thermocouples measured the temperature distribution within
the heating element as shm.,;rn in :!:i'igure 3. A fourth thermocouple mea-
sured the pool saturation temperature and was located several inches
from the heater in the liquid pool. The thermocouples \vere made of
constantan wire and copper wire (Honeywell - Type T - Model No. 9BIC -
30 A.W.G. -with fiber glass coating).
The three thermocouples leading from the heating element were each
attached to the female end of a thermocouple plug made by Marlin Hfg.
Corp. This plug arrangement allowed for easy removal of the heater
from the aut0clave. Each wire from the male end of the three thermo-
couple plugs and the pool thermocouple wire were passed out of the
vessel through a Conax Hlll-1-062-Al6-T gland with teflon sealant to a

16
liquid nitrogen reference jt1nction c1n the outside of the autoclave.
From the reference junction, the thernocouple wires were connected
to a Leeds and Northrup rotary thermocouple switch which was used in
conjunction with a Digitec Voltmeter, Hodel 451, single range (00.00-
10.00 M.V.). + The Digitec Voltmeter measured to - 0.1 percent of the
full scale reading.
The combined product errors of current and voltage for measuring
heat fluxes are ± 0.125 percent, which is approximately equal to t 50
2 Btu/hr. ft. for the large heat fluxes obtained in this investigation.
+ Temperature could be read to - 0.001 millivolts; equivalent to a tem-
perature accuracy of± 0.1°F. However, Figure 4 shows a typical re-
production of a previous liquid nitrogen nucleate boiling curve on
the same heat transfer surface. Temperature differences deviate by
an average of less than 1°F. for cor~csponding heat fluxes. Errors
of measurement in this \\fork are thoroughly discussed in appendix B.

0 .
---·--·-·-·---·---------
·~--------------~----~------~----------~----------~ 0 .
. (01)
rr-
0 . 0
0 0
. .
(\J .-(
..
F'ig
ure
4. P
epr-Jd
uc cio
n o
f a
Liq
uid
Ni tro
sen
Ku
cle
ate
B
oilin
g
Cu
rve
at
0.1
P
r on
Su
rface
Nw
nber 4
l6A
0 . 0 0 . ...:t .-!
~
0
0 Q
) .
()
(\J s:1
r-1 Q
) ;:.; Q
) CH CH ·rl A
Q)
0 ~
. ;:i
0 +
J ,-
j ro ~. Q
) P4 s Q
)
8
0 . co
0 . '-0
0 .

17
IV. EXPER_IHENTAL PROCEDURE
Before filling the autoclave, liquid nitrogen was allowed to
circulate through the internal condenser to aid in cooling the vessel
(see Figure 2). If the autoclave ~vere to be filled with nitrogen,
liquid nitrogen was charged through the fill line and into the vessel
and was vented to the atmosphere. Carbon monoxide and argon were
available in the gaseous state and were condensed inside the auto
clave by regulating the gas flow through the fill line and into the
vessel. Continued circulation of liquid nitrogen through the inter
nal condenser caused the gas to condense, until the required liquid
level was reached within the autoclave.
When the liquid level was approximately seven inches, the vessel
was closed to the atmosphere; and the system pressure controlled by
monitoring the nitrogen flow through the internal condenser. When
the desired pressure was reached, power was supplied to the heating
element. To achieve proper aging of the heat transfer surface, power
was increased until the heater passed into the film boiling region.
The pmver ~.,ras then turned off, and the heater allowed to cool to sat
uration temperature. This procedure of entering the film boiling
region was repeated each time the heater was Pxposed to the atmosphere.
With the liquid pool at the desired saturation temperature, power
was once again supplied to the heating element. Tempcra.ture, amperage
and voltage were recorded after steady state was a.chieved by adjusting
the nitrogen flow rate in the internal condenser, the power level was
raised and the next nucleate boiling point was recorded. Intermittently
18
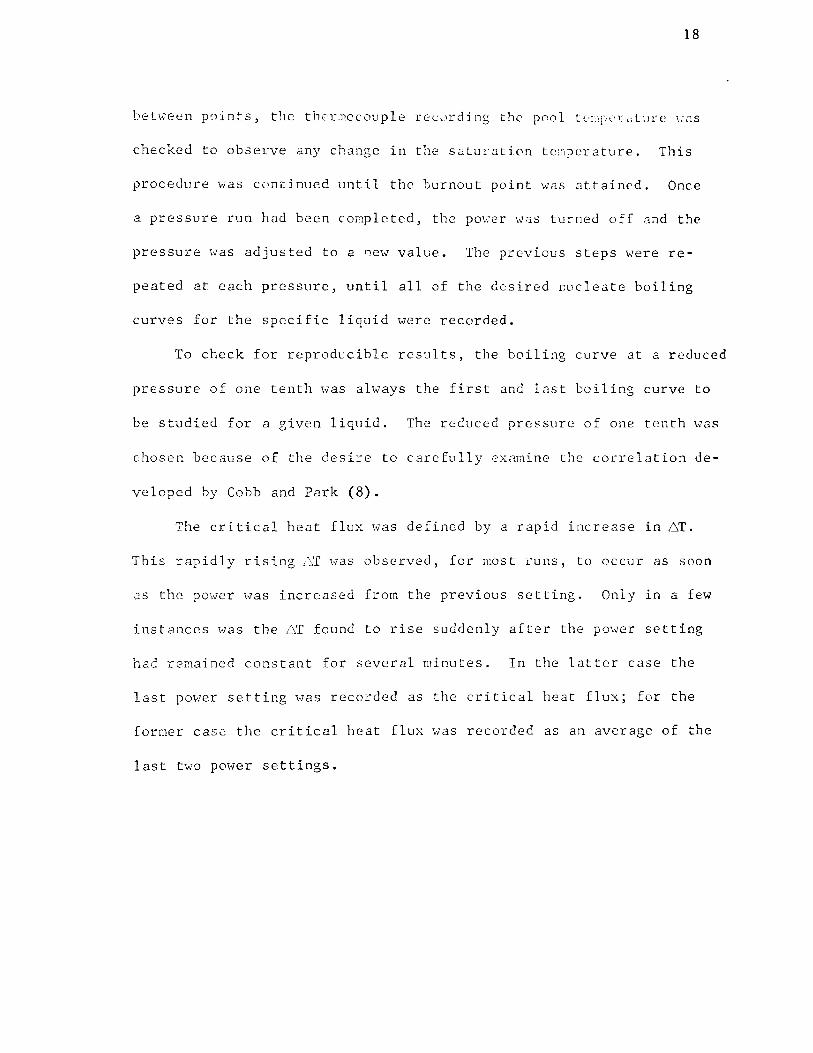
bet·h'een points, the t11cr,nccouplc r<::cLn·ding the pool tCDJ>c>r~:lcn·c \·,'C:S
checked to observe any change in the saturation temperature. This
procedure was continued until the burnout point was attained. Once
a pressure run had been completed, the power was turned off and the
pressure was adjusted to a new value. The previous steps were re
peated at each pressure, until all of the desired ~ucleate boiling
curves for the specific liquid were recorded.
To check for reproducible results, the boiling curve at a reduced
pressure of one tenth was always the first and last boiling curve to
be studied for a given liquid. The reduced pressure of one tenth \-.'as
chosen because of the desire to carefully examine the correlation de-
veloped by Cobb and Park (8).
The critical heat flux was defined by a rapid increase in 6T.
This rapidly rising ,\T Has observed, for most ~cuns, to occur as soon
as the power was increased from the previous setting. Only in a few
instances Has the 6T found to rise suddenly after the pmver setting
had remained constant for several minutes. In the latter case the
last power setting was recorded as the critical heat flux; for the
former case the critical heat flux was recorded as an average of the
last two power settings.

19
V. RESULTS
During the course of taking experimental boiling heat transfer
data, four different heat transfer surfaces were used. Table I is
a summary of the various gold heat transfer surfaces employed. T\vo
heaters were necessary because of the failure of the heating clement
within heater number 1. An entirely new heater and heating surface
were introduted after this failure; however, both heaters were of the
same design.
A total of thirty-eight nucleate boiling runs \-Jere made while
boiling \vith liquid nitrogen, liquid argon, <1nd liquid carbon mon
oxide over a wide range of reduced pressures. Four heating surfaces
were used in taking the twenty-two liquid nitrogen boiling runs, but
only one surface (surface number 2) Has employed for the sixteen liquid
argon and liquid carbon monoxide boiling runs. Thirteen of the thirty
eight nucleate boiling runs '\vere duplications of previous runs at vari
ous reduced pressures.
Figures 5 through 8 present a number of the nucleate boiling curves
at several reduced pressures for individual boiling surfaces. The boil
ing curves for liquid nitrogen and liquid argon followed the same gener
al pattern. The slopes of the boiling curves became larger with in
creasing pressure, and the critical heat fluxes had their greatest
values at reduced pressures ranging from three to five tenths. In
constrast, the nucleate boiling curves obtained with liquid carbon
monoxide (Figure 8) were characterized by abbreviated nucleate boiling
regions and lmv critical heat fluxes. Surface number 2 yielded S-shaped
boiling curves when boiling with liquid nitrogen, liquid argon and liquid
carbon monoxide.

TABLE I
HEAT TRANSFER SURFACES
Surface number Heater number
1 1
2 2
3 2
4 2
Characteristics of the surface
20
electropleated with gold - unaltered
electroplated with gold - unaltered
Surface number 2 - boiled in tap water for 24 hours
Surface number 3 - polished with a soft cloth wheel

--· ...... _
__
...__
0 0
0 .,...;
"' 1.1'\
• •
. 0
0 0
II li
II
P-.J..c J..c
J..c p
, P-.
0 <:j
8
~ ~
.. J 0 .
0 0
c 0
0 0
c 0
0 .
. .
. .
. .
. .,...;
"" a:;
('.. "'
lf' ..::t
C"''
N
( 0"') :/+..'!
tr-(,
".tH;'O
,LS: 'xn1:...r
'f"eaH
0 CD
• 0 II J..c p..
D>
'Cl
co • 0 II J..c 11..
0
0 . ,-i
fj g11:re 5.
K•1cle::~ to
Bo
iling
C
urv
es fo
:r L
iqu
id
Ni tro
gcn
·on
H
c::tt 'I'N
r>sfer S
urf.acc
l~mnber 1
21
0 • ~
..-•
0 . N
.... ~
0 • 0 .,...;
~
0 . G> 0
CJ •
s:: co
CJ
'"" C!l ~
t,.., •rl A
ol)
J..c 0
~
• .;..>
'0
(lj
1-· (i) p.. s Q
.) E--4
0 . -~ ......
0 • N
0
0

r--------------------........--~-1.]-----~-----~----·
0 0
0 0
\Q
.-l
"' l/'1
co
co .
. .
. .
0 0
0 0
0
II II
II II
II ~.
$; r-.
P-.r-. r-.
i--. r...,
0-, fl.
0 <J
0 t>
0
£:
~----·~·----~----~----~----~----~----~----~~--~~--~
0 0
0 0
0 .
. .
. .
l/'1
_j-
"' N
..--i
(Ol.:)
tz-' z '+c'l
".rt-i/lU8
I X<YL>I +
-e<-•H
fjg,_;:·8 6
. I>~r~Late
2-Y1ling
Cu
rves
fo:c U
q1
1id
IJitrc:sen
o
n
f~c-'lt 'I'r·'H
1Sfcr
Su:rf:1ce
Nurrber 2
0
22
0
0 . N
,~
0 . 0 .-l
~,.
Q . G
; c
(.) .
s.:: co
Q
r ... C.' (,...; ;, •ri ~:~
Q
0 ~
• _;::;
'L)
<'.1 r-. C
l) p
. G
0
(---1
0 . _:;[
0 • ('J
0

0 0
0 0
~-<
c~"'\ U
\ 0.~
• .
. .
0 0
0 0
II II
II II
M
P-.H ~
f)...H 0..
0 ~
[J
c (.,"'•. . 0 II J.< 11...
D>
'.J-\ ._, . 0 !I J.. ,, .....
0
0 . ..:t ......
0 . C'J ......
0 • 0 .-
i
-----~---~----~--·--~--·-~-----~----~-----~----~--~0
0 • \1"'1
Fig
ure
7.
0 0
. ..:!"
0 • (\J
0 • .--l
1'~u~lea tc
Boi lir.g
C
urv
es fo
r L
iqu
id A
rGon
on
· H
r:at T
ran
ffer Surf~ce
2
c
23 rx. 0

0 0
0 0
...-l ('()
IJ\
OJ
. 0
0 .
0 0
0 0
P-i;.; P-i;.;
P-i;.; P-l ....
~ _
G-·
_.,_.J:wew-....... "'r.~ ......
,...-~.::l;o;&""U:·•r~..._......_ ••
0 0
0 0
0 0
0 .
0 0
0
L'\
...:t (Y
") C\J
.-!
( 01
) ·'L
it • .rn; m
rr 'x
n1
if 1 B
8H
it-
G
Fit;u
re 8.
tjucle
ate
B
oilin
G C
urv
es fo
r L
iqu
id C
arbo
n M
on
ox
ide
on
Beat
Tran
sfer Su
rface N
wnber
2
24
0 . ...:t .-I
0 0
C\J r-l
0 . 0 .-I
f:r.! 0
"' (!)
0 C
) .
s:: O
J (!) ;.; (!)
Cr-.; '+-! ·r-1 A
(!)
0 ~
. +
' \..0
cl3 f...t (!) p
. s (l)
E-i
0 0
...:t
0 . C\J
0

25
VI. DISCUSSION
This study was made with the purpose of extending the knowledge
of boiling heat transfer in three areas. The first area involves the
prediction of the critical heat flux and maxiw1m temperature differ
ence for both liquid nitrogen and liquid argon. The effects of the
heat transfer surface on nucleate boiling are covered in the second area.
The third phase of study deals with nucleate boiling of liquid carbon
monoxide.
CRITICAL HEAT FLUX AND MAXIMD}1 TEMPERATURE DIFFERENCE CORRELATIONS
All critical flux data for nitrogen and argon was correlated by
using the Cobb and Park (8) maximum heat flux correlation. By using
the reduced pressure of one tenth as a reference value, the correla
tion eliminates the effect of heat transfer surface on the critical
heat flux throughout a series of pressure runs. It must be emphasized
that the heat transfer surface should remain constant during a series
of pressure runs for the correlation to be utilized.
An average error of 6.18 percent Hith a standard deviation of
18.2 percent was obtained '"hen sixteen liquid nitrogen and liquid argon
critical heat fluxes '"ere compared to the Cobb and Park equation in
Figure 9.
The series of nitrogen runs with heating surface number 1 deviates
noticeably from the Cobb and Park equation at reduced pressure of three
tenths Gnd five tenths. This deviation can probably be attributed to
a change in the heat transfer surface during boiling. Although care
was taken to properly age the heating surface before a series of runs,

26
0 1.h
1.2
1.0
..-I . 0
II
rf: o.P 0
~' " c:! t:'; ..........
·~ --.... C1 '-.•' (). 6
~ --....
>< l~ s ,.-.....
~~ -... ..._ 0' '-"
o.4
0 1'~2 .Snrf::tce 1
9 ~,i
·'2 Sl.J~fn.cc 2
0.2 8. lli
·'2 Su:rfar~e 3
8 Ar S,:rfd_ce 2
Cobb and. "Prc:.rk Co•Telation, Equation 6
0 -'-~~- __ ._ __ ,,-.!..-. ...!. • -1·-~--~--~-l..---.1--J...--~ 0 • .5 0.6 0.7 o.s 0.9 1.0

27
a chat~ge in surface conditions could have occlJrred after or during the
first nitrogen pressure run which was made at a reduced pressure af
one tenth. A premature burnout at this particular pressure would
cause the high deviation from the Cobb and Park equation. An att~mpt
to prove this argument, by reproducing the one tenth reduced pressure
run at a later date, was unsuccessful because of the failure of heater
number 1.
Figure 10 shows the accuracy of Zuber's (43) critical heat flux
correlation for liquid nitrogen, having an average experimental error
of -10 percent:; hm.;rever, the Kutatladze (25) curve is shifted upward
from the data. The correlations of Cichelli and Bonilla (5), Lienhard
and Schrock (26), and Rol,senow and Griffith (35) yield results which
sre in error by several hundred percent.
The complete failure of the five previously mentioned correlations
to predict maxim~m heat fluxes corresponding to the experimental re
sults obtaiced using liquid argon is presented in Figure 11. The Zuber
c.nd Kutatladze correlations fail to fit the CJrgon data while they pro
vide & close approximation to the nitrogen data because the surface
tension of argon is approximately ten times larger than the surface
tension of nitrogen, (see equation 2). The experimental heat flux data
yields a mean error of 11.9 percent with a standard deviation of 26.0
percent Hhen compared to the Cobb and Park equation.
For a given surface (surface number 2), the liquid argon critical
heat fluxes were approximately 24 percent higher than the liquid nit
rog0n crilisal heat fluxes. This percentage is based on nucleate
boiling runs made at reduced pressures ranging from one tenth to eight

28
tenths. Cobb (7) found the maximum heat flux to be 10 to 30 percent
higher with liquid argon than liquid nitrogen.
The data of this investigation confirms Park's (33) ma...ximtJm tern-
' perature difference correlation, equation 5. The scattering of the
data (Figure 12) can be attributed to the following sources: 1) De-
termination of the exact temperature difference at the burnout point
is difficult because of heater instability and 2) The magnitude of
the temperature difference is much smaller than that of the heat flux.

C\1 . .::
H --.. . ;S --..
C\J
375
350
325
300
275
225
200
175
150
l"'lt:; --.. c../
.-.- .. --....... . . ./ ..
I
// . ,
// (
: / 1/ ~/
-- ---
·-- + -- w- • .-- ............. 100 ·;£
75
50
0
0
EJ 0
O.l
0
N2 Surface l
N" Surface 2 c:
" Cun·e Reference
Cichelli and Bonilla Lienhard and Schrock Rohsenu11 and Griffith Ku t a tl.s.dze Zuber
\\ \
\ \ \ \
\ \ ' ..
\\ \ \ \\
29
(5) (26) (35) (25) (43)
\ - \
\\
P/P c
Figure 10. ~·hximlull Heat Flux CorrPlations for Liq_uid Nitrogen

CJ . >:::
H
-----.
350
325
300 I
--- , .............
/
I . '/ -/1 ~
I: /
I I /
I 275 I ,:
I jl _,.....- '--. I . • -...........
250 , I ·~ "
' / " I·; 225 -, /f
1/ : 2JJ :1. l (5
~ I ' .
15.0 j
100
75
50
25
0
8 Ar Surface 2
0,1 0.2 0.3
30
Cunre :RE:ference
Cichelli ~1d Bonilla (5) T~ien;1&.rd ancl Sch.cock (26) Rohseum·i and ~;riffith (35) Kutatladze (25) Zuber (43)
\
'\. \
• . \
\
\
.6.
0.5 0.6 0 '7 • I
0 Q .u o. 9 l. 0
F'F I c
:Figure ll. MaximuJn Heat Flux Correlations for LiQuid Argon

31
C\l . 0 .--1
~
<:] ....... • 0
0 co
II .
H
0 il.
r--i n 0 •rl ~
•rl ,._,
(_;
-.() . [--4
0 <
] k
0 .........
0 ..-;
G
''iS 0
•rl +
-) ·rl H
..:t
u (>
..--i N
(""\
C\? •
0 [-<
<
l) <!)
0 <!)
<] (.)
(.) 0
(.) m
r!
C"j ('J
frl c.-~
C.-; ~
H
r. H
H
;:j
;:j ;::1
;'j U
) u
) U
) U
)
•. S"l N
C
\l ,_~
"''"' z
z <
N
. 0
0 Q
<J
l>
~ ~
0
0 0
'-co
C'-
'-[) 1.1\
. .
. •
. .
..--1 0
0 0
0 0
.r.L ';?>
.J ll't 'P..J;:JdW
;),L
p;)o
np
da
Fic
rrr: 1
2.
Gen8r.".1i7.ed.
F::x:ir-•ll'Tl T
cnp
e1"!.h
're Djffcrc~;cc
Co
rrnJa
tion

32
HEAT TRANSFER SURFACE EfFECTS ON I\TUCLEATE BOILING
Four different heat transfer surfaces were utilized during the
experimental nucleate boiling runs, as indicated in Table I. Figure
13 illustrates the effect of the condition of the heat transfer sur
face on the shape and slope of liquid nitrogen nucleate boiling curves.
Relatively smooth nucleate boiling curves are associated \vith surfaces
1 and 4, but the slope of the surface 1 boiling curve is approximately
twice the slope of the boiling curve exhibited 1y surface 4. The boil
ing cu£ve obtained from surface 3 is also of greater slope than the
surface 4 curve; as stated in Table I, surface 4 is highly polished
and smoother than surface 3. Surface 2 and 3 boiling curves initially
have si~ilar slopes, but their shapes and slopes differ greatly as the
crittcal heat flux is approached.
The boiling curves derived from these surfaces confirm the con
cLJsicns reached by Carty and Foust (9); that ~~T in nucleate boiling
decreases with increased roughness and that the positions and slopes
of the boiling curves vary with roughness.
The S-shaped curve associated with surface 2 is particularly un
usual. S-shaped curves have been reported by several authors: Tang
and Rotem (38), Rallis and JaHurck (34), Van Stralen (39), and Zuber
(44); however, the observation of such curves is relatively infrequent.
Orell (32) gives further insight into the S-shaped curve by relating
its appearance to a sudden ir,crease in the nucleation site density.
Many authors- Gambill (15), Costello and Frea (10), Stermen and
Vilemas (37), Kosky (23), and Young and Hummel (42) - have indicated
the importance of the state of the heat transfer surface on the criti
cal heat flux. As mentioned, different pressurP. runs were reproduced

'"=>:j f-'•
(l4 >::! li (lJ
t-' w .
tJ ·~ .. __, f-'•:::: 1-+,)() 1-+.Jt--' (j) (j) ..::t· li ll' I
([) c+ ,.. ..... ::s (lJ 0 c+ ...-1
~· w '--"' ).l.-4 0 rD f-'• (\J
ll' t-' .
c+ f-'· .j..)
..... i1-. ,...>
t-3 CfC. li ll' 0 >-;
::s :::: <:_ en t-1 H.J<: ~ (lJ (j)
'""i en (:Q
en 1-+.J
~
U)O ~ >::! li li rl 1-+.Jt-i i1-. ll' f-'· o..a +' (lJ ~ ro en f-'· (!)
p, ~ ll' c-r ~
f-'• or-. f-.j
1-'0 Gtl
1-Q(J) li ::s
0 ::s
5.0i"
0 Svrface 1 - electrcrplated with gold
I 8. Surface 2 - electroplated with gold
4.0 .... 0 Surface 3 - Surface 2 boiled in tap water for 24 hours
@ Surface 4 - Surface 3 polished with a soft cloth wheel
3. o·-
2.0
l.O
0 ~
0 2.0 4.0 6.0 8.0
Temperature Difference, °F
10.0 12 .o
I , l
I I
I I
/j I i
l ~
14.<) ....,.: w

34
to be sure t~2t the henting surface had n0t changed during boiling.
Eight boiling curves were duplicated at various pressures on unaltered
heat transfer surfaces. Reproduction of the critical heat flux never
deviated by more than 7 percent; and the average deviation for the
eight critical fluxes reproduced was 3 percent. An inherent error
of 3 percent was calculated for this heater arrangement.
In contrast, the five nitrogen reduced pressure runs duplicated
on surfaces 1 and 2 produced an average deviation of 17.6 percent among
co~responding maxim~um heat fluxes. Similarily, a deviation of 24.0
percent was found between atmospheric critical heat fluxes on surfaces
1 and 3; ,.;rhile the ma..ximum heat flux was decreased by 16.4 percent by
polishing surface number 3.
Of the eight boiling curves duplicated on unaltered surfaces, five
wer2 not exposed to the atmosphere between checks for reproducibility
and three were exposed. This exposure did not affect duplication of
the maximum heat flux but did affect the reproducibility of the maxi
Iaum temperature difference. The reproducibility of the maximum 6.T
on the five unexposed surfaces never deviated by more than 7.2 percent,
\vith an average deviation of 4. 6 percent. The maximum !:.T on the three
exposed surfaces varied \vith an average deviation of 19.9 percent.
Frederking (27) explains this deviation by noting that in different
experiments the te;nperature difference may vary by a factor of two,
due to the amount of vapor or foreign gas trapped in surface cavities.

35
1\TtTCLEATE BOILING OF CARBON HONOXIDE
Nucleate boiling of liquid carbon monoxide gave unusual results
when comp&red to the experimental data of nitrogen and argon.
Three boiling curves were duplicated at a reduced pressure of
one tenth, and the average critical heat flux deviation was 11.3 per
cent for the same boiling surface. This high deviation might be ac
counted for by change in the heat transfer surface caused by carbon
monoxide or by the unique behavior of the carbon monoxide critical
heat flux as discussed below.
The critical heat fluxes of liquid argon and liquid nitrogen were
defined by a sudden rise in surface temperature signaling the begin
ning of film boiling. In contrast, the pressure runs of liquid car
bon monoxide, above the reduced pressure of one tenth, entered partial
film boiling at relatively lmv heat fluxes. This partial film boiling
-.;v-as characterized by a slm..:r increase in temperature difference with
tiQe at a const2nt heat flux. After several minutes had elapsed, the
last 6T \vas recorded before a rapid increase in surface temperature
marked the initiation of fully developed film boiling. The last UT
recorded varied randomly in the range of 20 to 50°F with different
pressure runs.
Boiling from a platinum surface -.;..:rith liquid oxygen, Lyon, Kosky,
and Harman (27) experienced this same phenomena of partial film boil
ing at higher pressures. They attributed this behavior to a small
section of the test element entering film boiling. It is apparent
that the variation of pressure causes a change in the normal mechan
isms of nucleate boiling for liquid oxygen and liquid carbon monoxide;

adsorption of the oxygen molecule on the bcdlin::.; surf.1cc :1t l1i;~lwr
pressures may be an explanation.
The carboa monoxide nucleate boiling runs were all obtained while
boiling from heat transfer surface number 2. This is the s:une surface
that exhibited the S-shaped boiling curves for liquid nitrogen and
liquid argon. It may be possible that surface effects other than
oxygen adsorption caused the premature film boiling obs~rved with
liquid carbon monoxide, and that these same unkn0Hn surface effects
are the source of the unique S-shaped boiling curvc>s. l\\Jclc:1te boil
ing of carbon monoxide from different heat transfer surfaces should
provide a definite answer to this question.
The carbon monoxide nucleate boiling curve associated Hith the
reduced pressure of three tenths has a very definite S-shaped appear
ance. This curve may represent the effects of an unstable transition
between the larger slope of the one tenth reduced pressure boiling
curves and the smaller sloped boiling curves at reduced pressures of
five tenths and higher.
The heat flux that initiated partial film boiling Has defined
as the critical h~at flux for carbon monoxide. Figure 14 is an en
largement of Figure 8, and both figures shaH the loH critical heat
fluxes of carbon monoxide coupled with the gradual disappearance of
the nucleate boiling region \vith increasir1g pressure.
A family of nucleate boiling pressure runs \vas made on surface
number 2 for liquid nitrogen, liquid argon, .:mel liquid carbon monoxide.
Comparison of the critical heat fluxes for these liquids shows that the
argon and nitrogen critical heat fluxes averJge 176 and 130 percent
larger in magnitude respectively, \vhen compared to the critical heat
fluxes of liquid carbon monoxide.

0 0
0 0
rl
(Y")
Ll\
CD
.
. .
. 0
0 0
0
rl rl
p...,rl rl
p..., p...,
p...,
L\ 0
0 [>
c IS
\ 0
\ 0
\ .
. 0
0
rl rl
p..., il;
0 ~
0
0 . 0 . 0 rl 37 rr..
0
" (!)
0 0
. ~
CD
(!)
(
~------J ......... _
__
,._
.!. .......... ~
-.ry~---.. J
----~~~""'•'..o-"'~~.J'il!'-~~
Ll\
C\J
0 C\J
Ll\
0 L
l\ 0
. .
. rl
rl
0
Fic:u
re 1
4.
Nu
cle
ate
B
oilin
s C
urv
es fo
r L
ic1u
id
Carb
on
M
on
ox
ide
on
Heat
Trc;,ns fe
r S
urfc>,cc
l'Tum
ber 2
0 . 0 . 0 . (\j
0
::-; (!)
'+-1 Ct-! ·~
A (!)
::-; ;_j
-P
m
::-; (!)
Pi
s (!) E--1

38
VII. CONCLUSIONS
1. Of the critical heat flux correlations tested, the Cobb and Park
(8) equation is the most accurate for the prediction of the criti
cal heat fluxes of liquid nitrogen and liquid argon.
2. Measured over a wide range of reduced pressures, the liquid argon
critical heat fluxes are approximately 24 percent higher than
liquid nitrogen critical heat fluxes for a given surface.
3. Each boiling heat transfer surface has its own characteristic boil
ing curve with respect to both shape and slope.
4. For a given surface, the critical heat flux can be reproduced to
within 3 percent at various reduced pressures; however, it may
vary as much as 25 percent among different heat transfer surfaces.
5. Exposure of the heat transfer surface to the atmosphere does not
affect the critical heat flux, but does alter the maximum temper
ature difference by an average of 20 percent.
6. In contrast to liquid nitrogen and liquid argon, the critical
heat fluxes of liquid carbon monoxide are defined by the appear
ance of partial film boiling at reduced pressures ranging from
three tenths to near the critical pressure.
7. ~1en compared to the critical heat fluxes of liquid carbon monox
ide over a wide range of reduced pressures and for a given surface,
the critical heat fluxes of liquid argon and liquid nitrogen aver
age 176 and 130 percent larger in magnitude respectively.

A 2 Are3, ft.
l'\0}1ENCLATURE
g Acceleration due to grQvity, ft./sec.2
39
gc = Conversion factor in NeHton's law of motion, lb.m ft./lb.f sec. 2
L Latent heat of vaporization, B.T.U./lb.
p = Pressure, P.S.I.
Q = Rate cf heat transfer, B.T.U./hr.
T = Temperature, 0 R or oF
!:.T = Temperature difference, (Tsurface - Tliquid)
Greek Symbols
E = Degree of metastability, defined by Equation 8
o Surface tension, lb.f/ft.
p = Density, lb./ft. 3
Subscripts
L = Refers to the liquid
r = Refers to reduced property
v = Refers to the vapor
.uax = Refers to the point 'vhere the maximum heat flux occurs

40
BIBLIOGRAPHY
l. Bankoff, S G., "Entrapment of Gns in the Spread~ng of n Liquid Over a Rough Surface," A.I.Ch.E. J., Vol. 4, 1958, p. 24.
2. Bankoff, S. G., "Prediction of Surface Temperature at Incipient Boi 1 ing," l1eat Trans fer, Chemical Engineering Progress, Symp::lsium Series, Vol. 55, A.I.Ch.E., Ne\.;r York, 1959, p. 87.
3. Bard, Y., and Leonard, E. F., "Heat Transfer in Simulated Boiling," Int. J. Heat Mass Transfer, Vol. 12, 1967, p. 1727.
4. Chang, Y., and Snyder, N. W., "Heat Transfer in Saturated Boiling," Heat Transfer, Chemical Engineering Progress, Symposium Series, Vol. 56, A.I.Ch.E., New York, 1960, p.25.
5. Cichelli, M. T., and Bonilla, c. F., "Heat Transfer to Liquids Boiling under Pressure," Trans. A.I.Ch.E., Vol. 41, 1945, p. 755.
6. Clark, H. B., Strenge, P. S., and \.Jestwater, J. W., "Active Sites for Nucleate Boiling," Heat Transfer, Chemical Engineering Progress, Symposium Series, Vol. 55, A.I.Ch.E., New York, 1959, p.l03.
7. Cobb, C. B., "A Study of Surface and Geometric Effects on the l';ucleate Boiling of Liquid Nitrogen and Liquid Argon," Ph.D. Thesis, University of Missouri at Rolla, 1967.
8. Cobb, C. E., and Park, E. L., "Nucleate Boi 1 ing - A Haximum Heat Flux Correlation for Corresponding States Liquids," A.I.Ch.E. Preprint 22, Tenth National Heat Transfer Conference, Philadelphia, Pennsylvania, August, 1968.
9. Corty, c., and Foust, A. S., "Surface Variables in Nucleate Boiling," Heat Transfer, Chemical Engineerin_g Progress, Symposium Series, Vol. 51, A.I.Ch.E., New York, 1955, p. l.
10. Costello, C. P., and Surface Burn0ut Heat
and Frea, W. J., "The Role of Capillary Wicking Deposits in the Attainment of H: gh Pool Boiling Fluxes," A.I.Ch.E. J., Vol. 10, 1964, p. 393.
11. Denny, V. E., "Some Effects of Surface ~licro-Geometry on Natural Convection and Pool Boiling Heat Transfer to Saturated Car-bon Tetrachloride," Ph.D. Thesis, University of Hinnesota, 1961.
12. Elrod, W. C., Clark, J. A., Lady, E. R., and Merte, H., "Boiling Heat Transfer Data at Lm'' Heat Flux," J. Heat Transfer, Vol. 89, 1967, p. 235.

41
13. Forster, K. E., and Grief, R., "Heat Transfer to a Boiling Liquid, Hechanisms and Correlations," J. Heat Transfer, Vol. 81, Feb. 1959, p. 43. .
14. Gaertner, R. F., and Westwater, J, W., "Population of Active Sites in Nucleate Boiling Heat Transfer," Heat Transfer, Chemical Engineerin~Progress, Symposium Series, Vol. 56, A.I.Ch.E., New York, 1960, p.39.
15. Gambill, W., "Experimental Investigation of the Inherent Uncertainty in Pool Boiling Critical Heat Fluxes to Saturated Water," A.I.Ch.E. J., Vol. 10, 1964, p. 502.
16. Griffith, P. J., and Wallis, J.D., "The Role of Surface Conditions in Nucleate Boiling," Heat Transfer, Chemical Engi~~ ing Progress, S)~posium Series, Vol. 56, A.I.Ch.E., New York, 1960, p. 49.
17. Heled, YA, and Orell, A., "Characteristics of Active Nucleation Sites in Pool Boiling," Int. J. Heat Hass Transfer, Vol. 10, 1967' p. 553.
18. Ivey, H. J., "Relationships Bet\,,een Bubble Frequency, Departure Diameter, and Rise Velocity in Nucleate Boiling," Int. J. Heat Mass Transfer, Vol. 10, 1967, p. 1023.
19. Jakob, M., Heat Transfer, Vol. 1, John Wiley & Sons, Inc., New York, 1949.
20. Jacob, M., and Fritz, W., Forsch. Gebrite Ingenieurw., 2, 1931, p. 434-447. (As reported in reference 19.)
21. Johnson, H. A. Jr., DeLaPena, J., and Hesler, R. B., "Bubble Shapes in Nucleate Boiling," A.I.Ch.E. J., Vol. 12, 1966, p. 344.
22. Kosky, P. G., 11 Nucleaticn Site Instability in Nucleate Boiling," Int. J. Heat Mass Transfer, Vol. 11, 1968, p. 928.
23. Kosky, P. G., Ph.D. Thesis, University of Calif., 3erkeley, 1965.
24. Kurihara, H. M., and Hyers, J. E., "The Effects of Superheat and Surface Roughness on Boi.ling Coefficient," A.I.Ch.E. J., Vol. 6 ' 19 60 ' p. 83 .
25. Kutateladze, S. S., Izv. Akad., Nauk., U.S.S.R., O.T.D. Tekh. Nauk, No. 4, 1951, p. 342 (A translation.)
26. Lienhard, J. II., and Schrock, V. E., "The Effect of Pressure, Geometry, and the Equation of State upon the Peak and Minimum Boiling Heat Flux," J. Heat Transfer, Vol. 85, 1963, p. 261.

42
27. Lyon, D. N., Kosky, P. G., and Harmnn, B. N., "Xucleate Boiling Heat Transfer Coefficients and Peak Nucleate Boiling Fluxes for Pure LiqtJid N2 and 02 on Horizontal Platinum Surfaces From Belmv 0.5 Atmosphere to the Critical Pressures," AdYances in Cryogenic Engineering, Vol. 9, Plenum Press Inc., New York, 1963, p. 77.
28. McAdams, W. H., Heat Transmission, Third Ed., HcGraw-Hi 11 Rook Company, Inc., New York, 1954.
29. Hoare, F. K., and Mesler, R. B., "The }feasurement of Rapid SurFace Temperature Fluctuations During Nucleate Boiling of Water," A.I.Ch.E. J., Vol. 7, Dec. 1961, p. 620.
30. Nangi.a, K. K., and Chon, W. Y., "Some Observations on the Effect of Interfacial Vibration on Saturated Boiling Heat Transfer," A.I.Ch.E. J., Vol. 13, 1967, p. 872.
31. Nukiyama, S. J., Soc. Mech. Engr's. (Japan), Vol. 37, 1931, p. 367. (From reference 33)
32. Orell, A., "On S-Shaped Boiling Curves," Int. J. Hasb Heat Transfer, Vol. 10, 1967, p. 967.
33. Park, E. L. Jr., "Nucleate and Film Boiling Heat Transfer to Methane and Nitrogen from Atmospheric to the Critical Pressure," Ph.D. Thesis, University of Oklahoma, 1965.
34. Rallis, C. J., and Ja~vurek, H. H., nLatent Heat Transport in Saturated Nucleate Boiling,'' Int. J. Heat Mass Transfer, Vol. 7, 1964, p. 1051.
35. Rohsenow, H. M., and Griffith, P., "A Correlation of Haximum Heat :Flux Data for Boiling of Satur.Jted Liquids," Hee1t Transfer, Chemice_l__Engineering Pr0gress, Symposivm Series, Vol. 52, A.I.Ch.E., Ne'v York, 1956, p. 47.
36. Sciance, C. T., Ph.D. Thesis, University of Oklahoma, 1966.
37. Sterman, L. S., and Vilemas, Y. U., 1''Ihe Influence of the State of the He<J.ting Surface on Heat Transfer at Boiling," Int. J, Heat Mass Transfer, Vol. 11, 1968, p. 347.
38. !ang, S. I., and Rotem, z., "A Secondary Boiling Instability," Can. J. Ch_~· En~, Vol. 43, 1965, p. 355.
39. Van Stralen, S. J., "Heat Transfer to Boiling Binary Liquid Mixtures, Part III," Br. Chern. Engng., Vol. 6, 1961, p. 834.
40. Wei, c., and Preckshot, G. W., "Photographic Evidence of Bubble Departure from Capillaries During Boiling, •: Chemical Engineering Science, Vol. 19, p. 838.

43
41. Hilliams, D. D., and i-Iesler, R. B., "The Effect of Surf<1cc Orientation on Delay Time of Bubbles from Artificial Sites During Nucleate Boiling," A.I.Ch.E. J., Vol. 13, 1967, p. 1020.
42. Young, R. K., and Hummel, R. L., "The Burnout of Surfaces Having Precise Arrays of Active Sites," A.I.Ch.E. Preprint 23, Tenth National Heat Transfer Conference, Philadelphia, Pennsylvania, August, 1968.
43. Zuber, N., Trans. A.S.M.E., Vol. 80, 1958, p. 711.
44. Zuber, N., "Recent Trends in Boiling Heat Transfer Research Part 1: Nucleate Pool Boiling," Applied Mechanics RevieHs, Vol. 17, 1964, p. 664.
45. Zuber, N., Tribus, M., and WestHater, J. W., "The Hydr·odynamic Crisis in Pool Boiling of Saturc:ted and Subcooled Liquids," U.S. At. Energ~ Comm., AECU-4439, p. 196, 1959.
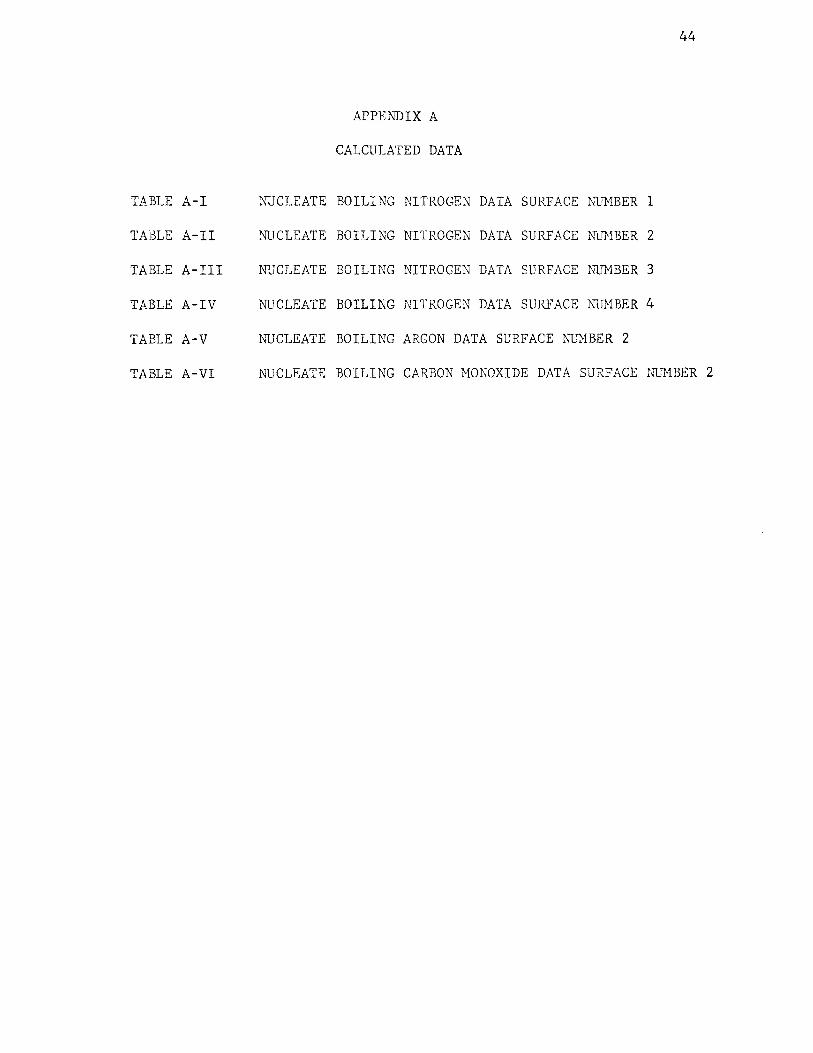
TABLE A-I l\'l.TCLEATE
TABLE A-II NUCLEATE
TABLE A-III NUCLEATE
TABLE A-IV NUCLEATE
TABLE A-V NUCLEATE
TABLE A-VI NUCLEATE
APPENDIX A
CALCULATED DATA
BOILING NITROGEN DATA
BOILING NITROGEN DATA
BOILING NITROGEN DATA
BOILING NITROGEN DATA
SURFACE NUMBER 1
SURFACE NLJNBER 2
SURFACE 1\'UMBER 3
SURF ACE :t'-.'lTHBER 4
BOILING ARGON DATA SURFACE NUMBER 2
44
BOILING CARBON MONOXIDE DATA SURFACE NUMBER 2

th1C:LEA'l'E BOILING l\"TITROGEN DATA ON SURFACE ~l.JNBER 1
Date - 6-27-67 Saturation Temperature 138.7°R
Saturation Pressure 14.2 P.S.I.A.
Q/A (10)-4 1?.:.!...::1. /~.E.!...Jt. 2
t:,.T Op
6.4 10.5 13.4 15.4 16.4 16.6
0.243 0.773 1.336 1.942 2.600 3.160 3.500 B-..::rnout Point
Date - 4-18-68 SatDration Temperature 160.7°R
S3turation Pressure 49 P.S.I.A.
Q/A (10)-4 6T B. t ._~jhr. ft 2 oF
0.241 3.6 0.670 5.4 1.200 6.0 1.690 7 .1+
2.130 8.2 2.670 9.0 3.020 9.7 3.520 10.4 3.360 10.8 4.060 11.2 4.260 Bu!'nO\Jt Point
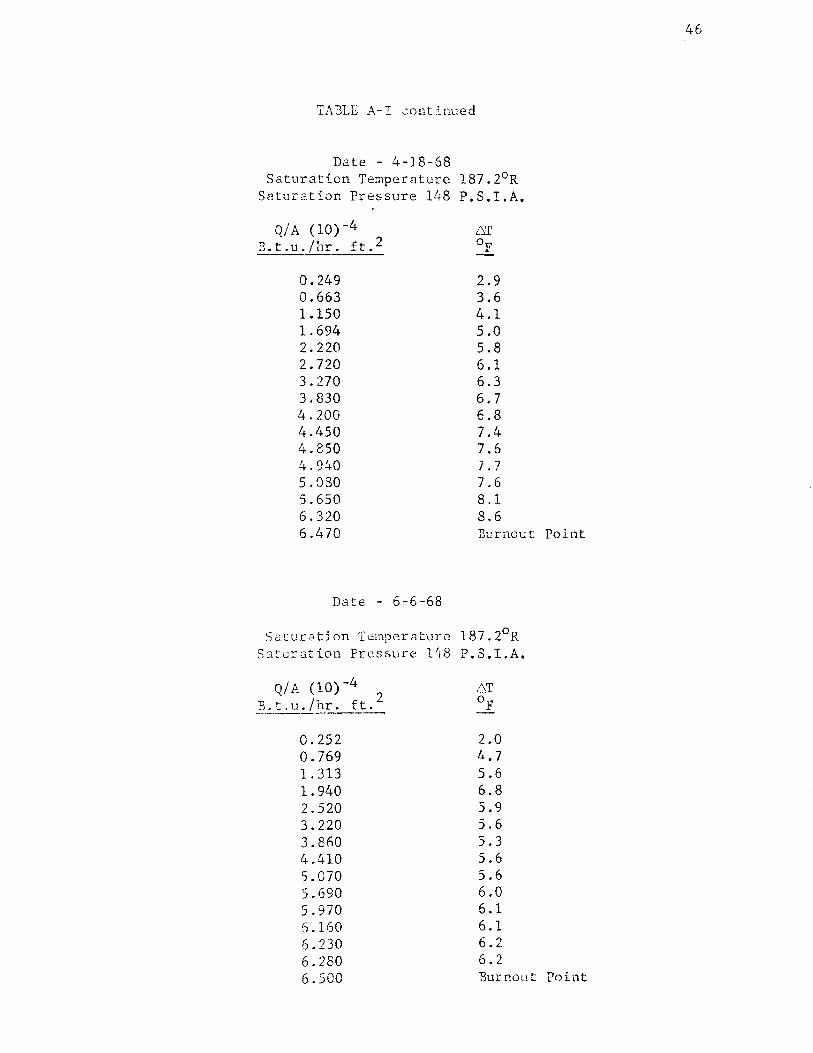
TABLE A-I .::ontinued
Date - 4-18-68 Saturation Temperature 187.2°R
Satur2tion Pressure 148 P.S.I.A.
Q/A (10)-4 6T B.t.u./hr. ft.2 oF
0.249 2.9 0.663 3.6 1.150 4.1 1.694 5.0 2.220 5.8 2.720 6.1 3.270 6.3 3.830 6.7 4. 200 6.8 4.450 7.4 4.850 7.6 4.9~0 7.7 5.080 7.6 5.650 8.1 6.320 8.6 6.470 :Bt.:rnout
Date - 6-6-68
Saturation Temperature 187.2°R Satu~ation Pressure 1~8 P.S.I.A.
Q/A (10)-4 2
.6.T ] . .:.t . u .:J_hr. ft. oF
0.252 2.0 0.769 4. 7 1. 313 5.6 1.940 6.8 2.520 5.9 3.220 5.6 3.860 5.3 4.410 5.6 5.070 5.6 5.690 6.0 5.970 6.1 5.160 6.1 6.230 6.2 6.280 6.2 6.500 Burnout
46
Point
Point

TABLE A-I continued
Date - 6-6-68 Saturation Temperature 187.2°R
Saturation Pressure 148 P.S.I.A.
Q/A (10)-4 B.t.u./hr. ft.2
0.146 0.588 1.120 1.593 2.090 2.550 3.030 3.700 4.400 5.160 5.960 6.170 6.250 6. 320
1.2 1.8 2.6 3.1 3.5 3.6 3.6 4.0 4.6 5.0 5.6 5.7 5.8 Burnout Point
Date - 5-7-68 Saturation T~mperature 202.9°R
Sat0ration Pressure 246 P.S.I.A.
Q/ A (10) -4 " B.t."cJ./hr. ft.L ---~--
0.258 0.657 1.200 1.735 2.220 2.630 3.120 3.650 4.110 4.560 5.000 5.590 5.980
1.2 2.7 4.5 5.6 6.0 5.8 5.6 5.0 5.2 5.6 6.0 6.8 Burnout Point
47

L~8
TABLE A-I continued
Date - 6-6-68 Saturation Temperature 202. 9°R
Saturation Pressure 246 P.S.I.A.
Q/A (10)-4 2
6T B. t. u. /hr. ft. OF
0.135 1.5 0. 613 2.1 1.105 2.8 1. 622 3.2 2.090 3.3 2.520 3.7 2.970 3.9 3.620 4.3 4.290 4.8 4. 780 4.8 5.180 5.0 5.590 5.3 5.800 5.5 5.950 5.6 6.050 5.7 6.150 Burnout Point
Date - 5-7-68 Saturation Tegperature 218.9°R
Saturation Pressure 394 P.S.I.A.
Q/A (10)-4 2
6T I3. t. u . /hr. ft. OF
0.085 1.2 0.333 1.4 0.525 1.7 0.750 2.0 0.966 2.2 1.085 2.5 1.400 2.6 1.601 2.9 1. 810 2.9 2.050 3.0 2.260 3.3 2. 41+0 3.4 2.500 Rurno·ut Point

TABLE A-I continued
Date - 5-7-68 Saturation Temperature 221.4°R
Saturation Pressure 423 P.S.I.A.
Q/A (10)-4 B.t.u./hr. ft. 2
0.046 0.208 0.432 0.629 0.742 0.909 1.180 1.382 1.562 1.680 1.850
0.3 0.4 0.7 0.8 0.9 1.1 1.4 1.6 1.7 1.6 BurP.out Point
Date - 5-8-68 SaturAtion Temperature 225.1°R
S:turation Pressure 467 P.S.I.A.
0.022 0.168 0.319 0.451 0.574 0.662 0.730
0.4 0.4 0.4 0.4 0.5 0.9 0.9 Bur~out Point
49
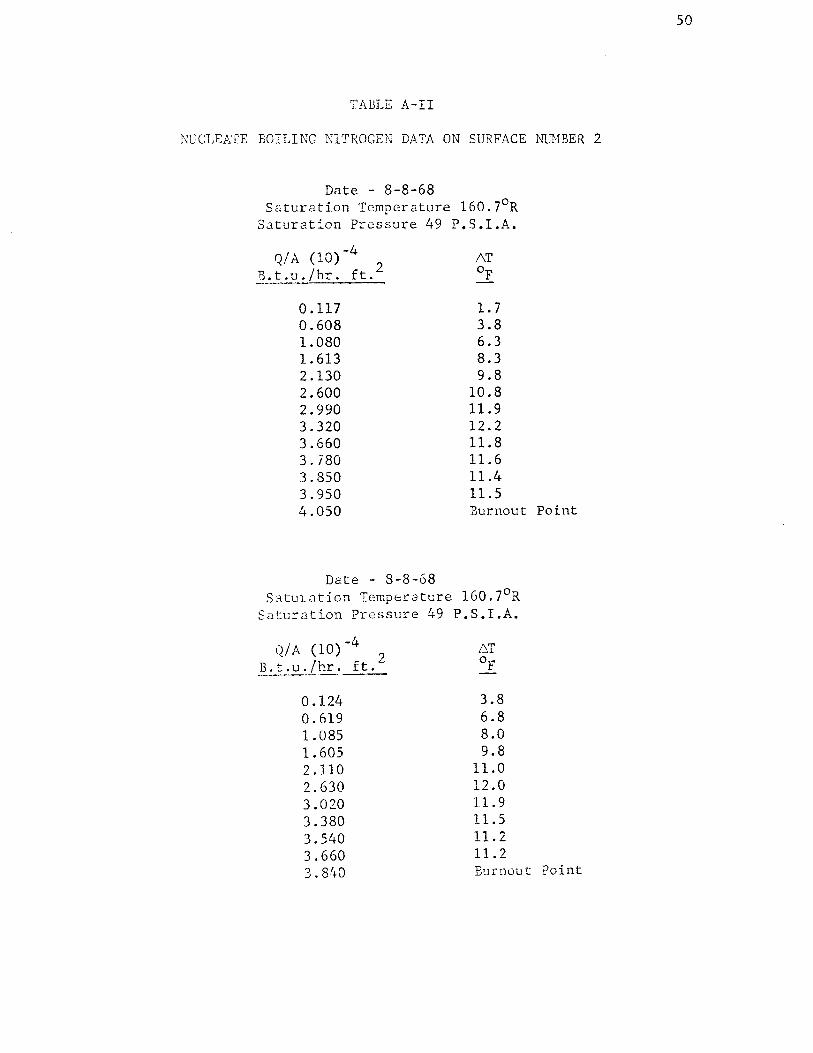
TABLE A-II
l\'1JCLEATE BOILING NITROGEN DATA ON SURFACE NUMBER 2
Date - 8-8-68 S~turation Temperature 160.7°R
Saturation Pressure 49 P.S.I.A.
Q/A (10)-4 2 B.t.u./hr. ft.
.6.T oF
1.7 3.8 6.3 8.3 9.8
10.8 11.9 12.2 11.8 11.6 11.4 11.5
0.117 0.608 1.080 1.613 2.130 2.600 2.990 3.320 3.660 3.l80 3.850 3.950 4.050 Burnout Point
Date - 8-8-68 Satu1ntion Temperature 160.7°R
Saturation Pressure 49 P.S.I.A.
Q/A (10)-4 2 6T
B. t .u ~lhr. ft. oF
0.124 3.8 0.619 6.8 1.085 8.0 1.605 9.8 2.110 11.0 2.630 12.0 3.020 11.9 3.380 11.5 3.540 11.2 3.660 11.2 3. 8!+0 Burnout ?oint
50
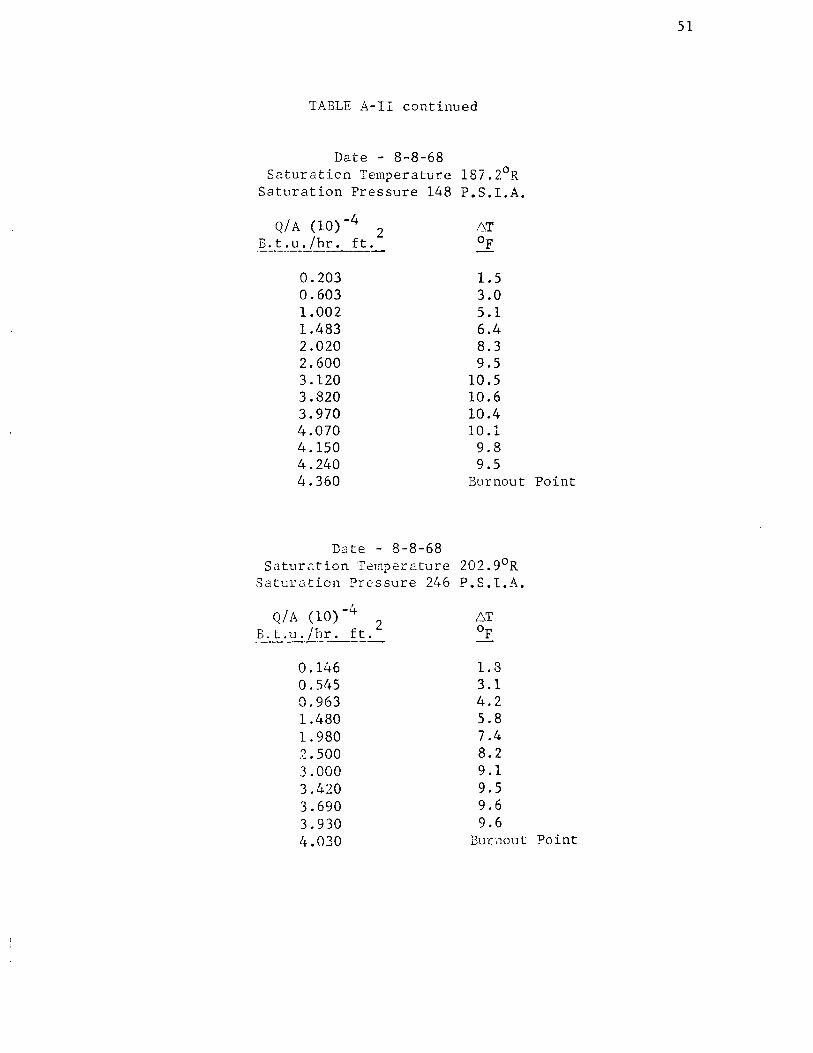
TABLE A-II continued
Date - 8-8-68 Saturaticn Temperature 187.2°R
Saturation Pressure 148 P.S.I.A.
Q/A (10)-4 2 .£:..!.:. u. /hr. ft.
0.203 0.603 1.002 1.483 2.020 2.600 3.120 3.820 3.970 4.070 4.150 4.240 4.360
1.5 3.0 5.1 6.4 8.3 9.5
10.5 10.6 10.4 10.1 9.8 9.5
Burnout Point
Date - 8-8-68 Satur~tion Temperature 202.9°R
Saturation Pressure 246 P.S.I.A.
Q/A (10)-4 2 A.:_l_._u. /1-~~f~-·
0.146 0.545 0.963 1.480 1. 980 2.500 3.000 3.420 3.690 3.930 4.030
1.3 3.1 4.2 5.8 7.4 8.2 9.1 9.5 9.6 9.6
Bur11out Point
51

TABLE A-II continued
Date - 8-8-68
Saturation Temperature 218.9°R Saturation Pressure 394 P.S.I.A.
Q/A (10)-4 2 B.t.u./hr. ft.
0.078 0.288 0.683 1.165 1.510 1. 910 2.200 2.290
0.7 1.6 2.0 2.2 2.4 2.5 2.5
· Burnout Point
Date - 8-8-68 Saturation Tcnpcrature 221.4°R
Saturation Pressure 423 P.S.I.A.
Q/A (10)-4 2
_!)~~Jh~~
0.162 0.281 0.495 0.690 0.932 1.148 1.455 1.650 1.860 1. 915
!':IT Op
1.8 2.3 2.6 2.8 2.7 2.9 3.0 3.0 3.1 Burnout Point
52

TABLE A-III
1\LJCLEATE BOILING NITROGEN DATA 0~ SURF,\CE l\'VHBER 3
Date - 8-31-68 Saturation Temperature 138.7°R
Saturation Pressure 14.2 P.S.I.A.
Q/A (10)-4
.£:~'!./hr. ft. 2
5.1 8.2 9.4
10.1 11.0 12.1 12.8 13.0
0.127 0.508 0.919 1.320 1. 740 2.160 2.460 2.570 2.640 Burnout Point
Date - 9-4-68 Saturation Temperature 138.7°R
Saturation Pressure 14.2 P.S.I.A.
Q/A (10)-4 /:,T B.t.u./hr. ft. 2 Op
0.279 6.5 0.763 8.3 1. 210 10.0 1. 760 12.2 2.260 13.2 2.340 13.3 2.420 13.4 2.490 Burnout Point
53
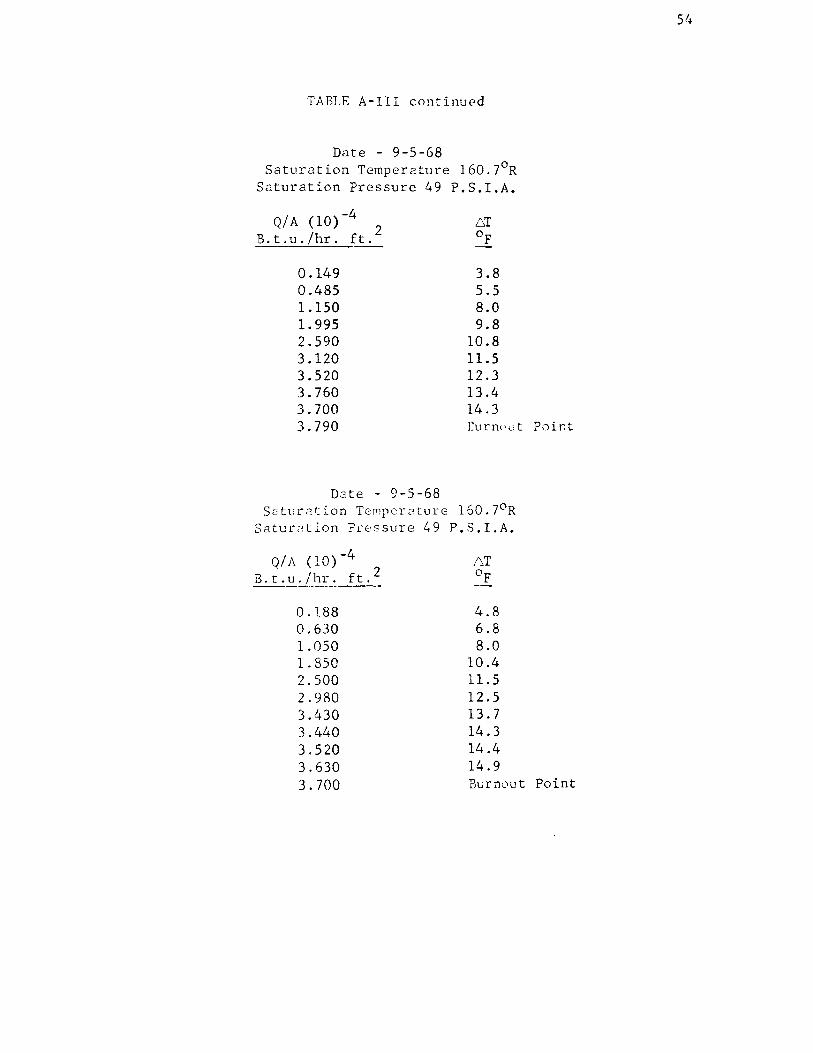
TABLE A-III continued
Date - 9-5-68 Saturation Temperature 160.7°R
Saturation Pressure 49 P.S.I.A.
Q/A (10)-4 2 B. t .u. /hr. ft.
3.8 5.5 8.0 9.8
10.8 ll.5 12.3 13.4 14.3
0.149 0.485 1.150 1. 995 2.590 3.120 3.520 3.760 3.700 3.790 Eurn<'l.Jt Point
Date - 9-5-68 Saturation Temperature 160.7°R
Saturation Pressure 49 P.S.I.A.
Q/A (10)-4 6T B.t.u./hr. ft. 2 OF
0.188 4.8 0.630 6.8 1.050 8.0 1.850 10.4 2.500 11.5 2.980 12.5 3.430 13.7 3.440 14.3 3.520 14.4 3.630 14.9 3.700 Burnout Point

TABLE A-IV
~~CLEATE BOILING NITROGEN DATA ON SURFACE NUMBER 4
Date - 9-5-68 Saturation Temperature 160.7°R
Saturation Pressure 49 P.S.I.A.
Q/A (10)-4 2 6T B.t.u./hr. ft. Op
0.219 5.0 0.733 7.8 1.200 9.8 1.970 12.2 2.520 14.2 2.780 16.4 2. 770 16.2 2.870 16.6 2.940 16.8 3.030 17.7 3.140 Burnout
Date - 9-5-68 Saturation Te~perature 160.7°R
Saturation Pressure 49 P.S.I.A.
Q/A (10)-4 2 _l).t.u./h_!'. ft.
5.1 7.9
11.6 13.1 15.3 16.5 16.8 17.4 !8.2
Point
0 .1+10 0.878 1.620 2.100 2.540 2.780 2.940 3.030 3.090 3.100 Burnout Point
55

TABLE A-V
NUCLEATE BOILING ARGON DATA ON SURFACE ~~1BER 2
Date - 7-6-68 Saturation TemperatuLe 192. 0 R
Saturation Pressure 71 P.S.I.A.
Q/A (10}-4 2 B.t.u./hr. ft.
6T Op
5.8 8.6
11.4 12.7 16.9 18.4 15.4
0.339 1.059 1.900 2.660 3.440 4.210 4.670 5.350 Burnout Point
Date - 8-1-68 Saturation Temperature 192. 0 R
Saturation Pressure 71 P.S.I.A.
Q/A (10)-4 6T B.t.u./hr. ft. 2 Op
0.348 3.6 1.045 8.8 1. 788 10.9 2.460 13.3 3.010 13.7 3.420 14.0 3.680 13.9 4.100 13.3 4.350 13.4 4.560 12.9 4. 780 Burnout Point
56

TABLE A-V continued
Date - 8-1-68 Saturation Temperature 192. 0 R
Saturation Pressure 71 P.S.I.A.
Q/A (10)-4 2 B.t.u./hr. ft.
0.343 1.226 2.390 2.950 3.390 3.970 4.230 4.540 4.650 4.800
5.2 9.8
13.5 14.6 14.6 14.6 14.0 13.5 13.9 Burnout Point
Date - 7-6-68 Saturation Temperature 225. 0 R
Saturation Pressure 212 P.S.I.A.
Q/A (10)-4 2 B. t ·-~-=.Lhr. ft.
0.301 1.030 1.895 2. 770 3.560 4.230 4. 780 5.120 5.850
3.4 4.6 5.6 6.2 6.9 7.3 6.4 6.0 Burnout Point
57

TABLE A-V continued
Date - 7-6-68 Saturation Temperature 243. 0 R
Saturation Press~re 352 P.S.I.A.
-4 Q/A (10) 2
B. t. u. /hr_. ft.
0.293 0.974 1.800 2.660 3.460 3.840 4.150 4.410 4.410 4.650
3.6 5.9 7.3 8.0 8.5 8.6 8.5 8.5 8.4 Burnout Point
Date - 8-1-68 Saturation 7emperat~re 262. 0 R
Saturation Pressure 564 P.S.I.A.
Q/A (10)-~~ 2 B.t.u./hr. tL. ---·
0.029 0.112 0.231 0.365 0. 525 0.701 0.859 1.200 1.440 1.700 2.030 2.220 2.430 2.630 2.850 3.000
1.8 2.3 2.8 3.1 3.3 3.4 3.5 3.8 3.8 3.9 4.0 4.0 4.0 4.1 4.1 Burnout Point
58

TABLE A-V continued
Date - 8-1-68 Saturated Temp~rature 268. 0 R
Saturated Pressure 634 P.S.I.A.
Q/A (10)-4 2 B.t.u./hr. ft.
0.214 0.354 0.615 0.915 1.123 1.309 1. 372 1.681 1. 810 1.900
1.8 1.8 1.8 2.0 2.1 2.1 2.1 2.2 2.2 Burnout Point
Date - 8-1-68 Saturated Temperature 270. 0 R
Saturated Pressure 670 P.S.I.A.
Q/A (10)-4 B.t.u./hr. ft. 2
0.267 0 .41~4 0.615 0. 710 0.840 0.925
1.7 1.6 1.7 1.5 1.7 Burnout Point
59

TABLE A-VI
i:\LJCLEATE BOILING OF CARBON HONOXIDE DATA SURF ACE NUHBER 2
Date - 8-1-68 Saturation Temperature 175.5°R
Saturation Pressure 51 P.S.I.A.
Q/A (10)-4 2 B. t.u. /hr. ft.
0.342 1.170 1.948 2.930 3.700 4.500 5.080
5.0 8.3
1.0.1 10.9 12.2 12.4 11.9 Bt1rnout Point
D<=~te - 8-8-68 Saturation Temper3ture 175.5°R
Saturation Pressure 51 P.S.I.A.
Q/A (10)-4 B. t. u: /hr. ft. 2
0.117 0.608 1.080 1.613 2.130 2.600 2.990 3.320 3.660 3.780 3.850 3.950 4.050
1.7 3.8 6.3 8.3 9.8
10.8 11.9 12.2 ll.8 11.6 11.4 ll.S Burnout Point
60

TABLE A-VI continued
Date - 8-8-68 Saturation Temperature 175.5°R
Saturation Pressure 51 P.S.I.A.
Q/A (10)-4 .0T B. t.u. /hr. ft. 2 OF
0.124 3.8 0.619 6.6 1.085 8.0 1.605 9.8 2.110 11.0 2.630 12.0 3.020 11.9 3.380 11.5 3.540 11.2 3.660 11.2 3.840 Burnout
Date - 8-8-68 Saturation Temperature 202.9°R
Saturation Pressure 152 P.S.I.A.
Q/A (10)-4 2 B.t.u./hr. ft.
2.3 3.3 4.1 4.7 5.0 3.8 4.4 4.9
Poi;tt
0.078 0.170 0.330 0.733 0.990 1. 328 1.590 1.858 2.100 6.0 Partial Film
61

TABLE A-VI continued
Date - 8-8-68 Saturation Temperature 218.7°R
Saturation Pressure 254 P.S.I.A.
Q/A (10)-4 B.t.u./hr. ft. 2
0.072 0.249 0.438 0.695 0.928 1.261 1.511
1.5 2.0 2.8 3.7 4.8 7 .o 9.1 Partial Film
Date - 8-8-68 Saturation Temperature 237.2°R
Saturation Pressure 407 P.S.I.A.
Q/A (10)-4 ~~1}__./h~ft. 2
0.065 0.124 0.204 0.348 0.459 0.646 0.746
1.0 1.7 2.4 3.5 4.8 7.0 7.9 Partial Film
62

TABLE A-VI continued
Date - 8-2-68 Saturation Temperature 239.4°R
Saturation Pressure 461 P.S.I.A.
Q/A (10)-4 2 B. t. u. /hr. ft.
0.053 0.141 0.270 0.373 0.488
0.9 1.3 1.4 1.8 2.6 Partial Film
Date - 8··2-68 Saturation Ter..pcratore 240. 8°R
Saturation Pressure 482 P.S.I.A.
Q/A (10)-4 2 B.t.u./hr. ft.
0.009 0.039 0.077 0.1.+6 0. 21+6 0.376 0.491 0.585 0.685 0.765
0.4 0.6 0.6 0.6 0.6 0.9 1.3 1.6 2.4 3urnout Point
6.3

APPENDIX B
EXPERI.HENTAL ERRORS
64

•
65
As noted, the equipment and apparatus discussed in this study
are v2ry similar to that used by Park (33) and Cobb (7). The error
analysis developed in these references should be referred to for
detailed study of errors.
Current and voltage could be read to within± 0.125 amperes and
± 0.01 volts respectively. The combined product errors are ± 0.125
percent. Temperature could be read to± 0.001 millivolts which is
+ equivalent to a temperature accuracy of - 0.1°F.
Both pool thermocouple and heater thermocouples were checked for
calibration, when no heat flux was applied, by using vapor pressure
data. Due to the resistance of the thermocouple plug and wires, an
inherent positive error of approximately 1°F was noticed. This error
\vas subtracted from thermocouple readings at each heat flux; and the
6T \vas then unaffected by this error, since the error was due to re-
sistance outside of the heating system and was eliminated by sub-
traction. During boiling, the three thermocouples within the heater
differed from 1 to 2°F depending on the intensity of the heat flux.
+ Pressures were measured accurately to - 1 pound per square inch.

66
VITA
Craig Bauer Johler, the son of Mr. and Hrs. Walter W. Johler,
was born August 12, 1945, in Alton, Illinois.
He attended both elementary and secondary schools in the Roxana,
Illinois, school system. After graduation from Roxana Community High
School in June of 1963, he entered the University of Missouri School
of Mines and Metallurgy in the fall of 1963. He received his Bachelor
of Science in chemical engineering in June, 196 7; and enrolled in the
graduate school of the University of Hissouri - Rolla in the fall of
1967.