A Study of the MRO Supply Chain for Paper Millscpbis.gatech.edu/files/papers/CPBIS-FR-04-01...
51
A Study of the MRO Supply Chain for Paper Mills Final Research Report Presented to the Center for Paper Business and Industry Studies (CPBIS) Faculty Yih-Long Chang, College of Management, Georgia Tech Cheryl Gaimon, College of Management, Georgia Tech Soumen Ghosh, College of Management, Georgia Tech Vinod Singhal, College of Management, Georgia Tech Graduate Students Carrie Crystal, College of Management, Georgia Tech Patty Swafford, College of Management, U. of Texas - Arlington September 2004
Transcript of A Study of the MRO Supply Chain for Paper Millscpbis.gatech.edu/files/papers/CPBIS-FR-04-01...

A Study of the MRO Supply Chain for Paper Mills
Final Research Report
Presented to the Center for Paper Business and Industry Studies (CPBIS)
Faculty Yih-Long Chang, College of Management, Georgia Tech Cheryl Gaimon, College of Management, Georgia Tech Soumen Ghosh, College of Management, Georgia Tech Vinod Singhal, College of Management, Georgia Tech
Graduate Students Carrie Crystal, College of Management, Georgia Tech
Patty Swafford, College of Management, U. of Texas - Arlington
September 2004

Page 1
ABSTRACT
The primary objective of our research was to study and understand the key
characteristics of the portion of the supply chain focused on maintenance, repair, and
operating supplies (MRO) for paper mills. More specifically, in the context of the MRO
supply chain for paper mills, our goals were: 1) to develop an understanding of current
practices including the challenges of integrating supply chains across organizations; 2)
to gather information on the primary drivers of supply chain performance 3) to identify
areas providing opportunities to improve the effectiveness and efficiency of the supply
chains; and 4) to identify specific initiatives to improve supply chain performance.
To achieve the above goals, we collected data from field site visits as well as
a comprehensive mail survey. The site visits provided valuable insights that enabled
us to understand current MRO supply chain practices. Moreover, the site visits helped
us to hone in on the appropriate measures of supply chain performance and the
primary drivers of MRO supply chain performance. With much effort, we have
collected a limited number of responses from the survey. It is not as big a sample as
we would hope, however, it gives us a statistical foundation to glean insights from the
survey and field data on several important dimensions.
In general and based on this research, we see promising trends for the
management of the MRO supply chain in the paper and pulp industry. One key
insight we have is that firms are both reducing the number of suppliers and increasing
contract length. It is interesting that, at this time, we do not find strong evidence of
close buyer-supplier relationships. However, we expect that the reduction in suppliers
and lengthening of contracts will, in the near future, lead to closer buyer-supplier
relationships. For example, using IT system linkages, we expect to see better
information exchange between the paper mills and their suppliers regarding inventory

Page 2
and production schedules. As those relationships grow and supplier-buyer trust
increases, it is possible that mills will consider relying more on supplier managed
inventory to reduce the inventory management burden at the mill and to increase the
supplier’s stake at the mill.
Competitive pressure has forced paper mills to reduce costs while maintaining
or improving quality and delivery reliability. Therefore, it is not surprising that
procurement managers overwhelmingly responded that the three most important
criteria for choosing suppliers were cost, quality, and on-time delivery. The fourth
criteria, the suppliers’ ability to offer solutions to a mill’s problems, reflects
management's recognition that changes in current MRO supply chain practices are
needed.
The usage of information technology may provide an opportunity for improved
performance. Paper mills follow a regular maintenance schedule and on average
adhere to the schedule and budget. Moreover, the mill manager relies heavily on IT
to help plan the maintenance process. In contrast, IT is not heavily used in the
management of the procurement process and MRO inventory system. IT usage in
these domains represents a possible opportunity for paper mills to improve efficiency
and effectiveness.

Page 3
1.0 INTRODUCTION
Firms are increasingly recognizing that the effective management of supply
chains is a primary driver of value creation and long-term performance. The
importance of Supply Chain Management (SCM) has emerged as a consequence of
the current business environment of global competition, globalization of supply chains,
short product life cycles, rapid changes in technologies, the need to provide higher
levels of customer service, and the constant pressure to reduce costs and improve
asset utilization. Hendricks and Singhal (2000) underscore the importance of effective
SCM by empirically showing that firms pay a significant price in terms of shareholder
value when supply chains do not work effectively. Their study, which is based 861
announcements of supply chain glitches (i.e., production and shipment delays),
indicates that non average glitch announcements are associated with a reduction in
shareholder value of $120 million, which represents almost a 9% decrease in stock
price. The economic consequences of supply chain glitches are even worse when
stock price performance is examined from a quarter before the formal announcement
of the glitch to a quarter after the formal announcement of the glitch. During this
period, glitches are associated with an average loss in shareholder value of about
20%.
While many firms in the automotive, consumer goods, and electronics
industries have exploited the value creation potential of SCM, firms in the pulp and
paper industry are just beginning to recognize the vast scope of the potential
opportunities that exist. McLean (1999) argues that SCM is a critical business issue in
the pulp and paper industry that offers tremendous potential for improving customer
satisfaction, lowering operating costs, reducing inventory investments, and improving
fixed asset utilization. He indicates that current SCM approaches and initiatives in the
pulp and paper industry have significant gaps in the areas of demand planning,
production planning, scheduling, inventory management, and transportation and

Page 4
distribution planning. However, rather than a comprehensive and systematic analysis
of SCM, firms in the pulp and paper industry have reacted to competitive forces by
pursuing actions that may be detrimental. For example, as a result of the fierce
competitive environment, significant pressure has been placed on suppliers to cut
costs. In response, some suppliers are reducing their investments in research and
development, equipment upgrades, and quality improvement initiatives. Needless to
say, these supplier actions may have a devastating impact on the long-term
performance of the pulp and paper industry.
The supply chain of the pulp and paper industry can be segmented into the
following four sub-chains: 1) fiber procurement which includes all the activities that are
required to deliver wood chips to a pulp and paper mill; 2) pulp and paper
manufacturing; 3) customer fulfillment which spans order taking, production, and
delivering of products to customers; and 4) non-fiber procurement which includes the
activities required to manage maintenance, repair, and operating (MRO) supplies.
While opportunities exist to improve all four components of the supply chain,
our focus in this research was to study the MRO (or non-fiber) supply chain for paper
mills. Typical MRO supplies in the paper and pulp industry include bearings, power
trains, pipe valves, electrical components, lubricants, clothing (felt and wires) and
office supplies. We selected the MRO portion of the supply chain as the focus of our
research since many in the industry have identified this as a critical area for which very
limited research has been accomplished. According to Kapoor and Gupta (1997),
business specific purchases (includes MRO) account for 15% to 20% of a company's
indirect purchases while indirect purchases account for roughly 24% of the company's
total purchases. From discussions with Jim NcNutt (2001), a paper mill spends
approximately $60 to $80 per ton of paper on MRO supplies.
When we examined current MRO practices, we found that, in response to
severe competitive forces, paper mills place substantial pressure on suppliers to

Page 5
reduce costs. Instead, we suggest that paper mills consider partnering with suppliers
to develop processes and products that benefit both the paper mills and the suppliers.
Through working with their supplier for mechanical seals, Boise Cascade's
International Falls mill realized savings over $200,000 (Williamson, 1999). The
Finnish mill, UPM-Kymmene Kuusanniemi invited their supplier, Tamfelt, to help solve
paper machine problems. Through collaborative efforts, a fine bottom fabric and dense
surface top fabric were introduced which enabled the mill to run the machine at its
target speed and to improve the paper quality (Shaw, 2000). Thus, through the
development of strong relationships with key suppliers, substantial improvements may
be realized in the MRO supply chain performance.
We thought it important to examine both the hard and soft factors that drive
supply chain performance. We explored how hard attributes such as existing
production capacity and location, existing process technologies, investments in new
technologies, and the information technology (IT) infrastructure impact SCM. Many
have argued that one of the keys to increasing the effectiveness of supply chains is
better utilization of information regarding supply and demand. We examined how this
information is captured, analyzed, shared, and made visible in a timely manner among
the various participants of the MRO supply chain for the paper mill.
On the soft side, we studied organizational issues such as the integration
across various supply chain partners, collaboration among partners, sharing of
information and plans, existing practices for coordination and control of the supply
chains, incentives issues, performance metrics used, and how those metrics influence
decisions and behaviors. Davis-Blake and Uzzi (1993) show that several factors play
a role in determining the use of temporary (internal) workers and independent
contractors (external), and significantly impact employee relationships. Carrillo and
Gaimon (2001) demonstrate the importance of linking organizational issues to the
behavior of operations managers by showing that organizations pursue different
Page 6
strategies for investment in resource-based core capabilities (which includes the
design and operation of a firm’s supply chain) depending on their organizational
structure and managerial incentives. Economic models of SCM that incorporate
organizational issues have recently appeared in the literature including Fisher and
Raman (1996), Cachon and Fisher (1997), Fisher (1997), Raman (1977), Lee and
Whang (1998), Gavirneri, Kapuscinski and Tayur (1999), and Lee, So, and Tang
(2000). While some anecdotal evidence of the impact of certain organizational
practices on supply chain performance is available, limited objective evidence exists.
Furthermore, little research has been done that rigorously links organizational
practices in the pulp and paper industry to supply chain performance. A key objective
of our research was to develop these linkages and to identify best practices based on
data analysis.
Our research approach included data collected from field site visits and a
comprehensive mail survey. The site visits served to develop a better understanding of
the issues faced by paper mills and their associated MRO suppliers, the supply chain
initiatives that are being pursued, and the impact these initiatives are likely to have on
performance. The information gathered from these site visits was quite useful when
we developed the mail survey, which was designed to give us a more comprehensive
view of drivers of supply chain performance across the paper industry.
The purpose of the mail survey was to gather comprehensive information from
a larger number of paper mills about their supply chain management practices. The
survey data would facilitate a deep understanding of MRO supply chain practices.
Leveraging that understanding, we would perform analysis that would enable us to
recommend initiatives to improve the performance of the supply chain and to develop
a baseline against which the future performance can be compared. The mail survey
would have also allowed us to develop economic models to project the operational and
financial benefits from supply chain management initiatives. Unfortunately, as

Page 7
discussed later, the response rate to our mailed survey was not sufficient to enable us
to perform a rigorous statistical analysis of the above issues. Instead, the limited
response to our mailed survey was used to highlight trends seen in the data.
The next section describes our research strategy and methodology. In
section, 3 we present our results and finally we conclude the paper with a summary in
section 4.

Page 8
2.0 RESEARCH STRATEGY AND METHODLOGY
2.1 OVERVIEW
Our research employed methods, where each method was selected to best
exploit the problem domain under investigation while also enabling the development of
generalizable results and managerial insights. We followed a classic research
approach wherein the researchers 1) gained an in-depth understanding of the
phenomenon to be studied, 2) conducted an empirical and analytical investigation of
the phenomenon, and 3) combined the qualitative understanding with the empirical
and analytical results to advance the field’s knowledge concerning that phenomenon.
Phase 1 of the study involved qualitative data gathering and analysis through
field studies. Based on the field investigations, we developed a better understanding
of the nature of the MRO supply chain relationships for the paper mills. These
relationships provided the necessary foundation to conceptualize a framework which
was the basis for a survey instrument. The survey design reflects the relationships
uncovered in Phase 1 as well as state-of-the-art knowledge of supply chain
management principles. This latter feature is desirable so that we may leverage our
knowledge of best practice supply chain approaches in other process industry
domains. Phase 2 of the study focused on data collection and the development of
prescriptive recommendations to improve performance of the MRO supply chains for
the paper mills.
2.2 PHASE 1: QUALITATIVE INFORMATION GATHERING THROUGH FIELD
STUDIES
Prior to conducting interviews, we gained a basic knowledge of the paper
industry through a review of the existing academic and practitioner literature and
identified and contacted three mills for case studies. We interviewed the purchasing
manager, maintenance manager, buyers and maintenance schedulers at each mill to

Page 9
hear their perspectives on the issues involved in the MRO supply chain. Each
employee was asked for key performance metrics and historical performance metric
data in his area. Additionally, we asked how and how often procurement and
maintenance interacted and coordinated activities, how the department forecasted
demand for maintenance activities and parts, and key recent or future MRO
improvement initiatives. Finally, we asked about other critical issues or challenges
that hadn’t been discussed yet. Through these open-ended questions we formed a
general picture of industry progress to date, terminology, and critical areas for
improvement for the three case study mills. Key characteristics of the mills we visited
can be found in Table 1.
Table 1 - Characteristics of Mills Visited
Characteristic Mill 1 Mill 2 Mill 3 Age of mill Original part built
in 1954 Machine 1 built in 1962
Built in 1995
Number of paper machines
2 3 1
Number of employees
~800 <50, outsourced maintenance
Annual amount of paper (tons) produced
~472,000 per year 1450 tons/day of kraft paper, 900 tons/day of TMP, and 760 tons/ day of market pulp
275K tons/year
Amount of capital investment
$66 Million in 2002
Type of paper produced
Kraft brown paper Coated and uncoated paper, kraft paper
Linerboard
Source of paper fiber (wood chips or recycled paper)
Wood chips Wood chips Recycled paper
Union or non-union maintenance employees
Union Non-union
Based on our interviews and literature search, we created four separate
categories to investigate within each paper mill: corporate MRO strategy/practices,
mill infrastructure, MRO supply chain performance, and mill MRO practices. Each of
Page 10
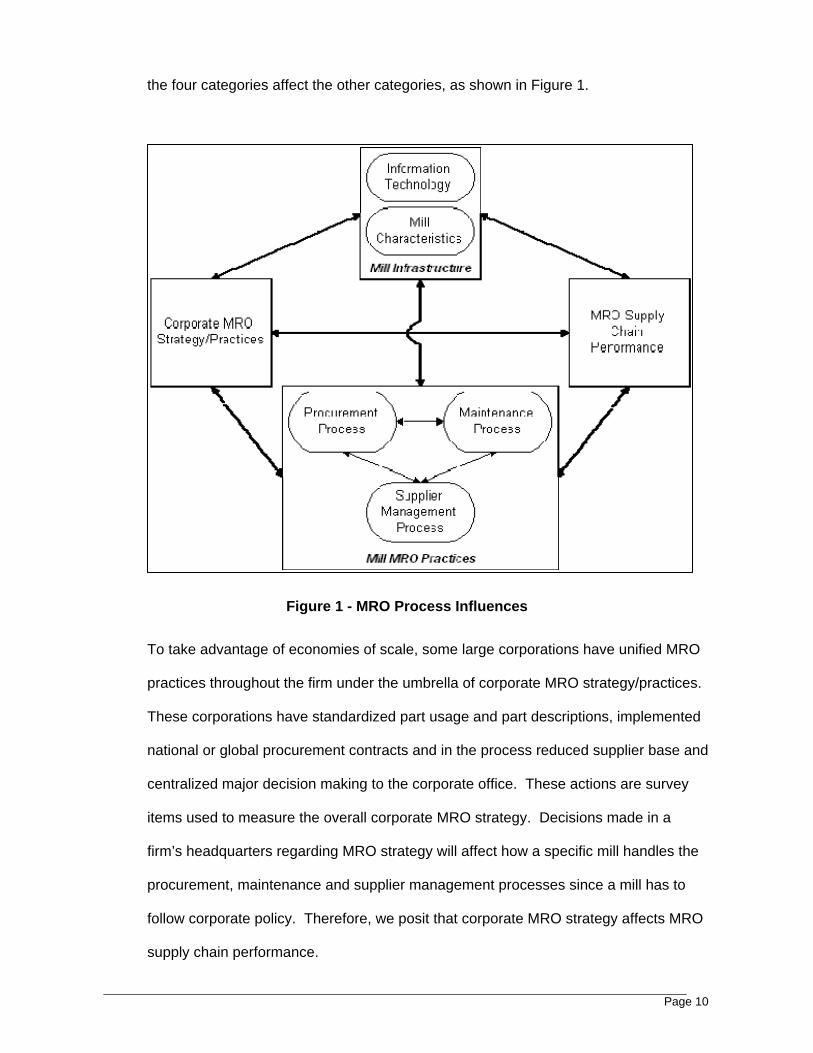
the four categories affect the other categories, as shown in Figure 1.
Figure 1 - MRO Process Influences
To take advantage of economies of scale, some large corporations have unified MRO
practices throughout the firm under the umbrella of corporate MRO strategy/practices.
These corporations have standardized part usage and part descriptions, implemented
national or global procurement contracts and in the process reduced supplier base and
centralized major decision making to the corporate office. These actions are survey
items used to measure the overall corporate MRO strategy. Decisions made in a
firm’s headquarters regarding MRO strategy will affect how a specific mill handles the
procurement, maintenance and supplier management processes since a mill has to
follow corporate policy. Therefore, we posit that corporate MRO strategy affects MRO
supply chain performance.

Page 11
Each mill runs a procurement, maintenance, and supplier management
process, which together make up mill MRO practices. These practices define how a
specific mill obtains and stores MRO items and manages the maintenance function.
The collection of mill practices within a firm will influence the corporate office’s MRO
strategy since corporate will want to make decisions that help the mills and the
company as a whole. A mill obtains MRO items through a procurement process,
characterized by how MRO items are categorized, the extent of forecasting used to
predict MRO requirements, the use of reorder points to maintain optimal inventory
levels, and the overall value of inventory kept at the mill. These specific tasks are
measured within the survey in order to give an overall picture of the procurement
process.
Closely related to procurement is the supplier management process,
characterized by the extent of communication process with suppliers, identification of
preferred suppliers, a process to reduce supplier base, and ability to evaluate and
track supplier performance. The maintenance process is characterized by the extent
of planned and emergency maintenance, production and procurement input, and parts
standardization and criticality sorting. All of these specific attributes of procurement,
maintenance and supplier management practices combined yield a mill’s MRO supply
chain practices, a key influencer of supply chain performance.
Each mill has a specific infrastructure which influences strategy, specific MRO
practices and supply chain performance. This infrastructure includes mill
characteristics and information technology (IT). Included in mill characteristics are:
overall production capacity, age and condition of equipment, whether or not a mill has
union employees, and number of employees. The general category of information
technology includes hardware, software, and the ability to use both to analyze data to
make better decisions. Infrastructure influences strategy, practices and performance
because decisions are partly based on the basic characteristics of a mill. For

Page 12
example, a very small mill will have a different inventory system than a large mill, just
as a mill with sophisticated information technology will manage a supply chain
differently than a mill with minimal automated inventory tracking and ordering.
Finally, we look at MRO supply chain performance. We measure this through
MRO and maintenance budgets, unscheduled maintenance and downtime, and MRO
inventory value and turns. All of the decisions a firm makes with regard to MRO items
will affect supply chain performance in some manner.
Each task in phase 1 built MRO knowledge within the paper industry. As a
result of these mill visits, we came to understand the different roles played within the
maintenance and purchasing groups. Because of the different roles and knowledge
base within each group, it became clear that we needed to design two separate but
complementary surveys to gather relevant information: one for the maintenance
manager and one for the procurement (purchasing) manager.

Page 13
2.3 PHASE 2: QUANTITATIVE DATA COLLECTION AND ANALYSIS
The goals of this phase were to complete survey development, collect and
analyze survey data, and develop recommendations and insights based on the survey
analysis. To achieve this, we developed two standardized and psychometrically sound
research survey instruments: one instrument is to be completed by the maintenance
manager and the other by the procurement manager (see Appendix B for actual
surveys). The research instruments reflect the in-depth understanding developed in
Phase 1 of MRO supply chains based on site visits. Data was collected via a survey
of pulp and paper mills in the US and Canada. The unit of analysis was a single pulp
or paper mill.
With the help of the Center for Paper Business and Industry Studies (CPBIS)
and the contacts developed in Phase 1 of the research study, an appropriate large-
scale sample of papers mills and MRO suppliers were identified for administering the
survey instruments. We collected data in two phases. The first phase started in
August 2003 when we sent out the survey instruments, along with letters of support
for this research from Paper Management Industry Association (PIMA) and CPBIS, to
over 500 mills listed in the Lockwood database. Each mill received two surveys in
each envelope (one survey for procurement, one for maintenance), so we sent out a
total of over 1000 surveys. As an incentive for filling out the surveys, we offered a
free copy of the completed report. After sending out reminder cards two weeks later,
we received 12 surveys back from 10 unique mills – a 1.2% response rate.
We started a second data collection effort in January 2004, with the goal of
improving the response rate. We combined the Lockwood database with two other
databases from CPBIS for an updated mailing list with contacts at 709 separate mills.
Instead of mailing out all of the surveys at once, we called each contact, informed
him/ her of the nature of the survey and asked him/ her to fill out or help find the
appropriate person to fill out the surveys. We made a maximum of two attempts to

Page 14
reach each potential recipient. On the second attempt, we left a voicemail message
about our research effort and mailed the surveys. Since some contacts requested we
not send them a survey, a total of 616 envelopes were mailed to mills, with two
surveys in each envelope for a total of 1232 surveys. From this effort, we received
27 completed surveys. Nine mills completed both the procurement and maintenance
surveys, which accounts for 18 of the 27 surveys. Additionally, 5 more mills
completed the procurement survey and another four mills returned the maintenance
survey. All told in the second mailing, 18 unique mills returned a total of 27 surveys
for a response rate of 2%.
During the two data collection efforts, we mailed 2232 surveys. We received
back 39 surveys from 28 unique mills for a 2% response rate.

Page 15
3.0 RESULTS
Our respondents come from a wide range of mill sizes and ages. Although we
received responses from 28 different mills, some of those mills did not provide
complete information. Hence, some of the data item averages are based on less
than 28 responses. The average respondent worked at a mill with 430 employees
that produced 377,000 tons of pulp and paper. The average machine age was 36
years. The average mill had nearly 22,000 MRO items on their books worth $6.5
million. We summarize these and other descriptive statistics in Table 2.
Table 2 Descriptive statistics for survey respondents1
N * Mean Median Standard Deviation
Range
Annual Production (tons)
14 377,000 219,000 364,000 49,400 – 1,200,000
# of Employees at mill
28 430 400 368 53-1750
Capacity (tons) 18 365,000 175,000 394,000 12,000 – 1,200,000
Average machine age (years)
17 36 35 17.7 9-84
Capital Investment (2002)
16 $8,476,000 $5,200,000 8,676,000 $100,000 - $30,000,000
Operating Cost ($/ton)
12 $362 $285 206 $113 - 790
# of MRO items in inventory
17 18,860 15,000 19,880 500 – 80,000
MRO inventory value
19 $5,763,000 $4,200,000 4,872,000 $ 7 – 20,000,000
% of obsolete items in MRO inventory
19 6.3% 4 5.5 0 – 20 %
* N= Number of respondents
The results in this report focus on nine factors that we predicted would impact
MRO supply chain performance. These nine factors are:
- Corporate Practice
- Supplier Management
1 Mean= average. Median= middle number, after ordering answers from highest to lowest. Standard deviation= a measure of the dispersion around the mean for all data collected. Range = lowest and highest answers.

Page 16
- Criteria for MRO Suppliers
- Maintenance Activities
- MRO Inventory
- IT for Maintenance
- IT for Procurement
- IT for MRO Management
- Maintenance Performance
Each of the nine factors assesses a different lever that impacts the MRO supply chain
performance. For example, the "Maintenance Activities" targeted general
maintenance practices that increase preventive maintenance and maintenance
effectiveness and impact maintenance costs. For each factor, we developed 6-12
specific questions which, taken together, measure the factor.
We will present each factor and the questions used to measure them, then the
responses to the questions. We will present average results for each question within
a factor, and then average these across questions to get the overall factor scores (as
shown in the tables that follow). To give some idea about the variability in factor
scores, we also present the factor score for each of the responding mills (as shown in
the graphs that follow). Respondents answered questions based on the extent to
which they engaged in each activity, on a 1 (None) to 5 (Very High) scale.
Since many mills answered only one survey, there are some significant gaps
in the graphs. Firms numbered 1-12 answered both surveys, so for most of the graphs
there are responses for firms 1-12. Firms numbered 13-20 answered the maintenance
survey only and left blank all questions that appeared in the procurement survey.
These unanswered questions (which appear as gaps in the graphs) include everything
in Corporate Practices, Supplier Management, Criteria for Suppliers, and IT for
Procurement. Similarly, firms numbered 21–29 answered the procurement survey
only and did not respond to questions in the maintenance survey. These firms will
have gaps in the graphs pertaining to Maintenance Activities, IT for Maintenance, and

Page 17
Maintenance Performance.
Many corporate headquarters have decided to ensure corporate initiatives
have a strong influence on mill practice. Therefore, we thought it valuable to examine
Corporate Practices – the extent to which mills use the following corporate control
procurement practices:
• Reduce number of MRO items
• Categorize MRO items into commodity groups
• Pursue commonality/standardization of MRO items across mills
• Use long-term corporate wide supplier contracts
• Create production schedules for all mills
• Use a centralized distribution center for MRO items
Table 3 - Corporate Practices scores by question N* Mean Median SD
Corporate PracticesReduce # of MRO suppliers 20 3.35 4.00 0.88Categorize MRO into commodity groups 20 3.20 3.50 1.24Standardize MRO across mills 20 3.00 3.00 1.26Use long-term contracts corporate wide supplier contracts 20 3.50 4.00 1.15Create production schedules for all mills 19 2.21 2.00 1.23Use centralized distribuition center for MRO items 20 1.85 1.50 1.14Average Corporate Practices Score 20 2.87 3.00 0.80 * N = number of respondents, SD = standard deviation
The respondents’ average overall score for corporate practices (2.87, see
Table 3) suggests that corporate headquarters is not closely engaged in the MRO
supply chain process of its mills. However, it is important to note that two trends exist
regarding the management of MRO supply chains. First, the results in Table 3
suggest that corporate headquarters has actively reduced the number of suppliers
(average score of 3.35 out of 5) that service its mills. Second, corporate headquarters
has adopted long-term contracts for corporate wide suppliers. Reducing the number

Page 18
of suppliers and increasing the length of supplier contracts is a key precursor for a
firm interested in building strong partnerships with its suppliers. Through those
partnerships, the MRO manager hopes to improve performance through improved
communication problem solving. However, not many firms are pushing towards
corporate headquarters controlling more mill practices, such as remote production
scheduling (2.21) and use of a centralized distribution center (1.85). Figure 2
illustrates a company by company look at corporate practices. We see that there is a
wide range of corporate control, from very little (company # 11) to strong corporate
influence (company #8).
Corporate Practices
0.00
1.00
2.00
3.00
4.00
5.00
0 5 10 15 20 25 30
Company Number
Ave
rage
Sco
re
Figure 2 - Corporate Practice scores by company
Mills develop supplier relationships over time through incentives and threats,
collaboration and communication. We examine these relationships through the
Supplier Management factor - an assessment of how each mill manages MRO
suppliers using the following practices

Page 19
• Use on-site MRO supplier representatives
• Use long term MRO supplier contracts
• Use single sourced contracts for MRO items
• Use preferred MRO supplier lists
• Employ supplier selection criteria
• Track and provide supplier performance feedback
• Share MRO material forecasts with suppliers
• Conduct periodic visits to MRO supplier sites
• Conduct periodic meetings with MRO suppliers at mill
• Collaborate within the firm to consolidate MRO purchase volume
• Participate in corporate MRO related decision
• Provide training for procurement/ inventory management mill personnel
Table 4 - Supplier Management scores by question N* Mean Median SD
Supplier ManagementUse on-site supplier representatives 19 3.05 3.00 1.22Use long-term MRO supplier contracts 19 3.11 3.00 1.15Use single source contracts for MRO items 19 2.95 3.00 1.27Use preferred MRO supplier lists 19 3.74 4.00 0.87Employ supplier selection criteria 19 3.32 3.00 1.06Track and provide supplier performance feedback 19 2.89 3.00 0.99
Share MRO material forecasts with suppliers 19 2.84 3.00 1.17
Conduct periodic visits to MRO supplier sites 19 2.26 2.00 0.87Conduct periodic meetings with MRO suppliers at mill 19 2.95 3.00 0.91Collaborate with other mills within firm to consolidate MRO puchase volume 19 2.63 3.00 1.16Participate in corporate MRO-related decisions 19 3.32 3.00 1.11Provide training for procurement mill personnel 19 2.84 3.00 1.01Average Supplier Management Score 19 2.99 2.83 0.74
* N = number of respondents, SD = standard deviation

Page 20
Supplier Management
0.00
1.00
2.00
3.00
4.00
5.00
0 5 10 15 20 25 30Company Number
Ave
rage
Sco
re
Figure 3 - Supplier Management scores by company
From Table 4, we observe that the management by the mill of its suppliers is
(in our rating scale) average (2.99). Specifically, mills share information with their
suppliers only to a limited extent. The score of 2.84 for “share forecasts with
suppliers”, 2.95 for “conduct periodic meetings with suppliers at mill” and of 2.84 for
“sharing MRO material forecasts” demonstrate the relatively limited communication
between the mill manager and suppliers. This lack of information sharing could be
due to the recent establishment of long-term relationships through long-term
contracts. As firms gain trust in their suppliers through successful partnerships,
greater information sharing could lead to substantial benefits. As a mill manager
entrusts more business to fewer suppliers (as seen in Corporate Practices), s/he will
be better able to track supplier performance. During the contract interval, the
information gleaned from the tracking should be shared with the supplier with the
expectation of improving performance. In the long-term, information from tracking
would be valuable when the mill decides whether or not to renew a contract. Our

Page 21
firms do not track and provide feedback to suppliers consistently (2.89). On some
dimensions, however, positive indications exist indicating recognition of the value of a
strong relationship between the MRO supply chain manager and his/her suppliers.
Specifically, managers are relying on-site supplier representatives in their mills (3.05)
and mills are using preferred MRO supplier lists (3.74).
We look at how each capability of a supplier factors into buy/don’t buy
decision in Criteria for MRO Suppliers. We asked the procurement manager at each
mill to tell us the importance of each of the following criteria when selecting suppliers
from 1 (none) to 5 (very high).
• Cost of MRO items
• Quality of MRO items
• Supplier on-time delivery performance of MRO items
• Supplier’s ability to change order quantities
• Supplier’s ability to change delivery lead-time
• Accessibility of MRO supplier for problem resolution
• Importance of mill purchases to MRO supplier’s total sales base
• Ability of MRO supplier to provide an on-site representative
• Ability of MRO supplier to offer solutions to mill problems
Table 5 – Criteria for Suppliers scores by question N* Mean Median SD
Criteria for SuppliersCost 20 4.15 4.00 0.59Quality 20 4.30 4.00 0.66On-time delivery 20 4.15 4.00 0.67Change order quantity ability 19 3.05 3.00 0.91Change order leadtime ability 19 3.42 3.00 1.02Supplier problem resolution 20 3.90 4.00 0.85Importance of mill purchases to MRO supplier's total sales base 20 2.85 3.00 0.99Ability of supplier to provide an on-site rep 20 3.40 4.00 1.05Ability of supplier to offer solutions to problems 20 3.95 4.00 0.69Average Criteria for Suppliers Score 20 3.70 3.67 0.40
* N = number of respondents, SD = standard deviation
Page 22
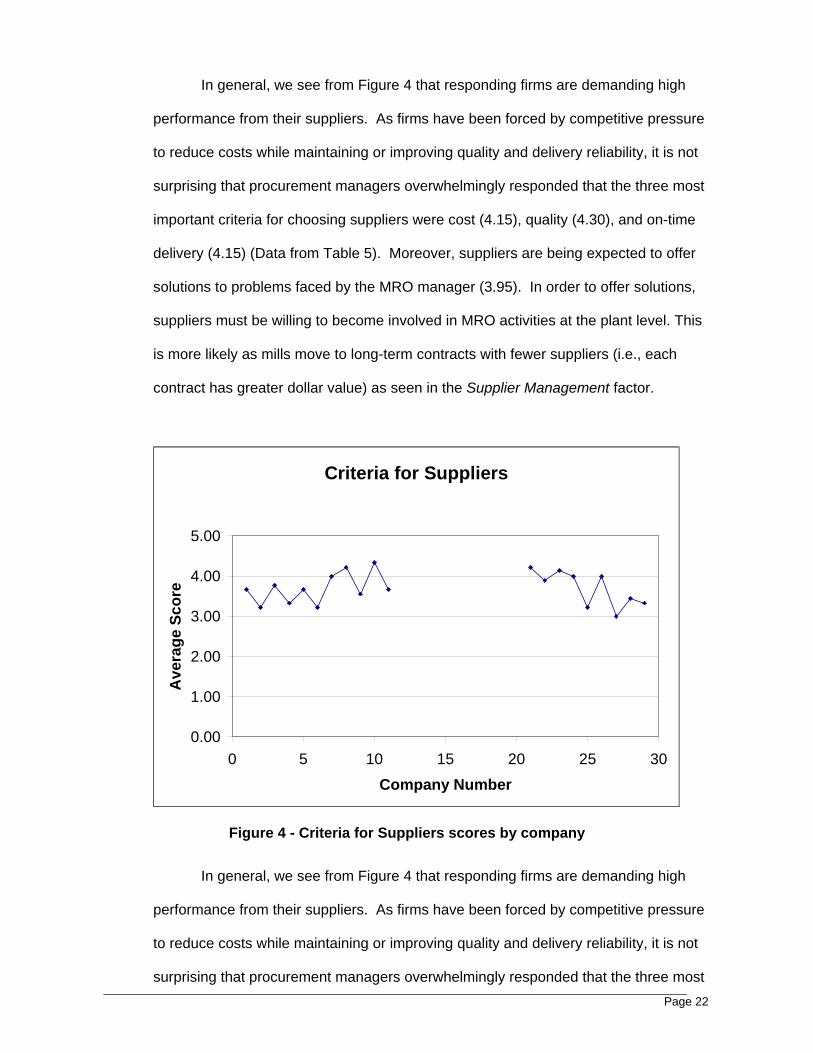
In general, we see from Figure 4 that responding firms are demanding high
performance from their suppliers. As firms have been forced by competitive pressure
to reduce costs while maintaining or improving quality and delivery reliability, it is not
surprising that procurement managers overwhelmingly responded that the three most
important criteria for choosing suppliers were cost (4.15), quality (4.30), and on-time
delivery (4.15) (Data from Table 5). Moreover, suppliers are being expected to offer
solutions to problems faced by the MRO manager (3.95). In order to offer solutions,
suppliers must be willing to become involved in MRO activities at the plant level. This
is more likely as mills move to long-term contracts with fewer suppliers (i.e., each
contract has greater dollar value) as seen in the Supplier Management factor.
Criteria for Suppliers
0.00
1.00
2.00
3.00
4.00
5.00
0 5 10 15 20 25 30Company Number
Ave
rage
Sco
re
Figure 4 - Criteria for Suppliers scores by company
In general, we see from Figure 4 that responding firms are demanding high
performance from their suppliers. As firms have been forced by competitive pressure
to reduce costs while maintaining or improving quality and delivery reliability, it is not
surprising that procurement managers overwhelmingly responded that the three most

Page 23
important criteria for choosing suppliers were cost (4.15), quality (4.30), and on-time
delivery (4.15) (Data from Table 5). Moreover, suppliers are being expected to offer
solutions to problems faced by the MRO manager (3.95). In order to offer solutions,
suppliers must be willing to become involved in MRO activities at the plant level. This
is more likely as mills move to long-term contracts with fewer suppliers (i.e., each
contract has greater dollar value) as seen in the Supplier Management factor.
The important factor, Maintenance Activities, assesses the extent to which a
mill manages the maintenance of its equipment. General activities such as
preventative maintenance and daily walk-throughs can help to prevent breakdowns
from ever taking place. As a result, both the mill realizes less in repair cost (parts and
labor) and mill downtime due to broken equipment. We asked maintenance
managers to rate the extent to which their mill undertook each of the following
practices from 1 (None) to 5 (Very High):
• Use maintenance work orders to drive planned maintenance schedule
• Schedule planned downtime
• Follow equipment manufacturer’s suggested preventative maintenance
schedule for planning MRO activities
• Use vibration analysis to identify needed maintenance of equipment
• Perform daily walk-through inspection of mill
• Collaborate with procurement personnel on MRO material requirements
• Collaborate with production personnel on maintenance/repair activities
• Provide training for maintenance personnel
• Participate in corporate MRO-related decisions
• Collaborate with MRO supplier on maintenance activities
• Use monitoring systems to improve process performance
• Use outsourced services for maintenance activities

Page 24
• Participate in hiring process of employees at supplier for outsourced
maintenance services
• Participate in performance evaluation of employees at supplier for
outsourced maintenance services
• Participate in training of employees at supplier for outsourced maintenance
services

Page 25
Table 6 – Maintenance Activities scores by question
N* Mean Median SDMaintenance Activities
Use work orders to drive planned maintenance schedule 19 4.00 4 0.75Schedule planned downtime 19 4.47 4 0.51Follow equipment manufacturer's suggested preventative maintenance schedule for planning MRO activities 19 3.32 3 0.82Use vibration analysis to id needed maintenance 19 4.21 4 0.79Daily walk thru inspection of mill 19 4.00 4 0.75Work with procurement on MRO material requirements 19 3.58 4 0.61Work with production on maintenance/repair activities 19 4.11 4 0.81Provide training for maintenance personnel 19 3.32 3 0.67Participate in corporate MRO decisions 19 2.95 3 1.03Work with MRO suppliers on maintenance activities 19 3.16 3 0.69Use monitoring systems to improve process performance 19 3.37 3 0.90Use outsourced services for maintenance activities 19 2.74 3 0.81
Participate in hiring process of employees at supplier for outsourced maintenance services 19 1.74 1 1.15Participate in performance evaluation of employees at supplier for outsourced maintenance services 19 1.84 1 1.12
Participate in training of employees at supplier for outsourced maintenance services 19 1.63 1 1.01Average Maintenance Activities Score 19 3.23 3.27 0.43
* N = number of respondents, SD = standard deviation
Table 6 indicates respondents believe their mills have strong maintenance
programs, with an overall score of 3.23. Mills proactively plan for maintenance by
both using work orders to drive planned maintenance schedules (4.00) and
scheduling planned downtime (4.47) to work on equipment. This scheduled
maintenance could be a result of regularly running diagnostics to identify needed
maintenance with activities such as vibration analysis (4.21) and walk-through
inspections of mill (4.00), which the mills are doing with regularity as evidenced by the
high scores. The maintenance groups seem to be working well with production

Page 26
Maintenance Activities
0.00
1.00
2.00
3.00
4.00
5.00
0 5 10 15 20 25 30Company Number
Ave
rage
Sco
re
personnel (4.11) to schedule these activities, but may want to increase
communication with procurement (3.58) to ensure the right items are ordered at the
right times for maintenance activities. Finally, some mills use outsourced services for
maintenance activities (2.74). Surprising, very few of the mills that outsource
maintenance participate in the hiring (1.74), evaluating (1.84), or training (1.63) of the
maintenance personnel who actually working in their mills. We believe that
maintenance managers would find it beneficial to play a more active role in the hiring
and development of these maintenance employees who play an integral role in the
maintenance process.
Figure 5 - Maintenance Activities scores by company The maintenance and procurement departments both have a stake in
effectively managing MRO inventory. Hence, we assess the extent to which practices
for managing MRO inventory are used on a scale from 1(not at all) to 5 (very high):
• Plan MRO material requirements using planned maintenance work orders
• Plan MRO material requirements using supplier leadtimes

Page 27
• Categorize and manage MRO items according to criticality
• Categorize and manage MRO items according to ABC classification
• Maintain MRO items as stocked inventory items
• Manage MRO items using a formal inventory control system
• Purchase MRO items on a Just In Time basis
• Use supplier managed inventory
Table 7 – MRO Inventory scores by question N* Mean Median SD
MRO InventoryPlan MRO material requirements using planned maintenance work orders 26 3.35 3.50 1.13Plan MRO material requirements using supplier leadtimes 26 3.12 3.00 1.03Categorize and manage MRO items according to criticality 26 3.62 4.00 0.80Categorize and manage MRO items according to ABC classification 26 2.12 2.00 1.14Maintain MRO items as stocked inventory items 26 3.54 4.00 0.76Manage MRO items using a formal inventory control system 26 3.65 4.00 1.06Purchase MRO on JIT basis 26 3.12 3.00 0.77Use supplier managed inventory 26 2.65 3.00 0.89Average MRO Inventory Score 26 3.14 2.94 0.58 * N = number of respondents, SD = standard deviation
While responding mills rated their MRO inventory practices at 3.14 (Table 7),
formal inventory control of MRO items is a high priority (3.65) indicating that mills
know their inventory. However, the underlying processes used to sort and control this
inventory could be improved. ABC sorting breaks items into three categories: A, B,
and C. Items fitting into the A category are used on a daily or weekly basis, B items
are used less frequently (possibly on a monthly basis or less) and C items may be
used once a year or less. In contrast, criticality sorting means that a mill ranks an
item as critical (1) or not (0). From our survey we observe that mills tend to use the
criticality sorting more often (average score of 3.62) than ABC sorting (average score

Page 28
of 2.12). However, the ABC classification allows more range in sorting for the
management of inventory items and may be a tactic for MRO managers to consider.
MRO Inventory
0
1
2
3
4
5
0 5 10 15 20 25 30
Company Number
Ave
rage
Sco
re
Figure 6 - MRO Inventory scores by company The 3.35 rating for “plan MRO material requirements using planned
maintenance work orders” represents an area of potential improvement. Earlier, in
the Maintenance Activities factor, we observed that the communication between
maintenance and procurement could be strengthened. This additional result on the
link between MRO material requirements and planned maintenance is another
indication of a lack of communication. As discussed earlier, most of the maintenance
work is planned through work orders. It would be straightforward to use those same
work orders to communicate maintenance item needs. Lastly, mills use supplier
managed inventory slightly less than average (2.65). Using a trusted supplier to
manage inventory can reduce the burden on the mill and increase opportunities for

Page 29
suppliers to provide solutions. Mills may want to consider trying supplier managed
inventory.
Information Technology can enable greater supplier-buyer communication,
immediate notification of changes in production, paperless purchase orders, etc. We
asked procurement managers the extent to which they undertook each of the
following actions in our assessment of IT for Procurement:
• Share MRO material requirement plans with suppliers
• Share inventory status with MRO suppliers
• Send purchase orders to MRO suppliers
• Verification of MRO material transactions with supplier
• Access MRO supplier’s material planning system
• Monitor MRO supplier performance
• Track MRO supplier delivery status
• Provide performance feedback to MRO suppliers
Table 8 – IT for Procurement scores by question N* Mean Median SD
IT for ProcurementShare MRO material requirements with suppliers 19 2.37 2.00 1.12Share inventory status with MRO suppliers 19 2.74 3.00 1.10Send purchase orders to MRO suppliers 19 3.53 4.00 1.26Verification of MRO material transactions with suppliers 19 3.11 3.00 1.20Access MRO supplier's material planning system 19 2.00 2.00 1.05Monitor MRO supplier performance 19 2.74 3.00 1.24Track delivery status 19 2.95 3.00 1.22Provide performance feedback to MRO suppliers 19 3.05 3.00 1.18Average IT for Procurement Score 19 2.81 3.00 0.97 * N = number of respondents, SD = standard deviation

Page 30
IT for Procurement
0
1
2
3
4
5
0 5 10 15 20 25 30
Company Number
Ave
rage
Sco
re
Figure 7 - IT for Procurement scores by company
While procurement groups use some IT for procurement, there remains have
significant opportunity for improvement, as shown by the average score of 2.81 in
Table 8. Mills have made the first step with supplier communications through
information technology by sending purchase orders electronically to MRO suppliers
(3.53). However, mills are behind in terms of using the more advanced forms of
electronic communication such as accessing suppliers’ material planning systems
(2.00), tracking delivery status (2.95), and sharing material requirements with
suppliers (2.37). While most respondents felt their mills were about average with
respect to their usage of IT, there was one clear IT leader (firm # 21) and one clear
laggard (firm #24) as evidenced in Figure 7.
In addition to enabling communication, information technology can simplify
routine tasks and help to ensure that tasks are completed on schedule. We asked

Page 31
maintenance managers the extent to which they undertook each of the following
actions in our assessment of IT for Maintenance:
• Plan maintenance activities
• Generate maintenance work orders
• Schedule maintenance activities
• Track maintenance activities
• Monitor maintenance performance
• Increase maintenance effectiveness during planned line shutdown
• Identify opportunities to improve performance by changing MRO practices
Table 9 – IT for Maintenance scores by question N* Mean Median SD
IT for MaintenancePlan maintenance activities 19 3.84 4 0.83Generate maintenance work orders 19 3.63 4 1.01Schedule maintenance 19 3.68 4 1.06Track maintenance 19 3.42 3 1.02Monitor maintenance performance 19 3.21 3 0.92Increase maintenance effectiveness during planned shutdowns 19 3.37 3 0.96ID opportunities to improve performance by changing MRO practices 19 2.79 3 0.85Average IT for Maintenance Score 19 3.42 3.29 0.76
*N = number of respondents, SD = standard deviation
Responding mills use IT in maintenance regularly. Specifically, participants
use IT to: plan maintenance activities (3.85), schedule activities (3.65), track activities
(3.35), and generate work orders (3.65), as seen in Table 9. Mills scored consistently
higher using IT for maintenance than they did in using IT for procurement (see the
average score in Table 9 of 3.42 versus the average score in Table 8 of 2.81). This
observation could be due to the fact that maintenance is a function within the mill
itself so that the maintenance IT system is fully controllable within the mill. In
contrast, to use IT for procurement, the mill IT system must communicate with
suppliers whose IT resides outside the mill domain.

Page 32
IT for Maintenance
0.00
1.00
2.00
3.00
4.00
5.00
0 5 10 15 20 25 30Company Number
Ave
rage
Sco
re
Figure 8 - IT for Maintenance scores by company Information Technology can simplify tasks within the MRO inventory arena
through tracking inventory and managing purchases. We asked both maintenance
and procurement managers the extent to which they undertook each of the following
actions in our assessment of IT for MRO Management:
• Forecast MRO inventory
• Manage purchase requisitions process
• Manage MRO inventory
• Track MRO inventory status
• Access MRO inventory data at other mills in your organization
• Coordinate corporate-wide inventory management

Page 33
Table 10 – IT for MRO Management scores by question N* Mean Median SD
IT for MRO ManagementForecast MRO inventory 26 2.50 2.50 0.95Manage purchase requisitions process 26 3.69 4.00 0.84Manage MRO inventory 26 3.27 3.00 1.12Track MRO inventory status 26 3.19 3.00 1.30Access MRO inventory data at other mills within firm 26 2.23 2.00 1.21Coordinate corporate wide inventory management 26 2.04 2.00 1.18Average IT for MRO Management Score 26 2.82 2.58 0.90
* N = number of respondents, SD = standard deviation
IT for MRO Management
0.00
1.00
2.00
3.00
4.00
5.00
0 5 10 15 20 25 30
Company Number
Ave
rage
Sco
re
Figure 9 - IT for MRO Management scores by company Firms showed a wide range of IT use in managing MRO items. As seen in
Figure 9, firm #21 leads the respondents in IT use for MRO management. These
mills use IT less for MRO management than for maintenance (2.82 versus 3.42, from
Tables 10 and 9). Specifically, firms use IT very little for forecasting MRO inventory
(2.48), accessing inventory data at other mills within a firm (2.22) or coordinating
corporate wide inventory (2.00). Therefore, firms are missing the advantages offered

Page 34
by IT systems that are built to support improved decision-making such as forecasting
and sharing items across mills. Mills may want to consider ways to leverage the
wealth of data contained within their IT systems.
Lastly, we examined Maintenance Performance as measured by the following
items, all measuring the mills’ maintenance groups’ performance, on a scale from 1
(None) to 5 (Very High):
• Adherence to planned preventative maintenance schedule
• Adherence to planned preventative maintenance budget
• Extent of unplanned repair maintenance
• Actual to budget spent for maintenance
• Extent of production downtime due to maintenance problems
• % of time that a paper line shut down due to MRO stockouts (This question
was a write-in question where respondents wrote in the percentage of time
that a paper line shut down due to MRO stockouts.
Table 11 – Maintenance Performance scores by question N* Mean Median SD
Maintenance PerformanceAdherence to planned preventative maintenance schedule 19 3.58 4.00 0.61Adherence to planned preventative maintenance budget 19 3.26 3.00 1.10Extent of unplanned repair maintenance 19 2.74 3.00 0.93Actual to budget spent for maintenance 19 3.58 4.00 0.77Extent of production downtime due to maintenance problems. 18 2.61 3.00 0.78% time line shutdown - MRO stockouts 22 0.50 0.00 1.25Average Maintenance Performance Score 19 3.17 3.00 0.39 * N = number of respondents, SD = standard deviation

Page 35
Maintenance Performance
0.00
1.00
2.00
3.00
4.00
5.00
0 5 10 15 20 25 30Company Number
Ave
rage
Sco
re
Figure 10 - Maintenance Performance scores by company
Mills’ maintenance performance results clumped mostly in the 3-4 range as
shown in Figure 10, indicating that the responding firms perform similarly to their
competitors. From Table 11, respondents rank themselves at 3.58 for actual to
budget spent for maintenance, 3.58 for adhering to the planned maintenance
schedule and3.26 for adhering to planned maintenance budget. The firms reported
that, on average, 0.5% of mill line shutdowns were due to MRO stockouts. The
median measure for this same item is 0. From this we may conclude that, for over
half of the responding mills, there were no line shut downs due to a MRO stockout
in 2002. In conclusion, while there is always room for improvement in stocking and
managing inventory, for the most part, the mills surveyed have the essential
maintenance parts when they need them.

Page 36
4.0 SUMMARY
We see promising trends for the MRO supply chain in the paper and pulp
industry. Table 12 lists the average responding mills’ scores for each of the nine
factors we measured. This table is a compilation of scores from Tables 3-11.
Judging from these scores, we can say that responding mills’ top strengths are:
criteria for MRO suppliers, IT for Maintenance, and maintenance activities, as
measured by our surveys.
Table 12 - Average Scores for nine factors N* Mean Median SD
Average Corporate Practices Score 20 2.87 3.00 0.80Average Supplier Management Score 19 2.99 2.83 0.74Average Criteria for MRO Suppliers Score 20 3.70 3.67 0.40Average Maintenance Activities Score 19 3.23 3.27 0.43Average MRO Inventory Score 26 3.14 2.94 0.58Average IT for Maintenance Score 19 3.42 3.29 0.76Average IT for Procurement Score 19 2.81 3.00 0.97Average IT for MRO Management Score 26 2.82 2.58 0.90Average Maintenance Performance Score 19 3.17 3.00 0.39
* N = number of respondents, SD = standard deviation
Outside of these 3 factors, there are many positive results within other
factors. Within the Corporate Practices factor, we saw that firms are beginning to
reduce the number of suppliers and increase contract length. This should eventually
lead to closer buyer-supplier relationships, including better information sharing of
inventory needs and production schedules through IT system linkups. As those
relationships grow and supplier-buyer trust increases, mills may consider using more
supplier managed inventory in order to reduce inventory management burden at the
mill and to increase a supplier’s stake at the mill.
As competitive pressures have forced firms to reduce costs while maintaining
or improving quality and delivery reliability, it is not surprising that procurement
managers overwhelmingly responded that the three most important criteria for
choosing suppliers were cost, quality, and on-time delivery, closely followed by

Page 37
suppliers’ ability to offer solutions to a mill’s problems. Mills follow a regular
maintenance schedule and on average stick to their schedule and budget. They rely
heavily on IT to help the maintenance process, but could probably improve
performance by using IT more to facilitate the procurement process and MRO
inventory system.

Page 38
4.0 REFERENCES
Bensaou, M. 1999. “Portfolios of Buyer-Supplier Relationships”, Sloan Management
Review, Summer.
Cachon, G., M. Fischer. 2000. “Supply chain inventory management and the value of
shared information”. Management Science, Vol. 46 No. 8.
Carrillo, Janice, Cheryl Gaimon. 2000. "Improving Manufacturing Performance
Through Process Change and Knowledge Creation," Management Science, Volume
46, No. 2.
Carrillo, Janice, Cheryl Gaimon, “Managing Knowledge-Based Core Capabilities Under
Uncertainty,” Working Paper, March 2001.
Davis-Blake, Alison, Brian Uzzi. 1993. “Determinants of Employment Externalization:
A Study of Temporary Workers and Independent Contractors”, Administrative
Science Quarterly, 38, 195-223.
Fischer, M., A, Raman. 1996. “Reducing the cost of uncertainty through accurate
response to early sales”. Operations Research, 44, 87-99.
Fischer, M. 1997. “What is the right supply chain for your product?”. Harvard Business
Review, March-April, 105-116.
Galloway, J. 1994. Mapping Work Processes, Quality Press, Milwaukee, WI.
Gavirneni, S., R. Kapuscinski, S. Tayur. 1999. “Value of information in capacitated
supply chains”. Management Science, 45, 16-24.
Hendricks, K. B. and V. R. Singhal, 2003. “The Effect of Supply Chain Glitches on
Shareholder Wealth”. Journal of Operations Management, Vol. 21, No. 5.
Kapoor, V and Gupta, A. 1997. “Aggressive Sourcing : A Free-Market Approach”, Sloan
Management Review, Fall , p. 21-31.
Lee, H., P. Padamanabhan, S. Whang. 1997. “Information distortion in supply chain:

Page 39
The bullwhip effect”. Management Science, 43, 546-558.
Lee, H., K. So., C. Tang. 2000. “The value of information sharing in a two-level supply
chain”. Management Science, 46, 626-643.
Lee, H., S. Whang. 1998. “Information Sharing in a supply chain”. Research Paper No.
1549, Graduate School of Business, Stanford University, Stanford, CA.
McLean, S. 1999. “Finding Strategic Advantage through SCM”, Pulp and Paper
International, 41, no.10, 28-31.
McNutt, J. 2001. Personal communications.
Raman, A. 1997. “Module Overview: Coordinating and managing supply chains:
Matching supply and demand”. Harvard Business School, Boston, MA.
Shaw, Monica, 2000. “Supplier/mill teamwork key in achieving quality and cost goals”,
Pulp and Paper, March edition.
Swafford, P., Ghosh, S., Murthy, N. 2000. “A Model of Global Supply Chain Agility and
it’s Impact on Supply Chain Performance”, Proceedings of the 2000 Decision
Sciences Institute Conference, Orlando, FL.
Williamson, Mark. 1999. “Mills partner with seal manufacturers to reduce process costs,
achieve ROI”, Pulp and Paper, May edition.

Page 40
Appendix A
Case Study Observations
Practices Mill One Mill Two Mill Three
Maintenance Process
Planned maintenance
process
~30%, 2 weeks of job packets 45% of work orders with target of
75%, Maintenance is planned for at
least 1 month ahead with 12 weeks
of backlog job orders, Critical
ranking are used when scheduling,
As planned maintenance has
increased, accidents have
decreased
Maintenance manager and 2
engineers keep list of maintenance
jobs in Excel (owner, frequency,
use of crane, time to
complete.etc.) Maintenance
manager has 2 years of history in
Excel. Maintenance is planned in
Excel with 1 week look ahead. 1/3
of the jobs planned are in the
backlog due to missing material.
Routine maintenance
process
~50% ~33%
Emergency maintenance
process
~20% ~33%
Input from production Daily morning meetings with
production, production can also
create work requests
Routine meetings with production
Impact from production
practices on maintenance
Maintenance work increased if
production staff does not operate
machine properly
Maintenance work increased if
production staff does not operate
machine properly
Use of criticality ranking of
MRO items
1 to 5 scale used, set by production
and maintenance
0/1 used with 1 indicating critical
items
No formal system but currently
identifying based on downtime
implications, time to repair, and
supplier leadtime
Coordination with
procurement
Occasional meetings but not
routine, phone and emails
No routine meetings so primarily
phone and email, issue of
accessibility to procurement people
Maintenance, procurement, and
stockroom are in same department
(small group)
Efforts to standardize MRO
items within mill
Standardized control values, project
initially started by maintenance
Yes, but primary problem is
standardization is not consider in
capital investment projects
Yes, when appropriate but driven
by cost implications

Page 41
Use of subassemblies and
parts versus assemblies
Uses subassemblies and parts if
there is a lower cost
Use of maintenance
frequencies for jobs
Yes, initially set with consultant's
help or recommendations from
MRO supplier
Yes, an on-site representative
assists with setting and maintaining
frequencies
Yes, kept in individual excel
spreadsheets
Use of preventative
maintenance analysis
(vibration analysis,
walkthroughs)
Vibration analysis and walkthroughs Standard walkthrough paths and
instructions, sonic readings,
vibration analysis, also set up 4 year
apprentice program for maintenance
personnel
Vibration analysis (2/month) and
daily walkthroughs
Extent of outsourcing
maintenance activities
$1.17 million versus $3.4 million
actual (based on 12 month average)
All maintenance is outsourced with
a supplier with whom there is a
high level of coordination and
interaction
Use of job packets Contains material list, safety
instructions, and technical
instructions
Packets include material lists and
instructions. Codes for job packets
are P-Planned, B-Material available,
S-Scheduled
No
Procurement Process Procurement responsible for
inventory
Maintenance responsible for
inventory
Maintenance responsible for
inventory (no procurement
department)
Use of MRO item categories
(commodity, critical, In-house)
Procurement identifies as standard
in paper industry or non-standard.
In these commodities are identified
for national contracts. Maintenance
identifies as stock or non-stock.
Classifications are reorder, direct,
contract, consignment, and order
on demand, Quotes are obtained
for direct and order on demand
items, no approval process for
reorder point items, approval is
given by maintenance
Just beginning to identify critical
items
Use of forecasting MRO
material requirements
2 weeks of planning for material if
TSW has job packet or maintenance
frequency for maintenance job,
supplier leadtime for part used if in
TSW
Material is planned using supplier
leadtime and inventory information if
maintenance work order is in MMS
or frequency is set for maintenance
activity
No, identification of material needs
is responsibility of engineer who
tracks and recommends
maintenance activity
Use of reorder points Yes, use history to maintain reorder
point levels
Yes, use history to maintain reorder
point levels, 20K-25K (~75% of
MRO items) items on reorder
Yes, set based on previous
experience. Expediting costs and
usage may be used in the future

Page 42
Amount of items (#,$) in
inventory versus purchased
when needed
Controlled storeroom Yes, separate building Yes, inventory accuracy at 92% (up
from 40% by limiting access and
requiring all material requests be
electronic using MMS)
No, currently have inventory
problems which are partially due to
not having 24/7 stockroom support
Supplier Management
Process
Use of on-site supplier
representative
Yes, for suppliers of bearings and
motors, Created expectation
document for on-site rep for motors.
Yes, with suppliers for bearings and
vibration analysis, Created job
description for on-site rep for
vibration analysis
Maintenance engineer did work
with felt supplier to assess actual
felt life (service from supplier
provided at no cost)
Means of
communication/coordination
with material suppliers
Phone for initial PO and follow-up,
PO is faxed, quarterly meetings with
some suppliers, no use of EDI
Phone/ fax Phone/fax
Means of
communication/coordination
with service suppliers
Most are local so phone and face-
to-face meetings
Phone/fax Extensive
communication/coordination with
contractor for maintenance who is
on-site
Identification and use of
preferred suppliers
Yes, but do not use a contract No No
Strategy to reduce supplier
base
Working to buy more MRO items
from one supplier but emphasis is
on having material, 80 vendors
account for ~80% of spending
No, but occurred as result of
national contracts
No, focus is on cost thus
competition among suppliers is
useful
Track/report supplier
performance
TSW has information so can create
reports, however reports are
requested only when there is a
problem, Also suppliers are
requested to submit their
performance reports
Do not track performance unless
there is a problem. Primary metrics
are price, stockouts, and delivery
No, however they will change
suppliers if not satisfied with cost
or delivery (may even break
national contract if not satisfied)
Supplier selection criteria ISO 9000 certification, on-time
delivery, fill rates, quality, and
importance of mill to supplier
Delivery performance to company
mills, location, # of distribution
centers, on-site rep., supplied
managed inventory, and 24/7
accessibility
Cost and delivery

Page 43
Vendor managed inventory One supplier has bearings on
reserve. If mill changes suppliers,
then mill must buy these bearings
Purchasing moving away from
vendor reserved inventory due to
switching costs; however
maintenance wants more consigned
inventory, Maintenance is also
considering a regional warehouse
for MRO items common to company
mills
One attempt with hardware but did
not work
Corporate No corporate procurement for mills
Efforts to standardize MRO
usage across mills
No Result of buying 3 identical paper
machines from same supplier
Use of standard part
descriptions and numbers
across mills
Corporate directive given 2 years
ago in order to identify usage and
cost of commodity items
Result of buying 3 identical paper
machines from same supplier
Use of national and/or global
contracts
Corporate strategy for economies of
scale in price negotiation, contract
must project at least a 15% savings,
did save $1 million with chemical
contract
Corporate directive started 3 years
ago, Identified ~50 commodities,
have 5-10 contracts under review at
any given time, 10% cost savings
and increased purchasing power;
however suppliers were not as
responsive at the beginning of
contracts but more so towards the
end of the contract
Use of national contracts was cost
driven. There is 1 global contract
for pressure screen baskets (50%
price reduction). There are 5
national contracts for items such
as bearings, starch, and felts.
Contract duration is 1-3 years and
can be broken due to price, quality
or delivery.
Strategy to reduce supplier
base
Tied to use of national contracts No, result of national contracts Result of national contracts
Centralized versus
decentralized decision-making
Corporate emphasizes cost/ton
and budget. Corporate also sets
the production schedule for its US
mills
Amount of participation from
mill personnel in corporate
decisions
Commodity teams consisting of mill
personnel involved in supplier
selection for contracts
Commodity teams consisting of mill
personnel involved in supplier
selection for contracts
Mill personnel involved in supplier
selection but little input into
production schedule
Information Technology
(extent of use)
Bought MMS for $300,000, spent $1 million on modifications. Corporate
is integrating all mills with a new system, INDUS
Page 44
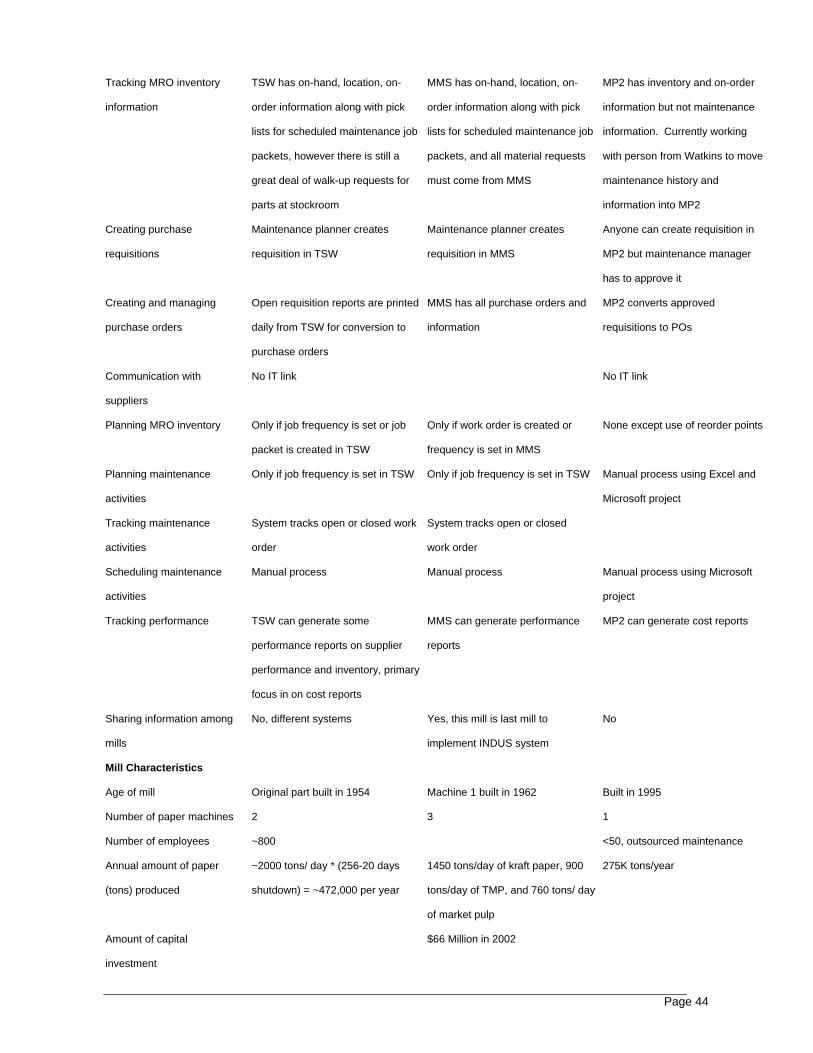
Tracking MRO inventory
information
TSW has on-hand, location, on-
order information along with pick
lists for scheduled maintenance job
packets, however there is still a
great deal of walk-up requests for
parts at stockroom
MMS has on-hand, location, on-
order information along with pick
lists for scheduled maintenance job
packets, and all material requests
must come from MMS
MP2 has inventory and on-order
information but not maintenance
information. Currently working
with person from Watkins to move
maintenance history and
information into MP2
Creating purchase
requisitions
Maintenance planner creates
requisition in TSW
Maintenance planner creates
requisition in MMS
Anyone can create requisition in
MP2 but maintenance manager
has to approve it
Creating and managing
purchase orders
Open requisition reports are printed
daily from TSW for conversion to
purchase orders
MMS has all purchase orders and
information
MP2 converts approved
requisitions to POs
Communication with
suppliers
No IT link No IT link
Planning MRO inventory Only if job frequency is set or job
packet is created in TSW
Only if work order is created or
frequency is set in MMS
None except use of reorder points
Planning maintenance
activities
Only if job frequency is set in TSW Only if job frequency is set in TSW Manual process using Excel and
Microsoft project
Tracking maintenance
activities
System tracks open or closed work
order
System tracks open or closed
work order
Scheduling maintenance
activities
Manual process Manual process Manual process using Microsoft
project
Tracking performance TSW can generate some
performance reports on supplier
performance and inventory, primary
focus in on cost reports
MMS can generate performance
reports
MP2 can generate cost reports
Sharing information among
mills
No, different systems Yes, this mill is last mill to
implement INDUS system
No
Mill Characteristics
Age of mill Original part built in 1954 Machine 1 built in 1962 Built in 1995
Number of paper machines 2 3 1
Number of employees ~800 <50, outsourced maintenance
Annual amount of paper
(tons) produced
~2000 tons/ day * (256-20 days
shutdown) = ~472,000 per year
1450 tons/day of kraft paper, 900
tons/day of TMP, and 760 tons/ day
of market pulp
275K tons/year
Amount of capital
investment
$66 Million in 2002
Page 45
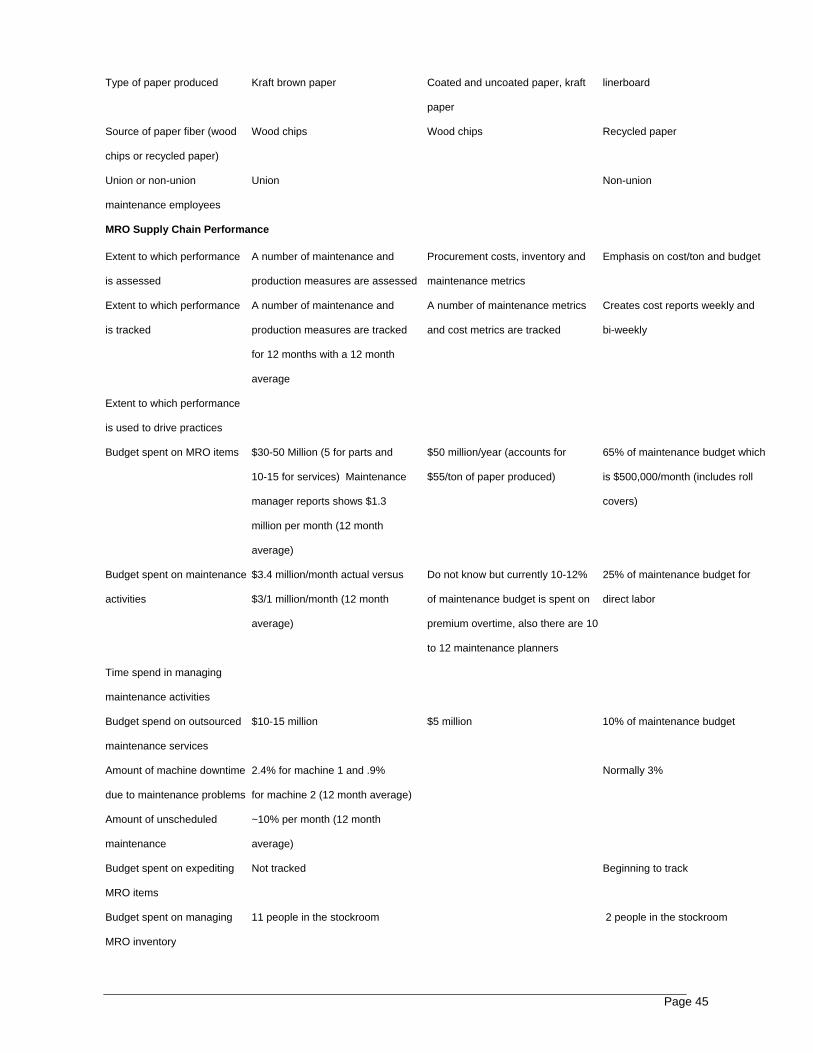
Type of paper produced Kraft brown paper Coated and uncoated paper, kraft
paper
linerboard
Source of paper fiber (wood
chips or recycled paper)
Wood chips Wood chips Recycled paper
Union or non-union
maintenance employees
Union Non-union
MRO Supply Chain Performance
Extent to which performance
is assessed
A number of maintenance and
production measures are assessed
Procurement costs, inventory and
maintenance metrics
Emphasis on cost/ton and budget
Extent to which performance
is tracked
A number of maintenance and
production measures are tracked
for 12 months with a 12 month
average
A number of maintenance metrics
and cost metrics are tracked
Creates cost reports weekly and
bi-weekly
Extent to which performance
is used to drive practices
Budget spent on MRO items $30-50 Million (5 for parts and
10-15 for services) Maintenance
manager reports shows $1.3
million per month (12 month
average)
$50 million/year (accounts for
$55/ton of paper produced)
65% of maintenance budget which
is $500,000/month (includes roll
covers)
Budget spent on maintenance
activities
$3.4 million/month actual versus
$3/1 million/month (12 month
average)
Do not know but currently 10-12%
of maintenance budget is spent on
premium overtime, also there are 10
to 12 maintenance planners
25% of maintenance budget for
direct labor
Time spend in managing
maintenance activities
Budget spend on outsourced
maintenance services
$10-15 million $5 million 10% of maintenance budget
Amount of machine downtime
due to maintenance problems
2.4% for machine 1 and .9%
for machine 2 (12 month average)
Normally 3%
Amount of unscheduled
maintenance
~10% per month (12 month
average)
Budget spent on expediting
MRO items
Not tracked Beginning to track
Budget spent on managing
MRO inventory
11 people in the stockroom 2 people in the stockroom

Page 46
MRO inventory value ($) $16 million ($1.6 million with no
activity in last 10 years)
$5 million ($3 million in capital
spare parts, $2 million in repair
parts)
MRO inventory turns Procurement manager stated
~4 per year but report shows
.48 per month
Not tracked since inventory is
young, Maintenance manager did
say that 1/2 moves quickly while
1/2 moves slowly
Cost/ton of paper produced $330 per ton (12 month average) $150/ton
Machine uptime (%) 97.6% for machine 1 and 99.1%
for machine 2 (12 month average)
Target is 95 to 96% (includes
scheduled downtime) In
November, downtime was &5 of
which 3% was maintenance

Page 47
Appendix B

Page 48

Page 49

Page 50