A study of the acetic anhydride method for the ...
79
University of Richmond UR Scholarship Repository Master's eses Student Research 6-1971 A study of the acetic anhydride method for the determination of citric acid Russell Kent Odland Follow this and additional works at: hp://scholarship.richmond.edu/masters-theses is esis is brought to you for free and open access by the Student Research at UR Scholarship Repository. It has been accepted for inclusion in Master's eses by an authorized administrator of UR Scholarship Repository. For more information, please contact [email protected]. Recommended Citation Odland, Russell Kent, "A study of the acetic anhydride method for the determination of citric acid" (1971). Master's eses. Paper 796.
Transcript of A study of the acetic anhydride method for the ...
University of RichmondUR Scholarship Repository
Master's Theses Student Research
6-1971
A study of the acetic anhydride method for thedetermination of citric acidRussell Kent Odland
Follow this and additional works at: http://scholarship.richmond.edu/masters-theses
This Thesis is brought to you for free and open access by the Student Research at UR Scholarship Repository. It has been accepted for inclusion inMaster's Theses by an authorized administrator of UR Scholarship Repository. For more information, please [email protected].
Recommended CitationOdland, Russell Kent, "A study of the acetic anhydride method for the determination of citric acid" (1971). Master's Theses. Paper 796.

ProjectName:OtJ(~-~kSSe// _ {q "f J
Date: Patron: Specialist:
S'IZ-1//S D T p ~/'"<_
Project Description:
HtL'i>ttr5 lhese-s Hardware Specs:

A STUDY OF THE ACETIC ANHYDRIDE METHOD
FOR THE DETERHINATION OF CITRIC ACID
BY
RUSSELL KENT ODIAND
A THESIS
SUBMITTEn TO THE GRADUATE FACULTY
OF
THE UNIVERSITY OF RICHMOND
IN CANDIDACY
FOR THE DEGREE OF
MASTER OF SCIENCE IN CHEMISTRY
JUNE 1971
APPROVED:
.. "~ ... -. ,.- '~ ' ... ,
.V.l1·'-~,..1~. "~,..•

A CK.NO"'tlIED GEMENT
I ·wish to ackno·1Iledge the many hours of counseling Dr.
W. Allan Powell contributed to me, far above and beyond· school
time. His helpful suggestions and criticisms have made this
paper possible.
In appreciation for the use of their library and instru
ments, I am grateful to The American Tobacco Co., Department
of Research and Development. Mr. William Hudson and Mr.
William Bm·rs0r are acknm·rledged for running the infrared (IR)
and mass spectrometer (HS) spectra, respectively.
I am indebted to ¥ir. Ashby F. Johnson, Jr. of the Research
Department of A. H. Robins Co._, Inc. for· his many nuclear mag
netic resonance (NHR) spectra and interpretations and to Mr.
M. Stone for the elemental analyses performed on the pigment.
Finally, I vds_h to thank Dr. Robert Fischbach of Fibers
Industries, Charlotte, N. C., for running the thermogravime
tric analysis on several samples.

DEDICATION
This thesis is dedicated to my loving wife, Barbara, an~
son, Patrick Kent, whose understanding and long patience have
made the completion of this work possible.

TABIE OF CONTENTS
INTRODUCTION
HISTORICAL
EXPERIMENTAL
I. Reagents
II. Apparatus
III. A Study of the Method
IV.
v.
A. Visible Spectrum of the Citric Acid,
Acetic Anhydride, and Pyridine Mixture
B. Optimum Amounts of Reagents
C. Order of Reagents
D. Effect of Water
E. Effects of Drying Citric Acid
F. Ueaction Temperature Study
G. Preparation of a Standard Curve
H. Interferences of Other Acids
Recommended Procedure for the Determina-
tior. of Citric Acid
Determination of Total Citric Acid in a
Cigarette Tobacco Blend
Page
1
3
10
10
10
11
11
12
13
13
14
16
17
19
20
20

VI. Characterization of the Pigment Formed by
the Reaction of Citric Acid, Acetic
Anhydride, and Pyridine
A. Product Formed Using Different Bases
and Anhydrides
B. Reaction with Different Acids
C. Decarboxylation of Citric Acid
D. Isolation of the Pigment
E. IR Spectrum
F. Degradation of Pigment; Analysis by
Mass Spectrophotometer
G. NMR Analysis
H. Melting Point
I. CHN Analysis
J. other Experimental Observations
K. Experimental Data Correlation
S Ul•Il'iA RY
BIBUOGRAPHY
AUTOBIOGRAPHY
23
23
24
26
27
28
30
31
31
32
33
35
37
38
42

- 1 -
INTRODUCTION
Citric acid is an important compound of many systems.
Numerous methods, both qualitative and quantitative, h3.ve
been used for the determination of the compound. Some of the
biological systems investigated include fermentation studies
(25), action on yeasts (44), antioxidant in fruits (55),
additive in bakery goods (26) and salad dressing prepara
tions (23), amounts in vegetables, fruits (24), milk (54),
and grain foods (5). Citric acid in hu.1Ilan bone (18), blood
and urine (9), muscles (3), teeth enamel (16), liver (21),
and brain (48) have been studied. Aside from the biological
systems, citric acid has been studied in soap (30), polymer
catalycis (28) and reactions (47), tanning (6), cosmetic uses
(7), coatings on glass (40), cleaning metals electrolytically
(14), metal complexes (49), effect of gamma rays upon (27),
and buffer solutions (29). The above examples are not com
plete; they only shm·1 the varied applications of citric acid.
The purpose of this project was to investigate a quanti
tative spectrophotometric method using anhydrous conditions
based on the citric acid-acetic anhydride-pyridine reaction

- 2 -
of Furth-Herr~ann (15). Conditions affecting the reaction
were investigated and optimized for maximum sensitivity and
minimum reaction.time. The precision and accuracy of the
method were determined, along with interfering substances.
A recovery study was made using a tobacco sample. Finally,
the pigment formed was characterized by NMR, IR, MS, empiri
cal formula, and molecular weight determinations.
L_ ____________________________ _
- 3 -
HISTORICAL
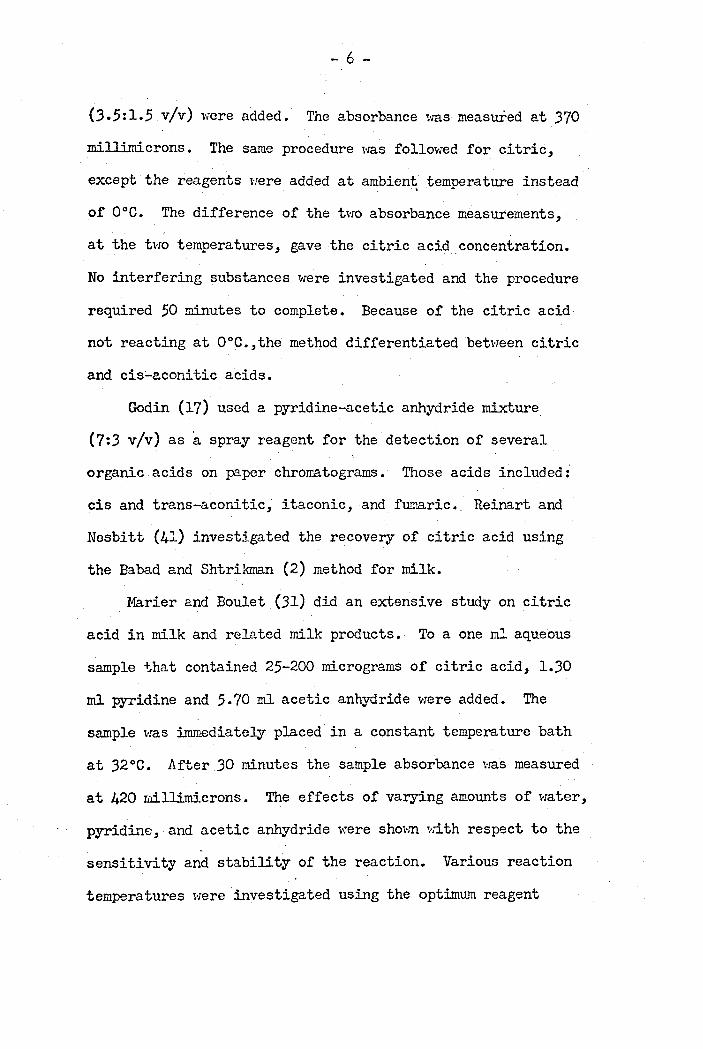
An attempt has bt3en made to show the spectrophotometric
methods used for the determination of citric acid. Some ad
vantages and disadvantages of the methods incorporating acetic
anhydride and/or pyridine are discussed in detail.
Methods, other than spectrophotometric, for the detection
of citric acid include coluTJID (42), paper (33), thin-layer
(22), and gas chrom3.tography (19). Polarographic (13), enzy
matic (34), and potentiometric (37) methods have also been
used for the analysis of citric acid. These methods shm·r the
wide range of analytical techniques available.
Pucher, Vickery, e~ §l-1. (53,39,38) developed 1.me of the
first quantitative spectrophotometric methods which is based
upon the oxidation of citric acid with potassium perm~nganate
with bromine added, to form pentabromoacetone. The penta
bromoacetone was extracted and treated Hith sodium sulfide.
The color produced was measured colorimetrically. This method
of producing the pentabroacetone, _with modifications (13)
after making the pentabromoacetone, is still used today.
Draganic (12) developed a method using copper benzidine
to detect citric, oxalic, tartaric, malonic, lactic, glycolic,

- 4 -
formic, and succinic acids. Crisan and_ K:rausz ( 11) detected
citric, oxalic, and tartaric ·with lead and ethylenediamine
tetraacetic acid.
Furth and Herrmann '(15) were the first to observe the
reaction bet1Ieen citric acid, pyridine and acetic anhydride
in 1935. .Their method was a color test and not quantitative.
They also noted that tartaric and aconitic acids gave distinct
colors. Casares-Lopez (8) noted that agaric acid produces
violet color 1·1ith these reagents.
Roeder (43) found that instead of pyridine, if one used
aliphatic amines, alkali salts of acetic acid, nicotine,
quinoline or strychnine, they produced the color complex.
Arreguine (1) four,d that when citric acid vras heated in ace
tic anhydride without any base, a red color was produced.
None of the above methods involving the Furth-Herrmann reac
tion were quantitative.
Saffran and Denstedt (h5) developed the first quantita
tive method for determining citric acid using a modified
Furth-Herrmann reaction. In this method v:ater was present,
whereas the original Furth-Herrmann test was an anhydrous
test. The method was used on kidney and liver homogenates
and blood plasma. Trichloroacetic acid was used to precipi
tate the protein 1·rhich 1·ras found to interfere with the color
development.
In the Saffran and Denstedt method, a one ml aqueous

- 5 -
solution that contained 5% trichloroacetic acid and ·15-400
· micrograms of citric acid were used for the sample. Acetic
anhydride (8 ml) and pyridine (1 ml) were added and the sam-- '~
ple placed in a water bath at 60°C for 10 minutes. The sam-
ple vras cooled for 5 minutes in an icevrater bath and the
absorbance was measured with a Filter 420 or 400. Compounds
found to interfere were: tartaric, itaconic, and isocitric
acids. Noninterfering compounds were: glucose, urea, gluta-
thione, and succinic, ascorbic, oxalic and malonic, fumaric,
pyruvic, and 1-malic acids. Beer's law was not followed and
it was suggested that knmm citric acid samples be run simul-
taneously with unknmm samples. Because of the exothermic
nature of the reaction, a water bath was necessary to maintain
the temperature at 60°C. The reaction time was lmr(30 minutes)
but the sensitivity of the method was not adequate.
Babad and Shtrikman (2) applied the above method to milk
and sld.m milk po·.rder. The methodology was the same CJ.s Saffran
and Denstedt (45) and no modification of the procedure v:as
given.. Nekhorocheff and Wajzer (36) expanded the Furth-Herrmann
reaction to make it.applicable to cis-aconitic acid. Instead
of pyridine for the base, ammonium hydroxide was used. To 0.5
ml of aqueous cis-aconitic solution to be tested, am.~onium
hydroxide anu 2 Iril of ethanol were.added and the solution was
evaporated to dryness. This procedure >-:as repeated J more
times, then the dry sample was cooled to 0°C; 3 ml 95% ethanol
and 0.5 ml of a m.i.xture of pyridine and acetic anhydride
- 6 -
(3.5:1.5 v/v) were added. The absorbance was measured at 370
millimicrons. The same procedure was followed for citric,
except the reagents Here added at ambient temperature instead '_)
of 0°C. The difference of the two absorbance measurements,
at the two temperatures, gave the citric acid_concentration.
No interfering substances were investigated and the procedure
required 50 minutes to complete. Because of the citric acid
not reacting at 0°C.,the method differentiated between citric
and cis-aconitic acids.
Godin (17) used a pyridine-acetic anhydride mixture
(7:3 v/v) as a spray reagent for the detection of several
organic acids on paper chrorratograms. Those acids included:
cis and trans-aconitic, itaconic, and fumaric. Reinart and
Nesbitt (41) investigated the recovery of citric acid using
the Babad and Shtrikman (2) method for milk.
Marier and Boulet (31) did an extensive study on citric
acid in milk and related milk products. To a one ml. aqueous
sample that contained 25-200 micrograms of citric acid, 1.30
ml pyridine and 5.70 ml acetic anhydride were added. The
sample was immediately placed in a constant temperature bath
at 32°c. After 30 minutes the sample absorbance was measured
at 420 millimicrons. The effects of varying amounts of water,
pyridine, and acetic anhydride were shovm with respect to the
sensitivity and stability of the reaction. Various reaction
temperatures were investigated using the optimum reagent
- 7 -
concentration. A recovery study using milk samples was perform
ed and possible interfering substances such as trichloroacetic
acid, hydrochloric acid, sodium hydroxide, phosphate, and calcium
chloride were studied. It was suggested that trisodium citrate
dihydrate be used for the standard instead of free citric acid
because of the high purity of the salt. The Varier and Boulet
(31) method represents the fastest, most sensitive, and accurate
procedure for the determination of citric acid using the Furth
Herrmann reagents in an aqueous system. Marier and Boulet (32)
modified the method for milk in the presence of casein.
Hartford (20) expanded the Y.iarier and Boulet (31) method
to include itaconic, aconitic and fumaric acids. Beer's I.aw
was not followed for the citric acid curve. The method does
not distinguish quantitatively between citric and aconitic
acids (measured at 43~ millimicrons), nor between itaconic
and fumaric acids (measured at 385 millimicrons). Al~ conditions
were the same as Marier and Boulet (31) with the exception of
measuring the acids at different wavelengths.
White and Davies (54) compared the Saffran and Denstedt
(45) method with the Marier and Boulet (31) method for analysing
citric acid in milk and found the latter method superior in
terms of speed and accuracy.
Choy, Quattrone, and Elefant (10) were the first to develop
a qu.3.ntitative method that used the anhydrous Furth-Herrrr~nn
reaction. A 2 ml aqueous standard had 4 ml of pyridine added
and the solution was evaporated to near dryness on a steam bath.

- 8 -
Sodium sulfate and pyridine were added and the solution was
filtered through a glass wool plug into a test tube m3.rked at r.>
8 ml. The solution was diluted to 8 ml mark with pyridine,
and 4 ml of acetic anhydride was added. The reaction took
place at room temperature for 30 minutes. The absorbance vras
measured at 385 rnillimicrons. For protein-containing samples,
such as milk and dairy products, the sa."llple was extracted with
methanol and p:i.ssed through a Florisil p:-3.cked chromatographic
column. An aliquot of the eluate was heated on a steam bath
until dry and the above procedure was foll01:ed. Studies sho·;-md
that acetic, propanoic, butanoic, valeric, caproic, and lactic
·acids did not interfere. No data 1·:ere given to justify their
selection of reaction time and the optimwn amounts of each
reagent. And apparently no studies were made on the stability
of the reaction, effects of \;ater, and the nature of the product
formed. The amount of citric acid required for the reaction
was 10--100 micrograms. This method is superior to the Marier
and Boulet (31) procedure because of the increase in sensitivity
and simplificJtion of the sa"llple prepn.ration steps.
Valentinis (52) used a Furth-Herrmann (15) reaction Hith a
unique condition for the quantitative determination of citric
acid. Instead of pyridine-acetic anhydride reagent, Valentinis
only used the acetic anh~rdride--without any base. Anhydrous
conditions prevailed in the system. The aqueous citric acid
sample was dried on a steam bath, 10 ml acetic anhydride was
added, and the mixture heated at 65°c for 45 minutes. The

- 9 -
purple color produced ·was measured at 520 millimicrons. It vras
stated that malic, tartaric, ascorbic, succinic, i~ctic, gallic,
and malonic acids do not interfere. Metals such as molybdenum, ·::>
aluminu.111, and tin which interfere with the reaction should be
removed from the system before analysis. The sensitivity
claimed was 10 micrograms. All of the work was done using pure
citric acid and no recovery study was reported or optimum condi-
tion studies given.
There was no literature reference found that adapted the
Furth-Herrmann reaction to the determination of citric acid
in tobacco. Sigmon (50) used the Hartford (20) method (previous-
ly discussed) for the analyses for citrates in cigarette paper.
The Hartford method was employed without modification and none
of the variables of the reaction were investigated.
Furth and Herrmann (15) indicate that the pigment formed
by the reaction of citric acid, acetic anhydride, and pyridine
was an acetylated dihydroxycitric anhydride with a composition
of C3H10010· This compound was sensitive to oxygen and soluble
in pyridine and acetone. This paper v:as the only one found
that attempted to characterize the pigment.

- 10 -
EXPERIMENTAL
I. Reagents
All cheniicals used were reagent grade including anhydrous
citric acid. The pyridine Has dried with a molecular sieve,
Jj.nde Type JA~Union Carbide Corporation.
II. Apparatus
Cary }1odel 14 Recording Spectrophotometer
Varian A-60 .m.m
Perkin-Elmer Model 21 Double Beam Infrared Spectrophoto
meter
Mass Spectrorr..eter CEC Hodel 21-103C
Beclanan Zerorratic II pH Meter
Perkin-Elmer Model 240 Instru'Ilent for Elemental Analysis
Mettler Thermoanalyzer II
Forced Draft Oven
Burrell i'lrist Action Shaker
Beckmann Thermometer
Wiley Hill .
- 11 -
III. A Study of the Method
A. Visible spectru.~ of the citric acid, acetic anhydride,
and pyridine mixture.
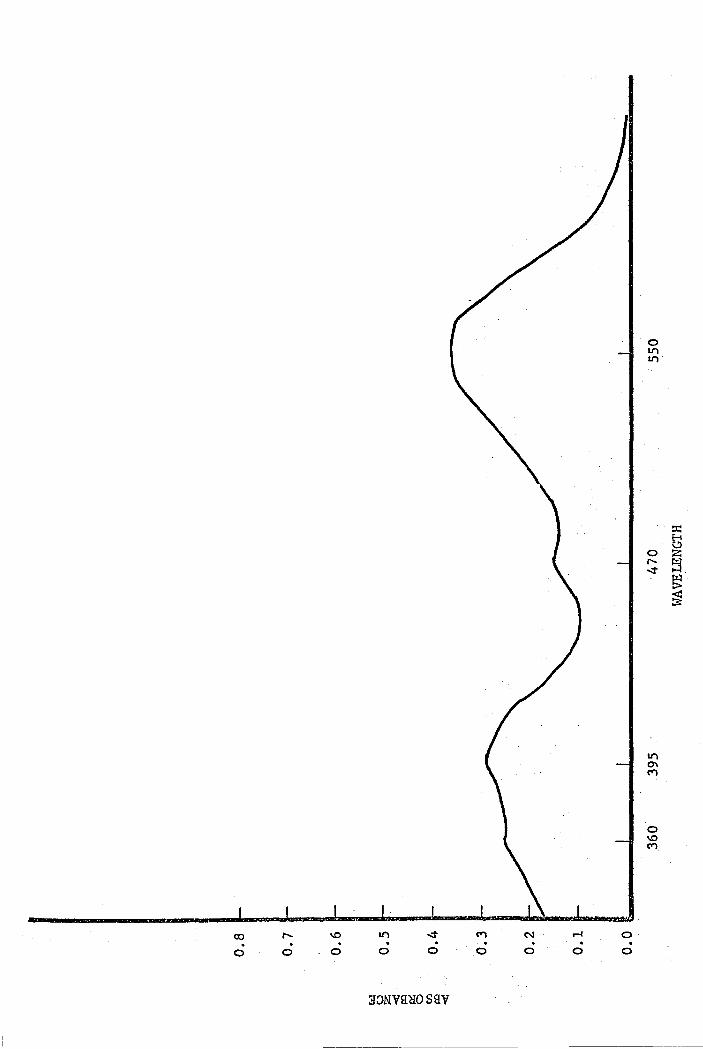
When dry citric acid was mixed with pyridine and acetic
anhydride and heated slightly, a purple pigment was produced.
Figure 1 sho:;s the visible spectrum of the product. The acetic
anhydride reagent was also used as the solvent for the system.
The wavelength maxima were (in millimicrons): 580, 450, 405,
and 385.
It should be noted that a color was produced when citric
acid and acetic anhydride, ,.fi thout any base, vrere heated on a
steam bath for 30 minutes. The visible spectrum. is shown in
Figure 2. The maximum wavelengths t·;ere (in millimicrons):
550, 470, 392, and 362, which were essentially the same as
those reported above, 1:rhen pyridine Has used. When pyridine
was added to the citric acid/acetic anhydride mixture and allff::
ed to set for JO minutes at room temperature, an identical
visible spectrtun was produced, as in Figure 1.
The main spectral difference Hith and 1·Tithout pyridine
was one of sensitivity. With pyridine, the sensitivity for the
lovrest wavelength peak was 150 times greater than \·tlthout the
base. Because of this sensitivit~ difference, a decision was
made to use pyridine and to measure the absorbance at 385 milli
microns.
Figure 1
Absorption Spectrmn of a Citric Acid
Acetic Anhydride-P..rridine Mixture.
80 micrograms citric acid/10 ml volu.~e

0\ co "' \.0 Ll"I . . . . . 0 0 0 0 0
. a::mv~nro sav
~ M . . 0 q
0 0 \.0
0 Ll"I Ll"I
0 0 Ll"I
::i::
~· z ~· ......
~~ ::;:
0 l{)
NM . 0

Figure 2
Absorption Spectrum of a Citric Acid
Acetic Anhydride Mixture
4.4 mg. citric acid/10 ml volume
. . . . . 0 0 0 0 0
3~NVH~O S S:V
. . 0 0
. 0
·o II'\ II'\

- 12 -
B. Optimum Amounts of Reagents
. Figure 3 sho·;;s the effect of pyridine on the absorbance
obtained using 7 ml of acetic anhydride.> The absorbance was
corrected to a _10 ml total volu.~e for all samples. The reac
tion time was 30 minutes at room temperature and the absorbance
,.,as measured at 385 millimicrons. The reagents should be
scrupulously dry. An aqueous solution containing 150 micro
grams of citric acid was dried in a forced draft oven at 105°
for 60 minutes. The acetic anhydride was used without any
modification. The maximum absorbance occurred when 3 ml of
pyridine was added.
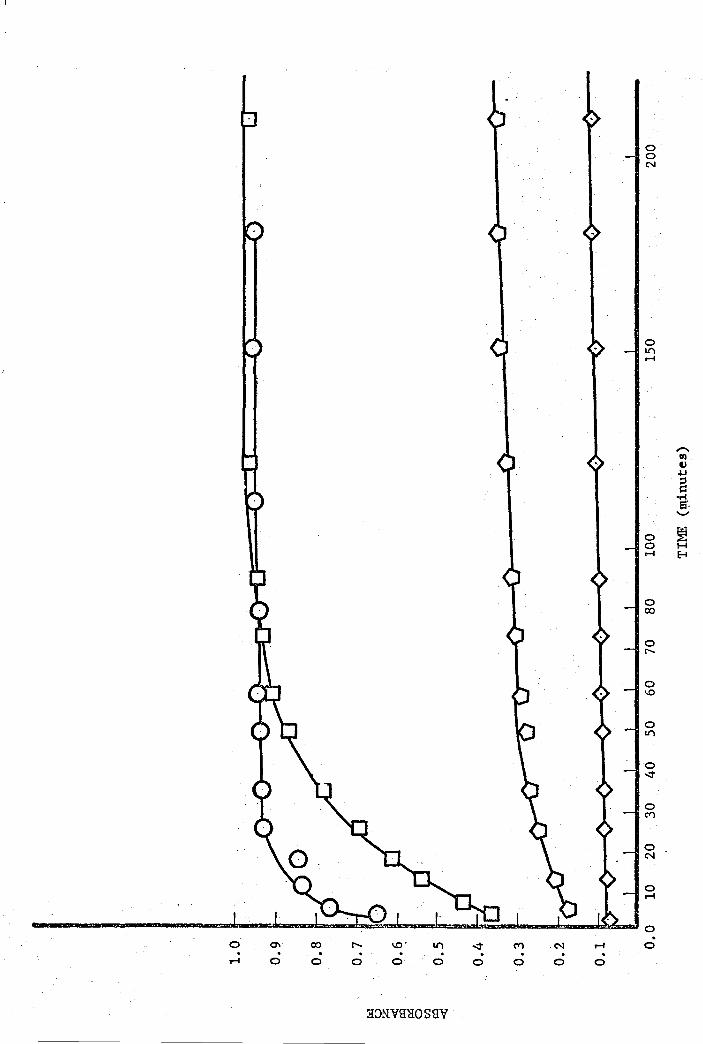
As with the pyridine, the acetic anhydride was varied
from 2 ml to 12 ml. All samples contained 150 micrograms
citric acid, 3 ml of pyridine, and the absorbance was corrected
to a 10 ml total volume. The maximum absorbance obtained in
Figure 4 was at 8 ml of acetic anhydride. The percent difference
in absorbance between 7 and 8 ml vras less than 2. To simplify
the caloulations, the colorimetric method.for the determination
of citric acid was based upon 7 ml of acetic anhydride, and a
total volume of 10 nil rather than 11 ml.
The effect of varying the amounts of ea.ch reagent on the
time required for the reaction and on the stability of the color
produced was determined by observing the change of absorbance
with increasing ti.Jr£ at room temperature. All sa.r:iples had 150
micrograms of citric acid, and 11ere diluted to a 10 ml total
volume using glacial acetic acid. Figure 5 sho~·rs that varying

Figure 3
Optimum Amount of Pyridine for Haximu..111
Absorbance at 385 Millimicrons
Conditions: 7.0 ml acetic anhydride all absorbances corrected to 10 ml total volume reaction time 30 minutes

0 . CX)
0 . .......
0
0 . Ir)
-...... s .._..
~ 0 H . Cl ..;;J- H
~
~
0 . (")
0 . N
0
. 0 (") 0 . . . . . . . . . . ,...f 0 0 0 0 0 0 0 0 0
a::mv~n10 SHV
Figure 4
Optimum Amount of Acetic Anhydride
for Maximum Absorbance at 385 Millimicrons
Conditions: 3.0 ml pyridine all absorbances corrected to 10 ml total volUi~e reaction time 30 ~.inutes at room temperature

1.0
0.9
0.8
0.7
~
o.6 u z . -< i:a IZ 0 0.5 I;/)
·~ 0.4
0.3
0.2
0.1
o.o 1 2 . 3 4 5 6 7 8 9 10 11 12 13 14 15 16
ACETIC ANHYDRIDE (ml)

(>
0
D
0
Figure 5
Sensitivity and Stability
of Various Amounts of Pyridine
Conditions: 150 micrograms of citric acid absorbance measured at 385 millimicrons diluted to 10 ml volume uith glacial acetic acid (AcOH)
pyridine (ml) AcOH(ml) ~~--2-0_(ml)
1 3 6
2 2 6
3 1 6
4 0 6
,..._ Ul ., +J ::I ~·
o.-l
=·· '-"
0 ~ 0 H .-I E-1
0 co
0 ........
0
'° 0 I.I"\
0 ..;:t
0 M
0 cN
0 .-I
0 . 0 0\ co " '°" I.I"\ ..;:t M cN .-I 0 . . . . . . . . .-I 0 0 0 0 0 0 0 0 0
a::>NVS:tIOSS:V

- 13 -
the pyridine between 1 and 4 mls and keeping the acetic anhy
dride constant at 6 ml, the ma.y..imum absorbance was reached
within 30 minutes with the maximu.rn amount of pyridine added.
The absorbance was stable for at least 3 hours. Figure 6
demonstrates that with the pyridine constant and varying the
acetic anhydride beti;.·men 1 and 7 mls, maxi.mu.TD. absorbance was
obtained within 30 minutes at 25°C with the maximwn·amount
of acetic anhydride added. Figures 5 and 6 shov; that the
less glacial acetic acid added, the greater the absorbance.
C. Order of Reagents
To observe the effect of the order of the reagents (pyri
dine and acetic anhydride) on the rate of formation of the
chromophore, two sa.r:iples were prepared. Each had 150 micro
grams of citric acid. One sample had the 7 ml of acetic
anhydride added before the 3 ml of pyridine. The other sample
had the same amount of reagents but added in reverse order.
Figure 7 sho1rs that the order of reagents does not affect the
maxirr.u.rn absorbance. Both rates of forrr'ation of the chromophore
were the same.
D. Effect of Water
The effects of water added before and after the addition
of the reagents were investigated. All samples had 150 micro
grams of citric acid, 3 ml of pyridine and 7 ml acetic anhydride.
A 30 minute development. time was allm·red. Figure 8 shows the

Figure 6
Sensitivity and Stability of Various
Amounts of Acetic Anl1ydride
Conditions: 150 micrograms of citric acid absorbance measured at 385 milli-microns diluted to 10 ml volume '.·rith glacial acetic acid
!t::_29.full AcOH0!iJl 12Y-_r~gin~
0 1 6 3
0 3 4 3
A 6 1 3
0 7 0 3

0 . . . . 0 0 0 0
. 0
. 0
N
0 .
0
0 0 <N
0 0 ......
0 II")
0 M
0 N
0 . 0

Figure 7
~faxim.um Color Developed By Reversing
Order of Addition of Reagents
Conditions: 150 micrograms of citric acid absorbance measured at 385 rolillimicrons reaction temperature 25°c
6. 7 ml Ac2o added; then 3 ml pyridine
O 3 ml pyridine added; then 7 ml Ac20

.......... 1 ... a- 00 . . 0 0
r-.. . 0
3::JNVffiIOSHV
N
0
.-I
0
0 0 ('"')
0 0 N
0 l.O .-I
O· 0 .-I
0 00
0 l.O
0 '1"
0 N
. "O
0
,...... VJ v .u g
o.-4 s '.../
~ H E-l

Figure 8
Effect of Water Added to the System
Before the Addition of Reagents
Conditions: 150 micrograms of citric acid 3 ml pyridine, 7 ml Ac2o added absorbance measured at 385 milJimicrons and corrected to 10 ml volume reaction temperature 25°

0 0 lf) ......
0 0 ("') ......
0 0 ...... ......
0 0
°'
0 0 r-..
0 0 I.!)
0 0 ("')
0 0 ......
0 . 0
,.... ti)
s ~ 1-1 bO
-M ...... ...... •.-1 s '-'
p:: r>:l
~

- 14 -
effect of 1·rater added befc:ire the reagents. There vras approxi
mently a 50% decrease in absorbance when 0.5 ml was added.
When vrater "Was added after the reagents, the decrease in
absorbance was less dramatic. Figure 9 shows only a 22%
decrease in absorbance after adding 0.5 ml of water. The ab
sorbance 1·;as not corrected to a 10 ml total volume. The effect
of extraneous Hater in the system prior to the addition of
reagents was more detrimental than Hater entering the system
after the reaction v;as underway.
To ascertain the effect of the absorbance versus increase
in reaction time with a knm-m amount of water, two 150 micro
gram samples of citric acid 1·rere prepared. One had 580 mg
added before the reagents and the other sample he.d the same
amount of v:::i.ter added after the reagents. Figure 10 again
shovrs that water added before the reagents yields a larger
decrease in absorbance.
E. Effects of n~·ing Citric Acid
As shmm in the above water addition studies, 1·rater added
before the reagents causes the ~aximu.~ decrease in the forma
tion of the chrcmophore. This is essentially the same as
having a wet sample.
Table l shoHs the effect of increasing drying time on ab
sorbance. All saJnples had 3 ml aqueous solution of citric acid
(150 micrograms) in a 25 ml wide mouth Erlemri.eyer flask. The
forced air draft oven was set at l00°C.

Figure 9
Effect of Water Added to the System
After the Addition of Reagents
Conditions: 150 wicrograms of citric acid 3 ml pyridine, 7 ml Ac20 added absorbance measured at 385 :millimicrons reaction temperature 25°c

4CtJ: • J ==-kn._j 0 °' CX) " '° I.I') "" M . . . . . . . .-I 0 0 0 0 0 0 0
N .-I . . 0 0
0 0 I.I')
0 0
""
0 0 M
0 0 N
0 0 .-I
. 0
,,.....,,
·~ <ii J-1 bO
•r-l .-I .-I •r-l E3 .._..
~ µ::i
~ ~

Figure 10
Effect of Water on Absorbance
With Respect to StabiJity and Sensitivity
Conditions: 150 micrograms of citric acid absorbance measured at 385 millimicrons reaction temperature 25° c
0
)80 mg H20 added; then 3 ml pyridine and 7 ml Ac2o
3 ml pyridine and 7 ml Ac20 added; then 580 mg H20

0 . .-!
. 0
00
0 . . .
0 0 0 .
0 .
0
N
0
.-!
0
0 0 N
0 l/"\ .-!
0 l/"\
0 ('()
0 N
0 . 0

- 15 -
TABLE I
Effect of Drying Time of Citric Acid on Absorbance
Hours in Oven -----·---···
0.5
1
2
3
4
Absorbance ----·---.612
.905
.912
.908
.921
A thermogravimetric analysis (TGA) instrument was used to
determine the decomposition, if any, on the citric acid at ex-
tended drying times. An expanded scale (0-100 micrograms) was
used to amplify the magnitude of weight lost in the sample.
The temperature was set isothermally at 123°C and held for five
hours. The decrease in weight shown in Figure 12, at 110 min
utes corresponds to a net weight loss of l~ss than 0.2%. Th:i.s
was thought to be due to loss of water and not of decomposition.
This study has sho·:m that aqueous samples may be dried in
a forced draft oven without danger of decomposition and that
1 hour at 100°C is an adequate drying time. If one uses larger
or smaller volu.rnes of solvent, then the drying time would have
to be experimentally determined.

Figure 11
ThermogravL~etric Analysis of Citric Acid
Conditions: 9.99 mg sample of citric acid 123 °C isotherm">.l temperature, air atmosphere

0 0 (")
0 If) r-4
0 0 r-4
0 co
0
'°
0 N
._ .. ._ ............................ -.. ............... Ciila.....,"""*'.::<=-=....,,"""'......,"""'"""""""'....,..,_.,...~~""""',,_,""""'.....,....,.....,~.o 0 0 r-4
0 00
0
'° 0 I./"\
~ H H

- 16 -
F. Reaction Temperature Study
Table II shows the absorbance of different concentrations
and temperatures for the standard curve. The aqueous citric
acid samples were dried in an oven at 105°C for 1 hour. Three
ml of pyridine and 7 ml of acetic anhydride were added to all
samples. The reaction time was 30 minutes for both reaction
temperatures.
TABLE II
Absorbance measured at 385 millimicrons
Concentration* Absorbance Absorb-=.nce
_(microgms/10 ml) (reaction temp 25°C) ·- (reaction ter:,p 38°C)_
20 .020 .208
40 .141 .426
60 .264 • 701
*Each concentration level was the average value of six samples.
Both Ms.rier and Boulet (31) and Hartford (20) noted that
citric acid did not follow Beer's law. If, after the addition
of the reagents, the samples were not placed in ar: oven at 37-
400C, the low concentration levels (e.g. 10-20 micrograns)
gave practically no absorbance. When the samples were heated
after the addition of the reagents, the lm·: concentration
samples reached maximum absorbance and the standard curve v~as
linear.

- 17 -
G. Preparation of a Standard Curve
To prepare a standard curve, weigh accurately 100 mg. of
anhydrous citric acid and dilute to 100 ml with water (1 mg.
citric acid/ml). This was the stock solution. From the stock
solution, transfer 2 ml to a 100 ml volumetric flask (20 micro
grams/ml) and dilute to volume. It was noted that the standard
solutions of citric acid developed a mold in the flask after
one month. Fresh standards should be prepared after three
weeks.
The pyridine should be previously dried with molecular
sieve. A fresh pint size bottle of reagent grade acetic anhy
dride should be used for the determination of citric acid.
After one or two weeks of exposing the opened bottle, while
withdrawing the aliquot, the las.t 25~50 ml of acetic anhydride
had become sufficiently contaminated to cause a decrease in
absorbance.
Transfer 1, 2, and 3 ml aliquots from the 20 microgram/ml
solution to 25 ml glass stoppered wide mouth Erlenmeyer flasks.
Place in a forced draft oven at 105°C for 1 hour. The use of
some type of tray, to evenly distribute the heat, is recommend
ed because of 11hot spots 11 that developed in the commercial
oven that was used.
The samples should be taken out of the oven and set aside
for 10 minutes (or until ambient temperature is reached) v:ith
the samples closed to the air using glass stoppers. Accurate
ly transfer J.O ml of pyridine and 7.0 ml of acetic anhydride

- 18 -
to the Erlenmeyer fl.ask containing the citric acid and a blank.
One should use a suction bulb to transfer the reagents because
of the toxicity of the pyridine (46) and the reactivity and
l.achrymatory properties of the acetic anhydride. Stopper the
fl.ask and put in an oven at 37-40°C for 30 minutes. Measure
the absorbance at 385 millimicrons and subtract the blank.
Figure 12 shows the standard curve for a concentration
range of 0-60 micrograms. Each concentration was done in
sextuplet. The percent relative deviation was 3.0. The slope
of the curve was 0.1147. This value was obtained from an IBM
1130 computer using a standard polynomial regression program.
TABlE III ·
Deviation From Standard Curve (Figure 13)
20 ugm CA 40 ugm CA_ 60 ugm c~
A Dev. A Dev. A Dev.
.203 .002 .• 451 .010 • 713 .002
.192 .013 .448 .007 .?20 .009
.217 .012 .429 .012 .?03 .008
.205 .ooo .• 434 • 007 • 710 . .001
.218 .013 .441 .000 .?17 .006 .:.122. .010 .443 • 002 .?05 .. .006
Ave. .205 .008 .441 .006 .7ll .005
Std. 10.8Xlo-3 Dev.
% Rel. Std. 5.3 1.9 1.0 Dev.

Figure 12
Standard Curve for Citric Acid
Conditions: absorbance measured at 385 millimicrons total volume, 10 ml reaction time, 30 min. 3 ml pyridine and 7 ml Ac2o added

0 0\ CX) ........ \0 11'\ -.:1" M . . . . . . . .... 0 0 0 0 0 0 0
:!I~lNVH1IO SHY
N .-1 . . 0 0
0
'°
0 -.:1"
0 N
0 . 0
,,...... Cll 6 cu ,_. bO 0 ,_. 0 ~
6 .._,,
~ H u < u H p:: E--4 H u

- 19 -
H. Interferences of Other Acids
Knmm acids at the 150 microgram level were substituted
for citric. acid employing the method developed. Several of
the acids listed in Table IV did not react at this low concen-
tration level ~:mt did give a color when reacted at the 1-2 gram
level. These acids i·till be discussed in the next section of
the experimental. All of the acids listed were done in dupli
cate and the absorbance 1·ras measured at 385 rnillimicrons:
After the addition of the reagents, the samples were not placed
inside an oven for the required time but uere left at room
temperature for 30 minutes.
TABLE IV
Acids Substituted for Citric Acid in the Method
Acid
citric cis-aconitic trans-aconitic itaconic isoci tra te~~<fumaric tartaric succinic d-malic 1-malic a1..:..malic oxalacetic alpha-keto-butyric alpha-keto-glutaric alpha-keto succinic beta-keto adipic 1-ascorbic
Micrograms citric acid*
l50 144 153 158
0 7 3 0 0 0 0 1 1 3 0 0 0
*All absorbance calculated from citric acid standard curve, 10 ml total volume

- 20 -
*::- The bariuin salt was used. No color is produced. When the the salt is acidified, then reacted with the reagents, a color is produced 9nly at high concentration levels (mg/10 ml range).
IV. Reco:Tu.~ended Procedure for the Determination of Citric Acid
The foll0iling is the reco::::rrnended procedure for the deter-
m..ination of citric acid. In a 25 ml glass stoppered flask,
place samples containing 0-60 micrograms of citric acid in a
forced draft oven at 105°C for one hour. (If more that 3 ml
water in sa."'11ple, a longer drJing time is needed). Remove from
the oven, stopper the flasks, and let samples cool to room
temperature for 10 minutes. Add 3_.0 ml of dry pyridine and
7.0 ml acetic anhydride, stopper iI~~ediately and mix thorough-
ly. Place in an oven at 37-40°C for 30 minutes. Measure the
absorbance at 385 mi.115.microns. Follm·: the above procedure
for a reagent blank. The flask should be dried before adding
the reagents • Compare the absorbance td_ th a standard curve
and calculate the amount of citric acid in the sample by the
equation:
Citric Acid(nucrograms) {A bst:?_rbag_ce-:_blank.}XDilutiog_ facto~
Slope of Standard Curve
V. Determination of Total Citric Acid in a Tobacco Blend
The foll01.·ring determination of citric acid in a tobacco
sample Has based on an extraction method by Harvey, Hale, and
Ikeda (19). After the extraction of the tobacco, they used

- 21 -
esterification and subsequently analyzed the methyl esters by
gas chrm;n.tography. A modification of their extraction proce
dure was used for quantitatively removing the citric acid from
the toba.cco. In place of the absolute methanol-sulfuric acid
mixture used for the extraction and esterification, a wi.xture
of methanol, hydrochloric acid, and 1·;ater was used. Also 20%
water \";as -added to the extraction procedure to prevent any
esterification that vrould take place. Harvey, Hale and Ikeda
shm·red that 1.·ith 10% water, one can only expect to get 18%
esterification. An acid is necessary to convert any citrates
in the tobacco to _free citric acid. The HCl was used in place
of H2so4 because of its volatility.
The follm·:ing procedure was used for analyzing citric
acid in a commercial cigarette tobacco. Grind the tobacco
in a \·liley mill using a 20 ruesh screen and dry it overnight
at 105°C in a forced draft oven. Accurately weigh l gram of
tobacco and place in a 125 ml Erlen.~eyer flask. Add 10 ml
water and 50 ml of a methanol, HCl, H20 mixture (89:1:10 v/v)
and shake for 30 minutes using a mechanical shaker. Filter
with one piece of h140 Whatman filter }Xlper. Transfer 1.0 ml
of extract to a 10 ml volumetric flask and dilute to volurne
with :methanol. Transfer 1.0 ml of the diluted extract to a
small separatory funnel and add 5 ml H20. Extract i·rith 5 ml
portions of diethyl ether four times into a 25 ml ground glass
Erlen.~eyer flask. Evaporate the ether to near dryness (less
than 3 ml) and place in a forced draft oven 5 105Q for 30

- 22 -
minutes. Let the samples cool at room teraperature, ·with the
flask stoppered, for 10 minutes. Add J.O ml pyridine and 7.0
ml acetic ?-nhydride, stopper, sHirl flask, and place in oven
at 37-:40°C for 30 minutes. Measure the absorbance at 385 milli-
microns. The average of 3 determinations gave a value of 2.59%
of citric acid on a dry weight basis of tobacco. An indepen-
dent method of analysis shovred the same tobacco to have 2.24%.
Table V shows the recovery study of 40 and 60 micrograms
of citric acid added to 1 gram of dry tobacco.
TABIE V
Recover.f of Citric Acid Added to Tobacco Sa.7llple
micrograms micrograms ~i tric~_i§_ add££ found ~-Jle c _2Ye i:;y -------
40 38.4 96.0 40 35.2 88.0 40 36.9 92.3 40 36.? 91.7
Average 36.8 92.0
60 57.0 95.1 60 56.7 94.5 60 55.3 92.5 60 55.5 92.5
Average 56.3 93.6
The equation used to find the amount of citric acid was:
micrograms citric acid {Abs.-blank)(dilution factor)
Slope of standard curve

- 23 -
VI. Characterization of the Pigment Formed By the Reaction
of Citric Acid, Acetic Anhydride, and Pyridine
:)
A. Product Forrned Using Different Bases and Anhydrides
Several bases 1;ere added to ci tri~ acid and acetic anhy-
dride to determine if pyridine was a specific base necessary
for the formation of the colored product. Sodium hydroxide
(1 pellet) l:as added to 1 gram of citric acid and 10 ml of
acetic anhydride. The sample had the same wavelength maxi-
mum (550-560 millimicrons) as when pyridine vras added. Po-
tassiu.~ hydroxide gave the same result. Another base, n-butyl-
amine, was added and an identical absorption was noted. It
should be mentioned that n-butylaroine reacted violently when
added to the citric acid-acetic anhydride mixture. ';\Then added
drop-';Iise, the reaction was controllable. It appears that any
base added to citric acid and acetic anhydride generated the
same visible spectrmn.
Four anhydrides were reacted with citric acid and pyri-
dine to deterrd.ne if any specific anhydride 1·ras needed for the
reaction. Succinic anhydride (15 grams) was mixed ·with 10 gm
citric acid and 100 ml pyridine. The solution lras heated in
a beaker on a hot plate. The reaction is exothennic and the
heater was used only to initiate the reaction. The mixture
-vrent frorr. light green to yellow to orange to a light brm·m.
color. The temperature lras 88°C after 16 minute reacti.on time.
Phthalic anhydride (15 gms) was added to 10 grams citric acid

- 24 -
and 100 ml pyridine. The solution went from a light yellow to
green to light brm·m. After 20 minutes reaction time, the
temperatur~ Has 86°C.
H:i.leic anhydride (20 gms) was added to 10 gms citric acid
and 150 nl pyridine. The solution turned dark brown immediate
ly. The solution started to boil and the temperature was 85°C.
Citric acid (10 gms) and 25 ml pyridine '·rere mixed together.
He.xafluoroacetic anh;yuride (less than 1 ml) was added drop;·rise.
The reaction vras instantaneous with a 1·;hi te gas evolved. No
odor above that of the pyridine could be detected. Extreme
care should be taken when mixing this reagent because of the
violent reaction that takes place. A pink color was produced
and vravelength nia:xima in acetone were: 572, 540, 1+55, and 360
millimicrons,
Finally, 8 grams of pyromellitic dianhydride was added to
10 grams of citric acid and 100 ml of pyridine. The solution
turned blue and finally a brm·m color developed. A precipitate
formed.
It appeared that succinic, nnleic, phthalic, pyromellitic,
and he::r...afluoroacetic anhydrides gave products that were si.'11ilar,
if not the same as the final product obtained Kith acetic anhy
dride.
B. Reaction With Different Acids
As shmm in Table III, cis and trans-aconitic, and itaconic

- 25 -
acids produce essentially the same absorbance at 385 millimi-
crons as citric when present at the same concentration level.
At a higher concentration level, isocitric produces an identi-
cal wavelength maxirrra but at much louer intensity. (The
isocitric as a bariTuil salt was acidified with lN HCL, evaporat-
ed to dryness and then reacted in the usual ~Anner.) The rates
of formation of the acetic anhydride product of the citric,
itaconic, isocitric, and aconitic acids were qualitatively
determined. Approxi'Ilately 1 gm of each acid with 10 ml acetic
anhydride were placed on a steam bath and the time in 1·rhich the
color first developed (eye observation) vras noted. The citric
and i taconic took 6 minutes v:hile isoci tric took 2 minutes and
aconitic, 1 minute, to develop color.
The wavelengths at which absorption occurs .for citric,
isocitric, and cis and trans-aconitic are identical to Figure 1.
Itaconic was identical except the peak at 550 millimicrons was
absent.
The structure of the following compolinds are listed bel01·::
COOH COOH COOH COOH I I I I CH2 C=CH2 HC H-C-OH I I II I
HO-C-COOH CH2 C-COOH H-C-COOH I I I I CH2 COOH CH2 CH
2 I I I COOH COOH COOH ·
citric itaconic aconitic isocitric (trans shm·m)
- 26 -
The compounds shmm above are very similar. All are di or tri
carboxylic acids. Citric and isocitric could eliminate one
molecule of 1·rater readily to form the aconitic acid. Methyl
citrate does not react vd.th the reagents to form any chromo
phore.
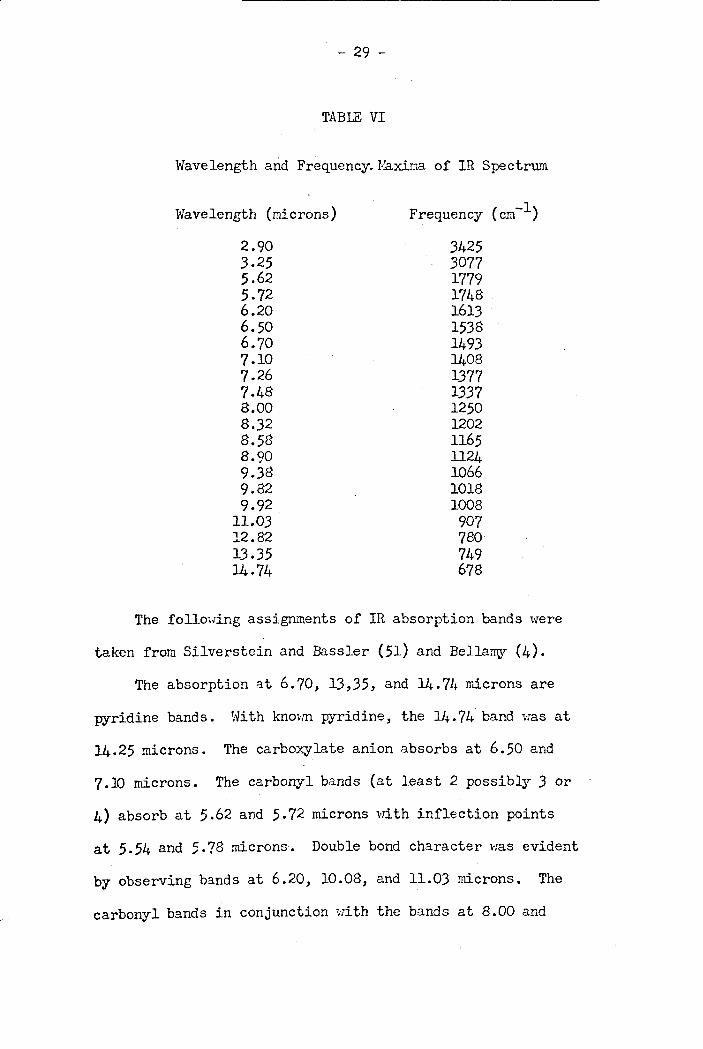
C. Decarbo.xylation of Citric Acid
The following qualitative experiment was carried out to
determine if the citric acid decarboxylated while forming the
product when acetic anhydride was added (without any b::tse). A
helium tank was connected to a 50 ml flask which was connected
to a gas uashing bottle \·d.th a fritted disk stopper. The
bottle was connected to a 11 U11 -tube of LiOH to keep air from
entering the system. A Ba(OH)2 solution Has prepared as
follows: Ba(OH)2 was added to 20 ml water until saturated.
The solution i:as filtered and the clear filtrate added to the
gas 1.-Tashing bottle l'!hich had previously been flushed with dry
helium. Citric acid (500 mg) and 30 ml acetic anhydride were
added to the flask and flushed b1mediately ·with helium. A
positive test fer co2 ·,·;as obtained. A blank consisting of
acetic anhydride alone, was added to the flask and flushed
with helium. No precipitate uas observed. These facts indi
cate th::i.t citric acid decarbo:xylates 1·rhen c.:i.cetic anhydride
was added.

- 27 -
D. Isol::i.tion of the Pigment
The pigment, formed by the mixture ?,f citric acid, acetic
anhydride and pyridine, 1·;as isolated for physical tests to deter
mine the structure of the pigment.
An extraction procedure was first comtemplated. The separa
tion of the pigment from the reagents did not appear feasible
because of the solubility of the acetic anhydride. The anhy
dride 1;as soluble in benzene, toluene, chloroform, carbon
tetrachloride, acetone, ether, ethyl alcohol, and water.
Pentane and acetic anhydride were not miscible but the pigment
stayed in the anhydride.
By trial and error, it was found that if the pigment
solution v.'CJ.S added to a large amount of diethyl ether, the
pigment precipitated from solution.
When 10 gms citric acid, 30 ml acetic anhydride and 14
ml pyridine Here mixed together, the reaction i:;as e:;:othermic
and car::ion dioxide was evolved. The reaction was allO'\·red to
proceed for 30 minutes at room temperature. The covered
beaker was cooled in an ice-v;ater bath for 15 minutes and then
poured into 200 ml of diethyl ether cooled in an ice-water
bath. After 5 minutes, the precipitate ·was filtered with
filter paper using suction. Approximately 200 ml of ether was
poured over the precipitate to remove any residual acetic anhydri~-,
pyridine, or citric acid. The wet precipitate v!as 4,mmediat53_J_y
put into a vacuu.~ desiccator and evacuated to d!"Jness. If the

- 28 -
precipi V.:i.te ·was exposed to the atmosphere, the reddish brown
powder turned black in color and started to bubble. After de-
composition, the black residue had a shiny, glossy appearance
with some bubble shapes intact. When examined closely, the
residue appeared like a very thin piece of black glass that
was shattered.
The sodium salt of the pigment was prepared several
times. Sodium hydroxide pellets were substituted for pyridine
and the precipitate was isolated as stated above. The sodium
salt was more sensitive to moisture and/or air and appeared I
only slightly soluble in acetic anhydride when an attempt was
made to regenerate the original color in solution. Further
sodium salt isolations >·rere discontinued.
Because of the heat evolved during the reaction when the
reagents 1·;ere mixed to form the pigment, the temperature was
observed {See Figure 13) as the reaction time progressed. At
1.5 minutes, the solution appeared to have been boiling. The
temperature at this time was 59°C. Because of the relative-
ly high boiling reagents used, the bubbles ·were apparently
carbon dioxide.
E. Infrared Spectrum of Pigment
The pigment was isolated {See Section VI, D) and dried
before obtaining the IR spectrum. Figure 14 shows the spec-
trUt~ obtained using a KBr pellet.
l_

Figure 13
Temperature of the Reaction
Conditions: 10 grams citric acid 30 ml Ac20 15 ml pyridine

r-1 r-1
0 r-1
°'
co
.......
\0
I/)
"'"
- ('I')
......... ..-............. .....: .......... ,..... ...... =-11,,._o/m;:E'!l;c~=-oz:l:oaz:"""11!is>a--...i...--.....i ........... ..i-.,,...,....,;J,,.r::!=!i=:z::mz:.!::mc,.....~c:
o 0 0
·r-1
0 O'\
0 00
L _________________________________________ --·
0 I/)
0 N
0 r-1
,..... Cll ~ -1.J
g •.-l s ~
~ H H
- 29 -
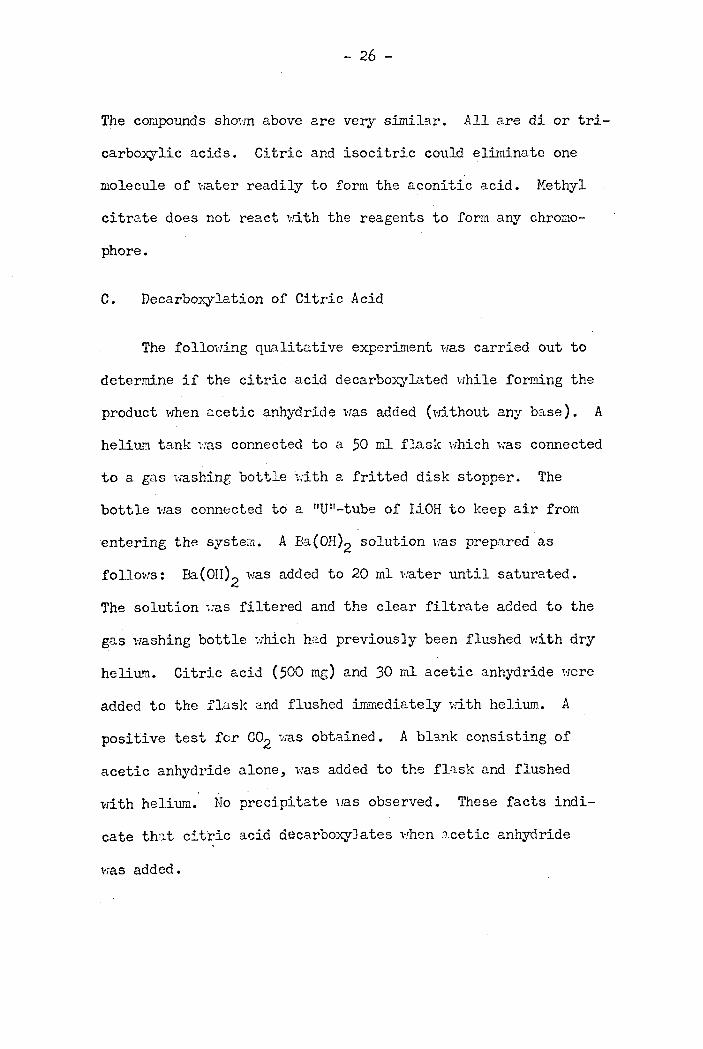
TABIE VI
Wavelength and Frequency.Maxima of IR Spectrum
Wavelength (microns)
2.90 3.25 5.62 5.72 6.20 6.50 6.70 7.10 7.26 7.48 8.00 8.32 8.58 8.90 9.38 9.82 9.92 .
11.03 12.82 13.35 14°74
Frequency (cm-1)
3425 3077 1779 1748 1613 1538 1493 1408 1377 1337 1250 1202 1165 1124 1066 1018 1008
907 780 749 678
The following assignments of IR absorption bands were
taken from Silverstein and Bassler (51) and Bellamy (4).
The absorption at 6.70, 13,35, and 14.74 microns are
pyridine bands. With knovm pyridine, the 14.74 band was at
14.25 microns. The carboxylate anion absorbs at 6.50 and
7.10 microns. The carbonyl bands (at least 2 possibly 3 or
4) absorb at 5.62 and 5.72 microns vd.th inflection points
at 5. 54 and 5. ?8 microns. Double bond character vras evident
by observing bands at 6.20, 10.08, and 11.03 microns. The
carbonyl bands in conjunction with the bands at 8.00 and

Figure 14
Infrared Spectru.~ of the Pigment
KBr Pellet

FREQUENCY (CM.)
, .. ::(\J\) ~000 'l.500 2000 18CO '.600 1400 1200 1000 950 900 850 800 750 700 -~. - --=-=·-~ -:_:_· -~~~~ =~__L=-_7-)--------~ ---= ---i ----·-"
-·-----~=~~-~=t !- ~,~~-~~~- - T--~-- ~~=t~ i_ I
I -I I I i I -- 1---- I I ! A-!----1 ; : I~ I I . ·" I ' ' I I
'
----r·--··
\ /\ / ___ . __ .. ,-- -- -
__ T ___ -j--1? __;_ !__: -· ; •• -.. -, I. i i. __l ..
I v· : ·•-····-,-- ! I -r '· --:--- '. : _Ji ~ . . ' - I ' _!.___
I I --'.----. I --- I ; -\ ----L--·-·,. I .'o I
l I ---
l I . "l I I . • :r I
I ,---f--
1 _ _J __ _ I _ _j_
20 :·n
·- -·- -L i·--1-- - r·. --1-. --·-· -1----I- ·---... ---1----·-----· I
··- ·• - ·-I - ·- 1-·-
J- -+--1--+-!--1- -1--+---l ·--r--I-- -!--l---!--+-+-·-0 I ' -- _J ___ :-----~- -- •
I \-- -:-1---;---· I
--·r-- - ____ j . ·-·· l-o 0
I I I I l THE PEkKJN- ELMER CO:.!.-. N·0Rw.A1.K. en
12 13 11 7 8 9 WAVELENGTH (MICRONS)
14 10 15 6 5 4 3

- 30 -
11.03 microns indicate a conjugated cyclic anhydride. The
band at 8.00 microns in conjunction with the carbonyl strong
ly suggested an acetate group. The bands at 2.92 and 6.20
microns were '"'8.ter from the KBr. The compound appeared to be
a pyridine salt of an unsaturated, acetylated cyclic anhydride
acid.
F. Degradation of the Pigment---Analysis by Mass Spe~trometer
The vapor pressure of the pyridine salt pigment was not
sufficiently high to obtain a spectrum of the compound. A
relatively large amount of the pigment i·:as placed in a glass
tube connected to the inlet of the mass spectrometer. The
purpose of the experiment was to heat the pigment and analyse
the gases evolved. The pigment was pumped do-vm and 10 minutes
later, a sample was taken. The first run showed a sm'lll amount
of carbon dio.xide (m/e 44) and larger amounts of pyridine
(m/e 79) and acetic acid (m/e 60). The pigment ~·;as evacuated
for 1 hour to eliminate all of the gases. The pigment ~·ras
then heated with a heat gun and a gas sanple removed for analy
sis. This second run shm·rnd an abundance of pyridine. ~
carbon dioxide ~ acetic acid. After all the gases 1·;ere vented
from thlj pigment, the sa"Icple was heated again .?.nd an aliquot
of the gcsec taken. This third spectrum showed the amount
of carbon dioxide:?'pyridine ~acetic acid.
No m/e above 80 was detected. The only three compounds
found by.degradating the pigment were acetic acid, carbon

- 31 -
dioxide and pyridine.
G. :NHR Analysis
Figure 15 shows the NHR analysis for the pigment. The
solvent used was deuterated dimethyl sulfoxide. The peak at
1.92 ppm was due to an acetyl group. The broad peak between
2.00 and 2.45 was due to methylene groups. All of the peaks
past 8.00 ppm were attributed to pyridine. The peaks at 0.00
ppm and 2.54 should be disregarded as they were due to inter
nal standard (tetramethylsilane) and solvent, respectively •.
Of the nine NMR spectra obtained on different pigments, all
were very siinilar except the ratio of the acetyl group kept
changing with respect to the rest of the spectrum. This
indicates that there was probably some free acetic acid in
the sa.TJ1.ple as a decomposition product (suggested by MS analy
sis). There were no olefinic hydrogens shmm in the spectr'IE..
Several spectra vrere made vd.th deuterated water added. The
spectra were the san1e as Figure 15.
H. Melting Point of the Pigment
Sa.rnples of the pigment that were placed into melting
point tubes and heated all shoued irreversible melts. The
melting point was very difficult to observe visually because
the dark red-brovm pigment turned light black color. ·All of
the samples decomposed between 103°-ll0°C.

Figure 15
NMR Spectrmn of the Pigment
Conditions: 60 megacycle instrument interna.l standard-tetramethy lsilane solvent-deuterated dL~ethyl sulfoxide top scan offset 450 cps

l __
0 -.,;
"'"' J: .. Au 0
·-
8 8 ~-8-~ -'""i-f'4 -
0
1 '
--==-

- 32 -
FinalJ.y, a satnple vras submitted for differential thermal
analysis (DTA). The pigment 1'las heated from room temperature
to 200°C at a rate of 5°/min. No melting point was detected.
The sample decomposed on heating in air.
I. CHN Analysis
CHN analysis Has performed on the pigment produced by
the addition of citric acid, acetic anhydride, and pyridine.
It is believed that the pigment is a pyridine salt of an
unsaturated anhydride acid. In Table VII, each empirical
formula shown is calculated on the assrnnption that one mole
cule of pyridine is present per molecule of pigment.
TABIE VII
Found Empirical Formula-Pyridine(C5H5N)
c H N O(by difference)
56.41 2.53 2.48 38.58 C2i.5H9014
56.36 2.42 2.21 38.58 C24.5H10°15.5
57.32 2.86 ~.32 37.50 C24H120U
57.42 3.07 2.77 36.74 C19H10°1i.5
55.30 3.47 3.40 37.83 C14H9010
57.16 3.09 2.71 37.04 C19.5H11°12
54.89 3.25 3.07 38.79 C16H10°n
56.42 3.47 3.08 37.03 C16Hll 010. 5

- 33 -
All of the above data ·were made on independent pigment
preparations. The first four -were made using benzene and ~>
toluene as solvents for precipitating the pigment. It had
been observed later that residual traces of benzene are diffi-
cult to remove using a vacutLm plLmp. In the last four analyses,
diethyl ether i·ras used to precipitate the pigment. This sol-
vent gave better yields and there was less chance of contami-
· nation because of the solubility of pyridine, acetic anhydride,
acetic acid, and unreacted citric acid in ether. (The prepa.ra-·-
tion of the pigment used in the last four am.lyses is found
in section VI, D). The last two analyses in the CHN table
were determined nine months apart on newly precipitated pig-
ments. There appears to be a fairly good check.
The !l'.ethod used to determine the CHN analysis was checked
by sublT'i t ting a kn01m pyridine oxalate. The results were:
Calcd. for c7H7No4: C, 49.70; H, 4.18; N, 8.28; O, 37.83
Found C, 48.47; H, 4.08; N, 7.98; O, 39.47
J. Other Ex~erimental Observations
Several other techniques were used for analysing the
pigment and/or its reaction products.
Colu..11n chromatography 1-:as used to purify the pigment.
Alwninum and silica oxide colwnns were used with several
solvent systems. In all cases the pigment turned black in
color and decomposed 1-2 cm. dm·m the column.

- 34 -
Because the NMR, HS, and IR suggest an acid and anhydride,
an attempt >·ras made to make the esters of the deco'11position
products. The pigment ·was added to water, made basic with
sodium hydroxide, and evaporated to dryness an a steam bath.
The residue was used to prepare the methyl esters of the acids
present, using the procedure of Harvey, Hale and Ikeda (19).
Only one ester was evident during a gas chromatographic analy
sis of the methyl esters. The ester i·1as identified by MS as
methyl acetate.
Several attempts v:ere m:i,de to determine the molecular
weight of the pigment. Because of the solubility of the
pigment in acetone and p-dioxane, the boiling point elevation
(acetone as solvent) and freezing point depression (p-dioxane
as solvent) techniques were used.
For the boiling point elevation experiment, a Beckmann
thermometer was placed in a round-bottom, tvro neck flask,
along with a reflux condenser. The top of the condenser was
fitted with a drying agent that excluded water from the system.
A heating m;:i.ntle connected to a pm·rerstat regulated the
temperature. ThE'! acetone (B.P. 56.5°C) was dried with sodiu.rn
sulfate. The molecular weight of knm·m citric acid (H.W. 192)
ranged from 322 to 951. 'rhis wide range for different concen
trations of citric acid was probably due to the extent of
association (di.'lllerization, trimerization, etc.) of the acid
. (35). To check the procedure of the molecular weight determi
nation, ethyl caproate (H.W. 144) was substituted for citric

- 35 -
acid. The experiment'll result was 185. The molecuhr ':might
of the pigment (4 determinations) ranged from 253 to 340. Some
of the pigment may have been decomposed and/or ionized by the
solvent(acetone). The freezing point depression method using
p-dioxane v;as unsuccessful because the pigment precipitated
out of the p-dioxane as the solution approached the freezing
point of 11. 7°C.
K. Experimental Data Correlation
Several general statements concerning the structure of the
pigment are presented. Because of the spectral similarities of
the reagents used to form the pigment 2nd the pigraent itself,
no definite chemical structure may be assigned. The I\l}ffi spectra
showed an acetyl group(s) with methylenes. No olefinic carbon
hydrogens were present. The IR spectra had carbonyls at higher
frequency than an acetate carbonyl. It also sho-.-:s unsaturation,
other than pyridine, as a vinyl or tetrasubstituted olefin. It
is assumed, based upon the NMR data, that a tetrasubstituted
olefin( s) v1as present. The visible spectrlliil (See Figure 1)
indicates extensive conjugation because of the 385, 405, and
550 millimicron maxima. The IR high frequency carbonyls and
the bands at 8.0 and 11.0 microns suggest an anhydride. Di-
or tricarbw::ylic acids are usually dehydrated to form anhydrides
in the presence of acetic anhydride. The CHN analysis shm-red
a very high OXIJgen content. The minimum amount of carbons

- 36 -
according to CHN analysis was 16.
Taking the above facts into consideration, it is suggest-
ed that the pigment is a pyridine salt of a small polymeric
cyclic anhydride acid with conjugation. It is possible that
one carboxylic acid group forms an anhydride with one car-
bo:xylic acid group of a different molecule of citric acid.
Another possibility is a highly conjugated ketone type acid
salt instead of an anhydride.
- 37 -
StniHARY
A method for the determination of citric acid employing
anhydrous conditions has been studied. The method was based
on the Furth-Herrmn.nn reaction of citric acid, acetic anhydride,
and pyridine. The chro:maphore produced i,;as measured spectro
photometrically at 385 millimicrons. The conditions of the
method, such as a.mount of reagents, order of reagents, effect
of i1ater, and temperature were optintl.zed for maximu.Tfl sensitivi
ty and rnini:mu.Tfl reaction time. Sixteen different acids were
substituted for citric to determine if any interfered with the
method.
A satisfactory procedure was developed to determine citric
acid and the method was applied to citric acid in cigarette
tobacco.
The pigment produced in the method was isolated. It was
found to decompose with traces of ·water and v:as soluble in
acetone, acetic anhydride, and pyridine. Visible, IR, NHR, and
MS spectra of the pigment '..rere obtained. Though the exact
chemical structure •·:as not identified, general structure types
were proposed.
In conclusion, a method for the determination of citric
acid in the 0-60 microgram range was developed. A procedure
was developed to isolate the pigment formed by the Furth
Herrmann reaction. The pigment was characterized by several
spectral techniques and general structures proposed.

1.
. 2.
3.
. 6.
?.
8.
9.
10.
11.
12.
1.3.
- 38 -
BIBLIOGRAPHY
Arreguine, V., Rev. univ. nacl. Cordoba, 7, 7 (1941); C.A. 'J§.:40597.
Babad, J. and Shtrikman, N., J. Dai!7 Research, 18, 72 (1951).
Beecher, G., Kastenschmidt, L., Hoekstra, W., Cassens, R., and Briskey, E., J. Avg. Food Chem., 17, 29 (1969); C.A. 7Q:45,348f. - -·- - -- -
Bellamy, L.J., "Advances in Infrared Group Frequencies", 1st Ed. , Methuen and Co. , Ltd. , Lond;on, 1968.
Bernhardt, D., Greifswald. Ha.th. Naturvriss. Reihe, 15, 185 (1966); C.A. 70:84,977. - -- -
Blazek, L. and Hvezda, O., Kozarstvi, 14, 74 (1964); C.A. 62:546lg.
Bousquet, W.F., Am. Perfurmer Cosmet, 77, .31 (1962); C.A. 59:7314g. - -
C~sares6Lopez, R., Biochem. ~., 284, 365 (1936); C.A. 30:3745 • .
Cha:m.bon., P., J'mn~ Pharm. Franc., 21, 613 (1963); C.A. 60:2030h.
Choy, T.K., Quattrone, J.J., Jr., Elefant, M., Anal. C~. Acta., 29, 114 (1963).
Crisan, I.A., Krausz, R., Ser. Chem. 12, 19 (1967); C.A. 68:9196c.
Draganic, Z.D., Anal. Chim. Acta., 28, 394 (1963) •.
Elving, P.J. and Van Atta, R.E., Anal. Chem., 26, 295 (1954). ~
- 39 -
14. Frantzis, N., U.S. Patent 3,425,920, February 4, 1969; C.A. 70:111,182a.
15. Furth, O. and Herrmann, H., Bioche~· Z., 280, 448 (1935).
16. Gedalia, I., A zaz, B., and Schmer ling, M., iG Dent. Res. 48, 105 (1969); C.A. 70:85,467a.
17. Godin, P., Chemist!7 and Industry, November 13, 1954, p. 11+24 .•
18. Hae, L.R., Freeman, S., and Nock, W., Amer. J. Physiol. 216, 179 (1969); C.A. 70:36,27Ja. -- - -
19. Harvey, H.R., Hale, R.W., and Ikeda, R.H., Tob. Sci., 14, 141 (1970).
20. Hartford, C.G., Anal. Chem. 34, 426 (1962).
21. Herrera, E. and Freinkel, N., Biochim. Biophys. Act8:., 17.Q, 244 (1968); C.A. 70:45,303n •
. 22. Higgins, H. and Von Brand, T., Anal. Bioche~., 15, 122 (1966).
23. Japikse, C.H., U.S. Patent 3,425, 843, February 4, 1969; C.A. 70:114,013g.
24. Johnston, F .B. and Hanunill, H.M., Can. Inst. Food Technol. J., 1, 3 (1968); c.A. £§:86,257c.
25. Karklins, R., Agafonova, V. F., Sin. Biol. Vazhn. Veshchestv, 49 (1967); C.A. 70:95,1~0&·1. - -- .
26. Keller, H.M., U.S. Patent 3,210,198, October 5, 1965; C.A. 63 :17 ,Oh6a_.
27. Korotchenko, K.A., Stanimirovich, S.G., and Stanimirovich, D.L., Prikl. Biokhim. ~likrobiol., 4, 721 (1968); C.A. 7Q_:59,110j.
28. Lang, \rT. and Frank, H.P., Austrian Pa tent 232, 180, March 10, 1964; C.A. 60:13,380a
29. LindCl_vist, B., Acta. Chem. Scand., 16, 1794 (1962); C.A. 58:952c.
30. Loury, M. and Forney, M., Rev. Franc. Corps Gras, l~, 647 (1965); C.A. ~:6,919d. -

31.
32.
33.
34.
35.
. 36.
37.
38.
39.
40.
41.
42.
45.
46.
47.
- 40 -
Marier, J.R. and Boulet, M., ~·Dairy Sci., 41, 1683 (1958).
:V.ia.rier, J.R. and Boulet, M., J. Dairv Sci., 43, 1414 (1960) • cc>
Matthias, W. and Schmidt, R.D., ~ Chromatog., 27, 326 (1967).
V.ia.yer, K. and Pause, G., Mitt. Gebiete Lebensm. !kg., 5~, 454 (1965); C.A. 65:14,088.
Moore, W.J., "Physical Chemistry 11 , 3rd FAi., p. 132, Prentice-Hall, 1963 •
Nekhorocheff, J. and Wajzer, J., Bull. Soc. Chim. Biol., 22,, 695 (1953); C.A. 48:3850e.
Ohlson, R., Persrna.rk, U. and Podlaha, O., J. Am. Oil Chemists' Soc., 45, 475 (1968). - -
Pucher, G.W., J. Biol. Chem., 153, 133 (1944).
Pucher, G.W., Sherman, C.C. and Vickery, H.B., J. Biol. Chem., 113, 235 (1936).
Ra.snick, F.D., French Patent 1,514, 571, ¥.arch 16, 1966; C.A. 70:70,822p.
Reinart, A. and Nesbitt, J.M.,~ Dairy Sci., 40, 1645 (1957).
Resnik, F.D., Lee, L.A., and Powell, W.A., Anal. Chem., 27, 928 (1955).
Ro.eder,4G., ~·Am. Pharm. Assoc., .30, 74 (1941); C.A.
22.:3560 • .
Saenko, N .F. and Sakharova, T .A., Vinodelie i Vinogradarstvo SSSR, 26, 6 (1966); C.A. 64:16,583b. -- --- --Safi'ran, 1.J:. and Denstedt, O., J. Biol. Chem., 175, 849 (1948). - - - -
Sax, N. I., ~ 1Dangerotis Properties of Industrial Materials 11 ,
p. 1067, 3rd. F..d., Reinhold Publishing Corp., 1968.
Schmadel, E. and Kling, W., s. African Patent 6,706,929, May 20, 1968; C.A. 70:107,728r.

48~
49.
50.
51.
52.
53.
54.
55.
·- 41 -
Seto, K., Yokoham~ Igaku, 19, 429 (1968); C.A. 70: 104,156s.
Shpilev, F.S., Ogoleva, V.P. and Rautkina, V.I., Tr. Dagestansk. Sel's Kokhoz Inst., }-4, 37 (1965); C.A. 65:1,46lc.
Sigmon, H.W., Private Co1mnunication, Unpublished report from Ecusta Paper Division, Olin Co., July, 1963.
Silverstein, R.H. and Bassler, G.C., "Spectrometric Identification of Organic Compounds", 2nd Ed., John Wiley and Sons, Inc., N.Y., 1968.
Valentinis, G., Sci. Aliment, 2, 128 (1963).
Vickery, H.B., Pucher, G.W. and Wakeman, J.D., Ind. Eng. Chem. Anal. Ed., 6, 140 (1934). -- --- -- -- -White, J.C.D. and Davies, D.T., i!..! Dairy Sci., 30, 171 (1963).
Wucherpfennig, K. and Bretthauer, G., Deut. LebensmRundschau, 5Q, 190 (1962); C.A. 5_Z:l7,152f.
1~1\. ~ .-, ............ -~.,., ~.~ . .._._ -- .... · .. . I
~ ~ .. I. ;. ' - ...... ~ J ..

NAME:
BIRTH DATE:'
EDUCATION:
EXPERIENCE:
SOCIETIES:
PUBUCATION:
- 42 -
AUTOBIOGRAPHY . '
Russell Kent Olland
June 29, 1941
B.S. - University ~f Richmond - 1964
Junior Research Chemist - American Tobacco Co., Department of Research and Development, Hopewell, Virginia - June 1964 to present Editor - THE BULIETIN - Virginia Section of the American Chemical Society
American Chemical Society, American Institute of Chemists, Virginia Academy of Science
Olland, R.K., Glock, Eugene, Bodenhamer, N.L., 11A Simple Technique for Trapping Gas Chroma.to-. graphic Samples From A Capillary Column for Mass Spectrometry Or.Rechromatography on Another Column", J. Chroma tog. Sci. 1., 187 (1969)