A Study of Secondary Science Teacher Efficacy and Level of ...
205
Marshall University Marshall Digital Scholar eses, Dissertations and Capstones 1-1-2013 A Study of Secondary Science Teacher Efficacy and Level of Constructivist Instructional Practice Implementation in West Virginia Science Classrooms Amanda Kristen Knapp [email protected] Follow this and additional works at: hp://mds.marshall.edu/etd Part of the Instructional Media Design Commons , Junior High, Intermediate, Middle School Education and Teaching Commons , Science and Mathematics Education Commons , and the Secondary Education and Teaching Commons is Dissertation is brought to you for free and open access by Marshall Digital Scholar. It has been accepted for inclusion in eses, Dissertations and Capstones by an authorized administrator of Marshall Digital Scholar. For more information, please contact [email protected]. Recommended Citation Knapp, Amanda Kristen, "A Study of Secondary Science Teacher Efficacy and Level of Constructivist Instructional Practice Implementation in West Virginia Science Classrooms" (2013). eses, Dissertations and Capstones. Paper 472.
Transcript of A Study of Secondary Science Teacher Efficacy and Level of ...
Marshall UniversityMarshall Digital Scholar
Theses, Dissertations and Capstones
1-1-2013
A Study of Secondary Science Teacher Efficacy andLevel of Constructivist Instructional PracticeImplementation in West Virginia ScienceClassroomsAmanda Kristen [email protected]
Follow this and additional works at: http://mds.marshall.edu/etdPart of the Instructional Media Design Commons, Junior High, Intermediate, Middle School
Education and Teaching Commons, Science and Mathematics Education Commons, and theSecondary Education and Teaching Commons
This Dissertation is brought to you for free and open access by Marshall Digital Scholar. It has been accepted for inclusion in Theses, Dissertations andCapstones by an authorized administrator of Marshall Digital Scholar. For more information, please contact [email protected].
Recommended CitationKnapp, Amanda Kristen, "A Study of Secondary Science Teacher Efficacy and Level of Constructivist Instructional PracticeImplementation in West Virginia Science Classrooms" (2013). Theses, Dissertations and Capstones. Paper 472.

A STUDY OF SECONDARY SCIENCE TEACHER EFFICACY AND LEVEL OF CONSTRUCTIVIST INSTRUCTIONAL PRACTICE IMPLEMENTATION IN WEST
VIRGINIA SCIENCE CLASSROOMS
A dissertation submitted to
the Graduate College of
Marshall University
In partial fulfillment of
the requirements for the degree of
Doctor of Education
in
Curriculum and Instruction
by
Amanda Kristen Knapp
Approved by
Dr. Ronald B. Childress, Committee Chairperson
Dr. Edna Meisel
Dr. Lisa A. Heaton
Dr. William Capehart
Marshall University
May 2013

ii
©2013
Amanda Kristen Knapp
ALL RIGHTS RESERVED
iii
DEDICATION
This work is dedicated to my grandparents, James and Eva Coleman who have
tirelessly encouraged my pursuit of higher education, though neither had the opportunity
to pursue it themselves. Both attended school in grades 1-8 in the one-room school
houses of Putnam County. My grandmother’s formal education ended after grade eight
as she was not able to attend high school due to lack of bus routes in the area and no
funding to allow her to board in town. My grandfather began high school but was drafted
into the Korean War before completing his senior year. Despite these hardships the
importance of education was impressed upon them at a young age and they have
supported the efforts of their family members to pursue life-long learning. Without their
support this work would not have been possible.
This work is also dedicated to my parents, Edward and Patricia Knapp, whose
support of education is an inspiration. Their hardworking example and devotion to the
cause of education have inspired both their biological children and the students of Leon
Elementary School, where they worked for many years as custodian and secretary, to
pursue their dreams.

iv
ACKNOWLEDGMENTS
My doctoral committee members are a wonderful group of people who have
supported me throughout the dissertation process as I struggled to juggle writing and a
full-time teaching position. For their support and encouragement I offer my gratitude:
To Dr. Ronald Childress, my chair, many thanks for assuming the role of my
doctoral committee chair, giving me direction and guidance in writing, a framework for
shaping my thoughts, modeling questioning techniques, focusing on the true meaning of
questions, and challenging me to consider all of the possibilities for discovery research
holds. I extend my deepest gratitude to Dr. Childress for sharing his wisdom and
expertise.
To Dr. Edna Meisel, committee member, sincere thanks for your support
throughout this process, your statistical expertise, and for focusing my research on the
area of greatest need and benefit to the students. Your insight and support during the
reorganization of the work was invaluable.
To Dr. Lisa Heaton, committee member, special thanks for your willingness to
join my doctoral committee on late notice, for providing fresh insight and advice to the
work, for much needed editorial advice, and invaluable technical support.
To Dr. William Capehart, committee member, much thanks for your heartfelt
support and encouragement throughout this process, reviewing numerous drafts of the
document, encouragement to pursue the study as thoroughly as possible, and numerous
pep talks.
v
TABLE OF CONTENTS DEDICATION ................................................................................................................... iii
ACKNOWLEDGMENTS ................................................................................................. iv
LIST OF TABLES ........................................................................................................... viii
ABSTRACT ........................................................................................................................ x
CHAPTER 1: INTRODUCTION ...................................................................................... 1
Issues in Science Education Today: Instructional Practices ........................................... 3
Framework: Traditional and Constructivist Instructional Practices ............................... 4
The Face of West Virginia’s Student Population ............................................................ 6
Teacher Efficacy ............................................................................................................. 8
Statement of the Problem .............................................................................................. 10
Research Questions ....................................................................................................... 11
Operational Definitions ................................................................................................. 12
Significance of the Study .............................................................................................. 15
Delimitations of the Study............................................................................................. 17
CHAPTER 2: LITERATURE REVIEW ......................................................................... 18
Instructional Practices in Science Education ................................................................ 18
Traditional Instructional Practices ................................................................................ 21
Constructivist Instructional Practices ............................................................................ 24
School Factors and the Use of Constructivist Strategies/Efficacy ................................ 35
Class Size ................................................................................................................... 35
Years of Teaching Experience ................................................................................... 37
Socioeconomic Factors .............................................................................................. 39
Advanced Placement Programming .......................................................................... 47
Teacher Efficacy ........................................................................................................... 52
Summary ....................................................................................................................... 63
CHAPTER 3: RESEARCH METHODS ......................................................................... 65
Research Design ............................................................................................................ 65
Population and Sample .................................................................................................. 66
Instrumentation.............................................................................................................. 67
Reliability and Validity ................................................................................................. 69

vi
Data Collection .............................................................................................................. 71
Data Analysis ................................................................................................................ 72
Limitations .................................................................................................................... 74
CHAPTER 4: FINDINGS ................................................................................................ 75
Data Collection .............................................................................................................. 75
Participant Characteristics ............................................................................................. 76
School Characteristics ................................................................................................... 78
Findings ......................................................................................................................... 79
Levels of Use of Selected Constructivist Instructional Practices .............................. 79
Levels of Use Based on Demographic Variables ...................................................... 83
Teacher Efficacy Levels .......................................................................................... 102
Efficacy in Student Engagement ............................................................................. 104
Efficacy in Instructional Practice ............................................................................ 105
Efficacy in Classroom Management ........................................................................ 107
Teacher Efficacy Levels Based on Demographic Variables ................................... 108
Relationship between Efficacy Level and Constructivist Practice Use ................... 116
Findings from Follow-Up Interviews ...................................................................... 119
Instrument Reliability .............................................................................................. 124
Summary of Findings .................................................................................................. 128
CHAPTER 5: CONCLUSIONS, IMPLICATIONS, & RECOMMENDATIONS ....... 131
Purpose of the Study ................................................................................................... 131
Population.................................................................................................................... 132
Methods ....................................................................................................................... 132
Summary of Findings .................................................................................................. 134
Conclusions ................................................................................................................. 136
Primary Research Questions .................................................................................... 136
Interview Findings ................................................................................................... 138
Instrument Reliability .............................................................................................. 139
Discussion and Implications........................................................................................ 140
Recommendations for Further Research ..................................................................... 151
REFERENCES ............................................................................................................... 154

vii
APPENDICES ................................................................................................................ 166
Appendix A: Instrument ............................................................................................. 166
Appendix B: Permission E-mails ............................................................................... 173
Appendix C: Phone Interview Questions ................................................................... 175
Appendix D: Principal Initial Contact and Reminder E-mails ................................... 176
Appendix E: IRB Stamped Consents (Online and Verbal) ........................................ 178
Appendix F: Initial IRB Approval Letter ................................................................... 180
Appendix G: Sample Size Calculations ..................................................................... 181
Appendix H: Pearson Product-Moment Correlations between Total Efficacy, ESE, EIP, & ECM and the Sixteen Constructivist Instructional Practices .......................... 182
Appendix I: Co-Investigator CV ................................................................................ 183
Appendix J: Phone Interview Analysis ...................................................................... 186
viii
LIST OF TABLES
Table 1: Subjects Taught by Participants and Years of Teaching Experience…………..77
Table 2: School Demographics…………………………..…………………………………….78
Table 3: Level of Use of Selected Constructivist Instructional Practices by Secondary Science Teachers………………………………………………………………………………….82
Table 4: Mean Differences between School Level and Level of Use of Constructivist Instructional Practices (Individual and Total)……………………………………………….84
Table 5: Mean Differences in Level of Use of Constructivist Instructional Practices Based on Total Years of Teaching Experience……………………………………………….86
Table 6: Mean Differences in Level of Use of Constructivist Instructional Practices Based on Year of Teaching Science……………………………………………………………89
Table 7: Mean Differences between AP and No AP Instruction and Level of Use of Constructivist Instructional Practices (Individual and Total)……………………………..92
Table 8: Mean Differences between School SES Level and Level of Use of Constructivist Instructional Practices (Individual and Total)………………………………………………94
Table 9: Mean Differences between School Size (A, AA, AAA) Based on Level of Use of Constructivist Instructional Practices (Individual and Total)………………………….....97
Table 10: Mean Differences between Size of Typical Science Classes Based on Level of Use of Constructivist Instructional Practices (Individual and Total)……………………100
Table 11: Teacher Efficacy in Student Engagement by Secondary Science Teachers…………………………………………………………………………………………..105
Table 12: Teacher Efficacy in Instructional Practice by Secondary Science Teachers…………………………………………………………………………………………..106
Table 13: Teacher Efficacy in Classroom Management by Secondary Science Teachers…………………………………………………………………………………………..107
Table 14: Mean Differences in Total and Sub-score Efficacy Levels Based on School Level..……………………………………………………………………………………………..109
Table 15: Mean Differences in Total and Sub-score Efficacy Levels Based on Total Years of Teaching Experience…………………………………………………………………110
Table 16: Mean Differences in Total and Sub-score Efficacy Levels Based on Years of Teaching Science……………………………………………………………………………….112
Table 17: Mean Differences in Total and Sub-score Efficacy Levels Based on AP Instruction………………………………………………………………………………………113

ix
Table 18: Mean Differences in Total and Sub-score Efficacy Levels Based on School SES………………………………………………………………………………………………...114
Table 19: Mean Differences in Total and Sub-score Efficacy Levels Based on School Size………………………………………………………………………………………………...115
Table 20: Mean Differences in Total and Sub-score Efficacy Levels Based on Class Size………………………………………………………………………………………………..116
Table 21: Pearson Product-Moment Correlations between Total Level of Use of Constructivist Practices, Total Efficacy, and Three Efficacy Sub-scores……………….118
Table 22: Cronbach’s Alpha Values for Individual Items and Total Constructivist Practice Implementation………………………………………………………………………125
Table 23: Cronbach’s Alpha Values for Individual Efficacy Prompts and Total Efficacy…………………………………………………………………………………………..126
Table 24: Cronbach’s Alpha Values for ESE, EIP, and ECM…………………………..127
x
ABSTRACT
The purpose of this study was to investigate the level of use of selected
constructivist instructional practices and level of teacher efficacy in West Virginia
secondary science classrooms. The study next sought to determine if a relationship
existed between level of use of the constructivist practices and teacher efficacy. In
addition the study sought to determine if differences existed in level of use of the selected
constructivist practices and/or teacher efficacy based on selected demographic variables.
The study was a mixed-methods design. First, a researcher-developed survey
instrument was used to collect data regarding the level of use of constructivist
instructional practices. Efficacy data were collected using an adapted (with permission)
version of the Teacher Self-Efficacy Scale (TSES) by Tschannen-Moran, Hoy, and Hoy
(1998). The study population consisted of secondary science teachers (middle, junior, and
high school) in the state of West Virginia. The last survey question allowed educators to
volunteer for a short follow-up interview to clarify the quantitative data.
Overall, West Virginia science teachers reported frequent use of the selected
constructivist instructional practices. Few significant differences were found based on
the selected demographic variables. West Virginia science teachers reported moderately
high efficacy levels. Few significant differences were found based on selected
demographic variables. A moderate but significant correlation was found between
teacher efficacy level and the level of use of the selected constructivist practices. The
follow-up interviews clarified concepts and revealed barriers to implementation of new
practices in the science classroom.
1
A STUDY OF SECONDARY SCIENCE TEACHER EFFICACY AND L EVEL OF
CONSTRUCTIVIST INSTRUCTIONAL PRACTICE IMPLEMENTATIO N IN
WEST VIRGINIA SCIENCE CLASSROOMS
CHAPTER 1: INTRODUCTION
Teacher efficacy and implementation of appropriate teaching practices play
critical roles in the classroom and can have a powerful influence on student achievement.
Nowhere is student achievement more important than in science classrooms. The
National Research Council, National Science Teachers Association, American
Association for the Advancement of Science, Achieve, and 20 participating states,
including West Virginia, are in the process of creating Next Generation Science
Standards (Next Generation Science Standards, 2011). These new standards must be
implemented using appropriate constructivist instructional practices in order to improve
student learning. Teacher efficacy level may play a significant role in the selection of
instructional practices and ultimately the success of science teaching standards.
Consequently, differences in level of teacher efficacy and level of use of selected
constructivist instructional practices in the science classroom become paramount.
Increasing course rigor for all students is an integral part of enhancing science
education for the 21st century, and the new standards strive to provide a rigorous, well
rounded course experience by incorporating input from a diverse group of stakeholders:
K-12 educators, higher education representatives, policy makers, the scientific
community, and the business community (Next Generation Science Standards, 2011).
With the creation of new standards, appropriate standards-based instructional practices

2
must be chosen by science teachers. According to the National Science Teachers
Association (NSTA), science instructors should incorporate a variety of instructional
practices based on a constructivist theoretical framework to meet science standards
(NSTA Position Statement: Leadership in Science Education, 2011).
As students from a variety of backgrounds and levels of preparedness enter the
science classroom, the instructional practices used to reach students in the classroom may
need to change. An increasingly diverse student population requires 21st century skill
sets to be successful and competitive in the future. As student diversity and the demand
for a more highly skilled workforce increase, educators must implement appropriate
practices to meet student needs and rise to the challenge of providing students with
science skills for success. It is necessary to understand current levels of constructivist
practice implementation to determine how to proceed.
Educators have a broad range of instructional practices from which to choose
(Paek, Ponte, Sigel, Braun, & Powers, 2005). Traditional behaviorist practices may not
be appropriate for all subpopulations. The NSTA recommends the use of constructivist
practices such as inquiry learning, problem solving, and cooperative leaning (NSTA
Position Statement: Leadership in Science Education, 2011); however, all science
educators may not believe constructivist practices are as effective as more traditional
methods. In addition, teachers may feel they are unable to execute constructivist
practices as well as those practices with which they have more experience. Therefore, in
order to improve science instruction for modern demands, we need to determine current
levels of use of constructivist instructional practices in science classrooms, current
science teacher efficacy levels, and examine relationships between the two constructs.
3
Teacher efficacy is the teacher’s belief in his/her ability to organize and
implement actions in the classroom (Bandura, 1997). Therefore, teacher efficacy could
play a significant role in the selection of instructional practices in the science classroom,
which can significantly affect learning outcomes for various student populations. In
addition, a sizeable population of low socioeconomic students (low SES) are part of the
overall student demographic of the state and may require constructivist instructional
practices for success. Teacher efficacy is positively correlated with instructional practice
implementation in the classroom (Tschannen-Moran, Hoy, & Hoy 1998), and
consequently student achievement. The results of a study of West Virginia science
teachers’ level of constructivist instructional practice implementation, and the
relationship, if any, to teacher efficacy could be beneficial when choosing instructional
practices to meet the standards and needs of a 21st century student population.
This study sought to determine current levels of implementation of selected
constructivist instructional practices in West Virginia science classrooms, current levels
of West Virginia science teacher efficacy, and the differences, if any, between teacher
efficacy level and the level of use of selected constructivist practices. This information
will provide educators with the knowledge to make sound decisions regarding
instructional practices now and in the future
Issues in Science Education Today: Instructional Practices
Improving instructional practice can greatly improve student performance (Bybee,
Taylor, Gardner, Van Scotter, Powell, Westbrook, & Landes, 2006). The authors
stressed the importance of utilizing research-based practices in the classroom to facilitate

4
student mastery of science content. The authors explained that practices must have
certain characteristics to be successful in the science classroom. For example, practices
must engage students in learning, build upon students’ prior knowledge, have a relevant
context and framework, and be organized appropriately. Ultimately these practices must
lead students to define goals and monitor progress in attaining the goals. At the same
time the instructor has great responsibility in choosing practices to support this learning.
Teachers must accurately assess student needs and choose practices to support learning
and challenge thinking. Subject matter must be taught in depth and misconceptions
cleared up immediately via a focus on metacognitive skills (Bybee et al., 2006).
Barak and Shakhman (2007) examined issues in science instructional practices
and found that "science teaching must be shifted from traditional schooling to more
constructivist oriented instruction" (p. 11). The authors listed critical thinking, problem
solving, independent study, and decision making as skills that must be fostered if science
education is to meet student needs. The authors also listed inquiry learning,
collaboration, and personal belief as components for successful learning in science.
Barak and Shakhman (2007) contrasted a constructivist instructional practice
framework with a traditional approach. In the constructivist framework the instructor
shares decision making, teaches students how to analyze their own thinking, and instructs
in problem solving. In contrast educators from a traditional framework make the
classroom decisions and focus on learning facts and principles.
Framework: Traditional and Constructivist Instruct ional Practices
Instructional practices play an important role in every classroom and influence
student learning in a variety of ways. Paek et al., (2005) described successful teachers as

5
those who utilize a variety of instructional practices. These practices can be classified
into two basic categories: traditional and constructivist. According to the authors,
traditional practices stem from a behaviorist theoretical framework which contrasts
sharply with the constructivist framework. Because the selection of appropriate
instructional strategies is critical for student success, it is important to understand and
characterize both theoretical frameworks.
Behaviorism is a theoretical approach that focuses on observed behaviors with the
goal of behavioral change (Woolfolk, 2010). Behavioral learning occurs when a behavior
is strengthened or reinforced to encourage its utilization using a reward or other positive
stimulus, or weakened to discourage utilization via a punishment or negative
consequence. According to Woolfolk, examples of behaviorism in the classroom include
the teacher providing instruction before an assignment, cueing, prompting, shaping,
positive practice, reprimands, response costs, cautions, punishments, and social isolation.
Emphasis is placed on learning a large amount of material. This theoretical approach
results in a teacher-centered classroom utilizing practices such as direct instruction,
lecture, teacher-led discussion, and assessment via multiple choice paper-pencil tests
(Paek et al., 2005).
In contrast, the constructivist theoretical framework is student centered.
Constructivist learning originates from the learner when the instructor provides a suitable
learning environment to facilitate student-centered activities (Woolfolk, 2010). Learning
is connected to prior knowledge with an emphasis on learning for the sake of learning.
Reflection upon learning through writing, projects, portfolios, and other strategies is
important.

6
Constructivism itself can be based upon the work of Piaget in which the focus lies
on the psychology of the individual and his/her knowing, or based upon the work of
Vygotsky with a focus on society/culture and skills developed through interaction within
these structures (Woolfolk, 2010). Instructors are not the sole source of information and
students are required to seek out knowledge and apply it for themselves. Bybee et al.
(2006) also stressed the importance of John Dewey in the development of constructivist
practices especially in the sciences. Dewey began his career as a science educator, and as
such, promoted reflective thinking based on educational experiences such as hands-on
labs and inquiry activities. Constructivist instructional practices such as cooperative
learning, presentations and other performance-based assessments, portfolios/laboratory
notebooks, writings, and independent research projects are utilized as a result of this
framework (Paek et al., 2005).
The Face of West Virginia’s Student Population
Each year the Anne E. Casey Foundation collects demographic data for each state
regarding the condition of its children. As of 2011, the year for which the most recent
data are available, WV had 384,794 citizens under age 18. Of these, 141,000 (37%) lived
below 150% of the poverty line. In 2010 (the most recent data available) 53.5% of West
Virginia’s children were eligible for free or reduced lunch. In 2011 there were 32,000
single parent families below the poverty line in West Virginia, and 44,000 children
considered to be living in extreme poverty (Anne E. Casey Foundation, 2012).
Many of these children of poverty live in homes where one or more parents work.
In 2011 there were 95,000 West Virginia children in low income working families, and
7
92,000 West Virginia children were classified as low income with housing costs
exceeding 30% of that income. In addition, 23,000 children were classified as living in
crowded housing with 90,000 children suffering food insecurity in 2011. Such conditions
can negatively affect children’s health. As of 2007, the year for which the most recent
data are available, 89,000 West Virginia children have special healthcare needs. As of
2009 there were 7.7 infant deaths per 1000 live births, 1,952 low birth weight babies, 313
very low birth weight babies, and 2,739 preterm births. As of 2007 11% of West
Virginia’s children had asthma (Anne E. Casey Foundation, 2012).
West Virginia student academic achievement is affected by low socioeconomic
conditions. In 2011, 35% of eighth graders were below basic in math and 32% were
below basic in reading. As of 2007 10% of children ages 1-5 were read to by family
members less than three days a week. In 2009, the year for which the most recent data
are available, there were 3,947 births to mothers with less than twelve years of education,
and 5,616 births to mothers who smoked. There were also 560 births to women who
received late or no prenatal care. In 2010 there were 26,000 West Virginia children (18
years old or below) without health insurance. In 2010 there were 17.6 reported cases of
child abuse or neglect per 1,000 children in the state (Anne E. Casey Foundation, 2012).
Low SES students benefit from constructivist practices (Costello, Hollifield, &
Stinnette, 1996). These authors suggested that students from low SES backgrounds and
other at-risk populations benefit from the following practices: connecting learning to
background and experiences, a variety of assessments that reflect multiple intelligences,
emphasizing both higher order thinking skills and review of basics when necessary, belief
in student ability, engaging activities, collaborative learning, connections with the

8
community, avoidance of tracking, peer tutoring, questioning, allowing students to design
and carry out their own experiments, and incorporating problem-based learning and
reciprocal teaching.
Many studies found the same types of constructivist teaching methods to be
beneficial to a variety of underserved populations (Costello, Hollifield, & Stinnette, 1996;
Keller, 2005; McKinney, Flenner, Frazier, & Abrams, 2006). Educators must be aware
of the student population demographics and the challenges they face if they are to select
appropriate instructional practices to meet the needs of West Virginia science students,
including the low SES subpopulation. The importance of constructivist instructional
strategies for students is clear. However, what role does teacher efficacy play in educator
utilization of these practices?
Teacher Efficacy
Teacher efficacy is described as a teacher’s confidence in him/herself to promote
student learning (Protheroe, 2008). Efficacy can be affected by prior teaching
experience, training, and school culture and in turn influences teaching, instructor
behavior, instructor attitude, and ultimately student outcomes (Bandura, 1993; Protheroe,
2008). Instructors with higher efficacy are more likely to be organized, plan more, try
new programming, experiment, and are more willing to try new teaching practices to
meet students’ needs (Protheroe, 2008). Trying a new strategy when old ones are not
sufficient directly influences student learning and holds important implications for
instructing a variety of learners in the science classroom.

9
Efficacy is related to school climate, administrative support, sense of community,
and decision-making structure (Tschannen-Moran, Hoy, & Hoy, 1998). The authors
described two types of efficacy. Collective efficacy plays a role in how the staff works
together and handles problems and/or change. Teacher efficacy can help mitigate the
effects of certain student characteristics such as low SES. Stronger teacher efficacy may
lead to stronger performance of low SES students even with many of the challenges
already discussed. Unfortunately, the authors also reported that a low sense of efficacy
can be contagious among staff members, undermining learning goals. If instructors do
not believe an action will produce results in the classroom, they will not invest time,
resources, or effort in the action (Bandura, 2002).
Teacher efficacy affects classroom behavior, teaching effort, and aspiration level
(Tschannen-Moran, Hoy, & Hoy, 1998). The authors proposed that teachers with higher
efficacy are more willing to implement new methods to meet student needs. In addition,
they found that teacher efficacy changes with context and can be specific to content
(science) and other situations. Efficacy can also change over time, especially in the
initial years in the classroom, stabilizing thereafter.
Teacher efficacy is associated with student motivation, educator implementation
of innovative ideas and techniques, classroom management, teaching time allotments,
and student referral to special education (Woolfolk Hoy, 2000). According to the author,
student teaching experiences and the initial teaching years are critical for strong efficacy
development. Teacher efficacy may be formed through prior teaching experiences and
events in classrooms unassociated with science coursework. These events influence an
instructor’s selection of teaching practices throughout the teaching career. Therefore a

10
measure of teacher efficacy is a critical component of understanding the selection of
instructional practices in science classrooms.
Teacher beliefs are important in the selection of instructional practices in the
classroom (Albion, 1999). Beliefs are particularly important when considering
implementation of new instructional practices. According to the author teacher belief can
be flexible and applied to new situations, which will be the case as new standards are
implemented in the science classroom.
Teacher efficacy has therefore become an important area of research in today’s
science classroom. One science teacher’s belief about his/her ability to make a difference
can have a profound effect upon dozens of students over the years. Consequently, this
study examines teacher efficacy in relation to practice.
Statement of the Problem
Research indicates implementation of constructivist instructional practices as a
powerful way to meet the needs of diverse science student populations, particularly West
Virginia’s large subpopulation of low SES students. In addition more efficacious science
instructors are more likely to implement these constructivist strategies. However a
discrepancy exists between research and practice. Appropriate instructional practices
must be implemented to meet student needs. With the variety of instructional practices
available, educators must select those they believe will be effective in the classroom. The
selection of appropriate practices becomes more critical as Next Generation Science
Standards are implemented. Because teacher efficacy level is so closely tied to level of
implementation of instructional practices in science classrooms and, as a result, student

11
outcomes, it is imperative to investigate differences between the two in West Virginia’s
science classrooms where the stakes are high for both students and staff.
This study investigated current levels of constructivist instructional practice
implementation in West Virginia science classrooms, current science teacher efficacy
levels, and the relationship, if any, between the two. Secondarily, the study sought to
determine if there are any differences in the levels of constructivist practice
implementation and teacher efficacy based on selected demographic/attribute variables.
Research Questions
The following research questions were utilized in the course of the study.
1. What are West Virginia science teachers’ levels of use of selected constructivist
instructional practices in West Virginia science classrooms?
2. What are the differences, if any, in the level of use of constructivist instructional
practices based on selected demographic variables (years of teaching, Advanced
Placement course instruction, SES level, class size)?
3. What are West Virginia science teachers’ levels of efficacy regarding teaching
science in WV science classrooms?
4. What are the differences, if any, in West Virginia science teacher efficacy levels
for teaching science based on selected demographic variables (years of teaching,
Advanced Placement course instruction, SES level, class size)?
5. What is the relationship, if any, between teacher efficacy level for teaching
science and the use of selected constructivist instructional practices in West
Virginia science classrooms?

12
Operational Definitions
During the course of this study the following operational definitions were used.
The justification for use of these definitions is examined in chapter two.
-Total Teacher Efficacy Level for Teaching Science (TELTS) - Teacher’s
confidence in him/herself to promote student learning as measured by questions
1-24 on a modified version of a self-reported survey, the Teacher Self-Efficacy
Scale (TSES) by Tschannen-Moran, Hoy, & Hoy (1998). The survey, contained
in Part III of the instrument (Appendix A) consisted of a Likart scale of 1-9 with 1
being "Nothing" and 9 being "A Great Deal" resulting in an overall score.
-Teacher Level of Efficacy in Student Engagement (ESE) for Teaching
Science – Teacher’s confidence in him/herself to promote student learning
through student engagement as measured by questions 1, 2, 4, 6, 9, 12, 14, and 22
on a modified version of a self-reported survey, the Teacher Self-Efficacy Scale
(TSES) by Tschannen-Moran, Hoy, & Hoy (1998). The survey, contained in Part
III of the instrument (Appendix A) consisted of a Likart scale of 1-9 with 1 being
"Nothing" and 9 being "A Great Deal" resulting in the factor level analysis.
-Teacher Efficacy in Instructional Practices (EIP) for Teaching Science –
Teacher’s confidence in him/herself to promote student learning through selection
of appropriate instructional practices as measured by questions 7, 10, 11, 17, 18,
20, 23, and 24 on a modified version of a self-reported survey, the Teacher Self-
Efficacy Scale (TSES) by Tschannen-Moran, Hoy, & Hoy (1998). The survey,
contained in Part III of the instrument (Appendix A) consisted of a Likart scale of

13
1-9 with 1 being "Nothing" and 9 being "A Great Deal" resulting in the factor
level analysis.
-Teacher Efficacy in Classroom Management (ECM) for Teaching Science –
Teacher’s confidence in him/herself to promote student learning through
classroom management as measured by questions 3, 5, 8, 13, 15, 16, 19, and 21
on a modified version of a self-reported survey, the Teacher Self-Efficacy Scale
(TSES) by Tschannen-Moran, Hoy, & Hoy (1998). The survey, contained in Part
III of the instrument (Appendix A) consisted of a Likart scale of 1-9 with 1 being
"Nothing" and 9 being "A Great Deal" resulting in the factor level analysis.
-School Socioeconomic Status – Overall percentage of the student body
qualifying for free and reduced lunch measured by self report question six on the
Demographics section of the survey instrument (Appendix A). Respondents
selected the category that best described the school in which they taught from the
following list: less than 35%, 36-50%, 51-75%, and 76% or more.
-Total Level of Use of Constructivist Instructional Practices (TLCIP) –
Teaching strategies derived from a constructivist theoretical framework
(Woolfolk 2010) measured by self-reported responses on the West Virginia
Science Teacher Level of Constructivist Instructional Practice Survey
(WVSTCIP). The survey, contained in Part II of the instrument (Appendix A)
consisted of a five point Likart scale for level of use with 1 being "Never Used"
and 5 being "Very Frequently Used. "
-Total Years of Teaching Experience – The number of total years of full-time
teaching the instructor had in the classroom. In this study it was measured by

14
subject response to self-report question two in the Demographics section of the
instrument (Appendix A). Respondents selected the best fit from the following
categories: 5 or less, 6-10, 11-15, 16-20, 21-25, and 26+.
-Total Years of Teaching Science Courses – The total number of years of
experience the instructor had teaching science courses. In this study it was
measured by subject response to self-report question three in the Demographics
section of the instrument (Appendix A). Respondents selected the best
description from the following categories: 5 or less, 6-10, 11-15, 16-20, 21-25,
and 26+.
-Class size – The total number of students in the average science classroom at the
school. In this study it was measured by subject response to self-report survey
question eight on the Demographics section of the survey instrument (Appendix
A). Respondents selected the best description from the following categories:
fewer than 10, 11-15, 16-20, 21-25, and 26 or more.
-School Level – Middle schools, junior high schools, or high schools in the state
of West Virginia as defined by the West Virginia Secondary School Activities
Commission (WVSSAC High School Classifications, 2011) school ranking
system and measured by self-report question one on the Demographics section of
the instrument (Appendix A). These schools included middle/junior high schools
of grades 6-8, 7-8, and 6-9 and high schools of grades 9-12 and 10-12.
Respondents selected the best description from the following categories:
middle/junior high, high school, or both. Respondents who selected the "both"
category were consolidated into the middle school category for statistical analysis.

15
-Subject(s) Taught in 2011-2012 - The subjects taught by respondents in the
2011-2012 school year as measured by self-report question four on the
Demographics section of the survey. Respondents selected the best description
from the following categories and were allowed to choose more than one category
for a duplicated count: general science, chemistry, biological science,
environmental/earth science, physical science, physics, or other.
-Advanced Placement Instruction – Instructors who taught one or more
Advanced Placement (AP) courses in the past five years including the 2011-2012
school year as measured by self-report question five on the Demographics section
of the survey. Respondents selected either "yes" or "no."
-School Size - The size of the school in which respondents taught in the 2011-
2012 school year as defined by the WVSSAC (2011) school ranking system for
2011-2012 (A, AA, and AAA) . School Size was measured by self-report question
seven on the Demographics section of the instrument (Appendix A). Respondents
selected from the following categories: 339 or less, 340-618, and 619 or more.
Significance of the Study
The instructional practices selected by teachers play an important role in student
success in the science classroom. Practice selection may be influenced by teacher
efficacy. Instructors may choose to implement instructional practices in different levels
dependent upon efficacy level. More research is needed to determine the relationships
between the implementation of constructivist instructional practices and teacher efficacy
in the science classroom. As Next Generation Science Standards are implemented,
instructors must be able to make informed decisions regarding instructional practices.

16
Ascertaining the level of use for constructivist instructional practices among
science instructors in the state of West Virginia, and teacher efficacy with regard to use
of these practices is important if educators are to meet the needs of learners. This study
contributed to the body of knowledge regarding effective instructional practice
implementation and efficacy, providing information to assist West Virginia science
educators with informed decision making. In addition it provides information to assist
state and local policy makers as they implement programming and make funding
decisions for professional development and supplies to ensure success of the Next
Generation Science Standards.
This decision making includes providing direction for professional development
at the state, regional, and local levels. At the state level the West Virginia Center for
Professional Development holds a variety of workshops for educators to improve
practice. West Virginia is also divided into eight Regional Education Service Agencies
(RESAs) which hold professional development workshops as well as bring professional
development to schools. County school boards and local agencies may also find the data
useful in designing professional development to aid teachers as they implement the Next
Generation Science Standards.
In addition the results of this study may aid instructors and policy makers in
higher education as they strive to implement successful teacher preparation programs to
meet the requirements of the Next Generation Science Standards. In order to give future
science educators the skills they need to implement the new standards, higher education
officials need to be able to make informed decisions regarding level of use of
constructivist instructional practices and the role of teacher efficacy in practice selection.

17
Because teacher efficacy is shaped in the formative years of teaching, including student
teaching, programming that promotes high levels of efficacy is paramount to teacher
candidate success.
Finally, the results of this study added to the knowledge-base needed to continue
providing challenging curricula for all students. Instructional practices utilized in science
classes influence student mastery of curricula set forth in the Next Generation Science
Standards. Expanding the knowledge base regarding level of use of instructional
practices, teacher efficacy, and determining the relationship (if any) among these factors
yielded information helpful to stakeholders as they construct methods of study designed
to challenge and inspire today’s students. Few studies have examined the relationship
between teacher efficacy and instructional practice implementation in the science
classroom. The results of this study helped define this relationship to provide
information that can be used for future study.
Delimitations of the Study
This study was limited to West Virginia science teachers in public schools at the
middle/junior high, and high school level (grades 6-12). West Virginia had 55 counties
in 2011-2012 with approximately 125 high schools and 156 middle schools in the study
period. According to the West Virginia Department of Education, there were
approximately 1,898 science teachers for grades 6-12 in the 2011-2012 school year.

18
CHAPTER 2: LITERATURE REVIEW
The purpose of this chapter is to provide a review of the relevant literature.
Section one provides a more in-depth review of the literature surrounding instructional
practices in science education. Section two provides discussion regarding traditional and
constructivist instructional practices. Section three is devoted to school factors serving as
independent variables (class size, years of teaching experience, Advanced Placement
instruction, and socioeconomic level). Finally, section four provides a deeper
explanation of efficacy, science teacher efficacy, factors that determine efficacy, and the
role of teacher efficacy in the selection of instructional practices.
Instructional Practices in Science Education
Instructional practices in science must be carefully chosen for several reasons
(Bybee et al., 2006). Students may come to the science classroom with incorrect
preconceived notions and require an adequate background of facts and context to build
upon. Students must also have the ability to organize and retrieve knowledge. According
to the authors science educators must teach content in-depth, recognize misconceptions,
correct them, and teach reflective thinking. Instruction related to science involves more
than teaching content for students to successfully grasp difficult scientific concepts.
Critical thinking in science education is also important, both historically and in
today’s classroom (Vieira, Tenreiro-Vieira, & Martins, 2011). Educators must select
instructional practices in the classroom that promote critical thinking. Critical thinking
skills allow the general population to understand the scientific and technological
advances occurring in today’s society, the importance of new discoveries, and to prepare
19
individuals for careers in related areas. Students must be able to critically understand,
assess, and make decisions based on the relevance of science to their lives.
Vieira, Tenreiro-Vieira, and Martins (2011) also suggested that students must be
able to analyze evidence in arguments, present their own arguments, make inferences,
and assess the credibility of sources. Students in today’s society benefit from appropriate
knowledge of variables, controls, accuracy, precision, context, validity, reliability,
hypotheses, cause/effect, correlation, and significance. These concepts are part of both
critical thinking and scientific literacy. The science classroom as an open, safe
environment for creativity and questioning provides an opportunity to promote critical
thinking, as well as the knowledge and attitudes to carry it successfully into the modern
world. Activities in the science classroom including discussions, analyzing journal
articles, reading scientific papers, and other relevant projects promote these skills.
Instructional strategies in the science classroom can be divided into two
categories: macrostrategies and microstrategies (Edvantia, 2005). Macrostrategies
include metacognitive activities (breaking down tasks and thinking about how they are
organized) and active engagement with the physical world (hands-on constructivist
practices), while microstrategies include independent practice (homework consisting of
short regular practice activities), higher order thinking (to organize information and
complete tasks), evaluation of evidence, and cooperative learning (with peers and adults).
Students require appropriate feedback, context, differentiation, appropriate time, and
scaffolding to successfully accomplish both macro and microstrategies.

20
Specific instructional practices in the sciences may also be needed to teach
concepts related to the Nature of Science (NOS). In a study of preservice MAT teachers
concepts including empirically based research, subjectivity, changeability, inferences,
observations, creativity, subjectivity, change over time, and the role of society in science
and vice versa were found to be well understood by participants (Abd-el-Khalick, Bell, &
Lederman, 1998). However, participants were not as clear about the difference between a
theory and a law, the importance of society and culture to scientific inquiries, and in
video-taped lessons only three of the 14 participants explicitly taught NOS concepts
though all expressed the importance of NOS. Instructors emphasized student needs,
reasoning, social skills, process/tasks skills, content knowledge/application, and
establishing a safe, secure, engaging learning environment over teaching NOS.
Participants listed several reasons for not teaching NOS including more important topics,
classroom management, lack of understanding/confidence, time constraints, and lack of
resources/experience. Abd-el-Khalick, Bell, and Lederman (1998) suggested more
support for preservice teachers to overcome these obstacles.
Appropriate professional development is also necessary for inservice teachers in
difficult subjects such as science and math, especially when teachers are not fully
certified and are teaching on permits (Huffman, Thomas, & Lawrenz, 2003). Various
types of professional development including immersion, curriculum development,
curriculum implementation, discussion of practices, and collaborative projects were
analyzed in the study using a five point Likart survey for level of use of the selected
practices. The level of use was compared to amount and type of instructor professional
development. Curriculum development and discussion of practice had significant results.

21
Historically, selection of appropriate instructional practices have been an integral
part of meeting the goals of new standards and objectives, including the four goals of the
National Science Education Standards (NSES), a precursor to the Next Generation
Science Standards (Yager, 2005). These goals included giving all students experience of
the natural world, utilizing scientific principles for decision making, debating
scientific/technological issues important to society, and becoming scientifically literate to
increase productivity. The following instructional practices were proposed by the author
to meet the goals: asking and answering questions, designing experiments, and collecting
and communicating evidence.
Traditional Instructional Practices
Throughout much of the history of education, instruction has revolved around
practices now termed “traditional” in nature. These instructional practices include lecture
and teacher-led activities from a behaviorist theoretical framework (Paek et al., 2005;
Woolfolk, 2010). Because many instructors teach in the manner they were taught,
traditional practices are still very common in classrooms today (Borko & Putnam, 1996).
Traditional learning practices, stemming from a behaviorist perspective, promote changes
in behavior. Students develop a repertoire of appropriate responses to a variety of stimuli
and educators reinforce those responses. For example, students memorize facts until they
can repeat them automatically (Schuman, 1996; Standridge, 2002). Two general types of
behaviorism include classical conditioning and operant conditioning, though both revolve
around the idea that all behavior is learned and strive to examine how the learning occurs
(Standridge, 2002). Both classical and operant conditioning focus on lower levels of
22
Bloom’s taxonomy but foster appropriate teacher-pupil boundaries and are relatively easy
to evaluate (Shirley, 2009).
Classical conditioning has a long history. Aristotle suggested that learning can
occur by association, though the idea of classical conditioning was not fully developed
until the 1920s when Ivan Pavlov trained a dog to salivate at the sound of a tuning fork
when rewarded with food. Upon removing the food, the dog continued to salivate at the
sound of the tone (Woolfolk, 2010). The author suggested these experiences can play a
role in the classroom. For example students who have had negative experiences testing
in the past may become nervous when assessed. These deliberate behaviors are also
components of operant conditioning. John Watson proposed that human behavior
originated when a stimulus produced a response (Standridge, 2002).
B.F. Skinner studied positive and negative reinforcements on behavior. Positive
reinforcement consists of a desired stimulus presented after a behavior while negative
reinforcement consists of removing an undesired stimulus when a behavior occurs
(Woolfolk, 2010). For example, positive reinforcement includes obtaining rewards for
achieving good grades, whereas negative reinforcement includes exemption from final
exams for good attendance. Negative reinforcement is not the same as punishment (Good
& Brophy, 1990). Punishment utilizes undesirable consequences that weaken and
suppress behavior (Woolfolk, 2010). For example, a student receives detention when
tardy for class, resulting in the student coming to class on time. Educators adopt these
concepts and use them to reward desired behaviors and punish or modify undesirable
ones (Standridge, 2002). The author listed the following as classroom applications of
behaviorism: behavior modification, contracts, reinforcement, extinction, and

23
consequences. Behavioristic methods may be useful for very young students, special
needs students, covering large amounts of material, meeting deadlines, and classroom
management due to the clear goals it provides (Shirley, 2009).
A third type of behaviorism, contiguity, is very context specific (Huitt &
Hummel, 2006). In these situations the stimulus and response are connected in a specific
time and/or place. The stimulus in this case is the environmental event and the response
is the action or behavior. For example, a student playing sports associates the action of
winning games with wearing a specific article of clothing during the time frame of the
game. Other types of behaviorism are not context specific and focus on students learning
facts and skills from an authority figure such as the teacher. Moussiaux and Norman
(1997) explained that this type of learning is merely a transfer of factual knowledge so
these methods can be of limited value if educators do not provide other supports.
Students also learn by modeling behavior (Standridge, 2002). They may not
necessarily participate directly in the task but can repeat it later at another time as needed.
For example, a student watches the instructor measure the temperature of water with a
thermometer. Later in the year, the student may repeat the same procedure as part of
another activity. Standridge linked modeling to the work of Bandura. Bandura (1986)
stated, "Of the many cues that influence behavior, at any point in time, none is more
common than the actions of others" (p.45). When modeling a behavior for others it is
helpful to break it down into discrete steps, a process often referred to as shaping. The
desired outcome is gradually guided or shaped until the student is successful. Cuing is
used to guide the student both verbally and nonverbally throughout the process
(Standridge, 2002).

24
In the behavioristic classroom students often receive information from an
authority figure utilizing some form of lecture. There are several types of lectures. In a
micro-lecture students are given portions of the lecture in chunks broken up by some
other method such as discussion, summarization, or writing, before moving on to the next
portion of lecture. Lecture sections may be as small as two to five minutes. In the write-
share-insert method the lecture is broken down by a writing activity in which students
make notes and share them with a partner. In the quick-review-and-out method the
teacher or students quickly summarize the main ideas before moving on to another topic.
In the mind-settling pause the teacher stops and gives students a moment of silent
reflection before continuing. In lecture-with-feeling the teacher centers the lecture on
real-life stories and events that grab attention instead of abstract concepts, people, or
places (Harmin & Toth, 2006).
Constructivist Instructional Practices
Constructivist instructional practices are often student centered instead of teacher-
centered, providing students with the opportunity to be active participants in their own
learning (Paek et al., 2005; Woolfolk, 2010). Practices from a constructivist perspective
promote student construction of knowledge with broad applications for problem solving
under more ambiguous conditions (Schuman, 1996). Good and Brophy (1990) attributed
constructivism to Bartlett while Woolfolk (2010) added Piaget, Vygotsky, Bruner,
Rogoff, Watson, Dewey, and Lave to the list. There is no single constructivist theory of
learning. But each variation agrees on two principles: learners actively construct
knowledge and knowledge is constructed through social interactions (Woolfolk, 2010),
compared to traditional practices in which the learner is passive.

25
Constructivism can be divided into two broad classes: psychological and social
(Woolfolk, 2010). Psychological constructivists examine how meaning is formed for the
individual, and are sometimes called individual constructivists. Constructivism revolves
around how the individual constructs internal representations, modifies and stores the
information, retrieves information, and analyzes and modifies information. According to
the author, Piaget’s version of this constructivism is sometimes called cognitive
constructivism because the focus lies on the process of constructing meaning.
Social constructivism on the other hand was informed by the work of Vygotsky
(Woolfolk, 2010). In this view students must participate in a variety of activities with
others in order to appropriate new behaviors. Appropriation is "being able to reason, act,
and participate using cultural tools" (Woolfolk, 2010, p. 312). The process occurs in the
zone of proximal development, or the area where a child can accomplish a task with
another’s help. In this view cognition and culture create each other, making individuals a
product of the society and culture to which they belong. Societal elements can be used to
bring students to the zone of proximal development, as Moussiaux and Norman (1997)
stressed the importance of activating prior knowledge. Not surprisingly this type of
culture is more likely to emerge among students if it is already present among the staff
(Becker & Riel, 1999). If staff members collaborate with peers, they are more likely to
foster the same environment of collaboration among students.
In a climate where learning occurs in context, constructivists propose that
assessment should occur in context as well. Testing should be integrated into the task
and not a separate activity (Merrill, 1991). In doing all of these things students must be
able to work together in a group or multiple groups to achieve the ultimate goal while

26
taking ownership of the learning and understanding the influences that shape it
(Woolfolk, 2010). Moreover information must be presented in many contexts throughout
the year for students to successfully understand it in depth. This idea developed in the
1960s after the Russian launch of Sputnik via the work of Jerome Bruner. He created a
spiral curriculum in which the work progresses from simple, concrete ideas to complex,
abstract ideas throughout the school years (Hewitt, 2006). In doing so a variety of
constructivist practices have been developed and used successfully in the classroom.
First, many constructivist practices utilize cooperative learning. Several types of
cooperative learning are based on the way students are grouped. One of the most popular
is the jigsaw method. In jigsaw, like other forms of cooperative learning, the teacher
must explain the process to students and check for understanding before getting started.
Students are assigned to heterogeneous groups or study teams and given the background
material. The groups are then divided into expert groups and work together to master the
subtopic assigned to that particular group. Then the expert groups return to the study
team to teach one another their particular part of the topic, followed by assessment
(Gunter, Estes, & Schwab, 2003).
Concept attainment can incorporate discussion into the classroom and is one
model often used for vocabulary acquisition and other unfamiliar ideas. In concept
attainment, the teacher prepares by selecting and defining a concept, selecting the
attributes he/she wants the children to attain, and developing positive and negative
examples. This preparation allows the teacher to determine when students have reached
the goal. Then the process is introduced to the students. The teacher presents the
examples and attributes and students work together to create a definition. They give

27
additional examples and discuss the process as a class. Finally, students evaluate the
work to ensure that it covers all of the information needed (Gunter, Estes, & Schwab,
2003).
Concept development allows students to build understanding of concepts and may
incorporate discussion and group work. It is believed to mirror the natural human
thought process. In this model students list as many items as possible related to the
subject. Then they group the items by similarities. After establishing groups, the groups
are labeled and reasons for the groupings are defined. When the groupings and their
reasoning are clear to everyone, the items are regrouped or some groups are subsumed
under others to consolidate groupings. The data are summarized and students make
generalizations. Finally, student progress is assessed via item variety, grouping, and
flexibility (Gunter, Estes, & Schwab, 2003).
In questioning, teachers ask questions of students, and students ask questions of
each other to learn more about a topic. It is more interactive than listening to teachers
explain answers in a lecture. However, the questions must focus student attention,
stimulate thinking, and result in learning. Questioning can be used to hold attention,
motivate students, and scaffold learning, so it is versatile and easily incorporated into
other constructivist activities (Walsh & Sattes, 2005). According to the authors, quality
questioning has four characteristics: a clear purpose, focus on content, facilitation of
thinking at the appropriate cognitive level, and clear communication.
Several types of questioning also exist, including ReQuest and the Socratic
Seminar (Fisher & Frey, 2007). In ReQuest (reciprocal questioning) students are taught to
28
ask and answer questions of one another as they read. Initially the teacher may lead the
process, but as students learn the process they can perform the tasks on their own. The
text is read, and students take turns questioning and responding. It works best in pairs to
ensure even participation. In the Socratic Seminar a text is selected and the teacher
proposes a question to get the process started. The question should not have a right
answer. The responses to the question should generate new questions from the students.
The leader both facilitates and participates as necessary from that point. But the
participants are responsible for the learning and must realize that they are not searching
for a correct answer (Fisher & Frey, 2007).
Synectics is another method used to develop problem solving skills and creative
thought processes. In this model students are given a topic. They are asked to describe
the topic and create analogies using the topic. Next students create personal analogies for
the object by assuming a view of reality from the object’s perspective. After completing
this step, which may be the most difficult, they go through the list and identify words that
conflict with one another. Students use these words to create direct analogies, followed
by re-examination of the original topic. Students finally evaluate their own thinking by
identifying the processes which were helpful (Gunter, Estes, & Schwab, 2003).
Determining cause and effect relationships is an important part of critical thinking
and problem solving. In the cause and effect model (which can be part of inquiry
learning, problem-based learning, or project based learning) students choose the topic or
problem they want to analyze. Then they look for the causes of the event and support for
the causes. Next they look for the effects of the event and associated supporting
evidence. Prior causes and subsequent effects are also analyzed (such as a chain of

29
events). Finally, students form conclusions, generalizations, and evaluate their
performance (Gunter, Estes, & Schwab, 2003).
Reciprocal teaching was developed in the 1980s by Palincsar and Brown for
increasing text comprehension (Dell’Olio & Donk, 2007). Teachers and students
alternate roles to summarize readings, predict what happens next, and clarify confusing
passages or vocabulary. It is especially helpful for students who have good text decoding
but poor comprehension. Teachers may have to provide a great deal of scaffolding at
first to get students used to the model, but after they learn appropriate procedures the
method can be used by students themselves. It has also been shown to be useful with
parent/child reading activities, special education populations, those with learning
disabilities, and English Language Learners (ELL). It is a constructivist method since it
allows students to construct knowledge through interactions with others.
The vocabulary acquisition model is more interactive for students than hearing
teachers lecture about the meaning of words. In this model the students are pretested to
determine prior knowledge. Then discussions about spelling and possible meanings are
used to elaborate. The data collected in the discussions are used to explore patterns of
meaning. Students then read and study the concept in preparation for a posttest (Gunter,
Estes, & Schwab, 2003).
The conflict resolution model can be used to determine solutions to either real-
world problems or to predict possible solutions in a narrative or story. It can incorporate
discussion and group work. First students list all of the important facts, participants, and
actions related to the conflict. They identify the reasons for the actions and feelings of

30
participants as well as reasons for the feelings. Next, alternative solutions are listed and
examined for appropriateness. Similar situations are discussed for examples and
assistance in determining feelings and reasons associated with solutions. The students
choose a course of action and evaluate it, comparing it to alternative solutions and their
consequences. Generalizations are made regarding the conflict and evaluated (Gunter,
Estes, & Schwab, 2003).
Incorporating drama into the classroom, in activities such as role playing, are also
beneficial constructivist activities, particularly for students from low SES backgrounds.
Acting, role play, and other activities are child-centered, process oriented, active, and
self-expressive. However, role play can also involve adults, as educators portray
historical figures and demonstrate processes. However, the use of dramatic teaching
methods is not without criticism. Many critics feel that dramatic methods are best
reserved for the theatre classroom, as their focus is on group symbolism not the
individual student (Pogrow, 2009).
In the values development model an overarching theme is identified and focus is
directed to a singular question. Supplemental resources are provided and students
explore interdisciplinary connections regarding the theme in order to create possible
answers to the question. There should be no clear-cut right answer. During the process
the instructor must model caring about the topic, anticipation, and learning techniques
(Gunter, Estes, & Schwab, 2003).
Learning extends beyond the classroom and authentic experiences are as varied as
writing to experts, planting a school garden, observing nature, visiting museums, bringing
31
experts into the school as guests, and having a class pet (Daniels & Bizar, 1998). The
commonality among each of these activities is that the experience is used for students to
"build an understanding of themselves and their place in the world" (Daniels & Bizar,
1998, p. 173).
Problem-based learning (PBL) is a constructivist approach that allows students to
learn both content and problem solving skills in an authentic setting. The problem being
solved generally mimics one in the real world and may not have a correct answer. It is a
type of project-oriented learning and can be related to inquiry based learning. It is a
seven-step process (Schmidt & Moust, 1988, April). In the first step, the teacher explains
the process and any new terms. Next, the problem is defined and analyzed through
brainstorming and discussion. Learning issues are formulated so that students can study
for themselves. Finally, students must share what they find.
Problem-based learning fosters higher-level thinking skills (Sevilla, 2012). It
takes basic knowledge and comprehension and forces students to apply it to real-world
problems. In order to do so they must analyze, evaluate, and synthesize the problem at
hand. PBL utilizes all levels of Bloom’s taxonomy. Moreover, it is applicable to all
content areas, not just science. Sevilla explained that traditional teaching methods focus
on the lower levels of Bloom’s taxonomy, while PBL forces students to progress to
higher levels.
Problem-based learning, inquiry based learning, and project based learning
provide students with an authentic problem to solve. However, project based learning
utilizes projects to accomplish student-centered instruction. Students are required to

32
formulate and solve their own problems in this constructivist approach. Project based
learning is different from traditional teaching methods since it focuses on the learner and
the project to be produced and stems from the work of Dewey and Kilpatrick (Schneider,
Stek, Krukowski, Synteta, Smith, & Schmitt, 2005)
Project-based learning can include experiments, field trips, and other hands-on,
student directed activities. The teacher designs and facilitates these activities. Project
based learning has the following characteristics: challenging but realistic problems,
collaborative learning, student-set goals, a long-term nature, focus on content with a
driving question, learning skills, interdisciplinary study, authentic experiences, and a
productive outcome that has a clear benefit to the class and/or community. Students are
responsible for time and resource management. Project based learning may involve other
types of learning methods, either behaviorist or constructivist in nature, as needed for
students to solve the problem (Schneider, et al., 2005).
Project-based learning and problem-based learning clearly have many similarities.
But they differ in that project based learning focuses on production of a concrete item.
Students focus on creating a product. In order to do so they identify an audience and
design the item for that audience. They are responsible for managing tasks, dividing up
the work, trouble shooting, reflecting, and evaluating the end-product. Student
responsibility is key and again educators serve as facilitators and guides while students
assume various roles. Assessment is frequent and carried out by teachers, peers, and the
individual (Schneider, et al., 2005).

33
Like other constructivist methods, project-based learning has drawbacks. Project-
based learning can be time consuming and expensive. Students may have difficulty
forming appropriate research questions and designing a project. Projects can be very
large so students may have trouble managing time and resources wisely. Like other
cooperative methods, students may have difficulty collaborating. If students struggle, the
teacher may have to help break the overarching problem down into sub-steps that are
more manageable. If technology is involved learning to use it appropriately can also
present challenges. Instructors may run into difficulties designing appropriate projects to
cover content, following up on projects to tie learning together, and creating appropriate
assessments (Schneider, et al., 2005).
Inquiry-based learning includes many types of constructivist activities and may
encompass problem-based and project-based learning. Inquiry is the process by which
scientists study and attempt to explain the world, and it includes the processes by which
students develop understanding of the world around them as well. Students must come to
master certain scientific ideas and understand how scientists reached these
understandings and in doing so students mimic the role of the scientist (Dow, Duschl,
Dyasi, Kuerbis, Lowry, McDermott, Rankin, & Zoback, 2000).
Increasing inquiry-based activities has been a goal in science education since the
National Science Education Standards were proposed over a decade ago. The inquiry
process involves students asking questions using the knowledge they already have to
acquire more knowledge to solve the problem. For inquiry to be successful students
should add to their knowledge base and realize that this new knowledge can be built upon

34
by asking new questions and solving new problems. Inquiry-based learning is a cycle that
builds upon itself by questioning and refinement (Dow, et al., 2000).
Teachers must provide students with direct experiences for inquiry-based learning
to be successful. Students must practice the process of scientific inquiry, asking
questions and researching on their own to answer the questions. This inquiry can involve
research in books and journals, experimental investigation, and analysis of results.
Inquiry requires critical thinking, logic, and consideration of many possible explanations
and alternatives. Experience leads to understanding. Educators must facilitate
understanding of the inquiry process and help students reflect on the processes and their
own learning if they are to be able to replicate it without assistance under new
circumstances. Inquiry learning is constructivist in nature due to this student centered
emphasis. Students’ own ideas and experiences can be drawn from to create inquiry
experiences. Once students see that the scientific process can help them solve problems,
they will have a deeper understanding of the scientific process as well as the tools
necessary to carry out future studies (Dow, et al., 2000).
In this study, teachers were surveyed using selected research-based constructivist
instructional practices on a five point Likart type scale for level of use with one being
"Never Used" and five being "Very Frequently Used." Teachers were presented with a
list of strategies and selected the level of use that best described their classroom. Several
school factors also served as independent variables and will be discussed next. Class
size, teaching AP or pre-AP courses, years of teaching experience, and socioeconomic
status were examined as part of this study.

35
School Factors and the Use of Constructivist Strategies/Efficacy
Class Size
Multiple stakeholders believe class size reduction is beneficial to students, as well
teachers, principals, and parents (Picus, 2000). Consequently, nationwide class size has
fallen from a 27:1 student-teacher ratio in 1955 to 17:1 in 1997, counting Title I and
special education teachers. The author explained that more educational dollars are spent
to reduce classroom size than increase teacher salaries. However, according to the author
educators in smaller classes reported higher morale and the opportunity to implement
new instructional practices.
Indiana’s Prime Time Project and Tennessee’s Project STAR are two initiatives
that limited class size while tracking student progress (Achi, 2011). Students in both
studies showed benefits from the smaller classes. The STAR program in particular
yielded rich data due to random assignment of students to reduced-size classrooms,
regular classrooms, and regular classrooms with an aid. Teachers were randomly
assigned to the classrooms. In each year of the study the students in reduced-size
classrooms exceeded their regular classroom peers in achievement. In addition, students
in small classes were two percent more likely to be enrolled in college years later
(Whitehurst & Chingos, 2011).
Wisconsin’s project SAGE reported similar results with students in urban areas
(Achi, 2011). Class size was reduced in kindergarten the first year of the study followed
by successive reduction in the next grade level classrooms the following years. Benefits
were particularly visible for poor, minority, at-risk, and special needs students. However,

36
for significant impact to occur, students needed to start the program in kindergarten, and
remain in small classes for at least three and preferably four years. Such initiatives
resulted in lower retention, higher graduation rates, and more students graduating with
honors (Achi, 2011).
Critics of class size reduction argue that the gains are not significant enough to
merit the expenditures associated with smaller classes and that pupil-teacher ratio is not
an accurate measure of class size since many schools include teachers such as music, art,
physical education, and aids who do not have their own classroom in the count (Achi,
2011). Other critics claim that the educational benefits do not justify the financial burden
in tough economic times. Increasing the student-teacher ratio by 1 student across the
nation would save $12 billion dollars a year (Whitehurst & Chingos, 2011). The authors
also suggested that, if the least effective teachers were laid off to accomplish this
reduction, the effect on student achievement would be negligible. The authors warned
that educators must carefully weigh the financial benefits of maintaining smaller classes
vs. cutting other programs such as art, music, and athletics in order to maintain smaller
courses. In addition, school systems must consider the cost of construction of new
classrooms to house additional course sections (Picus, 2000).
Flower (2010) found that even though the results of studies on class size reduction
are mixed, experts agreed on three points: low SES students benefit from smaller classes,
low ability level students benefit from smaller classes, and smaller classes positively
impact student attitude. However, the author cautioned that reducing class size without
changing instructional practices and supporting teachers with training, resources, and
professional development is not enough to help students. The results of research on class

37
size reduction are clearly mixed. It is therefore important to ascertain the influence of
class size on level of use of instructional strategies and teacher efficacy. Research on
total years of teaching experience vs. achievement has also shown mixed results and will
be analyzed next.
Years of Teaching Experience
Total years of teaching experience, like class size, is a variable often examined in
studies related to student achievement, particularly when educators are seeking to raise
achievement for a particular group of students or close an achievement gap. This factor
is a particularly important area of research since many states tie teacher pay to the
number of years of classroom experience. Teacher experience has been shown to
positively influence student achievement, but only during the initial years of teaching
(first three-five years) (Holley, 2008). The first three-five years in the classroom seem to
be the most critical. Other studies found that teaching experience does matter and that
educators continue to improve practices well beyond the three-five year mark (Haimson,
2011). She suggested that educators continue to improve practice for 15-20 years. Such
findings have serious implications for school systems seeking to improve student
achievement by laying off experienced teachers.
Teacher performance in the classroom improved each year for the first four years
and then leveled off on the fifth according to McCue (2011). However, the author also
found that teacher practices may be more important to achievement than years of
experience so continuing teacher education through quality professional development
could help improve student achievement after five years. The author also suggested that

38
teacher beliefs play a role in student achievement, which was examined in this study
using teacher efficacy.
Controlling for other factors the two teacher characteristics most closely tied to
student achievement were years of experience and teacher test scores in a study by
Clotfelter, Ladd, and Vigdor (2007). The authors used a value added model and years of
experience as linear indicator variables with the expectation that the greatest gains would
be made in the early years of teaching, as many other studies have indicated. The authors
did find that teachers with more experience were more effective than beginners. These
effects were more pronounced during the initial years of teaching, but continued to rise
slightly throughout the years studied.
Teacher factors including experience were examined over a three state area
yielding inconsistent results in the relationship between teacher experience and student
achievement (Jones, Alexander, Rudo, Pan, & Vaden-Kiernan, 2006). Teacher
experience was positively associated with student achievement in only fourth grade math
for one state. However, in each state that participated in the study, teacher experience
was the largest determining factor for salary. Interestingly, teachers with lower pay, and
therefore less experience, were found to be located in the poorest schools participating in
the study. In another study teacher experience was found to be a significant factor in
reading scores (reading vocabulary and reading comprehension) but only when
comparing beginners to educators with ten or more years in the classroom (Rockoff,
2004). In addition, school factors such as years of experience may be impacted by
student socioeconomic status (SES) (Jones et al., 2006).

39
Teacher quality is clearly hard to measure and may be driven by something less
tangible than years of experience (Rockoff, 2004). Some studies did not find that
increased teaching experience resulted in significant gains in student learning (Giglio,
2010). The author found that increasing teacher experience five years resulted in less
than one percent positive increase in student achievement. The author suggested that new
ways of measuring teacher effectiveness and compensating teachers may be necessary.
Criticism regarding the impact of teacher experience on student achievement has
been documented since the 1966 Coleman Report (Hanushek & Rivken, 2007). Since
that time, multiple studies have been published on both sides of the teacher experience
debate. The authors were particularly concerned with the tendency of more experienced
teachers to gravitate toward better schools and more academically oriented students
(Coleman, Campbell, Hobson, McPartland, Mood, & Weinfield, 1966). If teachers with
more experience tend to go to higher achieving schools, teacher experience may not be a
determining factor in achievement. It may be an indicator of easier-to-educate students.
Working conditions play a major role in teacher satisfaction, and higher compensation
may be necessary to get more experienced educators into poor or dangerous schools.
Consequently, this study examined the effects of SES on level of use of constructivist
instructional practices and teacher efficacy.
Socioeconomic Factors
Students from low socioeconomic backgrounds suffer many disadvantages in
school compared to higher socioeconomic students (Banks & Banks, 2007). In this study
SES was measured by a self-reported survey question in which teachers indicated the

40
percentage of students eligible for free-and-reduced lunch using categories from the
Improving Teacher Quality Grant Program Participant Survey administered by Marshall
University in 2011. The respondents selected the category that best described their
school from the following list: less than 35%, 36-50%, 51-75%, and 76% or more.
In Ruby Payne’s A Framework for Understanding Poverty (2005) two types of
poverty are examined. First, in generational poverty, the family has been in poverty for
at least two generations or lives with others who are already part of generational poverty.
A key characteristic of generational poverty is a sense that society bears responsibility for
providing for the family. On the other hand, situational poverty is a lack of resources due
to a specific situation that has occurred and may be mitigated, such as a death in the
family, illness, or divorce and the family may not be willing to accept assistance to
maintain pride.
Generational poverty is more debilitating. The following are characteristics of
generational poverty: survival orientation, matriarchal structure, casual oral-language,
men viewed as lover or fighter, women viewed as caregiver/martyr/rescuer, presence of
background noise (like the TV on at all times), emphasis on personality/humor, emphasis
on entertainment, focus on relationships, non-verbal and kinesthetic communication,
negative remarks for any type of failure, punishment/harsh discipline, disorganization,
belief in fate not choice, ownership of people, emphasis on the present time/in the
moment, and polarized thinking (Payne, 2005).
Other categories of poverty include absolute, relative, urban, and rural (Jensen,
2009). In absolute poverty, which is rare in the U.S., families lack shelter, water, and

41
food. Relative poverty occurs when a family’s income is lower than society’s average
living standard. Urban poverty occurs in areas of at least 50,000 people with over-
crowding, violence, noise, pollution, and dependence on city services. Finally, rural
poverty occurs in areas with populations below 50,000 where there are fewer services,
and more single parent homes. Less opportunity for education, help with disabilities, and
opportunities to obtain jobs are available in these areas. Rural poverty levels are
increasing and exceeding those of urban areas (Jensen, 2009).
Low SES students facing these challenges place a burden on the school system
that it is not equipped to meet (Holliday, 2011). Consequently many of these children
fail when the system does not adapt. From lack of support services to shortages of basic
tools for success (paper, pencils, etc…) low SES students may not have the items they
need to work in school (Payne, 2005). The effects of low SES on student outcomes have
been known for many years. Many low SES students lack enriching educational
experiences when they start school, including books, computer, and travel to enriching
locations (museums, zoos, parks, etc…).
The disadvantages faced by low SES students can compound the problem of low
test scores when compared with other nations, according to Bracey (2009). The U.S.
regularly scores unfavorably in areas such as math and science when compared with
other developed nations on assessments such as the NAEP and PISA (Schleicher, 2011).
However, the U.S. has a high percentage of children living in poverty who lack the
quality educational experiences necessary to prepare them for standardized testing.
Bracey (2009) found that high SES students from wealthier schools outscored nearly all
other developed nations in math and science. Only when low SES students were
42
averaged into the equation did U.S. scores fall below that of other nations. Payne (2005)
reported that one reason schools face so many challenges today is the decreasing number
of middle class students and increasing number of students of poverty.
Students facing these challenges do not come to school with the appropriate
cognitive strategies for learning and may act out in a variety of ways, ultimately ending
up labeled and placed in special programming (Payne, 2005). The author warned that
not all of these students should be placed in special education; the population is becoming
too large. Instead students must be given the strategies they need despite the challenge it
presents to educators. This challenge is partly due to differences between the hidden
rules of education (middle and upper class norms utilized in the classroom) and the
hidden rules of the culture of poverty. For example, according to the author relationships
and entertainment rate highly among the priorities of low SES families, so fostering
relationships between parents and the school may be one way to overcome these
challenges.
Teachers must build quality relationships with students and plan lessons that grab
students’ attention. After gaining students’ attention, educators must support them
throughout the learning process. Teachers must plan carefully for students and anticipate
areas of difficulty by carefully monitoring students to catch problems early before they
result in failure, low self-esteem, and learned helplessness (Jackson, 2009). Teachers
must be proactive not reactive. Proactive support "is rooted in the belief that all of our
students can achieve at high levels given the right conditions" (Jackson, 2009, p. 105),
once again implicating the importance of educator belief (efficacy) in the educational
process.

43
Failure to provide an appropriate education for all children may result in the U.S.
falling behind in today’s information and technologically driven society (Holliday, 2001).
Students who do not do well in school or dropout were traditionally incorporated into the
low skill labor market relatively easily. However, these jobs are quickly being lost to
overseas markets in the global economy (Ingrum, n.d.). According to the author, the job
outlook for high school dropouts in the current economy is bleak, and educators must
stress the importance of staying in school. Completion of high school is one way low SES
students can escape and stay out of generational poverty (Payne, 2005). The author
reminded educators that poverty is not about intelligence or ability (or lack thereof);
many individuals in low SES situations do not know that they have other choices, or have
no one to teach them the hidden rules of the middle class. Social difficulties arise when
students do not understand the rules and norms of the middle class. Schools may be the
only place students have the opportunity to learn these rules.
Physical and emotional support, language stimulation, and time for positive
interactions may all suffer as a result of poverty. As the child develops and enters school,
the parents’ past negative experiences in the educational system can result in
unwillingness to assist the child with participation in school and extracurricular activities
(Jensen, 2009). According to the author this unwillingness/inability to assist the child
may be due to parental depression, low self-esteem, inability to cope, and feelings of
powerlessness. Breaux (2007) suggested that educators reach out to parents in a positive
way. Educators should contact parents when students are doing something well, not just
call home when students get in trouble. Educators cannot use low socioeconomic status
as an excuse to exclude parents from the educational equation (Holliday, 2011).

44
The effects of low SES have been studied for several decades particularly with
regard to low academic performance and dropout rates. In 2011 West Virginia had a
15.5% high school dropout rate, and 11,000 teens age 16-19 were not attending school
and were not working (Anne E. Casey Foundation, 2012). In the early 1960s the most
important factors related to dropout rate were found to be low SES, parents with low
educational levels, parents who do not value education, low GPA, and incompatibility
with the school social system (Bertrand, 1962). Many of the factors listed in addition to
low SES have been found to be closely tied to poverty anyway, compounding the
problem for low SES students and increasing their likelihood of low academic
performance and dropping out of school. The situation is compounded even further when
low SES students have a learning disability, making them even more likely to drop out of
school than peers with only one disadvantage (Ingrum, n.d.).
Students of poverty experience these difficulties due to a variety of factors in their
lives (Jensen, 2009). Both genetics and environmental influences play a role in the
child’s development and ability to interact with the environment throughout life. The
author cautioned that educators must remember that the nine months the child spent in the
womb were critical times for development, especially brain development. Low SES
mothers are more likely to lack prenatal care, be exposed to toxins, and have high levels
of stress which can harm the baby’s development.
In addition high mobility after birth negatively impacts students and the ability of
teachers to reach them (DuFour, DuFour, Eaker, & Karhanek, 2010). Students may not
try to make friends at new schools, since they know they will be moving again and only
have to leave them behind. They may not try to succeed at school for the same reason

45
and they may not be placed in the best classroom to meet their needs due to lag time
between schools transferring student records. Often schools do not have a standard
policy for dealing with highly mobile low SES students. "Educators readily acknowledge
that the fate of a student who is not learning will depend on the randomness of the teacher
to whom he or she is assigned rather than any collective, coherent, systematic plan for
meeting the needs of all students" (DuFour, DuFour, Eaker, & Karhanek, 2010, p. 39). It
is therefore critical for staff members to sit down together and devise a school-wide plan
to assist these students in achieving success.
Several factors, including low SES are strongly correlated with test scores in
school (Levitt & Dubner, 2009). The parents’ education level, age of mother (30 or
older) at the time of her first child’s birth, speaking English in the home, parental
involvement in PTA, and many books in the home are all positively associated with test
scores. Unfortunately, low SES homes may lack one or more of these characteristics.
However, there are some steps educators can take to help low SES students succeed
(Bruce, 2008): reduce class size, especially in early elementary grades, maintain a
positive attitude and belief that all students can learn, relate new knowledge to students’
experiences, and use flexible instructional strategies. These instructional strategies
include the use of constructivist based practices that engage the learner and provide the
opportunity for skill development in multiple areas.
Building low SES students’ core skills in such a way that they can be transferred
to all subject areas is also an important way of overcoming some of the challenges faced
by students of poverty (Jensen, 2009). According to the author these skills include
attention and focus, short and long-term memory, sequencing/processing, problem

46
solving, application of skills in the long term, social skills, and hopefulness/self-esteem.
This emphasis on social skills and self-esteem is not a new suggestion. As students from
a variety of backgrounds predisposing them to learning difficulties entered school in the
past few decades "socialization was deemed by many to be a more important function of
the schools than intellectual development" (Henson, 2006, p. 49).
The challenges in teaching these students may seem insurmountable, so it is
critical for educators to avoid blaming the students. Educators have a responsibility to
teach low SES students the appropriate behaviors they need for success in schools
(Jensen, 2009). Children do not get to choose their parents or home environment. They
have no control over the behavior of their parents, either before or after birth. It is not the
students’ fault parents may be unemployed, underemployed, addicted, or absent.
Though the situation may seem hopeless, there is a very real prospect of changing
low SES students’ outcomes (Jensen, 2009). The author encouraged educators to not
give up on low SES students since the human brain is designed to change. Appropriate
stimulation and learning, exercise, and proper nutrition can go a long way in mitigating
the effects of poverty. In this study school SES was examined as a factor in the science
classroom due to the increasingly large number of SES students entering the school
system and the fact that proper stimulation can help them achieve success. Science
educators have a responsibility to reach all student populations with the Next Generation
Science Standards and provide a rigorous yet supportive learning environment.
The College Board promotes raising student expectations as a way of helping
overcome poverty (Newman, 2002). If students expect to succeed, they will. If they
47
expect to fail, they will accomplish this goal as well through what the author called a self-
fulfilling prophecy. However, educators can work to raise student expectations.
Newman (2002) found, "Among students who expect to complete a bachelor’s degree
program, low-income students are almost as likely as high-income students to enroll in
college" (p. 272). The College Board oversees the Advanced Placement (AP) program,
and cited low SES student participation in AP as one method to help advance the
educational opportunities of students of poverty. Therefore, teaching an AP course in
high school or a pre-AP course in middle school was analyzed as another independent
variable in this study.
Advanced Placement Programming
At the end of World War II educators realized a gap was developing between
secondary education and higher education. A more highly educated workforce was
necessary in an industrial society. The Ford Foundation created the Fund for the
Advancement of Education in 1951, which supported studies dedicated to increasing the
education of the population. The studies supported by the program indicated that
secondary and higher education should work together to ensure that students do not have
to repeat coursework (A Brief History of the Advanced Placement Program, 2003;
Schneider, 2009)
In a study conducted by Andover, Exeter, Lawrenceville, Harvard, Yale, and
Princeton, recommendations were made to institute achievement exams to help students
enter college with advanced standing, and to challenge upper-level high school students
with independent study and college-level work (A Brief History of the Advanced
48
Placement Program, 2003). The report was headed by Alan R. Blackmer and John
Kemper (History of the AP Program, 2011; Schneider, 2009). Titled General Education
in School and College and published through Harvard University Press, it implored high
schools, colleges, and universities to work together for the good of students (History of
the AP Program, 2011).
In a second study completed by the Committee on Admission with Advanced
Standing, recommendations were made to institute advanced curricula in high schools. In
order to accomplish this goal, the committee collected representatives from various
higher education disciplines to develop course descriptions and assessments for high
school students to use to earn college credit (A Brief History of the Advanced Placement
Program, 2003). This report, headed by Kenyon College president Gordon Keith
Chalmers, involved 12 schools and 12 colleges. It resulted in a pilot program with seven
schools (History of the AP Program, 2011). In 1952 eleven subject areas were piloted in
these schools by the Educational Testing Service (ETS) but by 1955 The College Board
was asked to begin administering the program on a larger scale (A Brief History of the
Advanced Placement Program, 2003). This pilot coincided with the proliferation of large
high schools in the 1950s, as James Conant and others saw larger schools as a way to
offer more courses, uniformly, and efficiently (Kaestle, 1983). The program was named
the College Board Advanced Placement Program (A Brief History of the Advanced
Placement Program, 2003) and was placed under the direction of Charles R. Keller of
Williams College (History of the AP Program, 2011).
These programs were fueled by several historical and political developments. In
1957 the launch of Sputnik by the Soviet Union fueled a focus on content in the
49
curriculum, particularly math and science. The Cold War brought the need for a quality
education to ensure American scientific and technological dominance (Hewitt, 2006;
Schneider, 2009). The National Defense Education Act of 1958 was a manifestation of
the rising fear for national security if education were not improved (Schneider, 2009),
and the AP program continued to expand. This expansion occurred despite the
publication of The Coleman Report which indicated that teachers’ practices may not have
the significant effect on student outcomes previously thought (Coleman et al., 1966). As
the 1960s progressed policy makers became concerned about rising poverty levels. Much
educational expansion occurred in the 1960s due to the fact that "schooling had become
one of the prime weapons in the war on poverty and a central concern not only of policy
makers but also of the dispossessed…." (Tyack, 1974, p. 270).
As the 1960s gave way to the 1970s and 1980s more and more schools began
adding AP courses to the curriculum. In the 1980s and 1990s active efforts to recruit
minority and low SES students into AP programs began (A Brief History of the Advanced
Placement Program, 2003). After the publication of the A Nation at Risk report in 1983
schools were especially focused on creating challenging curricula for all students
(National Commission on Excellence in Education, 1983). In 1989 the nation’s
governors met in the Charlottesville Educational Summit and wrote six national
education goals, later named the Goals 2000: Educate America Act (1994), which
included rigorous academic standards.
These changes may have been due in part to legislative actions on the state and
national level. However, during the 1970s some social scientists began questioning the
reform acts, stating that Americans were becoming more educated than necessary for the

50
jobs that would be available and that education may not be an escape from poverty.
These complaints were not a coincidence as nontraditional students began furthering their
education. The authors wrote "In abstract, people may favor giving all children a fair
chance, but at the same time they want their children to succeed in the competition for
economic and social advantage" (Tyack & Cuban, 1995, p. 29).
The 1990s also saw several important pieces of legislation that influenced policy
related to AP instruction. In 1996 the National Commission on Teaching and America’s
Future published the report What Matters Most: Teaching for America’s Future, which
helped pave the way for more professional teaching standards. In 1998 President Clinton
reauthorized the Higher Education Act (Earley, 2001). In 2002 President Bush
reauthorized the Elementary and Secondary Education Act also known as No Child Left
Behind (NCLB), which focused on equal opportunities for all students to receive a quality
education (US Department of Education, 2002). As a result, pre-AP and AP Vertical
teaming programs were placed in schools around the country to further increase
enrollment and college preparation.
Many of the same upper-level preparatory schools that originally helped initiate
the AP program are moving away from it due to criticism of standardized tests
(Schneider, 2009). AP courses culminate in a standardized exam, and in the wake of
increased standardized testing, increased student workload, and accompanying stress,
many schools are beginning to take a different approach to assessment. According to the
author other schools fear AP emphasizes breadth over depth and that its influence in
higher education is waning as more students from less elite backgrounds are taking
advantage of the program. However, Schneider explained that creating an atmosphere of
51
privilege was not the intent of the program. The program was intended to challenge and
track the best and brightest students, but not give them special privileges or an edge in
college admissions. Many schools allow any student who wants to take an AP course to
enter the classroom, regardless of preparation level. These open-door policies further
lower the status of AP courses in the eyes of critics and some universities, that no longer
grant AP credit. Elite schools dropping the AP program could undermine its usefulness
in struggling schools striving to increase rigor in their curriculum as colleges and
universities begin to see it as outdated (Schneider, 2009)
AP was however inevitably pulled into the battle against school inequalities in the
1960s (Schneider, 2009). Traditionally, AP was reserved for white, upper- and upper-
middle class students in private or suburban schools. Educators arguing for reform felt
the program should be offered to those students long denied a quality education and the
opportunity to enter college or university. Schools soon became a testing ground for
President Johnson’s Great Society program, and AP was part of the battle. According to
the author AP expanded across the nation in the following decades, with some states
including West Virginia legislating requirements for schools to offer a minimum number
of AP courses. AP is currently becoming available online to further reach isolated and
underserved student populations.
The history of the AP program, as well as the historical and political influences
that shaped it, are important for educators to understand as they examine instructional
practices in the classroom, particularly the science classroom. In this study survey
respondents were asked to indicate if they taught an AP course in the past five years,
including the 2011-2012 school year. This independent variable was analyzed in relation

52
both to level of use of constructivist instructional practices and level of teacher efficacy.
This analysis was important due to the specific training AP teachers receive through The
College Board, which may influence level of implementation of instructional practices
and belief that an instructor is making a difference in the classroom.
Teacher Efficacy
Teacher efficacy is defined as "teachers’ confidence in their ability to promote
students’ learning" (Woolfolk Hoy, 2000, p. 2). The roots of efficacy research began in
the 1960s with Rotter’s work on locus of control theory (Henson, 2001). Efficacy first
emerged as an area of study over 30 years ago when the Rand Corporation asked teachers
to indicate level of agreement or disagreement with the two statements below as part of a
study of reading instruction (Goddard, Hoy, & Hoy, 2000; Protheroe, 2008).
1. When it comes right down to it, a teacher really can’t do much because most
of a student’s motivation and performance depends on his or her home
environment.
2. If I try really hard, I can get through to even the most difficult or unmotivated
students (Armor, Conroy-Oseguara, Cox, King, McDonnell, Pascal, Pauly, &
Zellman, 1976).
Teacher confidence influences the selection of instructional practices. Time,
effort, and resources will be devoted to those practices the teacher believes will be the
most successful. Efficacy is therefore related to nearly every facet of classroom life from
classroom management to time allocation and special education referrals (Woolfolk Hoy,
2000). Moreover, according to the author, efficacy is developed early in the teaching
experience during student teaching and the first years in the classroom.
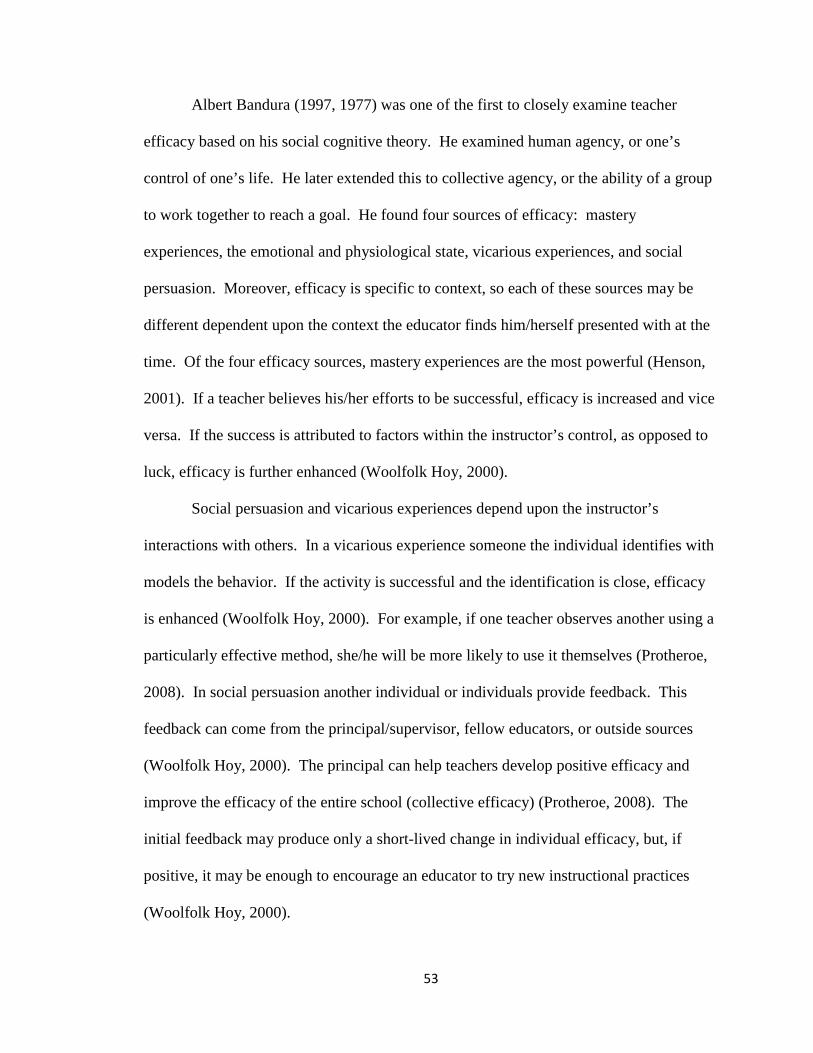
53
Albert Bandura (1997, 1977) was one of the first to closely examine teacher
efficacy based on his social cognitive theory. He examined human agency, or one’s
control of one’s life. He later extended this to collective agency, or the ability of a group
to work together to reach a goal. He found four sources of efficacy: mastery
experiences, the emotional and physiological state, vicarious experiences, and social
persuasion. Moreover, efficacy is specific to context, so each of these sources may be
different dependent upon the context the educator finds him/herself presented with at the
time. Of the four efficacy sources, mastery experiences are the most powerful (Henson,
2001). If a teacher believes his/her efforts to be successful, efficacy is increased and vice
versa. If the success is attributed to factors within the instructor’s control, as opposed to
luck, efficacy is further enhanced (Woolfolk Hoy, 2000).
Social persuasion and vicarious experiences depend upon the instructor’s
interactions with others. In a vicarious experience someone the individual identifies with
models the behavior. If the activity is successful and the identification is close, efficacy
is enhanced (Woolfolk Hoy, 2000). For example, if one teacher observes another using a
particularly effective method, she/he will be more likely to use it themselves (Protheroe,
2008). In social persuasion another individual or individuals provide feedback. This
feedback can come from the principal/supervisor, fellow educators, or outside sources
(Woolfolk Hoy, 2000). The principal can help teachers develop positive efficacy and
improve the efficacy of the entire school (collective efficacy) (Protheroe, 2008). The
initial feedback may produce only a short-lived change in individual efficacy, but, if
positive, it may be enough to encourage an educator to try new instructional practices
(Woolfolk Hoy, 2000).

54
The organizational structure of schools can also affect teacher efficacy. All
organizations have norms, and schools are no exception. Teachers quickly pick up on
subtle and not-so-subtle cues regarding these norms (Woolfolk Hoy, 2000). The school
culture itself can influence the efficacy of both staff and students (Protheroe, 2008).
Socialization regarding school norms actually begins during the student years as future
teachers observe professionals in the field who serve as positive and negative role
models. New norms and values are presented when the individual enters college, during
student teaching, and finally upon entering their own classroom (Woolfolk Hoy, 2000).
This process is part of Bandura’s triadic reciprocal causation in which environmental
influences, behavior, and personal factors intertwine to produce educator agency
(Henson, 2001) and leads to the two classes of efficacy (collective and teacher).
First, the school’s collective efficacy can have a major impact on student
achievement. Schools with high collective efficacy exhibit a "can-do" (Protheroe, 2008,
p. 44) attitude. These schools are better able to cope with challenges and do not give up
when things become difficult. Schools with a low collective efficacy do not cope as well
with difficult situations, and staff members are more likely to utilize student factors like
poverty to explain low performance, rather than accepting the responsibility themselves.
A positive relationship exists between collective efficacy and achievement.
Goddard, Hoy, and Hoy (2000) created a model of collective efficacy based on
Bandura’s (1977; 1997) four sources of efficacy, task analysis, and teaching competence.
The authors classified collective efficacy as an emergent attribute in which the sum of the
whole is greater than the individual parts. Because high teacher efficacy is positively
related to student achievement, increasing collective teacher efficacy can lead to

55
improvements in achievement. But the authors suggested that the relationship is not one-
way; it is a cyclical relationship in which high efficacy leads to improvements in
achievement, which leads to higher efficacy and the cycle continues. Moreover, once
established positively or negatively, collective efficacy is, according to the authors,
difficult to change (Bandura, 2000; Goddard, Hoy, and Hoy, 2000)
Goddard, Hoy, and Hoy (2000) applied collective efficacy to Bandura’s (1977;
1997) four sources of efficacy. For mastery experiences the authors’ suggested that
teachers experience success/failures as a group. Success enhances efficacy and failure
undermines efficacy. Schools with high efficacy can cope with stress better than those
with low efficacy, coming out of periods of disruption or struggle strong. Low efficacy
schools come out of periods of struggle with dysfunction, indicating a direct relationship
between efficacy and physiological state. Faculty in high efficacy schools benefit from
the vicarious experiences of others, listening to the successes and failures of those with
similar student populations and learning from them. Educators in high efficacy schools
enhance one another’s efficacy through positive reinforcement, professional
development, and positive administrative feedback. Goddard, Hoy, and Hoy (2000)
added two more factors in addition to these four provided by Bandura (1977; 1997). In
analysis of the teaching task, educators in high efficacy schools constantly assess what is
going on in the classroom and make adjustments at the individual and organizational
level in factors such as student motivation/ability, resources, and infrastructure. Finally,
in assessment of teaching competence teachers assess one another based on factors for
school success (teaching skills, training, methods, expertise, and student ability).

56
Goddard, Hoy, and Hoy (2000) used the efficacy survey to examine these factors
and found that teacher efficacy was a strong predictor of student achievement. In fact, an
increase of one collective efficacy unit for a school resulted in an 8.62 increase in math
achievement and an 8.49 increase in reading achievement. The authors attributed this
gain to educators in high efficacy schools acting purposefully for the benefit of students.
Collective efficacy would be an appropriate avenue for future study. However it is
beyond the scope of this study. Collective efficacy is an extension of individual teacher
efficacy (Tschannen-Moran, Hoy, & Hoy, 1998), which was the focus of the current
study.
Teacher efficacy can play a major role in classroom management practices, which
can in turn effect instructional practice selection and implementation. Generally a lower
sense of efficacy results in a more controlled classroom environment (stricter rules,
punishments, etc…) (Woolfolk & Hoy, 1990). This type of atmosphere and the desire to
maintain control do not lend themselves to the implementation of new practices,
particularly those from a constructivist theoretical framework. Plus, level of efficacy can
be resistant to change once firmly established (Woolfolk Hoy, 2000), though it tends to
fluctuate during the college/student teaching years as young instructors lose enthusiasm
in the face of the challenges and stress of the classroom (Woolfolk & Hoy, 1990).
Goddard, Hoy, and Hoy (2000) pointed out that efficacy is difficult to measure
because it is also context specific. Contexts that can impact teacher efficacy include
subject, students, and class period. Context is dependent upon the factors that make
teaching a particular group difficult. Each class and group of students is different, and
the instructor must realistically assess his/her strengths and weaknesses in reaching each

57
unique group of students. Instructors must also assess the usefulness of available
resources. These factors interact to impact efficacy. Therefore a teacher’s efficacy level
may vary with every class taught.
Woolfolk Hoy (2000) found that teacher efficacy generally increased during
college coursework, but fell once the teacher entered the classroom fulltime. The author
also found that greater efficacy resulted in fewer sick days for the fulltime instructor,
which was related to perceived difficulty of the teaching position, perceived success in
the position, and personal satisfaction with performance. Teachers who received more
support during the first year of teaching had higher efficacy and may be more open to
new ideas and methods and exhibit greater resiliency when presented with challenges in
the future.
Teaching efficacy is often broken down in several ways. First it may be divided
into two categories for study, General Teaching Efficacy (GTE) and Personal Teaching
Efficacy (PTE) (Woolfolk & Hoy, 1990). PTE is related to the instructor’s personal
confidence and ability and may be independent of GTE (Protheroe, 2008). Factors
including amount of effort, persistence and resilience in the face of challenges, and stress
that can be influenced by PTE (Goddard, Hoy, & Hoy, 2000). GTE refers to the
instructor’s belief about reaching students in general, especially those students who
present challenges (Protheroe, 2008). In addition Bandura (1997) broke efficacy down
further into seven dimensions: resource efficacy, instructional efficacy, disciplinary
efficacy, parental efficacy, community efficacy, decision-making efficacy, and positive
school climate efficacy. However, Woolfolk Hoy (2000) was not able to break efficacy

58
down into these seven constructs for analysis in her study of pre-service to fulltime
teacher efficacy changes, possibly due to sample size.
Due to the complex nature of teacher efficacy, particularly quantifying GTE and
PTE, there are several criticisms of teacher efficacy studies. One of the primary
criticisms is whether or not the theoretical framework is that of teacher efficacy itself or
part of the original locus of control theory (Henson, 2001). Henson proposed that
Tschannen-Moran, Hoy, and Hoy (1998) wove together the two constructs utilizing
Bandura’s four sources of efficacy as well as task analysis and teaching competence to
try to make sense of the overall construct. Task analysis focuses on the elements of the
teaching situation and is closely related to GTE, whereas teaching competency focuses on
the individual and his or her current abilities, more closely resembling PTE (Henson,
2001).
Other critics argued that teacher efficacy is so content specific that the efficacy
scales used to measure the construct are not specific enough to each individual context.
These measures of efficacy are referred to as global, requiring teachers to base judgment
for their rating on aggregated situations from the classroom that may or may not actually
pertain to what the questioner had in mind (Henson, 2001). The judgments are based on
context, but if context specificity is not provided, difficulties with discriminant validity
arise. However, if context becomes too specific, generalizability will be sacrificed,
presenting educational researchers with a dilemma either way according to the author.
A lack of experimental and quasi-experimental research regarding efficacy exists
(Henson, 2001). The author explained that most efficacy studies are self-reported,

59
survey, or correlational. This study was no exception. Due to the deficit of experimental
research, Henson (2001) described the results of most efficacy studies as a cross-sectional
snap-shot of instructor perceptions. A deficit of research exists for teacher and collective
efficacy in areas of efficacy development, relationships between sources of efficacy, and
long-term change through longitudinal studies according to the author.
However discoveries in efficacy research have yielded significant enough results
to merit further study including experimental interventions, quasi-experimental studies,
and direct observation (Henson, 2001). Research has indicated that such interventions
would carry more weight during the initial years of teaching, since efficacy stabilizes as
teachers gain experience. However the author reminds policy makers and professional
development leaders that change is still possible at any stage, but interventions among
experienced teachers must be sustained and focus on critical examinations of practice to
have lasting influence.
In order to address some of the psychometric difficulties (discriminant validity
and factor analysis) associated with earlier efficacy measurements and begin bridging
these theoretical disputes, Tschannen-Moran and Woolfolk Hoy (2000) created what is
sometimes referred to as the Ohio State Teacher Efficacy Scale (OSTES) (Henson, 2001)
or the Teachers’ Sense of Efficacy Scale (TSES). For the purposes of this study TSES was
used as the identifier. The TSES has been used as the starting point for many other
measures of teacher efficacy and is widely adapted. For example, it was used by Roberts
and Henson to develop the Self-Efficacy Teaching and Knowledge Instrument for Science
Teachers and Goddard et. al’s Collective Teacher Efficacy Scale (Henson, 2001). It was
consequently adapted for this study to focus on science education.

60
Teacher efficacy impacts implementation of instructional practices particularly
scientific inquiry and other constructivist practices (Richardson & Liang, 2008). The
authors proposed that instructors utilizing inquiry in science and math had higher efficacy
and surveyed inquiry elements vs. efficacy among pre-service elementary teachers in an
inquiry-based course three times using the Riggs and Enochs (1990) instrument. The
authors found that the science course met the prescribed goals of inquiry-based learning,
and resulted in an increase in participants’ efficacy levels over time. Science teacher
efficacy level was also examined in relation to professional development using the Riggs
and Enochs (1990) instrument (Roberts, Henson, Tharp & Moreno, 2000). The authors
examined archived data from 330 teachers over a seven-year period and administered the
instrument before and after an in-service training. Educators scoring below 50 on the
pretest were focused on with regard to length of training session, resulting in a
statistically significant gain in efficacy for educators attending a 4-6 week program vs. a
2-3 week program. Low scoring pretest participants in the longer program had greater
increases in efficacy levels. High scoring educators did not improve at a statistically
significant level.
Changes in pre-service teacher self-efficacy after enrollment in a science methods
course were also studied (Pontius, 1998). Participants were given two self-efficacy
instruments, a modified version of the Dembo and Gibson (1985) scale and the Riggs and
Enochs instrument (1990). The survey was given to 206 students with 195 useable
responses. A positive correlation was found between the two scales, both of which were
Likart type instruments. However, upon comparing science teaching efficacy and general
teaching efficacy a negative correlation was discovered. Pre-service teachers with higher

61
personal efficacy were found to have lower science teaching efficacy. Meanwhile those
with higher science teaching efficacy were found to have lower general teaching efficacy.
More research is clearly needed in subject-specific efficacy.
Smaller mixed methods studies have also yielded valuable information regarding
teacher efficacy. The experiences of 19 pre-service elementary teachers responsible for
organizing a science festival during practicum experiences were examined closely with
regard to efficacy (Crowther & Cannon, 1998). Both qualitative and quantitative data
were collected. Efficacy was measured using the Riggs and Enochs (1990) instrument
and Haury’s (1988) Science Locus of Control Instruments I and II. Over the course of
the experience, self-efficacy improved. However, outcome expectancy gained only two
points during the course of the 120 hours of contact time. Confidence level varied
according to completion of a science methods course, concurrent enrollment in the
course, or no enrollment in the course. Pre-service science teacher efficacy was also
evaluated with regard to participation in the practicum experience (Wilson, 1994). Again
both qualitative and quantitative data were collected with quantitative data gathered from
the Riggs and Enochs (1990) instrument. As long as the field experiences were slowly
introduced, well organized, logical, provided development and practice presenting lesson
plans, utilized team/club participation, and were well planned, efficacy increased.
Educator beliefs about science teaching in context have also been studied (Lumpe,
Haney, & Czerniak, 2000). The researchers conducted interviews with 130 educators and
analyzed results to create the 26 item Context Beliefs about Teaching Science instrument.
The instrument was given to 262 educators participating in long-term science
professional development. The authors categorized beliefs into enable beliefs (the belief

62
that something would enable student success) and likelihood beliefs (the belief that
students would attain the construct in question or that a situation would occur). They
found that enable beliefs were often greater than likelihood beliefs. Lower likelihood
beliefs were attributed to lack of resources and commitment. Context belief scores were
significantly correlated with the following factors: years of experience (positive
correlation), number of science methods courses (positive correlation), number of
teaching strategies, and time spent teaching science (Lumpe, Haney, & Czerniak, 2000)
The majority of efficacy studies focus on pre-service elementary teachers.
However, a few studies examined both elementary and secondary pre-service science
teachers’ efficacy beliefs (Savran & Cakiroglu, 2003). The authors compared efficacy
level and classroom management beliefs. The Riggs and Enochs (1990) instrument and
the Attitudes and Beliefs on Classroom Control Inventory by Martin, Yin, and Baldwin
(1998) were utilized. A sample of 646 pre-service teachers was utilized and overall
participants held positive efficacy beliefs. Differences were found in educational level
and secondary teachers held more positive efficacy beliefs than elementary teachers. The
authors proposed that this was due to higher enrollment in science courses by secondary
educators. No significant differences were found for gender, educational level, or
classroom management. Because most studies regarding science teacher efficacy focus
on the elementary population, more research such as this is needed on the secondary
educator population. Therefore, the current study focused on the secondary science
teacher population grades 6-12.

63
Summary
Constructivist instructional practices significantly influence classroom learning,
from correcting student misconceptions (Bybee, et. al, 2006), to promoting critical
thinking and problem solving (Vieira, Tenreiro-Vieira, & Martins, 2011). Appropriate
practices also help students understand the role of science in society as well as the
importance of empirical work and creativity (Abd-el-Khalick, Bell, & Lederman, 1998).
Constructivist instructional practices promote student centered learning, as opposed to
traditional teacher centered instruction (Woolfolk, 2010). Research regarding
constructivist practice implementation such as this study therefore plays a crucial role in
policy, professional development, and teacher preparation as the Next Generation Science
Standards are put into practice (Huffman, Thomas, & Lawrenz, 2003; Yager, 2005).
A variety of school factors, including years of teaching experience, school
socioeconomic status, class size, and instruction of AP or pre-AP courses may all
influence selection of instructional practices. Unfortunately, studies regarding each of
these factors have yielded mixed results over the years (Achi, 2011; Flower, 2010;
Giglio, 2010; Haimson, 2011; Holley, 2008; Jensen, 2009; McCue, 2011; Payne, 2005;
Picus, 2000; etc…). It was therefore necessary to examine these school factors in the
context of this particular study regarding level of use of constructivist instructional
practices and teacher efficacy level to determine what, if any, effect they had on the
variables in question.
Finally, research on teacher efficacy level has also yielded mixed results over the
years, but despite criticism has been shown to influence a variety of classroom activities

64
including selection of instructional practices (Woolfolk Hoy, 2000). Efficacy research
has several facets, including teacher efficacy and collective efficacy and has been shown
to fluctuate significantly during the early portion of an educator’s career (Henson, 2001;
Woolfolk Hoy, 2000). An examination of teacher efficacy level was needed, therefore,
in relation to level of use of constructivist instructional practices in order to determine if
any differences existed between the levels.

65
CHAPTER 3: RESEARCH METHODS
The purpose of this chapter is to outline the research design and methods used in
completion of this study. The chapter is organized around the following sections:
research design, population, instrument, data collection, and data analysis.
Research Design
A mixed-methods design was used to conduct this study allowing collection of
both qualitative and quantitative data. There are many benefits to a mixed methods
design including clarification of results, lowering cost, shortening timelines, reduction in
measurement error, and improving overall response rates (Dillman, Smyth, & Christian,
2009). Flexibility is another benefit of mixed methods designs (Patton, 2002). Mixing
quantitative and qualitative elements allows a customized approach to data collection and
triangulation of findings. Triangulation of data sources allows the investigator to collect
data about the same topic and/or from the same group through a variety of methods
yielding as much relevant data as possible. Patton discussed the need for the qualitative
portion of mixed methods studies to remain open and flexible; allowing the researcher to
explore emergent trends after data collection begins.
This mixed methods study occurred in two parts. Initial quantitative data
collection occurred via online survey in a one-shot cross sectional manner (Fink, 2003).
The quantitative survey provided descriptive data for one point in time, the 2011-2012
school year. The second part of the study consisted of qualitative follow-up telephone
interviews to triangulate findings from the quantitative study (Patton, 2009).
Respondents elaborated on instructional practices utilized in the classroom, teacher

66
efficacy, and perceived barriers to implementation of constructivist instructional
practices.
Population and Sample
The population for this study included West Virginia science teachers in public
schools at the middle/junior high, and high school level (grades 6-12). West Virginia had
55 counties in 2011-2012 with approximately 125 high schools and 156 middle schools.
According to the West Virginia Department of Education, there were approximately
1,898 science teachers for grades 6-12 in the 2011-2012 school year. A high school
instructor population estimate was obtained using the total number of science teachers in
three AAA high schools, three AA high schools, and three A high schools by calculating
an average for each category. This average was multiplied by the total number of schools
in that category (42, 43, and 40 respectively according to the 2011-2012 WVSSAC rules)
to obtain an estimate of 836 high school science instructors. The high school population
was subtracted from the state department population to obtain an estimate of middle
school science instructors (1,062). The total population was included in the initial
quantitative study.
Because not all potential science educators teach a science course each year,
especially at the middle/junior high school level, an inclusion/exclusion question was
included to indicate whether or not potential respondents were teaching a science course
during the 2011-2012 school year. Only those teachers who indicated they were teaching
a science course in the 2011-2012 school year were included in the study population.

67
Respondents for the qualitative portion of the study were recruited from the
respondents to the initial quantitative survey. A question was placed at the end of the
instrument asking each respondent if they were willing to participate in a follow up
telephone interview by providing a telephone number and/or e-mail address. Of 23
respondents 15 were randomly chosen for telephone interviews.
Instrumentation
Multiple instruments were utilized in this study. The quantitative online survey,
the West Virginia Science Teacher Level of Constructivist Instructional Practice Survey
(WVSTCIP), consisted of three portions, a demographic section, a section for level of use
of selected constructivist instructional practices, and a section for teacher efficacy. The
quantitative survey was a self-administered questionnaire, which provided respondents
with questions to complete independently (Fink, 2003). The demographic section of the
survey included basic questions with categories based on the Teacher Quality Survey
(TQS) from Marshall University, 2011 and the WVSSAC classifications for the 2011-
2012 school year. The complete instrument is included as Appendix A.
The second section of the quantitative survey solicited respondent information on
the level of use of constructivist instructional practices in their science classrooms. This
portion of the instrument was developed from a review of the literature and contained a
list of research-based constructivist instructional practices with a Likart scale of 1-5 for
participants to indicate their level of use for each practice (1= Never Used; 5= Very
Frequent Use). The instrument produced a total score for level of use for constructivist
practices.

68
Part three of the online survey focused on teacher efficacy and utilized a modified
version of the Teachers’ Sense of Efficacy Scale (TSES) by Tschannen-Moran and
Woolfolk Hoy. Permission to use this survey was granted by Anita Woolfolk Hoy in July
2011 (Appendix B). The instrument provided a total score for efficacy and three sub-
scores: Efficacy in Student Engagement (ESE), Efficacy in Instructional Practices (EIP),
and Efficacy in Classroom Management (ECM) (Henson, 2001). The TSES was
originally developed for use with pre-service teachers. The population was extended to
in-service science teachers for the purpose of this study. Prompts were revised to refer to
teaching science instead of general classroom teaching.
Tschannen-Moran and Woolfolk Hoy (2000) originally produced two forms of the
TSES, a long and short. Both use nine point Likert-type scales. The long form contains
24 items and the short form 12 items. The long form of the survey was chosen for this
study (Tschannen-Moran & Woolfolk Hoy, 2000). The WVSTCIP was pilot tested with a
sub-set of science teachers (grades 6, 9, and 10-12) to validate and clarify the survey
prompts. The purposes for the survey, individual items, and item clarity were analyzed.
In addition, the instrument was submitted for expert review by a panel of higher
education faculty with expertise in survey development. Several modifications including
changes in wording to eliminate ambiguity and revisions to narrow the focus to science
education, were made as a result of the pilot study and expert panel review.
The purpose of the follow-up telephone interviews was to collect additional data
for use in validating the initial survey findings. An interview protocol which followed
Borque and Fielder’s (2003) How to Conduct Telephone Surveys 2nd Edition, part of

69
Fink’s The Survey Kit 2 (2003), was developed and utilized to guide the process. This
protocol is provided in Appendix C.
Reliability and Validity
The TSES has been used in numerous studies for pre-service educators and as a
basis for creating other instruments. In the original TSES survey, Tschannen-Moran and
Woolfolk Hoy (2000) conducted two rounds of principle factor analysis from two
independent samples and found three factors that explained 57% of the matrix of
association variance. Convergent and discriminant validity coefficients supported
construct validity. The three factors were: Efficacy in Student Engagement (ESE) (inter-
factor correlation .59 and score reliability .82), Efficacy in Instructional Practices (EIP)
(inter-factor correlation .60 and score reliability .81), and Efficacy in Classroom
Management (ECM) (inter-factor correlation .64 and score reliability .72) (Henson,
2001).
The TSES authors found reliability with alpha of .94 and a standard deviation
(SD) of .94 for the long form of the TSES and reliability with alpha of .90 and an SD of
.98 on the short form of the TSES. Reliability for ESE with alpha .87 and SD 1.1 was
found for the long form and alpha .81 with SD 1.2 for the short form. EIS reliability was
found with alpha .91 and SD 1.1 on the long form and alpha .85 with SD 1.2 on the short
form. Finally, ECM had a reliability of alpha .90 with SD 1.1 on the long form and alpha
.86 with SD 1.2 on the short form (Tschannen-Moran & Woolfolk Hoy, 2000).
Reliability and validity are related. Data must be reliable to be valid (Huck, 2008)
Construct validity for the TSES was examined using a comparison between the
TSES, Rand Items, the Hoy and Woolfolk 10 item scale and the Gibson and Dembo TES

70
(Tschannen-Moran and Woolfolk Hoy, 2001). The TSES scores were positively
correlated in one study with the Rand Items with r= .35 and .28 (p< .01), the Gibson and
Dembo TES with r= .48 (p<.01) and a general teacher efficacy factor with r=.30 (p<.01).
In a second study after further modification the TSES scores were positively correlated in
one study with the Rand Items with r= .18 and .53 (p< .01), the Gibson and Dembo TES
with r= .64 (p<.01) and a general teacher efficacy factor with r=.16 (p<.01). In addition,
the authors measured discriminant validity through comparison with a survey of work
alienation. Teacher efficacy was significantly negatively related to work alienation with
r=.31 (p<.01). The survey was also field tested at Ohio State University by both teachers
and teacher education students to collect feedback. The authors found that the validity
results were good and the items represented the tasks associated with teaching.
Henson (2001) reported that Tschannen-Moran and Woolfolk Hoy (2000) later
ran a second order factor analysis and found that the three sub-scores (ESE, EIS, and
ECM) could be collapsed into one factor with pattern and structure coefficients from .74-
.84, giving the instrument more general application. It can be used to assess the three
sub-scores or for a general efficacy score and was used for both purposes in this study.
Validity for the instructional practices portion of the instrument was assessed via
piloting the instrument with a subset of three science teachers of various grade levels (6,
9, 10-12). Participants were given the instrument to complete and the opportunity to
discuss purpose and clarity of items and make suggestions for improvement in both
verbal and written form (notes on the survey sheet). In addition, the survey was
submitted to a panel of three higher education experts for review and feedback.

71
Data Collection
Following modification of the survey instrument after the expert review, the
instrument was submitted to the Marshall University Institutional Review Board (MU
IRB) for approval. IRB approval was granted on May 4, 2012 (Appendix E). An initial
contact e-mail introducing the study and requesting that the survey link be forwarded to
any instructor in their building teaching one or more science courses in the 2011-2012
school year was sent to the middle/junior high and high school principals on May 7,
2012. The principals were e-mailed utilizing the email addresses posted to the West
Virginia Department of Education website for the 2011-2012 school year. Permission
and instructions for use of this list of e-mails was granted April 23, 2012 (Appendix B).
The online survey link was sent via SurveyMonkey to principals on May 9, 12,
21, and 30, 2012 in a message designed to be easily forwarded to teachers (Appendix D).
By forwarding the link to teachers the principal granted permission for participation.
Teacher participation in the study indicated consent as per the cover letter included on the
first page of the survey. Results were collected in SurveyMonkey and downloaded into
SPSS. The quantitative survey was closed on June 11, 2012.
There were no required questions in the survey; respondents could skip questions,
move forward and back in the survey answering questions in order of preference, or quit
at any time. However, the nature of the survey resulted in missing data. An operational
decision was made to include only data sets in which respondents answered 80% of the
questions in the section under analysis (instructional practices and/or efficacy). Failure to
answer 80% of the questions resulted in omission of that set from analysis. Based on

72
these criteria (the inclusion/exclusion question and 80% minimum answer rate per
section), the survey yielded 201 total responses with 190 useable responses.
Survey participants were given the opportunity to participate in qualitative follow-
up interviews. Fifteen of the potential participants were contacted to participate in the
follow-up interviews. Verbal consent for participation was obtained and participants
were asked the questions on the interview guide. No identifying information was
collected and responses were typed not recorded. Initial analysis of three interviews was
conducted and these results were used to frame the final analysis of all interviews
(Appendix J).
Data Analysis
Data analysis for the quantitative survey results was completed using the
Statistical Package for the Social Sciences (SPSS) software. The following statistical
analyses were performed to answer each research question.
For Research Question One, total constructivist instructional practice score was
calculated by summing the individual responses for each of the 16 practices. A one
sample t-test was conducted to compare this sample mean and that of each instructional
practice to the mean score from a hypothetical normal distribution.
For Research Question Two, differences in level of use for each of the selected
constructivist instructional practices and the total implementation score were analyzed
based on selected demographic variables. An independent samples t-test was used to
determine if significant differences existed in the level of use for each practice and the
total level of use of constructivist practices based on school level (middle vs. high school)

73
and whether or not an instructor taught an AP or pre-AP course in the preceding five
years (including 2011-2012) by comparing the means from the two groups. A one-way
Analysis of Variance (ANOVA) was used to determine if significant differences existed
in the level of constructivist practice implementation for each practice and the total, based
on participants’ total years of teaching experience, years of teaching science, school SES
level, size of the student population, and number of students in the science classroom.
For Research Question Three, the total efficacy score was calculated by summing
the 24 individual efficacy prompts. A one sample t-test was conducted to compare this
sample mean as well as individual prompts to the mean score from a hypothetical normal
distribution. The 24 prompts were divided into three groups of eight to obtain efficacy
sub-scores for Efficacy in Student Engagement (ESE), Efficacy in Instructional Practice
(EIP), and Efficacy in Classroom Management (ECM). A one sample t-test was
conducted to compare these sub-score means to the hypothetical mean score as well.
For Research Question Four, differences in science teacher efficacy for the total
efficacy score (TE) and three efficacy sub-scores (ESE, EIP, and ECM) were analyzed
based on demographic variables. An independent samples t-test was used to determine if
significant differences existed in TE and the three sub-scores for school level (middle
school vs. high school) and whether or not an instructor taught an AP or pre-AP course in
the preceding five years including the 2011-2012 school year by comparing the means
from the two groups. A one-way Analysis of Variance (ANOVA) was used to determine
if a significant difference existed in TE or the sub-scores based on participants’ total
years of teaching experience, years of teaching science, school SES level, size of the
student population, and the number of students in the science classroom.

74
For Research Question Five, the total constructivist practice score, 16 individual
constructivist practice scores, total efficacy score, and three efficacy sub-scores were
compared using a Pearson Product-Moment Correlation to determine if a significant
relationship existed. Holcomb’s (2006) categories of relationship strength were used in
each of these comparisons: 0.00 = no relationship, .01-.24 = weak, .25-.49 = moderate,
.50-.74 = moderately strong, .75-.99 = very strong, and 1.00 = perfect.
The results from the follow-up interviews were analyzed using emergent category
analysis (Zhang & Wildemuth, 2009). Responses were categorized by common themes,
allowing analysis of the qualitative data for emergent trends and corroboration of results.
Sections two and three of the quantitative survey (constructivist instructional
practices and teacher efficacy) were examined for reliability using internal consistency,
or the degree to which the items measure the same construct (Pallant, 2007) using
Cronbach’s alpha coefficient. Cronbach’s alpha was performed for each of the 16
constructivist instructional practices, the individual efficacy prompts, total efficacy, and
the three efficacy sub-scores (ESE, EIP, and ECM).
Limitations
Due to the subject specific training provided to science educators, the results of
this analysis are limited to science teachers in West Virginia middle/junior high and high
schools and are not generalizable to other educator populations. Limitations associated
with sample size may also affect results. The efficacy portion of the instrument was also
designed for pre-service elementary teachers although the target population consisted of
in-service secondary teachers.

75
CHAPTER 4: FINDINGS
The purpose of this study was to determine the difference, if any, between teacher
efficacy level and the level of use of selected, constructivist, instructional practices in
science classrooms in West Virginia. The purpose of this chapter is to present and
discuss study findings. This chapter is organized into the following sections: data
collection, demographics (participant and school), major findings for each of the five
research questions, ancillary findings, and a summary of findings.
Data Collection
The study was a mixed methods design with a one-shot cross sectional survey and
follow up interviews. Initial permission (Appendix F) was granted by the MU IRB May
4, 2012. Following IRB approval, an introductory email (Appendix D) was sent to the
state’s 125 public high school and 156 public middle school principals on May 7, 2012.
The email introduced the survey and requested assistance with distribution of the
electronic survey to science teachers via SurveyMonkey. On May 9, 2012, the survey
link was sent to 123 high school principals (two principals declined to participate) and
156 middle school principals. Follow up requests were sent May 9, 14, 21, and 30, 2012
(Appendix D). Two hundred and one (N = 201) teachers responded to the survey. Data
collection was closed on June 11, 2012.
Of the 201 total responses, 190 responses were deemed usable. Usability was
determined by two inclusion criteria. The first question of the survey asked the
respondent to indicate whether or not they taught one or more science courses in the
2011-2012 school year. Only respondents answering “yes” to this question were

76
included in the analysis. The second inclusion criterion was completion of 80% of the
survey questions in the instructional practices and teacher efficacy portions of the survey.
Participant Characteristics
The participants in this study were teachers in West Virginia who taught one or
more science courses in the 2011-2012 school year in one of the state’s public middle,
junior high, or high schools. Part one of the survey requested that teachers indicate the
school level at which they taught in 2011-2012, total years of teaching experience, years
of teaching science, and if they taught an AP or pre-AP course.
A slightly larger percentage of high school teachers, 52.1% (n = 99), than middle
school teachers, 46.8% (n = 89), responded to the survey. The largest percentage of
respondents, 29.5% (n = 56), had five or fewer total years of teaching experience. And
the smallest percentage of respondents, 10.0% (n = 19), had 16-20 years of experience.
The largest group of respondents, 34.2% (n = 65), had five or fewer years of science
teaching experience and the smallest group, 7.9% (n = 15), had 21-25 years teaching
science. The data on respondent years of teaching experience are presented in Table 1.
Respondents were also asked to indicate the subject or subjects they taught
(general science, chemistry, biological science, environmental or earth science, physical
science, or physics) in 2011-2012. Over half of the respondents, 51.6% (n = 98), taught
general science, followed by biological sciences, 32.6% (n = 62). The fewest number of
respondents taught physics, 13.2% (n = 25). These data are presented in Table 1.

77
Table 1
Subjects Taught by Participants and Years of Teaching Experience
Characteristic n %
*Subject Taught
General Science
Chemistry
Biological Science
Environmental Science or Earth Science
Physical Science
Physics
98
38
62
34
48
25
51.6
20.0
32.6
17.9
25.3
13.2
Years Teaching
5 or less
6 – 10
11 – 15
16 – 20
21 – 25
26+
Years Teaching Science
56
28
24
19
21
42
29.6
14.7
12.6
10.0
11.1
22.1
5 or less
6 – 10
11 – 15
16 – 20
21 – 25
26+
65
34
25
18
15
33
34.2
17.9
13.2
9.5
7.9
17.4
N = 190 *Duplicated Count
Respondents were also asked if they had taught one or more Advanced Placement
(high school) or Pre-Advanced Placement (middle school) courses in 2011-2012. Thirty-
seven respondents (19.5%) indicated that they had taught at least one such course.

78
School Characteristics
Survey participants were asked three school demographic questions: school SES
level based on federal guidelines for percent of students eligible for free and reduced
lunch; the size of the student population based on the WVSSAC school classification
system (A, AA, and AAA); and the number of students in an average science class at the
school. These data are presented in Table 2.
Table 2
School Demographics
Characteristic n %
Students Eligible for Free and Reduced Lunch (SES Level)
Less than 35%
36-50%
51-75%
76% +
9
57
82
29
4.7
30.0
43.2
15.3
Number of Students in School
339 or less (A)
340-618 (AA)
619 + (AAA)
26
79
84
13.7
41.6
44.2
Typical Number of Students in Science Classroom
11-15
16-20
21-25
26 +
5
32
102
50
2.6
16.8
53.7
26.3
N=190
More than half (58.5%, n = 111) of the respondents reported student eligibility for
free and reduced lunch at 51% or greater. More than 85% of the respondents were from

79
AA (41.6%, n = 79) or AAA (44.2%, n = 84) schools. Eight of ten respondents reported
the typical number of students in the science classes in their schools contained 21-25
(53.7%, n = 102) or 26+ (26.3%, n = 50) students.
Findings
Five major research questions were addressed during this study. This section
presents the findings for each of the major research questions and includes sections
addressing ancillary findings, and instrument reliability. A final section provides a
summary of the findings.
Levels of Use of Selected Constructivist Instructional Practices
Participating science teachers were asked to indicate their level of use of each of
the 16 instructional practices on a Likert scale of 1 – 5, with 1 = Never, 2 = Hardly Ever,
3 = Sometimes, 4 = Frequently, and 5 = Very Frequently. A one sample t-test was
conducted to compare the sample mean for each instructional practice to the mean score
(M = 3.0, R = 1.0-5.0) from a hypothetical normal distribution. A total constructivist
instructional practice score was calculated for each subject by summing the individual
responses for each of the 16 practices. A one-sample t-test was used to compare this total
mean score with the mean (M = 48, R = 16-80) from a hypothetical normal distribution.
Analysis of respondent mean scores for the 16 constructivist instructional
practices yielded three levels of response. Six strategies had mean scores greater than
3.5. Four strategies had mean scores that fell between 3.0-3.49. Six strategies had mean
scores less than 3.0. Means ranged from 2.26 - 3.92

80
Instructional strategies with means greater than 3.60 included: grouping students
in order to divide a larger task and work together to complete it (M = 3.60, SD = .822,
p<.001), providing ideas related to a topic and form new connections and deeper
understanding of the topic (M = 3.92, SD = .707, p<.001), and pooling collective student
knowledge in groups or class wide to share ideas and clarify understanding (M = 3.69,
SD = .757, p<.001). Instructional strategies with means greater than 3.5 also included
providing students with examples and attributes of a word/topic which students utilize to
form a definition (M = 3.58, SD = .925, p<.001), asking questions of students and lead
students to ask questions of one another (M = 3.53, SD = .943, p<.001), and identifying a
theme, essential question, or big idea and have students use supplemental material to
explore the topic (M = 3.52, SD = .960, p<.001).
Instructional strategies with means ranging from 3.20 - 3.49 included: requiring
students to work together to solve a problem that mimics one found in the real world (M
= 3.49, SD = .923, p<.001), requiring students to work at their own pace through a cycle
of questioning, seeking answers, and reflection (M = 3.27, SD = .838, p<.001), and
requiring students to formulate and solve a problem with a focus on creating a concrete
product (M = 3.31, SD = .911, p<.001). Having students list all important facts,
participants, actions, feelings, reasons, and alternative solutions to problems also had a
mean greater than 3.0 (M = 3.14, SD = .831, p<.05).
Strategies with means less than 3.0 included: having students assume the roles of
others and experience new perspectives to solve a problem (M = 2.65, SD = .887,
p<.001), alternating roles with students to summarize, predict, and clarify passages (M =
2.73, SD = .938, p<.001), and requiring students to explore situations outside the

81
classroom in museums, gardens, with guest speakers, etc…(M = 2.26, SD =.828, p<.001).
Allowing students to choose a topic or a problem, look for causes, supports, and effects
also resulted in a mean less than 3.0 (M = 2.77, SD =.822, p<.001).
When a one-sample t-test was used to compare the mean score (3.0) from a
hypothetical normal distribution to the sample mean for each item, only two of the six
practices with means of less than 3.0 were not found to be statistically significant. The
two practices were having students list as many items as possible related to a topic and
grouping/regrouping them by similarities (M = 2.92, SD = .895, p = .234), and providing
students with a topic to describe, create analogies, identify conflicts, and evaluate
findings (M = 2.95, SD = .941, p = .466).
A one sample t-test was performed for the total level of constructivist practice
implementation. The total level of practice was obtained by summing each of the scores
for the individual practices and calculating the overall mean. This value (M = 50.84, SD
= 8.65) was compared to the mean (M = 48, R = 16-80) for a hypothetical normal
distribution and was found to be significant at the p <.001 level (t = 4.326). These data
are provided in Table 3.

82
Table 3
Level of Use of Selected Constructivist Instructional Practices by Secondary Science Teachers
Prompt M SD t-value 1. Group students in order to divide a larger task and work together to complete it.
3.60 .822 9.724***
2. Provide ideas related to a topic and form new connections and deeper understanding of the topic.
3.92 .707 17.224***
3. Pool collective student knowledge in groups or class wide to share ideas and clarify understanding.
3.69 .757 11.983***
4. Provide students with examples and attributes of a word/topic which students utilize to form a definition.
3.58 .925 8.265***
5. Have students list as many items as possible related to a topic and group/regroup them by similarities.
2.92 .895 -1.193
6. Ask questions of students; lead students to question one another. 3.53 .943 7.318***
7. Provide students with a topic; they describe it, create analogies, identify conflicts, and evaluate the result.
2.95 .941 -.731
8. Allow students to choose a topic or problem, look for causes, supports, and effects.
2.77 .822 -3.607***
9. Have students list all important facts, participants, actions, feelings, reasons, and alternative solutions to a problem.
3.14 .831 2.197*
10. Identify a theme, essential question, or big idea and have students use supplemental material to explore the topic.
3.52 .960 7.089***
11. Have students assume the roles of others and experience new perspectives to solve a problem.
2.65 .887 -5.191***
12. Alternate roles with students to summarize, predict, and clarify 2.73 .938 -3.701***
13. Require students to explore situations outside the classroom in museums, gardens, with guest speakers, etc…
2.26 .828 -11.555***
14. Require students to work together to solve a problem that mimics one found in the real world.
3.49 .923 6.879***
15. Require students to work at their own pace through a cycle of questioning, seeking answers, and reflection.
3.27 .838 4.275***
16. Require students to formulate and solve a problem with a focus on creating a concrete product.
3.31 .911 4.423***
*** p <.001, **p <.01, *p <.05: Scale: 1=Never 2=Hardly Ever 3= Sometimes 4=Frequently 5=Very Frequently; N= 190 R = 16-80

83
Levels of Use Based on Demographic Variables
Survey respondents were initially asked a series of demographic questions. This
section examines the differences in level of use of constructivist instructional practices
based on their responses to selected demographic variables. The differences in levels of
use for each instructional practice and the total level of use score for school level and AP
instruction were investigated using an independent samples t-test. The differences in
levels of use for each instructional practice and the remaining demographic variables
were investigated using Analysis of Variance (ANOVA).
An independent samples t-test was used to determine if significant differences
existed in the level of use of constructivist practices and school level (middle school or
high school). Teachers indicating that they taught both middle school and high school
level courses were collapsed into the middle school category. The analysis for two of the
individual practices, having students assume the role of others to experience new
perspectives and solve problems (High School: M = 2.80, SD = .808 Middle School: M
= 2.48, SD = .926, p < .05) and alternating roles with students to summarize, predict, and
clarify passages (High School: M = 2.94, SD = .827 Middle School: M = 2.51, SD =
.967, p < .01), resulted in significantly different levels of use between middle and high
school teachers with middle school significantly higher for both practices. There were no
significant differences in level of use based on school level for any other individual
instructional practices or the total use level. These data are provided in Table 4

84
Table 4
Mean Differences between School Level and Level of Use of Constructivist Instructional Practices (Individual and Total)
______________________________________________________________________________ Middle School High School
Constructivist Practice M SD M SD t 1. Group students in order to divide a larger task and work together to complete.
3.63 .794 3.56 .840 .546
2. Provide ideas related to a topic and form new connections and deeper understanding.
3.90 .713 3.92 .699 -.200
3. Pool collective student knowledge, group, share ideas, clarify understanding.
3.76 .746 3.61 .755 1.292
4. Provide students with examples/ attributes of a word/topic to form a definition.
3.56 .851 3.60 .985 -.282
5. Have students list as many items as possible related to a topic and group/regroup them by similarities.
3.00 .775 2.83 .986 1.220
6. Ask questions of students and lead students to ask questions of one another.
3.61 .864 3.44 .999 1.206
7. Provide students with a topic; they describe it, create analogies, identify conflicts, and evaluate the results.
2.99 .981 2.90 .905 .614
8. Allow students to choose a topic or problem, locate cause, effect and supports.
2.85 .739 2.69 .882 1.321
9. Have students list all important facts, participants, actions, feelings, reasons, and alternative solutions to a problem.
3.18 .687 3.08 .927 .838
10. Identify a theme, essential question, or big idea and have students use supplemental material to explore the topic.
3.65 .873 3.39 1.013 1.789
11. Have students assume the roles of others; use new perspectives to solve problems.
2.80 .808 2.48 .926 2.413*
12. Alternate roles with students to summarize, predict, and clarify passages.
2.94 .827 2.51 .967 3.056**
13. Require students to explore situations outside the classroom in museums, gardens, with guest speakers, etc…
2.34 .830 2.18 .824 1.248
14. Require students to work together to solve a real world problems
3.46 .899 3.49 .939 -.187
15. Require students to work at their own pace through a cycle of questioning, seeking answers, and reflection.
3.38 .784 3.17 .877 1.691
16. Require students to formulate and solve a problem with focus on creating a product.
3.30 .748 3.29 1.030 .115
Total Constructivist Practice Level 51.78 8.006 49.74 8.865 1.575 n = 84 (Middle School) n = 90 (High School) *p < .05 **p < .01

85
A one-way Analysis of Variance (ANOVA) was used to determine if significant
differences existed in the level of constructivist practice implementation based on
participants’ total years of teaching experience. Two practices, alternating roles with
students to summarize, predict, and clarify passages (5 or less: M = 2.94, SD = .904; 6-
10: M = 2.39, SD = .941; 11-15: M = 2.71, SD = .624; 16-20: M = 3.38, SD = 1.204;
21-25: M = 2.47, SD = .841; 26+: M = 2.51, SD = .919; f = 3.535, p<.05) and
requiring students to explore situations outside the classroom in museums, gardens, with
guests, etc… (5 or less: M = 1.92, SD = .821; 6-10: M = 2.22, SD = .850; 11-15: M =
2.26, SD = .810; 16-20: M = 2.76, SD = .664; 21-25: M = 2.29, SD = .849; 26+: M
= 2.51, SD = .731; f = 4.011, p<.05) were significantly different based on years of
experience. The highest mean score was reported for the 16-20 years of experience group
for both practices. There were no statistically significant differences in level of use of
constructivist practices based on total years of teaching experience for any other
individual instructional practices or the total level of use. These data are provided in
Table 5.

86
Table 5
Mean Differences in Level of Use of Constructivist Instructional Practices Based on Total Years of Teaching Experience___________
5 or fewer 6-10 11-15 16-20 21-25 26 +
Constructivist Practices M SD M SD M SD M SD M SD M SD f 1. Group students to divide a larger task; work together to complete
3.75 .806 3.48 .918 3.54 .721 3.67 .686 3.61 .916 3.47 .862 .704
2. Provide ideas related to a topic, form new connections and deeper understanding.
3.96 .678 4.00 .659 3.79 .658 4.00 .707 3.74 .733 3.95 .804 .561
3. Pool collective knowledge in groups or class wide to share ideas and clarify.
3.70 .749 3.75 .737 3.63 .647 3.94 .827 3.53 .612 3.63 .883 .656
4. Provide students with examples and attributes for students utilize to form a definition.
3.63 .871 3.63 .824 3.50 .834 4.12 .928 3.22 .878 3.49 1.070 1.883
5. Have students list as many items as possible and group/regroup them by similarities.
2.96 .816 2.63 1.056 3.00 .834 3.12 .993 2.89 .963 2.92 .862 .747
6. Ask questions of students and lead students to ask questions of one another.
3.67 1.013 3.21 .884 3.57 .728 3.76 1.091 3.39 .778 3.49 .989 1.088
7. Provide students with a topic; they describe it, create analogies, identify conflicts, and evaluate.
2.87 .841 3.00 .953 3.00 .853 3.18 1.380 2.63 .831 3.05 .941 8.28
8. Allow students to choose a topic or problem, look for causes, supports, and effects.
2.73 .819 2.67 1.007 2.88 .741 2.82 .883 2.63 .895 2.89 .699 .454
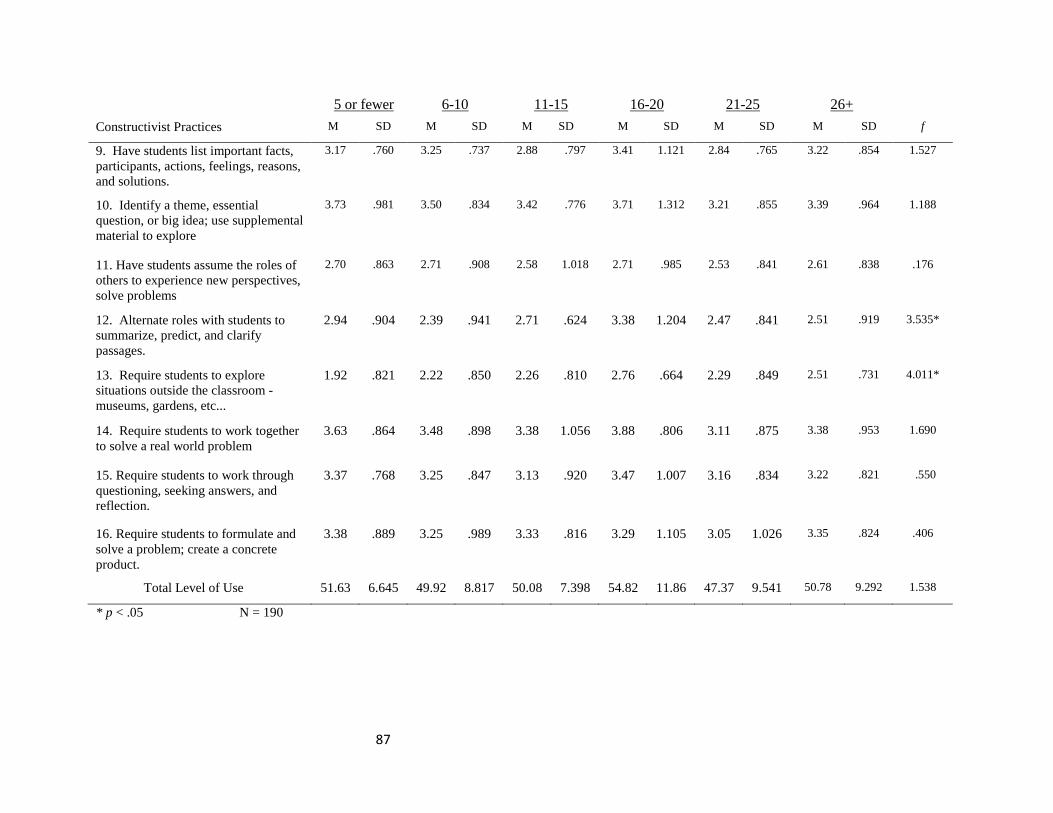
87
* p < .05 N = 190
5 or fewer 6-10 11-15 16-20 21-25 26+
Constructivist Practices M SD M SD M SD M SD M SD M SD f
9. Have students list important facts, participants, actions, feelings, reasons, and solutions.
3.17 .760 3.25 .737 2.88 .797 3.41 1.121 2.84 .765 3.22 .854 1.527
10. Identify a theme, essential question, or big idea; use supplemental material to explore
3.73 .981 3.50 .834 3.42 .776 3.71 1.312 3.21 .855 3.39 .964 1.188
11. Have students assume the roles of others to experience new perspectives, solve problems
2.70 .863 2.71 .908 2.58 1.018 2.71 .985 2.53 .841 2.61 .838 .176
12. Alternate roles with students to summarize, predict, and clarify passages.
2.94 .904 2.39 .941 2.71 .624 3.38 1.204 2.47 .841 2.51 .919 3.535*
13. Require students to explore situations outside the classroom - museums, gardens, etc...
1.92 .821 2.22 .850 2.26 .810 2.76 .664 2.29 .849 2.51 .731 4.011*
14. Require students to work together to solve a real world problem
3.63 .864 3.48 .898 3.38 1.056 3.88 .806 3.11 .875 3.38 .953 1.690
15. Require students to work through questioning, seeking answers, and reflection.
3.37 .768 3.25 .847 3.13 .920 3.47 1.007 3.16 .834 3.22 .821 .550
16. Require students to formulate and solve a problem; create a concrete product.
3.38 .889 3.25 .989 3.33 .816 3.29 1.105 3.05 1.026 3.35 .824 .406
Total Level of Use 51.63 6.645 49.92 8.817 50.08 7.398 54.82 11.86 47.37 9.541 50.78 9.292 1.538

88
A one-way analysis of variance (ANOVA) was used to determine if a significant
difference existed in the level of constructivist practice implementation based on
participants’ years of teaching science. Only one practice, requiring students to explore
situations outside the classroom in museums, gardens, with guest speakers, etc... was
significant at the p < .05 level (5 or less: M = 2.00, SD = .823; 6-10: M = 2.21, SD =
.876; 11-15: M = 2.35, SD = .832; 16-20: M = 2.50, SD = .855; 21-25: M = 2.46, SD
= .660; 26+: M = 2.57, SD = .728; f = 2.581, p<.05). The highest mean score was
reported for the 26+ age group for this practice. There were no statistically significant
differences in level of use of constructivist instructional practices based on total years of
teaching science for any other individual instructional practices or the total
implementation level score. These data are provided in Table 6.

89
Table 6
Mean Differences in Level of Use of Constructivist Instructional Practices Based on Years of Teaching Science_______________________________________
5 or fewer 6-10 11-15 16-20 21-25 26 +
Constructivist Practices M SD M SD M SD M SD M SD M SD f 1. Group students to divide a larger task; work together to complete
3.69 .801 3.57 .858 3.48 .770 3.86 .864 3.73 .799 3.37 .850 1.118
2. Provide ideas related to a topic, form new connections and deeper understanding.
3.94 .698 3.93 .651 .853 3.04 1.036 .663 4.00 .535 3.97 .765 .233
3. Pool collective knowledge in groups/class to share ideas and clarify.
3.73 .728 3.76 .739 3.60 .816 3.71 .726 3.53 .743 3.67 .844 .276
4. Provide students with examples and attributes for students utilize to form a definition.
3.60 .848 3.62 .862 3.61 1.033 3.71 .994 3.47 .990 3.50 1.042 .165
5. Have students list as many items as possible and group/regroup them by similarities.
3.07 .892 2.69 .891 3.00 .905 2.79 1.122 2.73 .799 2.93 .828 .938
6. Ask questions of students and lead students to ask questions of one another.
3.68 .965 3.21 .819 3.59 .854 3.50 1.092 3.60 .828 3.47 1.042 1.064
7. Provide students with a topic; they describe it, create analogies, identify conflicts, and evaluate.
2.87 .853 3.04 1.036 2.92 .881 3.00 1.468 2.73 .799 3.13 .860 .534
8. Allow students to choose a topic or problem, look for causes, supports, and effects.
2.79 .789 2.69 .891 2.79 .884 2.64 1.008 2.67 .816 2.93 .691 .407

90
* p < .05 N = 173
5 or Fewer 6-10 11-15 16-20 21-25 26+
Constructivist Practices M SD M SD M SD M SD M SD M SD f
9. Have students list important facts, participants, actions, feelings, reasons, and solutions.
3.20 .771 3.07 .651 3.00 .834 3.14 1.351 3.07 .704 3.23 .898 .328
10. Identify a theme, essential question, or big idea; use supplemental material to explore
3.70 .908 3.45 .870 3.50 .933 3.29 1.267 3.40 .910 3.41 1.053 .735
11. Have students assume the roles of others to experience new perspectives, solve problems
2.66 .870 2.76 .951 2.54 .977 2.43 .756 2.73 .884 2.67 .884 .355
12. Alternate roles with students to summarize, predict, and clarify passages.
2.90 .885 2.46 .962 2.96 .859 2.83 1.193 2.53 .915 2.53 .937 1.564
13. Require students to explore situations outside the classroom - museums, gardens, etc...
2.00 .823 2.21 .876 2.35 .832 2.50 .855 2.46 .660 2.57 .728 2.581*
14. Require students to work together to solve a real world problem
3.58 .850 3.54 .922 3.29 .999 3.50 1.092 3.67 1.047 3.30 .877 .716
15. Require students to work through questioning, seeking answers, and reflection.
3.36 .731 3.21 .774 3.22 1.085 3.14 1.099 3.47 .834 3.17 .791 .506
16. Require students to formulate and solve a problem; create a concrete product.
3.41 .844 3.07 .884 3.29 .908 3.14 1.351 3.40 1.121 3.37 .718 .694
Total Level of Use 51.56 6.477 49.86 8.327 50.13 10.38 50.43 13.97 50.87 8.374 51.10 8.957 .198

91
An independent samples t-test was used to determine if significant differences
existed in the level of constructivist practice implementation and whether or not an
instructor taught an AP or pre-AP course in the 2011-2012 school year. Only one of the
individual practices, pooling collective student knowledge in groups or class wide to
share ideas and clarify understanding, was significant at the p < .05 level (AP: M = 3.44;
SD = .736 No AP: M = 3.75; SD = .753; t = -2.200). The highest mean score was
reported for the No AP group for this practice. There were no statistically significant
differences in level of use based on AP instruction for any other individual instructional
practices or the total implementation level score. These data are provided in Table 7.
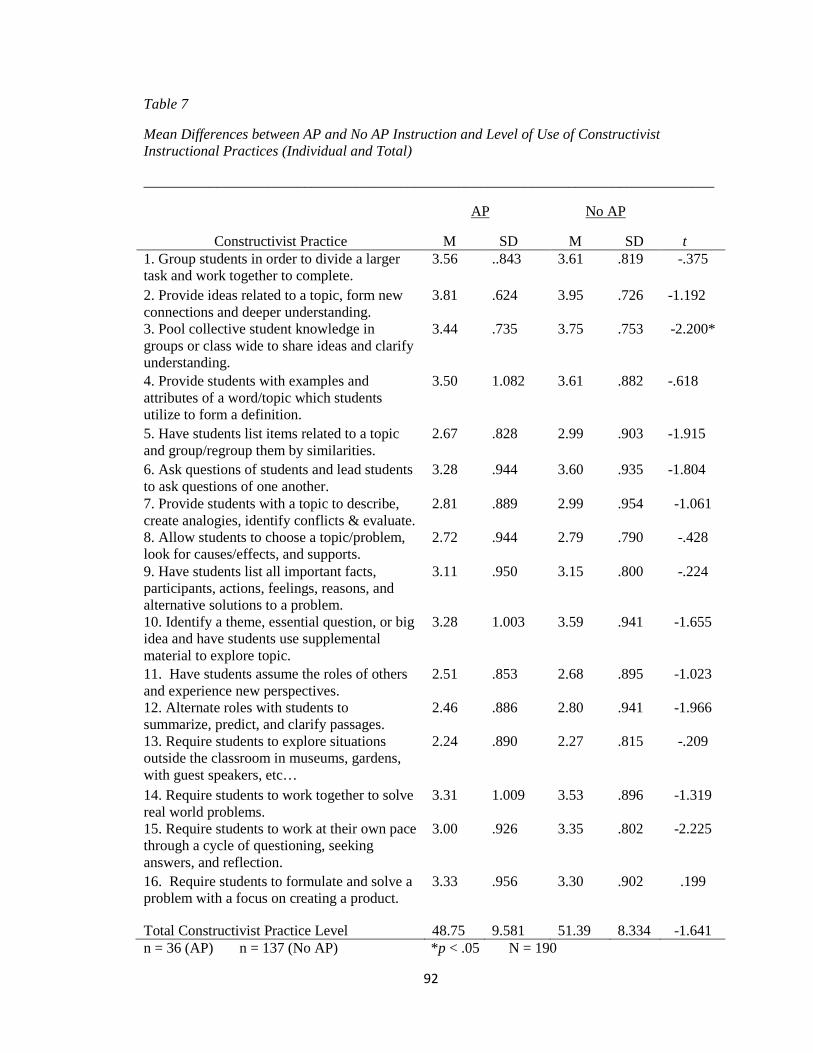
92
Table 7
Mean Differences between AP and No AP Instruction and Level of Use of Constructivist Instructional Practices (Individual and Total)
______________________________________________________________________________
AP No AP
Constructivist Practice M SD M SD t 1. Group students in order to divide a larger task and work together to complete.
3.56 ..843 3.61 .819 -.375
2. Provide ideas related to a topic, form new connections and deeper understanding.
3.81 .624 3.95 .726 -1.192
3. Pool collective student knowledge in groups or class wide to share ideas and clarify understanding.
3.44 .735 3.75 .753 -2.200*
4. Provide students with examples and attributes of a word/topic which students utilize to form a definition.
3.50 1.082 3.61 .882 -.618
5. Have students list items related to a topic and group/regroup them by similarities.
2.67 .828 2.99 .903 -1.915
6. Ask questions of students and lead students to ask questions of one another.
3.28 .944 3.60 .935 -1.804
7. Provide students with a topic to describe, create analogies, identify conflicts & evaluate.
2.81 .889 2.99 .954 -1.061
8. Allow students to choose a topic/problem, look for causes/effects, and supports.
2.72 .944 2.79 .790 -.428
9. Have students list all important facts, participants, actions, feelings, reasons, and alternative solutions to a problem.
3.11 .950 3.15 .800 -.224
10. Identify a theme, essential question, or big idea and have students use supplemental material to explore topic.
3.28 1.003 3.59 .941 -1.655
11. Have students assume the roles of others and experience new perspectives.
2.51 .853 2.68 .895 -1.023
12. Alternate roles with students to summarize, predict, and clarify passages.
2.46 .886 2.80 .941 -1.966
13. Require students to explore situations outside the classroom in museums, gardens, with guest speakers, etc…
2.24 .890 2.27 .815 -.209
14. Require students to work together to solve real world problems.
3.31 1.009 3.53 .896 -1.319
15. Require students to work at their own pace through a cycle of questioning, seeking answers, and reflection.
3.00 .926 3.35 .802 -2.225
16. Require students to formulate and solve a problem with a focus on creating a product.
3.33 .956 3.30 .902 .199
Total Constructivist Practice Level 48.75 9.581 51.39 8.334 -1.641 n = 36 (AP) n = 137 (No AP) *p < .05 N = 190
93
A one-way analysis of variance (ANOVA) was used to determine if a significant
difference existed in the level of use of constructivist practices based on participants’
school SES level (as measured with a self-reported question). No significant differences
based on SES level were found for any individual practice or for the total level of use of
constructivist instructional practices and school SES level (f = .479). These data are
provided in Table 8.

94
Table 8
Mean Differences between School SES Level and Level of Use of Constructivist Instructional Practices (Individual and Total)_____________________________________________________________________________________________________
< 35% 35-50% 51-75% 76 + % Totals
Constructivist Practices M SD M SD M SD M SD M SD f 1. Group students to divide a larger task; work together to complete
3.56 .882 3.58 .825 3.66 .861 3.59 .694 3.62 .819 .131
2. Provide ideas related to a topic, form new connections and deeper understanding.
4.11 .601 3.88 .758 3.88 .707 4.00 .679 3.92 .711 .436
3. Pool collective knowledge in groups or class wide to share ideas and clarify.
3.78 .667 3.65 .789 3.68 .658 3.63 .926 3.67 .744 .096
4. Provide students with examples and attributes for students utilize to form a definition.
3.56 1.130 3.57 .900 3.55 .859 3.70 1.068 3.58 .917 .198
5. Have students list as many items as possible and group/regroup them by similarities.
2.67 .866 2.80 .939 3.00 .864 3.04 .854 2.93 .886 .896
6. Ask questions of students and lead students to ask questions of one another.
3.78 .833 3.45 .986 3.53 .949 3.73 .962 3.55 .955 .667
7. Provide students with a topic; they describe it, create analogies, identify conflicts, and evaluate.
3.22 1.093 2.86 .990 2.99 .866 3.04 .999 2.97 .935 .499
8. Allow students to choose a topic or problem, look for causes, supports, and effects.
2.56 .726 2.75 .868 2.82 .839 2.89 .698 2.79 .818 .455
9. Have students list important facts, participants, actions, feelings, reasons, and solutions.
3.00 .707 3.20 .895 3.23 .841 3.00 .555 3.17 .811 .700
10. Identify a theme, essential question, or big idea; use supplemental material to explore
3.88 .991 3.40 1.030 3.51 .982 3.78 .751 3.54 .966 1.252
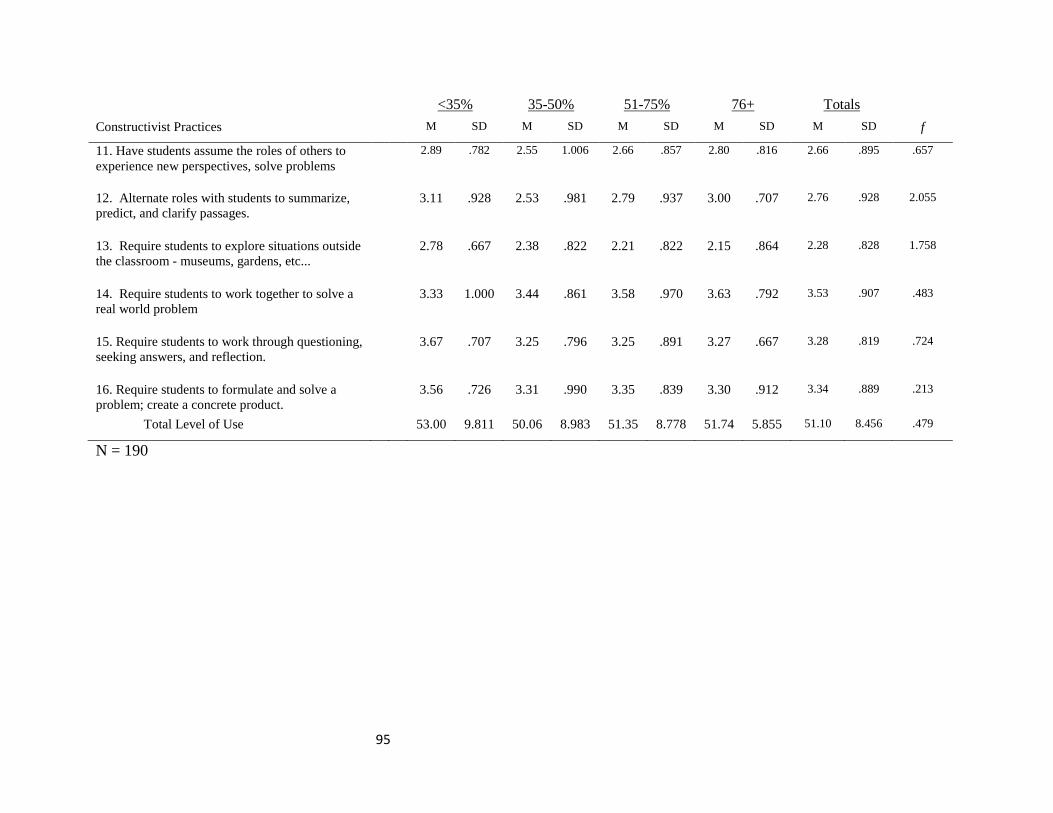
95
N = 190
<35% 35-50% 51-75% 76+ Totals
Constructivist Practices M SD M SD M SD M SD M SD f
11. Have students assume the roles of others to experience new perspectives, solve problems
2.89 .782 2.55 1.006 2.66 .857 2.80 .816 2.66 .895 .657
12. Alternate roles with students to summarize, predict, and clarify passages.
3.11 .928 2.53 .981 2.79 .937 3.00 .707 2.76 .928 2.055
13. Require students to explore situations outside the classroom - museums, gardens, etc...
2.78 .667 2.38 .822 2.21 .822 2.15 .864 2.28 .828 1.758
14. Require students to work together to solve a real world problem
3.33 1.000 3.44 .861 3.58 .970 3.63 .792 3.53 .907 .483
15. Require students to work through questioning, seeking answers, and reflection.
3.67 .707 3.25 .796 3.25 .891 3.27 .667 3.28 .819 .724
16. Require students to formulate and solve a problem; create a concrete product.
3.56 .726 3.31 .990 3.35 .839 3.30 .912 3.34 .889 .213
Total Level of Use 53.00 9.811 50.06 8.983 51.35 8.778 51.74 5.855 51.10 8.456 .479
96
A one-way analysis of variance (ANOVA) was used to determine if a significant
difference existed in the level of use of constructivist practices based on participants’
school size (as measured with a self-reported question) based upon the WVSSAC school
classification system for the 2011-2012 school year. (A = 339 or fewer students, AA =
340-618 students, AAA = 619 or more students). Only one individual practice was
significant at the p< .05 level, requiring students to formulate and solve a problem with
focus on creating a concrete product (A: M = 3.08; SD = .891; AA: M = 3.53; SD =
.944; AAA: M = 3.20; SD = .894 Totals: M = 3.31; SD = .908 f = 3.570; p<.05).
The highest mean score for this practice occurred in the AA category (M = 3.53; SD =
.944) but the lowest mean was the A category (M = 3.08; SD = .891). There were no
statistically significant differences in level of use based on school size for any other
individual instructional practices or the total implementation level score. These data are
provided in Table 9.

97
Table 9
Mean Differences between School Size (A, AA, and AAA) Based on Level of Use of Constructivist Instructional Practices (Individual and Total)__________________________________________________________________________________
A AA AAA Totals
Constructivist Practices M SD M SD M SD M SD f 1. Group students to divide a larger task; work together to complete
3.50 .648 3.70 .835 3.55 .863 3.61 .823 .893
2. Provide ideas related to a topic, form new connections and deeper understanding.
3.85 .784 4.01 .686 3.87 .695 3.93 .705 .962
3. Pool collective knowledge in groups or class wide to share ideas and clarify.
3.77 .765 3.77 .778 3.58 .732 3.69 .757 1.339
4. Provide students with examples and attributes for students utilize to form a definition.
3.38 .898 3.72 .906 3.55 .934 3.59 .920 1.477
5. Have students list as many items as possible and group/regroup them by similarities.
2.88 .816 3.06 .961 2.83 .828 2.93 .885 1.272
6. Ask questions of students and lead students to ask questions of one another.
3.58 .902 3.58 .991 3.47 .925 3.53 .945 .259
7. Provide students with a topic; they describe it, create analogies, identify conflicts, and evaluate.
2.80 .764 3.03 1.049 2.93 .890 2.95 .941 .570
8. Allow students to choose a topic or problem, look for causes, supports, and effects.
2.92 .688 2.83 .884 2.68 .804 2.78 .822 1.032
9. Have students list important facts, participants, actions, feelings, reasons, and solutions.
3.19 .801 3.24 .892 3.04 .774 3.15 .828 1.149
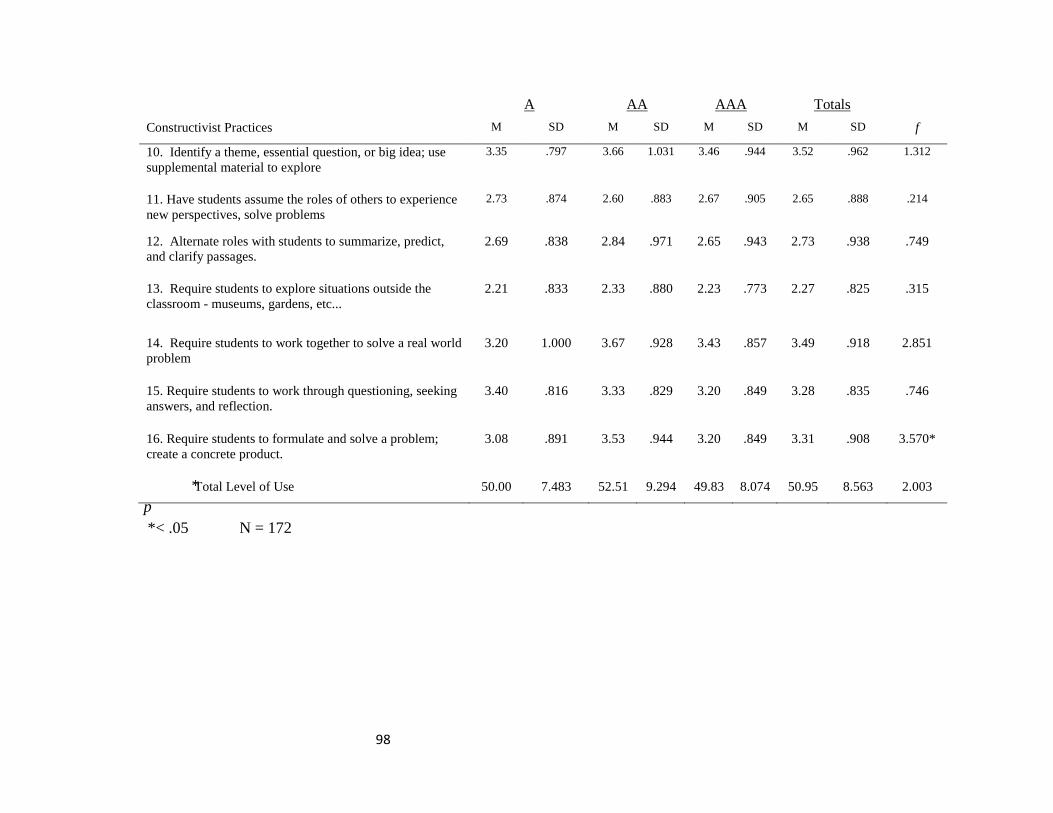
98
*p *< .05 N = 172
A AA AAA Totals
Constructivist Practices M SD M SD M SD M SD f
10. Identify a theme, essential question, or big idea; use supplemental material to explore
3.35 .797 3.66 1.031 3.46 .944 3.52 .962 1.312
11. Have students assume the roles of others to experience new perspectives, solve problems
2.73 .874 2.60 .883 2.67 .905 2.65 .888 .214
12. Alternate roles with students to summarize, predict, and clarify passages.
2.69 .838 2.84 .971 2.65 .943 2.73 .938 .749
13. Require students to explore situations outside the classroom - museums, gardens, etc...
2.21 .833 2.33 .880 2.23 .773 2.27 .825 .315
14. Require students to work together to solve a real world problem
3.20 1.000 3.67 .928 3.43 .857 3.49 .918 2.851
15. Require students to work through questioning, seeking answers, and reflection.
3.40 .816 3.33 .829 3.20 .849 3.28 .835 .746
16. Require students to formulate and solve a problem; create a concrete product.
3.08 .891 3.53 .944 3.20 .849 3.31 .908 3.570*
Total Level of Use 50.00 7.483 52.51 9.294 49.83 8.074 50.95 8.563 2.003

99
A one-way analysis of variance (ANOVA) was used to determine if a significant
difference existed in the level of use of constructivist practices based on the average size
of science classes in the participants’ schools (as measured with a self-reported question).
Class size categories were 20 or fewer students, 21-25 students, and 26+ students. Only
one individual practice was significant at the p< .05 level, requiring students to formulate
and solve a problem with focus on creating a concrete product (20 or fewer: M = 2.59;
SD = .896 21-25: M = 3.03; SD = .939 26+: M = 2.96; SD = .767 Totals: M = 2.92;
SD = .895 f = 3.291; p<.05). The highest mean score for this practice occurred in the 21-
25 student group (M = 3.30; SD = .939). There were no statistically significant
differences in level of use based on class size for any other individual instructional
practices or the total implementation level score. These data are provided in Table 10.

100
Table 10
Mean Differences between Size of Typical Science Classes Based on Level of Use of Constructivist Instructional Practices (Individual and Total)________________________________________________________________________________
20 or Fewer 21-25 26+ Totals
Constructivist Practices M SD M SD M SD M SD f 1. Group students to divide a larger task; work together to complete
3.49 .768 3.57 .902 3.76 .679 3.60 .824 1.220
2. Provide ideas related to a topic, form new connections and deeper understanding.
3.89 .737 3.86 .692 4.07 .712 3.92 .709 1.359
3. Pool collective knowledge in groups or class wide to share ideas and clarify.
3.62 .828 3.69 .756 3.74 .713 3.69 .757 .246
4. Provide students with examples and attributes for students utilize to form a definition.
3.49 .961 3.64 .932 3.56 .893 3.58 .925 .390
5. Have students list as many items as possible and group/regroup them by similarities.
2.59 .896 3.03 .939 2.96 .767 2.92 .895 3.291*
6. Ask questions of students and lead students to ask questions of one another.
3.30 .968 3.60 .904 3.58 .988 3.53 .943 1.450
7. Provide students with a topic; they describe it, create analogies, identify conflicts, and evaluate.
2.70 .909 2.99 .911 3.07 1.009 2.95 .941 1.713
8. Allow students to choose a topic or problem, look for causes, supports, and effects.
2.70 .878 2.75 .797 2.89 .832 2.77 .822 .624
9. Have students list important facts, participants, actions, feelings, reasons, and solutions.
3.14 .918 3.14 .811 3.13 .815 3.14 .831 .002

101
2
p < .05 N = 190
20 or Fewer
21-25
26+
Totals
Constructivist Practices M SD M SD M SD M SD f
10. Identify a theme, essential question, or big idea; use supplemental material to explore
3.43 1.068 3.46 .958 3.72 .854 3.52 .960 1.268
11. Have students assume the roles of others to experience new perspectives, solve problems
2.59 .896 2.56 .783 2.86 1.047 2.65 .887 1.806
12. Alternate roles with students to summarize, predict, and clarify passages.
2.67 .894 2.77 .906 2.70 1.047 2.73 .938 .187
13. Require students to explore situations outside the classroom - museums, gardens, etc...
2.29 .836 2.24 .794 2.28 .908 2.26 .828 ..061
14. Require students to work together to solve a real world problem
3.41 .927 3.50 .951 3.52 .876 3.49 .923 .185
15. Require students to work through questioning, seeking answers, and reflection.
3.38 .721 3.21 .814 3.31 .973 3.27 .838 .581
16. Require students to formulate and solve a problem; create a concrete product.
3.30 .968 3.29 .946 3.36 .802 3.31 .911 .090
Total Level of Use 49.73 8.977 50.79 8.622 51.87 8.492 50.84 8.646 .621

102
Teacher Efficacy Levels
Twenty-four efficacy prompts were listed in the third part of the survey.
Participants were asked to use a Likert scale of 1 – 9 with 1 = Nothing and 9 = A Great
Deal to indicate their level of efficacy. A one sample t-test was used to compare the
sample mean for each practice to the mean score (M = 5.0) from a hypothetical normal
distribution for each of the 24 practices.
The 24 items were also grouped into three subcategories based on type of
efficacy. Eight strategies were included in each category. Items 1, 2, 4, 6, 9, 12, 14, and
22 fall into the Efficacy in Student Engagement (ESE) category. Items 7, 10, 11, 17, 18,
20, 23, and 24 fall into the Efficacy in Instructional Practice (EIP) category. Items 3, 5,
8, 13, 15, 16, 19, and 21 fall into the Efficacy in Classroom Management (ECM)
category. Total scores for each category were calculated by summing the responses to
the eight prompts in that category and performing a one-sample t-test to compare each
total category mean to hypothetical mean score (M = 40; Range = 8-72).
Finally, a total efficacy score was calculated for each subject by summing the
responses to the 24 prompts. A total efficacy score of 169.86 (SD = 25.668) with t-value
26.420 was obtained. A one sample t-test comparing the sample total mean score to the
mean score (M = 118; Range = 24-216) from a hypothetical normal distribution was
conducted resulting in significance at the p<.001 level.
Initial analysis of respondent mean scores for the 24 efficacy items revealed three
levels of response. Ten efficacy prompts resulted in mean values less than 7.0. Ten had
mean values from 7.0-7.49. Four had mean values greater than 7.5. Each of the 24
103
prompts yielded significance at the p = < 0.001 confidence level. The prompts with mean
values less than 7.0 included: getting through to the most difficult students (M = 5.99,
SD = 1.789); helping students think critically (M = 6.95, SD = 1.399); motivating
students who show low interest n school work (M = 6.09, SD = 1.772); getting students
to believe they can do well in school (M = 6.99, SD = 1.437); helping students value
learning (M = 6.82, SD = 1.514); fostering student creativity (M = 6.95, SD = 1.579);
improving the understanding of failing students (M = 6.45, SD = 1.666); calming a
student who is disruptive or noisy (M = 6.95, SD = 1.661); assisting families in helping
their children do well in school (M = 5.95, SD = 1.941); and implementing alternative
strategies in your classes (M = 6.96, SD = 1.515).
The ten prompts with mean values from 7.0-7.49 included: controlling disruptive
behavior (M = 7.23, SD = 1.684); gauging student comprehension of what you have
taught (M = 7.46; SD = 1.139); crafting good questions for your students (M = 7.41; SD
= 1.187); getting children to follow classroom rules (M = 7.47; SD = 1.593); establishing
classroom management systems with groups of students (M = 7.38; SD = 1.550);
adjusting your lessons to the proper level for individual students (M =7.07; SD = 1.564);
using a variety of assessment strategies (M = 7.49; SD = 1.489); keeping a few problem
students from ruining an entire lesson (M = 7.21; SD = 1.730); responding to defiant
students (M = 7.04, SD = 1.608); and providing appropriate challenges for very capable
students (M = 7.33; SD = 1.215). Many of the classroom management prompts fell into
this level of response.
Four prompts resulted in mean values greater than 7.5. The highest level of
efficacy was reported for making expectations clear about student behavior (M = 8.12;

104
SD = 1.167; p <.001). Other mean efficacy levels greater than 7.5 were found for the
following prompts: How well can you respond to difficult questions from your students?
(M = 7.83; SD = .988; p <.001); How well can you establish routines to keep activities
running smoothly (M = 7.87; SD = 7.87; p <.001); and How well can you provide an
alternative explanation or example when students are confused? (M = 7.81; SD = 1.079; p
<.001), indicating confidence in the ability to accomplish these tasks.
Efficacy in Student Engagement
Initial analysis of the eight ESE means yielded two levels of response. Four
prompts had mean scores less than 6.50 and four had mean scores ranging from 6.50-
6.99. The highest efficacy score in this category related to convincing students they can
do well in school work (M = 6.99; SD = 1.437). Of the three efficacy subcategories
(ESE, EIP, and ECM) the lowest efficacy scores occurred in this subcategory (Total M =
51.87). The two lowest individual efficacy scores, assisting families in helping students
do well in school and getting through to the most difficult students, were both in this
category (M = 5.95; SD = 1.941 and M = 5.99; SD = 1.789). All t-values were
significant at the p<.001 confidence level in a comparison of the sample mean (M =
51.87; SD = 10.263) to the hypothetical mean (M = 40). These data are provided in
Table 11.

105
Table 11
Teacher Efficacy in Student Engagement by Secondary Science Teachers
Teacher Efficacy Prompt M SD t-value
1. How much can you do to get through to the most difficult students?
5.99 1.789 7.225***
2. How much can you do to help your students think critically?
6.95 1.399 18.208***
4. How much can you do to motivate students who show low interest in school work?
6.09 1.772 8.028***
6. How much can you do to get students to believe they can do well in school work?
6.99 1.437 18.038***
9. How much can you do to help your students value learning?
6.82 1.514 15.654***
12. How much can you do to foster student creativity?
6.95 1.579 16.121***
14. How much can you do to improve the understanding of a student who is failing?
6.45 1.666 11.253***
22. How much can you do to assist families in helping their children do well in school?
5.95 1.941 6.363***
Subcategory Total
51.87 10.263 15.126***
*** p <.001 Individual Strategy Scale: 1 = Nothing 9 = A Great Deal N = 190 Subcategory R = 8-72
Efficacy in Instructional Practice
Initial analysis of EIP yielded two response levels. Five prompts had mean scores
below 7.50. Three prompts had scores greater than 7.50. The prompt regarding
implementation of alternative strategies in the classroom was the only prompt in EIP to
fall below seven (M = 6.96; SD = 1.515). The highest individual prompt in this category

106
was gauging student comprehension of the material taught (M = 7.87; SD = 1.139). The
overall sub-score average for EIP was M = 7.47, nearly a full point higher on the scale (1-
9) than the ESE score. The efficacy scores for the EIP category were greater than those
for ESE and ECM, yielding the highest subcategory mean (M= 59.03) of the three
subcategories (ESE, EIP, ECM), indicating respondents had higher efficacy for
instructional practice than classroom management and student engagement. All t-values
were significant at the p<.001 confidence level. These data are provided in Table 12.
Table 12
Teacher Efficacy in Instructional Practice by Secondary Science Teachers
Teacher Efficacy Prompt M SD t-value
7. How well can you respond to difficult questions from your students?
7.83 0.988 37.212***
10. How much can you do to gauge student comprehension of what you have taught?
7.87 1.139 28.268***
11. How well can you craft good questions for your students?
7.41 1.187 26.369***
17. How much can you do to adjust your lessons to the proper level for individual students?
7.07 1.564 17.210***
18. How well can you use a variety of assessment strategies?
7.49 1.489 21.846***
20. How well can you provide an alternative explanation or example when students are confused?
7.81 1.579 34.082***
23. How well can you implement alternative strategies in your class?
6.96 1.515 16.911***
24. How well can you provide appropriate challenges for very capable students?
7.33 1.251 24.393***
Subcategory Total
59.03 7.951 31.297***
*** p <.001 Individual Efficacy Scale: 1 = Nothing 9 = A Great Deal N = 190 Subcategory R = 8-72

107
Efficacy in Classroom Management
Initial analysis of ECM yielded two response levels. Five prompts had mean
scores less than 7.40. Three prompts had mean scores greater than 7.40. Only one
prompt yielded a response lower than seven, regarding calming students who are
disruptive or noisy (M = 6.95; SD = 1.661). The ECM category yielded the highest
individual efficacy score, for making expectations clear about student behavior (M =
8.12; SD = 1.167). The overall sub-category average for ECM was M = 7.41. The ECM
score was 0.06 points lower than EIP. ECM had a greater subcategory mean than ESE
(M = 58.96). All t-values were significant at the p<.001 confidence level.
Table 13
Teacher Efficacy in Classroom Management by Secondary Science Teachers
Teacher Efficacy Prompt M SD t-value 3. How much can you do to control disruptive behavior? 7.23 1.684 17.301***
5. How much can you do to make your expectations clear about student behavior?
8.12 1.167 34.916***
8. How well can you establish routines to keep activities running smoothly?
7.87 1.304 28.713***
13. How much can you do to get children to follow classroom rules?
7.47 1.593 20.142***
15. How much can you do to calm a student who is disruptive or noisy?
6.95 1.661 15.280***
16. How well can you establish a classroom management system with groups of students?
7.38 1.550 20.037***
19. How much can you do to keep a few problem students from ruining an entire lesson?
7.21 1.730 16.625***
21. How well can you respond to defiant students? 7.04 1.608 16.556***
Subcategory Total c
58.96 10.399 23.842***
***p <. 001 Individual Strategy Scale: 1 = Nothing 9 = A Great N = 190 Subcategory R = 8-72

108
Teacher Efficacy Levels Based on Demographic Variables
This section examines the relationship between the selected demographic
variables, total efficacy level, and the three efficacy sub-scores. The total efficacy level
was obtained by summing each participant’s responses to the 24 efficacy prompts to
obtain a total efficacy score. Each prompt also belonged to one of the three
subcategories: Efficacy in Student Engagement (ESE), Efficacy in Instructional Practice
(EIP), and Efficacy in Classroom Management (ECM). The individual scores for
prompts in each of these categories were summed to obtain a sub-score for that category.
The total efficacy score and each of the scores (ESE, EIP, and ECM) were compared to
the following demographic variables: school level (middle school vs. high school), total
years of teaching experience, years of teaching science, science courses taught in 2011-
2012, teaching an AP course, school SES level, size of student population, and number of
students in a typical science course at the school.
An independent samples t-test was used to determine if significant differences
existed in total efficacy (TE) level and each of the three sub-scores (ESE, EIP, and ECM)
and school level (middle school or high school). No significant differences based on
school level were found in total teacher efficacy levels or efficacy levels for the Efficacy
in Instructional Practices and Efficacy in Classroom Management sub-scores. There
were significant differences based on school level for the ESE subcategory. Middle
school teachers (M = 53.58; SD = 9.22; p<.05) reported a higher level of efficacy than
high school teachers (M = 50.25; SD = 10.97; p<.05). These data are provided in Table
14.

109
Table 14
Mean Differences in Total and Sub-score Efficacy Levels Based on School Level
_______________________________________________________________________
Middle School High School
Total and Sub-Scale Efficacy Scores M SD M SD t
Total 173.16 23.32 166.63 27.45 1.66
Sub-Scale: Student Engagement 53.58 9.22 50.25 10.97 2.13*
Sub-Scale: Instructional Practice 59.53 7.50 58.52 8.38 .83
Sub-Scale: Classroom Management 60.05 9.21 57.87 11.34 1.37
*p <.05 n= 81 (Middle School) n= 89 (High School) Total Efficacy R = 24-216 Sub-Score R = 8-72
A one-way analysis of variance (ANOVA) was used to determine if a significant
difference existed in the total efficacy level and each of the three subcategories (ESE, EIP
and ECM) based on participants’ total years of teaching experience. No significant
differences were found among the participants’ efficacy levels based on total years of
teaching experience. These data are provided in Table 15.

110
Table 15
Mean Differences in Total and Sub-score Efficacy Levels Based on Total Years of Teaching Experience ____________________________________________________________________________________________________________
5 or fewer 6-10 11-15 16-20 21-25 26+
Efficacy M SD M SD M SD M SD M SD M SD f
Total 167.06 28.87 168.42 21.30 168.04 25.72 179.41 32.64 164.21 23.10 174.47 20.41 1.050
ESE 51.53 11.33 51.17 8.99 52.33 9.39 55.76 12.49 48.68 9.24 52.36 9.39 .914
EIP 58.49 8.17 57.88 7.21 57.38 8.03 61.82 9.73 56.79 8.48 61.53 6.23 1.832
ECM 57.04 11.57 59.38 8.60 58.33 10.04 61.82 12.88 58.74 8.25 60.58 9.80 .803
N = 190

111
A one-way analysis of variance (ANOVA) was used to determine if a significant
difference existed in the total efficacy level and each of the three subcategories (ESE, EIP
and ECM) based on participants’ years of teaching science. No significant differences
were found among the participants efficacy levels based on years of teaching science for
the six categories. These data are provided in Table 16.

112
Table 16
Mean Differences in Total and Sub-score Efficacy Levels Based on Years of Teaching Science
____________________________________________________________________________________________________________
5 or less 6-10 11-15 16-20 21-25 26+
Efficacy M SD M SD M SD M SD M SD M SD f
Total 168.16 27.99 171.21 22.48 169.63 24.49 167.29 38.31 169.64 21.66 173.62 16.97 .217
ESE 52.20 10.94 52.21 9.51 51.96 10.09 50.07 13.54 52.50 8.15 51.34 9.52 .127
EIP 58.44 7.95 58.38 7.80 59.71 7.62 57.43 11.34 57.21 8.95 62.00 5.40 1.22
ECM 57.52 11.32 60.62 7.97 57.96 8.83 59.79 15.46 59.93 7.37 60.28 10.37 .552
N = 190

113
An independent samples t-test was used to determine if significant differences
existed in total efficacy (TE) level and each of the three sub-scores (ESE, EIP, and ECM)
based on whether an instructor taught an AP or pre-AP course in the preceding five years
including the 2011-2012 school year by comparing the means from the two groups. No
significant difference was found between middle school and high school science teachers
for total efficacy, ESE, EIP, or ECM based on whether or not a teacher taught an AP or
pre-AP course. These data are provided in Table 17.
Table 17
Mean Differences in Total and Sub-score Efficacy Levels Based on AP Instruction
______________________________________________________________________
AP No_AP
Total and Sub-Scale Efficacy Scores M SD M SD t
Total 170.08 21.00 169.80 26.85 .059
Sub-Scale: Student Engagement 51.47 8.27 51.98 10.76 -.262
Sub-Scale: Instructional Practice 58.94 8.12 59.05 7.94 -.072
Sub-Scale: Classroom Management 59.67 7.96 58.77 10.98 .458
n= 36 (AP) n= 135 (No AP) Total Efficacy R = 24-216 Sub-score R = 8-72
A one-way analysis of variance (ANOVA) was used to determine if a significant
difference existed in the total efficacy level and each of the three subcategories (ESE, EIP
and ECM) based on school SES level. No significant differences based on school SES
were found in teacher efficacy level. These data are provided in Table 18.

114
Table 18
Mean Differences in Total and Sub-score Efficacy Levels Based on School SES
________________________________________________________________________
35% or Less 36%-50% 51%-75% 76+%
Total and Sub-Scale Efficacy
M SD M SD M SD M SD f
Total 179.56 13.427 166.86 24.232 170.82 25.304 169.63 169.88 .683
ESE 53.44 7.002 49.76 10.448 52.86 10.140 52.67 11.533 1.045
EIP 62.22 3.993 58.22 7.739 59.32 7.145 58.67 10.532 .724
ECM 63.89 6.547 58.88 9.109 58.64 11.000 58.30 12.642 .712
Total n = 9 ESE n = 50 EIP n = 76 ECM n = 27 Total Efficacy R = 24-216 Sub-Score R = 8-72
A one-way analysis of variance (ANOVA) was used to determine if a significant
difference existed in the total efficacy level and each of the three sub-scores (ESE, EIP
and ECM) based on school size using the parameters set by the WVSSAC for the 2011-
2012 school year. No significant differences based on school size were found in the
Efficacy in Student Engagement and Efficacy in Classroom Management sub-scores.
There were significant differences based on school size for total efficacy level and
Efficacy in Instructional Practice. The lowest mean score for Total Efficacy was the
AAA group (M = 165.43; SD = 25.911). The highest mean score for Total Efficacy was
the A group (M = 180.00; SD = 20.667). The lowest mean score for EIP was the AAA
group (M = 57.43; SD = 7.857). The highest mean score for EIP was the A group (M =
61.42; SD = 6.894). The EIP total mean was 59.14 (SD = 7.852). These data are
provided in Table 19.

115
Table 19
Mean Differences in Total and Sub-score Efficacy Levels Based on School Size
________________________________________________________________________
A AA AAA
Total and Sub-scale Efficacy Scores
M SD M SD M SD f
Total 180.00 20.667 171.32 26.105 165.43 25.911 3.356*
Sub-scale: Student Engagement
55.85 8.172 52.22 9.774 50.27 11.078 2.963
Sub-scale: Instructional Practice
61.42 6.894 60.13 7.896 57.43 7.857 3.536*
Sub-scale: Classroom Management
62.73 7.341 58.97 11.075 57.73 10.504 2.256
N = 190 *p < .05 A n = 42 AA n = 43 AAA n = 40
A one-way analysis of variance (ANOVA) was used to determine if a significant
difference existed in the total efficacy level and each of the three subcategories (ESE, EIP
and ECM) based on the typical number of students in science classes at respondents’
schools (20 or fewer students, 21-25 students, 26 + students). No relationships were
found to be significant based on class size. These data are provided in Table 20.

116
Table 20
Mean Differences in Total and Sub-score Efficacy Levels Based on Class Size
________________________________________________________________________
20 or fewer 21-25 26 +
Total and Sub-Scale Efficacy
M SD M SD M SD f
Total 169.46 23.840 170.69 26.387 168.44 26.153 .117
Sub-scale: Student Engagement
51.65 8.519 51.90 11.490 52.00 9.008 .012
Sub-scale: Instructional Practice
59.05 7.457 58.87 8.064 59.35 8.289 .053
Sub-scale: Classroom Management
58.76 11.154 59.92 9.552 57.09 11.397 1.092
N = 190
Relationship between Efficacy Level and Constructivist Practice Use
In the second part of the survey participants were asked to indicate their level of
use of 16 selected research based constructivist instructional practices on a scale of 1-5,
with 1 = Never and 5 = Very Frequently. The individual scores were summed to provide
the Total Level of Use of Constructivist Instructional Practices (TLCIP) score.
In the third part of the survey West Virginia science educators were asked to use a
scale of 1-9 to indicate their level of efficacy for the given prompts, with 1 = Nothing and
9 = A Great Deal. The section contained 24 prompts. Each individual score was
summed to provide a total efficacy score as well as the individual scores. The individual
scores were also divided into subcategories with eight prompts in each of the three
subcategories.
These eight scores were also summed to obtain a subcategory score for each of
the three subcategories. This process yielded a total efficacy score and three subscores

117
for Efficacy in Student Engagement (ESE), Efficacy in Instructional Practice (EIP) and
Efficacy in Classroom Management (ECM).
The Total Level of Use of Constructivist Instructional Practices (TLCIP) score
was compared with the total efficacy score (TE) and the three efficacy sub-scores (ESE,
EIP, and ECM) using a Pearson Product-Moment Correlation Coefficient (r). The total
efficacy score (TE) and each sub-score (ESE, EIP, and ECM) was also compared with
each individual constructivist strategy using a Pearson Product-Moment Correlation
Coefficient (r). These comparisons were used to determine if a significant relationship
existed between the level of use for each constructivist instructional practice, the three
subcategories of efficacy, and total efficacy. Relationships were described using
Holcomb’s (2006) scale of none to perfect where .00 = no relationship, .01-.24 = weak,
.25-.49 = moderate, .50-.74 = moderately strong, .75-.99 = very strong, and 1.00 =
perfect. Table 21 and Appendix H contain the Pearson r findings for each of these
relationships.
The results of the Pearson r between the Total Level of Use of Constructivist
Instructional Practices (TLCIP) score, total efficacy (TE) score, and each of the three
sub-score totals (ESE, EIP, and ECM) are provided in Table 21. Correlation coefficients
ranged from .281 - .523. The relationship between TLCIP CPI and TE level was
moderate at .464 (p<.01). The relationship between TLCIP and ESE was highest at .523
(p<.01), or moderately strong. The relationship between TLCIP and EIP was moderate at
.454 (p<.01). The relationship between TLCIP and ECM was lowest at .281 (p<.01), but
still in the moderate range. These data are presented in Table 21.

118
Table 21
Pearson Product-Moment Correlations between Total Level of Use of Constructivist Practices, Total Efficacy, and Three Efficacy Sub-scores
Measure TLCIP
TLCIP – Total Use Level __
TE – Total Efficacy .464**
ESE – Efficacy in Student Engagement .523**
EIP – Efficacy in Instructional Practice .454**
ECM – Efficacy in Classroom Management .281**
** p <.01 (2-tailed) N = 190
The Pearson r correlations between the total efficacy score (TE) and each of the
16 individual constructivist instructional practices were also determined. All correlations
between TE and the 16 constructivist instructional practices were found to be significant.
Eleven relationships were significant at p<.001 and five were significant at the p<.01
level. The five relationships at the p<.01 level were weak according to Holcomb’s scale
(.01-.24) and the remaining 11 (p<.001) were moderate according to the scale (.25-.49).
These data are presented in Appendix H.
The Pearson r correlations between the three sub-scores (ESE, EIP, and ECM)
and the 16 constructivist instructional practices were also determined. Correlations
between ESE and each of the 16 constructivist instructional practices resulted in three
relationships significant at the p<.01 confidence level and 13 significant at the p<.001
level. Two of the relationships were weak according to Holcomb’s (2006) scale (.01-.24)
while the other 14 relationships were moderate according to the scale (.25-.49). The

119
correlations between (EIP) and each of the 16 constructivist instructional practices
resulted in three relationships significant at the p<.05 confidence level. One of the
relationships was significant at the p<.01 confidence level and the other 12 were
significant at the p<.001 confidence level. Four of the relationships (those at the p<.05
and p<.01 confidence levels) were weak according to Holcomb’s (2006) scale (.01-.24)
while the 12 relationships with significance at the p<.001 level were moderate according
to the scale (.25-.49). The correlations between ECM and each of the 16 constructivist
instructional practices resulted in one relationship significant at the p<.05 confidence
level, five significant at the p<.01, level, and three significant at the p<.001 confidence
level. Six of the relationships (those at the p<.05 and p<.01 confidence levels) were
weak according to Holcomb’s (2006) scale (.01-.24) whereas the other three relationships
significant at the p<.001 confidence level were moderate according to the scale (.25-.49).
These data are presented in Appendix H.
Findings from Follow-Up Interviews
Online survey respondents were given the opportunity to participate in a short
follow-up telephone interview guided by five questions. Twenty-three individuals
indicated their willingness to participate by providing contact information in the free
response questions at the end of the survey. Fifteen of these 23 respondents were
selected for the follow-up telephone interviews. These interviews were designed to
clarify the quantitative survey results through emergent category analysis (Zhang &
Wildemuth, 2009). The purpose of this section is to present the results of these follow-up
interviews. The results for the analysis of each of the five phone interview questions are
included. A chart summarizing participant responses is included in Appendix J.

120
Timing of Instructional Practice Use
Respondents provided a range of responses to this question. Five respondents
indicated daily use of constructivist instructional practices, with two indicating at least
weekly use. Five science teachers also indicated use of constructivist instructional
practices as part of laboratory or post-lab activities. Two indicated using these practices
as part of discussions (such as book discussions or current events discussions), and one
indicated using it as part of lecture activities.
Two science teachers indicated using constructivist instructional practices as part
of opening activities and one indicated using it for only reinforcement purposes. Four
science teachers indicated use of constructivist practices as part of group work and four
indicated its use as part of presentations. Two instructors utilize these practices as part of
larger projects and three utilize them to help students make connections to other topics
and the real world. One science teacher also indicated the use of guest speakers, whereas
four individuals specifically indicated that they do not utilize guest speakers.
Nine science teachers indicated that field trips are not easily integrated into the
science program at their school and are therefore not used. Three respondents listed field
trips as part of their integration of constructivist instructional practices. Six science
teachers responded that the use of role play was part of their constructivist practice
implementation, while six also indicated that they do not use role play in the classroom.
Three respondents stated that they take students outside the classroom to other parts of
the campus for activities. Four instructors indicated that they reserve constructivist
instructional classes for their advanced courses, including AP courses.
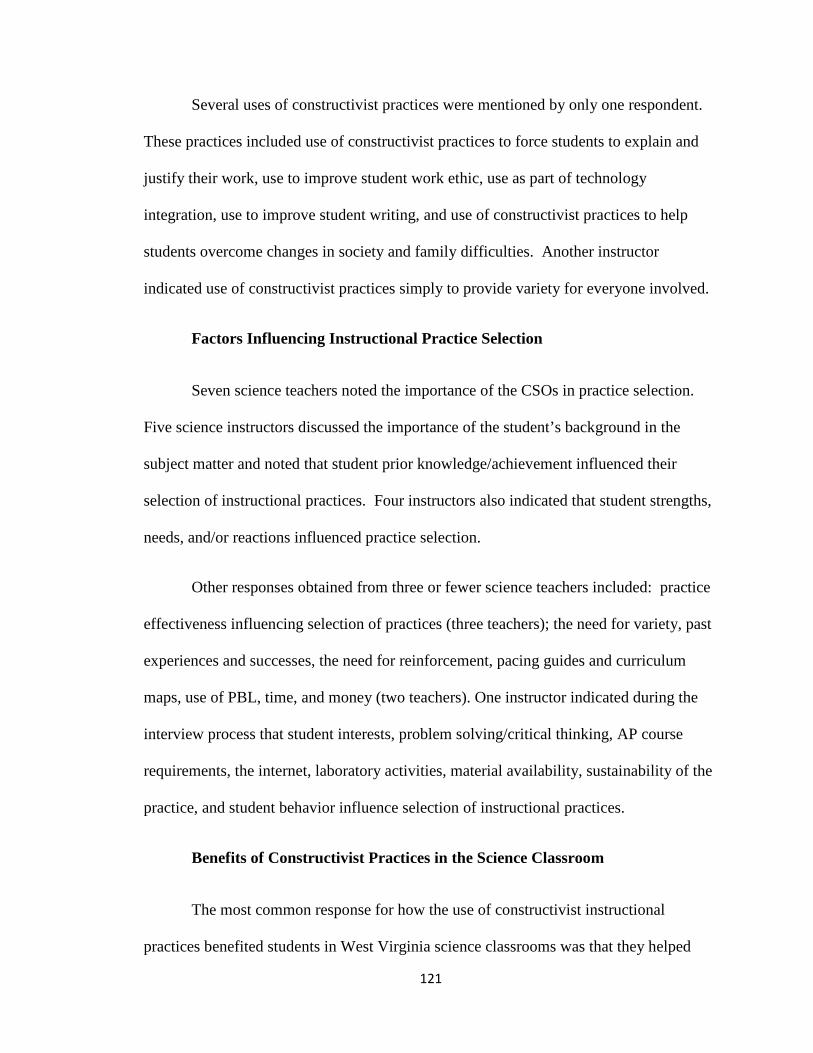
121
Several uses of constructivist practices were mentioned by only one respondent.
These practices included use of constructivist practices to force students to explain and
justify their work, use to improve student work ethic, use as part of technology
integration, use to improve student writing, and use of constructivist practices to help
students overcome changes in society and family difficulties. Another instructor
indicated use of constructivist practices simply to provide variety for everyone involved.
Factors Influencing Instructional Practice Selection
Seven science teachers noted the importance of the CSOs in practice selection.
Five science instructors discussed the importance of the student’s background in the
subject matter and noted that student prior knowledge/achievement influenced their
selection of instructional practices. Four instructors also indicated that student strengths,
needs, and/or reactions influenced practice selection.
Other responses obtained from three or fewer science teachers included: practice
effectiveness influencing selection of practices (three teachers); the need for variety, past
experiences and successes, the need for reinforcement, pacing guides and curriculum
maps, use of PBL, time, and money (two teachers). One instructor indicated during the
interview process that student interests, problem solving/critical thinking, AP course
requirements, the internet, laboratory activities, material availability, sustainability of the
practice, and student behavior influence selection of instructional practices.
Benefits of Constructivist Practices in the Science Classroom
The most common response for how the use of constructivist instructional
practices benefited students in West Virginia science classrooms was that they helped

122
build excitement and "wonder" in students, increasing motivation (six respondents). Six
science teachers also responded that the hands-on practices and laboratory activities used
in the classroom are helpful. Four teachers indicated that former students have contacted
them and elaborated on activities from the course that benefited them later in life. Four
respondents also indicated deepening student understanding and building a variety of
student skills (leadership, use of tools, maintaining lab area, and group work) as benefits
of constructivist instructional practice.
Two respondents indicated that adherence to the scientific method and
experimental design benefit students and two indicated that practical knowledge and
community need influence their selection of practices. Establishing a common language,
preparing students for presentations, constructing meaning, applying knowledge, helping
students retain knowledge longer, and large class size were each given once as benefits of
constructivist instructional practices.
Aspects of Constructivist Practices that Promote Learning
The two most common aspects of constructivist instruction cited by instructors
(cited five times each) as promoting student learning were establishment of routines and
setting forth clear expectations. The next most common responses included the use of
rubrics, providing visual/concrete examples of concepts that relate to students, and
providing alternative assessments and products to reach different learning styles (four
responses each). Providing students with the freedom to explore and control over their
own learning was indicated by three science educators as promoting student learning.

123
Group work, laboratory activities, applying knowledge, and providing students
with samples of expected products/work were also identified as examples of activities
that promoted student learning by three respondents. Finally, the following constructivist
practices were indicated as promoting student learning by one respondent: building
confidence, allowing time to fully develop activities, creating equality among classes,
shortening assessments, providing adaptation/options for students with special needs,
providing opportunities for technology integration, and promoting high expectations.
Barriers to Implementation of New Instructional Practices
The two most commonly cited barriers to implementing new instructional
practices were lack of time and student apathy (four responses each). Barriers cited by
three respondents included lack of parental support, students facing difficult and/or
dangerous situations at home, differing expectations among staff and/or staff support,
money, students from low SES backgrounds, and lack of materials in school and/or in the
home. Barriers cited by two respondents included lack of administrative support,
students unreceptive to cross-curricular work, lack of technology in the school,
parents/students not valuing education, inability to read on grade level, too many
preps/overworked, and large class sizes. Fourteen instructional barriers were listed by
respondents only once: negative parent attitude toward school, lack of infrastructure in
old buildings, old equipment, students not having basic needs met before they come to
school, student abuse of cell phones, learned helplessness, low math skills, inability to
apply material, inexperience using graphing calculators, too much standardized testing,
lack of technology in the home, anything that upsets students’ routines, too little time for
planning, and disrespect.

124
Instrument Reliability
The purpose of this section is to examine the reliability of the survey instrument.
The instructional practices portion of the survey instrument and the teacher efficacy
portion of the instrument were examined for internal consistency using Chronbach’s
alpha coefficient. It is important to determine internal consistency, or the degree to
which the items in the instrument measure the same construct (Pallant, 2007). Pallant
indicated that though the coefficient values are sensitive they should be above .7 for
appropriate internal consistency.
The Cronbach’s alpha based on the 16 constructivist instructional practices was
.880. This value was greater than the necessary value of .7 according to Pallant (2007)
indicating acceptable internal consistency of the instructional practices portion of the
survey instrument. These data are provided in Table 22.

125
Table 22
Cronbach’s Alpha Values for Individual Items and Total Constructivist Practice Implemented
Constructivist Practice M SD α 1. Group students in order to divide a larger task and work together to complete.
3.61 .836 .874
2. Provide ideas related to a topic and form new connections and deeper understanding of topic.
3.93 .689 .874
3. Pool collective student knowledge in groups or class wide to share ideas and clarify understanding.
3.7 .753 .876
4. Provide students with examples and attributes of a word/topic which students utilize to form a definition.
3.59 .943 .874
5. Have students list as many items as possible related to a topic and group/regroup them by similarities.
2.94 .905 .877
6. Ask questions of students and lead students to ask questions of one another.
3.52 .946 .873
7. Provide students with a topic; they describe it, create analogies, identify conflicts, and evaluate the results.
2.95 .948 .868
8. Allow students to choose a topic or problem, look for causes, supports, and effects.
2.81 .801 .872
9. Have students list all important facts, participants, actions, feelings, reasons, and alternative solutions to a problem.
3.13 .825 .870
10. Identify a theme, essential question, or big idea and have students use supplemental material to explore topic.
3.52 .953 .878
11. Have students assume the roles of others and experience new perspectives to solve a problem.
2.63 .887 .877
12. Alternate roles with students to summarize, predict, and clarify passages.
2.73 .954 .871
13. Require students to explore situations outside the classroom in museums, gardens, with guest speakers, etc…
2.31 .829 .878
14. Require students to work together to solve a problem that mimics one found in the real world.
3.52 .904 .869
15. Require students to work at their own pace through a cycle of questioning, seeking answers, and reflection.
3.27 .829 .876
16. Require students to formulate and solve a problem with a focus on creating a concrete product.
3.31 .899 .868
Total Constructivist Practice Level 51.48 8.347 .880 N = 153
The Cronbach’s alpha was calculated for the 24 efficacy prompts resulting in a
value of α = .957. This value was greater than the necessary value of .7 according to
Pallant (2007) indicating acceptable internal consistency of the individual efficacy
prompts and total efficacy. These data are provided in Table 23.

126
Table 23
Cronbach’s Alpha Values for Individual Efficacy Prompts and Total Efficacy
Efficacy Prompt M SD α 1. How much can you do to get through to difficult students? 5.99 1.790 .957 2. How much can you do to help your students think critically? 6.95 1.420 .956 3. How much can you do to control disruptive behavior? 7.24 1.711 .956 4. How much can you do to motivate students with low interest? 6.09 1.795 .956 5. How much can you do to make behavior expectations clear? 8.16 1.165 .956 6. How much can you do to get students to believe they can do well? 6.97 1.460 .955 7. How well can you respond to difficult questions from students? 7.86 .970 .957 8. How well can you establish smooth routines for activities? 7.95 1.238 .956 9. How much can you do to help your students value learning? 6.78 1.535 .956 10. How much can you do to gauge student comprehension? 7.47 1.145 .956 11. How well can you craft good questions for your students? 7.41 1.192 .956 12. How much can you do to foster student creativity? 6.96 1.573 .956 13. How much can you do to get children to follow classroom rules? 7.50 1.591 .954 14. How much can you improve the understanding failing students? 6.43 1.638 .954 15. How much can you do to calm a disruptive/noisy student? 6.94 1.673 .954 16. How well can you establish a classroom management system? 7.42 1.572 .954 17. How much can you adjust your lessons for individual students? 7.10 1.552 .956 18. How well can you use a variety of assessment strategies? 7.55 1.432 .956 19. How much can you do to keep a few problem students from ruining an entire lesson?
7.22 1.731 .955
20. How well can you provide an alternative explanation or example when students are confused?
7.85 1.066 .956
21. How well can you respond to defiant students? 7.11 1.538 .955 22. How much can you do to assist families in helping their children do well in school?
5.96 1.953 .956
23. How well can you implement alternative strategies in your class? 6.95 1.530 .955 24. How well can you provide appropriate challenges for very capable students?
7.36 1.273 .956
Total Efficacy Score 171.24 25.606 .957 N= 152
The Cronbach’s alpha was calculated for the three sub-scores of efficacy (ESE,
EIP, and ECM). Cronbach’s alpha for ESE was α = .903. Cronbach’s alpha for EIP was
α = .884. Cronbach’s alpha was α = .940 for ECM. Each of these values was greater
than the necessary value of .7 according to Pallant (2007) indicating acceptable internal
consistency of the individual efficacy prompts and total efficacy. These data are
provided in Table 24.

127
Table 24
Cronbach’s Alpha Values for ESE, EIP, and ECM
______________________________________________________________________________
Efficacy Prompts by Sub-Score M SD α
Efficacy in Student Engagement
1. How much can you do to get through to difficult students? 5.99 1.80 .895 2. How much can you do to help your students think critically? 6.94 1.411 .896 4. How much can you do to motivate students with low interest? 6.12 1.780 .887 6. How much can you do to get students to believe they can do well? 6.99 1.438 .883 9. How much can you do to help your students value learning? 6.81 1.534 .889 12. How much can you do to foster student creativity? 6.96 1.596 .894 14. How much can you improve the understanding failing students? 6.45 1.671 .882 22. How much can you do to assist families in helping their children do well in school?
5.94 1.973 .897
ESE Sub-Score Total (n = 8) Efficacy in Instructional Practices
52.22 10.254 .903
7. How well can you respond to difficult questions from students? 7.83 .985 .880 10. How much can you do to gauge student comprehension? 7.46 1.145 .864 11. How well can you craft good questions for your students? 7.41 1.194 .869 17. How much can you do to adjust your lessons to the proper level for individual students?
7.06 1.576 .868
18. How well can you use a variety of assessment strategies? 7.50 1.492 .869 20. How well can you provide an alternative explanation or example when students are confused?
7.82 1.078 .873
23. How well can you implement alternative strategies in your class? 6.96 1.508 .863 24. How well can you provide appropriate challenges for very capable students?
7.33 1.266 .870
EIP Sub-Score Total (n = 8) Efficacy in Classroom Management
59.36 7.710 .884
3. How much can you do to control disruptive behavior? 7.21 1.697 .933 5. How much can you do to make behavior expectations clear? 8.12 1.171 .944 8. How well can you establish smooth routines for activities? 7.85 1.316 .937 13. How much can you do to get children to follow classroom rules? 7.45 1.606 .926 15. How much can you do to calm a disruptive/noisy student? 6.94 1.668 .928 16. How well can you establish a classroom management system with groups of students?
7.38 1.568 .930
19. How much can you do to keep a few problem students from ruining an entire lesson?
7.18 1.748 .930
21. How well can you respond to defiant students? 7.07 1.555 .932
ECM Sub-Score Total (n = 8) 59.20 10.434 .940 ESE N = 163; EIP N = 165; ECM N = 164

128
Summary of Findings
The purpose of this chapter was to present data gathered for a study examining the
level of use of constructivist instructional practices and teacher efficacy in West Virginia
(WV) science classrooms. Respondents were asked to rate their level of use of selected
instructional practices and level of efficacy. In addition follow-up interviews were
conducted to clarify concepts and identify barriers.
In general WV science teachers described their level of use of constructivist
instructional practices as frequent, with 10 of the 16 practices surveyed resulting in a
level of use of 3.0 (Frequent use) or greater on a scale of 1-5. Results from a one sample
t-test were found to be significant for each of the 16 individual practices as well as a total
practice score obtained by summing the individual items (p<.001).
The level of use of constructivist instructional practices was analyzed via an
independent samples t-test to determine if significant differences existed based on
selected demographic variables. Overall, few significant differences were found based
on demographic variables. Two individual practices were found to be different based on
school level (middle school vs. high school). Two practices were also significant based
on total years of teaching and one practice was significant based on years of teaching
science. One individual practice was significantly different based on AP vs No-AP
instruction. One individual practice was significant based on size of the student
population and one individual practice was significant based on class size. No significant
differences were found in the total level of use score for constructivist practices based on
any of the demographic variables.

129
In general, WV science teacher’s described their level of efficacy regarding
teaching science as moderately high. Fourteen individual efficacy prompts had mean
values of 7.0 or greater on a scale of 1-9. One-sample t-tests for each prompt, as well as
a total efficacy score obtained by summing the prompts, and three sub-scores (Efficacy in
Student Engagement – ESE, Efficacy in Instructional Practice - EIP, and Efficacy in
Classroom Management – ECM) obtained by dividing the prompts into three groups of
eight resulted in significance at the p<.001 level. Each individual prompt mean, the total
efficacy mean, and each efficacy sub-score mean was significantly different from the
mean for a hypothetical normal distribution.
The total efficacy score and the three efficacy sub-scores were also analyzed
based on the selected demographic variables. One sub-score, ESE, was found to be
significant for school level (middle vs. high school). No significant differences were
found for total years of teaching, years of teaching science, teaching an AP course, school
SES, or the number of students in the science classroom. The total efficacy score and EIP
sub-score were found to be significant based on size of the student population.
The total efficacy (TE) score and each of the efficacy sub-scores (ESE, EIP, and
ECM) was compared to the total level of use of constructivist instructional practice score
using a Pearson Product-Moment Correlation Coefficient (r). Each relationship was
significant at the p<.01 level. The relationship between the total level of use score and
TE, EIP, and ECM were moderate and the relationship between the total level of use
score and ESE was moderately strong (Holcomb, 2006). Relationships were also
determined for each individual constructivist practice and the four efficacy scores (TE,
ESE, EIP, and ECM). The relationship between TE and the practices resulted in

130
significant relationships at the weak to moderate level. The relationships between ESE
and EIP and the practices were significant and moderate. The relationships between
ECM and the practices were mixed with nine significant relationships (three moderate
and six weak).
The findings from the follow-up telephone interviews yielded additional data
regarding level of use of constructivist instructional practices. Five of 15 respondents
indicated using constructivist practices daily, though four reserved them for advanced
classes. Dominant influences on practice selection included state CSOs, student
strengths/weaknesses, time, and effectiveness. Benefits of constructivist practice
utilization included building excitement, motivation, increasing skills, and deepening
understanding. Setting clear expectations, routines, rubrics, examples, and alternative
assessments were listed as promoters of practice success. However, few respondents
indicated that field trips, guest speakers, and role playing were regularly utilized and 29
barriers to new practice implementation were identified.
Cronbach’s alpha resulted in a desirable level of internal consistency and
reliability for the constructivist instructional practices (α = .88) and the efficacy portion
of the instrument (α = .957) with values greater than .7 (Pallant, 2007). Cronbach’s α
values for each of the individual constructivist practices and individual efficacy prompts
also yielded acceptable internal consistency. Cronbach’s α was calculated for each of the
three efficacy sub-scores and also yielded acceptable internal consistency (ESE α = .903,
EIP α = .884, and ECM α = .940).
131
CHAPTER 5: CONCLUSIONS, IMPLICATIONS, AND RECOMMEN DATIONS
This chapter reviews the purpose of the study, demographic data, and summarizes
the methods and findings. The chapter ends by presenting the study conclusions, a
discussion of implications, and recommendations for further study.
Purpose of the Study
The purpose of the study was to examine the level of use of selected research
based constructivist instructional practices and level of teacher efficacy in middle school
and high school science teachers in the state of West Virginia for the 2011-2012 school
year. Both level of use of constructivist instructional practices and teacher efficacy were
examined for differences based on selected demographic variables. In addition this study
sought to determine if a relationship existed between level of use of constructivist
instructional practices and teacher efficacy level. The following research questions were
addressed:
1. What are West Virginia science teachers’ levels of use of selected constructivist
instructional practices in West Virginia science classrooms?
2. What are the differences, if any, in the level of use of constructivist instructional
practices based on selected demographic variables (years of teaching, Advanced
Placement course instruction, SES level, class size)?
3. What are West Virginia science teachers’ levels of efficacy regarding teaching
science in WV science classrooms?

132
4. What are the differences, if any, in West Virginia science teacher efficacy levels
for teaching science based on selected demographic variables (years of teaching,
Advanced Placement course instruction, SES level, class size)?
5. What is the relationship, if any, between teacher efficacy level for teaching
science and the use of selected constructivist instructional practices in West
Virginia science classrooms?
Population
The population for this study was any West Virginia middle or high school
science teacher who taught at least one science course during the 2011-2012 school year.
At the time of the study West Virginia had approximately 120 high schools and 156
middle schools with 1,898 science teachers instructing one or more science courses
(WVDE, 2011). Science teachers from all of West Virginia’s 55 counties were included
in the survey.
Methods
This study was completed using a mixed-methods design. Primary data collection
was quantitative utilizing a one shot cross-sectional design survey model via
SurveyMonkey from one group of subjects at one point in time.
The survey instrument contained three sections: a demographics section,
instructional practices, and teacher efficacy. The instructional practice section used a
researcher developed five-point Likert scale with 16 selected constructivist instructional
practices created by a review of the literature and validated by expert review.
Respondents were asked to indicate the frequency of use of the constructivist
133
instructional practices. The teacher efficacy section consisted of a researcher adapted
(with permission) version of the Teacher Self Efficacy Scale from Ohio State University.
Respondents were asked to indicate their level of efficacy for teaching science by
responding to 24 prompts with a nine-point Likart scale. Finally respondents were given
the opportunity to participate in a short follow up telephone survey through two open
ended questions.
The instrument was distributed to middle school and high school science teachers
in West Virginia’s 55 counties via SurveyMonkey. The link was forwarded to the school
principal to forward to instructors in their building teaching one or more science courses
in the 2011-2012 school year. Survey responses were received from 201 science
educators and analyzed to determine differences in level of practice use and efficacy level
based on selected demographic variables.
Mean scores were calculated for the total level of use of constructivist
instructional practices, total efficacy level, and three subcategories of efficacy. One
sample t-tests were used to determine deviation of the means from the expected mean
values of hypothetical normal distributions. Independent sample t-tests and one-way
analysis of variance (ANOVA) were used to determine if the differences existed in level
of constructivist practice implementation or efficacy level based on selected demographic
variables. Pearson Product-Moment Correlation Coefficients (r) were determined
between the level of use of the selected constructivist instructional practices and the total
level of efficacy and the three subcategories.

134
Summary of Findings
The majority of respondents were high school (52.1%) general science teachers
(51.6%). Thirty-seven respondents taught an AP or pre-AP course. The largest group of
respondents had five or fewer years of total teaching (29.5%) and five or fewer years of
teaching science (34.2%). Overall, respondents (58.5%) indicated large numbers of low
SES students (more than 50% free and reduced lunch). Most respondents (85.8%)
worked in AA or AAA schools and taught in classrooms with 21 or more students (80%).
One sample t-tests were performed comparing the mean of each of the 16
individual constructivist instructional practices and the total level of use of constructivist
practices score to a hypothetical normal distribution resulting in significance for each at
the p<.001 level. Practices were also analyzed based on selected demographic variables.
Two of the practices resulted in significant differences for school level (middle school vs.
high school) and total years of teaching experience. One practice was significant based
on years of teaching science, teaching AP/pre-AP courses, school size, and class size. No
significant differences were found based on SES level. No significant differences were
found for the total efficacy score based on any of the selected demographic variables.
One sample t-tests were used to compare the sample mean for each individual
prompt, the total efficacy score (TE) and three efficacy sub-scores (ESE, EIP, and ECM)
to the mean from a hypothetical normal distribution. Each was significant at the p<.001
level. Teacher efficacy was examined with regard to the same demographic variables as
instructional practices. For school level (middle vs. high school) only ESE yielded
significance. No significant differences were found based on total years of teaching,
135
years of teaching science, AP instruction, school SES level, or the number of students in
the classroom. The relationships between school size, TE and EIP were significant.
A Pearson-Product Moment Correlation Coefficient (r) was performed comparing
the total level of constructivist practice implementation score with TE, ESE, EIP, and
ECM as well as between each constructivist practice and the four efficacy scores. All
relationships ranged from moderate to strong (Holcomb, 2006). Moderate relationships
included the relationships between level of use of the constructivist practices and TE,
EIP, and ECM. The relationship between constructivist practice use and ESE was
moderately strong. Each individual constructivist practice was compared to TE resulting
in eight moderate and eight weak relationships. Each individual practice was compared
to ESE resulting in 14 moderate and two weak relationships. Each individual practice
was compared to EIP resulting in 12 moderate and four weak relationships. Each
practice was compared to ECM resulting in six weak and three moderate relationships.
The findings from the follow-up telephone interviews yielded additional data
regarding the level of use of constructivist instructional practices. Five of 15 respondents
indicated using constructivist practices daily, though four reserved them for advanced
courses. Dominant influences on practice selection included state CSOs, student
strengths/weaknesses, time, and effectiveness. Benefits of using the practices included
building excitement, motivation, increasing skills, and deepening understanding. Setting
clear expectations, routines, rubrics, examples, and alternative assessments were listed as
promoting success. Field trips, guest speakers, and role playing were not regularly
utilized. Twenty-nine barriers for new practice implementation were identified.

136
Overall, acceptable internal consistency and reliability were found for each
portion of the survey instrument (constructivist instructional practice portion α = .88 and
efficacy α = .957). Cronbach’s α values for each of the individual constructivist practices
and individual efficacy prompts also yielded acceptable internal consistency. Cronbach’s
α for each of the three efficacy sub-scores (ESE α = .903, EIP α = .884, ECM α = .940)
also yielded acceptable internal consistency (Pallant, 2007).
Conclusions
Data collected as part of this study were sufficient to support the following
conclusions:
Primary Research Questions
Levels of Use of Selected Constructivist Instructional Practices
Fourteen of the 16 constructivist practices and the total use score yielded a mean
significantly different than that of a hypothetical normal distribution. Overall, West
Virginia science teachers frequently used the selected constructivist instructional
practices, with ten of the 16 practices used frequently.
Levels of Use Based on Demographic Data
Overall, few significant differences were found in the level of use of
constructivist instructional practices based on the selected demographic variables for the
individual and total use score. Only eight individual practices yielded significant
differences for the demographic variables: two for school level, two for total years of
teaching experience, one for years of teaching science, one for AP/Pre-AP instruction,

137
one for school size, and one for average class size. Although there were significant
differences in use level of constructivist instructional practices based on these six
demographic variables, none of these differences were sufficient to conclude that there
were differences in overall use based on the variables.
Teacher Efficacy Levels
Overall, West Virginia science teachers’ indicated moderately high efficacy (7.12
on a 9 point scale) levels significantly different than the expected normal distribution (M
= 5) for each of the individual efficacy prompts, each of the sub-scores of efficacy (ESE,
EIP, and ECM), and the total efficacy score. Overall, West Virginia science educators
believe that what they are doing makes a difference in the science classroom.
Teacher Efficacy Levels Based on Demographic Variables
Overall, few significant differences were found in total efficacy (TE) or the three
sub-scores (ESE, EIP, ECM). Only three significant differences were found in efficacy
level based on a demographic variable. TE and EIP were found to be significant at the
p<.05 level based on school size. EIP was significantly higher in A schools. ESE was
higher for middle school. Although there were significant differences in efficacy level
based on these three demographic variables, none of these differences were sufficient to
conclude that there were differences in overall efficacy level based on the variables.
Relationship between Efficacy Level and Constructivist Practice Use
Overall, the relationship between teacher efficacy and use of constructivist
instructional practices in West Virginia science classrooms is moderate but significant.

138
The relationship between total level of constructivist practices implementation (TLCPI)
and TE, the relationship between TLCPI and EIP, and the relationship between TLCPI
and ECM were moderate. The relationship between TLCPI and ESE was moderately
strong. When viewed individually the relationships between the constructivist practices
and TE, ESE, EIP, and ECM were weak to moderate.
Interview Findings
Data collected as part of the follow-up telephone interviews in the study were
used to support the conclusions for each of the interview questions below:
Timing of Instructional Practices Use
Overall, West Virginia science teachers participating in the survey frequently
utilized constructivist practices as part of the following activities: laboratory work, group
work, presentations, and for advanced courses. Five of 15 respondents utilized such
practices daily. Field trips, guest speakers, and role playing were rarely utilized by
respondents.
Factors Influencing Instructional Practice Selection
The two most dominant factors influencing selection of instructional practices for
respondents were the state Content Standards and Objectives (CSOs) with 7 of 15
respondents indicating influence, followed by student background, achievement, or prior
knowledge with 5 of 15 respondents indicating influence. Other factors included student
strengths/needs/reactions and practice effectiveness.

139
Benefits of Constructivist Practices in the Science Classroom
Common benefits of constructivist instructional practices indicated by
respondents included building student excitement, increasing motivation, building lab
skills, and deepening understanding. Ten specific examples of activities instructors
found to be particularly beneficial were provided. Four instructors cited evidence
provided by former students of activities that benefited them in college or life.
Aspects of Constructivist Practices that Promote Learning
Overall, the two aspects of constructivist instruction most commonly cited by
respondents as promoting learning were routines and clear expectations (5 of 15
respondents). Other important aspects of constructivist instruction cited by respondents
included: providing visual/concrete examples of concepts, use of rubrics, and providing
alternative products/assessments for students with different learning styles.
Barriers to Implementation of New Instructional Practices
Responses to this question were the most varied in the study. Twenty-nine
different barriers were given, indicating that barriers may be situation specific. The two
most common barriers given were lack of time and student apathy, followed by money,
lack of materials at home/school, lack of parental support, difficulties/danger at home,
differing expectations, and students from low SES backgrounds.
Instrument Reliability
All portions of the survey instrument exhibited acceptable levels of internal
consistency. The individual and total level of use scores for the constructivist

140
instructional practices each yielded alpha values greater than the necessary value of .7
(Pallant, 2007). The total efficacy and three efficacy sub-scores (ESE, EIP, and ECM)
yielded alpha values greater than .7 as well.
Discussion and Implications
The findings of this study can be used by science teachers, administrators, and
policy makers as they strive to make decisions regarding instructional practice at the
classroom, school, and state/district levels. The data could inform practice selection,
professional development, and help overcome barriers to implementing new practices.
The following discussion and implications section is organized around the study research
questions and ancillary findings.
Constructivist Practices: Level of Use
The one sample t-tests used to compare the level of use means of each
constructivist practice and the total level of use means for comparable hypothetical
normal distribution revealed significant differences for the total use score and 14 of the
16 practices. Ten of the significant sample means were larger than the expected mean in
the hypothetical normal distribution. Six of these sample means were greater than 3.5.
These results indicate that the science teachers participating in the survey used the
practices in a manner greater than expected in a normal population. This above average
constructivist practice implementation is beneficial for West Virginia’s science students
and provides the type of education researchers indicate meets student needs today (Barak
& Shakhman, 2007). These results also suggest that West Virginia’s science educators
are already using the practices necessary for successful implementation of Next

141
Generation Science Standards (Next Generation Science Standards, 2011). These
findings are important for the implementation of the Next Generation Science Standards
since a greater than expected use of constructivist practices will allow educators to more
readily engage students with the new standards. Educators will already be familiar with
the practices necessary to implement the standards, easing the transition for everyone.
Four of the 16 practices produced means significantly lower than those expected in a
normal distribution. These practices were: allowing students to choose a topic or
problem, look for causes, supports, and effects (M = 2.77), having students assume the
roles of others and experience new perspective to solve a problem (M = 2.65), alternating
roles with students to summarize, predict, and clarify (M = 2.73), and requiring students
to explore situations outside the classroom in museums, gardens, with guest speakers,
etc…. (M = 2.26).
Additional information on use of these strategies was provided in the follow up
telephone interviews. Respondents cited role playing and exploration outside the
classroom/field trips as difficult to implement and/or not part of their curriculum.
Barriers to implementation of such practices, including lack of time, lack of money, and
lack of support in the home, were also revealed in the telephone interviews. These
barriers could prevent instructors from implementing certain constructivist instructional
practices particularly those that are time intensive or create extra expenses.
Administrators, teacher preparation programs, and professional development programs
must follow research-based recommendations and provide science teachers with the
materials and support necessary to increase the use of these constructivist practices
(NSTA Position Statement: Leadership in Science Education, 2011).

142
Demographic Variables and Level of Use
Two of the individual practices, having students assume the role of others to
experience new perspectives and solve problems, and alternating roles with students to
summarize, predict, and clarify passages, resulted in significant differences based on
school level. Middle school teachers reported higher levels of use for both practices. No
significant differences were found for the total level of use score or the remaining 14
individual practices. The lack of significant findings may indicate a need for more
research in this area. The small sample size and relatively homogeneous sample of West
Virginia science educators may have also affected the results. A study with a larger,
more diverse population may result in a different outcome.
Surprisingly, no significant differences were found for the total use score based
on years of teaching or years of experience teaching science. Overall these results agreed
with the research indicating that years of experience was not a significant contributor to
student achievement. Multiple researchers found that years of experience did not
significantly influence student learning (Giglio, 2010; Jones, 2006). Again, more
research is needed in this area as numerous studies also found that years of experience
significantly influenced student achievement (Clotfelter, Ladd, and Vigdor, 2007;
Haimson, 2011; Holley, 2008; McCue, 2011; Rockoff, 2004). A larger sample
population of more diverse educators could result in a different outcome. Overall the
results do not indicate whether an instructor had taught an AP or pre-AP is a factor in
determining use levels for constructivist practices. However, since only 37 respondents
indicated they taught an AP or pre-AP course a different outcome may result with a
larger sample population.

143
No significant differences were found in the level of use of the 16 individual
constructivist practices and total use score based on school SES level. These results were
some of the most surprising of the survey. Numerous authors indicated that poverty
negatively influences student achievement (Holliday, 2011; Jensen, 2009; Payne, 2005).
Because achievement is influenced by selection of instructional strategies, constructivist
strategies have been recommended for use with low SES populations (Costello,
Hollifield, & Stinnett, 1996; Keller, 2005; McKinney, Flenner, Frazier, & Abrams,
2006). However, West Virginia’s student population is relatively homogeneous with a
larger subpopulation of low SES students across the board. Additional research with a
more diverse student population is needed for this variable.
No significant difference was found for the total level of use score based on the
size of the student population or the number of students in science class. These findings
were likewise surprising because many studies indicate that students benefit from smaller
class size (Achi, 2011; Flowers, 2010; Picus, 2000). However, other authors (Whitehurst
& Chingos, 2011) found that the effects of class size were minimal and benefits do not
outweigh the financial burden. The findings from the current study agree with the latter
research indicating that class size does not significantly influence practice selection, and
consequently student achievement. Because research on class size, like years of
experience, is mixed, more studies with larger educator populations may be beneficial.
Levels of Teacher Efficacy for Teaching Science
The 24 efficacy prompts, the total efficacy score (TE), the sub-score for Efficacy
in Student Engagement (ESE), the sub-score for Efficacy in Instructional Practice (EIP),

144
and the sub-score for Efficacy in Classroom Management (ECM) were found to be
significantly different than the hypothetical normal distribution for the applicable
comparison group. Mean scores for each of the groups were well above the hypothetical
mean for their group suggesting that the science teachers responding to the survey had
moderately high efficacy levels with regard to teaching science. These results are also
very encouraging for science education in West Virginia. If West Virginia science
educators already have moderately high efficacy levels, they believe that what they are
doing in the classroom promotes learning (Woolfolk, 2000). Teacher efficacy is
positively correlated with instructional practice implementation (Tschannen-Moran, Hoy,
& Hoy, 1998) so West Virginia science teachers are willing to implement new methods
to meet student needs. Sustained professional development which builds on this
willingness with regard to constructivist practices should be implemented to further
increase usage of constructivist instructional practices.
A willing educator population, provided with appropriate research-based
professional development, materials, time, and funding can implement programming to
meet the needs of the Next Generation Science Standards and improve test scores and
student performance. However, materials, time, and money were all listed by follow-up
survey respondents as barriers to implementation of constructivist practices.
Administrators and policy makers at the local, state, and county levels must take this into
consideration as they plan programs and allocate funding. Teacher efficacy is shaped by
experiences in the classroom, particularly early in an educator’s career (Woolfolk Hoy,
2000). If educators are constantly undermined by these barriers or new practices fail as a

145
result of them, educator efficacy may be negatively affected resulting in future
unwillingness to try new practices.
The lowest overall efficacy sub-score was found for the ESE subcategory. The
lowest individually scoring prompts also occurred in this category: assisting families in
helping students do well in school and getting through to the most difficult students. EIP
yielded the largest overall subcategory total. The highest individual prompt in this
category (gauging student comprehension of material taught) had a mean of 7.87. Only
one prompt yielded a response lower than 7.0 (calming students who are disruptive or
noisy).
These results provide further information regarding West Virginia science
teachers’ levels of efficacy. West Virginia science teachers had the highest level of
efficacy with regard to Efficacy in Instructional Practice (EIP), followed by Efficacy in
Classroom Management (ECM), and Efficacy in Student Engagement (ESE). The fact
that Efficacy in Instructional Practice yielded the highest efficacy score of the three
subcategories is also encouraging for West Virginia Science educators. These findings
agree with Albion’s (1999) findings that teacher beliefs are important in practice
selection, particularly choosing new practices for new situations (such as the Next
Generation Science Standards).
ECM was a very close second behind EIP in efficacy level. This finding
coincides with the literature, since Woolfolk (2000) listed classroom management as one
of the factors efficacy is closely associated with in the classroom. These findings were
also corroborated in the follow-up telephone interviews as many of the factors

146
contributing to the success of constructivist instructional practices identified by
respondents related to classroom management (setting forth clear expectations,
establishing routines, etc….).
The finding that ESE was a distant third was also corroborated in the follow-up
telephone interviews. Interviewees reported difficulties with student apathy, lack of
motivation, and lack of support as barriers to implementation of new practices. Other
respondents related that the lack of engagement they encounter in the classroom is a
result of the students’ home life. One interview respondent stated, "It has become the
norm that kids are not going to do this…I don’t give a lot of homework because the kids
are living in these situations where they cannot concentrate. There are things that go on at
home that are really a problem."
Demographic Variables and Level of Teacher Efficacy
Few significant differences in teacher efficacy based on school level were found
for TE, EIP, or ECM. A significant difference was found for ESE based on this variable,
with middle school teachers reporting higher levels of efficacy than high school teachers.
These results suggest that middle school teachers have a higher belief in their ability to
engage students than high school teachers. Since the structure of organizations effects
teacher efficacy (Protheroe, 2008; Woolfolk Hoy, 2000) the team-oriented culture of
middle schools may be more conducive to higher ESE.
No significant differences were found for TE, ESE, EIP, and ECM based on total
years of teaching or years of experience teaching science. These findings correspond to
the research indicating that efficacy is formed during the early years of teaching

147
(Woolfolk Hoy, 2000). The results agree with this research because, if a relatively stable
efficacy concept forms in the early years of teaching, few differences would be found
over time. Research specifically measuring changes in efficacy in the initial years of
teaching may reveal a different outcome, as opposed to this study which grouped years
one through five together. These results also have broader applications for
administrators, policy makers, and teacher educators as they design training and support
programs for new teachers. Appropriate professional development for new educators is
crucial for developing high levels of efficacy, which will influence the educator’s work in
the classroom and student achievement throughout their career.
No significant difference was found in TE, ESE, EIP, and ECM based on whether
or not participants taught an AP or pre-AP course in the preceding five years. This
finding agrees with the previous findings for teaching an AP course, which indicated no
significant differences for level of use of constructivist instructional practices based on
this variable. However, just as with level of use of constructivist instructional practice
the small sample size for AP instruction (37 instructors) may have limited the outcome.
The need for more research in AP teacher efficacy is evident.
No significant differences in TE, ESE, EIP, or ECM efficacy levels were found
based on school SES level. These results are encouraging for West Virginia’s low SES
students since the science teachers participating in the survey held moderately high
efficacy levels regardless of school SES level. These findings indicate that West
Virginia’s high proportion of low SES students benefit from science educators who
believe that what they do in the classroom makes a difference in student achievement.
These findings are important because teachers with high efficacy are more likely to

148
implement new programming (Protheroe, 2008; Tschannen-Moran, Hoy, & Hoy, 1998)
necessary to reach low SES students (Costello, Hollifeld, & Stinnett, 1996; Keller, 2005;
McKinney, Flenner, Frazier, & Abrams, 2006). Other studies suggest that teacher
efficacy mitigates the effects of low SES (Tschannen-Moran, Hoy, & Hoy, 1998).
No significant differences in ESE and ECM were found based on the size of the
student population. Significant differences in efficacy levels based on school size were
found for TE and EIP. The lowest means for TE and EIP were reported by the AAA
group and the highest mean was reported by the A group, suggesting the instructors in
small schools possessed higher total efficacy and efficacy in instructional practice. When
efficacy level was examined at the classroom level, however, smaller classrooms did not
follow the pattern of smaller schools. No significant difference was found for TE, ESE,
EIP, or ECM efficacy levels based on the number of students in science classes. The
mixed results of school/classroom size variables indicate a need for more research.
Relationship between Teacher Efficacy and Use of Constructivist Practices
These results of the Pearson Product Moment Correlation Coefficient (r) between
the total level of use of constructivist instructional practices and each of the four efficacy
scores (total efficacy, efficacy in student engagement, efficacy in instructional practice,
and efficacy in classroom management) indicate that the relationship between West
Virginia science teacher’s level of efficacy and implementation of the selected
constructivist instructional practices is moderate overall. These findings agree with the
previous efficacy findings given the moderately high teacher efficacy scores (22 of the 24
efficacy prompts resulted in significant means greater than 6 on a 9 point scale).

149
Teachers with higher efficacy are more willing to implement new instructional practices
(Tshannen-Moran, Hoy, & Hoy, 1998). The authors broke this down further by
indicating that efficacy affects teacher behavior, effort, and aspiration. West Virginia
science teachers are therefore more likely to implement new constructivist practices as
corroborated by 10 of the 16 individual constructivist practices resulting in means
significantly higher than that which was expected in a normal distribution (M = 3 on a
five point scale).
However, six constructivist instructional practices did not result in significant
differences or resulted in significantly lower means, so there is still room for
improvement. Work must be done through policy and professional development that will
allow West Virginia science teachers to improve implementation of these six practices
and overcome the barriers previously discussed in implementing them. Appropriate
programming to further increase efficacy would also be beneficial since efficacy is
context specific (Bandura, 1997; Tchannen-Moran, Hoy, & Hoy, 1998). Context specific
factors related to the remaining six constructivist practices should be further researched
and addressed to improve implementation level and consequently student learning.
The results from the current study indicate that appropriate training and
professional development would be helpful in increasing all levels of efficacy,
particularly that of student engagement. A moderate correlation was found between level
of constructivist practice implementation and TE, EIP, and ECM. However, the
relationship between level of constructivist practice implementation and ESE was
moderately strong. The moderately strong relationship between ESE and level of
constructivist practice implementation is of particular interest because science educators

150
responding to the survey indicated the lowest subcategory total score in ESE, yet the
strongest level of relationship existed between ESE and level of implementation of
constructivist practice. With limited funding for professional development, targeted
programming for efficacy in student engagement has the potential to make the greatest
gain in teacher efficacy, constructivist practice implementation, and, consequently,
student achievement.
Despite findings of high efficacy with regard to teaching science using
constructivist instructional practices, the level of use of these practices was still moderate
overall. Again, this discrepancy could result from many of the barriers identified in the
follow-up interviews. Science teachers may feel very confident in their ability to make a
difference teaching science using such practices but lack the time and money to do so.
With support to overcome these and other barriers, science the relationship between
efficacy level and level of use of constructivist instructional practices may prove to be
stronger.
Instrument Reliability
Acceptable reliability and internal consistency were found for both the
constructivist instructional practices portion of the instrument and the teacher efficacy
portion of the instrument. All Chronbach’s α values for the individual and total
constructivist practices were greater than the accepted value of .7 (Pallant, 2007) with no
value less than .86. All Chronbach’s α values were greater than the accepted value for
teacher efficacy as well, with no values less than .95. These values indicate that the
instruments are useful in gathering information for their respective purposes. They

151
would be useful instruments in further research on the topic, such as research in subject
areas outside of the sciences.
Recommendations for Further Research
This study investigated the level of use of selected constructivist instructional
practices, level of teacher efficacy, if these constructs varied by selected demographic
variables, and the relationship between level of use of constructivist instructional
practices and teacher efficacy (total efficacy and three efficacy sub-scores). The study
also sought to examine emergent trends from the initial survey findings through the use
of a qualitative follow-up telephone interview. Based on the study findings, the
following recommendations for further research are provided:
1. This study focused on science educators in the state of West Virginia.
Expanding the study to other states would vary demographics and provide a
useful comparison, since West Virginia student demographics differ greatly
from other populations, particularly in urban areas.
2. This study focused on science educators and constructivist instructional
practices, however, these practices are useful across the curriculum, not just in
science. Expanding the study to include other subject areas would provide a
useful comparison between subjects.
3. Likewise, this study focused on science educators and efficacy, but teacher
efficacy could influence practice selection and implementation in any subject
area. Expanding the study to include other subject areas would provide a
comparison for efficacy levels across subjects.

152
4. Study respondents provided the greatest variety of responses about barriers to
implementation of instructional practices in the follow-up interview questions.
Further qualitative and/or quantitative work regarding barriers to increasing
the use of constructivist instructional practices is necessary to clarify the
relationship between barriers and perceived barriers to the implementation of
constructivist instructional practices.
5. This study was conducted at one time (2011-2012 school year) for instructors
teaching one or more science courses in that time frame. However, teacher
efficacy is a construct that can change over time, so a longitudinal study
following a cohort of science educators over multiple years would clarify the
relationship between years of experience and teacher efficacy level.
6. This study focused only on classroom teachers. There are many more
individuals necessary to the effectiveness of a school. A survey of
administrator efficacy level and teacher efficacy level in relation to level of
implementation of new practices could provide a clearer picture of school-
wide efficacy and practice.
7. This study focused on efficacy and instructional practice implementation,
which is only part of the challenge in increasing student achievement. A
study of instructor efficacy level and student achievement level could provide
educators and researchers with valuable information on the relationship
between educator efficacy and achievement.
8. This study focused on the level of implementation of selected instructional
practices, not assessment of those practices. A study seeking to find the

153
relationship, if any, between constructivist practice implementation and type
of assessment would also yield valuable information for educators in the
classroom.

154
REFERENCES
A Brief History of the Advanced Placement Program. (2003).
Retrieved from the AP Central College Board website:
http://www.collegeboard.com/prod_downloads/about/news_info/ap/ap_
history_english.pdf
Abd-el-Khalick, F., Bell, R. L., & Lederman, N. G. (1998). The nature of science and
instructional practice: Making the unnatural natural. Science Education, 83, 417-
436. Retrieved from http://dahsm.medschool.ucsf.edu/history/medical_tech_
course/med_tech_pdf/khalicknature_of_science.pdf
Achi, C. M. (2011). Class size and student learning. Retrieved from
http://www.answers.com/topic/class-size-and-student-learning
Albion, P. R. (1999). Self-Efficacy Beliefs as an Indicator of Teachers' Preparedness for
Teaching with Technology. Retrieved from
http://www.usq.edu.au/users/albion/papers/site99/1345.html
Anne E. Casey Foundation. (2012). Kids Count Data West Virginia. Retrieved from
http://datacenter.kidscount.org/data/bystate/StateLanding.aspx?state=WV
Armor, D., Conroy-Oseguera, P., Cox M., King, N., McDonnell, L., Pascal, A. Pauly, E.,
& Zellman, G. (1976). Analysis of the school preferred reading programs in selected Los Angeles minority schools. (REPORT NO. R-2007-LAUSD). Santa Monica, CA: Rand Corporation.
Bandura, A. (1977). Self-efficacy: Toward a unifying theory of behavioral change.
Psychological Review 84, 191-215.
Bandura, A. (1986). Social foundation of thought and action: A social cognitive theory.
Englewood Cliffs, NJ: Prentice Hall.
Bandura, A. (1993). Perceived self-efficacy in cognitive development and

155
functioning. Educational Psychologist, 28(2), 117-148.
Bandura, A. (1997). Self-efficacy: The exercise of control. New York: Freeman.
Bandura, A. (2000). Exercise of human agency through collective efficacy. Current
Directions in Psychological Science, 9(3), 75-78.
Bandura, A. (2002). Growing primacy of human agency in adaptation and change in the
electronic era. European Psychologist, 7(1), 2-16.
Banks, J. A., & Banks, C. A. M. (Eds.). (2007). Multicultural education: Issues and
perspectives. Danvers, MA: John Wiley and Sons, Inc.
Barak, M., & Shakhman, L. (2007). Reform-based science teaching: Teachers’
instructional practices and conceptions. Eurasian Journal of Mathematics,
Science, and Technology Education, 4(1), 11-20. Retrieved from
http://www.ejmste.com/v4n1/Eurasia_v4n1_Barak.pdf
Becker, H. J., & Riel, M. M. (1999). Teacher professionalism and the emergence of
constructivist-compatible pedagogies. Retrieved from:
http://www.crito.uci.edu/tlc/findings/special_report2/abstract.htm
Bertrand, A. L. (1962). School attendance and attainment: Function and dysfunction of
school and family social systems. Social Forces, 40(3), 228-233.
Borko, H., & Putnam, R. T. (1996). Learning to teach. Berliner & R. C. Calfee (Eds.),
Handbook of Educational Psychology, 673-708. New York, NY: Simon &
Schuster Macmillan.
Bourque, L. B., & Fielder, E. P. (2003). How to Conduct Telephone Surveys. 2nd Edition. Thousand Oaks, CA: Sage Publications.
Bracey, G. (2009). The Bracey report on the condition of public education. Retrieved
from the Education and the Public Interest Center & Education Policy Research Unit website: http://epicpolicy.org/publication/Bracey-Report
Breaux, E. (2007). How to reach and teach all students simplified. Larchmont, NY: Eye

156
on Education.
Bruce, C. A. (2008). Countering the effects of poverty on students. Diverse Learning
Communities Today, 1. Retrieved from the NAESP website:
http://www.naesp.org/resources/2/DLCT/2008/DLCT2008v1n1a2.pdf
Bybee, R. W., Taylor, J. A., Gardner, A., Van Scotter, P., Powell, J. C., Westbrook,
A., & Landes, N. (2006). The BSCS 5E instructional model: Origins and
effectiveness. Retrieved from the Office of Science Education of the National
Institute of Health website:
http://science.education.nih.gov/houseofreps.nsf/b82d55fa138783c2852572c9004
f5566/$FILE/Appendix%20D.pdf
Clotfelter, C. T., Ladd, H. F., & Vigdor, J. L. (2007). How and why do teacher
credentials matter for student achievement. Retrieved from the Calder Research
Center website: http://www.caldercenter.org/pdf/1001058_teacher_credentials.pdf
Coleman, J. S., Campbell, E. Q., Hobson, C. J., McPartland, J., Mood, A. M., &
Weinfield, F. D. (1966). Equality of educational opportunity. (The Coleman
Report). Washington, DC: U.S. Government Printing Office.
Costello, M. A., Hollifield, H. A., & Stinnette, L. (1996). Critical issue: Providing
effective schooling for students at risk. Retrieved from the North Central Regional
Educational Laboratory website:
http://www.ncrel.org/sdrs/areas/issues/students/atrisk/at600.htm
Crowther, D. T., & Cannon, J. B. (1998). How much is enough: Preparing elementary
science teachers through science practicums. Paper presented at the annual
meeting of the Association for the Education of Teachers of Science. Retrieved
from http://www.eric.ed.gov/PDFS/ED415112.pdf
Daniels, H., & Bizar, M. (1998). Methods that matter: Six structures for best practice
of classrooms. York, ME: Stenhouse Publishers.

157
Dell’Olio, J. M., & Donk, T. (2007). Models of teaching: Connecting student learning
with standards. Thousand Oaks, CA: Sage Publications.
Dembo, M. H., & Gibson, S. (1985). Teachers' sense of efficacy: An important factor in
school improvement. The Elementary School Journal, 86(2), 173-184.
Dillman, D. A., Smyth, J. D., & Christian, L. M. (2009). Internet, mail, and mixed-
mode surveys: The tailored design method. 3rd Edition. Hoboken, NJ: John
Wiley and Sons, Inc.
Dow, P., Duschl, R. A., Dyasi, H. M., Kuerbis, P. J., Lowry, L., McDermott, L. C.,
Rankin, L., and Zoback, M. L. (2000). Inquiry and the National Science
Education Standards: A guide for teaching and learning. Washington DC:
National Academy Press.
DuFour, R., DuFour, R., Eaker, R., & Karhanek, G. (2010). Raising the bar and
closing the gap: Whatever it takes. Bloomington, IN: Solution Tree Press.
Earley, P. M. (2001). Title II requirements for schools, colleges, and departments of
education. Washington, DC: ERIC Clearinghouse on Teaching and Teacher
Education.
Edvantia. (2005). Research digest: Effective instructional strategies. Charleston, WV:
Appalachia Educational Laboratory. Retrieved from
http://sites.edvantia.org/pdta/pdf/Effective_Instructional_Strategies.pdf
Fink, A. (2003). How to design survey studies. 2nd Edition. Thousand Oaks, CA: Sage
Publications.
Fisher, D., & Frey, N. (2007). Checking for understanding: Formative assessment
techniques for your classroom. Alexandria, VA: ASCD Press.
Flower, D. (2010). What is the effect of class size on student learning? Retrieved from
the Alberta Teacher’s Association website:

158
http://www.teachers.ab.ca/Publications/The%20Learning%20Team/Volume%203
/Number%201/Pages/What%20is%20the%20effect%20of%20class%20size%20o
n%20student%20learning.aspx
Giglio, K. (2010). What teacher characteristics affect student achievement? Retrieved
from the Los Angeles Public Schools website:
http://www.rand.org/pubs/research_briefs/RB9526/index1.html
Goals 2000: Educate America Act. (1994). Pub. L. No. 103-227, 101-102.
Goddard, R. D., Hoy, W. K., & Hoy, A. W. (2000). Collective teacher efficacy: Its
meaning, measure, and impact on student achievement. American Educational
Research Journal, 37(2), 479-507.
Good, T. L., & Brophy, J. E. (1990). Educational psychology: A realistic approach. 4th
Edition. White Plains, NY: Longman.
Gunter, A. M., Estes, T. H., & Schwab, J. (2003). Instruction: A models approach. 4th
Edition. Boston: Allyn and Bacon.
Haimson, L. (2011). How teaching experience makes a difference. Retrieved from the
Parents Across America website: http://parentsacrossamerica.org/how-teaching-
experience-makes-a-difference/
Hanushek, E. A., & Rivken, S. G. (2007). Pay, working conditions, and teacher quality.
Journal Issue: Excellence in the Classroom, 17(1). Retrieved from
http://futureofchildren.org/publications/journals/article/index.xml?journalid=34&
articleid=76§ionid=443
Harmin, M., & Toth, M. (2006). Inspiring active learning: A complete handbook for
today’s teachers. Alexandria, VA: ASCD Press.
Haury, D. L. (1988). Evidence that science locus of control orientation can be modified
through instruction. Journal of Research in Science Teaching, 25, 233-246.
Henson, K. T. (2006). Curriculum planning: Integrating multiculturalism,
constructivism, and education reform. Long Grove, IL: Waveland Press.
159
Henson, R. K. (2001). Teacher self-efficacy: Substantive implications and measurement
dilemmas. Paper presented at the Annual Meeting of the Educational Research
Exchange, College Station, TX.
Hewitt, T. W. (2006). Understanding and Shaping Curriculum: What We Teach and
Why. Thousand Oaks, CA: Sage Publications
History of the AP program (2011). Retrieved from the AP Central College Board
website: from
http://apcentral.collegeboard.com/apc/public/program/history/8019.html
Holcomb, Z. (2006). SPSS basics: Techniques for a first course in statistics. Glendale,
CA: Pyrczak Publishing.
Holley, M. (2008). Teaching experience. Retrieved from the Mackinac Center for Public
Policy website: http://www.mackinac.org/9591
Holliday, T. (2011). Impact of poverty on student learning. Retrieved from the
Kentucky Department of Education website:
http://www.education.ky.gov/kde/administrative+resources/commissioner+of+ed
ucation/commissioner+hollidays+blog/impact+of+poverty+on+student+learning.
htm
Huck, S. W. (2008). Reading statistics and research. Boston, MA: Pearson Publications.
Huffman, D., Thomas, K., & Lawrenz, F. (2003). Relationship between professional
development, teachers’ instructional practices, and achievement of students in
science and mathematics. School Science and Mathematics, 103(8). Retrieved
from http://www.weber.edu/wsuimages/jmitchell/MEDUC%206000/Prof%20
Dev%20and%20Instructional%20Practices.pdf
Huitt, W., & Hummel, J. (2006). An overview of the behavioral perspective. Educational
Psychology Interactive. Retrieved from the Valdosta State University website:
http://www.edpsycinteractive.org/topics/behsys/behsys.html
Ingrum, A. (n.d.). High school dropout determinants: The effect of poverty and learning
160
disabilities. The Park Place Economist, 14. Retrieved from
http://www.iwu.edu/economics/PPE14/Ingrum.pdf
Jackson, R. R. (2009). Never work harder than your students and other principles of
great teaching. Alexandria, VA: ASCD Press.
Jensen, E. (2009). Teaching with poverty in mind: What being poor does to kids’ brains
and what schools can do about it. Alexandria, VA: ASCD Press.
Jones, D. H., Alexander, C., Rudo, Z. H., Pan, D., & Vaden-Kiernan, M. (2006).
Teacher resources and student achievement in high need schools. Retrieved from
the Southwest Educational Development Laboratory website:
http://www.sedl.org/pubs/policyresearch/policydocs/tr-sa.pdf
Kaestle, C. F. (1983). Pillars of the republic: Common schools and American society,
1780-1860. New York, NY: Hill and Wang.
Keller, E. (2005). Strategies for teaching minorities. Retrieved from the West Virginia
University Department of Education website:
http://www.as.wvu.edu/~equity/general.html
Levitt, S. D., & Dubner, S. J. (2009). Freakanomics. New York, NY: Harper Collins.
Lumpe, A. T., Haney, J. .J., & Czerniak, C. M. (2000). Assessing teachers’ beliefs about
their science teaching context. Journal of Research in Science Teaching, 37(3),
275-292. Retrieved from http://ret.fsu.edu/Files/Tools/CBAST.pdf
Martin, N. K., Yin, Z., & Baldwin, B. (1998). Construct validation of the attitudes and
beliefs on classroom control inventory. Journal of Classroom Interaction, 33(2), 6-15.
McCue, V. (2011). Effective teachers and teaching: What principals need to know to
impact student achievement. Retrieved from the Articlesbase website:
http://www.sooperarticles.com/education-articles/tutoring-articles/effective-
teachers-teaching-what-principals-need-know-impact-student-achievement-
398093.html

161
McKinney, S. E., Flenner, C., Frazier, W., & Abrams, L. (2006). Responding to the
needs of at-risk students in poverty. Retrieved from the University of South
Carolina at Aiken website: http://www.usca.edu/essays/vol172006/mckinney.pdf
Merrill, M. D. (1991). Constructivism and instructional design. Educational Technology,
45-53. Retrieved from http://www.gwu.edu/~tip/military.html
Moussiaux, S. J., & Norman J. T. (1997). Constructivist teaching practices: Perceptions
of teachers and students. Retrieved from
http://condor.admin.ccny.cuny.edu/~hhartman/CONSTRUCTIVIST%20TEACHI
NG%20PRACTICES.htm
National Commission on Excellence in Education. (1983). A nation at risk: The
imperative for educational reform. Washington, DC: U.S. Government Printing
Office.
Newman, J. W. (2002). America’s teachers: An introduction to education. Boston:
Allyn and Bacon.
Next Generation Science Standards. (2011). Retrieved from the Achieve website:
http://www.achieve.org/next-generation-science-standards
NSTA Position Statement: Leadership in Science Education. (2011). Retrieved from the
National Science Teachers Association website:
http://www.nsta.org/about/positions/leadership.aspx
Paek, P. L., Ponte, E., Sigel, I., Braun, H., & Powers, D. (2005). A portrait of Advanced
Placement teachers’ practices. Retrieved from the AP Central College Board
website: http://www.ets.org/Media/Research/pdf/RR-05-09.pdf
Pallant, J. (2007). SPSS survival manual: A step by step guide to data analysis using
SPSS for Windows. New York, NY: Open University Press.
Patton, M. Q. (2002). Qualitative research and evaluation methods. 3rd Edition.
Thousand Oaks, CA: Sage Publications.
Payne, R. K. (2005). A framework for understanding poverty. 4th Edition. Highlands,

162
TX: aha! Process, Inc.
Picus, L. O. (2000). Class size reduction: Effects and relative costs. Retrieved from the
University of Oregon website: http://eric.uoregon.edu/hot_topics/class_size.html
Pogrow, S. (2009). Teaching content outrageously: How to captivate all students and
accelerate learning, grades 4-12. San Francisco, CA: John Wiley & Sons, Inc.
Pontius, R. (1998). Correlation analysis and comparison of two self-efficacy
instruments. Paper presented at the annual meeting of the National Association
for Research in Science Teaching. Retrieved from
http://www.eric.ed.gov/PDFS/ED418854.pdf
Protheroe, N. (2008). Teacher efficacy: What is it and does it matter? Principal, 87(5),
42-45. Retrieved from the National Association of Elementary School
Principals website: http://www.naesp.org/resources/1/Principal/2008/M-Jp42.pdf
Richardson, G. M., & Liang, L. L. (2008). The use of inquiry in the development of
pre-service teacher efficacy in mathematics and science. Journal of Elementary
Science Education, 20(1), 1-16. Retrieved from
http://www.eric.ed.gov/PDFS/EJ798565.pdf
Riggs, I., & Enochs, L. (1990). Towards the development of an elementary teacher’s
science teaching efficacy belief instrument. Science Education, 74, 625-637. Roberts, K. J., Henson, R. K., Tharp, B. Z., & Moreno, N. (2000). An examination of
change in teacher self-efficacy beliefs in science education based on the duration
of in-service activities. Paper presented at the annual meeting of the Southwest
Educational Research Association. Retrieved from
http://www.eric.ed.gov/PDFS/ED438259.pdf
Rockoff, J. (2004). The impact of individual teachers on student achievement: Evidence
from panel data. Retrieved from the Columbia University website:
http://www0.gsb.columbia.edu/faculty/jrockoff/rockoff_teachers_march_04.pdf

163
Savran, A., & Cakiroglu, J. (2003). Differences between elementary and secondary
pre-service science teachers’ perceived efficacy beliefs and their classroom
management beliefs. The Turkish Online Journal of Educational Technology.
2(4), 15-20. Retrieved from http://www.tojet.net/articles/243.pdf
Schleicher, A. (2011). Is the sky the limit to education improvement? Phi Delta Kappan
93(2), 58-63.
Schmidt H. G. & Moust J. H. C. (1998, April). Processes that shape small-group tutorial
learning: A review of research. Paper presented at Annual Meeting of the
American Educational Research Association, San Diego, CA. Retrieved from
http://www.eric.ed.gov/ERICWebPortal/recordDetail?accno=ED419792
Schneider, D. K., Stek, Krukowski, S., Synteta, P., Smith, T. K., & Schmitt, L. (2005).
Project based learning. Retrieved from
http://edutechwiki.unige.ch/en/Project-based_learning
Schneider, J. (2009). Privilege, equity, and the Advanced Placement program: Tug of
war. Journal of Curriculum Studies. 41(6), 813-831. Retrieved from
http://charlietudor.wiki.westga.edu/file/view/Privelege,+equity+and+AP+(schneid
er).pdf
Schuman, L. (1996). Perspectives on instruction. Retrieved from the San Diego State
University website:
http://edweb.sdsu.edu/courses/edtec540/Perspectives/Perspectives.html
Sevilla, M. (2012). Problem-based learning in the 21st century classroom. Kindle
Edition. CreateSpace Independent Publishing Platform.
Shirley, R. (2009). What is behaviorism and how can it be utilized in schools. The
Behaviorist Approach to Teaching in Class. Retrieved from:
http://www.suite101.com/content/the-behaviourist-approach-to-teaching-in-class-

164
a115748
Standridge, M. (2002). Behaviorism. In M. Orey (Ed.), Emerging perspectives on
learning, teaching, and technology. Retrieved from
http://projects.coe.uga.edu/epltt/
Tschannen-Moran, M., Hoy, A. W., & Hoy, W. K. (1998). Teacher efficacy: Its meaning
and measure. Review of Educational Research, 68(2), 202-248.
Tschannen-Moran M., & Woolfolk Hoy, W. K. (2000). Directions for scoring the
Teachers’ Sense of Efficacy Scale. Retrieved from http://wmpeople.wm.edu/asset/index/mxtsch/scoringetcfortses
Tschannen-Moran, M. & Woolfolk Hoy, A. (2001). Teacher efficacy: Capturing an
elusive construct. Teaching and Teacher Education, (17),783-805. Retrieved from http://mxtsch.people.wm.edu/Scholarship/TATE_TSECapturingAnElusiveConstr uct.pdf
Tyack, D. B. (1974). The one best system: A history of American urban education.
Cambridge, MA: Harvard University Press. Tyack, D., & Cuban, L. C. (1995). Tinkering toward utopia: A century of public school
reform. Cambridge, MA: Harvard University Press.
U.S. Department of Education. (2002). No child left behind. Retrieved
from the U.S. Department of Education website: http://www.ed.gov/policy/elsec/leg/esea02/107-110.pdf
Vieira, R. M., Tenreiro-Vieira C., & Martins, I. P. (2011). Critical thinking:
Conceptual clarification and its importance in science education. Science
Education International, 22(1), 43-55.
Walsh, J. A., & Sattes, B. D. (2005). Quality questioning: Research based practice to
engage every learner. Thousand Oakes, CA: Corwin Press.

165
Whitehurst, G. J., & Chingos, M. M. (2011). Class size: What research says and what it
means for state policy. Retrieved from:
http://www.brookings.edu/papers/2011/0511_class_size_whitehurst_chingos.aspx
Wilson, J. D. (1994). An evaluation of field experiences for the preparation of elementary teachers for science, mathematics, and technology. A paper presented at the annual meeting of the Mid-South Educational Research Association. Retrieved from http://www.eric.ed.gov/PDFS/ED383656.pdf
Woolfolk, A. E., & Hoy, W. K., (1990). Prospective teachers’ sense of efficacy and
beliefs about control. Journal of Educational Psychology, 82, 81-91. Woolfolk, A. (2010). Educational psychology. 11th Edition. Upper
Saddle River, NJ: Prentice Hall. Woolfolk Hoy, A. (2000). Changes in teacher efficacy during the early years of
teaching. Paper presented at the annual meeting of the American Educational Research Association, New Orleans, LA. Session 43:22. Published: Qualitative and Quantitative Approaches to Examining Efficacy in Teaching and Learning, April 28, 2000.
WVSSAC High School Classifications. (2011). Retrieved from the WVSSAC website:
http://www.wvssac.org/new_site/wvssac_website/html/classifications.htm
Yager, R. E. (2005). Exemplary science: Best practices in professional development.
Arlington, VA: NSTA Press.
Zhang, Y., & Wildemuth, B. (2009). Qualitative analysis of content. In B. Wildemuth
(Ed), Applications of Social Research Methods to Questions in Information and
Library. Santa Barbara, CA: Libraries Unlimited.

166
APPENDICES
Appendix A: Instrument
A Survey of Science Teacher Efficacy and Instructional Practice in WV Secondary Schools
You are invited to participate in a research project entitled A Study of the Relationship between Science Teacher Efficacy and Level of Constructivist Instructional Practice Implementation in West Virginia Science Classrooms designed to analyze the relationship, if any, between teacher efficacy and instructional practice. The study is being conducted by Dr. Ronald B. Childress and Amanda Knapp from Marshall University and has been approved by the Marshall University Institutional Review Board (IRB). This research is being conducted as part of the dissertation for Amanda Knapp. This survey is comprised of questions referring to level of use of instructional practices from the literature, level of efficacy, and basic demographics. Your replies will be confidential.
There are no known risks involved with this study. Participation is completely voluntary and there will be no penalty or loss of benefits if you choose to not participate in this research study or to withdraw. If you choose not to participate or withdraw simply close/exit the window. You may choose to not answer any question by simply leaving it blank. You may move forward or back within the survey and no questions are required. Once you complete the survey you can delete your browsing history for added confidentiality.
Completing the on-line survey indicates your consent for use of the answers you supply. By completing this survey you are also confirming that you are 18 years of age or older. If you have any questions about the study or in the event of a research related injury, you may contact Dr. Childress at xxx.xxx.xxxx, or Amanda Knapp at xxx.xxx.xxxx (via email at [email protected]). If you have any questions concerning your rights as a research participant you may contact the Marshall University Office of Research Integrity at (304) 696-4303. Please print this page for your records.
Survey Link: XXXXXX
Amanda K. Knapp

167
West Virginia Science Teacher Level of Constructivist Instructional Practice Survey (WVSTCIP)
Demographics Page I- Please indicate the choice that best describes your current teaching situation.
1. Are you teaching one or more science classes at the middle/junior high or high school level in the 2011-2012 school year?
_____ Yes _____No
Demographics Page II - (Continued if respondents answer yes above. If respondent answers no he/she will be taken to the end of the survey).
1. Which of the following best describes the school level at which you teach the majority of your science classes?
Middle/Junior High
High School
Both
2. Counting the 2011-2012 school year, how many total years of teaching experience do you have?
5 or less
6-10
11-15
16-20
21-25
26+
3. Counting the 2011-2012 school year, how many total years of teaching science do you have?
5 or less

168
6-10
11-15
16-20
21-25
26+
4. Please indicate the science course(s) you are teaching in 2011-2012. Check all that apply.
General Science
Chemistry
Biological Science
Environmental Science or Earth Science
Physical Science
Physics
Other (please specify)
5. Counting the 2011-2012 school year, have you taught an Advanced Placement (AP) course (high school) or Pre-AP course (middle/junior high school) in the last 5 years?
Yes
No
6. Which of the following best reflects the percent of children eligible for free and reduced lunch in your school in the current school year?
Less than 35%
36-50%
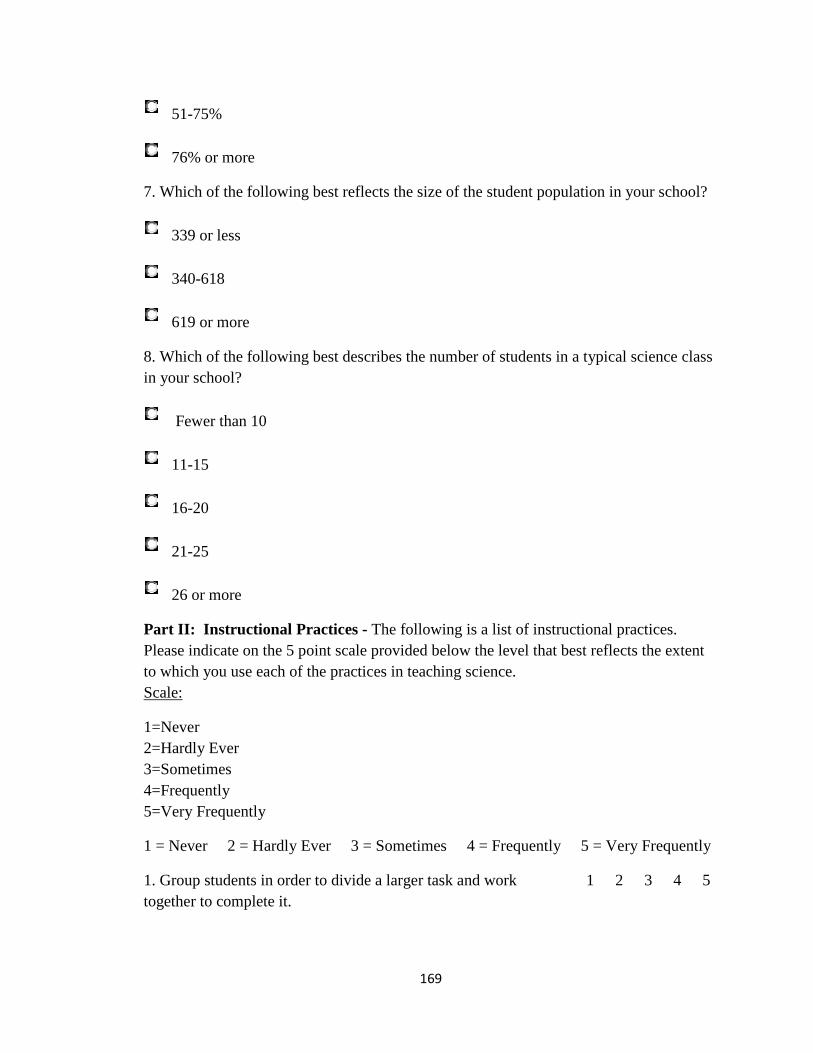
169
51-75%
76% or more
7. Which of the following best reflects the size of the student population in your school?
339 or less
340-618
619 or more
8. Which of the following best describes the number of students in a typical science class in your school?
Fewer than 10
11-15
16-20
21-25
26 or more
Part II: Instructional Practices - The following is a list of instructional practices. Please indicate on the 5 point scale provided below the level that best reflects the extent to which you use each of the practices in teaching science. Scale:
1=Never 2=Hardly Ever 3=Sometimes 4=Frequently 5=Very Frequently
1 = Never 2 = Hardly Ever 3 = Sometimes 4 = Frequently 5 = Very Frequently
1. Group students in order to divide a larger task and work together to complete it.
1 2 3 4 5
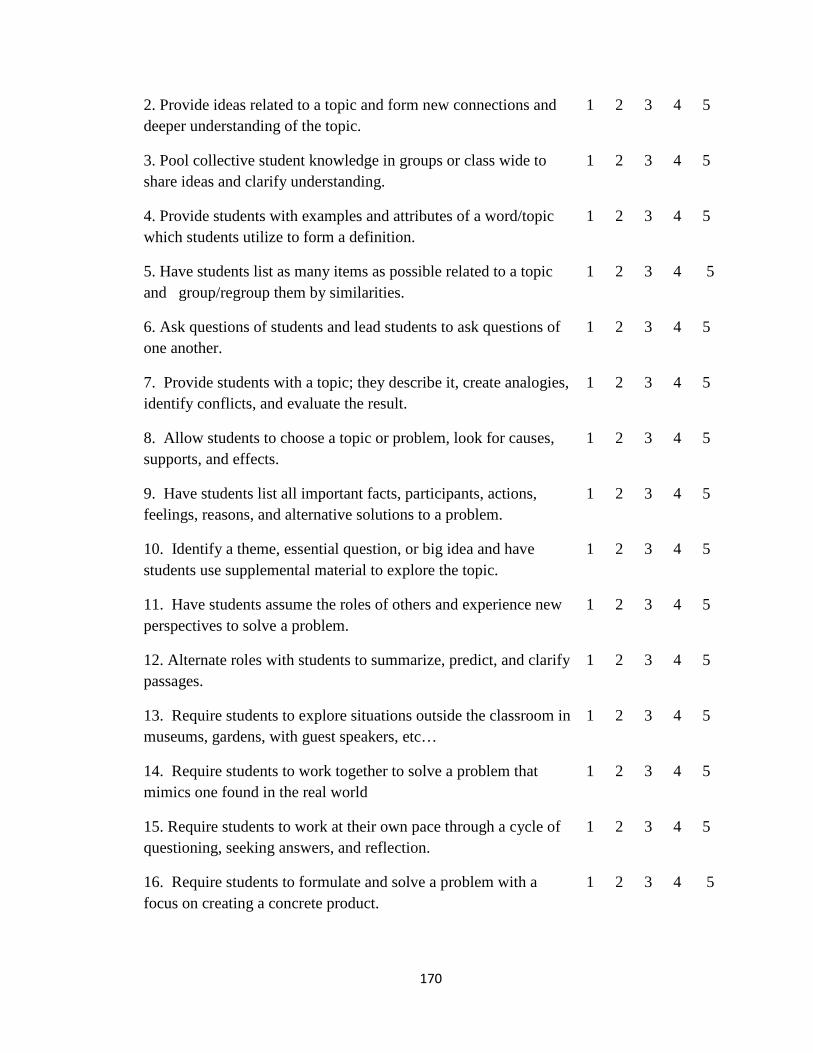
170
2. Provide ideas related to a topic and form new connections and deeper understanding of the topic.
1 2 3 4 5
3. Pool collective student knowledge in groups or class wide to share ideas and clarify understanding.
1 2 3 4 5
4. Provide students with examples and attributes of a word/topic which students utilize to form a definition.
1 2 3 4 5
5. Have students list as many items as possible related to a topic and group/regroup them by similarities.
1 2 3 4 5
6. Ask questions of students and lead students to ask questions of one another.
1 2 3 4 5
7. Provide students with a topic; they describe it, create analogies, identify conflicts, and evaluate the result.
1 2 3 4 5
8. Allow students to choose a topic or problem, look for causes, supports, and effects.
1 2 3 4 5
9. Have students list all important facts, participants, actions, feelings, reasons, and alternative solutions to a problem.
1 2 3 4 5
10. Identify a theme, essential question, or big idea and have students use supplemental material to explore the topic.
1 2 3 4 5
11. Have students assume the roles of others and experience new perspectives to solve a problem.
1 2 3 4 5
12. Alternate roles with students to summarize, predict, and clarify passages.
1 2 3 4 5
13. Require students to explore situations outside the classroom in museums, gardens, with guest speakers, etc…
1 2 3 4 5
14. Require students to work together to solve a problem that mimics one found in the real world
1 2 3 4 5
15. Require students to work at their own pace through a cycle of questioning, seeking answers, and reflection.
1 2 3 4 5
16. Require students to formulate and solve a problem with a focus on creating a concrete product.
1 2 3 4 5

171
Part III: Teacher Efficacy -The following is a list of questions about teaching science. Using the scale provided, please indicate the extent to which you believe you can accomplish each of these tasks in your science classroom. The scale is as follows: 1 = Nothing 9 = A Great Deal 1 = Nothing 9 = A Great Deal
1. How much can you do to get through to the most difficult students?
1 2 3 4 5 6 7 8 9
2. How much can you do to help your students think critically?
1 2 3 4 5 6 7 8 9
3. How much can you do to control disruptive behavior? 1 2 3 4 5 6 7 8 9
4. How much can you do to motivate students who show low interest in school work?
1 2 3 4 5 6 7 8 9
5. How much can you do to make your expectations clear about student behavior?
1 2 3 4 5 6 7 8 9
6. How much can you do to get students to believe they can do well in school work?
1 2 3 4 5 6 7 8 9
7. How well can you respond to difficult questions from your students?
1 2 3 4 5 6 7 8 9
8. How well can you establish routines to keep activities running smoothly?
1 2 3 4 5 6 7 8 9
9. How much can you do to help your students value learning?
1 2 3 4 5 6 7 8 9
10. How much can you do to gauge student comprehension of what you have taught?
1 2 3 4 5 6 7 8 9
11. How well can you craft good questions for your students?
1 2 3 4 5 6 7 8 9
12. How much can you do to foster student creativity? 1 2 3 4 5 6 7 8 9
13. How much can you do to get children to follow classroom rules?
1 2 3 4 5 6 7 8 9
14. How much can you do to improve the understanding of a student who is failing?
1 2 3 4 5 6 7 8 9

172
15. How much can you do to calm a student who is disruptive or noisy?
1 2 3 4 5 6 7 8 9
16. How well can you establish a classroom management system with groups of students?
1 2 3 4 5 6 7 8 9
17. How much can you do to adjust your lessons to the proper level for individual students?
1 2 3 4 5 6 7 8 9
18. How well can you use a variety of assessment strategies?
1 2 3 4 5 6 7 8 9
19. How much can you do to keep a few problem students from ruining an entire lesson?
1 2 3 4 5 6 7 8 9
20. How well can you provide an alternative explanation or example when students are confused?
1 2 3 4 5 6 7 8 9
21. How well can you respond to defiant students? 1 2 3 4 5 6 7 8 9
22. How much can you do to assist families in helping their children do well in school?
1 2 3 4 5 6 7 8 9
23. How well can you implement alternative strategies in your class?
1 2 3 4 5 6 7 8 9
24. How well can you provide appropriate challenges for very capable students?
1 2 3 4 5 6 7 8 9
Part IV: Telephone Survey - If you are willing to participating in a short telephone interview regarding the survey please enter your e-mail address and phone number in the spaces below. Thank you.
E-mail Address Phone Number:
_______________________________ _________________________________

173
Appendix B: Permission E-mails
E-mail 1: Permission to Use Instrument
July 14, 2011 9:42 AM
You are welcome to use the TSES in your dissertation research.
Anita
Anita Woolfolk Hoy, Professor
Educational Psychology & Philosophy
School of Educational Policy and Leadership
The Ohio State University
Columbus, OH 43210
phone: 614-488-5064
fax: 614-292-7900
e-mail [email protected]
http://www.coe.ohio-state.edu/ahoy

174
E-mail 2: Permission to use E-mail File
RE: FW: Request for Permission to Distribute Surveys
Date: 10:34 AM 4/23/12
From: Donna Jones
Ms. Knapp,
Unfortunately, we are unable to utilize our listserv for your survey. I am
attaching file of all principal emails within the state. Whatever you
distribute should be sent from your access account. Due to the way the
access server operates, you will only be able to send 50 emails at one time.
If I may be of further assistance, please feel free to contact me.
-----Original Message-----
From: [email protected] [mailto:[email protected]]
Sent: Tuesday, April 17, 2012 9:46 AM
To: Donna Jones
Subject: Re: FW: Request for Permission to Distribute Surveys
175
Appendix C: Phone Interview Questions
1. When do you utilize constructivist instructional practices in your science
classroom activities? (Examples will be provided if needed: opening a unit,
culminating activity, attention-getter, etc…)
2. What factors influence your selection of instructional practices in the science
classroom?
3. How have the constructivist instructional practices you implemented benefited
students in your science classroom? Describe specific examples if applicable.
4. What aspects of constructivist instruction do you believe promote student
learning?
5. What barriers (if any) do you encounter when implementing new instructional
practices?

176
Appendix D: Principal Initial Contact and Reminder E-mails
To: WV Middle, Junior, and High School Principals (on e-mail list)
From: Date:
Dear Secondary School Administrator,
This is a request to distribute an electronic survey to the science teachers in your building. Middle, junior, and high school science teachers are being invited to participate in a state-wide confidential research survey. The title of the study is A Study of the Relationship between Science Teacher Efficacy and Level of Constructivist Instructional Practice Implementation in West Virginia Science Classrooms.
I am writing to request your assistance in completing this study. Within the week you will receive another e-mail containing the link to the electronic survey via SurveyMonkey. Please forward the e-mail containing the survey link to teachers in your building instructing at least one science course during the 2011 – 2012 school year. Forwarding the survey link indicates your consent for the teachers in your building to participate in the survey. If you do not wish for the science teachers in your building to participate in the study simply do not forward them the link.
The survey is being conducted as part of my doctoral program requirements for Marshall University. The information provided will assist in determining if a relationship exists between teacher efficacy level and instructional practice implementation. It will help science instructors make informed decisions and has the potential to assist administrators in planning professional development.
The online questionnaire will take approximately fifteen (15) minutes to complete. Participation is completely voluntary. Individual teachers and schools will not be identified. Data will be reported in aggregate. Teachers will also be provided with an opportunity to volunteer to participate in a short telephone follow-up interview.
If you have questions, you may contact me at 304-458-1817 or through e-mail at the address above. If you have questions concerning the rights of teachers participating in this research process, you may contact the Marshall University Office of Research Integrity at (304) 696-4303. Dr. Ron Childress, principal investigator for this study, may be reached at [email protected] , phone 304-746-1904.
Thank you in advance for your assistance with this survey and for your continued support of research in science education. I look forward to sharing the study results with you.
Amanda K. Knapp

177
Principal Reminder E-mail
Dear Middle/Junior or High School Principal:
Earlier this month your science teachers were invited to participate in a confidential research survey entitled A Study of the Relationship between Science Teacher Efficacy and Level of Constructivist Instructional Practice Implementation in West Virginia Science Classrooms. As the survey collection window draws to a close this is a reminder to forward the survey link below to all instructors in your building teaching one or more science courses during the 2011-2012 school year if you have not done so already. If you have already forwarded the link to your teachers thank you for your support of research in science education.
If you have questions, you may contact me at 304.458.1817 or through e-mail at [email protected]. If you have questions concerning the rights of teachers participating in this research process, you may contact the Marshall University Office of Research Integrity at (304) 696-4303. Dr. Ron Childress, principal investigator for this study, may be reached at [email protected] or by phone at 304-746-1904.
Thank you in advance for your assistance with this survey and for your continued support of research in science education.
Survey Link: XXXXX
Amanda K. Knapp
Co-Principal Investigator

178
Appendix E: IRB Stamped Consents (Online and Verbal)
Knapp 2012: A Study of the Relationship between Science Teacher Efficacy and Level of Constructivist Instructional Practice Implementation in West Virginia Science Classrooms
Confidential Online Survey Consent Marshall University IRB Approved on: 05/04/12 Expires on: 05/04/13 Study number: 327087
(Included on Page 1 of the Instrument) You are invited to participate in a research project entitled A Study of the Relationship between Science Teacher Efficacy and Level of Constructivist Instructional Practice Implementation in West Virginia Science Classrooms designed to analyze the relationship, if any, between teacher efficacy and instructional practice. The study is being conducted by Dr. Ronald B. Childress and Amanda Knapp from Marshall University and has been approved by the Marshall University Institutional Review Board (IRB). This research is being conducted as part of the dissertation for Amanda Knapp. This survey is comprised of questions referring to level of use of instructional practices from the literature, level of efficacy, and basic demographics. Your replies will be confidential. There are no known risks involved with this study. Participation is completely voluntary and there will be no penalty or loss of benefits if you choose to not participate in this research study or to withdraw. If you choose not to participate or withdraw simply close/exit the window. You may choose to not answer any question by simply leaving it blank. You may move forward or back within the survey and no questions are required. Once you complete the survey you can delete your browsing history for added confidentiality. Completing the on-line survey indicates your consent for use of the answers you supply. By completing this survey you are also confirming that you are 18 years of age or older. If you have any questions about the study or in the event of a research related injury, you may contact Dr. Childress at 305.746.1904, or Amanda Knapp at 304.458.1817(via email at [email protected]). If you have any questions concerning your rights as a research participant you may contact the Marshall University Office of Research Integrity at (304) 696-4303. Please print this page for your records. Survey Link: XXXXXX Amanda K. Knapp Co-Principal Investigator Chemistry/Physics Teacher Buffalo High School

179
Consent to Participate in Research – Verbal Presentation
Marshall University IRB Approved on: 05/04/12 Expires on: 05/04/13
Study number: 327087
Hello, my name is Amanda Knapp. I am a chemistry and physics teacher at Buffalo High school and Marshall University graduate student. You have been chosen to be in a study about the relationship between science teacher efficacy and level of constructivist instructional practice implementation in West Virginia science classrooms. You were chosen randomly from a pool of initial survey respondents who submitted contact information. This study involves research. The purpose of this research study is to determine the relationship, if any, between teacher efficacy level and level of constructivist instructional practice implementation. This will take 10 minutes of your time. If you choose to be in the study, I will ask a question and you will be expected to answer based on your experiences teaching science in West Virginia. There are no foreseeable risks or benefits to you for participating in this study. There is no cost or payment to you. If you have questions while taking part, please stop me and ask. Your answers will remain confidential and no names or identifying information will be used. If you have questions about this research study you may call me at 304.458.1817 and I will answer your questions. You should also contact Dr. Ronald B. Childress at 304.746.1904 in the event of a research related injury. If you feel as if you were not treated well during this study, or have questions concerning your rights as a research participant call the Marshall University Office of Research Integrity (ORI) at (304) 696-4303. Your participation in this research is voluntary, and you will not be penalized or lose benefits if you refuse to participate or decide to stop. May I continue?

180
Appendix F: Initial IRB Approval Letter
w w w . m a r s h a l l . e d u Office of Research Integrity Institutional Review Board 401 11th St., Suite 1300 Huntington, WV 25701 FWA 00002704 IRB1 #00002205 IRB2 #00003206 May 4, 2012 Ronald Childress, EdD MUGC Department of Education RE: IRBNet ID# 327087-1 At: Marshall University Institutional Review Board #2 (Social/Behavioral) Dear Dr. Childress: Protocol Title: [327087-1] A Study of the Relationship between Science Teacher Efficacy and Level of Constructivist Instructional Practice Implementation in West Virginia Science Classrooms Expiration Date: May 4, 2013 Site Location: MUGC Submission Type: New Project APPROVED Review Type: Expedited Review In accordance with 45CFR46.110(a)(7), the above study and informed consent were granted Expedited approval today by the Marshall University Institutional Review Board #2 (Social/Behavioral) Chair for the period of 12 months. The approval will expire May 4, 2013. A continuing review request for this study must be submitted no later than 30 days prior to the expiration date. This study is for student Amanda Knapp. If you have any questions, please contact the Marshall University Institutional Review Board #2 (Social/Behavioral/Educational) Coordinator Michelle Woomer, B.A., M.S at (304) 696-4308 or [email protected]. Please include your study title and reference number in all correspondence with this office.

181
Appendix G: Sample Size Calculations
Sample Size Calculations: The co-investigator went to the WVSSAC website and counted the number of schools in each ranking (A, AA, AAA). Then using the number of teachers counted for the RESAs from earlier in the project, three schools of each ranking were counted and averaged. This allowed an estimate of the total number of science teachers in each ranking to be obtained. This number was then multiplied by the number of schools in the ranking category.
Average Number of Science Teachers in 42 A High Schools = 2.7 x 42 = 112
Buffalo = 3
Valley Fayette = 3 Average = 2.7
Hannan = 2
Average Number of Science Teachers in 43 AA High Schools = 5.7 x 43 = 243.7
Herbert Hoover = 6
Greenbrier West = 6 Average = 5.7
James Monroe = 5
Average Number of Science Teachers in 40 AAA High Schools = 12 x 40 = 480
Capitol = 10
Cabell Midland = 17 Average: 12
Hurricane = 9
Average number of high school science teachers rounded to nearest whole number = 836
Middle Schools =Total number of science instructors grades 6-12 from state = 1,898
Subtract average number of high school science teachers 1,898-836 = 1062
Small middle schools have 2-3 science instructors
Medium 5-6 science instructors
Large 9-11 science instructors

182
Appendix H: Pearson Product-Moment Correlations between Total Efficacy, ESE, EIP, & ECM and the Sixteen Constructivist Instructional Practices
_________________________________________________________________________________________________________________________________
Constructivist Practices TE ESE EIP ECM 1. Group students in order to divide a larger task and work together to complete it. .379*** .411*** .339*** .268***
2. Provide ideas related to a topic and form new connections and deeper understanding of the topic. .317*** .337*** .306*** .215**
3. Pool collective student knowledge in groups or class wide to share ideas and clarify understanding. .309*** .320*** .263*** .245***
4. Provide students with examples and attributes of a word/topic which students utilize to form a definition.
.200** .255*** .167* .117
5. Have students list as many items as possible related to a topic and group/regroup them by similarities.
.180** .218** .182* .092
6. Ask questions of students and lead students to ask questions of one another. .388*** .392*** .341*** .309***
7. Provide students with a topic; they describe it, create analogies, identify conflicts, and evaluate the results.
.333*** .369*** .335*** .203**
8. Allow students to choose a topic or problem, look for causes, supports, and effects. .355*** .383*** .379*** .207**
9. Have students list important facts, participants, actions, feelings, reasons, and alternative solutions to a problem.
.315*** .356*** .277*** .213**
10. Identify a theme, essential question, big idea and have students use supplemental material to explore the topic.
.278*** .341*** .289*** .129
11. Have students assume the roles of others and experience new perspectives to solve a problem. .190** .234** .175* .105 12. Alternate roles with students to summarize, predict, and clarify passages. .239** .289*** .207** .148
13. Require students to explore situations outside the classroom in museums, gardens, with guest speakers, etc...
.257*** .290*** .311*** .110
14. Require students to work together to solve a problem that mimics one found in the real world. .343*** .386*** .317*** .225** 15. Require students to work at their own pace through a cycle of questioning, seeking answers, and reflection.
.234** .254** .266*** .124
16. Require students to formulate and solve a problem with a focus on creating a concrete product. .256*** .263*** .273*** .165* * p <.05 **p <.01 ***p <.001 N = 168-176

183
Appendix I: Co-Investigator CV
Amanda Kristen Knapp
Address: 1377 Capehart Rd. Leon, WV 25123 Phone: (304) 458-1817
Academic Degrees
Master of Arts, 2006
Secondary Education Marshall University
Bachelor of Arts/Bachelor of Science, 2003 Secondary Education/Biology
Summa Cum Laude/University Honors Minors in French/Chemistry Marshall University
Teacher Certification, 2006-2007 Chemistry/Physics Wheeling Jesuit University
Current Licensure – WV Professional Teaching Certificate
Biological Sciences 9-Adult (Permanent)
General Science 5-Adult (Permanent)
Physics 9-Adult (Permanent)
Chemistry 9-Adult (Permanent)
Special Training/Certification
Biology Advanced Placement Training, 2004
Wheeling Jesuit University InStep Project-Based Learning, 2005
Chemistry Advanced Placement Training, 2006
Teacher Leader Institute (TLI), 2010
Chemistry Advanced Placement Training, 2011
Study Abroad, Summer 2001
Exeter College, Oxford University

184
Current Studies
Doctoral Student in Curriculum and Instruction Area of Emphasis: Science Education
Professional Experience
Teacher, Putnam County Schools (2006 – Present) Chemistry/Physics/Astronomy, Buffalo High School, Buffalo WV
Teacher, Jackson County Schools (2004-2006) Biology/Earth Science/General Science/Chemistry, Ravenswood High School, Ravenswood WV
Substitute Teacher, Mason County Schools (Spring 2004) Biology/Anatomy and Physiology/General Science Hannan High School, Ashton WV
Grants
Education Alliance Mini Grant, 2008-2009
Funded $500 for Project Based Physics Buffalo High School
Texas Instruments Calculator Grant 10 TI-Nspire Calculators Buffalo High School
Donor’s Choose.org 2008-2009 Funded $800 in Two Grants for T-I Nspire Calculators for Buffalo High School
Education Alliance Mini Grant, 2006-2007
Funded $1,000 for Light Analysis Equipment Buffalo High School
Professional / Academic Memberships
Marshall University Society of Yeager Scholars Omicron Delta Kappa Leadership Honorary (ODK) National Association of Professional Women (NAPW)
Leadership Activities
Buffalo High School Next Generation Learning Team
Instructor Marshall University Graduate College
EDF 619E, Educational Psychology Online, Fall 2010

185
Co-Instructor/Module Designer Marshall University Graduate College EDF 610 Trends and Issues in Education Fall 2008.
Supervising Teacher
Marshall University Student Teacher Spring 2008
Awards and Recognition
NAPW Woman of the Year
Buffalo High School Teacher of the Year, 2009
Who’s Who Among America’s Teachers
Certificate of Excellence – Educational Testing Services for PLT Exam Scores

186
Appendix J: Phone Interview Analysis
Question 1 When do you utilize
constructivist instructional practices in your science classroom
activities?
Question 2 What factors influence
your selection of instructional practices in the science classroom?
Question 3 How have the constructivist instructional practices you
implemented benefited students in your science classroom? List specific examples if applicable.
Question 4 What aspects of
constructivist instruction do you believe promote
student learning?
Question 5 What barriers, if any, do
you encounter when implementing new
instructional practices?
Used during lecture or discussion time, or post-lab discussions. "We talk about ideas that spring up." -Few field trips due to location and few guest speakers. -Assume roles when doing environmental discussions to look at all sides. Take a side they do not support. Students come up to board and re-teach, assuming role of teacher. Reach each other in own terms.
-Time and money – loss of time to sports, other activities. -Spending limitations, science products are expensive and consumable.
-It helps them understand more than just giving scientific information. -Common language helps -Evidence: calls and visits from beginning bio students experiencing success because of activities in class.
-Providing routines, one of biggest concerns with new program. -Providing visual examples, even if it is simple (fuzzy balls for cilia). -Grab examples from classroom. -Routine the biggest one
-"Barriers for me are the students who have maybe no significant person in their lives who are watching over them." -Safety issues at home or monetary issues with food and clothing. -"The kids don’t have their basic needs met so when they come to school learning is not something they are thinking about." -"If a student is having major issues maybe a short meeting with all of the teachers."
-Used a lot in physics – reaching deeper understanding; ask them to tell me why; justify what they do. -I use it with the more advanced chemistry
-Student background; what is their background in other subjects and knowledge; interests and strengths; focus on problems solving and critical thinking; push
-Presentations to a panel, questioning and constructing leads to much deeper level of understanding. -Not everything is effective this way. -Explain using video
-Students have some freedom to explore and some control in the direction of their learning but not all control. -Helps with the confidence issue; don’t throw them
-Students claim "other teachers don’t make us do this" and "we don’t have to work as hard in other classes." -Technology barriers -Financial barriers

187
concepts. -Making connections to other areas and making questions to pull information and get them to make connections. -Few field trips due to funding
them into that uncomfortable area. -A lot of PBL, but lack of confidence from students necessitates baby steps. -Chem I Atomic Theory Example: Timeline of evolution of atomic model with connections to history (WWII).
analysis with the correct terminology to a panel of other teachers and professors from state, etc… especially in physics because they are seniors and have to take it to the next level.
out on a limb; have rubric and go over it. -Show examples of the type of work you want. -When you make expectations clear they can be successful.
-Parents don’t see the relevance – their negative attitude influences the kids. -Lack of planning for the future
-At least once a week, usually Tues-Thurs; rarely Friday and not Monday. -Something out of desks weekly -Divide into groups by topic and each gets subtopic. -Not just labs – present posters and other data -Few field trips – principal against it due to not making AYP. -Lack of funding, paying for buses.
-AP Bio: has required labs so that is not negotiable. Also have a pacing guide have to follow. -No "canned labs" with other classes. -It is anything that might reinforce learning; a lot of reinforcement.
-It helps students get to know each other and apply knowledge they have learned already. -Don’t have some skills at all, like measuring and dissection; "I get upper level kids who cannot read a ruler; have never used a hand tool – it’s like teaching shop" -They are getting a lot of clean up skills – I don’t clean up after them. -"The goal of lab – they want to see the end result so they pay attention even more." -Some classes misbehave -"It is stressful"
-Making things clear and keeping routines. -Applying the knowledge -If labs don’t work they have to find out why. -There are a lot of things I could do if I had the technology.
-It is hard to reach some students who don’t excel in the classroom; students who cannot read in 10th grade. -They still excel in lab; they spend time outside and using tools; if you give them a chance they can share what they know. -Having four different preps. -Funding -Building -Class size -Old equipment -Cell phones -Overworked -Too many classes to get ready for
-Everyday -Pooling ideas is common
-Probably the effectiveness with the students more than
"I would like to believe some of the things I try have been very beneficial."
-Routine and Rubrics -Eliminating things – especially with seniors
-They may not be getting a lot of help at home. -"I think the biggest
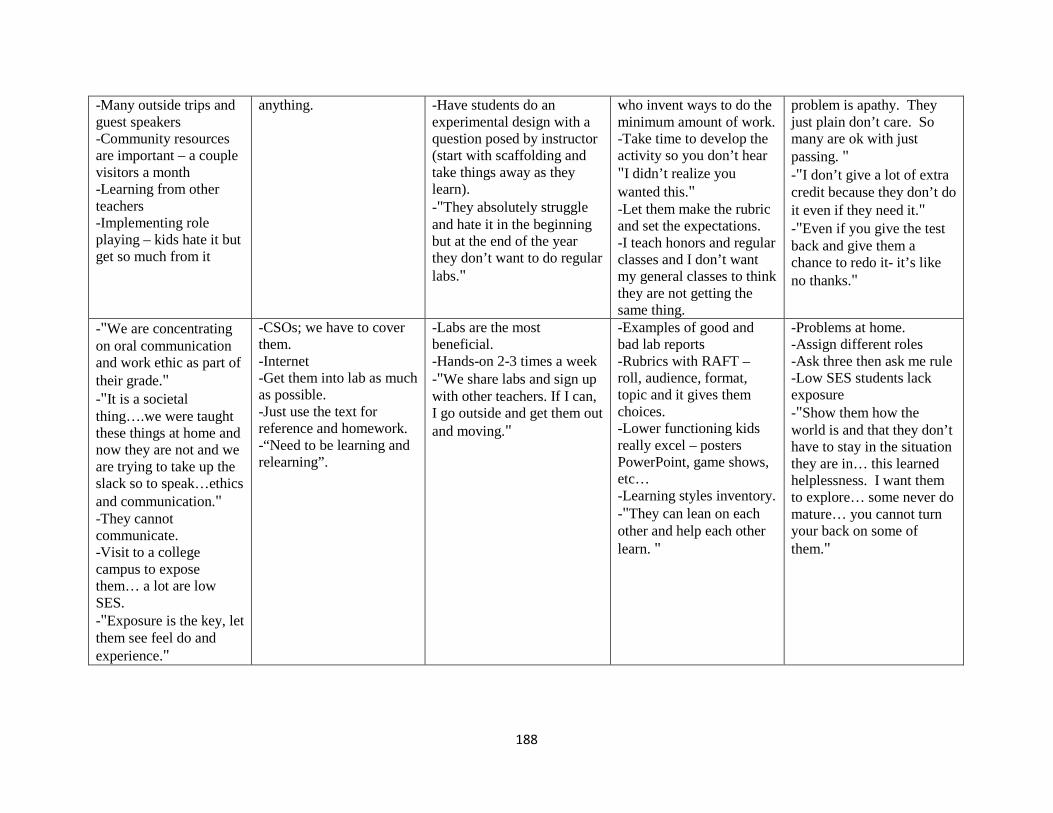
188
-Many outside trips and guest speakers -Community resources are important – a couple visitors a month -Learning from other teachers -Implementing role playing – kids hate it but get so much from it
anything.
-Have students do an experimental design with a question posed by instructor (start with scaffolding and take things away as they learn). -"They absolutely struggle and hate it in the beginning but at the end of the year they don’t want to do regular labs."
who invent ways to do the minimum amount of work. -Take time to develop the activity so you don’t hear "I didn’t realize you wanted this." -Let them make the rubric and set the expectations. -I teach honors and regular classes and I don’t want my general classes to think they are not getting the same thing.
problem is apathy. They just plain don’t care. So many are ok with just passing. " -"I don’t give a lot of extra credit because they don’t do it even if they need it." -"Even if you give the test back and give them a chance to redo it- it’s like no thanks."
-"We are concentrating on oral communication and work ethic as part of their grade." -"It is a societal thing….we were taught these things at home and now they are not and we are trying to take up the slack so to speak…ethics and communication." -They cannot communicate. -Visit to a college campus to expose them… a lot are low SES. -"Exposure is the key, let them see feel do and experience."
-CSOs; we have to cover them. -Internet -Get them into lab as much as possible. -Just use the text for reference and homework. -“Need to be learning and relearning”.
-Labs are the most beneficial. -Hands-on 2-3 times a week -"We share labs and sign up with other teachers. If I can, I go outside and get them out and moving."
-Examples of good and bad lab reports -Rubrics with RAFT – roll, audience, format, topic and it gives them choices. -Lower functioning kids really excel – posters PowerPoint, game shows, etc… -Learning styles inventory. -"They can lean on each other and help each other learn. "
-Problems at home. -Assign different roles -Ask three then ask me rule -Low SES students lack exposure -"Show them how the world is and that they don’t have to stay in the situation they are in… this learned helplessness. I want them to explore… some never do mature… you cannot turn your back on some of them."

189
-"I use them all the way through. I have found that variety is the key. You can’t do the same thing every day." -“If you don’t switch gears you lose them” -Team field trips but not individual class trips -No role play at current middle school job but did at high school for environmental issues.
-"What has worked in the past and the internet" -Search each CSO and compare current activities to what other teachers are using and see what fits better. -"I want to do something different"
-Example: Gummy bears in distilled, tap, and salt water. -Momentum with toy cars and clay. -"I try to find things that follow the scientific method" -Let students correct themselves -Gum drop molecules -Yeast balloons -Mousetrap catapults
-Routine... daily question with emphasis on writing, planner, then it varies… activity, reading, writing,… then we wrap up. -Moved to short little tests of 20 questions or so rather than large tests.
-Few barriers -Some have problems with math. -May have problems getting materials – provide for them. -Work on writing abstracts with language arts department -They cannot apply what they learned. -Cannot type things in calculator or graph -Not antagonize the other teachers.
-Honors Chemistry – Book discussion – "I throw things out and we take it from there." -No field trips due to subject matter limitations -"We go outside of the classroom for a role play of electron configurations because there is not enough room."
-"Primarily it is based on my years of experience and finding out what has worked and what has not worked. The prior knowledge is very limited….I know they have had stuff like naming compounds but they forgot it."
-"I have gotten feedback specifically from students who have gone on and taken chemistry in college… students said it is exactly what my professor is doing and I can do it. I am constantly looking for new labs and new approaches and stuff like that for covering the material."
-"Getting students directly involved in what they are doing. Encouraging them to help each other but definitely having clear expectations…. this is the way we do it here."
-Not being open to being cross curricular … "they have to read and critique an article from ChemMatters and they will fuss about this is not English class and why do I have to write. I mark grammar and spelling errors." -Little parent resistance
-"To deepen my students’ understanding of a concept by providing relationships
-"I determine what my students’ needs are, how easy it is to get their attention and keep it, how
-"My two goals when employing constructivist instruction is to achieve deeper understanding and
-"I just try my best to hit everyone up with something that relates to them. Sometimes it is like
-Attempt at change away from block scheduling that upset the status quo. -"The status quo is

190
to build on." -Example: Gas laws writing from weather perspective. -It moves info from short term to long term memory. -Sharing of prior knowledge from what works for each group of students in the past -Assign internet based searches – bonus points for a good discovery -Webquests
well do they retain information that I simply deliver, do they need a stronger connection to a topic or not?... I have to consider how much time we have to complete the remaining CSOs."
longer retention time." -Example: Type 2 nomenclature with different forms of iron. -"By providing useful analytic thinking of the happenstance in chemistry and physics we begin to see students getting intrigued by the wonder of nature and matter. This makes retention time longer than taking notes from an overhead"
pulling teeth but I try not to give up” -Keep on schedule -"Sometimes an evolutionary change is needed for some kids to catch on. Sometimes a revolutionary change is needed…"
comfortable for many and when you ask for change, that you clearly see will help students, you begin to see barriers all over the place.” -Need for spaced practice for complex concepts.
-Twice a week – "I do problem based learning. It is hard to do field trips and things because of the red tape, money, and buses. I do not role play or do guest speakers."
-"I went to TLI for problem based learning so that is what I do."
-"I think it gets them more involved and excited. The interest level is not usually there for most of them" -Example: DNA gel electrophoresis (guest presenters).
-"I give a rubric before we do a lab or anything to make it clear what we need to do. They don‘t always have to do the same thing to get a product that is acceptable."
-"Mainly time. Trying to get through all of the CSOs because it takes time to do things. Money to do things is hard." -Administration desire for order in classroom -Research disputes this – explains need for collaboration.
-"I try to do it everyday. I usually have several units that I do it with. Usually it is toward the physics and earth science side. Not with chemistry. I don’t want to give them the
-"I try to do a variety of things. If it does not work one way I will change it because of how they react. Some students just want it straight out. I will switch it up."
-"I have had kids take a role I did not know they would. Sometimes they will be the leader when you think they will be the follower." -Example: guys vs. girls rocket cars -"They don’t have to ask you
-"You definitely need a routine, especially with 7th graders. They cannot handle it if you don’t do the same thing. I like to switch it up…but they cannot handle it. It is best for the kids even though I
-"I think it is me…and trying to get them to understand. The administration is all for it, but the kids will say they don’t want to do it and it is crazy." -Student motivation

191
opportunity to make a mess or hurt one another" -"Most of them are group projects. I give them ideas or sometimes I just let them run with it. I want to see what they can do." -Few trips -Role play – writing and RAFT with genetics
everything." -"I do have to monitor students getting upset. But for the most part they take their own role and go with it. That is the best part."
hate it but they thrive on it."
-Few family problems, if so give an alternate assignment. -Apathy -Too much standardized testing -Lack of time
-"Usually at the beginning of the class. We usually start off in cooperative learning groups and see how it impacts society… we brainstorm, ask why, then start getting into the basics… what we need to know and do in the project." -“We go outside every now and then but not on trips” -“Funding is the biggest issue and we don’t want to pull them away from other studies”. -Rarely role play -Make movies
-CSOs -Curriculum map -"I try to assess student prior knowledge and how we can tie that in on the curriculum we need to know to build on it."
-"We try to do things that they can use on a day to day basis. Mostly helping the community. If we want to explain force and motion maybe we will all go bowling. We go play ball to do simple machines to relate it to something they already know. Then we tie in the formula and do that but keep it hands on."
-Reading comprehension may not be good – listen to it instead -Multiple modalities – movies, PowerPoint -Presentations and papers -Connect to the real world -Use phone as a learning tool as long as it does not get out of hand -Apps: math, direction, sun/earth rotation, stars, mosquitoes
-Students with economic hardships -Students on their own -Students without computers at home so no assignments for homework -Lack of computers in the classroom – have to share mobile lab -Lack of materials -"You just have to treat each group of kids differently. We like the hands on activities."
-"I would use it as -Cost: "You cannot ask -"I do think it helps to make -"I would say the hands-on -"That’s the great question.

192
reinforcement. I would not start with it." -Labs -Projects -Group work -Kids busy outside of class -Fewer problems with trips at high school – now whole team has to go -Fitting in speakers is hard – must fit team -No role playing
kids and spending it out of your pocket… that’s a big issue... we have to buy paper…" -Effectiveness -Available materials
the concrete connections and they retain information better. We do a lot of projects where they have to build things and we do a lot of that." -"The parents were telling me the kids were driving them crazy with it… they were engaged even outside of class… It was big though!"
activities and it is more relatable to them. Not just vocabulary out of the book. There is more interest in it."
Some have nothing. I have tried to provide all of the materials and not require anything outside. You have some kids go above and beyond but the ones that don’t value education ... We have a lot of apathy."
-"Mostly with AP biology, especially since the curriculum is changing. That is primarily the main class I do. Students do pool knowledge. There is a degree of change to do out of school things. We have an 8 hour day now so they are reluctant to approve trips and speakers." - No role playing.
-"Mostly student achievement. I start with lecture and if they don’t grasp it I supplement with other practices."
-"I think the main thing is since I teach upper level kids, preparing them for college. Based on what they tell me when they come back in terms of format and information."
-"In terms of making expectations clear and as high as possible."
-"The main thing is the time constraints in terms of covering CSOs. Making sure that while you implement new practices you still have to cover a multitude of CSOS. You just don’t have time to cover everything. Reaching students is not usually a problem since it is upper level but reaching families, I don’t have a lot of trouble with that the few times I have had to do it"
-Daily -Short lab � real world problem � discussion -Projects to end unit and
-Student behavior -State standards -Few field trips – instructed not to take them
-Motivation -"The students usually come in without good feelings about science."
-"It really gives them a purpose. They understand why they are doing this, why they are in a science
-Planning – "I want to have everything planned out and I want to know what I am doing and there are always

193
to assess
until after Westest -Only outside if working toward objectives. -Strict regulations -Some role playing with roles chosen by students
-Hands on activities as encouragement, assist with less exciting topics -Helps reach different learning styles, rather than just listening to lectures. -See, feel, smell -"They seem to have a lot of fun. I tell them that is why I teach science."
class and why it applies to them. -Projects used to overcome lack of caring; increase interest; show them you do care and they are easier to reach.
unforeseen issues." -Lack of family support - "It has become the norm that kids are not going to do this. I don’t give a lot of homework because the kids are living in these situations where they cannot concentrate. There are things that go on at home that are really a problem." -Lack of respect
-Use of an opening activity -Electricity example – give common electrical parts and they have to light up a bulb with two types of circuits -Students explain verbally to teacher -Field trips difficult due to 45 minute periods -Used to go outside but also difficult due to 45 minute periods -Field trips difficult due to paper work and large numbers of kids -Rarely role play, mostly modeling how to use equipment in lab situations
- How well activity meets curriculum -It must be a practice that can be maintained consistently throughout year. -Suit needs of students -Appropriate to level of student -Help students master a standard. -Must actually work.
-Example: Adult came up and related remembering hottest part of flame -Bending glass tubing -Group work -Example: Earth science grouping arrangements -Necessary because of large class sizes (32) and teacher cannot be everywhere.
-"Especially with high school students they need to know up front this is what I can do and what I cannot do discipline wise." -Consistency is a "big deal" -Learning style inventory -“Understanding how each student absorbs information.”
-"The only barrier to a new instructional practice would be trying to start it after the beginning of a year after you have already established a routine and then if you would not stay consistent with it." -Student resistance is not "the first thing" -Never had a problem financially "I consider our school very lucky no matter who is in charge. I have been to so many conferences and heard that this is not the case." -Class size might be a problem.

1