
A STUDY OF SALINE FRESHWATER INTERFACE PHENOMINA IN … · A STUDY OF SALINE FRESHWATER INTERFACE...
13
A STUDY OF SALINE FRESHWATER INTERFACE PHENOMINA IN THE MAHANADI DELTA REGION: ORISSA, INDIA S V N Rao 1 I Radhakrishna 2 Nitin Joshi 1 Ajay Sharma 1 Shashank Shekhar 3 1. DHI (India) Water and Environment, C R Park New Delhi 2. Integrated Technologies for Groundwater Resource Systems Development, Tarnaka, Hyderabad 3. Department of Geology, Delhi University Delhi *Corresponding Author: [email protected] ABSTRACT The subsurface aquifer systems in Mahanadi delta region in Orissa (India) is largely characterized by two groups of freshwater aquifer systems: 1. The south western Mahanadi delta region is represented by unconfined to semi-confined freshwater aquifers underlained by brackish/ saline aquifer systems with a diffusion boundary 2. The north eastern parts of Mahanadi delta is represented by deep freshwater confined aquifers overlained by brackish/saline water aquifers with aquitard/ aquiclude boundary. Both the systems are prone to saline water mixing/ migration with time and development. The present paper incorporates results of a simulation study using a finite element based FEFLOW model and examines saline water migration scenarios when subjected to increasing rates of pumping under steady state conditions with the help of a calibrated groundwater model. The results indicate the unconfined and semi-confined aquifer systems in the south western part of Mahanadi delta are prone for faster rates of saline water mixing of the contamination when compared to the deep confined systems in the north eastern parts of Mahanadi delta. INTRODUCTION Coastal groundwater systems constitute a very important resource for drinking, irrigation, agriculture and industrial sectors of the country. These systems are often interfaced with oceanic basins on one hand and upland regions with surface-groundwater development projects on the other hand and become targets for hydrodynamic changes. The fresh ground water resource systems in Indian coastal deltas have been subjected to large scale stresses in the form of ground water withdrawals and reduced recharge potentials over the last two decades or so and as a consequence there is large scale drop of water levels and reduction in fresh water storages besides saline water ingression inland into fresh water systems. Global warming processes and projected rise of sea levels are further threatening these situations. Physico- chemical processes accompanying such ingression, aquifer characteristics and paleo hydro-geological processes in various delta regions and their space-time variations are required to be studied and quantified to develop appropriate optimization schemes/ models with predictive capabilities for sustainable development and management of fresh ground water resources. The fresh/saline water interface boundary is a complex, sensitive and dynamic in nature and makes the strategies for well field development rather difficult. It demands very accurate information in relation to (a) the thicknesses of fresh/saline aquifers; (b) the nature of the interface or diffusion boundary; (c) estimation of saline/ freshwater wedging and its geometrical variations; (d) designing appropriate monitoring networks; and (e) assessment of possible vertical leakages through the aquitard. Borehole geophysical techniques provide a reasonably powerful tool for estimation of interface/diffusion boundaries and water quality characteristics in multi-aquifer systems of coastal deltas (Jones & Buford, 1957; Radhakrishna & Rao, 1990). The Mahanadi-Brahmani-Baitarni deltaic regions of Orissa (India) coast provide a useful base where the aquifer and interface geometries/boundaries were accurately
Transcript of A STUDY OF SALINE FRESHWATER INTERFACE PHENOMINA IN … · A STUDY OF SALINE FRESHWATER INTERFACE...
A STUDY OF SALINE FRESHWATER INTERFACE PHENOMINA
IN THE MAHANADI DELTA REGION: ORISSA, INDIA
S V N Rao1 I Radhakrishna
2 Nitin Joshi
1 Ajay Sharma
1 Shashank Shekhar
3
1. DHI (India) Water and Environment, C R Park New Delhi
2. Integrated Technologies for Groundwater Resource Systems Development, Tarnaka, Hyderabad
3. Department of Geology, Delhi University Delhi
*Corresponding Author: [email protected]
ABSTRACT
The subsurface aquifer systems in Mahanadi delta region in Orissa (India) is largely characterized by two
groups of freshwater aquifer systems: 1. The south western Mahanadi delta region is represented by
unconfined to semi-confined freshwater aquifers underlained by brackish/ saline aquifer systems with a
diffusion boundary 2. The north eastern parts of Mahanadi delta is represented by deep freshwater
confined aquifers overlained by brackish/saline water aquifers with aquitard/ aquiclude boundary. Both
the systems are prone to saline water mixing/ migration with time and development.
The present paper incorporates results of a simulation study using a finite element based FEFLOW model
and examines saline water migration scenarios when subjected to increasing rates of pumping under
steady state conditions with the help of a calibrated groundwater model. The results indicate the
unconfined and semi-confined aquifer systems in the south western part of Mahanadi delta are prone for
faster rates of saline water mixing of the contamination when compared to the deep confined systems in
the north eastern parts of Mahanadi delta.
INTRODUCTION
Coastal groundwater systems constitute a very important resource for drinking, irrigation, agriculture and
industrial sectors of the country. These systems are often interfaced with oceanic basins on one hand and
upland regions with surface-groundwater development projects on the other hand and become targets for
hydrodynamic changes. The fresh ground water resource systems in Indian coastal deltas have been
subjected to large scale stresses in the form of ground water withdrawals and reduced recharge potentials
over the last two decades or so and as a consequence there is large scale drop of water levels and
reduction in fresh water storages besides saline water ingression inland into fresh water systems. Global
warming processes and projected rise of sea levels are further threatening these situations. Physico-
chemical processes accompanying such ingression, aquifer characteristics and paleo hydro-geological
processes in various delta regions and their space-time variations are required to be studied and quantified
to develop appropriate optimization schemes/ models with predictive capabilities for sustainable
development and management of fresh ground water resources.
The fresh/saline water interface boundary is a complex, sensitive and dynamic in nature and makes the
strategies for well field development rather difficult. It demands very accurate information in relation to
(a) the thicknesses of fresh/saline aquifers; (b) the nature of the interface or diffusion boundary; (c)
estimation of saline/ freshwater wedging and its geometrical variations; (d) designing appropriate
monitoring networks; and (e) assessment of possible vertical leakages through the aquitard. Borehole
geophysical techniques provide a reasonably powerful tool for estimation of interface/diffusion
boundaries and water quality characteristics in multi-aquifer systems of coastal deltas (Jones & Buford,
1957; Radhakrishna & Rao, 1990). The Mahanadi-Brahmani-Baitarni deltaic regions of Orissa (India)
coast provide a useful base where the aquifer and interface geometries/boundaries were accurately

defined, mapped and delineated for appropriate model analyses and development of groundwater
resources (Radhakrishna 2006).
A number of models have been reported in literature dealing with saltwater-freshwater modeling in
coastal environment. Among them SEAWAT (Langevin et al 2004) and FEFLOW (Diersch 2006) are
most popular. The SEAWAT is a MODFLOW based density dependent flow and transport model.
Masterson and Garabedian (2007) used SEAWAT numerical model to simulate effects of sea-level rise on
the depth to the fresh water/salt water interface. Rao et al (2006, 2007) have demonstrated its utility for
both conceptual and application based studies. FEFLOW model is not freely available in public domain
and hence not many applications (publications) have been reported at least from India.
In the present study FEFLOW (Diersch 2006) has been used to simulate fresh-saline mixed interface. It is
a 3D-finite element flow and transport model. The model is fully graphics-based and interactive. The GIS
framework integrates pre and post processing of data besides a programming interface. The implemented
numerical features allow the solution of large problems. This modeling package was chosen because
finite elements accurately accommodate steeply varying aquifer systems in three dimensions and for
accounting the density dependent flow and transport processes. The goal of this study was to determine
model (approximately calibrated) responses to increased rates of pumping in terms for studying the up-
coning behavior in a typical deltaic system in India.
SALINE FRESH WATER INTERRELATIONSHIPS
The Mahanadi delta system is the third largest delta plain along the east coast of India and covers an area
of about 0.9 x 10⁴
km2 which lies between 85
0 40
`: 86
0 45
' E long. and 19
0 40': 20
0 35' N lat. The delta
terrain has a characteristic tropical and humid monsoonal climate with an annual rain fall of 1570 mm.
Then cyclonic storms, floods, droughts are rather common. The river after traversing over a distance of
about 800 km. spreads itself in the form of delta plain with its apex near Naraj with a network of
distributaries and sub distributaries viz: Birupa, Mahanadi/ Chitrala, Katjhori/ Devi and Koyakhai/ Daya/
Kusubhadra/ Bhargavi. A detailed drainage network map with different block centers and major
townships is shown in fig.1. A major portion of the delta region is flat with gentle slope towards Bay of
Bengal. A typical characteristic geo-morphological feature is the formation of long narrow islands in the
central part of the delta system which could be a reflection of the manifestation of the sub surface
structure of the delta. The entire delta region could be classified into three morphological units namely
upper, central and lower delta regions. The upper delta region is characterized by coarse –medium sandy
facies with admixtures of clays and sands. The central delta region is characterized by a number of
lenticular islands, developed as a result of bifurcation and rejoining of the sub distributaries river system.
The lower delta region adjoining the coastline has a number of low lying swamps, tidal canals and a series
of sand ridges and valleys (Radhakrishna, 2001)
Several hydro geological and geophysical exploratory endeavors have been made in this region and
brought to light the availability of thick sequences of freshwater aquifer systems belonging to Recent,
Quaternary and Tertiary periods (Radhakrishna, 2001). The thicknesses of these aquifer systems increase
from 100 m to 400 m and beyond towards the out fall region of the delta from the upstream areas with a
gentle slope. At the same time the saline contamination hazards reach peak levels in most parts of
northern and central Mahanadi delta region up to the depth levels varying between 60 m to 300 m below
which fresh water aquifers occur under deep confined conditions with artesian and sub artesian pressure
heads. In contrast the southern parts of the Mahanadi delta region is characterized by fresh water aquifers
floating over saline water aquifers with thicknesses varying from 10m to 120m with interface depth levels
decreasing towards the coast. A detailed interface depth structure map based on several interpretative
analyses of geophysical log profiles is presented in fig. 1 (Radhakrishna, 2001) which forms the basic

material for the present study. The interface depth structure, its nature and boundary conditions are very
important to evolve required strategies for sustainable development of fresh water resources. This would
also form the basis for an appropriate well field development while estimating the mechanisms involved
in understanding saline water intrusion processes.
The above table suggests that the interface could be a hydraulic diffusion boundary with freshwater
floating over saline water or a geological aquiclude/ aquitard boundary with freshwater underneath the
saline water. The nature of the interface and depths has to be carefully evaluated while designing the well
field structures. The south Mahanadi delta region is characterized by a freshwater system sitting over a
brackish water system with a diffusion boundary and with depths varying from 20 m to 100 m. The
interface depth in general decreases towards the coast. The north Mahanadi delta is represented by a
brackish water system sitting over a freshwater system with aquitard/ aquiclude acting as an interface.
This interface aquiclude is thicker towards the coast and thinner inland. It is therefore necessary in such
systems to adopt cement plugging in the gravel pack area at different depths to avoid vertical migration of
saline water while pumping. It is also necessary in such situations to estimate the lateral extension of
aquiclude interface boundaries upstream where saline and freshwater systems come into juxtaposition,
and to optimize and control the pumping without destabilizing the freshwater regime.
The southern parts of the delta system are basically drained by sub distributaries of Mahanadi River
represented by Daya, Bhargavi and Kusubhadra. The fresh ground water systems modeled in the present
work are by and large unconfined and some time semi-confined aquifer systems underlained by a number
of brackish/saline aquifer systems. It is to be noted that large number of wells structures have already
been installed taping this fresh water resources and some more are expected in the near future. This
unregulated developmental activity could lead to saline water mixing into the upper unconfined aquifer
systems and may gradually contaminate in course of time with saline water from underneath. Similarly
the north eastern parts of Mahanadi delta drained by distributaries like Katzhuri, Mahanadi, Chitrala and
Fig. 1 Saline - fresh water Interface depths structure map for Mahanadi delta system

Virupa are characterized by deep confined fresh ground water systems overlained by brackish/saline
water aquifers. Both these systems are separated by aquicludes and aquitards. These fresh water systems
over last two decades are subjected to large scale fresh ground water withdrawals through a number of
deep tube wells and some more are planed in the future. This uncontrolled development could lead to
saline water contamination vertically through aquitards and through lateral migration from the upstream
side as a result of differential pumping and changing hydro dynamic situations in both fresh and saline
water bodies. It is therefore necessary to have very careful optimized schemes for groundwater
development to minimize the threats of saline water contamination. In line with the above observation and
factual situations a FEFLOW conceptualized model (Dierch, 2006) has been developed to study the
contamination impacts on freshwater development.
MODEL DEVELOPMENT AND CALIBRATION
The two 5-layer groundwater models for the unconfined in the southern part and the semi-confined in the
northern part of the Mahanadi deltaic system were conceptualized and developed using well-log and
interface-depth structure map data. The aquifer hydraulic conductivities, specific yield and storage
coefficients pertaining to various layers were assigned based on log data in approximated layer
thicknesses (clay, sand, etc.) and their values based on information available from experience and
literature. The goggle-earth map was used to determine surface features/ topography, boundary conditions
for constructing the GIS shape files. The aquifer boundaries and properties are depicted in figures 2 and 3
and in table 1.
The boundary and initial conditions in respect of unconfined aquifer (southern part) are as follows. Rivers
were assumed to act as time-invariant recharging boundaries having constant head (zero concentration)
varying spatially with topography. Sea boundary was assumed as constant zero head and constant mass
concentration (35kg/m3). As deeper aquifers indicate high salinity, the nodes in the fifth layer and along
the sea boundary were assumed to be of constant concentration of 35 kg/m3. The unconfined aquifer was
assumed to be recharged from rainfall to an extent of 15% of annual rainfall (1250mm). Pumping for
agricultural or consumptive use purposes is extracted from second layer. Concurrent data of rainfall and
monthly groundwater levels during 1998 (one year only) at different locations were available for
calibration.
The boundary and initial conditions in respect of semi-confined aquifer (northern part) were set as
follows. Here deeper layers are productive and fresh (fourth layer), while the shallow aquifer is saline
(second layer). The river and sea boundary nodes were similarly assigned as in the case of unconfined
aquifer. However since the shallow aquifer here shows high salinity, all the nodes in the second layer
were assigned constant salinity (35kg/m3) until the point where the aquitard (of 3
rd layer) pinches out
approximately midway along X-direction along east to west. Model simulation beginning Jan 1998
groundwater levels were set as initial conditions (hotstart). The shallow aquifer here is not being used for
any useful purposes. Rainfall recharge has no effect on deeper aquifers which are recharged by rivers
streams in the upper reaches of delta system.
The two models were then simulated for average stresses (pumping/ recharge) based on crop water
requirement (uniformly), rainfall recharge (unconfined only) and boundary conditions for one year
beginning Jan 1998. The model calibration was accomplished by adjusting the aquifer parameters, mainly
the hydraulic conductivity. The model calibration for the two aquifers for pre monsoon (April 1998) and
Post monsoon (Oct 1998) are shown in figures 4 through 5. At this stage the model is assumed to be in
quasi-steady state conditions i.e. at the end of calibration period.

Exploratory site locations
Constant head varying with space
Constant head/ mass boundary
Fig. 2 Location of exploratory bore wells and model boundaries for the unconfined aquifer system

Exploratory site locations
Constant head varying with space
Constant head/ mass boundary
Fig. 3 Location of exploratory bore wells and model boundaries

Table1. Aquifer properties
S. No Particulars Values
1 2
Semi-Confined aquifer in northern part of Delta system a) Number of Mesh elements, mesh nodes and layers b) Element type
c) Time stepping Scheme
d) Aquifer thickness (variable as in figure) e) Global Hydraulic Conductivity values in X, Y & Z directions except for the
aquitard in 3rd
layer pinching out midway along X direction (m/day) f) Hydraulic conductivity of the aquitard in X, Y & Z directions (m/day) g) Specific yield of upper layer h) Specific Storage (/m) i) Longitudinal and lateral dispersivity assumed (m) j) Density of fresh and seawater (kg/m
3)
k) Concentration of fresh and seawater (kg/m3)
l) Slope of concentration-density m) Steady state boundary conditions
i. River recharging head on western end (m) ii. Sea boundary (m)
iii. Pumping in 4th
layer (m3/day)
n) Period of simulation for calibration (years) Un-confined aquifer in the southern part of Delta system a) Number of Mesh elements, mesh nodes and layers b) Aquifer thickness (variable as in figure) c) Element type d) Time stepping Scheme e) Global Hydraulic Conductivity values in X, Y & Z directions (m/day)
f) Specific yield of upper layer g) Specific Storage (/m) h) Longitudinal and lateral dispersivity assumed (m) i) Density of fresh and seawater (kg/m
3)
j) Concentration of fresh and seawater (kg/m3)
k) Slope of concentration-density l) Steady state boundary conditions/ initial conditions
i. River recharging head on western end (m) ii. Rainfall recharge (15% of monthly rainfall during monsoon)
iii. Sea boundary (m) iv. Pumping in 2
nd layer (m
3/day)
m) Period of simulation for calibration (years)
5825, 3936, 5 6 Noded Triangular Prism Adams-Bashforth/Trapezoid Predictor-Corrector Scheme Variable as per well log data Variable as per well log data (Clay, sand, etc) - do - 0.15 0.0001 70, 15 1000, 1025 0, 35 0.71 Non Uniform 0 500 - 2000 1 11790, 7656, 5 Variable as per well log data 6 Noded Triangular Prism Adams-Bashforth/Trapezoid Predictor-Corrector Scheme Variable as per well log data (Clay, sand, etc) 0.15 0.0001 70, 15 1000, 1025 0, 35 0.71 Non Uniform 0.15 0 500 - 2000 1

Fig 4 Model calibration for the unconfined system for pre and post monsoon season for the year 1998
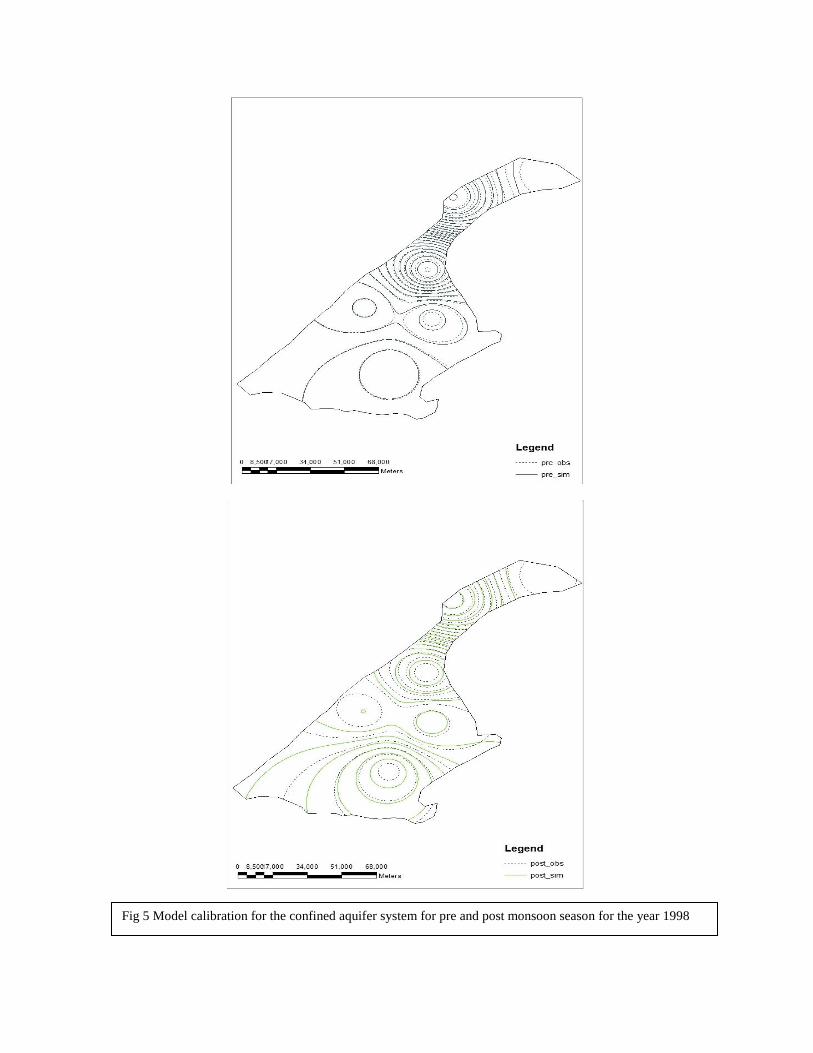
Fig 5 Model calibration for the confined aquifer system for pre and post monsoon season for the year 1998
MODELING SCENERIOS FOR GROUNDWATER DEVELOPMENT
The calibrated models were used to examine the aquifer‟s spatial responses as a result of incremental
high-capacity pumping at typical locations in both the aquifer systems and the results are presented/
described in the following paragraphs. The two models were run for induced pumping from a single point
in each aquifer repeatedly beginning quasi-steady-state conditions. The pumping wells are located in the
freshwater layers of both the systems. However it is important to note that the figures depict integrated
responses of the aquifer geometry, boundary conditions and natural/ induced stresses in a regional
perspective. The responses for the two aquifers are shown in figures 6 through 9. The figures graphically
depict migration of salinity from their boundaries. The results for the two models may be summarized as
under:
1. The unconfined aquifer shows relatively higher effects pumping in terms of salinity concentration.
The salinity migration is essentially from bottom layers in the form of up-coning with larger areal
coverage. Therefore groundwater development needs to carefully planned and regulated
throughout the southern deltaic region. Further rainfall recharge measures need to be encouraged
to augment dilution of saline water as pumping is from shallow aquifer.
2. The deep confined aquifer shows relatively less areal contamination of saline water (in terms of
concentration) for corresponding rates of pumping and therefore can permits higher pumpages on a
sustainable basis. This is due to the fact that higher rates of pumping induce salinity migration
from upper layers from the point where the aquitard pinches out and through aquitard to a small
extent. The salinity migration is rather more localized even though the pumping location was
chosen nearer to the point where the aquitard (in the 2nd
layer) pinches out. This indicates the
effect will be still less for other locations unless they are closer to sea boundary. The aquitard layer
effectively prevents salinity migration from upper layer in the confined aquifer. Therefore
regulation of groundwater development must focus in areas where the underlying aquitard pinches
out. Here rainfall recharge measures are not of much significance.
CONCLUSIONS
The subsurface groundwater systems in the Mahanadi delta region has two typical diverse aquifer
systems, an unconfined fresh water system underlained by brackish water zone in the south west and a
deep confined fresh water system overlained by saline water system in the north-east. The aquifer systems
were conceptualized to represent groundwater flow model using several interpretive results of geological,
geophysical log data. An approximately calibrated model is used to examine scenarios of salinity
migration due to mixing when subjected to increasing rates of pumping under steady state conditions.
These results also show the impacts of saline water mixing/ migration is relatively less in north eastern
parts of the delta when compared with south western parts of the delta. The study concludes that the
northern semi-confined aquifer can handle relatively higher pumpages without affecting water quality
deteriorations. Also there is a greater need to regulate groundwater development in the southern part of
Mahanadi delta system due to shallow freshwater resources, aquifer un-confining conditions and the need
to promote rainfall recharge conditions
Acknowledgement
The authors thankfully acknowledge for the support provided by Sri Ajay Pradhan, Managing Director,
DHI India, New Delhi.

Figure 7 Salinity migrations as result of pumping from second layer – unconfined system
Figure 6 Up-coning scenario for the unconfined system for incremental rates of pumping from second layer

Figure 8 Up-coning phenomena for the confined system for increasing rates of pumping from the fourth layer
Figure 9 Salinity migrations from second layer through and from the point of aquitard
pinching due to pumping from 4th layer

References
Diersch, H.-J. G. (2006), “FEFLOW Reference and User Manual”, Finite Element Subsurface
Flow & Transport Simulation System, WASY Institute for Water Resource Planning and
Systems Research Ltd., Berlin, 278 p.
Jones, P. H. & Buford, J. B (1957) Electric logging applied to groundwater Exploration.
Geophysics 16(1), 115–139.
Langevin CD, Shoemaker WB, Guo W, Missimer CDM (2004) „MODFLOW-2000, the USGS
modular groundwater model -Documentation of the SEAWAT 2000 version with variable
density flow process (VDF) and the integrated MT3DMS transport process (IMT). USGS open
report 03-426.
Radhakrishna, I and Gangadhara Rao T (1990) „Evaluation of hydro-geochemical parameters
with spontaneous potential logs.‟ J. Hydrology. 114, 245–257.
Radhakrishna I (2001) Saline fresh water interface structure in Mahanadi delta region, Orissa,
India. Environmental Geology 40 (3) 369-380.
Radhakrishna I (2006) Assessment of saline–freshwater interface structure in the Indian coastal
delta complexes Sustainability of Groundwater Resources and its Indicators Proceedings of
symposium S3 held during the Seventh IAHS Scientific Assembly at Foz do Iguaçu, Brazil,
April 2005. IAHS Publ. 302, 2006
Rao, S V N., Sudhir Kumar, Shashank Shekher and D Chakravorty (2006). Optimal pumping
from skimming wells. ASCE J. of Hydrologic Engineering, Vol. 11, 5, 464-471.
Rao, S V N., Sudhir Kumar, Shashank Shekhar and S K Sinha (2007) Optimal operation of
skimming wells – A case study in river Yamuna flood plain at Palla in north India 15:6 of
Hydrogeology Journal , 1157-1167
****************************