The Study of Premature Failure of Springs Used In Railway Coaches

308
This article can be downloaded from http://www.ijerst.com/currentissue.php
Int. J. Engg. Res. & Sci. & Tech. 2015 Vivek Pagey et al., 2015
A STUDY OF PREMATURE FAILURE OF
BITUMINOUS ROAD: JABALPUR- PATAN ROAD:
A CASE STUDY
Vivek Pagey1*, A K Singhai1 and R K Yadav1
Roads should last for the period for which they have been designed. But sometimes failuretakes place on the roads well before their design life, commonly known as premature failure ofhighways and roads. Jabalpur-Patan road is a typical case of premature failure of a bitumenroad in district Jabalpur, MP. A detailed study was conducted to find out various causes ofpremature failure of this road and to suggest remedial measures to prevent such failures in thefuture and to bring out solutions in practice from the point of view of Geotechnical and Highwayengineering.
Keywords: Premature Failure, Pavement, Bituminous Roads, Geotechnical and Traffic Study,
MORTH
*Corresponding Author: Vivek Pagey � [email protected]
1 ME IV Sem. Geotechnical Engineering, JEC, Jabalpur, India.
Int. J. Engg. Res. & Sci. & Tech. 2015
ISSN 2319-5991 www.ijerst.com
Vol. 4, No. 2, May 2015
© 2015 IJERST. All Rights Reserved
Case Study
INTRODUCTION
Roads are the lifelines of development of any area,
state or country. The pace of progress is intimately
connected with the network of roads, connectivity
between various growth centers and hassle less
movement of man and materials all the year round
to various places of activity.
At one hand the speed of growth directly
depends upon the effective network of roads and
on the other hand an effective network of roads
is the direct outcome of proper infrastructure
development. Roads have become very important
in our life because the economy of time and
money is largely dependent on the availability of
roads from point to point.
Sometimes failure takes place on the roads
well before their design life, commonly known as
premature failure of highways and roads.
There are multiple reasons for premature
failure of bitumen roads and a variety of known
and unknown factors responsible for such
failures. More important factor is the error in
following instructions given in the manuals for
every stage of road construction, may it be raising
of a new road or improvement of existing road in
all the cases the guidelines given in the manuals
in respect of materials to be used, quality control
measures to be strictly adhered to and number
of checks and rechecks by different agencies
engaged in the task of constructing quality
bitumen roads.

309
This article can be downloaded from http://www.ijerst.com/currentissue.php
Int. J. Engg. Res. & Sci. & Tech. 2015 Vivek Pagey et al., 2015
It has been observed that frequent damage to
the bitumen roads immediately after the
construction of roads takes place.
STUDY ROAD DETAILS
Jabalpur- Patan road is a typical case of
premature failure of a bitumen road,
reconstructed by state PWD of M.P. in the year
2007. The distance between Jabalpur and Patan
is approximately 30 km. This road connects
Jabalpur to Damoh district via Patan and
Tendukheda blocks. This road is a bituminous road
and was constructed mainly to carry moderate
traffic load of small buses, light commercial
vehicles, tractors, bullock carts and light motor
vehicles.
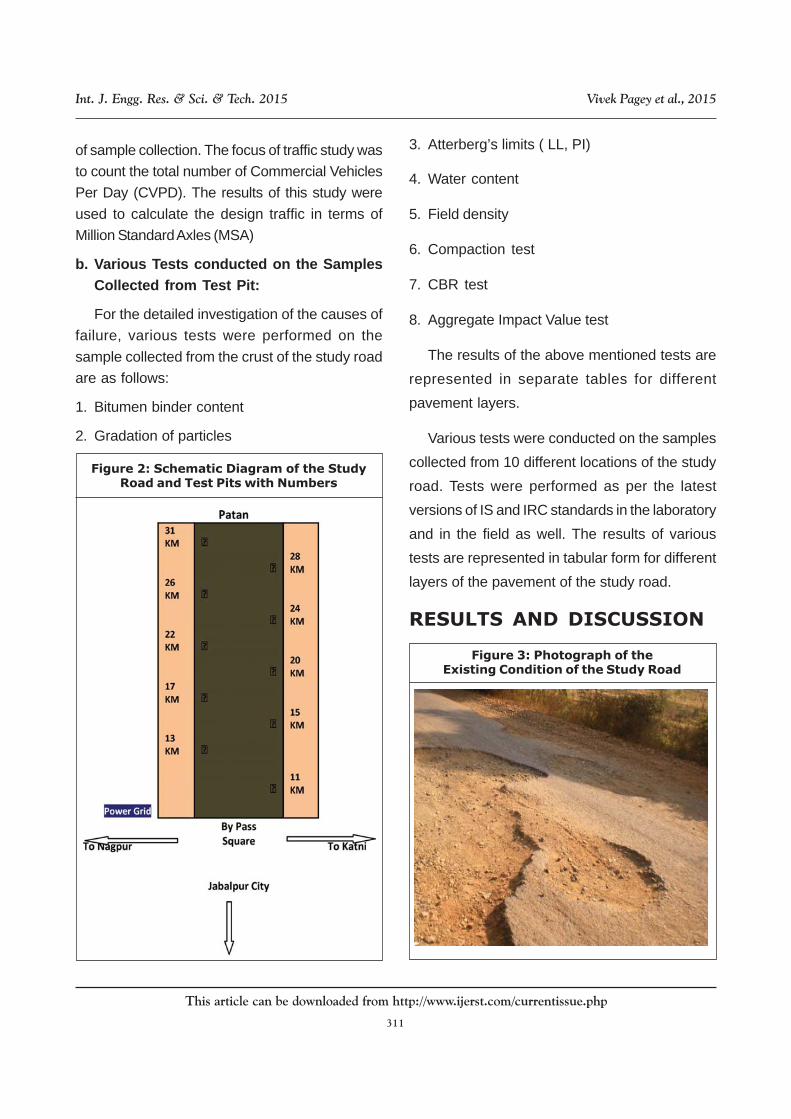
Out of the 30 km length of the road, for purpose
of study a stretch of 20 km between the villages
Sukha and Patan has been selected, as shown
in the schematic sketch of the road outlay.
This existing road is a single lane road with
• Carriage width is 3.75 m
• Road way 7.5 m
• newly built shoulders
• Present road condition: Poor
• Having insufficient width to cross heavy
vehicles safely.
Edge cracking, big pot holes and uneven
settlement are some of the key features which
are apparent when we travel on this road. At the
same time the crossing of two vehicles is risky
due to the edge cracking and narrow width of this
road.
OBJECTIVE OF THE STUDY
The objective of the study is to find out various
causes of premature failure of such an important
road and to suggest remedial measures to
prevent such failures in the future and to bring
out solutions in practice from the point of view of
Geotechnical and Highway engineering.
LITERATURE REVIEW
An extensive literature review was undertaken to
gather information pertaining to investigations of
pavement failures as well as current materials
requirements and design and construction
practices utilized to minimize the risk of moisture-
related damage in flexible pavements. This
section provides a synthesis of the findings of
the available literature. Research work has been
done in this field on various roads in India and
abroad. Brief description of some of the work is
outlined here:
Mahesh Kumar et al. shown in their research
work that Heavy vehicular loads cause damage to
road crusts. Not adopting proper specifications in
execution of work such as non sealing the surface
of DBM, non preparation of berms with overlays,
heavy axle loads and impervious bitumen layers
resulted into the failure of highways.
Figure 1: Map of the Study Road

310
This article can be downloaded from http://www.ijerst.com/currentissue.php
Int. J. Engg. Res. & Sci. & Tech. 2015 Vivek Pagey et al., 2015
Praveen Kumar et al. in their research paper
on ‘Case studies on failure of Bituminous
Pavement’ found that the pavement failure is
defined in terms of decreasing serviceability
caused by the development of cracks and ruts.
The purpose of this study was to evaluate the
possible causes of pavement distresses, and to
recommend remedies to minimize distress of the
pavement. The paper describes lessons learnt
from pavement failures and problems
experienced during the last few years on a
number of projects in India. Based on the past
experiences various pavement preservation
techniques and measures are also discussed
which will be helpful in increasing the serviceable
life of pavement.
Dangar Rushikesh et al. conducted studies on
Pavement Deterioration on National Highway 8b
Section Rajkot-Bamanbore (Km 185/0-Km 216/
8) and reached on very important findings on
pavement deterioration.
According to them, pavements are complex
structures involving many variables, such as
materials, construction methods, loads,
environment, maintenance, and economics.
Thus, various technical and economic factors
must be well understood to design, build
pavements, and to maintain better pavements.
Moreover, the problems relating to pavement
maintenance are still complex due to the dynamic
nature of road pavements where elements of the
pavement are constantly changing, being added
or removed. These elements deteriorate with time
and therefore to be maintained in good condition
requires substantial expenditure. The paper
analyze the condition survey of the NH 8-B
(Section Rajkot-Bamnabore (km 185/0-km 216/
8)). It gives an idea about problem of pavement
deterioration and pavement condition at present.
Studies conducted by Horak et al. in their
research found that premature failure in the form
of cracking, stripping and brittleness of a hot mix
asphalt surfacing on a major road in South Africa
was investigated. Anecdotal evidence as well as
pavement structural evaluation with the FWD
confirmed that the distress was restricted to the
surface layer alone. Testing on the recovered
binder indicated that excessive filler material was
present in the mix.
METHODOLOGY OF THE STUDY
After conducting the reconnaissance of the study
road, it was decided to go for the detailed field
work. Permission was taken from the authorities
of MPPWD, Jabalpur.
Ten numbers of trial pits were dug to collect
the sample from the study road at different
locations. The location of the test pits were kept
in staggered manner 2-3 km apart from each
other.
The test pits measuring 1.2 m x 1.2 m were
dug open upto the subgrade level to find out the
thickness of the pavement layers to study the
quality of the material as well as construction
quality in order to check the causes of the causes
of the premature failure of the study road. The
average depth of the excavation of the test pits
was 0.8 m.
The study road was investigated for the causes
of distress and failure of the existing pavement.
Traffic volume study was also conducted. Traffic
volume data has been taken after carrying out
the traffic survey at the site. The survey covered
counting of different category of vehicles.
a. Traffic Volume Count Details of the Study Road
Traffic surveys were conducted on three different
days for a period of 24 hours each day at the time
311
This article can be downloaded from http://www.ijerst.com/currentissue.php
Int. J. Engg. Res. & Sci. & Tech. 2015 Vivek Pagey et al., 2015
of sample collection. The focus of traffic study was
to count the total number of Commercial Vehicles
Per Day (CVPD). The results of this study were
used to calculate the design traffic in terms of
Million Standard Axles (MSA)
b. Various Tests conducted on the SamplesCollected from Test Pit:
For the detailed investigation of the causes of
failure, various tests were performed on the
sample collected from the crust of the study road
are as follows:
1. Bitumen binder content
2. Gradation of particles
3. Atterberg’s limits ( LL, PI)
4. Water content
5. Field density
6. Compaction test
7. CBR test
8. Aggregate Impact Value test
The results of the above mentioned tests are
represented in separate tables for different
pavement layers.
Various tests were conducted on the samples
collected from 10 different locations of the study
road. Tests were performed as per the latest
versions of IS and IRC standards in the laboratory
and in the field as well. The results of various
tests are represented in tabular form for different
layers of the pavement of the study road.
RESULTS AND DISCUSSION
Figure 2: Schematic Diagram of the StudyRoad and Test Pits with Numbers
Figure 3: Photograph of theExisting Condition of the Study Road
312
This article can be downloaded from http://www.ijerst.com/currentissue.php
Int. J. Engg. Res. & Sci. & Tech. 2015 Vivek Pagey et al., 2015
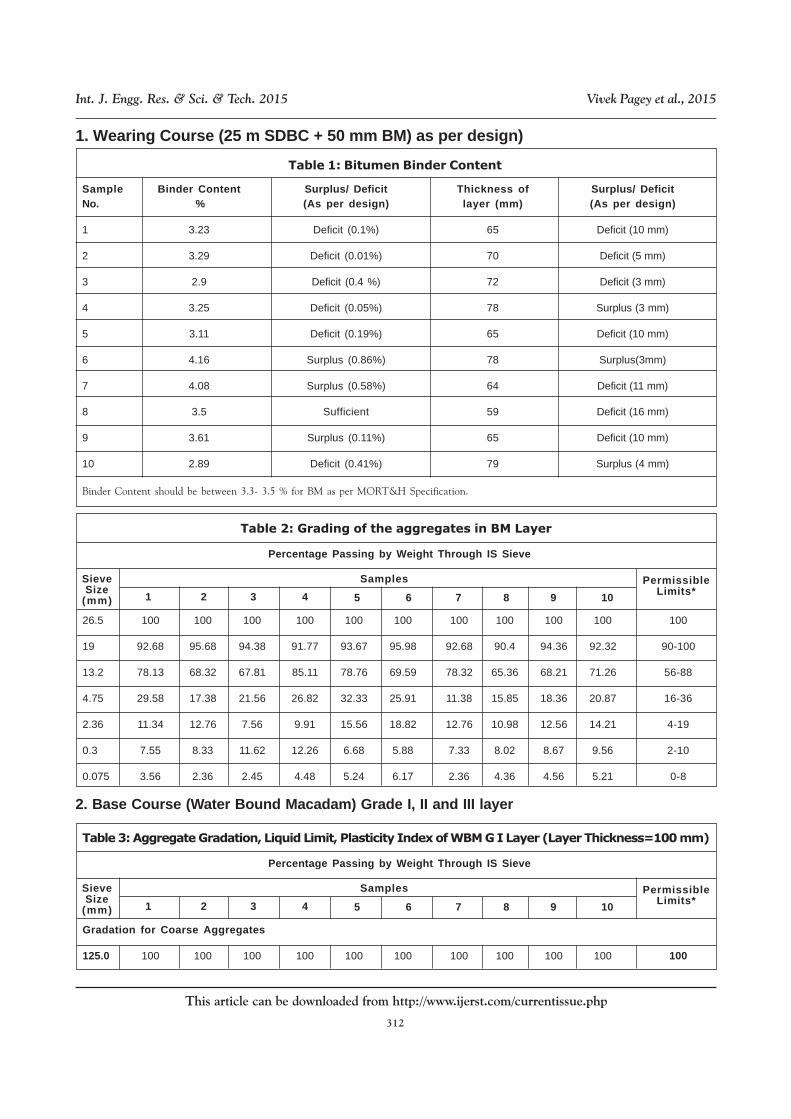
1. Wearing Course (25 m SDBC + 50 mm BM) as per design)
Table 1: Bitumen Binder Content
Sample Binder Content Surplus/ Deficit Thickness of Surplus/ DeficitNo. % (As per design) layer (mm) (As per design)
1 3.23 Deficit (0.1%) 65 Deficit (10 mm)
2 3.29 Deficit (0.01%) 70 Deficit (5 mm)
3 2.9 Deficit (0.4 %) 72 Deficit (3 mm)
4 3.25 Deficit (0.05%) 78 Surplus (3 mm)
5 3.11 Deficit (0.19%) 65 Deficit (10 mm)
6 4.16 Surplus (0.86%) 78 Surplus(3mm)
7 4.08 Surplus (0.58%) 64 Deficit (11 mm)
8 3.5 Sufficient 59 Deficit (16 mm)
9 3.61 Surplus (0.11%) 65 Deficit (10 mm)
10 2.89 Deficit (0.41%) 79 Surplus (4 mm)
Binder Content should be between 3.3- 3.5 % for BM as per MORT&H Specification.
26.5 100 100 100 100 100 100 100 100 100 100 100
19 92.68 95.68 94.38 91.77 93.67 95.98 92.68 90.4 94.36 92.32 90-100
13.2 78.13 68.32 67.81 85.11 78.76 69.59 78.32 65.36 68.21 71.26 56-88
4.75 29.58 17.38 21.56 26.82 32.33 25.91 11.38 15.85 18.36 20.87 16-36
2.36 11.34 12.76 7.56 9.91 15.56 18.82 12.76 10.98 12.56 14.21 4-19
0.3 7.55 8.33 11.62 12.26 6.68 5.88 7.33 8.02 8.67 9.56 2-10
0.075 3.56 2.36 2.45 4.48 5.24 6.17 2.36 4.36 4.56 5.21 0-8
Percentage Passing by Weight Through IS Sieve
Table 2: Grading of the aggregates in BM Layer
SieveSize
(mm)
Samples PermissibleLimits*1 2 3 4 5 6 7 8 9 10
2. Base Course (Water Bound Macadam) Grade I, II and III layer
Percentage Passing by Weight Through IS Sieve
Table 3: Aggregate Gradation, Liquid Limit, Plasticity Index of WBM G I Layer (Layer Thickness=100 mm)
SieveSize
(mm)
Samples PermissibleLimits*1 2 3 4 5 6 7 8 9 10
Gradation for Coarse Aggregates
125.0 100 100 100 100 100 100 100 100 100 100 100

313
This article can be downloaded from http://www.ijerst.com/currentissue.php
Int. J. Engg. Res. & Sci. & Tech. 2015 Vivek Pagey et al., 2015
Percentage Passing by Weight Through IS Sieve
Table 3 (Cont.)
SieveSize
(mm)
Samples PermissibleLimits*1 2 3 4 5 6 7 8 9 10
90.0 91.22 92.37 91.88 97.82 95.32 96.67 89.36 93.56 91.65 87.45 90-100
63.0 67.88 59.45 61.29 70.17 72.28 29.57 72.85 72.77 78.23 69.31 25-60
45.0 7.13 6.79 2.76 3.88 11.45 16.67 14.85 11.78 7.03 12.24 0-15
22.4 3.33 3.24 8.33 4.65 3.25 4.23 5.36 3.12 6.64 7.66 0-5
Gradation for Screenings
13.2 100 100 100 100 100 100 100 100 100 100 100
11.2 96.63 94.54 90.44 92.58 89.56 88.65 94.23 96.24 95.32 92.3 95-100
5.6 22.24 25.38 26.23 27.52 29.77 28.12 28.65 25.69 22.13 28.66 15-35
0.18 5.28 5.56 4.67 3.57 2.87 6.67 5.05 4.95 6.87 5.66 0-10
Field 2.12 2.11 2.06 2.21 2.12 1.98 1.95 2.13 2.18 2.10 2.168Density(gm/cc)
Degree Good Good Sufficient Good Good Sufficient Sufficient Good Good Sufficient >98of Com-paction
Field 7.5 6.25 6.68 7.25 5.39 7.45 8.03 7.12 6.42 7.21 MoistureContent(%)
Impact 22.03 23.6 18.6 19.54 20.12 21.36 19.24 18.23 20.63 22.58 Value %
Liquid 21.26 25.21 22.56 24.36 20.32 20.95 20.03 21.03 25.87 21.18 Limit%(LL)
Plasticity NP NP NP NP NP NP NP NP NP NP < 6Index(PI)**
Note: * As per MORT&H Specifications, 4TH Revision, ** For Materials Finer than 425 Micron Sieve.
Percentage Passing by Weight Through IS Sieve
Table 4: Aggregate Gradation, Liquid Limit, Plasticity Index of WBM G II Layer
SieveSize
(mm)
Samples PermissibleLimits*1 2 3 4 5 6 7 8 9 10
Gradation for Coarse Aggregates
90 100 100 100 100 100 100 100 100 100 100 100
63 96.24 92.37 93.88 94.82 91.32 96.67 89.36 90.54 91.65 87.45 90-100

314
This article can be downloaded from http://www.ijerst.com/currentissue.php
Int. J. Engg. Res. & Sci. & Tech. 2015 Vivek Pagey et al., 2015
Percentage Passing by Weight Through IS Sieve
Table 4 (Cont.)
SieveSize
(mm)
Samples PermissibleLimits*1 2 3 4 5 6 7 8 9 10
53 66.88 46.45 61.29 40.17 52.28 29.57 62.85 72.77 78.23 69.31 25-75
45 10.53 15.79 12.76 13.85 14.45 11.67 14.85 13.78 7.03 12.24 0-15
22.4 4.63 6.24 8.33 4.65 3.25 4.23 5.36 3.12 6.64 7.66 0-5
Gradation for Screenings
13.2 100 100 100 100 100 100 100 100 100 100 100
11.2 98.73 96.54 91.44 95.58 89.56 88.65 90.23 96.24 91.32 92.3 95-100
5.6 24.74 26.38 26.23 24.52 29.87 23.12 30.65 25.69 32.13 28.66 15-35
0.18 5.28 5.56 4.67 3.57 2.87 6.67 5.05 4.95 6.87 5.66 0-10
Field 2.03 2.11 2.06 2.20 1.86 1.98 1.95 2.13 2.08 2.10 2.168Density(gm/cc)
Degree Sufficient Good Sufficient Good Sufficient Sufficient Sufficient Good Sufficient Sufficient >98of Com-paction
Field 7.8 6.22 5.68 6.24 6.39 8.45 7.03 6.12 5.45 6.21MoistureContent%
Impact 18.50 20.6 19.6 19.54 24.12 22.36 19.24 18.23 21.64 21.52Value%
Liquid 24.36 26.21 21.56 25.36 21.32 22.95 20.03 24.03 24.87 20.18Limit%(LL)
Plasticity NP NP NP NP NP NP NP NP NP NP < 6Index(PI)**
Note: * As per MORT&H Specifications, 4TH Revision; Materials Finer than 425 Micron Sieve
Percentage Passing by Weight Through IS Sieve
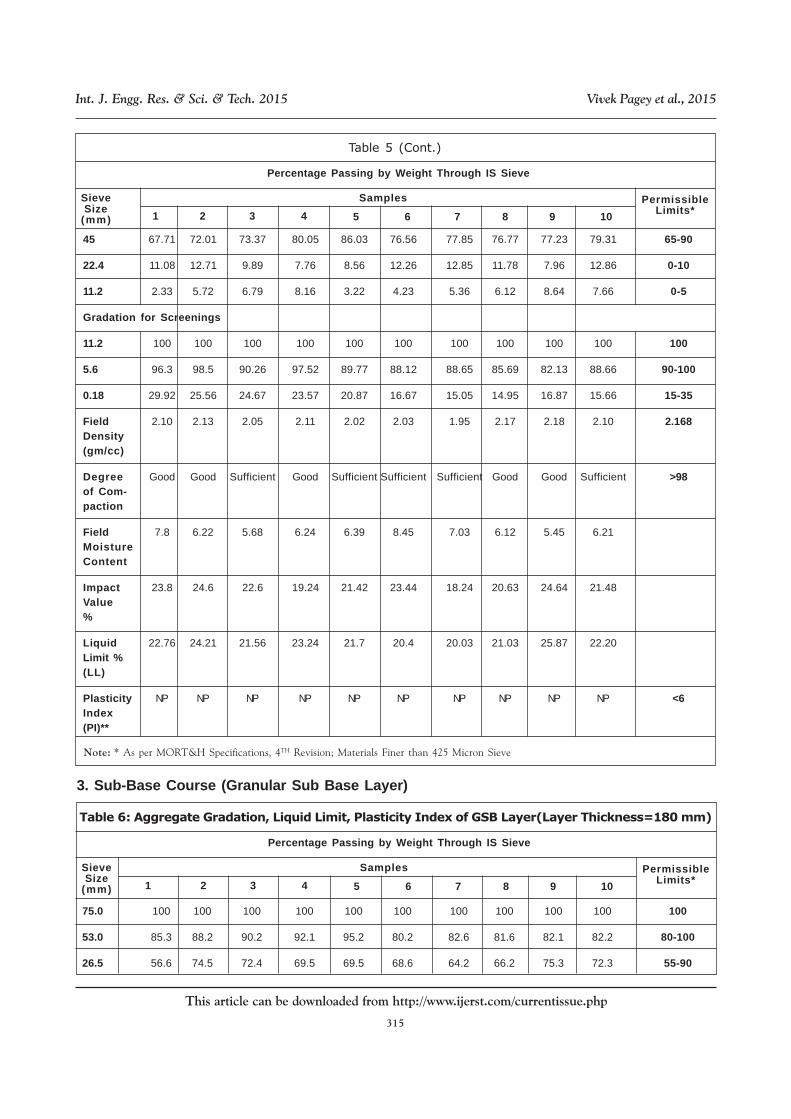
Table 5: Aggregate Gradation, Liquid Limit, Plasticity Index of WBM G III Layer
SieveSize
(mm)
Samples PermissibleLimits*1 2 3 4 5 6 7 8 9 10
Gradation for Coarse Aggregates
63 100 100 100 100 100 100 100 100 100 100 100
53 92.3 91.38 89.57 88.76 98.78 91.26 88.36 90.56 91.65 87.45 95-100
315
This article can be downloaded from http://www.ijerst.com/currentissue.php
Int. J. Engg. Res. & Sci. & Tech. 2015 Vivek Pagey et al., 2015
Percentage Passing by Weight Through IS Sieve
Table 5 (Cont.)
SieveSize
(mm)
Samples PermissibleLimits*1 2 3 4 5 6 7 8 9 10
Note: * As per MORT&H Specifications, 4TH Revision; Materials Finer than 425 Micron Sieve
45 67.71 72.01 73.37 80.05 86.03 76.56 77.85 76.77 77.23 79.31 65-90
22.4 11.08 12.71 9.89 7.76 8.56 12.26 12.85 11.78 7.96 12.86 0-10
11.2 2.33 5.72 6.79 8.16 3.22 4.23 5.36 6.12 8.64 7.66 0-5
Gradation for Screenings
11.2 100 100 100 100 100 100 100 100 100 100 100
5.6 96.3 98.5 90.26 97.52 89.77 88.12 88.65 85.69 82.13 88.66 90-100
0.18 29.92 25.56 24.67 23.57 20.87 16.67 15.05 14.95 16.87 15.66 15-35
Field 2.10 2.13 2.05 2.11 2.02 2.03 1.95 2.17 2.18 2.10 2.168Density(gm/cc)
Degree Good Good Sufficient Good Sufficient Sufficient Sufficient Good Good Sufficient >98of Com-paction
Field 7.8 6.22 5.68 6.24 6.39 8.45 7.03 6.12 5.45 6.21 MoistureContent
Impact 23.8 24.6 22.6 19.24 21.42 23.44 18.24 20.63 24.64 21.48 Value%
Liquid 22.76 24.21 21.56 23.24 21.7 20.4 20.03 21.03 25.87 22.20Limit %(LL)
Plasticity NP NP NP NP NP NP NP NP NP NP <6Index(PI)**
Percentage Passing by Weight Through IS Sieve
Table 6: Aggregate Gradation, Liquid Limit, Plasticity Index of GSB Layer(Layer Thickness=180 mm)
SieveSize
(mm)
Samples PermissibleLimits*1 2 3 4 5 6 7 8 9 10
75.0 100 100 100 100 100 100 100 100 100 100 100
53.0 85.3 88.2 90.2 92.1 95.2 80.2 82.6 81.6 82.1 82.2 80-100
26.5 56.6 74.5 72.4 69.5 69.5 68.6 64.2 66.2 75.3 72.3 55-90
3. Sub-Base Course (Granular Sub Base Layer)

316
This article can be downloaded from http://www.ijerst.com/currentissue.php
Int. J. Engg. Res. & Sci. & Tech. 2015 Vivek Pagey et al., 2015
Percentage Passing by Weight Through IS Sieve
Table 6 (Cont.)
SieveSize
(mm)
Samples PermissibleLimits*1 2 3 4 5 6 7 8 9 10
9.5 45.02 36.23 52.01 56.36 65.24 70.21 36.22 49.21 45.5 56.26 35-65
4.75 32.2 35.3 26.2 27.5 28.7 27.1 28.6 29.6 25.1 28.6 25-55
2.36 25.56 24.21 28.32 30.28 34.25 39.04 38.54 36.25 37.25 29.32 20-40
0.425 11.20 15.03 14.85 14.85 13.01 9.54 12.32 15.44 17.9 19.6 10-25
0.075 5.28 5.56 7.67 9.57 12.8 6.67 5.05 11.9 6.87 9.66 0-5
Field 1.96 2.02 2.06 2.16 2.02 1.94 1.98 2.12 2.16 2.00 2.212Density(gm/cc)
Degree Sufficient Sufficient Sufficient Good Sufficient Sufficient Sufficient Good Good Sufficient
of Com-paction
Field 6.8 6.22 5.28 6.24 6.1 9 7.45 7.03 6.12 5.45 5.21MoistureContent
Impact 28.05 27.36 30.4 27.74 30.12 19.36 29.24 28.45 26.64 25.98Value %
Liquid 19.2 18.21 17.56 18.25 16.32 20.95 17.03 19.03 24.87 20.18Limit %(LL)
Plasticity NP NP NP NP NP NP NP NP NP NP <6Index (PI)
CBR 35 38 36 37 31 35 32 33 35 31 >30Value (%)
Note: * As Per Mort&H Specification, 4th Revision.
4.Subgrade Layer
Table 7: Properties of Subgrade Soil
SieveSize
(mm)
Samples PermissibleLimits*1 2 3 4 5 6 7 8 9 10
Field 8.25 9.35 9.45 10.21 10.65 11.38 12.33 10.8 8.44 8.65MoistureContent(%)
Field 1.54 1.66 1.32 1.78 1.45 1.94 1.77 1.65 1.80 1.69DryDensity(gm/cc)
317
This article can be downloaded from http://www.ijerst.com/currentissue.php
Int. J. Engg. Res. & Sci. & Tech. 2015 Vivek Pagey et al., 2015
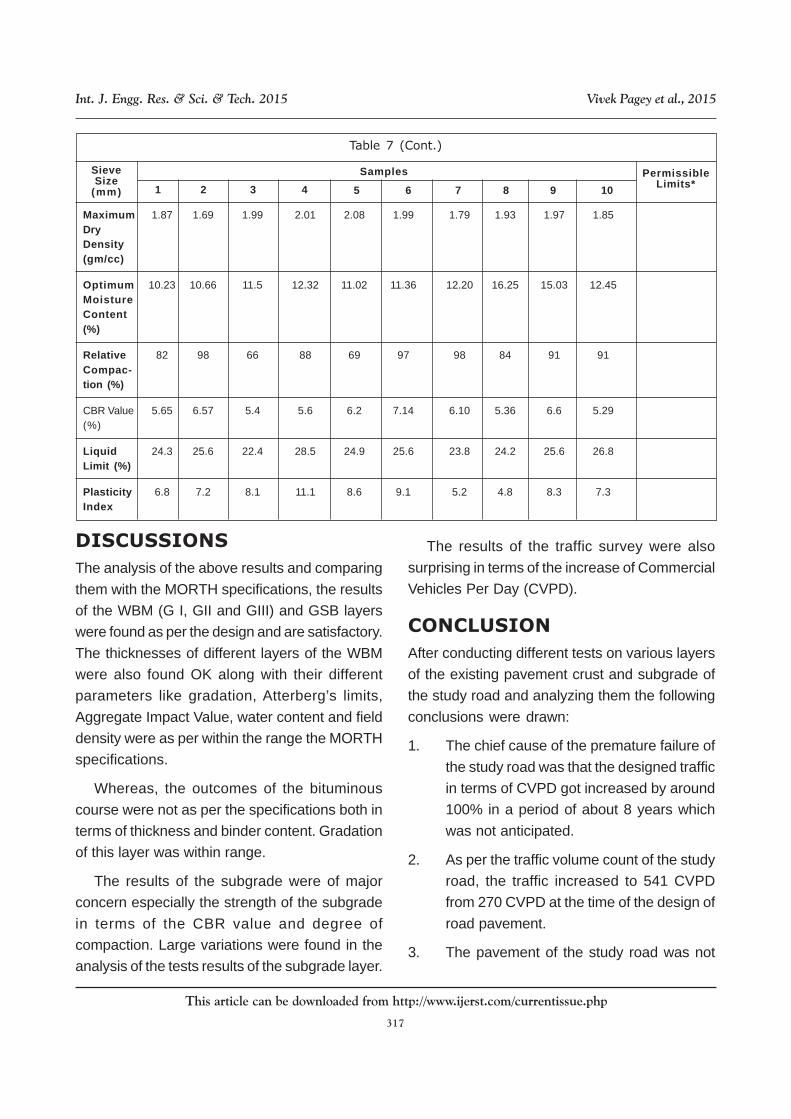
Table 7 (Cont.)
SieveSize
(mm)
Samples PermissibleLimits*1 2 3 4 5 6 7 8 9 10
Maximum 1.87 1.69 1.99 2.01 2.08 1.99 1.79 1.93 1.97 1.85DryDensity(gm/cc)
Optimum 10.23 10.66 11.5 12.32 11.02 11.36 12.20 16.25 15.03 12.45MoistureContent(%)
Relative 82 98 66 88 69 97 98 84 91 91Compac-tion (%)
CBR Value 5.65 6.57 5.4 5.6 6.2 7.14 6.10 5.36 6.6 5.29(%)
Liquid 24.3 25.6 22.4 28.5 24.9 25.6 23.8 24.2 25.6 26.8Limit (%)
Plasticity 6.8 7.2 8.1 11.1 8.6 9.1 5.2 4.8 8.3 7.3Index
DISCUSSIONS
The analysis of the above results and comparing
them with the MORTH specifications, the results
of the WBM (G I, GII and GIII) and GSB layers
were found as per the design and are satisfactory.
The thicknesses of different layers of the WBM
were also found OK along with their different
parameters like gradation, Atterberg’s limits,
Aggregate Impact Value, water content and field
density were as per within the range the MORTH
specifications.
Whereas, the outcomes of the bituminous
course were not as per the specifications both in
terms of thickness and binder content. Gradation
of this layer was within range.
The results of the subgrade were of major
concern especially the strength of the subgrade
in terms of the CBR value and degree of
compaction. Large variations were found in the
analysis of the tests results of the subgrade layer.
The results of the traffic survey were also
surprising in terms of the increase of Commercial
Vehicles Per Day (CVPD).
CONCLUSION
After conducting different tests on various layers
of the existing pavement crust and subgrade of
the study road and analyzing them the following
conclusions were drawn:
1. The chief cause of the premature failure of
the study road was that the designed traffic
in terms of CVPD got increased by around
100% in a period of about 8 years which
was not anticipated.
2. As per the traffic volume count of the study
road, the traffic increased to 541 CVPD
from 270 CVPD at the time of the design of
road pavement.
3. The pavement of the study road was not

318
This article can be downloaded from http://www.ijerst.com/currentissue.php
Int. J. Engg. Res. & Sci. & Tech. 2015 Vivek Pagey et al., 2015
able to withstand the increased traffic load
in such a short duration of around 8 years.
4. The traffic increase on the study road was
mainly due to the construction of the
Jabalpur – Damoh road via Katangi during
that period. This caused the HCVs and
vehicles to take the Jabalpur Patan road.
5. The existing width of the carriageway is 3.75
m only which is not adequate for the
crossing of two heavy vehicles.
6. The second major cause was of premature
failure was the inadequate strength of the
subgrade level in terms of CBR value.
7. The design CBR was minimum 7% but after
finding the CBR value of the samples
collected from the subgrade the CBR value
was below 7 % in most of the test pits.
8. The inadequate CBR value was also one
of the major factors for the premature failure
of the study road.
9. The thicknesses of the wearing course
were not found proper as per the crust
design of the study road. As per the design
the thickness of the bituminous course was
75 mm (25 mm SDBC + 50 mm BM),
which was not found adequate in most of
the test pits.
10. The top of the road was not properly sealed
in most of the places on the entire road and
on test locations.
11. Water has entered in the non bituminous
layers i.e., the base course (WBM) and the
sub- base course (GSB) from the top and
side of the crust. This moisture reduced the
strength of different layers of the pavement.
12. Edge cracking was also evident in most of
the places throughout the length of the study
road. This cracking took pace due to
improper construction and compaction of
the shoulders and the berms.
Note: This paper is only for academic interest
and cannot be used by anyone for any personal
interest.
REFERENCES
1. Mahesh Kumar, Tripta Goyal and Abhishek
Jatin (2012), “Premature Failure of
Highways and Remedies- A Case History”,
IRC Journal of Indian Highways, June 2012,
Vol. 40 no. 6, pp 47-59.
2. Dangar, Rushikesh P and Zala L B (2011),
“Pavement Deterioration: A Case Study On
National Highway 8b Section, Rajkot-
Bamanbore ( Km 185/0-216/8)”, National
Conference on Recent Trends in
Engineering and Technology, 13-14 May
2011, BVM engineering College, V.V. Nagar
Gujarat, India
3. Chen D (2009), “Investigation of a Pavement
Premature Failure on a Weak and Moisture
Susceptible Base”, Journal of Performance
of Constructed Facilities, Vol. 23, Issue 5
(October 2009) pp. 309-313.
4. Sikdar P K, Jain S S, Bose S and Kumar P
(1999), “Premature Cracking of Flexible
Pavements”, Journal of Indian Roads
Congress, Paper No. 461, Vol. 60, Issue 3,
pp. 355-398.
5. Remedial Recommendations for Non-
Permissible Cracking and Undulation
Distress on NH-7. Report No. Ref. NHAI-
07-0698 LT, Infra Techno Consultants
Australia and Singapore. 1998.
319
This article can be downloaded from http://www.ijerst.com/currentissue.php
Int. J. Engg. Res. & Sci. & Tech. 2015 Vivek Pagey et al., 2015
6. “Specification for Road and Bridge Works”
(Fourth Revision) by Indian Road
Congress, New Delhi, 2001
7. Principles and Practices of Highway
Engineering, Dr. Kadyali L R and Dr. Lal N B
Khanna Publishers, Delhi-6.
8. “Highway Engineering”, 1963, (Eighth
Edition), Dr. Khanna S. K. and Justo C E G
Nem Chand & Bros, Roorkee.
9. IRC: 82-1982 Code of Practice for
Maintenance of Bituminous Surfaces of
Highways, Reprint, March ’99, by Indian
Road Congress, New Delhi.
10. IRC: SP:19-2001 Manual For Survey
Investigation And Preparation Of Road
Projects.(First Revision Dec-2001) by Indian
Road Congress, New Delhi.
11. http://www.nhai.org (National Highways
Authority of India).