A Study of Polycarbonate / Poly (butylene terephthalate ...
103
A Study of Polycarbonate / Poly (butylene terephthalate) Compounding in a Twin Screw Extruder by Md. Hasan Tareque A thesis presented to the University of Waterloo in fulfillment of the thesis requirement for the degree of Master of Applied Science in Chemical Engineering Waterloo, Ontario, Canada, 2009 © Md. Hasan Tareque 2009
Transcript of A Study of Polycarbonate / Poly (butylene terephthalate ...

A Study of Polycarbonate / Poly (butylene terephthalate)
Compounding in a Twin Screw Extruder
by
Md. Hasan Tareque
A thesis
presented to the University of Waterloo
in fulfillment of the
thesis requirement for the degree of
Master of Applied Science
in
Chemical Engineering
Waterloo, Ontario, Canada, 2009
© Md. Hasan Tareque 2009

ii
I hereby declare that I am the sole author of this thesis. This is a true copy of the thesis,
including any required final revisions, as accepted by my examiners.
I understand that my thesis may be made electronically available to the public.

iii
ABSTRACT
In this work, the compounding of polycarbonate (PC) / poly-butylene terephthalate (PBT)
blends was studied for the purpose of improving quality of products with reduced
wastage and finally to satisfaction of end users. The effect of material rheological
characteristics and processing conditions on compounding of PC /PBT was investigated
through statistical experiments carried out on a 58 mm twin-screw extruder at SABIC
Innovative Plastics Limited (formerly GE Plastics Limited) in Cobourg, Ontario.
Melt Volume-Flow Rate (MVR) is the most commonly used property to monitor the
quality of products of PC/PBT blends. The MVR was studied with different sampling
times and correlations between product properties (melt flow) and processing conditions
(screw speed, flow rates) were discussed.
The rheological behavior of PC/PBT blends was investigated by dynamic and capillary
rheometers. The effects of processing conditions (screw speed, feed rate) on viscosity
were measured and it was found that the Cox-Merz rule is not valid for PC/PBT blends.
The change of morphology of PC/PBT blends was observed under a scanning electron
microscope (SEM) by using different types of samples. Those samples were (i) PC/PBT
blends pellets, (ii) PC/PBT blend samples, but collected after completing the rheological
tests in the parallel plate rheometer, and (iii) PC/PBT blend samples, but collected after
completing the rheological tests in the capillary rheometer. There was evidence that the
samples collected after completing the tests in the parallel and capillary rheometer might
be degraded due to temperature and time.

iv
ACKNOWLEDGEMENTS
First and foremost, I express my gratitude to my supervisor, Prof. Costas Tzoganakis, for
his guidance, suggestions and support. He is an excellent supervisor with impressive
personality and responsibility. His enthusiasm and integral view on research, not only
greatly contributed to the quality of this work, but also helped me become a better
professional.
I would like to thank the members of our research group, especially Dr. Shuihan,
Estanislao and Mohammad for their help with a variety of tasks.
I want to express my thanks and appreciations to the SABIC Innovative Plastics at
Cobourg Plant, ON, Canada, especially Mr. Paul Van Laren and Mr. Daniel Ross, for
providing the materials, equipment, machinery, facility, financial and technical support
for completion of this work.
I would lastly like to thank my parents, family and friends, for their inspiration, love and
continuing support. Most of all, I thank my wife, Sharmin who has been a source of
strength and motivation of success. Also thanks to my son, Farabi and daughter, Farah for
their love and affection.
v
TABLE OF CONTENTS
List of Figures ........................................................................................................................vii
List of Tables ..........................................................................................................................xi
Chapter 1 INTRODUCTION ....................................................................................................1
Chapter 2 LITERATURE REVIEW .........................................................................................4
2.1 PC/PBT Blends ...................................................................................................................4
2.2 Compounding of PC/PBT in Twin Screw Extruders ........................................................13
Chapter 3 EXPERIMENTAL .................................................................................................19
3.1 Factorial Design of Experiments .......................................................................................19
3.2 Testing Procedures ............................................................................................................24
3.2.1 Melt Volume-Flow Rate (MVR) ...................................................................................24
3.2.2 Parallel Plate Rheometer ................................................................................................25
3.2.3 Capillary Rheometer .....................................................................................................26
3.2.4 Scanning Electron Microscopy (SEM) ..........................................................................27
Chapter 4 RESULTS AND DISCUSSION .............................................................................30

vi
4.1 Melt Volume-Flow Rate (MVR) ......................................................................................30
4.1.1 Statistical Analysis ………………………………………………………………….…43
4.1.1.1 Variance Analysis……………………………………………………………………43
4.1.1.2 Effect of Different Factors by Variance Analysis………………………………..45
4.1.1.3 Comparison of Predicted and Observed Values……………………………….....47
4.1.1.4 Three Dimensional Surface Plot with Main Effects…………………………..…49
4.2 Dynamic Rheological Properties from Parallel Plate Rheometer..........................................53
4.3 Rheological Properties from Capillary Rheometer…………………….….............................62
4.4 Scanning Electron Microscopy (SEM) .............................................................................67
Chapter 5 CONCLUSIONS AND RECOMMENDATIONS……………………………......75
5.1 Recommendations for Path Forward .................................................................................76
References ...............................................................................................................................77
Appendix - Experimental Graphs ..........................................................................................84

vii
LIST OF FIGURES
Figure 4.1.1: Variation of Melt Volume-Flow Rate (MVR) with sampling time for
Run3 and Run5 of 1st set of experiments. ...................................................................36
Figure 4.1.2: Variation of Melt Volume-Flow Rate (MVR) with sampling time for
Run10 and Run12 of 2nd set of experiments.…………………………………….......37
Figure 4.1.3: Variation of Melt Volume-Flow Rate (MVR) with sampling time for
Run8 and Run5 of 1st set of experiments……………………....................................38
Figure 4.1.4: Variation of Melt Volume-Flow Rate (MVR) with sampling time
for Run8 and Run5 of 2nd set of experiments……………………………………..39
Figure 4.1.5: Variation of Melt Volume-Flow Rate (MVR) with sampling time for
Run1, 4, 6, 9 and 13 (centre points) of 1st set of experiments……………….….….41
Figure 4.1.6: Variation of Melt Volume-Flow Rate (MVR) with sampling time of Run1,
4, 6, 9 and 13 (centre points) of 2nd set of experiments……………………….…..42
Fig. 4.1.7: Variation of predicted values with observed values of MVR for 1st set of
experiments………………………………………………………………………..47
Fig. 4.1.8: Variation of predicted values with observed values of MVR for 2nd set of
Experiments…………………………………………………………………….….48
Fig. 4.1.9: Three-dimensional surface plot showing main effects of the two factors PC
flow rate and PBT flow rate with the lowest screw-speed (N) 369 rpm on
MVR of 1st set of experiments……………………………………………………49

viii
Fig. 4.1.10: Three-dimensional surface plot showing main effects of the two factors PC
flow rate and PBT flow rate with the highest screw-speed (N) 451 rpm on
MVR of 1st set of experiments……………………………………………………...50
Fig. 4.1.11: Three-dimensional surface plot showing main effects of the two factors PC
flow rate and PBT flow rate with the lowest screw-speed (N) 369 rpm on
MVR of 2nd sets of experiments……………………………………………………51
Fig. 4.1.12: Three-dimensional surface plot showing main effects of the two factors PC
flow rate and PBT flow rate with the highest screw-speed (N) 451 rpm on
MVR of 2nd sets of experiments…………………………………………………...52
Figure 4.2.1: Typical dynamic response behavior of PC/PBT blends
of 1st set of experiments of Run1………………………………………….....53
Figure 4.2.2: Variation of viscosity with respect to angular frequency of
PC/PBT blends of 1st set of experiments………………………………….…..54
Figure 4.2.3: Loss modulus versus storage modulus of PC/PBT
blends of 1st set of experiments…………………………………………..……55
Figure 4.2.4: Change of viscosity with respect to angular frequency of
PC/PBT blends of 2nd set of experiments……………………………………...56
Figure 4.2.5: Variation of viscosity with respect to angular frequency of
PC/PBT blends of 1st set of experiments of Run3 and Run8………………….57
Figure 4.2.6: Variation of viscosity with change of angular frequency
of PC/PBT blends of 2nd set of experiments………………………...…………58

ix
Figure 4.2.7: Viscosity changes with variation of angular frequency of PC/PBT
blends of 1st set of experiments……………...……………..…………………59
Figure 4.2.8: Viscosity changes with variation of angular frequency
of PC/PBT blends of 2nd set of experiments………………………………….60
Figure 4.2.9: Dynamic response behavior of PC/PBT blends
of 3rd set of experiments………………………………………………...……61
Figure 4.3.1: Complex Viscosity / Steady-shear Viscosity as a function of Angular
Frequency / Shear Rate for run number 6 of the 2nd set of experiments…………..63
Figure 4.3.2: Complex Viscosity /Steady-shear Viscosity as a function of Angular
Frequency / Shear Rate for run number 13 of the 2nd set of experiments...……..…64
Figure 4.3.3: Complex Viscosity /Steady-shear Viscosity as a function of Angular
Frequency / Shear Rate of run number 3 of 3rd set of experiments………..............65
Figure 4.3.4: Complex Viscosity /Steady-shear Viscosity as a function of Angular
Frequency / Shear Rate of run number 8 of the 3rd set of experiments……............66
Figure 4.4.1: SEM micrographs of unstained samples (0.1 μ m)…………………………….…68
Figure 4.4.2: SEM photographs of unstained samples (0.2 μ m)…………………………...…..69
Figure 4.4.3: SEM micrographs of stained samples ( 0.2 μ m)……………………...……...…..70
Figure 4.4.4: SEM micrographs of stained samples ( 1 μ m)…………………………...……....72
Figure 4.4.5: SEM photographs from the reel backscattering electron
detector (RBSD)……………………………………………………………...…...73

x
Figure 4.4.6: SEM images from the reel backscattering electron detector
(RBSD) stained by RuO4……………………………………………………………….………………74
Figure A.1: Dynamic response behaviour of PC/PBT blends of 1st set of experiments of
Run6…………………………………………………………………..............……84
Figure A.2: Dynamic response behaviour of PC/PBT blends of 1st set of experiments of
Run13………………………………………………………………………………85
Figure A.3: Dynamic response behaviour of PC/PBT blends of 2nd set of experiments of
Run7……………………………………………………………………………..…86
Figure A.4: Dynamic response behaviour of PC/PBT blends of 2nd set of experiments of
Run13……………………………………………………………………………….87
Figure A.5: Complex Viscosity / Steady-shear Viscosity as a function of Angular
Frequency / Shear Rate for run 9 of the 2nd set of experiments……………….……88
Figure A.6: Complex Viscosity / Steady-shear Viscosity as a function of Angular
Frequency / Shear Rate for run 11 of the 2nd set of experiments………………..…89
Figure A.7: Complex Viscosity / Steady-shear Viscosity as a function of Angular
Frequency / Shear Rate for run 5 of the 3rd set of experiments……...…..…………90
Figure A.8: Complex Viscosity / Steady-shear Viscosity as a function of Angular
Frequency / Shear Rate for run 7 of the 3rd set of experiments……………...……..91

xi
LIST OF TABLES
Table 3.1: Factorial design of 1st set of experiments…….………………………............................20
Table 3.2: Factorial design of 2nd set of experiments……….………………………………………21
Table 3.3: 3rd set of experiments…………………………….…………………………………....23
Table 4.1.1: Melt Volume Rate (MVR) measurement results for 1st set of experiments……...…....31
Table 4.1.2: Melt Volume Rate (MVR) measurement results for 2nd set of experiment…………....32
Table 4.1.3: Melt Volume Rate (MVR) measurement results for 3rd set of experiments…….……..33
Table 4.1.4: Replicate MVR measurements for 1st set of experiments……………………….….....34
Table 4.1.5: Replicate MVR measurements for 2nd set of experiments……………….……………..34
Table 4.1.6: Replicate MVR measurements for 3rd set of experiments…………...…………..….....35
Table 4.1.7: Average MVR of Run 1, 4, 6, 9 and 13 of 1st set of experiments…………………........41
Table 4.1.8: Average MVR of Run 1, 4, 6, 9 and 13 of 2nd set of experiments………………..….....42
Table 4.1.9: Analysis of variance (ANOVA) for 1st set of experiments………………………….......43
Table 4.1.10: Analysis of variance (ANOVA) for 2nd set of experiments…………………………...44
Table 4.1.11: Effect Estimations by analysis of variance (ANOVA) for 1st set of experiments….....45
Table 4.1.12 Effect Estimations by analysis of variance (ANOVA) for 2nd set of experiments…....46


1
Chapter 1
INTRODUCTION
Polymer blends offer an important route toward the development of new desired
properties of materials. They represent one of the most attractive techniques to generate
materials with unique combination of properties not available in a single polymer. If a
polymeric material can be generated /developed at a lower cost with properties meeting
specifications, then manufacturers would rather use it to remain competitive. Blending
allows for the beneficial properties of two or more polymers to be combined in one
material while shielding their mutual drawbacks.
Blends of poly (butylene terepthalate) (PBT) and polycarbonate (PC) materials are of
commercial interest because of their potential in combination. The semi-crystalline PBT
provides chemical resistance and thermal stability, while PC provides impact resistance,
toughness and dimensional stability at elevated temperatures. Blend properties can be
tailor-made by changing the percentage of PBT and PC in their blends. Most polymers
are mutually immiscible from a thermodynamic standpoint since entropic contribution to
the free energy of mixing is negligible. Most commercial polymer blends are multiphase
systems.
In PC/PBT blends, the PC and the PBT are physically mixed involving transesterfication
which results in the formation of PC-PBT co-polyesters. To control or prevent the
transesterification reaction, some additives may be used. Also, some special additives
may be used to serve as compatibilisers or as impact modifiers.
Twin screw extruders (TSE) are normally used for compounding of PC and PBT.
Modular intermeshing TSEs have been considered the most important machines for

2
continuous melt compounding. Co-rotating and counter-rotating are two classes of
intermeshing TSEs. Co-rotating TSEs have self wiping screw designs that enable them to
avoid the build-up of deposits and they have been more widely used than counter-rotating
intermeshing TSEs in compounding applications.
During polymer compounding, the blend components are transported and mixed along
the axial direction of an extruder which consists of partially and completely filled
sections of screw. Generally, PC and PBT are fed through two separate gravity hoppers
into a TSE. The rotating action of the screws contributes in producing a homogeneous
melt blend which is pumped through a manifold hanger die. At the die exit, the melted
material is cooled in a water trough and subsequently goes through pelletizing, drying,
screening, packaging and shipping to customers.
Polymer blending has been one of the most important areas of research and development
in polymer processing in the past few decades. There are numerous publications
addressing various topics in this area. In chapter 2 of this dissertation, a review is
provided with emphasis on PC and PBT blends. In the first section of chapter 2,
properties, rheology, morphology and applications of PC/PBT blends are overviewed. In
the second section of chapter 2, compounding of PC/PBT blends in TSE as well as
processing and diagnostics topics are discussed.
PC/PBT blends must have acceptable properties for customers or end users. Melt
Volume-Flow Rate (MVR) or Melt Flow Index (MFI) is the most common quality index
which characterizes the flow behavior of polymer melts with a single number. Normally,
MVR is measured offline using a MVR indexer located in a quality control laboratory,
however a few manufacturing companies use on-line measurements. Knowing the MVR
of a polymer is vital to anticipating and controlling its processing. It is an
assessment of average molecular mass and is an inverse measure of the melt viscosity.

3
Generally, higher MVR polymers are used in injection moulding, and lower MVR
polymers are used with blow moulding or extrusion processes.
In chapter 3, the experimental procedures including design of experiments, materials and
equipment used along with characterization of PC/PBT blends are presented. The melt
volume-flow rate (MVR), dynamic (parallel plate) rheometry, capillary rheometry and
scanning electron microscopy (SEM) measurement procedures and observations are
described in the characterization section.
The results of melt volume-flow rate (MVR), dynamic (parallel plate) rheometry,
capillary rheometry and scanning electron microscopy (SEM) are discussed in chapter 4.
The dynamic response of PC/PBT blends is presented in section 4.2 of this chapter. In
section 4.3, the validity of the Cox-Merz rule for PC/PBT blends is discussed. The
morphology of PC/PBT blend pellets and that of samples collected from the parallel plate
and capillary measurements are presented and discussed in section 4.4.
Finally, the conclusions of this research work are summarized in chapter 5 along with
recommendations for future research directions.

4
Chapter 2
LITERATURE REVIEW
Polymer blending has been one of the most important areas of research and development
in polymer science in the past few decades. Judging from the number of publications in
this area, it continues to maintain a prominent position. In this chapter, a review is
provided focusing on polycarbonate (PC) / poly(butylene terephthalate) (PBT) blends. In
the first section, properties, morphology, rheology and applications of PC/PBT blends are
overviewed. In the second section, compounding of PC/PBT blends in twin-screw
extruders (TSE) as well as processing and diagnostics topics are discussed.
2.1 PC/PBT Blends
Polymer blends are mixtures of at least two polymers and/or copolymers comprising
more than 2 wt% of each macromolecular component [1]. Polycarbonate (PC) and poly
(butylene terephthalate) (PBT) are important commercial engineering polymers, each of
them providing superior performance in a variety of applications. PC is an amorphous
polymer and is characterized by its dimensional stability, transparency, flame resistance,
high impact strength, and a very wide range of service temperature. However, PC has
some shortcomings, such as poor solvent resistance, low fatigue strength, and high melt
viscosity. PBT is a semicrystalline polymer with good chemical resistance, electric
insulation, and processability. The PC/PBT blends can inherit the toughness of PC and
the chemical resistance of PBT, and are available commercially [2]. The blend has high
ductility, toughness, and the dimensional stability and low shrinkage of polycarbonate as
well as the stress-crack resistance and gasoline resistance of the semi-crystalline PBT.
Blends of PC and PBT show a complex morphology and exhibit partial miscibility of PC
and PBT. Stabilization of the morphology and preventing continuous randomization by
ester exchange are some of the important characteristics of these blends. Critical

5
inventions involve such discoveries that combine properties such as high impact strength,
flow, and solvent stress crack resistance [3].
In general, for homopolymers and polymer blends, the molecular weight influences the
impact toughness and the viscoelastic properties such as the tensile modulus and, thus the
toughness of the material [4]. The mechanical properties of PC/PBT blends such as
tensile strength and low temperature falling weight impact strength tend to deteriorate
slightly when the number of extrusion times increases, but if the process is strictly
controlled, recycling of this blend would be acceptable [5].
PBT and PC form semicompatible blends and the presence of PC affects the
crystallization behavior and crystalline morphology of PBT. Crystallization of PBT is
largely hindered by the presence of PC in their blends and the rate of crystallization is
found to decrease with increasing level of PC [6]. Wahrmund et al. [7] studied melt
blends of bisphenol A polycarbonate (PC) with PBT by differential thermal analysis
(DTA) and dynamic mechanical behavior to determine their state of miscibility. Both
techniques showed multiple glass transition temperatures indicative of incomplete
miscibility in the amorphous phase. They demonstrated that there are amorphous phases
containing both components, i.e., partial miscibility of the PC-PBT system.
Sanchez et al. [8] showed that the PC/PBT blends, although transparent in the melt state
and mostly in the solid state, are partially miscible blends. They are composed by a PC-
rich phase, an amorphous PBT-rich phase, and a crystalline PBT phase. The crystalline
phase increases in volume when heated using PBT crystallized from both amorphous
phases. Lee et al. [9] examined the phase behavior of PC/PBT blends by dynamic
mechanical testing. They demonstrated that the blends of PC/PBT show two distinct
relaxation peaks, indicating immiscibile behavior. Marchese et al. [10] analyzed PBT/PC
samples, obtained through reactive blending with titanium (Ti) and samarium (Sm) based

6
catalyst, for determining a correlation between the chemical architecture, crystallizability,
and miscibility. They showed that the samples have complete miscibility.
Pompe and Haubler [11] postulated that the miscibility of polycarbonate PC and
poly(butylene terephthalate) PBT is controversially discussed in the literature. Partial
miscibility has been generally found in melt blends of the two polymers. However, in
solution cast blends they were found to be immiscible. It is known that the
transesterification takes place in the melt and co-polyesters formed by the
transesterification change the compatibility of PC and PBT.
The three possible mechanisms for the PC/PBT transesterification are suggested by
Devaux and co-workers [12]. The exchange reaction can result either from an alcoholysis
between an –OH terminated polycondensate (PC or PBT) and another macromolecular
species (PBT or PC) or from an acidolysis reaction involving carboxyl terminated PBT.
The transesterification can also proceed via a direct reaction between PBT unit and a PC
group. The exact mechanism of the exchange reaction between PC and PBT was assessed
by the study of model reactions. They concluded that the main process is that of direct
transesterification. Wilkinson and Tattum [13] studied the crystallization behavior of
PBT and a 50/50 PC/PBT blend with added transesterification catalyst using differential
scanning calorimetry (DSC) and synchrotron small angle X-ray scattering (SAXS) / wide
angle X-ray scattering (WAXS). They demonstrated that PBT crystallization was
inhibited in the blend by both the presence of PC and transesterification. Also, increasing
transesterification resulted in a progressive reduction in the melting and crystallization
temperature and degree of crystallinity. They postulated that transesterification also
induced a significant change in blend morphology.
Tattum et al. [14] formed a series of 50:50 PC/PBT blends via reactive melt blending in a
torque rheometer. In their work, a controlled degree of transesterification between the
7
two homopolymers was initiated by the incorporation of an alkyl titanium catalyst during
melt blending and finally quenching by the addition of a transesterification inhibitor.
They discussed that as the degree of transesterification increased, the composition of the
blends became increasingly complex, comprising of mixtures of the homopolymers and
various AB-type copolymers of PC and PBT, resulting in significant changes in their
thermal behavior. Also, a corresponding transformation in the morphology of the blends
was observed due to the formation of increasing concentrations of co-polyesters. Hopfe et
al. [15] studied melt blends of PC and PBT which were characterized for their
transesterification and crystallization behavior using Fourier transform infrared
spectroscopy (FTIR) as well as nuclear magnetic resonance (NMR) spectroscopy and
differential scanning calorimetry (DSC). They suggested that the transesterification can
be analyzed by FTIR spectroscopy using certain spectral features.
Sanchez [16] studied the aging of a PC/PBT blend with and without pigment by natural
and accelerated methods. He analyzed tensile and impact properties and melt flow index
was evaluated before and after aging, and also after recycling. He showed that the rupture
elongation of the recycled material was very good, showing the recycling potential of this
material. He suggested that tensile modulus and tensile strength were not affected by the
processes to which the blend was submitted. He concluded that the impact strength of the
recycled material showed a decrease after aging.
Utracki [17] suggested that most polymer blends are immiscible and need to be
compatibilized. The compatibilization must accomplish: (i) optimization of the interfacial
tension, (ii) stabilize the morphology against high stresses during forming, and (iii)
enhance adhesion between the phases in the solid state. Compatibilization is
accomplished either by addition of a compatibilizer or by reactive processing. His review
focused on three aspects: description of the interphase, compatibilization by addition and

8
reactive compatibilization. He pointed out that the compatibilization methods can be
divided into two categories:
a) By addition of: (i) a small quantity of a third component that is miscible with both
phases (cosolvent, e.g., phenoxy), (ii) a small quantity of copolymer whose one part is
miscible with one phase and another with another phase (e.g., 0.5 to 2 wt% of tapered
block copolymer), (iii) a large amount of a core-shell, multi-purpose compatibilizer-
cum-impact modifier.
b) By reactive compatibilization, which uses such strategies as: (i) trans-reactions, (ii)
reactive formation of graft, block or lightly crosslinked copolymer, (iii) formation of
ionically bonded structures, and (iv) mechano-chemical blending that may lead to chains’
breakage and recombination, thus generation of copolymers (even at liquid nitrogen
temperature).
Utracki [17] also showed that the reactive compatibilization (RC) engenders a thick
interphase that results in high stability of morphology during the forming stage (e.g.,
during injection molding under high stress and strain), but it increases the viscosity. In
some cases, as for example in PC/PBT blends, transesterification seems to be the easiest
compatibilization strategy. However, since PBT crystallinity is of utmost importance, the
method is neither easy to control nor of great advantage.
Mishra and Venkidusamy [18] characterized blends of PC with PBT using density
measurements, DSC, IR, and TGA. They suggested addition of PBT increases the density
values of blends linearly. Also, all the blends showed a single glass transition
temperature, indicating the miscibility of two polymers in the amorphous phase. They
discussed that with more than 6% addition of PBT to PC, PBT crystallizes as per its own
crystal structure and the addition of 4% PBT to PC improves the thermal stability at

9
higher temperature compared to pure PC. Also, IR studies showed that addition of PBT
improves the intermolecular forces in PC. Pesetskii et al. [19] showed that processes of
phase separation in blends consisting of PC and PBT can cause variations in properties of
both the amorphous and crystalline phases. They postulated that adhesion interaction
between phases in the blend becomes weaker between the glass transition temperatures
(Tg) of PBT and PC. They demonstrated that over the temperature range where
interphase interactions occur and two components are in the glassy state, the blend is not
impact resistant. Over the temperature range between Tg of PBT and Tg of PC, the
blends become impact resistant materials because of the energy of crack propagation in
the PBT amorphous phase.
Functional group containing MBS (graft terpolymer made from methyl methacrylate(M),
butadiene(B) and styrene(S)) impact modifiers for the PC/PBT alloy were synthesized
and characterized by Tseng and Lee [20]. They proposed that the functional group was
used to improve the adhesion between the MBS and the PC/PBT alloy. Their results
showed that the layer composition of the MBS exhibited a significant effect on the impact
strength.
Reekmans and Nakayama [21] studied the mechanical reinforcement and the molecular
structure development upon deformation of the blend PC and PBT. They showed that
elastic modulus increases with the extension ratio for all compositions and temperatures
and that blends with 25 - 40 wt % of PC have higher elastic modulus at low temperature
than pure PBT. Also, crystallinity increases with extension ratio and is relatively smaller
with increasing PC content.
Delimoy et al. [22] studied the crystallization of PC/PBT blends at low undercoolings
(<6 0 C) in isothermal conditions by rapidly cooling samples from the melt. On the basis
of their studies, original mechanisms of crystallization were proposed. The main feature

10
of these mechanisms is the slowness of the PBT crystallization when it is finely dispersed
and this behavior is attributed to a low nucleation density. They argued that
crystallization is thought to result from a homogeneous PBT nucleation which becomes
effective at such high undercoolings. This is followed by a very rapid growth of the
crystals. Also, Bennekom et al. [23] postulated that the phase behavior is strongly
dependent on blending and cooling conditions in blends of an amorphous polymer and a
semi-crystalline polymer. In the case of partial or complete miscibility of the components
in the molten state, the cooling rate and kinetics of non-isothermal crystallization will
influence the final extent of phase separation at room temperature.
Hobbs et al. [24] discussed the partial melt miscibility of the PC/PBT system. They
showed that among the unique morphological features of PBT/PC blends are the
consistent isolation of the core/shell impact modifier (IM) in the PC phase, and
crystallization and phase separation of the PBT from the partially miscible PBT/PC melt
on slow cooling. Nabar and Kale [25] studied the miscibility and rheological behavior of
PC/PBT blends. They suggested that the rheology of PC/PBT blends seems to show
systematic variation with time of mixing and same result showed DSC data also.
However, for PC/PBT blends, the processing time in an extruder and residual catalyst
present in the commercial sample cause sufficient degree of transesterfication. In their
work, the blends were mixed for different time periods for rheological studies. They
suggested that as the mixing time is increased, the blends show decrease in viscosity.
Wu et al. [26] prepared PBT/PC blends with different interfacial adhesion strength by
melt blending of the PBT and PC together with in situ formed PBT/PC copolymers. They
showed that the enhanced interfacial adhesion can effectively transfer the applied stress
from one phase to the other, reduce the flaws in the material and result in improved yield
strength, elongation at break and Young’s modulus. They demonstrated that fracture
toughness of the blends increases with the reactive extrudate (RE) content.

11
Bai et al. [27] investigated the mechanical properties and morphology of PBT/PC/PTW
(poly(ethylene-butylacrylate-glycidyl methacrylate)) blend. They showed that adding
PTW (poly-ethylene–butylacrylate–glycidyl methacrylate) to a brittle PBT/PC (50/50)
blend resulted in decreased tensile strength, flexural strength and flexural modulus, and
increased the elongation at break and impact strength.
Hobbs et al. [28] carried out DSC measurements on a number of PBT/PC blends prepared
by melt compounding and solution casting from hexafluoroisopropanol (HFIP). Their
results clearly indicate that appreciable mixing of the two polymers takes place in the
melt phase whereas complete separation is observed in cast films. The failure of the
casting procedure to mimic the melt blending results is related in part to liquid-liquid
phase separation and to crystallization of both polymers from the casting solvent.
The linear viscoelastic oscillatory shear properties of a PC and PBT, 60/40 by weight,
blend and its nanocomposites with various concentrations of organically modified
organoclay and clay surface treatment were studied by Depolo et al. [29]. They argued
that the decrease in properties is attributed to a decrease in molecular weight. They
observed a relatively small decrease in Tg and attributed it to increased compatibility.
The rheological behavior of materials is very complex, and polymers are usually more
complex than alternative materials of construction [30]. A parallel plate rheometer has
been developed for the study of nonlinear viscoelastic phenomena in molten plastics. By
making use of a novel shear stress transducer, the effects of instrument friction and edge
phenomena on the stress determination are eliminated. This makes possible the study of
the response of a melt to large, transient deformations involving large shear rates [31].
The rheological behavior of molten polymers is of prime importance as it relates to their
microstructure and governs their processing characteristics [32]. Rotational rheometers,
12
specifically cone-plate, parallel plate, and sliding plate rheometers are routinely used to
characterize the linear viscoelastic properties of polymer melts. Small amplitude
oscillatory shear experiments are employed to measure the storage (G’) and loss moduli
(G”), which are related to the elastic and viscous character of the material, respectively,
and the complex viscosity (η *) as functions of angular frequency (ω ) [33].
A well-known empiricism in the rheology of polymer melts is the Cox-Merz rule, which
relates the linear dynamic moduli as functions of frequency to the steady shear flow
viscosity as a function of shear rate. The Cox-Mexz [34] rule states that the (steady)
viscosity versus shear rate curve is virtually identical to the dynamic viscosity versus
frequency curve. It is valid for most common polymers. Since it is easier to get the
dynamic data over a very wide range of frequencies, it is used extensively in industry.
Scanning electron microscopy (SEM) is widely used to elucidate the phase morphology
of polymer blends. Samples for SEM are easy to prepare and the morphology can be
observed under high resolution [35].
Polymer blends have become a very important subject for scientific investigation in
recent years because of their growing commercial acceptance. Copolymerization and
blending are alternative routes for modification of properties of polymers. Blending is the
least expensive method. It does not always provide a satisfactory alternative to
copolymerization, of course, but polymer blends have been successfully used in an
increasing number of applications in recent years. Such successes encourage more
attempts to apply this technique to wider range of problems in polymer-related industries
[30].
Polymer blends are important industrial materials with good properties to satisfy a wide
range of applications. Mechanical properties of the blends, to a great extent, are

13
controlled by their morphology [36]. Kalkar et al. [37] postulated that PBT and PC can
form one of the most successful commercial polymer blends. The PBT/PC blends have
been commercialized under several trade names such as Xenoy®, Makroblend®/Pocan®
and Ultrablend®. Impact modified PC/PBT blends have been used extensively in
applications such as automotive bumpers where low temperature impact resistance and
resistance to automotive fluids such as gasoline are required [38].
2.2 Compounding of PC/PBT in Twin Screw Extruders
Twin screw extruders have established a solid position in the polymer processing
industry. The two main areas of application for twin screw extruders are profile extrusion
of thermally sensitive materials and specialty polymer processing operations, such as
compounding, devolatilization, chemical reactions, etc. Twin screw extruders used in
profile extrusion have a closely fitting flight and channel profile and operate at restively
low screw speeds, in the range of about 20 rpm. These machines offer several advantages
over single screw extruder. Better feeding and more positive conveying characteristics
allow the machine to process hard-to-feed materials (powders, slippery materials, etc.)
and yield short residence times and a narrow residence time distribution (RTD). Better
mixing and larger heat transfer area allow good control of the stock temperatures. Good
control over residence times and stock temperatures obviously are key elements in the
profile extrusion of thermally sensitive materials [39].
Twin screw extruders are generally classified by the direction of rotation: co-rotating and
counter-rotating, and by the degree of intermeshing: non-intermeshing (tangential),
completely or partially intermeshing. Currently, a wide variety of twin screw machines
are being offered. Some find niches in specific applications, particularly when extensive
devolatilization, high additive loadings, and/or intensive dispersive melt mixing are
important [40].

14
The main distinction is made between intermeshing and non-intermeshing twin screw
extruders. The latter are extruders where the flights of one screw do not protrude into the
channel of the other screw. These extruders cannot form closed or semi-closed
compartments and, therefore, do not have positive conveying characteristics. In
intermeshing extruders, the degree of intermeshing can range from almost fully
intermeshing to almost non-intermeshing with a corresponding range in the degree of
positive conveying characteristics. However, it should be noted that fully intermeshing is
a necessary, but not sufficient condition for positive conveying. In some geometrics,
there is very little sealing of the screw channels, even when the screws are fully
intermeshing. Positive conveying requires that the screw channels are closed off so that
the material contained in the various channel sections is fully occluded. Any amount of
back leakage into upstream channel sections will adversely affect the positive conveying
behavior [41].
In intermeshing, co-rotating extruders, the materials are conveyed in a figure-eight
pattern, alternating between moderate shear stress in the overflight zone (between screw
and the barrel) and high shear stress in the apex zone. Owing to a segmented design, both
the screw and the barrel can be custom-assembled to optimize for a specific production.
The screw is usually made of several types of conveying and kneading mixing elements,
both being able to convey the material either forward or backward. These extruders are
easier to scale-up, provide good and adjustable balance between the dispersive and
distributive mixing and they can be operated at restively high output rates [40].
The processes in the twin screw extruder depend primarily on the mode of operation (co-
or counter-rotation) and degree of fill. The length of the feeding and melting zones can
vary considerably, depending on the screw configuration and rotation speed, but in
general these are much shorter in twin screw than for single screw machines. While in the
single screw extruder, a continuous solid bed is formed, this does not happen in a twin
15
screw machine since the screw chambers are normally not totally filed and the solids
conveying zone is continuously divided by intermeshing with the other screw [40].
The theory of twin screw extruders is not as well developed as the theory of single screw
extruders. As a result, it is difficult to predict the performance of a twin extruder based on
extruder geometry, polymer properties, and processing conditions. Conversely, it is
equally difficult to predict the proper screw geometry when a certain performance is
required in a particular application. This situation has led to twin screw extruders of
modular design. These machines have removable screw and barrel elements. The screw
design can be altered by changing the sequence of the screw elements along the shaft. In
this way, an almost infinite number of screw geometries can be put together. The modular
design, therefore, creates excellent flexibility and allows careful optimization of screw
and barrel geometry of each particulars application. Unfortunately, modular screws and
barrels also increase the cost of the extruder a great deal [39].
Experiments with two lab scale, intermeshing twin screw extruders were described by
Rauwendall [41], one co- and one counter-rotating. Results are presented on power
consumption, residence time distribution, and mixing characteristics of the two extruders.
He postulated that the counter - rotating extruder exhibits a narrow residence time
distribution and better dispersive mixing capability and the co-rotating extruder showed a
better distributive mixing capability. He mentioned that the overall extruder performance
seems to be dominated by the effect of the intermeshing region. He concluded that the co-
rotating extruder appeared to be best suited for melt blending operations, while the
counter-rotating extruder seems to be preferred in operations where solid fillers had to be
dispersed in a polymer matrix.
Most of the information that has been published on co-rotating twin screw extruders has
been the result of research and development studies conducted by machine manufactures

16
and a few of polymer producers. The isothermal flow of a Newtonian liquid in a co-
rotating twin screw extruder having screw elements with three tips has been analyzed
when the effect of the intermeshing zone on flow can be neglected. It was found that the
values for four dimensionless parameters must be specified in order to obtain a unique
relationship between the dimensionless axial pressure gradient and the dimensionless
volumetric flow rate. These parameters included the number of screw tips, the helix
angle, the ratio of the clearance to the screw radius, and the ratio of distance between
screw centers to the radius [42].
Secor [43] postulated that twin-screw extruders are used very effectively, when partially
filled, for mixing and surface renewal of high viscosity fluids. He suggested that the rate
of energy input, often sufficiently high to be a major design consideration, determines the
drive power, the heat input to the fluid, and the cooling requirements. A simple model
for the rate of energy dissipation in twin-screw extruders predicts that the power input is
proportional to the square of the screw speed. Meijer and Elemans [44] showed that a
simplified model for a corotating twin-screw extruder is able to predict very well the
correct energy consumption, specific energy, and temperature rise, not only over the
extruder as whole, but also locally during processing (depending on local screw
geometry, processing conditions, and material properties). They emphasized that this is of
great practical importance in polymer processing because an understanding of the process
is within reach and gives a perspective for solving problems in scale-up.
Gao et al. [45] presented and experimentally validated a physically motivated model for
predicting the mean residence time in twin screw extruders. They showed that accurate
estimation of the mean residence time and propagation delay through a plasticating
extruder is critical for implementing feedback control schemes employing sensors
mounted along the extruder. In their studies, experiments were carried out on a 30 mm
Krupp Werner and Pfleiderer co-rotating twin screw extruder equipped with reflectance

17
optical probes over the melting section and mixing section and at the die. They
demonstrated that the mean residence times predicted by their model are in good
agreement with the experimentally measured ones. In their studies, both the model and
experimental results indicate that the mean residence volume has a linear relationship
with flow rate / screw speed ratio. They proposed that when the percent drag flow is not
large, this model can be used to predict the mean residence time with an estimation error
of no more than 10%. On the other hand, when the percent drag flow is large or higher
estimation accuracy is required an improved mean residence time model can be used.
They observed that operating conditions with equivalent specific throughput result in an
equivalent residence-volume distribution (RVD) and residence-revolution distribution
(RRD), and for a given screw configuration the axial mixing as measured by a tracer is
essentially the same for all operating conditions. This allows the experimental RVD
curves to be superimposed to form a single master curve for a given screw geometry.
They identified that those new tools motivate the development of a simple residence
model that characterizes the partially filled and fully filled screw sections and is capable
of distinguishing between screw configurations and operating conditions.
Kumar et al. [46] developed a framework for improved operation of extruders in a wide
range of applications by incorporating intelligent means for (i) on-line product quality
estimation(inferential sensing), (ii) diagnostics for common process/material failures, and
(iii) closed loop control of product quality based on the on-line estimation. In their study,
they have developed a novel model-based approach for the estimation, diagnostics and
controls in a unified framework.
Linjie and Xiaozheng [47] postulated that the melting of a polymer in co-rotating twin-
screw extruders depends not only on screw configurations and operational conditions, but
on the properties of the polymer as well. The progressive melting of polymer pellets in
co-rotating twin-screw extrusion was so complicated and varying that it was nearly

18
impossible to be described and modeled by one single model. They suggested that it was
modeled by selecting necessary melting sub-stages, so that the operating conditions and
screw configuration could be optimized. Finally, Shah and Gupta [48] found that for
similar screw cross-sections and rotational speed, the axial velocity as well as the degree
of mixing is higher in the co-rotating extruder, whereas pressure builds up is higher in the
counter-rotating extruder. In contrast to the flow in the co-rotating extruder, where the
velocity was always maximum at the screw tips, in the counter rotating extruder the
velocity was higher in the intermeshing zone. Since the counter-rotating twin-screw
extruders, which are similar to gear pumps, provide the maximum positive displacement,
they are the machine of choice for profile extrusion, whereas co-rotating twin-screw
extruders are more suitable for other applications such as compounding, mixing,
devolatization and chemical reaction. In this study, a co-rotating twin screw extruder was
used for compounding of PC/PBT blends and details are explained in Chapter 3 of this
thesis.

19
Chapter 3
EXPERIMENTAL
The experiments described in this chapter were all carried out on a WP ZSK 58 mm co-
rotating extruder at the compounding facility of SABIC Innovative Plastics in Cobourg,
Ontario. The resin used was a commercial Xenoy® PC/PBT blend and three sets of
experiments were completed.
In these sets of experiments, the main objective was to evaluate the effects of processing
conditions and resin composition on the rheological properties of the blend. For that
purpose, a 2-level factorial design was employed with screw speed, and PC and PBT flow
rates being the factors considered. The factorial design and experimental set up for these
experiments are explained in section 3.1 and testing procedures for rheological property
measurements are described in section 3.2.
3.1 Factorial Design of Experiments
A 2 3 factorial design provides the smallest number of runs for which 3 factors can be
studied in a complete factorial design because there are only two levels for each factor. In
this study, the three factors were screw speed, PC flow rate (feeder 1) and PBT flow rate
(feeder 2), each at two levels. These levels were approximately 10 % from the nominal
conditions which were used as the center point. The design was augmented with 5
replicate runs at the center point. This design was run on two consecutive days as shown
in Tables 3.1 and 3.2. Due to machine operating limitations, some of the combinations of
the levels were not feasible and were adjusted to practical levels of the factors studied.
These amended combinations are specified with bold red color numbers in Tables 3.1and
3.2.

20
Table 3.1 : Factorial design of 1st set of experiments (die hole diameter = 4 mm)
Run Order
Screw Speed
(N )
(RPM)
Total
Feed Rate
(Q) (kg/hr)
Feeder PC
(X1)
Feeder PBT
(X2)
1 410 425 0.61 0.39
2 451 434 0.66 0.34
3 451 383 0.61 0.39
4 410 425 0.61 0.39
5 369 383 0.61 0.39
6 410 425 0.61 0.39
7 369 434 0.66 0.34
8 451 468 0.61 0.39
9 410 425 0.61 0.39
10 451 416 0.56 0.44
11 400 (410) 468 0.61 0.39
12 400 (369) 416 0.56 0.44
13 410 425 0.61 0.39

21
Table 3.2: Factorial design 2nd set of experiments (die hole diameter = 3 mm)
Run
Order r
Screw Speed
(N)
(RPM)
Feed
Rate(Q)
(kg/hr)
Feeder PC
(X1)
Feeder PBT
(X2)
1 410 425 0.61 0.39
2 451 434 ( 456) 0.66 0.34
3 451 383 0.61 0.39
4 410 425 0.61 0.39
5 369 383 0.61 0.39
6 410 425 0.61 0.39
7 369 (390) 434 0.66 0.34
8 451 468 0.61 0.39
9 410 425 0.61 0.39
10 451 416 0.56 0.44
11 400 (451) 468 0.61 0.39
12 400 (369) 416 0.56 0.44
13 410 425 0.61 0.39

22
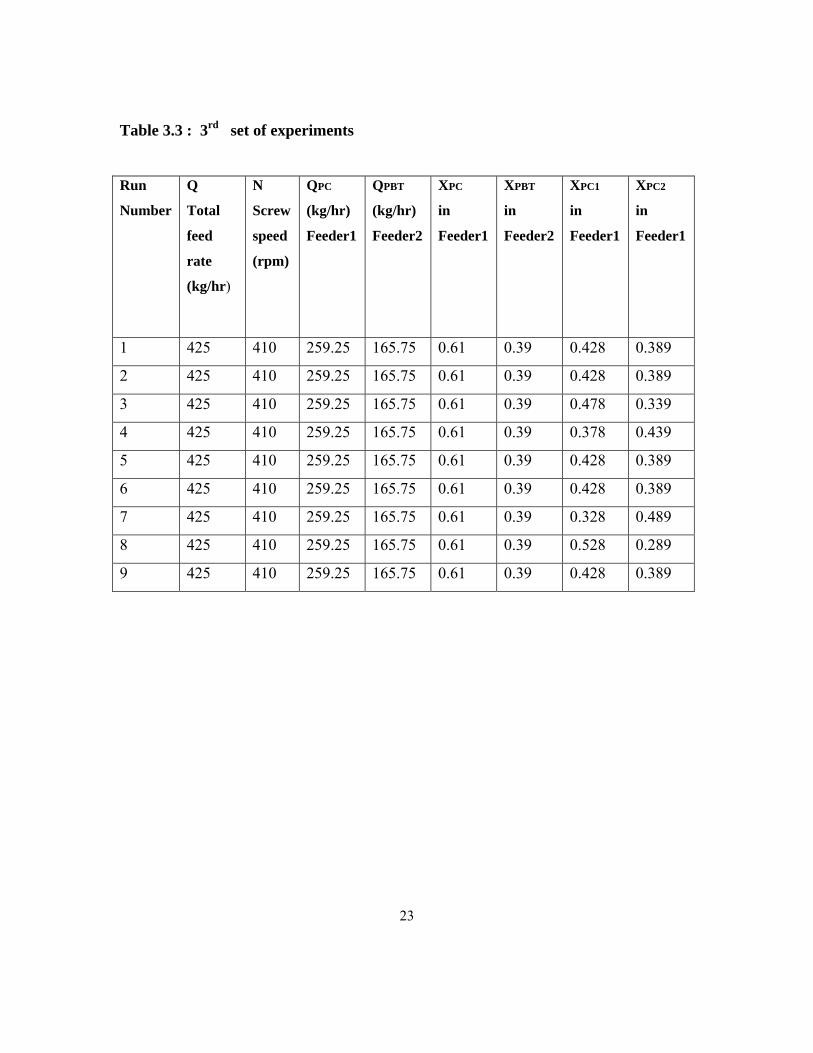
A 3rd set of experiments was run as shown in Table 3.3. The screw speed, total feed rate,
feed rate of PC (feeder 1) and feed rate of PBT (feeder 2) were kept constant for all nine
runs in this set of experiments. The composition of the PC feeder was the only variable
that was manipulated. These experiments were run randomly without any notice. In Table
3.3, Q is the total feed rate, N is the screw speed, QPC is the total feed of polycarbonate in
feeder1, QPBT is the feed rate of poly (butylene terephthalate), XPC1 is the weight fraction
of polycarbonate of type1 in feeder 1 and XPC2 is the weight fraction of polycarbonate
type 2 in feeder 1. The experimental set up for this set of experiments was similar as
those of 1st and 2nd set of experiments. The die used had 17 holes each with 3 mm
diameter. For the total of 9 runs of experiments, 36 polymer samples were collected at
intervals of 1, 5, 10, and 15 minutes for each run.
As indicated earlier, these experiments were carried out at the SABIC Innovative Plastics,
Cobourg plant using a WP 58mm twin-screw extruder, with two feeders and a data
acquisition system. The extruder was capable of running at a maximum screw speed of
620 rpm. The extruder was powered by a 250 HP drive, which provided a measurement
of total screw load (estimated from motor current and voltage) and screw speed. The
extruder had 9 thermocouples along the barrel length, 3 thermocouples along the die and
heating elements to control the temperatures in the corresponding barrel zones. The
signals for the machine variables were recorded using a data acquisition system. In these
experiments the motor torque (or load), die pressure, feed-rates, screw speed, melt
temperature were recorded at a sampling rate of 2 Hz. The die used on the first day had
17 holes each with 4 mm diameter and the die used on the second day had 17 holes but
each with 3 mm diameter. The material used was again a Xenoy ® blend. Polymer
samples were collected during each run. A total of 143 samples were collected on the first
day at intervals of 0.5 , 1 , 1.5 , 2 , 2.5 , 3 , 3.5 , 4 , 9 , 14 and 19 minutes for each
run. On the second day, totally 156 samples were collected at intervals of 0.5 , 1 , 1.5 ,
2 , 2.5 , 3 , 3.5 , 4 , 6 , 8 ,10 and 15 minutes for each run.
23
Table 3.3 : 3rd set of experiments
Run
Number
Q
Total
feed
rate
(kg/hr)
N
Screw
speed
(rpm)
QPC
(kg/hr)
Feeder1
QPBT
(kg/hr)
Feeder2
XPC
in
Feeder1
XPBT
in
Feeder2
XPC1
in
Feeder1
XPC2
in
Feeder1
1 425 410 259.25 165.75 0.61 0.39 0.428 0.389
2 425 410 259.25 165.75 0.61 0.39 0.428 0.389
3 425 410 259.25 165.75 0.61 0.39 0.478 0.339
4 425 410 259.25 165.75 0.61 0.39 0.378 0.439
5 425 410 259.25 165.75 0.61 0.39 0.428 0.389
6 425 410 259.25 165.75 0.61 0.39 0.428 0.389
7 425 410 259.25 165.75 0.61 0.39 0.328 0.489
8 425 410 259.25 165.75 0.61 0.39 0.528 0.289
9 425 410 259.25 165.75 0.61 0.39 0.428 0.389

24
3.2 Testing Procedures
3.2.1 Melt Volume-Flow Rate (MVR)
Melt Volume-Flow Rate (MVR) or Melt Flow Index (MFI) is the most common quality
index which characterizes the flow behavior of polymer melts with a single number
(single-point measurement). The melt flow indexer is normally located in the laboratory
and not directly at the production line; hence the MFI value is determined ‘off-line’ [49].
The major method used in the plastics industry today is the Melt Flow Rate Test (MFR),
sometimes referred to as the Melt Flow Index (MFI). Although the limitations of this test
have been known and discussed for many years, it is widely used and standard test
procedures have been established for most polymers (ASTM D1238-95 or ISO 1133).
The almost universal acceptance of this test has arisen from the fact that it gives an
indication of quality while being simple, easy to operate, fast and, most importantly,
inexpensive. These single point data are plotted versus time on control charts to establish
the variability of the process and the consequential product quality [50].
The Melt Flow Index test originated in the laboratories of ICI and was specified as a
standard rheological quality control test in the ISO, BS, and ASTM. Despite the fact that
MFI is an empirically defined parameter with certain limitations, it is still one of the most
popular parameters in the plastics industry for distinguishing various grades of polymers.
Polymer manufacturers have used it routinely to specify the most suitable end use of a
particular grade of the polymer [51]. The melt flow index is related to the inverse of
viscosity; however, no end-loss corrections have been developed. The molten polymer in
the reservoir is extruded through a capillary by the force weights which load a piston.

25
According to the measuring procedure and the dimensions of the reservoir, the piston and
the capillary are standardized worldwide [49].
By ASTM standards, melt flow index (MFI) is defined as the number of grams of
polymer that can be pushed out of a capillary die of standard dimensions (diameter: 2.095
mm, length: 8.0 mm) under the action of standard weight (2.16 kg for PE, at 190°C) in 10
minutes (ASTM Standard 1238). In this study, in all three sets of experiments MVR
values were measured in the SABIC Innovative Plastics industry’s laboratory and
followed their own standard. The amount of polymer that came out through the die after a
specific interval was weighed and normalized to the number of grams that would have
been extruded in 10 minutes. It is noted that the test results are reported by melt volume
flow rate (MVR), which is melt flow index (MFI) divided by polymer melt density i. e. ,
MVR (cm 3 /10 min) = MFI (g/10 min) / ρ (g/cm 3 ) .
3.2.2 Parallel Plate Rheometer
In a parallel plate rheometer, one plate rotates whilst the other is stationary, and the
torque and normal force are measured. The sample volume is not as strong a function of
the plate’s radius as for the cone-and-plate geometry. The shear rate in this geometry is a
function of the radius measured from the centre. Dynamic shear properties, such as
storage and loss moduli are measured when one plate oscillates relative to other. When
small gaps are used, one must take into account the small yet finite movement of the non-
oscillating plate, even when a force rebalances torque head is used [49]. It is easier to
load and unload viscous or soft solid samples with parallel plate geometry than with one
and plate or concentric cylinders. Thus parallel plates are usually preferred for measuring
viscoelastic material functions [52].

26
Dynamic rheological measurements for storage modulus G' and loss modulus G" were
made on a parallel plate rheometer (AR2000, TA Instruments) with 25 mm diameter
parallel plates and a 900nm gap set. Samples were dried at 120 0 C in a vacuum oven for
two hours. The sample were prepared as disks (Diameter=25mm, Thickness=1 mm)
using hot press at 260 0 C. Liquid nitrogen run through to pressurize the oven in order to
provide a nonreactive atmosphere during the experiment. The measurements were carried
out at 270 0 C and dynamic frequency sweeps were made over range of 0.01 – 100 Hz for
1st and 2nd set of experiments, and 1-100 Hz for 3rd set of experiments. Details results are
discussed in chapter 4.2.
3.2.3 Capillary Rheometer
The simplest and most ubiquitous type of melt rheometer is the capillary rheometer.
While it is not very versatile in its capabilities, its popularity makes it important for the
practitioner to understand its proper use and limitations. Capillary rheometers are used
primarily to determine the viscosity in the shear rate range of 5 to 1000 s 1− , although
very long capillaries have occasionally been used to extend the range to much lower
shear rates [32].
The capillary rheometer, however, has many of the elements required to simulate the
operation of the machines used in polymer processing. It is similar to the MFR
instrument, with a temperature-controlled barrel containing a piston that forces molten
polymer through a capillary die of fixed dimensions. In the capillary rheometer, however,
extrusion of the polymer is driven by a motor and screw or servo-hydraulic system. A
load cell on the piston or a pressure transducer in the rheometer barrel measures the
extrusion forces. The force necessary to produce flow (shear stress) and the rate of flow
(shear rate) are then used to calculate the viscosity or resistance to flow:
27
Viscosity, (η) = Shear Stress/Shear Rate
This rheometer is able to reproduce the deformation rates and forces at which polymer is
actually processed (many of the early extruders and injection molding machines used a
ram instead of a screw) and thus can simulate the conditions seen in a conversion process
[50].
Capillary viscosity measurements were made by a Galaxy V Capillary Rheometer (Model
8052; Kayeness Inc. : A Dynisco Company). The capillary size was 0.03 inch in
diameter and 1.2 inch in length (L/D = 40). The samples were dried in a vacuum oven at
temperature 120 0 C for two hours. The dry sample was charged into the heated barrel of
the capillary rheometer which was set at 270 0 C. Test was started after a 5 minute soak
time.
3.2.4 Scanning Electron Microscopy (SEM)
According to literature reports, particle characterization can be achieved using electron
spectroscopy for chemical analysis (ESCA), photon correlation spectroscopy (PCS), X-
ray diffraction, transmission electron microscopy (TEM), scanning electron microscopy
(SEM), and various other physical methods. Among all the techniques, SEM is the easiest
visual technique to obtain information about the average size, size distribution, and the
surface morphology of particles [53].
In the conventional scanning electron microscope (SEM), image contrast can be produced
either by variations in sample topography or by differences in chemical composition.
Secondary electron images, which are most commonly used in SEM analyses, are
generally dominated by topographical features and only weakly modulated by variations
in substrate composition. Although more sensitive to compositional variations,

28
corresponding backscattered images have been of less interest because of their poorer
quality and resolution. These deficiencies have only recently been overcome with
improved detection systems. Chemical contrast differences provide a viable and useful
means of characterizing multiphase polymer systems by scanning electron microscopy
[54].
Scanning Electron Microscopy (SEM) is a popular technique for assessing the structure
in a polymer blend. This method focuses an electron beam onto a surface, and the
emission of electrons from specimen is detected and amplified to obtain a image. The
resultant image is often viewed on a video monitor. SEM exhibits a relatively large depth
of fields, thus can show topological features better than other microscopy methods
(except perhaps atomic force microscopy). Staining and etching processes can be
employed to provide improved contrast. SEM is particularly useful for the observation of
fracture surfaces [55]. Ruthenium tetraoxide (RuO4) is a powerful oxidizing agent and
readily attacks a variety of functional groups and aromatic systems. Ruthenium would
appear to offer several practical advantages in that it is less volatile, less toxic, less
expensive, and more readily available than osmium [56].
The morphologies of the fractured surfaces of the blends were observed in a scanning
electron microscope (FESEM 1530, with EDX Pegasus 1200 integrated). The blend
specimens were cryo-fractured in liquid nitrogen to produce brittle surfaces, which were
then stained by RuO4 vapour. Ruthenium tetraoxide was obtained by reacting RuCl3 with
excess amount of NaIO4. RuO4 staining was employed in order to reveal more detail
information on the morphology at a better contrast under a SEM microscope. They were
then coated with a thin layer of gold prior to SEM observations. Both secondary electron
(SE) detector and reel backscattering electron (RBSE) detector were used in this study.
Three time durations were used for staining the samples. Those were: a) overnight

29
(around 14 hrs), b) 2 hrs, and c) 1 hr. Unstained samples were also prepared for
comparisons.
In this study, three different types of samples were used for SEM tests. Those were:
a) PC/PBT blend pellets,
b) PC/PBT blend sample, but collected after completing the rheological test in the
parallel plate rheometer, and
c) PC/PBT blend sample, but collected after completing the rheological test in the
capillary rheometer
These samples were obtained from the 2nd set experiments, run number 13 at a 10 minute
time interval.

30
Chapter 4
RESULTS AND DISCUSSION
PC/PBT blends were characterized in this study. Melt volume-flow rate (MVR) data were
measured by using an extrusion plastomer, rheological properties were obtained by using
parallel plate and capillary rheometers, and finally the morphology of PC/PBT blends
was observed by scanning electron microscopy (SEM). The results of melt volume-flow
rate for all of three set of experiments are presented in section 4.1 of this chapter. In
sections 4.2 and 4.3, the rheological properties of PC/PBT blends are discussed along
with the Cox-Merz rule validity. The morphology of PC/PBT blend pellets and samples
collected after testing in both parallel plate and capillary rheometers is finally discussed
in section 4.4 of this chapter.
4.1 Melt Volume-Flow Rate (MVR)
Polymer samples were collected as a function of time during all three sets of experiments.
The method for MVR measurements was described in chapter 3. All the MVR
measurements were carried out on an extrusion plastomer at SABIC Innovative Plastics
plant in Cobourg, ON. Each MVR measurement took around 20 minutes and results are
shown in Tables 4.1.1, 4.1.2 and 4.1.3.

31
Table 4.1.1 : Melt Volume Rate (MVR) measurement results for 1st set of experiments (where N
stands for the screw speed, Q for the volumetric flow rate, X1 for the weight fraction of PC and
X2 for the weight fraction of PBT).
* Missing sample indicated by --
Instantaneous Melt Volume Rate(MVR) measurements
Sampling time(minute) Run
No.
N
(rpm)
Q
(kg/
hr)
X1
(PC)
X2
(PBT) 0.5 1 1.5 2 2.5 3 3.5 4 9 14 19
1 410 425 0.61 0.39 15.4 14.2 15.8 14.8 18.7 17.2 17.4 16.8 16.8 17.2 17.2
2 451 434 0.66 0.34 16.9 16.7 13.8 15.4 15.6 14.9 15.6 15.6 15.0 *-- 12.4
3 451 383 0.61 0.39 18.2 19.5 17.9 18.9 18.6 18.8 19.4 19.1 20.0 20.9 20.7
4 410 425 0.61 0.39 17.2 16.4 16.3 16.1 15.8 16.2 16.6 16.3 15.8 15.7 16.3
5 369 383 0.61 0.39 16.5 16.7 17.0 15.9 16.4 16.1 16.1 16.1 16.3 17.5 16.3
6 410 425 0.61 0.39 16.8 16.4 16.2 16.8 15.4 16.0 15.6 15.4 18.2 18.5 17.2
7 369 434 0.66 0.34 15.9 15.9 16.5 16.0 15.0 14.7 15.0 14.5 13.3 13.4 13.2
8 451 468 0.61 0.39 17.8 18.1 16.8 16.3 17.1 17.0 16.5 16.4 16.8 15.7 17.6
9 410 425 0.61 0.39 14.5 15.4 15.2 15.8 15.8 16.2 13.9 16.3 17.4 16.8 17.1
10 451 416 0.56 0.44 20.6 21.3 21.6 20.7 21.0 20.6 21.8 22.4 21.0 20.3 21.4
11 410 468 0.61 0.39 15.3 15.7 16.6 16.3 19.8 16.4 15.6 15.2 15.2 -- --
12 369 416 0.56 0.44 16.9 16.0 16.6 16.4 16.9 16.9 17.3 17.2 17.4 -- --
13 410 425 0.61 0.39 16.8 17.2 16.8 17.1 17.6 17.8 18.3 17.4 17.4 18.0 17.7

32
Table 4.1.2: Melt Volume Rate (MVR) measurement results for 2nd set of experiments (where N is the
screw speed, Q is the volumetric flow rate, X1 is the weight fraction of PC and X2 is the weight
fraction of PBT).
Instantaneous Melt Volume Rate(MVR) measurements
Sampling time(minute) Run
No.
N
(rpm)
Q
(kg/
hr)
X1
(PC)
X2
(PBT) 0.5 1.0 1.5 2.0 2.5 3.0 3.5 4.0 6.0 8.0 10 15
1 410 425 0.61 0.39 16.2 17.7 18.7 18.2 18.7 20.5 19.4 18.0 16.8 18.5 15.3 18.6
2 451 456 0.66 0.34 17.4 15.6 18.4 17.0 19.9 20.1 19.0 19.0 20.4 19.3 20.7 19.5
3 451 383 0.61 0.39 21.7 23.0 23.4 26.3 26.0 25.5 24.5 25.0 24.8 24.3 25.4 23.8
4 410 425 0.61 0.39 18.5 19.1 19.0 18.7 18.6 18.8 18.8 19.1 19.2 19.3 20.1 19.2
5 369 383 0.61 0.39 17.9 19.5 18.9 19.0 18.7 18.8 19.1 20.0 18.2 19.2 19.5 17.9
6 410 425 0.61 0.39 16.7 18.2 19.0 18.8 19.3 19.8 18.6 18.9 19.3 19.1 19.4 19.8
7 390 434 0.66 0.34 17.9 16.9 16.5 18.6 17.5 17.5 17.5 16.2 16.9 17.4 16.4 17.3
8 451 468 0.61 0.39 20.5 20.5 20.4 20.6 20.9 20.1 20.3 20.5 20.9 20.4 21.0 20.1
9 410 425 0.61 0.39 19.2 19.3 19.6 18.6 19.4 20.3 19.3 20.5 20.2 20.7 21.2 20.3
10 451 416 0.56 0.44 25.8 25.0 25.3 25.0 25.0 24.9 25.9 25.0 25.9 24.0 25.7 26.4
11 451 468 0.61 0.39 19.5 20.5 20.6 21.0 20.9 20.9 20.0 23.0 19.8 20.0 20.5 20.4
12 369 416 0.56 0.44 20.5 20.2 20.3 19.8 20.4 20.1 21.5 20.8 19.7 19.6 19.5 20.5
13 410 425 0.61 0.39 18.3 19.6 20.0 20.0 20.1 20.3 20.9 20.6 21.1 21.0 20.2 20.8

33
Table 4.1.3 : Melt Volume Rate (MVR) measurement results for 3rd set of experiments (where Q is
the total flow rate, N is screw speed, QPC is the total flow rate of PC, QPBT is flow rate of PBT, F1
means feeder1, and F2 means feeder2 ).
Instantaneous Melt
Volume -Flow Rate
(MVR) measurements
Sampling time(minute)
Run
No.
Q
(kg/h
r)
N
(rpm)
QPC
(kg/hr)
F1
QPBT
(kg/hr)
F2
XPC
in
F1
XPBT
in
F2
XPC1
in
F1
XPC2
in
F1
1.0 5.0 10 15
1 425 410 259.25 165.75 0.61 0.39 0.428 0.389 19.2 20.3 19.6 20.5
2 425 410 259.25 165.75 0.61 0.39 0.428 0.389 19.2 21.7 20.6 20.0
3 425 410 259.25 165.75 0.61 0.39 0.478 0.339 18.9 19.2 19.4 19.4
4 425 410 259.25 165.75 0.61 0.39 0.378 0.439 18.6 18.4 19.0 18.6
5 425 410 259.25 165.75 0.61 0.39 0.428 0.389 20.6 18.8 18.6 18.9
6 425 410 259.25 165.75 0.61 0.39 0.428 0.389 21.1 19.6 18.9 19.2
7 425 410 259.25 165.75 0.61 0.39 0.328 0.489 20.1 19.3 18.8 18.9
8 425 410 259.25 165.75 0.61 0.39 0.528 0.289 18.1 18.4 17.6 18.0
9 425 410 259.25 165.75 0.61 0.39 0.428 0.389 20.9 20.3 21.3 20.9

34
In order to assess the measurement error, some melt volume-flow rate (MVR)
measurements were randomly repeated under identical conditions. Results of the
replicated measurements with the average value are shown in Tables 4.1.4, 4.1.5 and
4.1.6.
Table 4.1.4 : Replicate MVR measurements for 1st set of experiments
Table 4.1.5. : Replicate MVR measurements for 2nd set of experiments
Run No.
Sampling time (min)
MVR Measurement
Replicate MVR Measurement
Average
1 10 15.3 14.2 14.8 2 10 20.7 19.7 20.2 3 10 25.4 24.5 25.0 4 10 20.1 20.2 20.2 5 10 19.5 20 19.8 6 10 19.4 19.3 19.4 7 10 16.4 16.6 16.5 8 10 21 20.8 20.9 9 10 21.2 20.5 20.9
10 10 25.7 25.9 25.8 11 10 20.5 20.7 20.6 12 10 19.5 19.3 19.4 13 10 20.2 19.9 20.1
Run No.
Sampling time (min)
MVR Measurement
Replicate MVR Measurement
Average
1 19 17.2 17.3 17.3 5 19 16.3 16.6 16.5
10 19 21.4 22.5 22.0 13 19 17.7 17.7 17.7
35
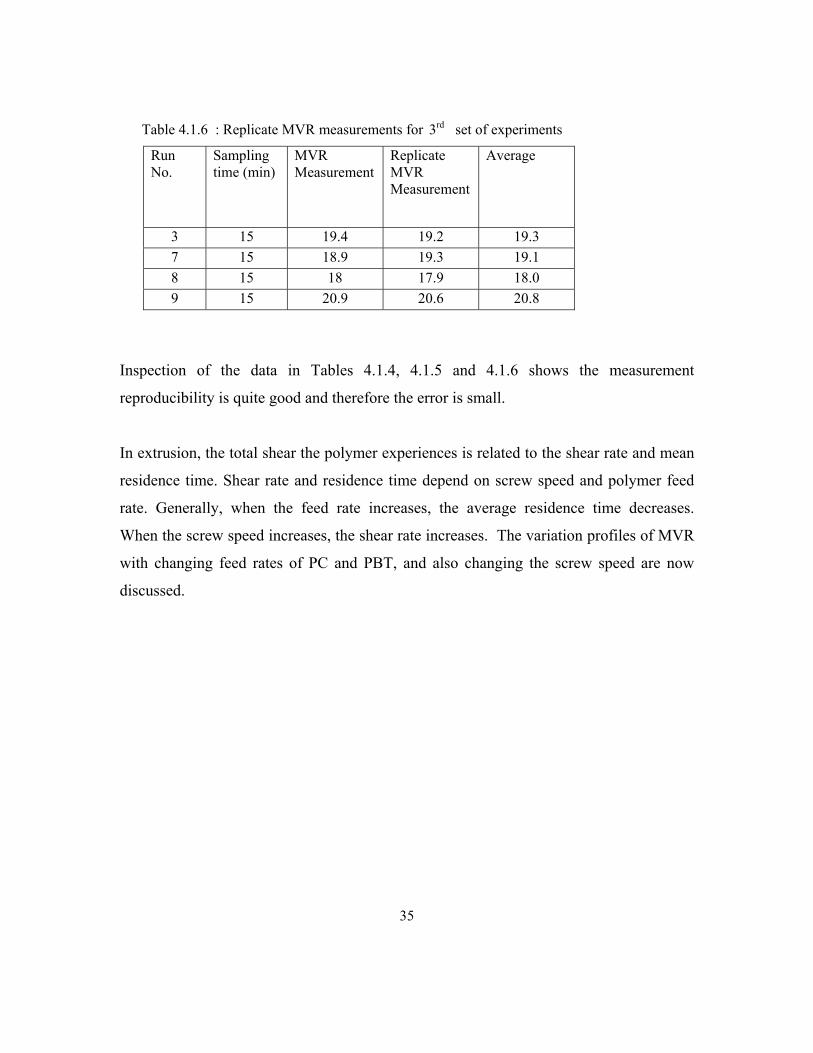
Table 4.1.6 : Replicate MVR measurements for 3rd set of experiments
Run No.
Sampling time (min)
MVR Measurement
Replicate MVR Measurement
Average
3 15 19.4 19.2 19.3 7 15 18.9 19.3 19.1 8 15 18 17.9 18.0 9 15 20.9 20.6 20.8
Inspection of the data in Tables 4.1.4, 4.1.5 and 4.1.6 shows the measurement
reproducibility is quite good and therefore the error is small.
In extrusion, the total shear the polymer experiences is related to the shear rate and mean
residence time. Shear rate and residence time depend on screw speed and polymer feed
rate. Generally, when the feed rate increases, the average residence time decreases.
When the screw speed increases, the shear rate increases. The variation profiles of MVR
with changing feed rates of PC and PBT, and also changing the screw speed are now
discussed.
36
15
16
17
18
19
20
21
22
0 2 4 6 8 10 12 14 16 18 20
Different sampling time(min)
MV
R
Run3Run5
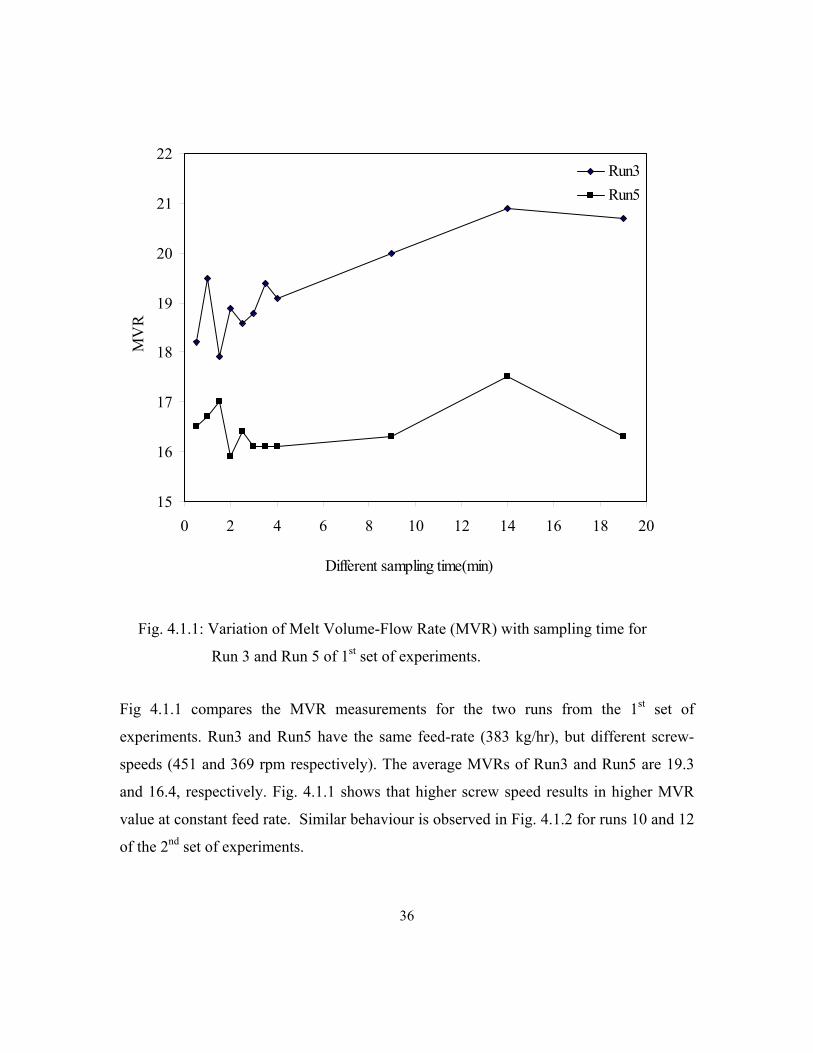
Fig. 4.1.1: Variation of Melt Volume-Flow Rate (MVR) with sampling time for
Run 3 and Run 5 of 1st set of experiments.
Fig 4.1.1 compares the MVR measurements for the two runs from the 1st set of
experiments. Run3 and Run5 have the same feed-rate (383 kg/hr), but different screw-
speeds (451 and 369 rpm respectively). The average MVRs of Run3 and Run5 are 19.3
and 16.4, respectively. Fig. 4.1.1 shows that higher screw speed results in higher MVR
value at constant feed rate. Similar behaviour is observed in Fig. 4.1.2 for runs 10 and 12
of the 2nd set of experiments.

37
18
19
20
21
22
23
24
25
26
27
0 2 4 6 8 10 12 14 16
Different sampling time(min)
MV
R
Run10Run12
Fig. 4.1.2: Variation of Melt Volume-Flow Rate (MVR) with sampling time for
Run 10 and Run 12 of 2nd set of experiments.
Run10 and Run12 have the same feed-rate (416 kg/hr), but different screw-speeds (451
and 369 rpm, respectively). The higher screw-speed again results in higher MVR. The
average MVRs of Run10 and Run12 are 25.3 and 20.2, respectively.

38
15
16
17
18
19
20
21
22
0 2 4 6 8 10 12 14 16 18 20
Different sampling time(min)
MV
R
Run3Run8
Fig. 4.1.3: Variation of Melt Volume-Flow Rate (MVR) with sampling time for
Run 8 and Run 5 of 1st set of experiments.
The effect of feed rate at constant screw speed is highlighted in Fig 4.1.3. Run 3 and Run
8 have the same screw-speed (451 rpm), but different feed-rates (383 and 468 kg/hr,
respectively). Increased flow rate results in lower residence time that leads to reduced
MVR. The average MVR of Run 3 and Run 8 are 19.3 and 16.9, respectively. The same
trends are shown in Fig. 4.1.4. In this figure, Run 5 and Run 12 have the same

39
17
18
19
20
21
22
0 2 4 6 8 10 12 14 16
Diffrent sampling time(min)
MV
R
Run12Run5
Fig. 4.1.4: Variation of Melt Volume-Flow Rate (MVR) with sampling time
for Run 8 and Run 5 of 2nd set of experiments.
screw-speed (369 rpm), but different feed-rate (383 and 416 kg/hr, respectively). The
average MVR of Run5 and Run12 are 18.9 and 20.2 respectively.

40
For all the centre points runs (i.e., run numbers 1, 4, 6, 9 and 13) of 1st and 2nd set of
experiments screw speed, feed rate and composition of PC and PBT are the same. Tables
4.1.7 and 4.1.8 show average MVR values for the 1st and 2nd set of experiments,
respectively. In these experiments, the screw speed, feed rate and composition of PC
were 410 rpm, 425 kg/hr and 0.61, respectively. Figures 4.1.5 and 4.1.6 show variations
of MVR with sampling times for the centre points runs. Although all the runs had the
same variable levels, these figures show different MVR. This difference in MVR can be
attributed to different levels of degradation due to different dies used in these
experiments [57]. The die used in the second set of experiments was more restrictive
resulting in higher degree of fill in the extruder, thus leading to more shearing and
degradation. Finally, the MVR measurements show that the time interval from 0 to 5
minutes is transient.

41
Table 4.1.7: Average MVR of Run 1, 4, 6, 9 and 13 of 1st set of experiments
Run No.
Average MVR
1 16.5 4 16.2 6 16.6 9 15.9 13 17.4
12
14
16
18
20
0 5 10 15 20
Different sampling time(min)
MV
R
Run1Run4Run9Run13Run6
Fig. 4.1.5: Variation of Melt Volume-Flow Rate (MVR) with sampling time for
Runs 1, 4, 6, 9 and 13 (centre points) of 1st set of experiments

42
Table 4.1.8: Average MVR of Run 1, 4, 6, 9 and 13 of 2nd set of experiments
Run No.
Average
1 18.1 4 19.0 6 18.9 9 19.9 13 20.2
12
13
14
15
16
17
18
19
20
0 5 10 15 20
Different sampling time(min)
MV
R
Run1Run4Run9Run13Run6
Fig. 4.1.6: Variation of Melt Volume-Flow Rate (MVR) with sampling time of Runs
1, 4, 6, 9 and 13 (centre points) of 2nd set of experiments

43
4.1.1 Statistical Analysis Analysis of variance (ANOVA) of the 1st and 2nd set of experiments was done in this
section. It was already mentioned in section 3.1 that both of these set of experiments were
conducted using 2 3 factorial design of experiments and due to machine operating
limitations, some of the combinations of the levels were not feasible and were adjusted to
practical levels of the factors studied. These amended combinations are specified with
bold red color numbers in Tables 3.1 and 3.2 in Chapter 3.
4.1.1.1 Variance Analysis
Table 4.1.9: Analysis of variance (ANOVA) for 1st set of experiments
ANOVA; Var.:MVR; R-sqr=.92288
3 factors, 1 Blocks, 13 Runs; MS Residual=.4354181
Factor SS df MS F p-value
N(rpm) 8.71360 1 8.71360 20.01203 0.00422
QPC(kg/hr) 13.19721 1 13.19721 30.30928 0.00150
QPBT(kg/hr) 3.26684 1 3.26684 7.50276 0.033775
N by QPC
Interaction
4.85132 1 4.85132 11.14175 0.01565
N by QPBT
Interaction
0.39655 1 0.39655 0.91073 0.37677
QPC by QPBT
Interaction
0.02901 1 0.02901 0.06662 0.80494
Error 2.61251 6 0.43542
Total SS 33.87692 12
Where, SS = Sum of squares, df = Degrees of freedom, MS = Mean squares, F = Variance ratio,
p = Probability

44
Table 4.1.9 shows that the melt volume-flow rate (MVR) of 1st of experiments is
significantly affected by the screw speed (N), flow rate of PC (QPC) and PBT (QPBT), and
interaction between screw speed (N) and flow rate of PC (QPC).
Table 4.1.10: Analysis of variance (ANOVA) for 2nd set of experiments
ANOVA; Var.:MVR; R-sqr=.92288
3 factors, 1 Blocks, 13 Runs; MS Residual=.4354181
Factor SS df MS F p-value
N(rpm) 20.08822 1 20.08822 21.25202 0.00365
QPC(kg/hr) 20.87503 1 20.87503 22.08441 0.00332
QPBT(kg/hr) 0.00167 1 0.00167 0.00177 0.96780
N by QPC
Interaction
0.01039 1 0.01039 0.01099 0.91993
N by QPBT
Interaction
0.16812 1 0.16812 0.17786 0.68790
QPC by QPBT
Interaction
0.76881 1 0.76881 0.81335 0.40188
Error 5.67143 6 0.94524
Total SS 64.74769 12
Table 4.1.10 shows that the melt volume-flow rate (MVR) of 2nd set of experiments is
significantly affected by the main factors being screw speed (N) and flow rate of PC
(QPC), and interaction between flow rate of PC(QPC) and PBT (QPBT).

45
4.1.1.2 Effect of Different Factors by Variance Analysis
Table 4.1.11: Effect Estimations by analysis of variance (ANOVA) for 1st set of experiments
Effect Estimates; Var.:MVR; R-sqr=.92288; 3 factors, 1 Blocks, 13 Runs;
MS Residual=.4354181
Factor
Effect Std.
Err.
t(6) p-
value
-95.%
Cnf.Limt
+95.%
Cnf.Limt
Coeff Std.Err.
Coeff.
-95.%
Cnf.Limt
+95.%
Cnf.Limt
Mean/
Interc.
16.89 0.18 92.21 0.000 16.44 17.34 16.89 0.18 16.44 17.34
N(rpm) 2.09 0.47 4.47 0.004 0.95 3.23 1.04 0.23 0.47 1.61
QPC
(kg /hr)
-2.53 0.46 -5.51 0.002 -3.66 -1.41 -1.27 0.23 -1.83 -0.70
QPBT
(kg/hr)
1.24 0.45 2.74 0.034 0.13 2.34 0.62 0.23 0.07 1.17
N by QPC
Interaction
-1.54 0.46 -3.34 0.016 -2.66 -0.41 -0.77 0.23 -1.33 -0.20
N by QPBT
Interaction
0.43 0.45 0.95 0.377 -0.67 1.53 0.22 0.23 -0.34 0.77
QPC by
QPBT
Interaction
0.11 0.44 0.26 0.805 -0.97 1.20 0.06 0.22 -0.49 0.60
From Table 4.1.11, ANOVA describes the relation between MVR and main factors and interaction
effect for the 1st set of experiments as follows:
MVR = 16.89 + 2.09×N – 2.53× QPC + 1.24× QPBT -1.54×N× QPC
The above equation shows that MVR increases with increasing N and QPBT, and reverses with the
value of QPC and interaction of N × QPC. This is expected since: (i) increasing N increases shear
rate and may lead to increased degradation that results in reduced viscosity and therefore increased

46
MVR, (ii) PC is the high molecular weight component, so increasing its flow rate will decrease
MVR and (iii) PBT is the low molecular weight component, so increasing its flow rate will
increase MVR. This agrees with the results of Figs. 4.1.1 and 4.1.2 where the MVR increases as
screw speed increases.
Table 4.1.12 Effect Estimations by analysis of variance (ANOVA) for 2nd set of experiments
Effect Estimates; Var.:MVR; R-sqr=.92288; 3 factors, 1 Blocks, 13 Runs;
MS Residual=.4354181
Factor Effect Std.
Err.
t(6) p-
value
-95.%
Cnf.Limt
+95.%
Cnf.Limt
Coeff Std.Err.
Coeff.
-95.%
Cnf.Limt
+95.%
Cnf.Limt
Mean/
Interc.
19.05 0.41 47.02 0.000 18.05 20.04 19.05 0.41 18.05 20.04
N(rpm) 5.49 1.19 4.61 0.004 2.58 8.41 2.75 0.60 1.29 4.20
QPC
(kg /hr)
-5.77 1.23 -4.70 0.003 -8.78 -2.77 -2.89 0.61 -4.39 -1.38
QPBT
(kg/hr)
0.04 1.04 0.04 0.967 -2.51 2.60 0.02 0.52 -1.25 1.30
N by QPC
Interaction
0.13 1.24 0.10 0.920 -2.91 3.17 0.07 0.62 -1.46 1.59
N by QPBT
Interaction
0.40 0.95 0.42 0.688 -1.93 2.74 0.20 0.48 -0.97 1.37
QPC by QPBT
Interaction
-1.02 1.13 -0.90 0.401 -3.78 1.74 -0.51 0.56 -1.89 0.87
From Table 4.1.12, ANOVA describes the relation between MVR and main factors and interaction
effect for the 2nd set of experiments as follows:
MVR = 19.05 + 5.49×N – 5.77×QPC -1.02× QPC × QPBT
It shows that the melt volume-flow rate (MVR) is significantly affected by screw speed (N), flow
rate of PC(QPC); and interaction of PC(QPC) and PBT(QPBT).

47
4.1.1.3 Comparison of Predicted and Observed Values
For the 1st set of experiments, variations of predicted values with observed values are
shown in Fig. 4.1.7. It is demonstrated that a linear relationship exists between predicted
and observed values of MVR, and five centre points are parallel to X-axis. Same
behavior for the 2nd set of experiments is shown in Fig.4.1.8.
Observed vs. Predicted Values3 factors, 1 Blocks, 13 Runs; MS Residual=.4354181
DV: MVR
14 15 16 17 18 19 20 21 22
Observed Values
14
15
16
17
18
19
20
21
22
Pre
dict
ed V
alue
s
Fig. 4.1.7: Variation of predicted values with observed values of MVR for 1st set of experiments

48
Observed vs. Predicted Values3 factors, 1 Blocks, 13 Runs; MS Residual=.9452381
DV: MVR
16 17 18 19 20 21 22 23 24 25 26 27
Observed Values
15
16
17
18
19
20
21
22
23
24
25
26
27
Pre
dict
ed V
alue
s
Fig. 4.1.8: Variation of predicted values with observed values of MVR for 2nd set of experiments

49
4.1.1.4 Three-Dimensional Response Surface Plot with Main Effects
The response surface is shown graphically in Figs. 4.1.9 and 4.1.10 for the 1st set of experiments.
Both figures indicate that MVR increases as PBT flow rate increases and PC flow rate decreases.
MVR values are significantly affected by the higher value of screw speed (N) than the lower
Fitted Surface; Variable: MVR3 factors, 1 Blocks, 13 Runs; MS Residual=.4354181
DV: MVR
> 16 < 15.75 < 14.75
Fig. 4.1.9 : Three-dimensional response surface plot showing main effects of the two factors PC flow
rate and PBT flow rate with the lowest screw-speed (N) 369 rpm on MVR of 1st set of
experiments

50
value of screw speed (N) with different flow rate of PC and PBT. In Fig. 4.1.9, five centre points are
shown in the middle of the response surface. Same trends are shown in Figs. 4.1.11 and 4.1.12 for the
2nd set of experiments.
Fitted Surface; Variable: MVR3 factors, 1 Blocks, 13 Runs; MS Residual=.4354181
DV: MVR
> 21 < 20.5 < 19.5 < 18.5 < 17.5 < 16.5 < 15.5 < 14.5
Fig. 4.1.10 : Three-dimensional response surface plot showing main effects of the two factors PC flow
rate and PBT flow rate with the highest screw-speed (N) 451 rpm on MVR of 1st set of
experiments

51
Fitted Surface; Variable: MVR3 factors, 1 Blocks, 13 Runs; MS Residual=.9452381
DV: MVR
> 18 < 18 < 16 < 14 < 12
Fig. 4.1.11 : Three-dimensional response surface plot showing main effects of the two factors PC flow
rate and PBT flow rate with the lowest screw-speed (N) 369 rpm on MVR of 2nd sets of
experiments
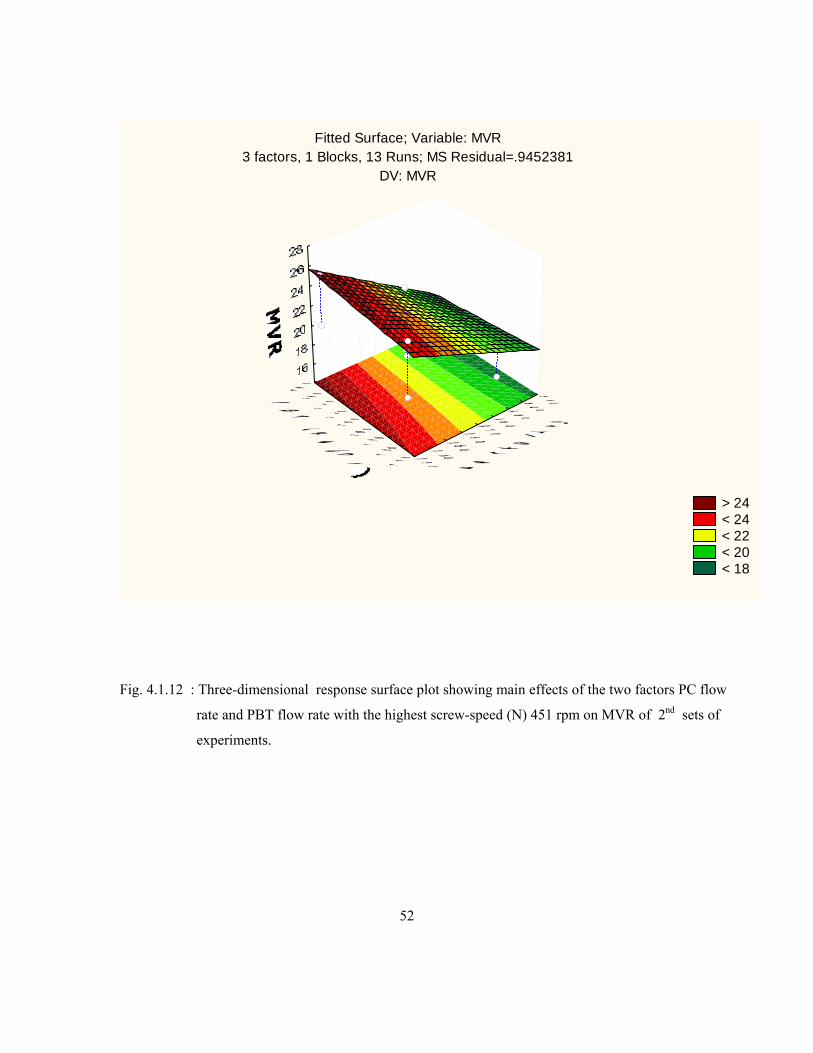
52
Fitted Surface; Variable: MVR3 factors, 1 Blocks, 13 Runs; MS Residual=.9452381
DV: MVR
> 24 < 24 < 22 < 20 < 18
Fig. 4.1.12 : Three-dimensional response surface plot showing main effects of the two factors PC flow
rate and PBT flow rate with the highest screw-speed (N) 451 rpm on MVR of 2nd sets of
experiments.

53
4.2 Dynamic Rheological Properties from Parallel Plate Rheometer In dynamic rheometer testing, measurements were done on the last sample of each run for all
three sets of experiments. That means using the sample obtained at sampling time of 19
minute of each run in the 1st set of experiments and sampling time of 15 minutes for both the
2nd and 3rd set of experiments.
As mentioned in chapter 3, the TA Rheometer (AR 2000) was used to measure the dynamic
viscoelastic properties including storage modulus (G’) and loss modulus (G”) of PC/PBT
blends. Fig.4.2.1 presents the typical response of storage modulus (G') and loss modulus (G")
100
1000
10000
100000
0.01 0.1 1 10 100 1000
Angular Frequency(rad/s)
Stor
age
Mod
ulus
, G' (
Pa)
100
1000
10000
100000
Loss
Mod
ulus
, G" (
Pa)
G'G"
Fig. 4.2.1: Typical dynamic response behavior of PC/PBT blends
of 1st set of experiments of Run1.
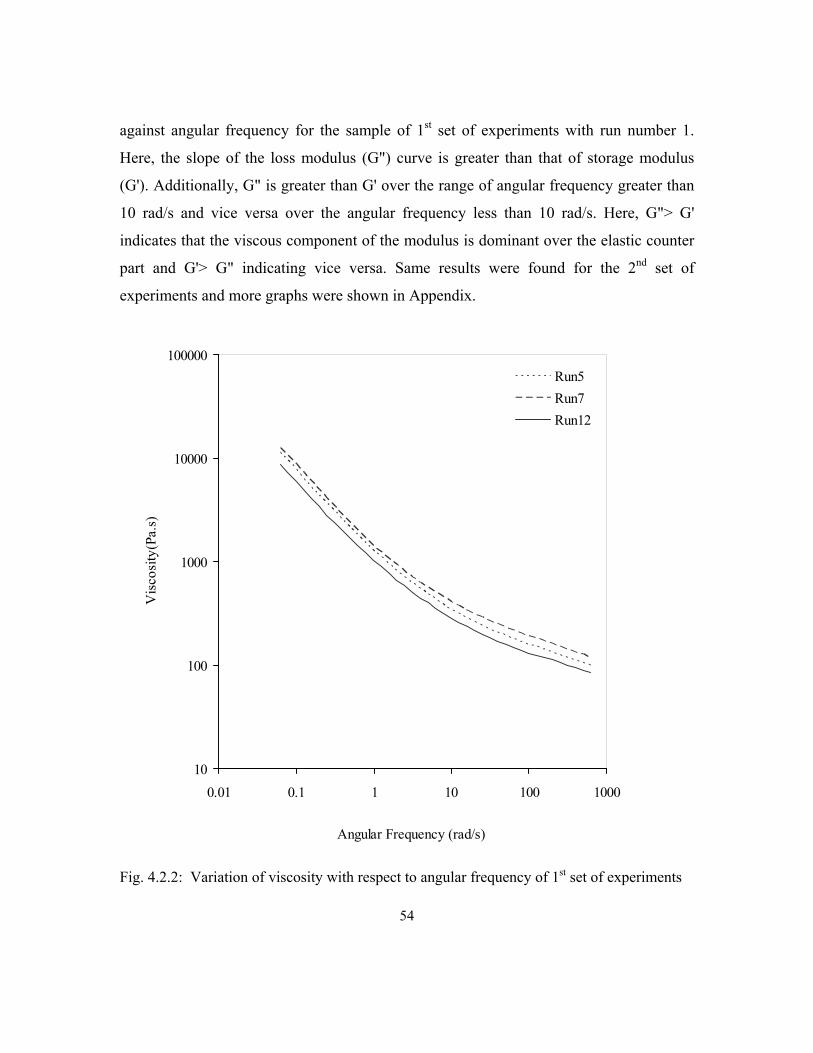
54
against angular frequency for the sample of 1st set of experiments with run number 1.
Here, the slope of the loss modulus (G") curve is greater than that of storage modulus
(G'). Additionally, G" is greater than G' over the range of angular frequency greater than
10 rad/s and vice versa over the angular frequency less than 10 rad/s. Here, G"> G'
indicates that the viscous component of the modulus is dominant over the elastic counter
part and G'> G" indicating vice versa. Same results were found for the 2nd set of
experiments and more graphs were shown in Appendix.
10
100
1000
10000
100000
0.01 0.1 1 10 100 1000
Angular Frequency (rad/s)
Vis
cosi
ty(P
a.s)
Run5Run7Run12
Fig. 4.2.2: Variation of viscosity with respect to angular frequency of 1st set of experiments

55
Fig. 4.2.2 shows the variation of viscosity with angular frequency for runs 5, 7 and 12 of
the 1st set of experiments. Here, the compositions of PC in run numbers 5, 7 and 12 were
0.61, 0.66 and 0.56, respectively. From Fig. 4.2.2, it is clear that the viscosity increases
with increasing concentration of PC. Also, similar behavior is observed when loss
modulus versus storage modulus is compared in Fig.4.2.3.
100
1000
10000
100000
100 1000 10000 100000
Storage modulus, G' (Pa)
Loss
mod
ulus
, G"(
Pa)
Run5Run7Run12
Fig. 4.2.3: Loss modulus versus storage modulus of PC/PBT
blends of 1st set of experiments.

56
10
100
1000
10000
100000
0.01 0.1 1 10 100 1000
Angular Frequency(rad/s)
Vis
cosi
ty(P
a.s)
Run3
Run11
Fig. 4.2.4: Change of viscosity with respect to angular frequency of
PC/PBT blends of 2nd set of experiments.
In this study, the viscosity depends on mainly the composition of PC rather than the variation
of screw speed and flow rate. Fig. 4.2.4 demonstrates the variation of viscosity with angular
frequency for runs 3 and 11 of the 2nd set of experiments. In these two runs, the compositions

57
of PC (0.61) and PBT (0.39) were the same, but the screw speed and total flow rate were 451
and 410 rpm, and 383 and 468 kg/hr, respectively. It can be seen that both curves are
superimposed with each other. This means that the viscosity of polymer blends depends on
composition of PC rather than screw speed and feed rate.
10
100
1000
10000
100000
0.01 0.1 1 10 100 1000Angular Frequency(rad/s)
Vis
cosi
ty(P
a.s)
Run3Run8
Fig. 4.2.5: Variation of viscosity with respect to angular frequency of
PC/PBT blends of 1st set of experiments of Run3 and Run8.
Fig. 4.2.5 represents the variation of viscosity with angular frequency for runs 3 and 8 of
the 1st set of experiments. In this two runs, the screw speed was maintained the same at
451 rpm, and also the composition of PC was 0.61 for both runs. The feed rates for runs 3

58
and 8 were 383 and 468 kg/hr, respectively. The viscosity curves were superimposed
which indicates that the viscosity of the polymer blend does not depend on flow rate.
10
100
1000
10000
100000
0.01 0.1 1 10 100 1000
Angular Frequency(rad/s)
Vis
cosi
ty(P
a.s)
Run5Run12
Fig. 4.2.6: Variation of viscosity with change of angular frequency
of PC/PBT blends of 2nd set of experiments.
Fig. 4.2.6 shows the variation of viscosity with angular frequency for runs 5 and 12 of the
2nd set of experiments. In these two runs, the screw speed was maintained the same at

59
369 rpm, but the composition of PC was 0.61 and 0.56 for run 5 and 12, respectively.
Also the feed rates for runs 5 and 12 were 383 and 416 kg/hr, respectively. The results
show that composition of PC affects the viscosity.
10
100
1000
10000
100000
0.01 0.1 1 10 100 1000
Angular Frequency (rad/s)
Vis
cosi
ty (P
a.s)
Run1
Run4
Run6
Run9
Run13
Fig. 4.2.7: Viscosity changes with variation of angular frequency
of PC/PBT blends of 1st set of experiments.
The screw speed, feed rates and the composition PC for runs 1, 4, 6, 9 and 13 (centre
points) of 1st and 2nd set of experiments were the same. Though all the runs had the same

60
variable levels, both figures 4.2.7 and 4.2.8 show different viscosity in different runs in
each set of experiments. This is due to the different dies used in these sets of experiments
as discussed earlier. In Figs. 4.2.7 and 4.2.8, it is shown that the viscosity values of all
runs remain very close when angular frequency value is less than 1.00 rad/s and that the
viscosity starts to deviate for angular frequency greater than 1.00 rad/s.
10
100
1000
10000
100000
0.01 0.1 1 10 100 1000
Angular Frequency (rad/s)
Vis
cosi
ty (P
a.s)
Run1Run4Run6Run9Run13
Fig. 4.2.8: Viscosity changes with variation of angular frequency
of PC/PBT blends of 2nd set of experiments.

61
10
100
1000
1 10 100 1000
Angular Frequency (rad/s)
Vis
cosi
ty(P
a.s)
Run7Run8Run3
Fig. 4.2.9 : Dynamic response behavior of PC/PBT blends
of 3rd set of experiments
Fig. 4.2.9 shows the viscosity with angular frequency for runs 3, 7 and 8 of the 3rd set of
experiments. In the 3rd set of experiments, all nine runs were maintained at the same
screw speeds (410 rpm) and total feed rates (425 kg/hr). The compositions of PC and
PBT were also the same in all runs. But two types of PC were used. Compositions of PC1

62
in Run 3, 7 and 8 were 0.478, 0.328 and 0.528, respectively. Also compositions of PC2 in
Run 3, 7 and 8 were 0.339, 0.489 and 0.289. From Fig. 4.2.9, it is shown that the
concentration of the more viscous PC2 affects the viscosity of the blend.
4.3 Rheological Properties from Capillary Rheometer
The complex viscosity when plotted versus angular frequency, often superposes with
steady-shear viscosity as a function of the shear rate. This is known as the Cox-Merz rule,
and it provides information about a nonlinear property from a measurement of a linear
property. An attempt to apply the Cox-Merz relationship to the oscillatory viscosity and
capillary viscosity was not successful in these measurements.
The measurement procedure of steady-state shear viscosity, angular frequency, moduli
and other related factors was described in chapter 3, section 3.2. Samples were used from
both the 2nd and 3rd set of experiments and those were the last samples from each run in
this study.

63
10
100
1000
10000
1 10 100 1000 10000
Angular Frequency / Shear Rate (1/s)
Com
plex
Visc
osity
/ St
eady
-sta
te S
hear
Visc
osity
(Pa.
s)
DynamicCapillary
Fig. 4.3.1: Complex Viscosity / Steady-shear Viscosity as a function of Angular
Frequency / Shear Rate for run number 6 of the 2nd set of experiments.
Fig.4.3.1 shows, complex viscosity / steady-shear viscosity (Pa.s) versus angular
frequency / shear rate (1/s) curves of run number 6 with sampling time 15 minutes in the
2nd set of experiments. It is shown that the Cox-Merz rule is not obeyed (viz, curves do
not superimpose) in PC/PBT blend case. This was repeated for other samples of the same
set of experiments. Fig. 4.3.2 shows, complex viscosity / steady-shear viscosity (Pa.s)
versus angular frequency / shear rate (1/s) curves of run number 13 with sampling time

64
15 minutes in the 2nd set of experiments. This run also shows the same trend. Samples
from the 3rd set of experiments were checked as well.
10
100
1000
10000
100000
1 10 100 1000 10000
Angular Frequency / Shear Rate (1/s)
Com
plex
Vis
cosi
ty /
Stea
dy-s
tate
She
ar V
isco
sity
(Pa.
s)
Dynamic
Capillary
Fig. 4.3.2: Complex Viscosity /Steady-shear Viscosity as a function of Angular
Frequency /Shear Rate for run number 13 of the 2nd set of experiments.
Fig.4.3.3 shows the curves of complex viscosity / steady-shear viscosity (Pa.s) versus
angular frequency / shear rate (1/s) for run number 3 of the 3rd set of experiments with
sampling time 15 minute. The results are similar. Also Fig. 4.3.4 represents the curves for run

65
10
100
1000
10000
100000
1 10 100 1000 10000
Angular Frequency / Shear Rate(1/s)
Com
plex
Vis
cosi
ty /
Stea
dy-s
tate
She
ar V
isco
sity
(Pa.
s)""
"DynamicCapillary
Fig. 4.3.3: Complex Viscosity /Steady-shear Viscosity as a function of Angular
Frequency /Shear Rate of run number 3 of 3rd set of experiments.
number 8 of the 3rd set of experiment and the curves did not superpose. So, it is
postulated that the Cox-Merz rule is not obeyed for the compounding of PC/PBT.
Schulken et al. [58] suggested that polymers composed of very stiff rod like molecules
may not give agreement in comparing steady state shear rate with dynamic frequency.
Also, Hsieh et. al [59] concluded that the Cox Merz rule is found not to be obeyed by all
the polymers studied. As pointed out by Booij et al. [60], the Cox-Merz rule is not
applicable to strongly nonlinear melts. Therefore, it is not surprising that the curves do
not superimpose and Cox-Merz rule is not properly obeyed in PC/PBT blends. It is noted

66
that more curves for complex viscosity / steady-shear viscosity as a function of angular
frequency / Shear Rate were shown in Appendix of this thesis.
10
100
1000
10000
100000
1 10 100 1000 10000
Angular frequency/ Shear rate(1/s)
Com
plex
vis
cosi
ty /
Stea
dy-s
tate
She
ar v
isco
sity
(Pa.
s)
DynamicCapillary
Fig. 4.3.4: Complex Viscosity /Steady-shear Viscosity as a function of Angular
Frequency /Shear Rate of run number 8 of the 3rd set of experiments.

67
4.4 Scanning Electron Microscopy (SEM) Results
Changes in the morphology of PC/PBT blends were studied under a scanning electron
microscopy (SEM). The SEM experimental procedure was described in chapter 3 and
samples were used from the 2nd set of experiments of run number 13 at 10 minute time
intervals. Both stained and unstained samples were used to compare the SEM
photographs. Images from the Reel Back-Scattering Electron (RBSE) detector and
Secondary Electron (SE) detector were taken for the element and topological contrast.
The morphology depends strongly on composition, with bi-continuous morphologies
usually observed at near critical composition, where PC and PBT can dissolve in each
other in their blend [4]. Wu at el. [61] postulated that a 50/50 (PC/PBT) blend possessed
a bicontinuous structure and the other blends had a dispersed phase of either PBT or PC
depending on which was the minor component. In this study, PBT was the minor
component and a dispersed phase of PBT in PC was found. It is noted that sample’s
compositions of PC and PBT were 61% and 39%, respectively.
Fig. 4.4.1 shows unstained samples and there is no significant difference in morphology
of all three (a), (b) and (c) SEM micrographs.

68
0.1 µm
0.1 µm
0.1 µm
(a)Pellets
(b)
(c)Capillary Rheometer
ParallelPlateRheometer
Fig. 4.4.1 : SEM micrographs of unstained samples
Fig. 4.4.2 also shows the images of unstained samples and there was some difference
between the morphology of pellets and samples collected after completing the tests both
in parallel and capillary rheometers. The samples collected after completing the test in
parallel and capillary rheometers may have degraded. After completing the tests in
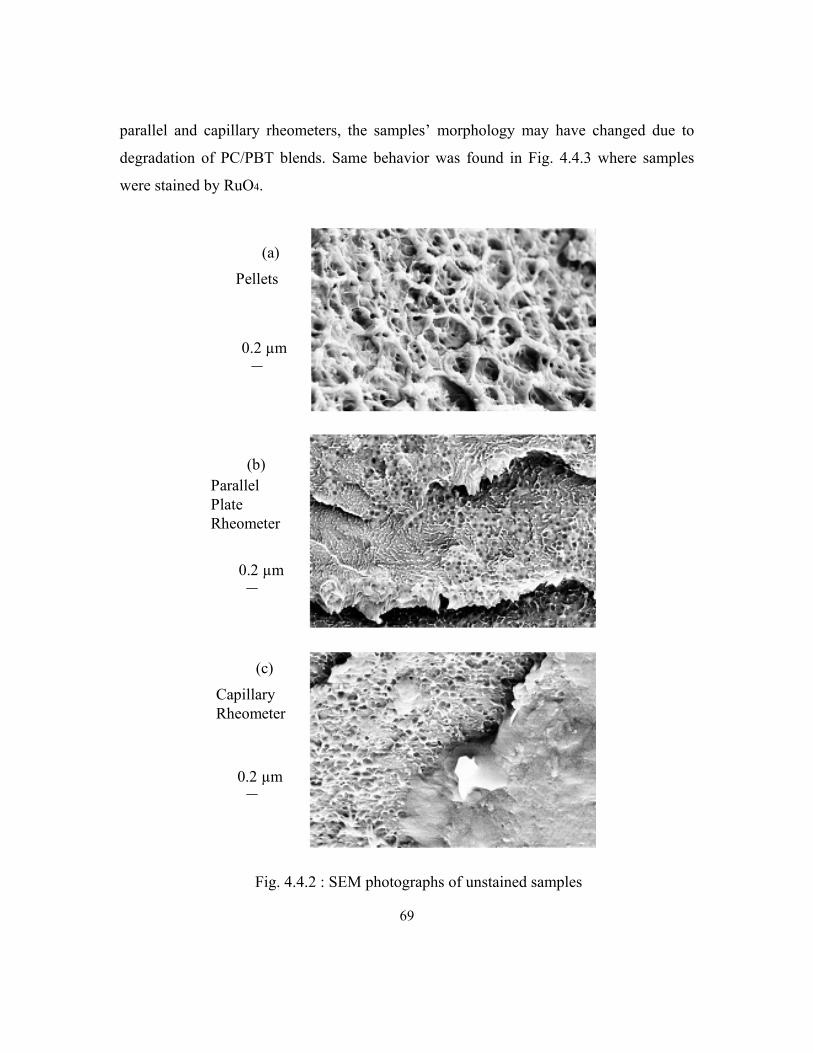
69
parallel and capillary rheometers, the samples’ morphology may have changed due to
degradation of PC/PBT blends. Same behavior was found in Fig. 4.4.3 where samples
were stained by RuO4.
0.2 µm
0.2 µm
0.2 µm
(a)
Pellets
(b)
(c)
Capillary Rheometer
ParallelPlateRheometer
Fig. 4.4.2 : SEM photographs of unstained samples

70
0.2 µm
0.2 µm
0.2 µm
(a)
Pellets
(b)
ParallelPlateRheometer
(c)
CapillaryRheometer
Fig. 4.4.3 : SEM micrographs of stained samples

71
Since diffusion of ruthenium tetroxide (RuO4) vapor in the amorphous region would be
expected to occur more readily than that in the crystalline region [62]. The dark stained
lines in Figs.4.4.3 and 4.4.4 are probably the amorphous areas between crystallites. Also,
Wu et al. [61] demonstrated that the black continuous phase is PC which was stained by
RuO4. And also white dispersed particles are PBT, which were quite randomly and
uniformly distributed in the PC matrix.
The SEM photographs from the reel backscattering electron detector (RBSD) of the same
samples stained by RuO4 have dominant information about element composition as
shown in Figure 4.4.5. No significant differences in morphology observed among the
samples.
Fig. 4.4.6 shows the morphology of RBSD stained by RuO4. There is no significant
difference among the three images.

72
1 µm
1 µm
1 µm
(b)ParallelPlateRheometer
(c)
Capillary Rheometer
(a)Pellets
Fig. 4.4.4 : SEM micrographs of stained samples

73
1 µm
1 µm
(a)
Pellets
ParallelPlateRheometer
(c)
CapillaryRheometer
1 µm
(b)
Fig. 4.4.5 : SEM photographs from the reel backscattering electron
detector (RBSD)

74
1 µm
1 µm
1 µm
(b)
ParallelPlateRheometer
(c)
Capillary Rheometer
(a)Pellets
Fig. 4.4.6 : SEM images from the reel backscattering electron detector
(RBSD) stained by RuO4

75
Chapter 5
CONCLUSIONS AND RECOMMENDATIONS
The objective of this work was to improve the quality of products of PC/PBT blends
regarding customer satisfaction, minimized waste product and maximized profit. Melt
Volume-Flow Rate (MVR) is the quickest method to find out the flow characteristics of
blends. It measures the flowability of thermoplastic polymers and gives an indication of
the flow properties of the melt, thus indicating processing qualities of polymer.
Variations of MVR with sampling times were studied. The screw speeds were increased
with time at constant feed rates of PC and PBT. It was shown that when the feed rates
increased, MVR decreased due to decrease of average residence time. Higher screw
speed resulted in higher MVR value at constant feed rate and increased flow rate resulted
in lower residence time that leads to reduced MVR. The measurements of MVR data
were statistically analyzed by analysis variance (ANOVA).
Dynamic rheological properties from parallel plate rheometer measurement were shown
that the polymer blends viscosity increased with increasing the concentration of PC. The
experimental results showed that viscosity of polymer blends depends on the composition
of PC rather than the variations of screw speed and feed rates. Here, experiments were
done with constant screw speeds or constant feed rates or constant PC compositions as
well as with different screw speeds or different screw speeds or different PC
compositions.
An attempt to apply the Cox-Merz relationship to the oscillatory viscosity and capillary
viscosity was not successful in this study. So, it would be concluded that Cox-Merz rule
was found not to be obeyed by all the polymers studied.

76
The samples collected after completing the tests in parallel and capillary rheometers may
be degradable when studied under scanning electron microscope (SEM). The samples
with stained by RuO4 showed evidence that RuO4 reacted strongly with PBT, possibly
leading to cross linking of PBT.
5.1 Recommendation for Path Forward
In this work, the 1st and 2nd sets of experiments were done by a 2 3 factorial design of
experiments and due to machine operating limitations, some of the combinations of the
levels were not feasible and were adjusted to practical levels of the factors studied.
Minimizing machine operating limitation could be a future task of this works.
Changes in the morphology of PC/PBT blends were studied under a scanning electron
microscope (SEM). In this study, samples were used only from 2nd set of experiments of
run 13 with a 10 minute time interval. So, more study has to be done on the other sets of
experiments to compare the morphology and highlight the effect of all processing
variables.
The measurements of MVR data were statistically analyzed by analysis of variance
(ANOVA). More statistical analysis needs to be done in the future and the results need to
be evaluated against actual production data that are not well controlled.

77
REFERENCES
1. A. Ajji , L. A. Utracki, “lnterphase and Compatibilization of Polymer Blends”, Polym. Eng.
Sci., 36, 1574-1585 (1996)
2. S. C. Tjong ,Y. Z. Meng, “Properties of Ternary In Situ Polycarbonate / Polybutylene
Terephthalate /Liquid Crystalline Polymer Composites”, J. Appl. Polym. Sci, 74, 1827-1835
(1999)
3. C-K. Shih , C-K. Shih, L.L.C., “Innovations in Selected Commercially Significant Polymer
Blend and Blending Process”, SPE ANTEC Technical Papers (2002)
4. J. M. R. C. A. Santosa, J. T. Guthrie, “Polymer blends: the PC–PBT case”, J. Mater. Chem.,
16, 237-245 (2006)
5. W. Birley, X.Y. Chen, “Further studies of polycarbonate-poly(butylene terephthalate) blends” ,
Br. Polym. J., 17, 297-305 (1985)
6. R. S. Halder, M. Joshi, A. Misra,” Morphological studies on the blends of poly (butylenes
terephthalate) and bisphenol-A polycarbonate”, J. Appl. Polym. Sci., 39, 1251-1264 (1990)
7. D. C. Wahrmund, D. R. Paul, J. W. Barlow, “Polyester-polycarbonate blends. I. Poly(butylene
terephthalate)”, J. Appl. Polym. Sci., 22, 2155-2164 (1978)
8. P. Sanchez, P. M. Remiro, J. Nazabal, “Physical properties and structure of unreacted PC/PBT
blends”, J. Appl. Polym. Sci., 50, 995-1005 (1993)
9. K. J. Lee, J. M. Kim, J. G. Kum, J. M. Oh, “Phase behavior of bisphenol-A polycarbonate and
poly(ester-ether) elastomer blend”, SPE ANTEC Technical Papers, 2458-2465 (1998)

78
10. P. Marchese, A. Celli, M. Fiorini, “Relationships between the molecular architecture,
crystallization capacity, and miscibility in poly(butylenes terephthalate) / polycarbonate blends :
A comparison with poly(ethylene terephthalate) / polycarbonate blends” , J. Polym. Sci.: Part B:
Polym. Phys., 42, 2821-2832 (2004)
11. G. Pompe, L. Haubler, “Investigations of Transesterification in PC/PBT Melt Blends and the
Proof of Immiscibility of PC and PBT at Completely Suppressed Transesterification”, J. Polym.
Sci.: Part B: Polym. Phys., 35, 2161-2168 (1997)
12. J. Devaux, P. Godard, J. P. Mercier, “The transesterification of bisphenol-a
polycarbonate(PC) and polybutylene terephthalate (PBT): A new route to block
copolycondensates”, J. Polym. Eng. Sci., 22, 229-233 (1982)
13. A. N. Wilkinson , S. B. Tattum, “Melting reaction and recrystallization in a reactive PC-PBT
blend”, Polymer, 38, 1923-1928 (1997)
14. S. B. Tattum, D. Cole, A. N. Wilkinson,” Controlled Transesterification and Its Effects on
Structure Development in Polycarbonate-Poly(Butylene Terephthalate) Melt Blends” , J.
Macromol. Sci., Part B, 39, 459-479 (2000)
15. I. Hopfe, G. Pompe and K.J. Eichhorn, “Ordered structures and progressive trans-
esterification in PC/PBT melt blends studied by FTIR. spectroscopy combined with DSC and
n.m.r.”, Polymer, 38, 2321-2327 (1997)
16. E. M. S. Sanchez, “Ageing of PC/PBT blends : Mechanical properties and recycling
possibility”, Polym. Testing, 26, 378-387 (2007)
17. L. A. Utracki, “Compatibilization of Polymer Blends”, Can. J. Chem. Eng., 80, 1008-1016
(2002)

79
18. S. P. Mishra, P. Venkidusamy, “Structural and thermal behavior of PC/PBT blends”, J. Appl.
Polym. Sci., 58, 2229 - 2234 (1995)
19. S. S. Pesetskii, B. Jurkowski, V. N. Koval, “Polycarbonate/polyalkylene terephthalate blends:
Interphase interactions and impact strength”, J. Appl. Polym. Sci., 84, 1277-1285 (2002)
20. T. W. Tseng, J. S. Lee,” Functional MBS impact modifiers for PC/PBT alloy”, J. Appl.
Polym. Sci., 76, 1280 - 1284 (2000)
21. B. J. Reekmans, K. Nakayama, “Hot drawing of partially miscible blends of polycarbonate
and poly(butylene terephthalate)”, J. Appl. Polym. Sci., 62, 247 - 255 (1996)
22. D. Delimoy, B. Goffaux, J. Devaux, R. Legras, “Thermal and morphological behaviors of
bisphenol A polycarbonate / poly ( butylene terephthalate ) blends”, Polymer, 36, 3255-3266
(1995)
23. A. C. M. V. Bennekom, D. V. D. Berg, J. Bussink and R. J. Gaymans, “Blends of amide
modified polybutylene terephthalate and polycarbonate : phase separation and morphology”,
Polymer, 38, 5041 - 5049 (1997)
24. S. Y. Hobbs, M. E. J. Dekkers and V. H. Watkins, “The morphology and deformation
behavior of poly (butylene terephthalate)/BPA polycarbonate blends”, Polym. Bul., 17, 341-345
(1987)
25. S. Nabar, D. D. Kale, “Rheology and transesterfication between polycarbonate and
polyesters”, J. Appl. Polym. Sci., 104, 2039-2047 (2007)
26. J. Wu, K. Wang, D. Yu, “Fracture toughness and fracture mechanisms PBT/PC/IM blend”, J.
Mater. Sci., 38, 183-191 (2003)
80
27. H. Bai, Y. Zhang, Y. Zhang, X. Zhang, W. Zhou, “Toughening modification of PBT/PC
blends by PTW”, Polym. Testing, 24, 235-240 (2005)
28. S. Y. Hobbs, V. L. Groshans, M. E. J. Dekkers, A. R. Shultz, “Partial miscibility of poly
(butylene terephthalate)/BPA polycarbonate melt blends”, Polym. Bul., 17, 335-339 (1987)
29. W. S. Depolo, D. W. Litchfield, D. G. Baird, “Rheological characterization of compatibility
& degradation of polycarbonate / polybutylene terephthalate layered silicate nanocomposities”,
Antec Papers, 2330-2334 (2006)
30. A. Rudin, “The Elements of Polymer Science and Engineering”, Second Edition, Academic
Press, USA(1999)
31. J. M. Dealy, S. S. Soong, “A Parallel Plate Melt Rheometer Incorporating a Shear Stress
Transducer”, J. Rheol., 23, 355-365 (1984)
32. J. M. Dealy and K.F. Wissburn, “Melt Rheology and its Role in Plastics Processing”, Van
Nostrand Reinhold, New York (1990)
33. C. A. Braybrook, J. A. Lee and P. J. Bates, “Measurement of the high frequency viscoelastic
properties of polypropylene using a sliding plate rheometer”, Antec Papers, 1970-1972 (2007)
34. W. P. Cox, E. H. Merz, “Correlation of dynamic and steady flow viscosities”, J. Polym. Sci.,
28, 619-622 (1958)
35. G. Goizueta, T. Chiba and T. Inoue, “Phase morphology of polymer blends: 2. SEM
observation by secondary and backscattered electrons from microtomed and stained surface”,
Polymer, 34, 253-256(1993)

81
36. K. Premphet and W. Paecharoenchai, “Polypropylene / Metallocene ethylene-octene
copolymer blends with a bimodal particle size distribution: mechanical properties and their
controlling factors”, J. Appl. Polym. Sci., 85, 2412-2418 (2002)
37. A.K. Kalkar, H.W. Siesler, F. Pfeifer, S.A. Wadeka, “Molecular orientation and relaxation in
poly(butyleneterephthalate)/polycarbonate blends”, Polymer, 44, 7251–7264 (2003)
38. B. Chisholm, “Blends of amide-modified polybutylene terephthalate and polycarbonate”, SPE
ANTEC Technical Papers, 2508-2514 (1998)
39. C. Rauwendaal, “Polymer Extrusion”, 4th Edition, Hanser Gardner Publications, USA (2001)
40. L. A. Utracki, “Polymer Blends Handbook”, Kluwer Academic Publishers, Boston, USA
(2002)
41. C. J. Rauwendaal, “Analysis and experimental evaluation of twin screw extruders”, Polym.
Eng. Sci., 21, 1092-1100 (1981)
42. C. D. Denson, B. K. Hwang Jr., “The influence of the axial pressure gradient on flow rate for
Newtonian liquids in a self wiping, co-rotating twin screw extruder”, Polym. Eng. Sci., 20, 965-
971(1980)
43. R. M. Secor, “Power consumption of partially filled twin-screw extruders”, Polym. Eng. Sci.,
26, 969-973 (1986)
44. H. E. H. Meijer, P. H. M. Elemans, “The Modeling of Continuous Mixers. Part I: The Co-
rotating Twin-Screw Extruder”, Polym. Eng. Sci., 28 , 275-290 (1988)
45. J. Gao, G. C. Walsh, D. Bigio , R. M. Briber, Mark D. Wetzel , “Mean residence time analysis
for twin screw extruders” , Polym. Eng. Sci. , 40, 227-237 (2000)

82
46. A. Kumar, S. A. Eker, P.K. Houpt, “A model based approach for estimation and control for
polymer compounding ”, IEEE, 1, 729 – 735 (2003)
47. Z. Linjie, G. Xiaozheng, “ Physical model of polymer pellets melting in co-rotating twin-
screw extruder”, SPE ANTEC Technical Papers, 149-153 (2000)
48. A. Shah and M. Gupta, “Comparison of the flow in co-rotating and counter- rotating twin-
screw extruders”, SPE ANTEC Technical Papers, 443-447 (2004)
49. A. A. Collyer, “Techniques in Rheological Measurements”, Chapman & Hall, UK (1993)
50. D. E. D. Laney, J. F. Reilly, “A Practical Approach to Polymer Rheology for Quality
Control”, SPE ANTEC Technical Papers, 1162-1166 (1999)
51. A. V. Shenoy, D. R. Saini, “Melt Flow Index: More Than Just A Quality Control
Rheological Parameter. Part I”, Adv. Polym. Tech. , 6, 1-58 (1986)
52. C. W. Macosko, “RHEOLOGY : Principle, Measurements, and Applications”, VCH
Publishers Inc. , New York, 1994
53. Xu, Z. Hou and T. Li , “Novel Sample Preparation Method of Polymer Emulsion
for SEM Observation”, Microscopy Research and Technique, 70, 847–850 (2007)
54. S. Y. Hobbs and V. H. Watkins, “The Use of Chemical Contrast in the SEM Analysis of
Polymer Blends”, J. Polym. Sci. : Polym. Phys. Ed. , 20, 651-658 (1982)
55. L. M. Robeson, “Polymer Blends : A comprehensive Review”, Hanser Gardner Publications,
Canada (2007)
56. L. M. Berkowitz and P. N. Rylander, “Use of Ruthenium Tetroxide as a Multi-purpose
Oxidant”, J. Amer. Chem. Soc. , 80, 6682-6684 (1958)

83
57. Ancheh, V. N. , “A Study of Polycarbonate / Poly (butylene terephthalate) Compounding in a
Twin Screw Extruder”, Masters Dissertation, University of Waterloo, Waterloo, Ontario, Canada
(2008)
58. R. M. Schulken, R. H. Cox and L. A. Minnick, “Dynamic and Steady-State Rheological
Measurements on Polymer Melts”, J. Appl. Polym. Sci. , 25, 1341-1353 (1980)
59. T. T. Hsieh, C. Tiu and G. P. Simon, “Melt Rheology of Aliphatic Hyperbranched Polyester
with Various Molecular Weight”, Polymer, 42, 1931-1939 (2001)
60. H. C. Booij, P. Leblans, J. Palmen, G. T-Thoone, “Nonlinear viscoelasticity and the Cox-
Merz relations for polymeric fluids”, J. Polym. Sci.: Polym. Phys. Ed.,. 21, 1703-1711 (1983)
61. J. Wu, Y. W. Mai and A. F. Yee, D. Yu, “Fracture toughness and fracture mechanisms of
PBT/PC/IM blends”, J. Mater. Sci., 29, 4510-4522 (1994)
62. J. S. Trent, J. I. Scheinbeim and P. R. Couchman, “Ruthenium Tetraoxide Staining of
Polymers for Electron Microscopy”, Macromolecules, 16, 589-598 (1983)

84
APPENDIX
Experimental Graphs
100
1000
10000
100000
0.01 0.1 1 10 100 1000
Angular Frequency (rad/s)
Stor
age
Mod
ulus
, G' (
Pa)
100
1000
10000
100000
Loss
Mod
ulus
, G" (
Pa)
G'G"
Fig. A.1 : Dynamic response behaviour of PC/PBT blends of 1st set of experiments of Run6

85
100
1000
10000
100000
0.01 0.1 1 10 100 1000
Angular Frequency(rad/s)
Stor
age
Mod
ulus
, G' (
Pa)
100
1000
10000
100000
Loss
Mod
ulus
, G" (
Pa)
G'G"
Fig. A.2 : Dynamic response behaviour of PC/PBT blends of 1st set of experiments of Run13

86
100
1000
10000
100000
0.01 0.1 1 10 100 1000
Angular Frequency(rad/s)
Stor
age
Mod
ulus
, G' (
Pa)
100
1000
10000
100000
Loss
Mod
ulus
, G" (
Pa)
G'G"
Fig. A.3 : Dynamic response behaviour of PC/PBT blends of 2nd set of experiments of Run7
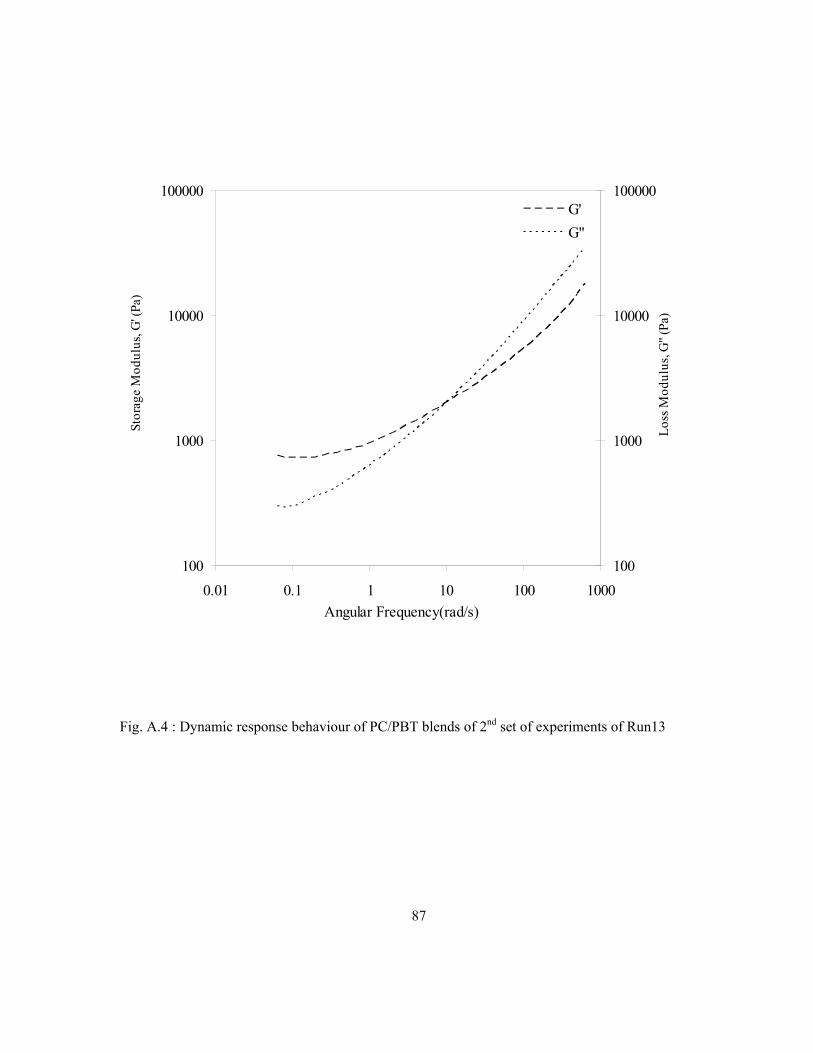
87
100
1000
10000
100000
0.01 0.1 1 10 100 1000Angular Frequency(rad/s)
Stor
age
Mod
ulus
, G' (
Pa)
100
1000
10000
100000
Loss
Mod
ulus
, G" (
Pa)
G'G"
Fig. A.4 : Dynamic response behaviour of PC/PBT blends of 2nd set of experiments of Run13

88
10
100
1000
10000
1 10 100 1000 10000
Angular Frequency / Shear Rate (1/s)
Com
plex
Vis
cosi
ty /
Stea
dy-s
tate
She
ar V
isco
sity
(Pa.
s)
DynamicCapillary
Fig. A.5: Complex Viscosity / Steady-shear Viscosity as a function of Angular
Frequency / Shear Rate for Run9 of the 2nd set of experiments.

89
10
100
1000
10000
100000
1 10 100 1000 10000
Angular Frequency / Shear Rate (1/s)
Com
plex
Vis
cosi
ty /
Stea
dy-s
tate
She
ar V
isco
sity
(Pa.
s)
DynamicCapillary
Fig. A.6 : Complex Viscosity / Steady-shear Viscosity as a function of Angular
Frequency / Shear Rate for Run11 of the 2nd set of experiments.

90
10
100
1000
10000
100000
1 10 100 1000 10000
Angular Frequency / Shear Rate (rad/s)
Com
plex
Vis
cosi
ty /
Stea
dy-s
tate
She
ar V
isco
sity
(Pa.
s)
DynymicCapillary
Fig. A.7 : Complex Viscosity / Steady-shear Viscosity as a function of Angular
Frequency / Shear Rate for Run5 of the 3rd set of experiments.

91
10
100
1000
10000
100000
1 10 100 1000 10000Angular Frequency / Shear Rate(1/s)
Com
plex
Vis
cosi
ty /
Stea
dy-s
tate
She
ar V
isco
sity
(Pa.
s)
DynamicCapillary
Fig. A.8 : Complex Viscosity / Steady-shear Viscosity as a function of Angular
Frequency / Shear Rate for Run7 of the 3rd set of experiments.