A Study of Plan Quality and QA over a Population of Planners, Planning Systems… · 2018-02-20 ·...
67
2017 QADS Head & Neck Plan Study A Study of Plan Quality and QA over a Population of Planners, Planning Systems, and Modalities Ben Nelms, Ph.D. 1 & Vladimir Feygelman, Ph.D. 2 1 Canis Lupus LLC 2 Moffitt Cancer Center
Transcript of A Study of Plan Quality and QA over a Population of Planners, Planning Systems… · 2018-02-20 ·...

2017 QADS Head & Neck Plan Study
A Study of Plan Quality and QA
over a Population of Planners,
Planning Systems, and Modalities
Ben Nelms, Ph.D.1 & Vladimir Feygelman, Ph.D.2
1 Canis Lupus LLC2 Moffitt Cancer Center

Outline
Introduction
- Goals
- Brief history of the plan study program
- Medical Physics Practice Guidelines 5.a (MPPG 5.a)
Methods
- Experimental design and discussion of variables
- Plan scoring, QA metrics, and method of data collection
Results
- Analyses, comparisons, and studies of variation
- Best practices (planning & physics)
Conclusions
2

Introduction
Goals, History, etc.
3

Goals
4
Standard
Clinical Datasets
(Images + Structures)
INDUSTRY STANDARD: Process, Test Data, Scoring Methods and Benchmarks
Processes
Quality
Download &
Import Test
Data
Create
Treatment Plan
Score Plan
Quality
True Composite
Dose QA
Assess Performance of:
TPS, Modality, & Planner vs. Dynamic
Population Data
High Quality
Test Plan
Assess Performance of:
TPS Dose Calculation
Accuracy & Delivery

Goals
Benchmarking
- Achievable levels of quality for treatment plan quality
- Achievable levels of quality for dose accuracy
Objective, Comparative Analyses
- Modality vs. Modality, TPS vs. TPS, etc.
- Study of delivery efficiency and monitor unit usage
Study of Variation
- Potential causes and ways to improve
Sharing of Best Practices
- Identify and interview “high performers”
- Share their successful tips and techniques (planning & physics)
5

History of Modern Plan Studies
H&N
AAMD
Head
& Neck
AAMD
GYN
AAMD
Prostate
Fossa
AAMD
Lung
AAMD
Abdomen
AAMD
Anus
AAMD
Breast
AAPM
Lung
SBRT
AUS
PUG
Head
& Neck
AUS
PUG
GYN
AUS
PUG
Brain
ASTRO
PROS
Head
& Neck
GYN
AAMD
Brain/
Hippo
Vicki’s
Pilot
Project
Pilot study Subjective scoring Modern method (PQM)
Radiation Oncology Resources (ROR) & Canis Lupus LLC ProKnow
2008 2010 20112009 20132012 2014 2015 2016
2016
AAMD/RSS
SBRT
Prostate
2017 QADS
MPPG 5.a
Head/Neck
SNC
2017
TROG
SBRT
Spine
2017
Legend:
6
2018
2017
AAMD
Skin
2017
RSS
SBRT
Lung
PTCOG
Studies
(Mayo &
Univ FL)

Modern Scoring Method
Technology. Developed in 2011 as “Quality
Reports,” became Sun Nuclear’s product
called PlanIQ™. General method licensed for
use for ProKnow Plan Studies
Identify critical metrics. Dose, DVH, and
formulaic metrics selected from a large library
of options.
Define each metric’s objective score f(x). For
each metric, capture what defines success, i.e.
specify priority along with: 1) minimally
required result, 2) ideal result, and 3) variable
scoring in between.
Define each metric’s weight. Assign point
value (i.e. weight) for each metric, which
scales the score f(x) ordinate values.
PLAN
QUALITY
ALGORITHM
PER METRIC SCORES =
COMPOSITE PLAN SCORE
METRICS
OBJECTIVES
WEIGHTS (PRIORITIES)
7
SCORE F(X)

Library of Available Metrics
8

Modern Scoring Method
2012 Publication was the first study using the modern
scoring method (prostate + nodes, in conjunction with
the 2011 AAMD meeting)
This has become a key paper cited by many new studies,
in particular for studies of software auto-planning vs.
manual planning
9

Statistical Process Control & Study of Variation
Quality
Fre
qu
en
cy
[ Top Limit ]
Quality
Fre
qu
en
cy
[ Top Limit ]
High variation
Average quality is low
Lots of low quality items
Few high quality items
Lower variation
Average quality is higher
Fewer low quality items
More high quality items
10

Key Findings from the 2012 Paper
Despite controlled inputs (CT and structures) and well-defined objectives (Plan Quality Algorithm), there was very high variability in plan quality.
11

Key Findings from the 2012 Paper
NO correlation with:
Certification
Education level
Experience
Confidence
12

Key Findings from the 2012 Paper
VMAT was not statistically “better” than IMRT, though it was
somewhat less variable.
13

Key Findings from the 2012 Paper
No significant dependence on TPS
- All TPS models show large variation in plan quality.
- Over many studies over the years, there are reproducible trends in terms of benchmarks such as max scores or 90th percentile, i.e. top 10%.
No dependence on plan “complexity”
- As evidenced by total monitor units or treatment time
- Some very efficient/low MU plans score very high while some very inefficient/high MU plans score low
Quality is determined by Planner Skill
- This first (and all subsequent studies so far) assert that plan quality depends less on modality or technology, and more on planner skill.
14

MPPG 5.a (TG244)
Goal
- To provide an overview of the minimum requirements for TPS dose calculation algorithm commissioning (data acquisition, modeling, and verification) and QA in a clinical setting.
Six standard patient datasets are provided
- Five for studying plan quality and dose accuracy, and one for studying heterogeneities
15

Methods
Experimental Design
Scoring Methods
Data Collection
16

Control Variables
Patient anatomy (CT images)
Contoured targets and organs (RT Structure Set)
Objective planning goals (plan scoring algorithm)
Common scoring software, to eliminate inter-TPS
variation in DVH calculation methods
- Nelms BE, Stambaugh C, Hunt D, Tonner B, Zhang G, and Feygelman V.
“Methods, software and datasets to verify DVH calculations against
analytical values: Twenty Years Late(r),” Med Phys. 2015 Aug; 42(8).
17

Control Variables (cont.)
Modern dose calculation algorithm (superposition or
better)
Minimum requirements for dose grid resolution (≤ 3.0
mm) and size (covering all scored structures)
Realistic and practical delivery time
- Estimated “beam on” time is calculated and displayed on each
plan quality scorecard
18

Independent Variables
Treatment Planning System
Treatment Modality (VMAT, IMRT, protons, helical
Tomotherapy, robotic, etc.)
Human Skill
- Relative talents of treatment planner(s) & physicist(s)
Planning Techniques
Beam Energy
19

Dependent Variables
Plan Quality Scores (Composite, max 150)
Per Metric Scores
Estimated Treatment Times
Pretreatment Dose QA (Calc vs. Meas)
20

Patient Dataset
21

Plan Quality Algorithm
21 Scored Metrics
- 150 points total
- Target coverage accounted for 94 of the 150 points
- Conformation and sparing of organs-at-risk: 56 points
- 14 of 21 metrics use advanced, non-linear scoring
- 2 “hard constraint” OAR objectives
2 unscored metrics
- Estimated Treatment Time (min)
- Cumulative meterset (e.g. monitor units) over all treatment
beams
22

Plan Scoring Scoresheet, At-a-Glance
23
Blank Scoresheet Scored Plan

Dose QA: Metrics Collected
QA Device
QA Method
- True Composite, Single Angle Composite, EPID-based planar,
independent dose recalc, etc.
Gamma Passing Rates
- 3% (global) / 3 mm / 10% lower threshold
- 3% (global) / 2 mm / 10% lower threshold
- 2% (local) / 2 mm / 20% lower threshold
24

Dose QA: Special Rules
For the dose QA method field, generic and/or industry-
standard terms were required, such as:
- True composite
- Single angle composite
- Portal dosimetry
- Log-file based re-calculation
- etc.
Users not allowed to use “measurement uncertainty”
- Bailey et al., “Measurement Uncertainty function and its effect on
planar dose pass rates,” JACMP 17(2), 2016.
25

Refresher: The X’s and O’s of 3D Dosimeters
All else equal, QA metrics (e.g. passing rates) measured by different detector geometries will NOT be the same. The more sensitive the metric, the more varied the results.
Sensitivities vary based on error type and where the errors manifest in 3D.
This presents a real problem for any group trying to publish general guidelines that apply across all QA devices.
26

Refresher: Some Inconvenient Truths
27
Jin X, Yan H, Han C, Zhou Y, Yi J, Xie C. Correlation between gamma index passing rate and clinical dosimetric difference for
pre-treatment 2D and 3D volumetric modulated arc therapy dosimetric verification. Br J Radiol 2015;88:20140577.
Nelms BE, Chan MF, Jarry G, Lemire M, Lowden J, Hampton C, and Feygelman V. Evaluating IMRT and VMAT dose accuracy:
Practical examples of failure to detect systematic errors when applying a commonly used metric and action levels. Med Phys.
2013 Nov; 40(11).
Nelms BE, Opp D, Robinson J, Wolf TK, Zhang G, Moros E, Feygelman V. VMAT QA: measurement-guided 4D dose
reconstruction on a patient. Med Phys. 2012 Jul; 39(7).
Feygelman V, Stambaugh C, Opp D, Zhang G, Moros E, and Nelms, BE. Cross-validation of two commercial methods for
volumetric high-resolution dose reconstruction on a phantom for non-coplanar VMAT beams. Radiother Oncol. 2014 Mar;
110(3).
Opp D, Nelms BE, Zhang G, Stevens C, Feygelman V. Validation of measurement-guided 3D VMAT dose reconstruction on a
heterogeneous anthropomorphic phantom. J Appl Clin Med Phys. 2013 Jul; 14(4).
Chan MF, Li J, Schupak K, Burman C. Using a Novel Dose QA Tool to Quantify the Impact of Systematic Errors Otherwise
Undetected by Conventional QA Methods: Clinical Head and Neck Case Studies. Technol Cancer Res Treat. 2013 Jun; 13(1).
Stasi et al. Pretreatment patient-specific IMRT quality assurance: A correlation study between gamma index and patient clinical
dose volume histogram. Med Phys. 2012 Dec; 39(12).
Carrasco et al. 3D DVH-based metric analysis versus per-beam planar analysis in IMRT pretreatment verification. Med Phys.
2012 Aug; 39(8).
Zhen H, Nelms BE, Tome WA. Moving from gamma passing rates to patient DVH-based QA metrics in pretreatment dose QA.
Med Phys. 2011 Oct; 38(10).
Nelms BE, Zhen H, Tomé WA. Per-beam, planar IMRT QA passing rates do not predict clinically relevant patient dose errors.
Med Phys. 2011 Feb;38(2).

Refresher: Some Inconvenient Truths
No Gamma passing rate at any setting of % difference or distance has been proven to be sensitive and specific in terms of detecting relevant clinical errors in the TPS dose calc (or dose delivery).
In fact, all common permutations of gamma have been proven insensitive and non-specific.- Among those with low specificity and sensitivity are: 3% (global)/ 3 mm
(TG119), 3% (global) / 2 mm (TG218), and even 2% (global) / 2 mm (TG244).
- Higher sensitivity observed with 2% (local) / 2 mm, but with some concern if it’s too sensitive, i.e. false positives. Needs benchmarking to see what is achievable.
Accurate, measurement-guided 3D dose reconstruction and DVH analysis is promising, and by definition is both sensitive and specific.
28
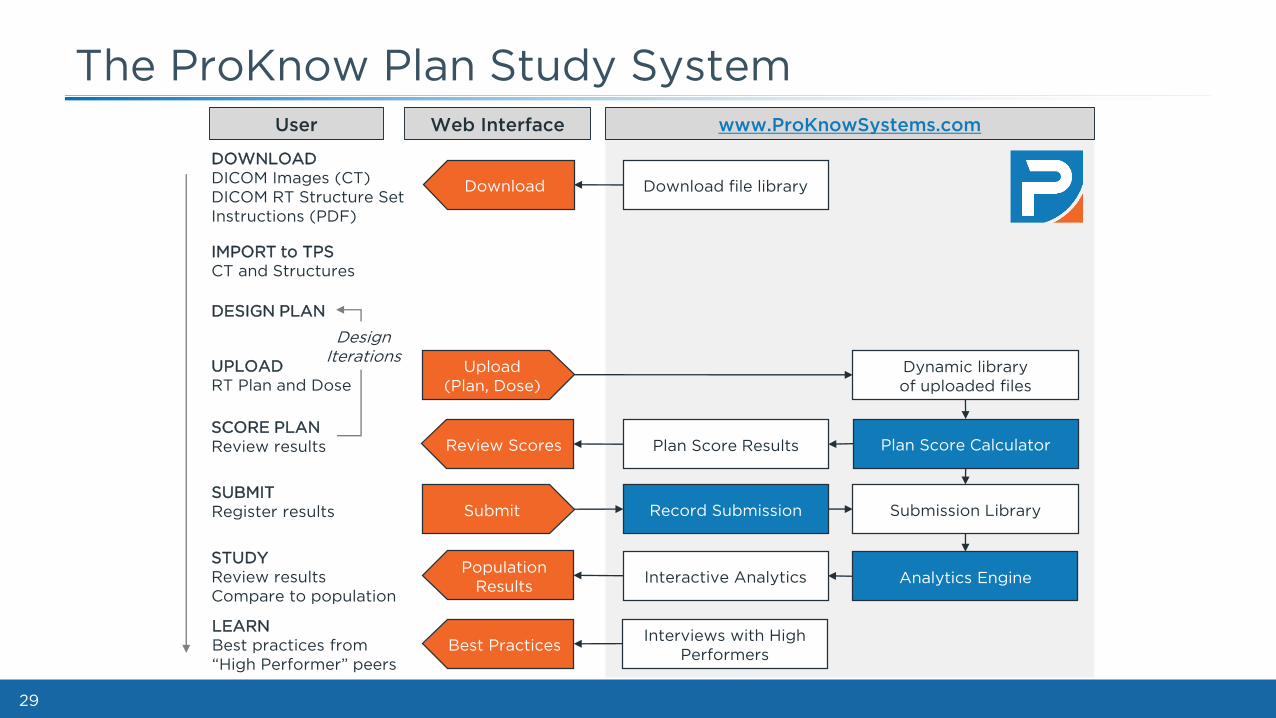
The ProKnow Plan Study System
29
Download file library
DOWNLOAD
DICOM Images (CT)
DICOM RT Structure Set
Instructions (PDF)
DESIGN PLAN
IMPORT to TPS
CT and Structures
SCORE PLAN
Review results
UPLOAD
RT Plan and Dose
SUBMIT
Register results
STUDY
Review results
Compare to population
Dynamic library
of uploaded files
Plan Score CalculatorPlan Score Results
Record Submission Submission Library
Analytics EngineInteractive Analytics
User Web Interface www.ProKnowSystems.com
Upload
(Plan, Dose)
Download
Review Scores
Population
Results
Submit
Design
Iterations
Best PracticesInterviews with High
Performers
LEARN
Best practices from
“High Performer” peers

SAM Questions
Ready, Set, Go!
30
SAM Question #1
1. Which of the following is currently the
biggest driver of radiation treatment plan
quality?
A. Advanced modalities such as VMAT & protons
B. TPS model
C. Allowing more monitor units for modulation
D. Planner experience level
E. None of the above
31

SAM Question #1: Answer
1. Which of the following is currently the
biggest driver of radiation treatment plan
quality?
A. Advanced modalities such as VMAT & protons
B. TPS model
C. Allowing more monitor units for modulation
D. Planner experience level
E. None of the above
32
REFERENCE: Nelms BE, Robinson G, Markham J, Velasco K, Boyd S, Narayan S, Wheeler J,
Sobczak M. Variation in external beam treatment plan quality: An inter-institutional study of
planners and planning systems. Practical Radiation Oncology 2012 Oct;2(4):296-305.

SAM Question #2
2. Which of the following summarizes the goal
of the MPPG 5.a / TG244 guidelines?
A. To summarize the standard methods and
performance benchmarks for dose QA.
B. To summarize minimum requirements for TPS dose
calculation algorithm commissioning and QA.
C. To provide methods and minimum requirements
for linear accelerator commissioning.
D. To provide standard datasets to verify inter-
connectivity of medical devices.
33

SAM Question #2: Answer
2. Which of the following summarizes the goal
of the MPPG 5.a / TG244 guidelines?
A. To summarize the standard methods and
performance benchmarks for dose QA.
B. To summarize minimum requirements for TPS
dose calculation algorithm commissioning and QA.
C. To provide methods and minimum requirements
for linear accelerator commissioning.
D. To provide standard datasets to verify inter-
connectivity of medical devices.
34
REFERENCE: AAPM TG244 subcommittee. AAPM Medical Physics Practice Guideline 5.a.:
Commissioning and QA of Treatment Planning Dose Calculations — Megavoltage Photon
and Electron Beams. J Appl Clin Med Phys. 2015;16(5).

SAM Question #3
3. Which of the following is important for a study aimed to quantify and compare the abilities of different TPS and treatment planners to produce a high quality plan?
A. Each planner must use the same patient imageset and contoured critical volumes.
B. Dose calculation grids must be of sufficient resolution and size.
C. Each submitted plan and corresponding dose must be scored exactly the same way, with 100% transparency and objectivity.
D. All of the above.
35

SAM Question #3: Answer
3. Which of the following is important for a study aimed to quantify and compare the abilities of different TPS and treatment planners to produce a high quality plan?
A. Each planner must use the same patient imageset and contoured critical volumes.
B. Dose calculation grids must be of sufficient resolution and size.
C. Each submitted plan and corresponding dose must be scored exactly the same way, with 100% transparency and objectivity.
D. All of the above.
36
REFERENCE: Nelms BE, Robinson G, Markham J, Velasco K, Boyd S, Narayan S, Wheeler J,
Sobczak M. Variation in external beam treatment plan quality: An inter-institutional study of
planners and planning systems. Practical Radiation Oncology 2012 Oct;2(4):296-305.
SAM Question #4
4. Which of the following is true about pretreatment dose QA using different dosimetry methods:
A. If an identical fraction is analyzed with multiple commercial QA systems, a physicist should expect identical, or at least very similar, metric results.
B. A gamma passing rate as measured by a Delta 4 “X” geometry will produce the same or higher passing rate if measured by an ArcCHECK “O” geometry.
C. Passing rates of 100% as measured by methods using an EPID have been proven to ensure a passing rate of 90% or higher for the same criteria in a true 3D dosimeter.
D. None of the above.
37

SAM Question #4: Answer
4. Which of the following is true about pretreatment dose QA using different dosimetry methods:
A. If an identical fraction is analyzed with multiple commercial QA systems, a physicist should expect identical, or at least very similar, metric results.
B. A gamma passing rate as measured by a Delta 4 “O” geometry will produce the same or higher passing rate if measured by an ArcCHECK “X” geometry.
C. Passing rates of 100% as measured by methods using an EPID have been proven to ensure a passing rate of 90% or higher for the same criteria in a true 3D dosimeter.
D. None of the above.
38
REFERENCE: Feygelman V, Zhang G, Stevens C, Nelms BE. Evaluation of a new VMAT QA
device, or the “X” and “O” array geometries. J Appl Clin Med Phys. 2011 Jan 31;12(2):3346.
REFERENCE: Zhen H, Nelms BE, Tome WA. Moving from gamma passing rates to patient
DVH-based QA metrics in pretreatment dose QA. Med Phys. 2011 Oct;38(10):5477-89.

SAM Question #5
5. Which of the following is true regarding the use of gamma passing rates for dose QA:
A. Clinically relevant errors can still occur even for passing rates > 95% for conventional criteria such as 3% / 3 mm.
B. Local percent dose normalization is more sensitive than global normalization.
C. All else equal, different dosimetry methods can produce different gamma results.
D. No gamma method has ever been proven to be sensitive and specific relative to detection of clinically relevant errors.
E. All of the above.
39

SAM Question #5: Answer
5. Which of the following is true regarding the use of gamma passing rates for dose QA:
A. Clinically relevant errors can still occur even for passing rates > 95% for conventional criteria such as 3% / 3 mm.
B. Local percent dose normalization is more sensitive than global normalization.
C. All else equal, different dosimetry methods can produce different gamma results.
D. No gamma method has ever been proven to be sensitive and specific relative to detection of clinically relevant errors.
E. All of the above.
40
REFERENCES: Many (see earlier slide), including: Nelms BE, Chan MF, Jarry G, Lemire M, Lowden J, Hampton C, and
Feygelman V. Evaluating IMRT and VMAT dose accuracy: Practical examples of failure to detect systematic errors
when applying a commonly used metric and action levels. Med Phys. 2013 Nov; 40(11).

Results
Data Analyses
Comparisons
Studies of Variation
41

Participation by Modality (N = 238)
42

Participation by TPS (N = 238)
43

Participation by Role (N = 238)
44

Participation by Country (34 Countries)
45

Participation by QA Device (N = 77)
46

Participation by QA Method (N = 77)
47

Plan Scores (All)
48

Visual Examples of Variation
49
Movie of
Doses for 90th
Percentile,
i.e. Top 10%
Plan Scores

Visual Examples of Variation
50
Movie of
Doses for 10th
Percentile,
i.e. Low 10%
Plan Scores

Visual Examples of Variation
51
PTV 56 has three dose levels:
56 Gy (PTV56 = 1301 cc)
63 Gy (PTV63 = 542 cc)
70 Gy (PTV70 = 237 cc)

Visual Examples of Variation
52
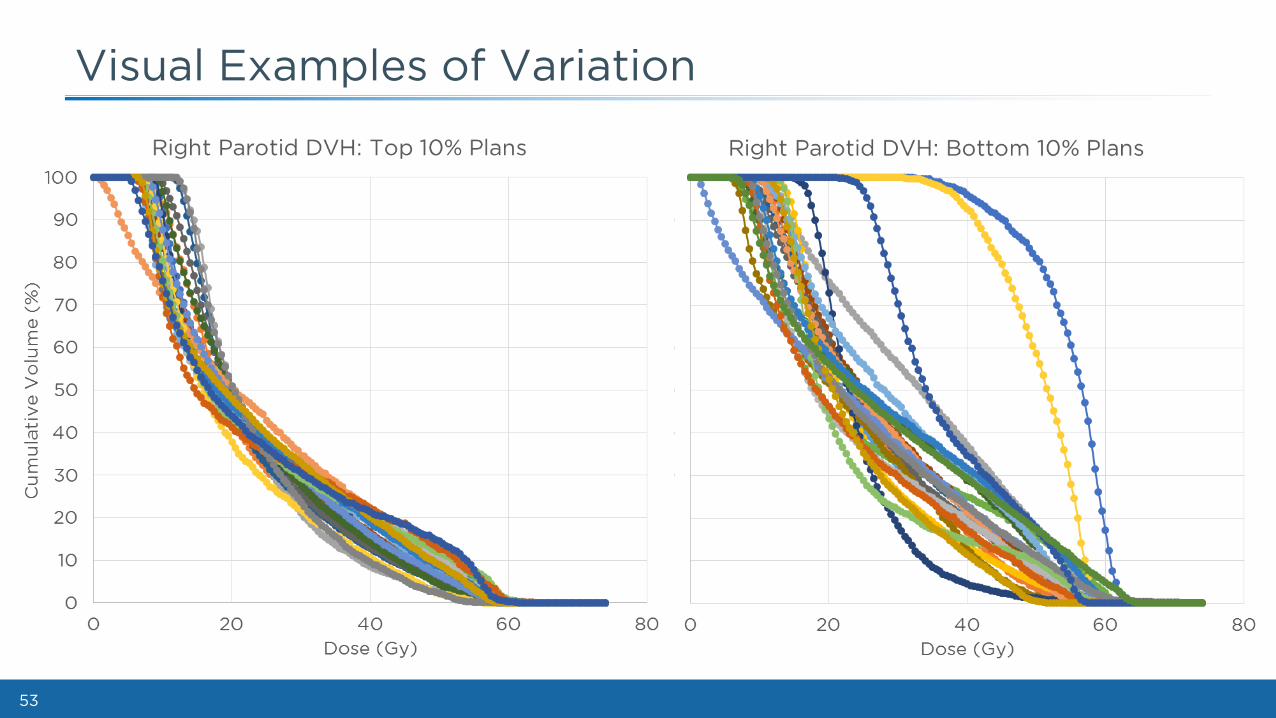
Visual Examples of Variation
53

Plan Scores: By Modality and TPS
54

Plan Scores: By Planner Role
55

Plan Scores vs. Efficiency (Time)
56

Plan Scores vs. Efficiency (MU)
57

True Composite QA: 3G/3/10 vs. 3G/2/10 vs. 2L/2/20
58

True Composite QA: 3% (Global) / 3 mm / 10%TH Passing Rates
59

True Composite QA: 3% (Global) / 2 mm / 10%TH Passing Rates
60

True Composite QA: 2% (Local) / 2 mm / 20%TH Passing Rates
61

True Composite QA: 2% (Local) / 2 mm / 20%TH Passing Rates
62

Sharing of Best Practices
What?- Planners and physicists from around the world who were recognized as
“high performers” were contacted.
- Many agreed to recorded interviews, and others to written interviews, sharing their methods.
- Cross section of different TPS, modalities, and dose QA methods.
- These interviews are shared worldwide through ProKnow.
Where?- Sign in to ProKnow, go to the 2017 QADS Plan Study, and select “Learn”
- Videos are embedded and documents are downloadable.
For Who?- Everybody. Worldwide. For free.
- You do not need to have participated in the plan study to access these learning materials.
63

Conclusions
64

Conclusions (TPS)
All TPS studied were able to produce high quality plans.
- 6 (of 6) TPS produced plans in the top 25% of plan quality.
- 4 (of 6) TPS produced plans in the top 10% of plan quality.
All TPS studied showed high variability in plan quality
distribution.
This suggests there would be high value in training, i.e.
propagating best practices to help remove the low
quality/low score tail.
65

Conclusions (Modality & Complexity)
VMAT vs. IMRT vs. Tomotherapy
- No statistical difference based on modality.
- The VMAT plans were significantly more efficient in terms of time and monitor units than both IMRT and helical tomotherapy.
Protons vs. Photons
- Protons were a small sample size (8 out of 238 plans). Based on those, there was no measured advantage of protons over photons.
- The max, 75th percentile, and median were:
• 146.88, 140.66, and 135.61 (IMRT, VMAT, tomo)
• 143.99, 140.39, and 134.69 (PROTONS)
No correlation of plan quality to total MU (or time)
- Many efficient (low MU) plans were very high quality.
- Many inefficient (high MU) plans were lower quality.
66

Conclusions (True Composite Dose QA)
Justification for aggressive benchmarks
- Adoption of using more stringent criteria (2L/2/20) and tighter tolerances (> 95%) is justified, even for this sufficiently complex head & neck study.
• Top quartile of dose QA performances showed passing rates > 95% for the stringent 2% (local normalization) / 2 mm criteria
• Median 2 (local) / 2 mm passing rate was 90%
• Was this sample biased towards high performers? Maybe, but when benchmarking that is fine, perhaps even preferred.
Use of standard patient datasets for benchmarking
- In terms of TPS commissioning, there is great value to the industry in using: 1) standard patient datasets, 2) object plan quality measures, and 3) consistent QA methods.
- We should pursue similar benchmarking studies for the remaining MPPG 5.a datasets.
67