
A STUDY OF PARAMETERS THAT AFFECT PIVOTED … Affecting... · A STUDY OF PARAMETERS THAT AFFECT...
14
A STUDY OF PARAMETERS THAT AFFECT PIVOTED SHOE JOURNAL BEARING PERFORMANCE IN HIGH-SPEED TURBOMACHINERY by Scan DeCamillo Manager, Research and Development Kingsbury, Inc. Philadelphia, Pennsylvania and Keith Brockwell Senior Research Officer National Research Council of Canada Institute for Aerospace Research Ottawa, Ontario, Cauada Scan DeCamillo is Manager of Research and Development for Kingsbury, Inc., in Philadelphia, Pennsylvania. He is respon- sible for design, testing, analysis, and development of Kingsbury fluid film bearings for worldwide industrial and military applications. He began work in this field in 1975 and has since provided engineering support to industry regarding problem solving, design improvement, application, and operation of hydrodynam- ic bearings in various machinery. During the course of his work, Mr. DeCamillo has developed pelformance and structural tools for bearing analysis, established design criteriafor power, naval, and nuclear applications, and has contributed information to ASM, AISI, EPRI, NASA, and API for various publications and specifications. He is an inventor and author of several technical papers. Mr. DeCamillo received his B.S. degree (Mechanical Engineer- ing) from Drexel University. He is a registered Professional Engineer in the State of Pennsylvania and a member of the Vibration Institute, ASM, ASME, and STLE. Keith Brockwell is a Senior Research Officer with the National Research Council of Canada's Institute for Aerospace Research, in Ottawa, Ontario, Canada. His major research interests are tribology, fluid film lubrication, and bearing technology. He has authored and coauthored close to 50 technical papers and reports dealing with these topics. Mr. Brockwell received his postgraduate training from Imperial College and Newcastle Polytechnic, England. Previous UK appointments included the Glacier Metal Company and Michell Bearings where he was Manager of the Design Services Department. He is a Chartered Engineer (UK), a Member of the Institution of Mechanical Engineers, and a Fellow of the Society of Tribologists and Lubrication Engineers. Mr. Brockwell is a member of the STLEIASME Tribology Conference Planning Committee, and was formerly an Adjunct Professor at the University of British Columbia, where his teaching interest was tribology. 9 ABSTRACT Journal bearing pad temperatures, oil flow requirements, and power losses can impose limitations on the design and operation of high-speed turbomachinery. Over the past few years, the authors have conducted extensive tests and studies of parameters that affect pivoted shoe journal bearing performance. A special, high-speed test rig is described, which was designed and built for the purpose of measuring bearing steady-state performance char- acteristics under light to moderately heavy loads, and to very high operating speeds that are being approached in new turbine and compressor designs. Instrumentation includes a detailed array of pad temperature detectors and the direct measurement of friction- al torque. Data are presented that compare the effects of pivot offset, oil flow, load orientation, method of lubrication, and oil discharge configuration on 6 inch diameter pivoted shoe journal bearing per- formance. The parameters are shown to significantly influence bearing pad temperature and power loss, particularly at high loads and speeds. Pad temperature profiles, isotherms, torque, and oil outlet temperatures are compared and evaluated. Discussions address the prediction and application of these parameters, and how they may be used to improve the capacity and performance of high-speed turbomachinery. The data and discussions are intended to provide useful information to engineers, programmers, and personnel involved with the study or operation of pivoted shoe journal bearings. INTRODUCTION Turbomachinery operating speeds and loads have increased over time resulting in increased bearing temperatures and power losses. Gardner and Ulschmid (1973) addressed the concern of journal bearing limitations at turbulent operation, documenting a dramatic increase in pad temperature and power loss of a 17 inch pivoted shoe bearing at 3600 rpm (267 fps surface speed). The pad was a center pivot design, which has the advantage of being able to operate in either direction of rotation. There are many technical papers that study center pivot journal bearings. Offset pivots improve journal bearing pad temperature limitations, but are not as well documented in literature. Large steam and gas turbine designers are presently consider- ing 22 inch and larger diameter journal bearings for power generation where surface speeds at 3600 rpm exceed 330 fps. Designers of steam turbines and compressors have intentions for operating speeds approaching 400 fps. Such conditions are well into the turbulent regime where conventional bearing losses and
Transcript of A STUDY OF PARAMETERS THAT AFFECT PIVOTED … Affecting... · A STUDY OF PARAMETERS THAT AFFECT...

A STUDY OF PARAMETERS THAT AFFECT PIVOTED SHOE JOURNAL BEARING PERFORMANCE IN HIGH-SPEED TURBOMACHINERY
by Scan DeCamillo
Manager, Research and Development
Kingsbury, Inc.
Philadelphia, Pennsylvania
and Keith Brockwell
Senior Research Officer
National Research Council of Canada
Institute for Aerospace Research
Ottawa, Ontario, Cauada
Scan DeCamillo is Manager of Research and Development for Kingsbury, Inc., in Philadelphia, Pennsylvania. He is responsible for design, testing, analysis, and development of Kingsbury fluid film bearings for worldwide industrial and military applications. He began work in this field in 1975 and has since provided engineering support to industry regarding problem solving, design improvement, application, and operation of hydrodynam
ic bearings in various machinery. During the course of his work, Mr. DeCamillo has developed
pelformance and structural tools for bearing analysis, established design criteriafor power, naval, and nuclear applications, and has contributed information to ASM, AISI, EPRI, NASA, and API for various publications and specifications. He is an inventor and author of several technical papers.
Mr. DeCamillo received his B.S. degree (Mechanical Engineering) from Drexel University. He is a registered Professional Engineer in the State of Pennsylvania and a member of the Vibration Institute, ASM, ASME, and STLE.
Keith Brockwell is a Senior Research Officer with the National Research Council of Canada's Institute for Aerospace Research, in Ottawa, Ontario, Canada. His major research interests are tribology, fluid film lubrication, and bearing technology. He has authored and coauthored close to 50 technical papers and reports dealing with these topics.
Mr. Brockwell received his postgraduate training from Imperial College and
Newcastle Polytechnic, England. Previous UK appointments included the Glacier Metal Company and Michell Bearings where he was Manager of the Design Services Department.
He is a Chartered Engineer (UK), a Member of the Institution of Mechanical Engineers, and a Fellow of the Society of Tribologists and Lubrication Engineers. Mr. Brockwell is a member of the STLEIASME Tribology Conference Planning Committee, and was formerly an Adjunct Professor at the University of British Columbia, where his teaching interest was tribology.
9
ABSTRACT
Journal bearing pad temperatures, oil flow requirements, and power losses can impose limitations on the design and operation of high-speed turbomachinery. Over the past few years, the authors have conducted extensive tests and studies of parameters that affect pivoted shoe journal bearing performance. A special, high-speed test rig is described, which was designed and built for the purpose of measuring bearing steady-state performance characteristics under light to moderately heavy loads, and to very high operating speeds that are being approached in new turbine and compressor designs. Instrumentation includes a detailed array of pad temperature detectors and the direct measurement of frictional torque.
Data are presented that compare the effects of pivot offset, oil flow, load orientation, method of lubrication, and oil discharge configuration on 6 inch diameter pivoted shoe journal bearing performance. The parameters are shown to significantly influence bearing pad temperature and power loss, particularly at high loads and speeds. Pad temperature profiles, isotherms, torque, and oil outlet temperatures are compared and evaluated. Discussions address the prediction and application of these parameters, and how they may be used to improve the capacity and performance of high-speed turbomachinery. The data and discussions are intended to provide useful information to engineers, programmers, and personnel involved with the study or operation of pivoted shoe journal bearings.
INTRODUCTION
Turbomachinery operating speeds and loads have increased over time resulting in increased bearing temperatures and power losses. Gardner and Ulschmid (1973) addressed the concern of journal bearing limitations at turbulent operation, documenting a dramatic increase in pad temperature and power loss of a 17 inch pivoted shoe bearing at 3600 rpm (267 fps surface speed). The pad was a center pivot design, which has the advantage of being able to operate in either direction of rotation. There are many technical papers that study center pivot journal bearings. Offset pivots improve journal bearing pad temperature limitations, but are not as well documented in literature.
Large steam and gas turbine designers are presently considering 22 inch and larger diameter journal bearings for power generation where surface speeds at 3600 rpm exceed 330 fps. Designers of steam turbines and compressors have intentions for operating speeds approaching 400 fps. Such conditions are well into the turbulent regime where conventional bearing losses and

Test Rig
• 6 inch Test Shaft
• Speed to 16000 rpm
• Loads to 5500 Ibs
~co.e l1li __ . _a_a _BII_--.J
o '
Figure Test Rig SchemCltic. 1.
10 PROCEEDINGS OF THE 30TH TURBOMACHINERY SYMPOSIUM
temperatures become so high that options must be considered to address limitations. Direct lubrication is one solution that has been successfully applied in thrust bearings for many years, and also in special journal bearing applications dating back to the mid-sixties. It is only recently that direct lube journal bearings have been seriously considered for general turbomachinery applications because high surface speeds now warrant such a consideration.
As in the case of offset pivots, technical papers on direct lube journal bearings are sparse. Data are published by Tanaka (1991) and Tanaka and Mishima (1989) comparing 100 mm (3.94 inch) diameter designs to 137 fps; Harangozo, et a1. (1991), tested 5 inch diameter bearings to 152 fps; and Fillon, et a1. (1993), report on 100 mm (3.94 inch) diameter data to 70 fps. The authors' (Brockwell, et aI., 1992, 1994; Dmochowski, et aI., 1993) tested 3.88 inch diameter, leading-edge-groove (LEG) designs to 270 fps; DeCamillo and Clayton (1997) provide data on an 18 inch LEG generator bearing at 283 fps; and Edney, et a1. (1996), report on 5 inch diameter LEG steam turbine bearings running to 312 fps.
In assessing bearing limitations, there are many parameters that affect results including geometry, operating conditions, and even instrument location. For example, DeChoudhury and Barth (1981) show that the drop in oil outlet temperature between the bearing and drain line can lead to significant differences in thermal balance calculation of power loss. Pinkus (1990) describes peculiar behavior between laminar, transitional, and high-speed turbulent regimes of bearing operation. Pettinato and DeChoudhury (1999) note high edge temperatures from misalignment in ball-in-socket pivot geometry. Wygant, et a1. (1999), show differences in steadystate and dynamic performance attributed to restriction of pad motion by friction in sliding contact pivots. Conventional flooded journal bearings were used in these references. The flooded journal bearing design has been studied for many years, and information is available for a wide range of operating loads and speeds.
In contrast, the few published papers on direct lube journal bearings cited earlier mostly report on low speed operation, in the laminar to transitional range of operation. There is some disagreement regarding the magnitude of the benefits of direct lubrication. This may be due to laminar/transitional influences, but there are also differences in the method of direct lubrication, as well as the type of pivot, instrument location, etc. In general, all references agree that direct lubrication provides pad temperature benefIts that appear to improve with load and speed. There is also agreement that direct lube power loss is lower, although most authors report that thermal balance methods are of insufficient precision to allow an accurate assessment. Benefits are typically attributed to eliminating seal losses and reducing churning losses, but these are hypothetical because there are little data available for confirmation.
In order to address such issues, a special test rig was designed and built to measure steady-state performance under light to moderately high loads, and to very high operating speeds that are being approached in new turbine and compressor designs. An important feature of the rig is the direct measurement of frictional torque, which provides a more precise measurement of power loss than thermal balance techniques. Over the past few years, the authors have conducted extensive tests and studies of parameters that affect the performance of pivoted shoe journal bearings. The purpose of this work is to improve the capacity and performance of high-speed turbomachinery by extending bearing speed and/or load limitations and improving efficiency.
TEST RIG
Tests were performed on a new rig designed to investigate steady-state performance under high operating speeds and light to moderately heavy unit loads. The test apparatus is illustrated in Figure 1 and consists of a test bearing, the shaft and drive system, the loading system, and the rig supporting structure.
The test shaft is driven by alSO hp variable speed DC electric motor. A belt and pulley system connects the motor to the test shaft and provides a 4.5: 1 speed step-up giving a maximum shaft speed of just over 16,000 rpm. The DC motor is linked to an electronic controller that ensures speed control to within ± 1 percent accuracy. The test shaft is supported by two 3.5 inch diameter pivoted shoe journal bearings spaced approximately 28 inches apart. The test shaft journal is 6 inches in diameter with circularity within 0.0005 inch. Shaft speed is measured using a slotted optical switch in conjunction with a shaft-mounted disk containing a number of drilled holes. This was found to be a robust system capable of reliable operation even at the top speed of the test facility.
An important feature of the rig is the direct measurement of frictional torque. This is accomplished by the design of the test housing (Figure 2). The two-piece housing is positioned on the test shaft, midway between the support bearings. The bottom face has been accurately machined and sits in a spherical hydrostatic bearing that eliminates friction between the housing and the loading device. The housing is held against rotation by a 100 lb capacity load cell mounted to a torque arm. Power loss is determined from the measured frictional force, and radii of the torque arm and bearing bore. The spherical hydrostatic bearing also provides good alignment between the test bearing and shaft. A second plane hydrostatic bearing supports the spherical hydrostatic bearing. This provides lateral freedom and allows the load line to be adjusted in relation to the test bearing. Proximity probes mounted on both ends of the test bearing housing measure the horizontal and vertical displacements of the test bearing with respect to the position of the shaft. These probes also provide an indication of the level of alignment between the test bearing and the shaft.
A pneumatic cylinder located between the test housing and base of the rig (Figure 1) generates the static load. This has a capacity of 5500 lb. Three load cells located between the top of the load applicator and the bottom surface of the plane hydrostatic bearing measure the vertical load applied to the test bearing. The load cells are arranged in such a way that they each share an equal proportion (one-third) of the load applied to the bearing. In calculating the net load on the test bearing, the combined weight of the test bearing, housing, and the hydrostatic bearing system is accounted for.
A pump with a capacity of 20 gpm and a maximum supply pressure of 300 psig delivers oil to the test bearing from alSO gallon capacity tank. The flowrate is measured by a turbine type flowmeter with a linear flow range of 2.5 to 29 gpm. Feed oil temperature is measured before it enters the test bearing, and is controlled by a water-oil heat exchanger to ± 1°C (33.8°F). An industrial type pressure transducer with a pressure range of zero to
Measurement
of Frictional Torque
(Power Loss)
Figure 2. Test Housing and Torque Measurement System.
Table 1. Test Rig Measurement Uncertainties.
Measurement Tyj>e of sensor Limit of error of sensor Temperature Type T thermocouple I 'c or 0.75%
(whichever is greater) Shaft speed Optical switch ± 5 rpm Bearing load 0-2000 lb. load cells (x 3) ± 5 lb. at full scale Friction force 0-100 lb. load cell ± 0.1 lb. at full scale Displacements Eddy current proximity probes ± 0.00004 in Oil flowrate Turbine flow meter ± 0.5% of reading Oil supply pressure Pressure transducer ± 0.6Iblin" Leading edge groove Miniature pressure transducer ± 0.75 Ib/in oil pressure Drive motor power Power cell ± 10 hp consumption
45 Type T thermos .020" below surface Load
c'cw rotation
III
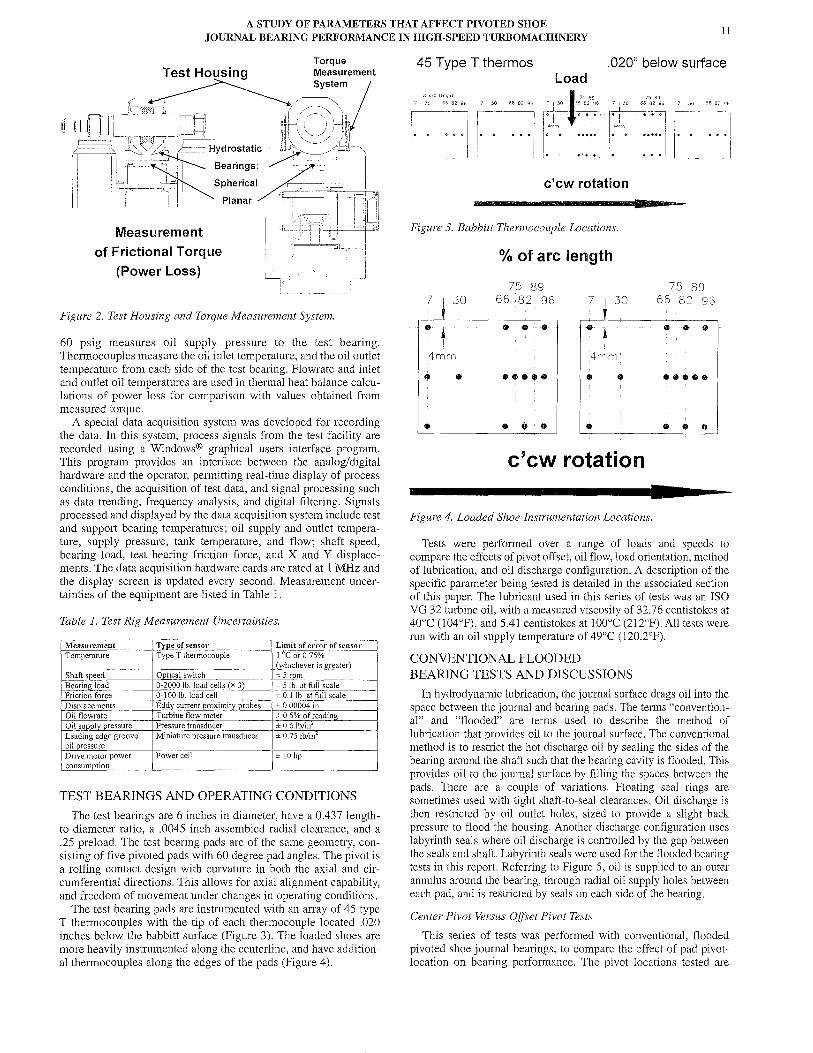
Figure 3. Babbitt Thermocouple Locations.
% of arc length
75 89 66 82 96 7 • 30 82
., ., . 75 89
66 7 t 96 30 . . ., • • • •••• • • •••••
• o • • • • • •
c'cw rotation
Figure 4. Loaded Shoe Instrumentation Locations. •
A STUDY OF PARAMETERS THAT AFFECT PIVOTED SHOE JOURNAL BEARING PERFORMANCE IN HIGH·SPEED TURBOMACHINERY
11
60 psig measures oil supply pressure to the test bearing. Thermocouples measure the oil inlet temperature, and the oil outlet temperature from each side of the test bearing. Flowrate and inlet and outlet oil temperatures are used in thermal heat balance calculations of power loss for comparison with values obtained from measured torque.
A special data acquisition system was developed for recording the data. In this system, process signals from the test facility are recorded using a Windows® graphical users interface program. This program provides an interface between the analog/digital hardware and the operator, permitting real-time display of process conditions, the acquisition of test data, and signal processing such as data trending, frequency analysis, and digital filtering. Signals processed and displayed by the data acquisition system include test and support bearing temperatures; oil supply and outlet temperature, supply pressure, tank temperature, and flow; shaft speed, bearing load, test beating friction force, and X and Y displacements. The data acquisition hardware cards are rated at 1 MHz and the display screen is updated every second. Measurement uncertainties of the equipment are listed in Table 1.
TEST BEARINGS AND OPERATING CONDITIONS
The test bearings are 6 inches in diameter, have a 0.437 lengthto-diameter ratio, a .0045 inch assembled radial clearance, and a .25 preload. The test bearing pads are of the same geometry, consisting of five pivoted pads with 60 degree pad angles. The pivot is a rolling contact design with curvature in both the axial and circumferential directions. This allows for axial alignment capability, and freedom of movement under changes in operating conditions.
The test bearing pads are instrumented with an alTay of 45 type T thermocouples with the tip of each thermocouple located .020 inches below the babbitt surface (Figure 3). The loaded shoes are more heavily instrumented along the centerline, and have additional thermocouples along the edges of the pads (Figure 4).
Tests were performed over a range of loads and speeds to compare the effects of pivot offset, oil flow, load orientation, method of lubrication, and oil discharge configuration. A description of the specific parameter being tested is detailed in the associated section of this paper. The lubricant used in this series of tests was an ISO VG 32 turbine oil, with a measured viscosity of 32.76 centistokes at 40 0 e (l04°F), and 5.41 centistokes at lOOoe (212°F). All tests were run with an oil supply temperature of 49°e (120.2°F).
CONVENTIONAL FLOODED BEARING TESTS AND DISCUSSIONS
In hydrodynamic lubrication, the journal surface drags oil into the space between the journal and bearing pads. The terms "conventional" and "flooded" are terms used to describe the method of lubrication that provides oil to the journal surface. The conventional method is to restrict the hot discharge oil by sealing the sides of the bearing around the shaft such that the bearing cavity is flooded. This provides oil to the journal surface by filling the spaces between the pads. There are a couple of variations. Floating seal rings are sometimes used with tight shaft-to-seal clearances. Oil discharge is then restricted by oil outlet holes, sized to provide a slight back pressure to flood the housing. Another discharge configuration uses labyrinth seals where oil discharge is controlled by the gap between the seals and shaft. Labyrinth seals were used for the flooded bearing tests in this report. RefelTing to Figure 5, oil is supplied to an outer annulus around the bearing, through radial oil supply holes between each pad, and is restricted by seals on each side of the bearing.
Center Pivot Versus Offset Pivot Tests
This series of tests was performed with conventional, flooded pivoted shoe journal bearings, to compare the effect of pad pivotlocation on bearing performance. The pivot locations tested are

Seals Seals
1.==.' 1 Oil outlet 4~~~t~
Figure 5. Conventional (Flooded) Bearing Lubrication.
50% offset 60% offset (center pivot) (offset pivot)
Figure 6. Center and Offset Pivot Geometry.
• Center Pivot GEl Offset Pivot
130 }--
- -Coad r} 120
!J Bearing Load On \':,
+ ~ §: 110 Pad e
E " 100
l LOP .. ~ ()? ~
=::::::::::::::::::::::::::::::::::::::::::====:::::::::::~~==-- .. Rotation '" Co E 90
~ ~ 80 0..
70 r
45 90 135 180 225 270 315 360
position (deg.)
Figure 7. Pad Temperature Profiles, LOp, 200 PSI, 3600 RPM.
shown schematically in Figure 6. The center pivot design has the pivot located in the center of the pad, 50 percent of the pad arc length from the leading edge in the direction of rotation. The offset pivot design has the pivot located at 60 percent of the pad arc length from the leading edge. Other than the location of the pivot, the bearing geometry for the two sets of pads is identical.
Pad Temperature Profiles
Pad temperature profiles are obtained by plotting the centerline thermocouple temperatures against the relative angular position of the detector in the bearings as depicted in Figure 7. This figure is for a load-on-pad (LOP) orientation where the load is directed toward a single pad. The loaded pad data are in the center of the figure. As speed and load are increased (Figures 8 and 9), the loaded pad temperature increases and will eventually limit the application. Figure 10 compares the loaded pad temperature profiles plotted according to position along the pad arc length.
130
120
§: lID
e " ~ 100
" Co E 90
~ "0 80 f1.
• Center Pivot
70 .. ... -
I~ 60 \rr""
I'J Offset Pivot
45 90 135 180 225 270 315
position (deg.)
Figure 8. Pad Temperature Profiles, LOP, 200 PSI, 9000 RPM.
140
130
120
§: 110
e " e 100
" Co E 90
~ ~ 80
70
60
50
• Center Pivot I'J Offset Pivot
()?~
~+L~ t::t::::
~ / f
" .J ;7 po
45 90 135 180 225 270 315
position (deg.)
Figure 9. Pad Temperature Profiles, LOP, 320 PSI, 9000 RPM.
• Center Pivot ill Offset Pivot 140 ~-~------------~------
130
120
§: 110
e " E 100
" Co E 90
~ -g 80 0..
70
60
360
360
50L-_~_-L_~ __ L-_~_-L_~ __ ~_-L_~
o 10 20 30 40 50 60 70 80 90 100
position (%arc)loaded pad
Figure 10. Loaded Pad Temperature Profiles, LOp, 320 PSI, 9000 RPM.
12 PROCEEDINGS OF THE 30TH TURBOMACHINERY SYMPOSIUM
Pad SUiface Isotherms
Before any comparisons are made, it is useful to look at the entire pad surface profile. This is generated by curve fitting data from the array of thermocouples in the loaded pad surface. Figure II is an isometric view of the loaded, center pivot pad. Figure 12 is the same data looking directly at the babbitt face. Figures 13 and

A STUDY OF PARAMETERS THAT AFFECT PIVOTED SHOE JOURNAL BEARING PERFORMANCE IN HIGH-SPEED TURBOMACHINERY
13
14 are similar plots for the loaded, offset pivot pad under identical conditions of load, speed, and oil flow. The surface temperature profiles are important in that they show if the pad is aligned with the shaft or if there is edge or skew loading that can distort comparisons and lead to erroneous conclusions. The symmetric patterns of Figures II through 14 indicate good axial alignment between the loaded pad and shaft, which is attributed to the alignment capability of the rolling contact pivot design. Another observation is that there is a fairly substantial axial temperature gradient noticeable in the figures. Temperature drops 15 to 20 De (59 to 68 DF) from the center hot spot to the sides of the pad for the operating conditions shown.
ilil-130:135! i L'i! 125-130;
'11!l120-125: L'i! 115-120
110-115:
0105-110; ':=i100-105i
iD95-100 I !O 90-95
if] 85-90 iD80-85 i El75-80 , I Iii! 70-75
1l11li65-70 :1I!I60-65 I 1 l1li 55-60 i 11150-55
Figure 11. Center Pivot Pad Suiface Isotherm, Isometric, LOP, 320 PSI, 9000 RPM.
:-D130-135-!
1II1II 125-1301
I Gill 120-1251
!1J115-120! IIi!l 110-1151
SE I EiiJ 105-110! f! I 0 100~105i ~ I Ci 95-100 '
8. 1090-95 E I ~ 1085-90 '0 ;080-85 &. li!il 75-80
: Gill 70-75 , i l1li65-70
iGill60-65 i I Gill 55-60 , ' i_~ __ ~O:.2§ __ J
Figure 12. Center Pivot Pad Surface Isotherm, Plan View, LOp, 320 PSI, 9000 RPM.
Pad Temperature Comparisons, Center Versus Offset Pivot
A study of pad surface isotherms indicated that the pads were aligned with the shaft, and that peak temperatures were located along the circumferential centerline for the conditions tested. With this assurance, centerline pad temperature profiles can be used to provide an accurate indication of the highest pad temperatures.
Figures 15 through 17 are pad temperature profiles for a loadbetween-pad (LBP) orientation where the test load is applied directly between the two bottom pads. LBP pad temperature response is similar to the LOP data of Figures 7 through 9 in that as speed and load are increased, the loaded pad temperatures also
iI!!l130--;35i
135 ! 1iII125-130! Iliil120-125i jill! 115-1201
ilill110-115 1
!Cci 105-110[ §: i!::l100-105! e 'IU95-100'
~ 1090-95 !
~ : [] 85-90 ~ Ie'] 80-85 I- , 'tl ii2l75-80 &. I Ill! 70-75
11I!III65-70 1111160-65 i
IU55-60 I LiII 50-55 _J
Figure 13. Offset Pivot Pad Suiface Isotherm, Isometric, LOp, 320 PSI, 9000 RPM.
111130-135
l11li125-130:
!ill 120-125
!Jl! 115-120;
SE :&\l110-115!
: Ell 105-110' ~ -: 100-105 .a r: i:J 95-100 <l> 0- :090-95 E ill [] 85-90 I-"0 80-85 <U n.
! &175-80
Ill! 70-75
,11165-70
, 1IlI60-65
'l1li55·60
l~~Q:!5!5._
Figure 14. Offset Pivot Pad SUiface Isotherm, Plan View, LOp, 320 PSI, 9000 RPM.
increase. For LBP orientation, it is noted that the second loaded pad in direction of rotation runs hotter than the first loaded pad, The effect is most noticeable at the higher load and speed. This is attributed to hot oil carryover. That is, a pad's temperature is influenced by oil from the preceding pad. The unloaded pad preceding the first loaded pad has relatively cool temperatures. The second loaded pad is influenced by much hotter oil from the first loaded pad. And so, for LBP orientation, the second loaded pad temperature becomes the limiting factor. Figure 18 compares second loaded pad temperature profiles for the center and offset pivot designs.
StUdying LOP Figures 7 through 9 and LBP Figures 15 through 17, similar trends can be detected for the center and offset pivot designs and for LOP and LBP orientation. Except at the lowest speed and load where temperature profiles are fairly level, temperatures for all pads are lowest at the leading edge and increase toward the trailing edge. The temperature levels of all pads, and the temperature gradient from leading to trailing edge of all pads increase with speed. The temperature levels and gradient of the loaded pads increase with load. Other trends observed in this study are difficult to show in the few, reduced figures. A minor reduction in unloaded pad temperatures was noticed with increased load. The hottest temperature location of the loaded pads moved toward the trailing edge as speed was increased. This trend is reversed for increased load.

14 PROCEEDINGS OF THE 30TH TURBO MACHINERY SYMPOSIUM
• Center Pivot [gjJ Offset Pivot
J40 ~------------------------------------------,
130
120
§: 110
~ :l f 100
" Co E 90
~ ~ 80
LBP
Load
Between
Pads
Bearing Load
I 0. F==========:@~~ Rotation
70
60
50~~ 45 90
~ ... ~ ...
135 180 225 270
~ 315
position (deg.)
Figure 15. Pad Temperature Profiles, LBP, 200 PSI, 1800 RPM.
+ Center Pivot III Offset Pivot 140
~ 130 fl )J. 120 ~+cO
§: 110
~ :l ~ 100
" Co E 90
jJ " I-"0 80 " 0.
70 ~ .. ~ 60
50
45 90 135 180 225 270 315
position (deg.)
Figure 16. Pad Temperature Profiles, LBP, 200 PSI, 9000 RPM.
• Center Pivot III Offset Pivot
360
360
140 r-------------------------------------------~
70~./ 60
45 90 135 180 225
position (deg.) 270
2nd loaded pad
315
Figure 17. Pad Temperature Profiles, LBP, 320 PSI, 9000 RPM.
360
Differences between center and offset pivot temperatures are also noticeable in Figures 7 through 9 and 15 through 17. In all cases, the offset pivot runs with cooler overall pad temperatures, particularly noticeable on the loaded pads. Figure 10 for LOP and Figure 18 for LBP focus on the hotter, loaded pad. For the center pivot, the pad temperature is noticed to increase to a maximum at a position of 82 and 89 percent of the arc length for LOP and LBP, respectively, after which it falls to a lower level. For the offset pivot
• Center Pivot III Offset Pivot 140r---------------------~--,_----------------,
130
120
10 20 30 40 50 60 70 80 90 100
position (%arc) 2nd loaded pad
Figure 18. Loaded Pad Temperature Profiles, LBP, 320 PSI, 9000 RPM.
design, the pad temperatures reach a maximum close to the trailing edge of the pad. These observations are consistent with 3.88 inch diameter results in earlier work by the authors (Brockwell, et aI., 1994). For the range of loads and speeds tested, the center pivot maximum temperature varied between the 65 percent and 90 percent location. The offset pivot maximum temperature varied between the 82 percent location and trailing edge. The specific location of the maximum temperature varied with speed and load.
To further reduce the data for generalized comparison, it is helpful to view a single location. The 75 percent position is a typical location used in industry (Nicholas, 1994) and is recommended in many specs such as American Petroleum Institute (API). With the entire profile measured in detail, and data showing different maximum temperature locations for the center and offset pivot designs, some authors choose to compare maximum measured temperatures (Simmons and Lawrence, 1996). Figures 19 through 22 compare 75 percent location and maximum temperatures for LOP and LBP orientation at 100 percent of recommended flow. The speed range for these comparisons was limited because the lubrication system could not provide the recommended flow for higher speeds. However, tests were also performed with 50 percent flow, shown in Figures 23 and 24.
140,-----------------------------------------,
130
120
u i 110 ::s ~ 100 (]) Co E 90 (])
I-
-g 80 c..
70
60
o
- Center Pivot
........ Offset Piv ot
0320 psi
o 200 psi
2000 4000 6000 8000 10000 12000 14000 16000
Shaft rpm
Figure 19. 75 Percent Location Pad Temperatures, LOP
The change in slope and inflection noticeable in Figures 23 and 24 indicate that the speed range covers laminar, transitional, and turbulent operating conditions. Figures 19 through 24 show that the offset pivot design has lower 75 percent location and lower maximum temperatures than the center pivot design for all conditions

A STUDY OF PARAMETERS THAT AFFECT PIVOTED SHOE JOURNAL BEARING PERFORMANCE IN HIGH-SPEED TURBOMACHINERY
15
140 ,-----------------------------------------~
130
120
u ~ 110 e ::l ..... 100 -~ Ql C. E 90 -Ql I-"C 80· <U 0...
70
60
50 0
- Center Pivot ........ Offset Pivot
0320 psi o 200 psi
2000 4000 6000 8000 10000 12000 14000 16000
Shaft rpm
Figure 20. Maximum Pad Temperatures, LOP.
140,---------------------------------------,
130
120
Q: 110 e .a 100 -I!! Ql C. E 90 -Ql I-"C 80 <U 0...
70 -
60 -
50 0
- Center Pivot ........ Offset Piv ot
---0----0
_ . ..8
<:::~:er-··~·-8-.--·.Q---1T· .,..,p 0320 psi
o 200 psi
2000 4000 6000 8000 10000 12000 14000 16000
Shaft rpm
Figure 21. 75 Percent Location Pad Temperatures, LBP.
140 -,-----------------------------------------,
130
120
u ~ 110 e ::l
~ 100-Ql C. E 90-~ -g 80 0...
70
60
- Center Pivot ........ Offset Pivot
0320 psi o 200 psi
50-·~, ----,---~----,----.----,---_,----,_--~
o 2000 4000 6000 8000 10000 12000 14000 16000
Shaft rpm
Figure 22. Maximum Pad Temperatures, LBP.
tested. The 75 percent location temperatures are as much as 20°C (68°F) cooler, and maximum temperatures are up to lOoC (50°F) cooler than the center pivot pad temperatures. The benefit is noticed to improve with speed and load, and extends through the laminar, transitional, and turbulent regimes of operation.
140-,---------------------------------------.
130 _ - Center Pivot ........ Offset Pivot
120
Q: 110 e .a I!! 100 Ql C. 0'-E 90-
•. "g.' •. ,- -f.Y -- -0--" .G"'···" ~ "C 80 ~
70
60 o 200 psi
50+---_.----,_--_,----,----,----,_--~--~
o 2000 4000 6000 8000 10000 12000 14000 16000
Shaft rpm
Figure 23. 75 Percent Location Pad Temperatures, LOp, 50 Percent Flow.
140 ,-----------------------------------------,
130
120
u ~ 110 ~ ::s ..... 100 I!! C1> c. E 90 -C1> I-"C 80 <U 0...
70
60 -
50 0
- Center Pivot ........ Offset Piv ot
.' , .•• (J
""
,.'
o 200 psi
2000 4000 6000 8000 10000 12000 14000 16000
Shaft rpm
Figure 24. Maximum Pad Temperatures, LOp, 50 Percent Flow.
Power Loss Comparisons, Center Versus Offset Pivot
Power loss using frictional torque measurements are compared in Figures 25 and 26 for select cases of load orientation and flow. These figures are representative of the cases studied. For 100 percent flow (Figure 25), there was a slight but noticeably higher power loss for the offset pivot design, which is consistent with theory. Cooler temperatures have higher oil viscosities and, therefore, more frictional drag. In the case of 50 percent flow (Figure 26), there was no measurable difference in power loss between the offset and center pivot designs. It may be that the higher pad temperatures negate any measurable difference. Considering all test cases, a fair conclusion is that offset pivot power losses were the same to slightly higher than the center pivot design.
Reduced Oil Flow
Figure 27 compares the effects of reducing oil flow by 50 percent for the center pivot LOP configuration. One would expect pad temperatures to increase with reduced flow across the range of conditions. However, Figure 27 shows that only higher speed tern· peratures are affected, a phenomenon also noted by DeChoudhury and Masters (1983). The authors have similar experience in independent thrust bearing tests. Specifically, some variation in pad temperature with flow at low speed, an intermittent range where flow has little effect, and a significant variation of pad temperature

16 PROCEEDINGS OF THE 30TH TURBOMACHINERY SYMPOSIUM
80 ~-- --~--- .------.-~--~-~--~-~,
70
60
~ 50 I/) I/)
.3 40
~ o 30 a.
20 -
- Center Pivot
........ Offset Pivot
o 2000 4000 6000 8000 10000 12000 14000 16000
Shaft rpm
Figure 25. Center Versus Offset Pivot Power Loss, LOP, 100 Percent Flow. 80,----------------------,
70
60
~ 50 I/) I/) 0 40 -
..J .. Q)
:: 30 -0 a.
20
10
- Center Pivot
........ Offset Piv ot
o 200 psi
o 2000 4000 6000 8000 10000 12000 14000 16000
Shaft rpm
Figure 26. Center Versus Offset Pivot Power Loss, LEP, 50 Percent Flow. 140,---------------------~
130
120
Q: 110 l!! ~ 100 Q) a.
- Center Pivot, 100% Flow
........ Center Pivot, 50% Flow
~ 90-
-g 80 a.
70
60
0320 psi
o 200 psi
o 2000 4000 6000 8000 10000 12000 14000 16000
Shaft rpm
Figure 27. 75 Percent Location Pad Temperatures, LOp, 50 Versus 100 Percent Flow.
with flow at high speeds. These appear to coincide with the laminar, transitional, and turbulent film regimes. And so it would seem that the observed phenomenon is associated with film turbulence.
Be that as it may, the purpose of the work is to improve bearing limitations. Flow reduction for the center pivot design is inappropriate because pad temperatures (Figure 27) are already high. However, the lower temperatures of the offset pivot design may allow for an improvement in efficiency with reduced oil flow.
With center pivot pad temperatures as a baseline, Figure 28 compares the effects of decreasing the offset pivot bearing oil flow for a LOP orientation at 320 psi projected load and 10,660 rpm. For a 50 percent reduction in flow, the offset pivot loaded pad temperatures increase fairly evenly from leading to trailing edge, such that the entire pad is running approximately lOoe (50°F) hotter. With 50 percent flow, the offset pivot 75 percent location is still cooler than the center pivot baseline, but the maximum pad temperature is hotter. The question as to which comparison should be used to judge the two designs becomes more relevant.
... center pivot 100% flow
140 r-______ ~--~---------~§~oTff~s~e~tP~iv~o~t~5~O~%~f~lo~w_,
130
120
£ liD
e! " E 100
" Co E 90
~ -g 80 Q.
70
60
i ... qffset pivot 100% flow ----_··-'----1 --- --~-"------.-!.-.. -----------
i i --.~--.-- ---I ------------1----- ---+----~ -
------.. ~-----i------------~-_+7""__r
50 L-__ ~_~ __ ~ _ _L_~ __ ~ _ _L ___ L__~_~
o 10 20 30 40 50 60 70 80 90 100
position (%arc) loaded pad
Figure 28. Effects of Flow on Loaded Pad Temperature Profiles, LOp, 320 PSI, 10,660 RPM.
In the authors' experience, both are important. Maximum pad temperature is of concern in regard to the oil, where additives and base stock can break down or deposit on the pad surfaces causing bearing temperatures to increase over time. In regard to the bearing, the 75 percent location is a general area known from experience to suffer distress under adverse conditions. This is typified by Figure 29, which shows mechanical fatigue of the babbitt near the 75 percent location of a center pivot pad. The 75 percent location is only a rule-of-thumb. The actual location changes with load and speed and is also influenced by other parameters. A technically valid comparison requires an analysis of pressure and temperature related to mechanical criteria for the babbitt. One method used by the authors is as follows:
rt Figure 29. Mechanical Fatigue on a Center Pivot Pad.

A STUDY OF PARAMETERS THAT AFFECT PIVOTED SHOE JOURNAL BEARING PERFORMANCE IN HIGH· SPEED TURBOMACHINERY 17
Figure 30 is a plot of yield point versus temperature based on data from ASTM-B23 for grade 2 babbitt. In the normal range of bearing operating temperatures, the yield point is approximately 4000 psi at 70°C (I58°F), and reduces to 2000 psi at 130°C (266°F). The purpose of the figure is to establish a material reference point to judge the two designs.
6000
~ 5000 Q.
-; 4000 ... ~ til 3000 e !l. 2000
1000
ASTM 8-23 Grade 2 White Metal Yield Point (O.125% of Gage length)
o +.----.-.-.,----~. o 20 40 M W 100 1~ 1~ 1M 1W
Temperature (C)
Figure 30. Babbitt .125 Percent Offset Yield Point.
Figure 31 plots the calculated pressure profile and curve-fitted measured pad temperatures for the center pivot pad of Figure 28. Notice that the peaks occur at different locations such that at peak temperature, the pressure on the babbitt is very low and at peak pressure, the temperature is low. Figure 32 is a similar plot for the offset bearing with 50 percent flow. By comparing the pressure and temperature to the babbitt yield point, the condition along the pad arc can be evaluated. For example, from Figure 31 at the 52 percent location, the film pressure and temperature are 1400 psi and 91°C (195.8°F), respectively. From Figure 30, the yield point at 91°C (195.8°F) is 3200 psi. The ratio of the film pressure to yield point is 1400/3200 psi = .46 for this location. By repeating this procedure for each position along the pad, a map of the pressure to yield ratio can be generated as shown in Figure 33. The closest approach to the yield point is found at the 62 percent location for the center pivot design, and at the 82 percent location for the offset pivot design. The highest ratio for each is approximately .47 or, in other words, both have a worst case pressure location that is 47 percent of the babbitt yield point.
140
130
120
Q: 110
~ 100 '" ~
ell 90 C. E ell 80 I-
70
60
50
• Pressure (psi) II1II Temperature (C)
Pressure Profile
Temp, Profile
1750
1500
1250 ~ ~
1000 i1l
~ 750 D.
500
250
~--,-----.-------.---___.--___.-----.-----.-----.--___,--~O
0 10 20 30 40 50 60 70 80 90 100
position (% arc) loaded pad
Figure 31. Center Pivot Loaded Pad Pressure and Temperature Profiles, 100 Percent Flow.
The comparison shows that the offset pivot bearing running with 50 percent flow and the center pivot bearing running with 100
ill Pressure (psi) r:il Temperature (C)
140 ,-------------------------.------------~ 2000
130
120·
Q: 110·
~ .a 100·
~ ~ 90 E ~ 80
70
60
Pressure Profile
1750
1500
1250 ~ ~
1000 i1l
~ 750 D.
500
250
50~--.___--.---___..______.--___.-----.--___,--___,--___,--~0
o 10 20 30 40 50 60 70 80 90 100
position (% arc) loaded pad
Figure 32. Offset Pivot Loaded Pad Pressure and Temperature Profiles, 50 Percent Flow.
1.00
0.90
1: 0.80 '8. 0 .70 '0 ]! 0.60 >. - 0.50 'w C.OAO E 'i: 0.30
g 0.20 ns !r 0.10
0.00
I. J I
-+- Center Pivot, 100% flow 1:_ -- ~---
.~ Offfiet P;"'tj='n--f--.
--_. : L ~ --'L 1--.¥'~ ... - ~ "'-.
K' ,/ /1-'"' .~ 1\
A'" <'" ~ .'\ \ /. ....---'1'--- \ ~
~:::--- 1 ,\ ,
o 10 20 30 40 50 60 70 80 90 100
position (% arc)
Figure 33. Ratio of Film Pressure to Babbitt Yield Point, LOp, 320 PS1, 10,660 RPM.
percent flow are equivalent in regard to the integrity of the babbitt for the operating condition shown. This exercise also brings out two important points. First, the closest approach to the yield point occurs at a location before the peak temperature. Second, this location is quite different between the offset and center pivot designs, and is not obvious from the temperature profiles of Figure 28 alone.
To complete the study on improving efficiency, Figure 34 compares power loss for the offset pivot pad with 50 percent flow to the center pivot pad with 100 percent flow. There is a reduction in power loss on the order of 10 to 20 percent, which provides a small increase in machine efficiency. With reduced flow, the offset pivot bearing's oil outlet temperatures are 5°C (41°F) higher (Figure 35). The higher outlet temperatures would need to be checked to assure they are still within acceptable specification limits. (Please note that this section compares only one test condition, and is not intended as recommendation to reduce flow by 50 percent in all applications.)
LOP Versus LBP Orientation
When a LOP bearing application is running hot, it is straightforward to assume that reorienting the bearing for LBP will significantly reduce pad temperature, because the load would then be shared by two shoes. In a five-pad bearing, the unit pad load is reduced 38 percent going from LOP to LBP orientation. However, earlier figures indicate that the second loaded pad ran up to l2°C (53.6°F) hotter than the first loaded pad in LBP tests.

]8 PROCEEDINGS OF THE 30TH Tl'RBOMACHI:\ERY SYMPOSIUM
70
60
~ 50 (/j (/j
0 40 -...J
t ~ 30 0 a.
20
10
o
- Center Pivot
........ Offset Pivot
~,~'
-,"If"-
,.0 -'
0320 psi
2000 4000 6000 8000 10000 12000 14000 16000
Shaft rpm
Figure 34. Power Loss-Center Pivot 100 Percent Flow Versus Offset Pivot 50 Percent Flow.
90-,------------------------------------------,
85
80
Q: 75 ~ :::>
~ 70 Ql a. E ~ 65-
60 -
55
o
- Center Pivot
........ Offset Pivot
0320 psi
2000 4000 6000 8000 10000 12000 14000 16000
Shaft rpm
Figure 35. Drain Temperature-Cellter Pivot 100 Percent Flow Versus Offset Pivot 50 Percellt Flow.
Figure 36 compares temperature profiles for LOP and LBP orientations for the center pivot bearing at identical operating conditions. It is noticed that the hottest pad temperature for each orientation reaches similar levels, just above lOOoe (212°F). In other words, there is not a significant reduction in pad temperature going from LOP to LBP orientation for the case shown. Figure 37 compares pad temperature profiles of the LOP loaded pad with the LBP second loaded pad. There is little difference in pad temperature profile between the two orientations.
Figure 38 plots center pivot 75 percent location pad temperatures, and Figure 39 plots offset pivot power loss measurements comparing LOP and LBP performance. These figures were chosen to represent general observations of a study of all operating conditions tested that include center and offset pivots at various flows and over a range of operating loads and speeds. LBP orientation in most cases ran with lower pad temperatures than the LOP configuration, but not as much as would be expected. This is attributed to the effects of hot oil canyover. In general, the temperature benefits of LBP orientation improve with load and speed. In regard to power loss, there was no measurable difference between LOP and LBP orientation (Figure 39).
140
130
120
~ 110
~ " E 100
" c. E 90
" f-
-g 80 a.
70
60
50
• LOP Q L B P
LOP LBP 2nd
loaded loaded pad pad
l- f !s rP
1/ ~A r 0- I~ ~.
45 90 135 180 225 270 315 360
position (de g.)
Figure 36. LOP Versus LBP Pad Temperature Profiles, 200 PS1, 7760 RPM, 50 Percent Flow.
• LOP ( 1 st pad) Q L B P ( 2nd pad) 140,-------------------------------------------~
130
120
2: 110
e " f 100
~ E 90 ,! ~ 80 a.
70
60
10 20 30 40 50 60 70 80 90 100
position (%arc)
Figure 37. LOP Versus LBP Loaded Pad Temperature Profiles, 200 PS1, 7760 RPM, 50 Percent Flow.
Q: ~ :::> .... r: Ql 0-E Ql I-"0 co a.
140,-----------------------------------------~
130 - LOP (1st pad)
........ LBP (2nd pad)
120 -
110
100
90
80
70 -0320 psi
o 200 psi
!!, 50 psi 60
o 2000 4000 6000 8000 10000 12000 14000 16000
Shaft rpm
Figure 38. 75 Percent Location Loaded Pad Temperatures, Center Pivot, 50 Percent Flow.
FLOODED VERSUS DIRECT LUBE TEST DATA AND DISCUSSIONS
This section compares the effects of direct lubrication and discharge configuration. As mentioned earlier, the term "flooded"

A STUDY OF PARAMETERS THAT AFFECT PIVOTED SHOE JOURNAL BEARING PERFORMANCE IN HIGH-SPEED TURBOMACHINERY
19
80 .-----------------------------------------~
70
60
~ 50 en en .3 40 -
~ o 30 c..
20
10
- Offset Pivot, LOP
........ Offset Pivot, LBP
0320 psi
o 1 ____ ~~~~~::~-_.--~--;~=-~5~O~P:SI~· -J o 2000 4000 6000 8000 10000 12000 14000 16000
Shaft rpm
Figure 39. Power Loss-Offset Pivot, LOP and LBP, 50 Percent Flow.
refers to a method of lubrication. For the flooded design tested, oil is provided to the bearing between the pads and the discharge is restricted by labyrinth seals, which provides oil to the journalsurface by flooding the spaces between pads (Figure 40). Leadingedge-groove is a method of lubrication that provides oil directly to the journal surface at the entrance to the oil film (Figure 41). In both of these methods, the principles of hydrodynamic operation are the same. Specifically, the journal drags oil into the space between the journal and bearing pads.
Flooded
Oil outlet
Evacuated
Opened
Seal
Clearance
Figure 40. Discharge Configuration, Flooded Versus Evacuated.
Conventional j\
/ \ 60% offset / ' (offset PiV/"~_6~_ •. \
/-'. -j .
/c:t~J/< ~~0
Oil inlet '" ~i-';~
Pivot
LEG
Pivot
Figure 41. Method of Lubrication, Conventional Versus Direct Lube.
In the case of direct lubrication, it is desirable to allow the hot oil to exit freely from the bearing to reduce parasitic losses and efficiently remove heat. There are a few different methods for evacuating the bearing cavity. For test data reported in this paper, the labyrinth seal clearances were enlarged (Figure 40). This is a most efficient method because the side leakage (exiting oil) is discharged between the end seals and shaft without being captured and recirculated within the bearing. Note that in these comparisons, two parameters are changed-the method of lubrication and the discharge configuration. Otherwise, the flooded and LEG bearings are the same. The pads have 60 percent offset pivots (Figure 41), and data are compared under identical operating conditions and oil flow.
Conventional (Flooded) Versus LEG (Evacuated)
Figure 42 compares conventional, flooded bearing pad temperature profiles to direct lube, evacuated pad temperature profiles at conditions of 320 psi and 10,660 rpm. The direct lube design has noticeably lower pad temperature levels, especially at the leading edges of the pads. This is attributed to providing cool oil directly to the leading edge, which affects the entire loaded pad (Figure 43). Comparing 75 percent location temperatures for 200 psi in Figure 44, and 320 psi in Figure 45, this benefit is noted to improve with load and speed, up to 16°C (60.8°F) cooler at extreme test conditions. It is also noticed that the differences begin around the turbulent transition, evident by the inflection in the curves. This seems to tie in with the behavior of pad temperature and flow with turbulence discussed in the reduced oil flow section of this paper.
[J Conv. flooded • LEG evacuated 140 ,------------------------____ ,
130
120
§: 110
e :J
~ 100 Ql C. E 90
~ ~ 80 a..
60
.0'°-0
~. 50 L_ __ ~ ___ _L ____ ~ ___ ~ ___ L__~ __ _L ___ ~
o 45 90 135 180 225 270 315 360
position (deg.)
Figure 42. Pad Temperature Profiles, LOp, 320 PSI, 10,660 RPM, 50 Percent Flow.
140
130
120
§: llO ! i 100
8. E 90
{!.
~ 80
70
60
50
• Conv. flooded • LEG evacuated
-'l-
V) I----1/ /
------
y V
----l-----'
-----V
f--- J--It- L----... I----
10 20 30 40 50 60 70 80 90 100
position (%arc) loaded pad
Figure 43. Loaded Pad Temperature Profiles, LOP, 320 PSI, 10,660 RPM, 50 Percent Flow.

20 PROCEEDINGS OF THE 30TH TliRBOMACHINERY SYMPOSIUM
140 'I --------------------------------------~
[I __ Cony. Flooded
130 ........ LEG eyacuated
120j
u_ 110
e!
~ 100 c.
~ 90
~ 80 a.
70
60
_---cr -- ----0----0 ---- -0- ---Q-
_9--- 0 --a
o 200 psi
50-·~,----~--~----_r----~--_,----_r----~--~
o 2000 4000 6000 8000 10000 12000 14000 16000
Shaft rpm
Figure 44. 75 Percent Location Pad Temperatures, LOp, 50 Percent Flow, 200 PSI.
140.-----------------------------------------,
130
120
§: 110 e! ::l .... 100 -I!! II) c. E 90
(!!. 't) 80 os a.
70
60
50 0
-- Cony. Flooded
........ LEG evacuated
,--.. /Q-'
, .. , ...
•
0320 psi
2000 4000 6000 8000 10000 12000 14000 16000
Shaft rpm
Figure 45. 75 Percent Location Pad Temperatures, LOp, 50 Percent Flow, 320 PSI.
Figure 46 compares power losses for the two designs. Power loss in the evacuated, direct lube bearing measured significantly lower than the flooded bearing design, on the order of 45 percent at extreme operating conditions. Resulting oil drain temperatures are plotted in Figure 47. It is noticed that the flooded design oil outlet temperatures are very high, exceeding typical specification limits at the higher speeds. The evacuated, direct lube design oil outlet temperatures ran up to 15°C (59°F) cooler, and support the reduction in power loss from measured torque. As with pad temperatures, a study of power loss and oil outlet temperatures indicates that the benefits improve with increased speed and load.
Effects of Discharge Configuration on Direct Lubrication
To distinguish between the effects of direct lubrication and evacuated discharge, direct lube tests were also performed in a flooded configuration with restrictive labyrinth seals. Pad temperature results are over plotted in Figure 48. In the flooded condition, the direct lube loaded pad temperatures increased to a level between the LEG evacuated and conventional flooded bearing designs. Based on this and comparisons of other test conditions, part of the direct lubrication pad temperature reduction is attributed to the method of lubrication, and part is attributed to the discharge configuration.
80,------------------------------------------,
70
60 -
- Cony. flooded
........ LEG evacuated
~ 50 II) II) 0 40 -
...J "-II) ;;: 30 -0 a.
20 0320 psi
10
o-~--~----~----,---_,----~----,_----._--~
o 2000 4000 6000 8000 10000 12000 14000 16000
Shaft rpm
Figure 46. Power Loss-Conventional (Flooded) Versus Direct Lube (Evacuated), 50 Percellt Flow.
90 .,---------------------------------------~
- Conv. flooded 85 - ........ LEG evacuated
80
§: 75 -e! ::J
~ 70 (!) c. ~ 65-I-
60
55 -
0320 psi
o 2000 4000 6000 8000 10000 12000 14000 16000
Shaft rpm
Figure 47. Oil Outlet Temperatures-Conventional (Flooded) Versus Direct Lube (Evacuated), 50 Percent Flow.
140 ,---------------------------------------,
130
120
§.: 110
~
~ 100
" c. E 90
~ -g 80 a.
70
60
... Cony. flooded
.fi!I. LEG flooded
... LEG evac.
10 20 30 40 50 60 70 80 90 100
position (%arc) 2nd loaded pad
Figure 48. Affects of Oil Discharge Restriction on Direct Lube Pad Temperature.
Resulting power losses are compared in Figure 49, which also shows an increase to a level between the LEG evacuated and conventional flooded bearing losses. The data indicate that a significant portion of the power loss reduction is due to the discharge configuration, and a smaller portion to the method of lubrication.

A STUDY OF PARAMETERS THAT AFFECT PIVOTED SHOE JOURNAL BEARING PERFORMANCE IN HIGH-SPEED TURBOMACHINERY
21
80
II 70
4- Conv. flooded
60 G LEG flooded
~ 50 <II- LEG evac.
(f) /1 (f) 0 40
..J
j/'/ i ~ 30 -0 . I c..
20 "F I
I 10
I 0-. I
2000 4000 6000 8000 10000 12000 14000 16000
Shaft rpm
Figure 49. Affects of Oil Discharge Restriction on Direct Lube Power Loss.
SUMMARY
Returning to the original purpose of the work, the tests were undertaken to improve the capacity and performance of high-speed turbomachinery by extending bearing speed and/or load limitations and improving efficiency.
Extension of speed and load capability is accomplished by parameters that reduce bearing temperatures. In this respect, the offset pivot reduces temperatures. Referring to Figure 19 for a comparative example (say a 100°C (212°F) temperature limit and 320 psi load) the offset pivot can extend the application's speed to 11,000 rpm compared to the center pivot, which reaches 100°C (212°F) at approximately 5000 rpm. For a constant speed, say 11,000 rpm, the offset allows loads on the order of 320 psi where the center pivot design is at 200 psi.
In regard to improving machine efficiency, this can be attained by reducing oil flow and power loss, explained earlier with Figure 34. Because of the lower pad temperatures, it is possible to reduce oil flow in the offset design without jeopardizing the integrity of the babbitt. This is accompanied by a small increase in machine efficiency, on the order of 10 to 20 percent. With reduced flow, the oil outlet temperatures are higher and need to be checked to assure that the levels do not exceed acceptable limits.
Temperatures are further reduced in the direct lube design (Figures 44 and 45). Continuing the example, the LEG evacuated design allows for 320 psi operation to 15,000 rpm compared to the conventional flooded design which reaches 100°C (212°F) at 9000 rpm (both with 50 percent flow). For efficiency, direct lubrication with an evacuated discharge configuration can attain most significant reductions in power loss, on the order of 45 percent (Figure 46), with lower pad temperatures as well as a significant reduction in oil outlet temperature (Figure 47). The reductions in power loss are significant enough to allow an additional benefit considering design for a smaller lubrication system.
CONCLUSIONS
Conventional (Flooded) Bearings
This series of tests was performed with conventional, flooded pivoted shoe journal bearings to compare the effect of pad pivot location on bearing performance. The pivot locations tested were center (50 percent) and offset (60 percent). Other than the location of the pivot, bearing geometry for the two sets of pads was identical. The bearings were tested in LOP and LBP configurations. Conclusions arising from these tests are as follows:
Center Pivot Versus Offset Pivot
o Center pivot maximum temperatures occurred between the 65 percent and 90 percent location.
• Offset pivot maximum temperatures occurred between the 82 percent location and trailing edge.
• As speed increases, the hottest temperature location of the loaded pads moves toward the trailing edge. The trend is reversed for increasing load.
• The offset pivot design ran cooler in all cases tested, as much as 20°C (68°F) lower than the center pivot design. The benefit improved with speed and load.
• Offset pivot power losses were the same to slightly higher than the center pivot pad.
Effects of Reduced Flow
• Offset pivot design oil flow can be reduced without jeopardizing the integrity of the babbitt compared to a center pivot design at similar operating conditions.
• Reducing the flowrate to the offset pivot bearing by 50 percent reduced power losses 10 to 20 percent. This provides a small increase in machine efficiency.
• For conditions tested, oil outlet temperatures ran 5°C (41°F) higher with a 50 percent flow reduction.
LOP Versus LBP Orientation
• For LBP orientation, the second loaded pad ran up to 12°C (53.6°F) hotter than the first loaded pad. This is attributed to hot oil CalTyover.
• The LBP orientation in most cases ran cooler than LOP, but not as cool as expected, which is also attributed to hot oil carryover.
• The benefits of LBP orientation improve with load and speed.
• There was no measurable difference in power loss between LOP and LBP orientation.
Flooded Versus Direct Lltbrication
This section compares the effects of direct lubrication and discharge configuration. The conventional, flooded bearing has oil discharge restricted by labyrinth seals. The direct lube LEG design is tested with two discharge configurations described below. Other than this, the two bearings are of the same geometry and compared at identical operating conditions and oil flow.
Conventional Flooded Versus Direct Lube (Evacuated)
In these comparisons, the direct lube bearing has an evacuated discharge configuration via large clearance end seals.
• Direct lubrication with an evacuated discharge design has significantly lower pad temperature, power loss, and oil outlet temperature. At extreme conditions, pad leading edge temperatures were significantly cooler than the conventional, flooded design.
(I Direct lube, 75 percent location pad temperatures ran up to 16°C (60.8°F) cooler than the flooded bearing at extreme operating conditions. Maximum pad temperatures were as much as 12°C (53.6°F) cooler.
(I The direct lube design with an evacuated discharge reduces power loss on the order of 45 percent compared to the conventional, flooded design. Oil outlet temperatures were up to 15°C (59°F) cooler.
• The pad temperature and power loss benefits improved with increased speed and load.
Direct Lube (Flooded) Versus Direct Lube (Evacuated)
In this section, the effects of oil discharge configuration on direct lube performance were compared. The LEG flooded discharge configuration had the oil discharge restricted by

22 PROCEEDINGS OF THE 30TH TURBO MACHINERY SYMPOSIUM
labyrinth seals. The LEG evacuated discharge configuration had large clearance end seals. The conclusions are:
• Part of the reduction in LEG pad temperatures is due to the direct lube design, and part is due to the evacuated discharge configuration.
• A significant portion of the power loss reduction is attributable to evacuation of the housing, and a smaller portion to the method of lubrication.
ADDITIONAL COMMENTS
Data contained in this report show the necessity to consider other parasitic losses (such as churning and seal losses) in computer models. Parasitic influences are discussed by many authors (e.g., Booser, 1990), and are required to predict the higher losses in flooded designs, and the lower losses in evacuated designs. Other phenomena mentioned throughout the paper need to be better understood to develop accurate computer models. A study of pad temperature profiles can give valuable insight into hydrodynamic behavior, and is necessary for programming models to accurately predict performance. The surface isotherms showing axial temperature gradients are also useful data for program development. It is hoped that the information and high-speed data contained in this paper will enhance the study and prediction of bearing performance in turbomachinery.
REFERENCES
Booser, E. R., 1990, "Parasitic Power Losses in Turbine Bearings," STLE Tribology Transactions, 33, (2), pp. 157-162.
Brockwell, K., Dmochowski, w., and DeCamillo, S., 1992, "Performance Evaluation of the LEG Tilting Pad Journal Bearing," I Mech E Seminar Plain Bearings-Plain Bearings-Energy Efficiency and Design, MEP, London, England, pp. 51-58.
Brockwell, K., Dmochowski, W., and DeCamillo, S., 1994, "Analysis and Testing of the LEG Tilting Pad Journal Bearing-A New Design for Increasing Load Capacity, Reducing Operating Temperatures, and Conserving Energy," Proceedings of the Twenty-Third Turbomachinery Symposium, Turbomachinery Laboratory, Texas A&M University, College Station, Texas, pp. 43-56.
DeCamillo, S. and Clayton, P. J., 1997, "Performance Tests of an 18-Inch Diameter, Leading Edge Groove Pivoted Shoe Journal Bearing," Proceedings of the Second International Conference on Hydrodynamic Bearing-Rotor System Dynamics, Xi' an, China, pp. 409-413.
DeChoudhury, P. and Barth, E. w., 1981, "A Comparison of Film Temperatures and Oil Discharge Temperature for a Tilting-Pad Journal Bearing," ASME Journal of Lubrication Technology, 103, pp. 115-119.
DeChoudhury, P. and Masters, D. A., 1983, "Performance Tests of Five-Shoe Tilting-Pad Journal Bearing," ASLE Transactions, 27, (1), pp. 61-66.
Dmochowski, w., Brockwell, K., and DeCamillo, S., 1993, "A Study of the Thermal Characteristics of the Leading Edge Groove and Conventional Tilting Pad Journal Bearings," ASME Journal of Tribology, 115, pp. 219-226.
Edney, S. L., Waite, J. K., and DeCamillo, S. M., 1996, "Profiled Leading Edge Groove Tilting Pad Journal Bearing for Light Load Operation," Proceedings of the Twenty-Fifth Turbomachinery Symposium, Turbomachinery Laboratory, Texas A&M University, College Station, Texas, pp. 1-16.
Fillon, M., Bligoud, J. C., and Frene, J., 1993, "Influence of the Lubricant Feeding Method on the Thermohydrodynamic Characteristics of Tilting-Pad Journal Bearings," Proceedings of the Sixth International Congress on Tribology, Budapest, Hungary, 4, pp. 7-10.
Gardner, W. W. and Ulschmid, 1. G., 1973, "Turbulence Effects in Two Journal Bearing Applications," ASME Paper No. 73-LubS-7.
Harangozo, A. v., Stolarski, T. A., and Gozdawa, R. J., 1991, "The Effect of Different Lubrication Methods on the Performance of a Tilting Pad Journal Bearing," STLE Tribology Transactions, 34, pp. 529-536.
Nicholas, 1. c., 1994, "Tilting Pad Bearing Design," Proceedings of the Twenty-Third Turbomachinery SymposiulIl, Turbomachinery Laboratory, Texas A&M University, College Station, Texas, pp. 179-194.
Pettinato, B. and DeChoudhury, P., 1999, "Test Results of Key and Spherical Pivot Five-Shoe Tilt Pad Journal Bearings-Part I: Performance Measurements," STLE Tribology Transactions, 42, (3), pp. 541-547.
Pinkus, 0., 1990, Thermal Aspects of Fluid Film Tribology, New York, New York: AS ME Press.
Simmons, J. E. L. and Lawrence, C. D., 1996, "Perfonnance Experiments with a 200 mm, Offset Pivot Journal Pad Bearing," STLE Preprint No. 96-AM-7B-4.
Tanaka, M., 1991, "Thermohydrodynamic Performance of a Tilting Pad Journal Bearing With Spot Lubrication," ASME Journal of Tribology, 113, pp. 615-619.
Tanaka, M. and Mishima, N., 1989, "Thermo hydrodynamic Performance of a Spot-Fed Tilting Pad Journal Bearing," Proceedings of Eurotrib89, 3, pp. 198-203.
Wygant, K. D., Flack, R. D., and Barrett, L. E., 1999, "Influence of Pad Pivot Friction on Tilting-Pad Journal Bearing Measurements-Part I and Part II," STLE Tribology Transactions, 42, pp. 210-215 and 250-256.
ACKNOWLEDGEMENT
The authors sincerely thank all personnel at Kingsbury, Inc., and the National Research Council of Canada, who contributed to the work documented in this paper. The authors are grateful to Kingsbury, Inc., and the National Research Council of Canada, for permission to publish this information.


![SSMS Shortcuts Display the context menu Display the Query ... · RETURNS AS BEGIN RETURN END IN ( [pivoted column],](https://static.fdocuments.net/doc/165x107/5ed852fa6664347bbe09255c/ssms-shortcuts-display-the-context-menu-display-the-query-returns-as-begin-return.jpg)


