![of Ti 6Al 4V Ti 6Al 4V 1B for FRIB beam dumppuhep1.princeton.edu/mumu/target/FRIB/amroussia_112613.pdfTi-6Al-4V vs Ti-6Al-4V-1B Alloy Ti‐6Al‐4V Ti‐6Al‐4V‐1B E [GPa] At RT](https://static.fdocuments.net/doc/165x107/5eb2d6d755eb4c7aaa54e97d/of-ti-6al-4v-ti-6al-4v-1b-for-frib-beam-ti-6al-4v-vs-ti-6al-4v-1b-alloy-tia6ala4v.jpg)
A STUDY OF MICROSTRUCTURE, TENSILE DEFORMATION, …...cyclic fatigue properties for both the...
150
A STUDY OF MICROSTRUCTURE, TENSILE DEFORMATION, CYCLIC FATIGUE AND FINAL FRACTURE BEHAVIOR OF COMMERCIALLY PURE TITANIUM AND A TITANIUM ALLOY A Thesis Presented to The Graduate Faculty of The University of Akron In Partial Fulfillment of the Requirements for the Degree Master of Science Udaykar Bathini August, 2010
Transcript of A STUDY OF MICROSTRUCTURE, TENSILE DEFORMATION, …...cyclic fatigue properties for both the...

A STUDY OF MICROSTRUCTURE, TENSILE DEFORMATION, CYCLIC FATIGUE
AND FINAL FRACTURE BEHAVIOR OF COMMERCIALLY PURE TITANIUM
AND A TITANIUM ALLOY
A Thesis
Presented to
The Graduate Faculty of The University of Akron
In Partial Fulfillment
of the Requirements for the Degree
Master of Science
Udaykar Bathini
August, 2010

ii
A STUDY OF MICROSTRUCTURE, TENSILE DEFORMATION, CYCLIC FATIGUE
AND FINAL FRACTURE BEHAVIOR OF COMMERCIALLY PURE TITANIUM
AND A TITANIUM ALLOY
Udaykar Bathini
Thesis
Approved: Accepted:
Advisor Department Chair
Dr. Anil K. Patnaik Dr. W. Binienda
Co-Advisor Dean of the College
Dr. T.S. Srivatsan Dr. G.K. Haritos
Faculty Reader Dean of the Graduate School
Dr. C. C. Menzemer Dr. George R. Newkome
Date

iii
ABSTRACT
Rapid industrial growth and advances in the domains of engineering and related
technologies during the last fifty years have led to the extensive use of traditional metals
and their alloy counterparts. Titanium is one such metal which has gained wide
popularity in the aerospace and defense related applications owing to a wide range of
impressive mechanical properties like excellent specific strength (σUTS/ρ), stiffness,
corrosion and erosion resistance, fracture toughness and capability to withstand
significant temperature variations.
Two materials, namely commercial purity titanium (Grade 2), referred to
henceforth as Ti- CP (Grade 2) and the “work-horse” alloy Ti-6Al-4V have been chosen
for this research study. The intrinsic influence of material composition and test specimen
orientation on the tensile and fatigue behavior for both Ti- CP (Grade 2) and Ti-6Al-4V
have been discussed. Samples of both Ti- CP (Grade 2) and Ti-6Al-4V were prepared
from the as-provided plate stock along both the longitudinal and transverse orientations.
The specimens were then deformed to failure in uniaxial tension for the tensile tests and
cyclically deformed at different values of maximum stress at constant load ratio of 0.1 for
the high cycle fatigue tests. The microstructure, tensile properties, resultant fracture
behavior of the two materials is presented in the light of results obtained from the
uniaxial tensile tests. The conjoint influence of intrinsic microstructural features, nature

iv
of loading and specimen properties on the tensile properties is discussed. Also, the
macroscopic fracture mode, the intrinsic features on the fatigue fracture surface and the
role of applied stress-microstructural feature interactions in governing failure for the
cyclic fatigue properties for both the materials under study Ti- CP (Grade 2) and the
“work-horse” alloy Ti-6Al-4V have been discussed in detail.
Careful study of the microstructure for Ti-CP (Grade 2) material at a low
magnification revealed the primary alpha (α) grains to be intermingled with small pockets
of beta (β) grains. Observation at the higher allowable magnifications of the optical
microscope revealed very fine alpha (α) phase lamellae located within the beta (β) grain.
The microhardness and macrohardness measurements were consistent through the sheet
specimen for Ti- CP (Grade 2) and slightly lower compared to Ti-6Al-4V. However, the
macrohardness was marginally higher than the microhardness resulting from the presence
of a large volume fraction of the soft alpha phase. The hardness values when plotted
reveal marginal spatial variability. Tensile fracture of Ti-CP (Grade 2) was at an
inclination to the far field tensile stress axis for both longitudinal and transverse
orientations. The overload region revealed a combination of fine microscopic cracks,
microscopic voids of varying size and randomly distributed through the surface, and a
large population of shallow dimples, features reminiscent of locally brittle and ductile
failure mechanisms. The maximum stress (σmaximum) versus fatigue life (Nf)
characteristics shown by this material is quite different from those non-ferrous metals that
exhibit a well-defined endurance limit. When compared at equal values of maximum
stress at a load ratio of 0.1, the fatigue life of the transverse specimen is noticeably
greater than the longitudinal counterpart. At equivalent values of maximum elastic strain,

v
the transverse specimens revealed noticeably improved fatigue life as compared one-on-
one to the longitudinal counterparts.
Careful observations of the Ti-6Al-4V alloy microstructure over a range of
magnifications spanning very low to high magnification revealed a duplex microstructure
consisting of the near equiaxed alpha (α) and transformed beta (β) phases. The primary
near equiaxed shaped alpha (α) grains (light in color) was well distributed in a lamellar
matrix with transformed beta (dark in color). The microhardness and macrohardness
values recorded for the Ti-6Al-4V alloy reveal it to be harder than the commercially pure
(Grade 2) material. However, for the Ti-6Al-4V alloy the microhardness is noticeably
higher than the corresponding macrohardness value that can be ascribed to the presence
of a population of processing-related artifacts and the hard beta-phase. Tensile fracture of
the Ti-6Al-4V alloy was macroscopically rough and essentially normal to the far field
stress axis for the longitudinal orientation and cup-and-cone morphology for the
transverse orientation. However, microscopically, the surface was rough and covered
with a population of macroscopic and fine microscopic cracks, voids of varying size, a
population of shallow dimples of varying size and shape, features reminiscent of locally
brittle and ductile failure mechanisms. When compared at equal values of maximum
stress at a load ratio of 0.1, there is a marginal to no influence of microstructure on high
cycle fatigue life of both orientations of the alloy.

vi
ACKNOWLEDGMENTS
First and foremost I would like to thank my advisor Dr. Anil Patnaik and my co-
advisor Dr. T. S. Srivatsan for their invaluable and knowledgeable guidance, patience and
advice throughout the course of the research. The Funding for this research project was
provided by the US Army Picatinny Arsenal through the Defense Metals Technology
Center [DMTC], North Canton, Ohio. I would like to gratefully acknowledge the
Department of Civil Engineering and Department of Mechanical Engineering at the
University of Akron for allowing me the use of infrastructure and services for my
research. I would also like to extend my sincere gratitude to Dr. Craig Menzemer for
serving on my thesis committee.
I would like to thank ATI Wah Chang [Oregon, USA] and TICO Titanium (Michigan,
USA) for providing the material and support that made this research possible.
My sincere appreciation is also extended to the following individuals for their invaluable
contribution in this research, by way of understanding and assistance.
(i). Mr. Mithun Kuruvilla (former graduate student), Mr.Nurudeen Balogun and
Mr. Manigandan Kannan (current graduate students in the Department of
Mechanical Engineering), for assisting me in the initial stages of testing.
(ii). Mr. Clifford Bailey (Senior Engineering Technician, Department of
Mechanical Engineering), for his timely assistance and knowledge in the
testing equipment used for this project.

vii
(iii). Mr. Dale Ertley (Senior Engineering Technician) and Mr. William Wenzel
(Engineering Technician), of the College of Engineering Machine shop for
assistance with preparing the test samples as per ASTM standards.
(iv). Mr. David McVaney (Senior Engineering Technician), for allowing us to use
the hardness tester in the Civil Engineering Department.
(v). Mr. Thomas J. Quick (Research Associate) of the Department of Geology for
assisting me with use of the Scanning Electron Microscope.
Most importantly, I extend warmest thanks to my family and friends, who have been with
me and provided support and guidance in all my activities.
viii
TABLE OF CONTENTS Page
LIST OF TABLES…………………….…………………………………………..…..…xii
LIST OF FIGURES………...…………………………………………………….….….xiii
CHAPTER
I. Introduction……………………………………………………………….…..…..1
Part A: Commercially Pure Titanium (Ti - CP (GRADE 2))
II. Review of the Literature (Commercially Pure Titanium)…………….………...…6
III. Material (Ti-CP (GRADE 2)) ……………...………………………….……...…12
IV. Test Sample Preparation……………………………………………….….…..…15
V. Experimental Procedures…………………...………………………….…...……17
5.1 Initial microstructure characterization ……...……………….….…….…17
5.2 Hardness testing…………………….……………………….…...………18
5.3 Mechanical testing………………….…………………………....………20
5.3.1 Tensile tests ………………………………………….....………..20
5.3.2 High Cycle Fatigue Tests …………………………….…….……21
5.4 Failure-damage analysis…………….……………………………………21
VI. Results and Discussion………………………......………………..…..…………23
6.1 Initial Microstructure……………….……………………..……..………23
6.2 Hardness…………………………………..………..……..……..………25
6.2.1 Microhardness measurement ……………………………..……..25
6.2.2 Macrohardness measurement …………………………..……….26
ix
6.3 Tensile Properties……………….……………..…………….……...……28
6.4 Tensile Fracture Behavior………..………………………….…..….……31
6.5 High Cycle Fatigue Resistance……………….…….……….…..….……36
6.6 Cyclic Fatigue Fracture………… ….……………………….…..….……41
6.6.1 Cyclic Fatigue Fracture: Longitudinal Orientation……………....42
6.6.2 Cyclic Fatigue Fracture: Transverse Orientation…………...........48
VII. Conclusions ……………………………………………………………………...56
Part B: Titanium Alloy Ti-6Al-4V
I. Review of the Literature (Titanium Alloys) ………….…………………………58
II. Material (Titanium alloy Ti-6Al-4V) ………….……………………………...…67
III. Test Sample Preparation………….…………………………….…………...…...68
IV. Experimental Procedures ……………………………………………………......69
4.1 Initial microstructure characterization...…………….……………...........69
4.2 Hardness testing …….…………………..………………………….........69
4.3 Mechanical testing….…………………..…………….…………….........72
4.3.1 Tensile tests ……………………………………………….……..72
4.3.2 High Cycle Fatigue Tests ………………………………….…….73
4.4 Failure-damage analysis .…………………..…………….……...……….73
V. Results and Discussion ………..…………………..…………….……...……….75
5.1 Initial Microstructure ….…………………..…………….……...……….75
5.2 Hardness: Macro-hardness measurement…..…………….……......…….76
5.2.1 Microhardness measurement ……………………………..……..76

x
5.2.2 Macrohardness measurement ……………………………...…….79
5.3 Tensile Properties….…………………..…………….………......……….81
5.4 Tensile Fracture Behavior………………..…………….………......…….84
5.5 High Cycle Fatigue Resistance………..…………….………..........…….89
5.6 Cyclic Fatigue Fracture………..…………….………......................…….93
5.6.1 Cyclic Fatigue Fracture: Longitudinal……......................……….94
5.6.2 Cyclic Fatigue Fracture: Transverse……...................………….100
VI. Conclusions…………………………………………….……....................…….107
REFERENCES ……………………………………………………………….……….109
APPENDICES ……………………………………………………………….………..113

xi
APPENDIX A: TABLES SHOWING HIGH CYCLE FATIGUE
TEST DATA, AND STRESS AND LOAD
CALCULATIONS FOR Ti- CP (GRADE 2).......……….……..114
APPENDIX B: TABLES SHOWING HIGH CYCLE FATIGUE
TEST DATA, AND STRESS AND LOAD
CALCULATIONS FOR
Ti-6Al-4V ALLOY ………………………….............................117
APPENDIX C: PROCEDURE FOR PERFORMING THE TENSION
TEST ON THE INSTRON-8500 SERVO
HYDRAULIC TESTING MACHINE ...……………….….….120
APPENDIX D: PROCEDURE FOR PERFORMING A HIGH CYCLE
FATIGUE TEST ON THE INSTRON-8500
SERVO HYDRAULIC TESTING MACHINE……….….…..125
APPENDIX E: PROCEDURE FOR PERFORMING LOOP SHAPING
FOR A GIVEN STRESS RATIO AND MATERIAL
ON THE INSTRON-8500 SERVO HYDRAULIC
TESTING MACHINE………………………………….…..….129

xii
LIST OF TABLES
Ti – CP (Grade 2)
Table Page
1. Nominal Chemical composition (in weight percent) of
Ti-CP (Grade 2)….…………………………………………………………...….13
2. A compilation of the microhardness measurements for
Ti-CP (Grade 2). ………………………………………………………….….….19
3. A compilation of the macrohardness measurements for
Ti-CP (Grade 2). ………………………………………………………….….….17
4. Room temperature tensile properties of
Ti-CP (Grade 2). ……………………………………………………………..….27
Ti-6Al-4V
Table Page
5. Nominal Chemical composition (in weight percent) of the
Ti-6Al-4V alloy. ……………………………………………………………..….67
6. A compilation of the microhardness measurements for the
Ti-6Al-4V alloy. ……………………………………………………………..….71
7. A compilation of the macrohardness measurements for the
Ti-6Al-4V alloy. ……………………………………………………………..….71
8. Room temperature tensile properties of the
Ti-6Al-4V alloy. ……………………………………………………………..….81

xiii
LIST OF FIGURES
Ti – CP (Grade 2)
Figure Page
1. The as-received plate stock for the Ti – CP (Grade 2) material. ………..……..….…..14
2. A schematic of the longitudinal and transverse flat test specimen
used for Mechanical testing (Tensile and Cyclic fatigue). ……….………….….16
3. Optical micrographs showing the key micro-constituents of the
Ti – CP (Grade 2), at different magnifications. …………………………......…...24
4. A profile showing the variation of microhardness values across
the length of fully annealed, Ti-CP (Grade 2). ……………………….……...….26
5. A profile showing the variation of macrohardness values across the
length of fully annealed, Ti-CP (Grade 2). …………………………...….……...27
6. Bar graph depicting the average microhardness and macrohardness
values of Ti-CP (Grade 2). …………………………………………………...….27
7. Influence of test specimen orientation on engineering stress
versus engineering strain curve for of Ti -CP (Grade 2)..……...…...…….……..30
8. The monotonic stress versus strain curve for Ti-CP (Grade 2)..………..........….30
9. Scanning electron micrographs of the tensile fracture surface of the
Ti-CP (Grade 2) specimen (orientation: Longitudinal) deformed
in tension, showing: ……………………………………………………...……..34
(a). Overall morphology of tensile fracture surface at an inclination
to stress axis.
(b). High magnification of (a) showing population of voids and
shallow dimples of varying size covering the transgranular region.
(c). High magnification of (b) showing the morphology and
distribution of dimples and fine microscopic cracks features
reminiscent of locally ductile and brittle failure mechanisms.
(d). The overload region showing microscopic voids, cracks
and shallow dimples.

xiv
10. Scanning electron micrographs of the tensile fracture surface of
Ti-CP (Grade 2) specimen (orientation: Transverse) deformed
in tension, showing: …………………………………………………...……..….35
(a). Overall morphology of tensile fracture surface at an inclination
to stress axis.
(b). High magnification of (a) showing isolated voids and shallow
dimples of varying size covering the transgranular region.
(c). High magnification of (b) showing the morphology and
distribution of dimples and fine microscopic voids features
reminiscent of locally ductile failure mechanisms.
(d). The overload region showing randomly distributed microscopic
voids, microscopic cracks and pockets of shallow dimples.
11. Variation of maximum stress (σmax) with fatigue life (Nf) for
Ti-CP (Grade2). ……………………………………………...………………….39
12. Variation of the ratio of maximum stress/yield stress (σmax/ σy) with
fatigue life (Nf) for Ti-CP (Grade2). ………………………….………….……..39
13. Variation of maximum Elastic Strain (σmax/E) with fatigue life (Nf)
for Ti-CP (Grade2). ………………………….………………………………….40
14. Variation of the ratio of maximum stress/ultimate tensile stress
(σmax/σUTS) with fatigue life (Nf) for Ti-CP (Grade2) ……………………….…40
15. Scanning electron micrographs of the fatigue fracture surface of
Ti-CP (Grade 2) specimen (orientation: Longitudinal) deformed in
cyclic fatigue under a maximum stress of 405MPa with a fatigue
life (Nf) of 45532 cycles: ……………………………………………….........….44
(a). Overall morphology showing the different regions
(b). Fine microscopic cracks in the region of early crack growth
(c). Pockets of shallow striations in the region of stable crack growth
(d). Healthy population of dimple and voids of varying size and
shape in the region of overload.
16. Scanning electron micrographs of the fatigue fracture surface of
Ti-CP (Grade2) specimen (orientation: Longitudinal) deformed in cyclic
fatigue under a maximum stress of 405MPa with a fatigue life (Nf)
of 45532 cycles showing growth and eventual coalescence of the fine
microscopic cracks to form a macroscopic crack: …………………………...….45
17. Scanning electron micrographs of the fatigue fracture surface of
Ti-CP (Grade2) specimen (orientation: Longitudinal) deformed in cyclic
atigue under a maximum stress of 366MPa with a fatigue life (Nf) of
125559 cycles: …………………………………………………………...……....46

xv
(a). Overall morphology showing distinct regions of crack
initiation and overload.
(b). The transition region from crack growth to overload.
(c). Pockets of well defined striations in the region of stable
crack growth.
(d). Microscopic voids of varying size and shape intermingled
with dimples on the overload surface.
18. Scanning electron micrographs of the fatigue fracture surface of
Ti-CP (Grade2) specimen (orientation: Longitudinal) deformed in
cyclic fatigue under a maximum stress of 366MPa with a fatigue
life (Nf) of 125559 cycles showing pockets of striations within
the grains, microscopic cracking along the grain boundaries, and
microscopic cracking at and along grain boundary triple junctions. …………....47
19. Scanning electron micrographs of the fatigue fracture surface of
Ti-CP (Grade2) specimen (orientation: Transverse) deformed in
cyclic fatigue under a maximum stress of 399Mpa with a fatigue
life (Nf) of 72773 cycles: …………………………………………………….….50
(a). Overall morphology showing the regions of crack initiation
and early crack growth and overload.
(b). Voids of varying size and shape and a healthy population
of dimples.
(c). Growth and coalescence of fine microscopic voids to form
a microscopic crack.
20. Scanning electron micrographs of the fatigue fracture surface of
Ti-CP (Grade2) specimen (orientation: Transverse) deformed in
cyclic fatigue under a maximum stress of 387MPa with a fatigue
life (Nf) of 234351 cycles: ………………………………………………..….….51
(a). Overall morphology showing two distinct regions of crack
initiation and early crack growth and overload.
(b). Progress of fatigue damage in the region of stable crack growth.
(c). High magnification of (b) showing well-defined striations in
the region of stable crack growth.
(d). Microscopic voids of varying size and shape along with shallow
dimples in the region of unstable crack growth.
21. Scanning electron micrographs of the fatigue fracture surface of
Ti-CP (Grade2) specimen (orientation: Transverse) deformed in
cyclic fatigue under a maximum stress of 387MPa with a fatigue
life (Nf) of 234351 cycles showing fine microscopic cracks. ……………..…….52

xvi
22. Scanning electron micrographs of the fatigue fracture surface of
Ti-CP (Grade2) specimen (orientation: Transverse) deformed in
cyclic fatigue under a maximum stress of 356MPa with a fatigue
life (Nf) of 957815 cycles: ……………………………………………….……...53
(a). Overall morphology showing the two distinct regions of crack
initiation and early crack growth and overload.
(b). Progress of fatigue damage in the region of stable crack growth.
(c). High magnification of (b) showing well defined striations in
the region of stable growth.
(d). Microscopic voids of varying size and shape along with shallow
dimples in the region of unstable crack growth.
Ti –6Al-4V
23. Optical micrographs showing the key micro-constituents of the titanium
alloy, Ti-6Al-4V at different magnifications. ……………………………......….78
24. A profile showing the variation of microhardness values across the length
of fully annealed Ti-6Al-4V alloy. ………………………………………....…...79
25. A profile showing the variation of macrohardness values across the length
of fully annealed Ti-6Al-4V alloy. …………………………………………..….80
26. Bar graph depicting the average microhardness and macrohardness values
of the Titanium alloy, Ti-6Al-4V………………………………………..……….80
27. Influence of test specimen orientation on engineering stress versus
engineering strain curve of Ti-6Al-4V alloy. ………………………………..….83
28. The monotonic stress versus strain curve for the Ti-6Al-4V alloy. ………….….83
29. Scanning electron micrographs of the tensile fracture surface
of Ti-6Al-4V specimen (orientation: Longitudinal) deformed in tension,
showing: ……………………………………………………………………...….88
(a). Overall morphology of tensile fracture surface.
(b). High magnification of (a) showing macroscopic crack
in the transgranular region.
(c). A microscopic crack surrounded by population of shallow dimples.
(d). The overload region showing coalescence of microscopic voids
to form a microscopic crack and surrounded by shallow dimples.

xvii
30. Scanning electron micrographs of the tensile fracture surface
of Ti-6Al-4V specimen (orientation: Transverse) deformed in tension,
showing: ……………………………………………………………………...….89
(a). Overall cup and cone morphology of tensile fracture surface.
(b). High magnification of (a) showing microscopic crack,
population of voids and dimples in the transgranular region.
(c). High magnification of (b) showing the morphology and
distribution of microscopic cracks, voids and dimples
on the transgranular fracture surface.
(d). The overload region showing coalescence of microscopic voids
to form a microscopic crack and surrounded by shallow dimples.
31. Variation of maximum Stress (σmax) with fatigue life (Nf) for titanium
alloy Ti- 6Al-4V at a stress ratio of R = 0.1. ………………………………...….91
32. Variation of the ratio of Maximum Stress/Yield Stress (σmax/ σy)
to fatigue life (Nf) titanium alloy Ti- 6Al-4V at a stress ratio
of R = 0.1. ……………………………………………………………………….91
33. Variation of maximum Elastic Strain (σmax/E) with fatigue life (Nf)
for titanium alloy Ti- 6Al-4V at a stress ratio of R = 0.1. …………………...….92
34. Variation of the ratio of Maximum Stress/Ultimate Tensile Stress
(σmax/σUTS) to fatigue life (Nf) for titanium alloy Ti- 6Al-4V at a
stress ratio of R = 0.1. …………………………………………………..........….92
35. Scanning electron micrographs of the fatigue fracture surface of the
Ti-6Al-4V specimen (Orientation: Longitudinal) deformed in cyclic
fatigue at a maximum stress of 870 MPa at a stress ratio of R = 0.1
and resultant fatigue life (Nf) of 35357 cycles, showing: ……………………….96
(a). Overall morphology of failure.
(b). The region between stable and unstable crack growth showing
a healthy population of fine microscopic voids and dimples.
(c). High magnification of (b) showing a population of macroscopic
and fine microscopic voids.
(d). Void coalescence to form a fine microscopic crack and shallow
dimples indicative of locally ductile failure.
36. Scanning electron micrographs of the fatigue fracture surface of the
Ti-6Al-4V specimen (Orientation: Longitudinal) deformed in cyclic
fatigue at a maximum stress of 829 MPa at a stress ratio of R = 0.1
and resultant fatigue life (Nf) of 255,334 cycles, showing: ………….………….97

xviii
(a). Overall morphology of failure.
(b). The region of crack initiation and radial outward progression
of fatigue damage.
(c). The transgranular surface: flat and near featureless in the region
of early crack growth.
(d). Shallow dimples covering the region of overload reminiscent
of locally ductile failure.
37. Scanning electron micrographs of the fatigue fracture surface of the
Ti-6Al-4V specimen (Orientation: Longitudinal) deformed in cyclic
fatigue at a maximum stress of 811 MPa at a stress ratio of R = 0.1
and resultant fatigue life (Nf) of 674,128 cycles, showing: …………….........….98
(a). Overall morphology of failure.
(b). The transgranular surface in the region of early crack growth.
(c). High magnification of (b) showing pockets of fine shallow
striations indicative of localized micro-plastic deformation.
(d). Shallow dimples in the region of overload.
38. Scanning electron micrographs of the fatigue fracture surface of the
Ti-6Al-4V specimen (Orientation: Longitudinal) deformed in cyclic
fatigue at a maximum stress of 811 MPa at a stress ratio of R = 0.1
and resultant fatigue life (Nf ) of 674,128 cycles, showing well defined
striations in the region of stable crack growth indicative of
micro-plastic deformation. ……………………………………………………....99
39. Scanning electron micrographs of the fatigue fracture surface of the
Ti-6Al-4V specimen (Orientation: Transverse) deformed in cyclic
fatigue at a maximum stress of 962 MPa and resultant fatigue life
(Nf) of 40,664 cycles, showing: …………………………………………….….102
(a). Overall morphology of failure.
(b). The region of early crack growth: flat and near featureless.
(c). Pockets of shallow striations in the region of stable crack growth.
(d). A healthy population of fine microscopic voids in the region
of overload.
40. Scanning electron micrographs of the fatigue fracture surface of the
Ti-6Al-4V specimen (Orientation: Transverse) deformed in cyclic
fatigue at a maximum stress of 900 MPa at a stress ratio of R = 0.1 and
resultant fatigue life (Nf) of 425,984 cycles, showing: ……………….…….….103
(a). Overall morphology of failure showing region of initiation
and radial progression of fatigue damage.
(b). High magnification of region of early crack growth.

xix
(c). High magnification observation of the region of early crack
growth showing a random distribution of fine microscopic cracks.
(d). A population of voids and dimples in the region of overload.
41. Scanning electron micrographs of the fatigue fracture surface of the
Ti-6Al-4V specimen (Orientation: Transverse) deformed in cyclic
fatigue at a maximum stress of 900 MPa at a stress ratio of R = 0.1
and resultant fatigue life (Nf) of 425,984 cycles, showing: …………….......….104
(a). Fine and shallow striations found in random pockets in the
region of stable crack growth
(b). Healthy population of fine microscopic voids of
varying shape intermingled with dimples.
42. Scanning electron micrographs of the fatigue fracture surface of the
Ti-6Al-4V specimen (Orientation: Transverse) deformed in cyclic
fatigue at a maximum stress of 823 MPa at a stress ratio of R = 0.1
and resultant fatigue life (Nf) of 581,951 cycles, showing: ……….…………...105
(a). Overall morphology of showing radial propagation of
fatigue damage.
(b). A healthy population of fine microscopic cracks
covering the transgranular fracture surface region.
(c). High magnification of (b) showing non-linear nature of fine
microscopic cracks.
(d). A healthy population of shallow dimples in the region of unstable
crack growth.
43. Scanning electron micrographs of the fatigue fracture surface of the
Ti-6Al-4V specimen (Orientation: Transverse) deformed in cyclic
fatigue at a maximum stress of 823 MPa at a stress ratio of R = 0.1
and resultant fatigue life (Nf) of 581,951 cycles, showing pockets
of shallow striations reminiscent of local microplastic deformation. ……….…106

1
CHAPTER I
INTRODUCTION
Industrialization coupled with rapid advances in the field of science and
technology have resulted in the development and use of a wide range of metals, their
alloy composite counterparts i.e., metal matrix composites, in various applications and
industries. Over the past few decades, titanium and its alloys have emerged as a preferred
choice of use, owing to their excellent, mechanical properties like, high specific strength
(σUTS/ρ), stiffness, commendable corrosion and erosion resistance, fracture toughness and
the ability to withstand huge temperature variations [1,2]. Continuous research in the
field of material sciences have established titanium as a preferred choice for use in many
performance-critical industries like aerospace and defense-related applications [3-4].
Pure titanium metal has a melting point of 1675oC and an atomic weight of 47.9
[5]. The density of pure titanium metal is 4.5 g/cm3, which is about sixty-percent of steel
[2, 5]. Furthermore, pure titanium and its alloys are essentially non- magnetic and offer
good heat transfer capability. The excellent specific strength [σUTS/ρ] of pure titanium
and its alloys at both high temperature (in excess of 590oC) and low temperature (less
than -253oC) enables it to be the preferred metal that is often chosen and used as an ultra-
high speed metal for aircraft structural components and even components of the space
shuttle [3, 5]. The high melting point of titanium metal enables it to be preferred choice
for use in turbine engines [6].

2
Further, since the titanium metal has excellent superplastic properties, it can be easily
deformed to the tune of two-thousand percent without experiencing appreciable necking
and/or cracking when heated to a temperature of 925oC during the super-plastic forming
process [6]. Also, titanium and its alloy counterparts are nonmagnetic and have a lower
linear coefficient of expansion and lower thermal conductivity than the widely chosen
and used family of steel and the alloys of aluminum [7]. In more recent years, the
automotive industry has increased its use of the titanium metal because of its
performance at elevated temperatures coupled with good formability. Noticeably, the
metal has minimal degradation and high oxidation resistance during long term service or
extended service at elevated temperatures [3, 4].
Essentially, the high cost of producing the titanium metal limited its selection and
use to those applications that either required high performance or where life-cycle cost
analysis justified its selection and use [8]. It was the aerospace and defense industries that
stimulated the initial development of titanium in both commercially pure (CP) form and
as alloys in the early 1950‟s [9, 10]. From a scientific perspective, titanium is categorized
as a polymorphic metal because at room temperature [T = 25oC], it has a hexagonal
close-packed (HCP) crystal structure, which is referred to as the alpha phase [11].
However, at temperature above 882°C, an allotropic phase transformation occurs to form
the body-centered cubic (bcc) crystal structure, which is referred to as the beta phase [12-
14]. Unalloyed titanium is generally referred to as commercially pure (CP) titanium
metal, which has noticeably low strength when compared one-on-one to alloys, but is the
most corrosion resistant version of the metal [13, 14], making it a preferred choice for
military aircraft stationed on ships. Interstitial elements, such as oxygen and nitrogen, are

3
beneficial since they tend to contribute to strengthening of the commercially pure
titanium and its different grades [15]. Since commercially pure titanium has excellent
corrosion resistance, it is used on-board kitchens, toilets and de-icing equipment.
Helicopters use titanium alloys in highly stressed components like rotor head and rotor
mast. In space vehicles, titanium alloys are used for the fuel and satellite tanks due to its
light weight, high strength and long term chemical compatibility [1, 4]. The automotive
industry was attracted to titanium alloys for its light weight, high specific strength (σ/ρ),
high elastic energy absorption capacity and excellent corrosion resistance [4]. It is used in
exhaust systems, valves, valve cups, connecting rod, turbochargers, suspension springs,
etc [5]. The Marine and energy industries require materials having
(a) High corrosion resistance,
(b) Wide range of strength and performance characteristics under static, cyclic and
dynamic loading conditions,
(c) Cold resistance in a temperature range of -50°C,
(d) High erosion resistance and fire resistance, which they found the alloys of titanium to
meet all of the requirements [6, 16].
Biomedical applications rely on biocompatibility of titanium alloys. Hip and knee-joint
prostheses and other permanent implants like casing for cardiac pacemakers, bond
fixtures, orthodontic and dental implants are made from the titanium metal [2, 7, 16].
Though titanium and its alloys are expensive, it cannot be compromised on account of its
varied properties, low maintenance and long life usage. The higher cost of titanium can
be ascribed to the metal‟s strong affinity for oxygen, creating challenges both during
extrusion and downstream processing. This limitation has engineered a considerable

4
amount of scientific and technological interest in developing potentially viable and
economically affordable manufacturing methods that aid in reducing the cost of the
product.
The primary objective of this research project was to study the performance of
built‐up welded beams of commercially pure (Grade 2) titanium and a common titanium
alloy Ti-6Al-4V under both static and fatigue loading conditions. The secondary
objectives were:
(i) To study the conjoint influence of intrinsic microstructural features, nature of
loading and specimen properties on the tensile properties and resultant fracture
behavior of the alloys of titanium, Ti-CP (Grade 2) and the “work-horse” alloy
Ti-6Al-4V in the light of results obtained from the uniaxial tensile tests.
(ii) To understand the macroscopic fracture mode, the intrinsic features on the fatigue
fracture surface and the role of applied stress-microstructural feature interactions
in governing failure for the cyclic fatigue properties for both the alloys of
titanium, Ti-CP (Grade 2) and Ti-6Al-4V.
(iii) To evaluate of static strength and fatigue behavior of commercially pure titanium
(Grade 2) and Ti‐ 6Al‐4V built‐up beams to produce high strength, low weight,
corrosion resistant and low cost structural beams for the purpose of applications in
the defense sector.
(iv) To experimentally and theoretically evaluate Ti alloy beams fabricated and tested
under both static and fatigue loading.

5
(v) To develop analysis and design approaches for static and fatigue performance of
built‐up beams made from both commercially pure titanium and a common
titanium alloy.
The study presented in this thesis is part of a larger ongoing research program
aimed at establishing the influence of orientation of plate and microstructure on the
structural response of welded titanium structures. The thesis is divided into two major
sections PART-A and PART-B. The hardness, tensile properties, high cycle fatigue
properties and final fracture behavior for Ti-CP (Grade 2) is discussed in PART – A and
the titanium alloy Ti-6Al-4V is discussed in PART-B. The literature review related to
Ti-CP (Grade 2) is presented in PART-A (Chapter II), while the titanium alloy Ti-6Al-4V
is covered in PART-B (Chapter I). The characteristic properties and chemical
composition of the as received Ti-CP (Grade 2) is described in PART-A (Chapter III),
and for Ti-6Al-4V it is described in PART-B (Chapter II). The test sample preparation
and experimental procedures are described in PART-A (Chapters IV and V) for Ti-CP
(Grade 2) and PART-B (Chapters III and IV) for Ti-6Al-4V. PART-A (Chapter VI) and
PART-B (Chapter V) discuss the two materials under this study, in light of the conjoint
and mutually interactive influences of load ratio, maximum stress, intrinsic
microstructural features, nature of loading and stress (load)-deformation-microstructural
interactions. The conclusions drawn from the analysis of test results for Ti-CP (Grade 2)
material are listed in PART –A (Chapter VII) and for the titanium alloy Ti-6Al-4V; they
are listed in PART-B (Chapter VI).

6
PART - A
CHAPTER II
REVIEW OF LITERATURE [Ti – CP (GRADE 2)]
In this chapter, a brief review of the published literature encompassing the
domains of processing, microstructure and mechanical behavior of the commercially pure
form of titanium is presented. Wiskott et al., [17], studied the mechanical and structural
characteristics of commercially pure titanium (Grade 2) welds and solder joints. In recent
years, titanium either in the commercially pure form or the alloyed form has been a viable
choice for use as an orthopedic and dental implant material. The objective of this research
was to determine the applicability of the gathered test data for laser welds and Infrared
(IR) brazing using an Au‐Pd alloy to the titanium joints. Their study was particularly
designed to assess the mechanical resistance, microstructural development, and elemental
diffusion of laser welded, electric arc welded and brazed joints using commercially pure
titanium as the substrate metal. The native metal was made of grains that were fairly
equiaxed and homogeneous. Annealing the machined specimens at 950°C had little to no
influence on grain structure. Laser welding of commercially pure titanium produced joint
structures that were both identical and continuous with the parent metal. The joints were
devoid of visible contamination and no Widmanstatten structures were present [17]. In
contrast to the laser joints, electric arc welding was found to produce major alterations in
structure of the joint [17]. The heating regimen associated with this technique converted
an initially granular parent metal to an acicular structure. The Widmanstatten structures

7
observed were present up to 15mm from the joints. The results of the mechanical tests
revealed the annealed substrate alloy to have a 68% higher UTS value than the ASTM F
67‐83 specification for CP Ti grade. However, in a previous report on ASTM Grade 5
and ASTM Grade 2 (Commercially pure titanium whose composition is close to the one
used by the researchers in this study), the UTS of standard specimens was found to be in
the range of 474 ‐ 479 MPa – a value that was well within 5% of the tensile strength of
the specimens. No microstructural alteration was found for the fatigue resistance
observed. The arc‐welded joints were found to be superior to the native substrate under
monotonic tensile load but were inferior when subjected to fatigue loading or cyclical
stresses. Judging from the small microstructural differences between the native CP
titanium and the annealed CP substrate, the annealing process was actually a stress relief
rather than a recrystallization process. This detailed study by the researchers revealed an
improvement in cyclic fatigue resistance with annealing [17]. Under fatigue loading
conditions, the CP titanium‐based brazing as well as the laser welded and electric arc
weld performed equally well if not better than an Au-Pd alloy. There was an observable
increase in grain size with an increase in heat application. However, these researchers
were unable to link a specific features of the microstructure observed or to establish
correlation of the elemental analysis with the specimen‟s resistance to fatigue stress
application [17].
Salishchev et al., [18] examined and documented grain size dependence of certain
mechanical properties of commercially pure titanium when deformed at room
temperature. A continuous improvement in strength, lower work hardening was observed
with a decrease in grain size. The strength was observed to steadily increase with a

8
decrease in grain size of the annealed titanium specimens. Evaluating the effect of grain
size on average strain hardening rate (νa) for the annealed state, it was found that the
work hardening coefficient decreased as the grain size decreased to 1μm and was found
to be relatively independent of grain size. A decrease in the average crystal size resulted
in a steady increase in strength, a decrease in hardening, and a shortening of the uniform
deformation stage (grain size d < 20 μm) [18]. The total plasticity prior to fracture
coupled with localized deformation in the neck indicated a relatively weak sensitivity to
grain size. The phenomenon associated with grain size effects was attributed to be due to
the predominant dislocation density near the grain boundaries [18].
The microstructure and mechanical properties of commercial purity titanium
severely deformed by accumulative roll bonding (ARB) process was studied by Terada et
al., [19]. Commercial purity titanium was deformed by accumulative roll bonding (ARB)
process up to 8 cycles (equivalent to strain of 6.4) at ambient temperature. The
microstructure of the ARB‐processed specimens revealed two kinds of characteristic
ultrafine microstructures. The first was a lamellar boundary structure that was elongated
along the rolling direction (RD), which has also been reported for the accumulative roll
bonding processed cubic metals [19]. The lamellar boundary spacing decreased with an
increase in the accumulative roll bonding strain and reached about 80nm following 5
cycles of ARB. The second microstructure was the equiaxed grains having a mean grain
size of 80‐100nm. Ultra fine grain (UFG) microstructures were formed in the CP‐Ti
highly deformed by the accumulative roll bonding process [19]. Deformation twins were
observed to form at the lower strain below 50% rolling reduction but disappeared at a
higher reduction above 75%. Therefore, deformation twining was found to have little

9
influence on evolution of the ultrafine microstructure [19]. It was suggested that fine
equiaxed grains formed during recovery and the inhomogeneously deformed regions,
such as, the macroscopic shear bands and micro shear bands, where very large shear
strain tends to localize. Local adiabatic heating arising from low thermal conductivity of
titanium does assist in the recovery [19].
I.P.Semenova et al., [20] documented the enhanced fatigue strength of
commercially pure titanium processed by severe plastic deformation. In their study, they
evaluated the high-cycle fatigue behavior of smooth and notched samples of
ultrafine‐grained titanium prepared by severe plastic deformations and compared it with
the corresponding properties of conventional titanium. They found that a combination of
high strength and enhanced ductility of the ultrafine‐grained titanium led to an increase in
fatigue endurance limit [20]. Commercially pure (CP) titanium (Grade4) [Ti: balance, C:
0.052%, O: 0.34%, Fe: 0%, N: 0.015 %( wt %)] was the material used to conduct the
research study. The microstructure of the titanium rods subsequent to processing was
characterized to be a combination of (i) Equiaxed ultrafine grains and sub grains having
an average grain size of 200‐nm and (ii) A high dislocation density in the cross‐section.
The typical structure in the longitudinal section, i.e., examined along the rod length,
consisted of the α‐ grains elongated along the rod axis. The interior of the elongated
grains was fragmented by sub grains about 200nm in size and having low‐angle
boundaries. They found the fatigue endurance limit of the ultra-fine grain samples
following 107 cycles to increase from 350 MPa to 590 MPa due to a significant increase
in the strength of the material that possessed sufficient ductility. These researchers
showed that an additional enhancement of the fatigue limit, up to 610Mpa, was possible

10
by means of annealing at 350° C for 6h. The annealing enabled increasing ductility
without appreciable loss of strength. The fatigue endurance limit of the UFG titanium is
strongly influenced by notch size and shape [20]. The notch sensitivity of the ultrafine
grain titanium was found to be greater than that of the coarse grained CP Ti counterpart,
but lower than the one for the Ti‐6Al‐4V alloy.
Takao et al., [21] studied the low cycle fatigue behavior of commercially pure
titanium. Owing to its excellent strength-weight ratio, commercially pure titanium is
generally chosen for use in heat exchangers both in power stations and in chemical
plants. In an aggressive environment, the material undergoes cyclic deformation and their
study did shed some light on the low‐cycle fatigue behavior of this material. The high
cycle fatigue of the titanium material chosen is characterized by microscopic cracking
initiating within the slip bands between grains and joining together to form macroscopic
cracks that grow through the microstructure culminating in final fracture. A similar
behavior can be observed for low cycle fatigue criteria. Thus, crack initiation and crack
propagation behavior for the commercially pure titanium was studied by a careful
examination of the fracture surface of the test specimen that was subject to cyclic strain
conditions in low cycle fatigue. The 0.2% proof stress of the material was determined to
be 243MPa. A tensile strength of 372 MPa, elongation of 35.4%, a reduction in area of
67.0%; true fracture stress of 793MPa, elastic modulus of 110GPa and average grain size
of 76μm were determined from mechanical testing of the specimens. Further, it was
observed that, the fatigue hardening and softening behavior was not very remarkable in
commercial purity titanium. Irreversible localized deformation was observed along the
grain boundaries, which gradually accumulates during subsequent loading cycles

11
culminating in the formation of cracks. Since the number of slip systems for commercial
purity titanium is less than other metals having a face‐centered cubic or body‐centered
cubic crystal structure, maintaining the continuity of plastic deformation is difficult [21].
Therefore slip band growth is obstructed by the surrounding grains resulting in a
concentration of deformations along the grain boundaries [21].

12
PART- A
CHAPTER III
MATERIAL [Ti – CP (GRADE 2)]
The first material chosen for this study was commercially pure (CP) titanium
(Grade 2) referred to henceforth as Ti - CP (Grade 2). This material was provided by
TICO Titanium based in Wixom, Michigan, USA. The material was provided by the
manufacturer in a fully annealed condition. The Ti-CP (Grade 2) is receptive to heat
treatment and can be solution heat treated and annealed to achieve the desired strength
and properties. The quantities supplied by TICO are shown in Figure 1, and were as
follows:
i. Plate 0.375″ TK X 3.00″ wide X 36.00″ long six pieces
ii. Sheet 0.125″ TK X 4.00″ wide X 36.00″ long three pieces
The edges of the plates and sheets were sheared. The chemical composition of the plates
was provided by the supplier and is as shown in Table 1 along with other details.

13
Table 1: Material specifications, nominal chemical composition (in weight percent)
and material properties given by TICO for the Ti - CP (Grade 2).
Description 0.375″ Thick Plate 0.125″ Thick Sheet
Specification
ASTM B‐265‐06/ASME
SB‐ 265‐A06 GR. 2 EN
10024:2004
Type 3.1
ASTM B‐265‐07/ASME
SB‐265‐ 7/ASTM F‐67‐06
GR.2 EN 10204:2004
Type 3.1
Chemical Composition
• Fe Iron
• Oxygen
• N Nitrogen
• C Carbon
0.13
0.16
0.002
0.012
• Residual Element (Each)
less than 0.10
• Residual Element (Total)
less than 0.40
• Final Product Hydrogen
0.0032
• Titanium Remainder
0.08
0.1
0.0105
0.014
• Residual Element (Each)
less than 0.10
• Residual Element (Total)
less than 0.4
• Final Product Hydrogen
11/10 PPM
• Titanium Remainder
Average Tensile Strength,
psi 73,500 70,250
Yield 0.2% Offset 52,100 49,500
Elongation % 33 25.75
Reduction in Area % 59
Anneal Condition Yes 1370F, HGA 3 to 11 Min
Guided Bend Test Pass

14
Figure 1: The as received plate stock for the Ti – CP (Grade 2) material.

15
PART-A
CHAPTER IV
TEST SAMPLE PREPARATION [Ti – CP (Grade 2)]
The test samples used in this study were prepared as per the specifications
prescribed in the standard ASTM E-8. The samples were precision machined from the as-
provided annealed plate stock both in transverse (T) and longitudinal (L) orientations. In
case of the longitudinal orientation, the specimens were machined such that the major
stress axis was parallel to the rolling direction, whereas, in case of the transverse
orientation, the specimens were machined such that the major stress axis is perpendicular
to the rolling direction of the alloy plates. The specimens measured 0.250 inch in
diameter at the grips and 0.125 inch in diameter at the gage section and 0.5inch in length.
A schematic of the test specimen is as shown in Figure 2. In order to minimize the
effects of surface irregularities and finish, the gage sections of the specimens were
mechanically polished using progressively finer grades of silicon carbide impregnated
emery paper (320 grit, 400 grit and 600 grit) to remove any circumferential scratches or
residual marks.

16
Figure 2: A schematic of the longitudinal and transverse flat test specimen used for
Mechanical testing (Tensile and Cyclic fatigue).
TEST SPECIMEN

17
PART- A
CHAPTER V
EXPERIMENTAL PROCEDURES [Ti-CP (GRADE 2)]
5.1 Initial microstructure characterization
An initial characterization of the microstructure of the as-provided material was
done using a low magnification optical microscope. Samples of desired size were cut
from the as-received stock of the titanium material Ti-CP (Grade 2) and mounted in
bakelite. The mounted samples were then wet ground on progressively finer grades of
silicon carbide impregnated emery paper using copious amounts of water both as a
lubricant and as a coolant. Subsequently, the ground samples were mechanically polished
using five-micron alumina solution. Fine polishing to a perfect mirror-like finish of the
surface of the titanium material, i.e., Ti-CP (Grade 2), was achieved using five-micron
diamond solution as the lubricant. The polished samples were subsequently etched using
a reagent that is a solution mixture of 5-ml of nitric acid (HNO3), 10 ml of hydrofluoric
acid (HF) and 85 ml of water (H2O). The polished and etched surface of the sample of
Ti-CP (Grade 2) was observed under an optical microscope and photographed using
bright field illumination technique.

18
5.2 Hardness testing
Hardness of a material is the mechanical property defined as the resistance offered
by the material to indentation i.e. permanent deformation and cracking [22].The hardness
was measured using a Vickers (Hv) micro hardness testing machine. The test itself is quite
simple and nondestructive that is easy to perform and is widely used for the purpose of
determining the mechanical properties of monolithic metals and their alloy counterparts.
The macro-hardness measurements (RC) were made on a Rockwell hardness
machine using an indentation load of 140 Kgf, a minor load of 10 Kgf, 120 degree
diamond cone, a dwell time of 10 seconds and the value read on the „C‟ scale. The macro
-hardness tests were also done on the polished surface of each Ti-CP (Grade 2) test
specimen. Two samples of, Ti-CP (Grade 2) were examined for micro-hardness and
macro-hardness measurements. The results of the micro-hardness and macro-hardness
tests are summarized in Table 2 and Table 3.

19
Table 2: A compilation of microhardness measurements made on Ti-CP (Grade 2).
Alloy
Trial 1 Trial 2 Trial 3 Trial 4 Trial 5 Average
Sample 1 A
Ti-CP (Grade 2)
Vicker's
hardness 213.59 193.56 193.65 193.67 200.58 199.37
Rc - - - - - -
Sample 1 B
Ti-CP (Grade 2)
Vicker's
hardness 175.59 178.58 167.26 169.26 193.67 176.82
Rc - - - - - -
Table 3: A compilation of macrohardness measurements made on Ti-CP (Grade 2).
Alloy
Trial 1 Trial 2 Trial 3 Trial 4 Trial 5 Average
Sample 1A
(Ti-CP
(Grade 2))
Vickers
hardness 260 260 272 254 260 261.2
Rc 24 24 26 23 24 24.2
Sample 1B
(Ti-CP
(Grade 2))
Vickers
hardness 260 266 279 254 260 263.8
Rc 24 25 27 23 24 24.6

20
5.3 Mechanical testing
Tensile and high cycle fatigue tests were conducted on the specimens to
systematically study the tensile deformation, cyclic fatigue and final fracture behavior for
the commercially pure titanium. The details of the tests are given in the following
sections.
5.3.1 Tensile tests
Uniaxial tensile tests were performed on a fully-automated, closed-loop servo-
hydraulic mechanical test machine [INSTRON-8500 Plus] using a 100 kN load cell. The
tests were conducted at room temperature (300 K) and in the laboratory air (Relative
Humidity of 55 pct) environment. The test specimens were deformed at a constant strain
rate of 0.0001/sec. An axial 12.5-mm gage length clip-on type extensometer was
attached to the test specimen at the gage section using rubber bands. The stress and strain
measurements, parallel to the load line, and the resultant mechanical properties, such as,
stiffness, strength (yield strength and ultimate tensile strength), failure stress and ductility
(strain-to-failure) was provided as a computer output by the control unit of the test
machine. The average values of yield strength obtained from the tensile tests were used
for calculating the following information required for the high cycle fatigue tests.
(a) Yield load based on the yield stress obtained from the tensile tests.
(b) Maximum stresses, as percentages of the yield stress of the alloy for purpose of
testing the specimens under conditions of stress amplitude-controlled fatigue.

21
5.3.2 High cycle fatigue tests
The stress-amplitude controlled high cycle fatigue tests were performed using a
sinusoidal waveform at a stress ratio [R = Minimum Stress (σmin) / Maximum Stress
(σmax)] of 0.1 .The cyclic loading of the test specimen was conducted at a frequency of
5Hz. At a given stress ratio [R = σminimum / σmaximum], the fatigue tests were conducted
over a range of stress amplitudes to establish the variation of maximum stress (σmaximum)
with cyclic fatigue life (Nf).
Three specimens in the transverse orientation had been subjected to a stress
percentage marginally higher than the yield stress condition (approximately 6%). The
data collected from the high cycle fatigue test is used to establish the following
relationships.
1. Variation of maximum stress (σmax) with fatigue life (Nf).
2. Variation of the ratio of maximum stress/yield stress (σmax/σy) with fatigue life (Nf).
3. Variation of maximum elastic strain (σmax/E) with fatigue life (Nf).
4. Variation of the ratio of maximum stress/ultimate tensile stress (σmax/σUTS) with
fatigue life (Nf).
The fatigue test data for the cylindrical samples of the Ti – CP (Grade 2) (at R = 0.1) are
summarized in Appendix A.
5.4 Failure-damage analysis
The fracture surfaces of the deformed and failed tensile specimens of i.e., Ti-CP
(Grade 2), were comprehensively examined in a scanning electron microscope (SEM) to
determine the macroscopic fracture mode and to concurrently characterize the fine scale

22
topography of the tensile fracture surface for the purpose of establishing microscopic
mechanisms governing fracture. The distinction between the macroscopic mode and
microscopic fracture mechanisms is based entirely on the magnification level at which
the observations are made. The macroscopic mode refers to the overall nature of failure
while the microscopic mechanisms relate to the local failure processes, such as: (i)
microscopic void formation, (ii) microscopic void growth and coalescence, and (iii)
nature, intensity and severity of the fine microscopic and macroscopic cracks dispersed
through the fracture surface. The samples for observation in the SEM were obtained
from the failed tensile specimens by sectioning parallel to the fracture surface.

23
PART-A
CHAPTER VI
RESULTS AND DISCUSSION [Ti-CP (GRADE 2)]
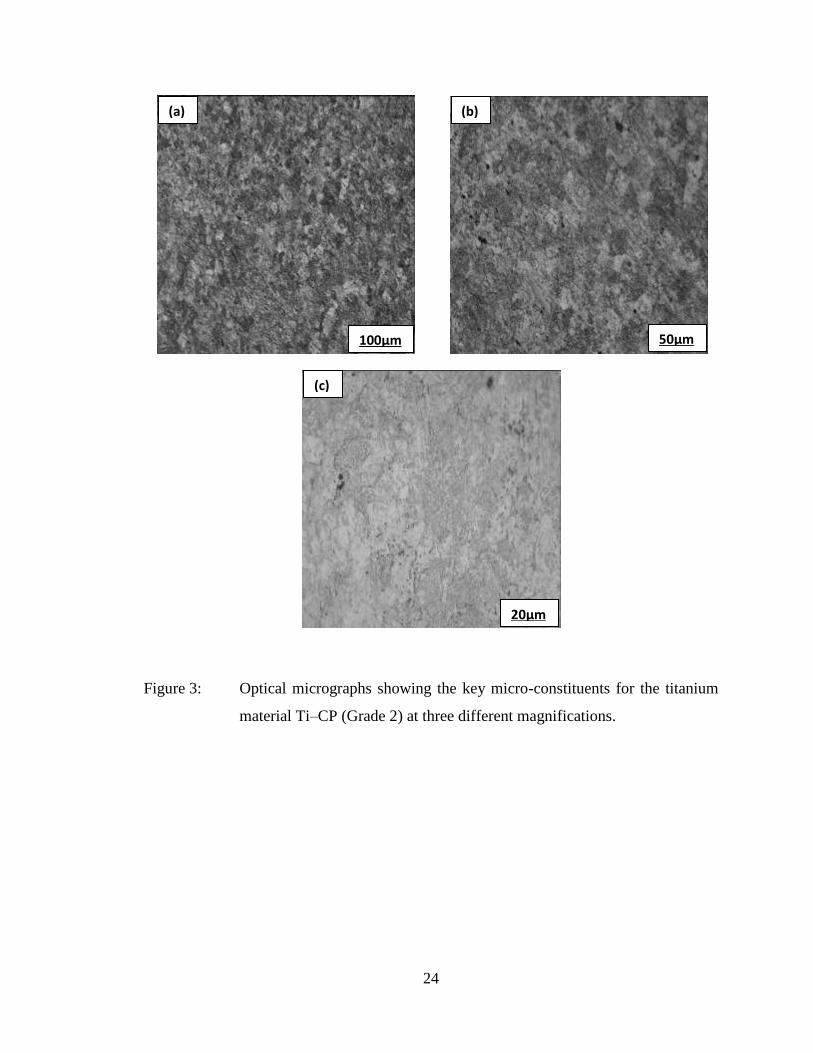
6.1 Initial Microstructure
The microstructure of an alloy is an important factor that determines its
mechanical properties to include tensile properties, fracture toughness, fatigue resistance
and resultant fracture behavior. The optical microstructure of Ti-CP (Grade 2) is shown
in Figure 3 at three different magnifications. At a higher magnification (500 x), the
intrinsic microstructural constituents of Ti-CP (Grade 2), is shown in Figure 3c bringing
out clearly the size, morphology, volume fraction, and distribution of the alpha (α) and
beta (β) phases.
Low magnification observation of the microstructure of the Ti-CP (Grade 2)
essentially revealed the primary alpha (α) grains to be intermingled with small yet
noticeable pockets of the beta (β) grains. High magnification observation revealed very
fine alpha (α) phase lamellae located within the beta (β) grain (Figure 3 b).
24
Figure 3: Optical micrographs showing the key micro-constituents for the titanium
material Ti–CP (Grade 2) at three different magnifications.
50μm 100μm
(a) (b)
20μm
(c)

25
6.2 Hardness
Hardness is defined as the resistance offered by a material to permanent
indentation or deformation. A hardness test is the most economical, reliable and efficient
method for determining the mechanical properties of a metal. The presence of intrinsic
variations in the microstructural features i.e., the alpha and beta phases, does cause a
marked variation of the properties measured across a cross-section of the Ti-CP (Grade 2)
sample.
6.2.1 Microhardness measurement
The Vickers microhardness measurements were made from edge-to-edge across
the center of a sample mounted in bakelite. Multiple measurements were made in order to
compensate for the variation of hardness values across the sample cross-section. The
cumulative effect of strengthening observed in the material can be attributed to the
following :
(a) The presence of the intrinsic microstructural features like the alpha and beta phases
(b) A net weakening effect, that can be ascribed to the presence of processing-related
features like (i) fine microscopic voids and pores, and (ii) fine microscopic cracks that
is intercepted by the pyramidal indenter resulting in a net decreased value for
microhardness of the specimens. [22,23].
It can be further observed that, the hardness values when plotted reveal marginal spatial
variability with an average value of 200kg/mm2
for the Ti - CP (Grade 2). The variation
of microhardness values across the length of fully annealed Ti-CP (Grade 2) material is
shown in Figure 4.

26
Figure 4: A profile showing the variation of microhardness values across the length
of fully annealed Ti-CP (Grade 2).
6.2.2 Macrohardness measurement
The macrohardness values (Table 2) across the length of the specimen were
measured based on the Rockwell C scale, with an average value of 260 kg/mm2 for the
Ti-CP (Grade 2) material . The variation of macrohardness values across the length of
fully annealed Ti-CP (Grade 2) is shown in Figure 5. The bar graph depicting the
average microhardness and macrohardness values of the material Ti-CP (Grade 2) is
shown in Figure 6.

27
Figure 5: A profile showing the variation of macrohardness values across the length
of fully annealed Ti-CP (Grade 2).
Figure 6: Bar graph depicting the average microhardness and macrohardness values of
Ti-CP (Grade 2).
0
100
200
300
Microhardness
Macrohardness
Microhardness Macrohardness
Ti - CP (Grade 2)
Vic
ke
r's h
ard
ne
ss H
(k
g/m
m2)

28
6.3 Tensile Properties
The room temperature tensile properties of Ti-CP (Grade 2) are summarized in
Table 4. The results reported are the mean values based on duplicate tests. The elastic
modulus, yield strength, ultimate tensile strength, elongation-to-failure and strength at
failure (fracture) were provided as an output of the PC based data acquisition system.
The yield strength was determined by identifying the stress at a point on the engineering
stress versus engineering strain curve where a straight line drawn parallel to the elastic
portion of the stress versus strain curve at 0.2% offset intersects the curve. The ductility
is reported as elongation-to-failure over a gage length of 12.7 mm. This elongation was
measured using a clip-on extensometer that was attached to the gage section of the test
specimen [6].
Table 4: Room temperature tensile properties for Ti-CP (Grade 2) [Results are mean
values based on duplicate tests]
Material Orientation
Elastic
Modulus
Yield
Strength UTS Elongation
GL=0.5"
(%)
Reduction
in Area
(%)
Tensile
Ductility
ln(Ao/Af)
(%) msi GPa ksi MPa Ksi MPa
Ti :CP
(Grade-2)
Longitudinal 16 115 63 432 81 561 14.7 43.4 57
Transverse 15 108 55 382 67 465 18.9 47 63
ASM
Handbook 15.2 105 40-60
275-
410 50 344 20 35 -

29
The representative stress versus strain curves for Ti-CP (Grade 2) for both the
longitudinal (L) and transverse (T) orientations are shown in Figure 7 and Figure 8. The
modulus of elasticity for Ti-CP (Grade 2) was determined to be 115GPa in the
longitudinal orientation and 108GPa in the transverse orientation. The yield strength for
Ti- CP (Grade 2) in the longitudinal orientation was determined to be 432 Mpa (63 ksi),
which is 15 % higher than the value for the transverse orientation [382 Mpa (55 ksi)].
The ultimate tensile strength is 561 MPa (81 Ksi) in the longitudinal orientation and 465
MPa (67 ksi) in the transverse orientation, a noticeable difference of 20 pct. The ultimate
tensile strength is higher than the yield strength indicating a noticeable work hardening
beyond yield. The elongation of Ti- CP (Grade 2) alloy was 14.7% in the longitudinal
orientation and 18.9% in the transverse orientation. The reduction-in-area was 43.4% in
the longitudinal orientation and 47% in the transverse orientation. The engineering stress
versus engineering strain curves for the material in both the longitudinal and transverse
orientations are shown in Figure 7. Observation of the variation of stress with plastic
strain, is shown in Figure 8, and reveals that Ti-CP (Grade 2) to be harder in the
longitudinal orientation compared to the transverse orientation. The strain hardening
exponent (n) of this material is 0.097 for the longitudinal (L) orientation and 0.094 for the
transverse (T) orientation.

30
Figure 7: Influence of test specimen orientation on engineering stress versus
engineering strain curve for Ti – CP (Grade 2).
Figure 8: The monotonic stress versus strain curve for Ti – CP (Grade 2)

31
6.4 Tensile Fracture Behavior
An exhaustive examination of the tensile fracture surfaces of both the longitudinal
and transverse specimens in a scanning electron microscope (SEM) revealed the specific
role played by intrinsic microstructural features and microstructural effects on strength
and ductility properties of the chosen titanium material. Representative fractographs of
the tensile fracture surface of Ti-CP (Grade 2) for the longitudinal orientation are shown
in Figure 9 and for the transverse orientation in Figure 10.
Due to the occurrence and presence of fairly high localized stress intensities at
selected points through the microstructure, the corresponding strain is conducive for: (i)
the nucleation and early growth of the microscopic voids, and (ii) the eventual
coalescence of the microscopic and macroscopic voids to occur at low to moderate stress
levels [25, 26]. This results in the early initiation and presence of fine microscopic
cracks distributed through the fracture surface [16]. During far-field loading, the fine
microscopic voids tend to grow, or increase in size, and eventually coalesce with each
other. The halves of these voids are the shallow dimples visible on the fracture surface.
Coalescence of the fine microscopic cracks results in a macroscopic crack that is favored
to propagate in the direction of the major stress axis. The irreversible plastic deformation
that is occurring at the “local” level is responsible for aiding the growth of the cracks
through the microstructure. The fine microscopic and macroscopic cracks tend to
propagate in the direction of the major stress axis, suggesting the important role played
by normal stress in promoting tensile deformation. Since a gradual extension of both the
microscopic and macroscopic cracks under quasi-static loading essentially occurs at the
high local stress intensities comparable with the fracture toughness of the material, the

32
presence of a population of fine microscopic and macroscopic voids does exert a
detrimental influence on strain-to-failure (Єf) associated with ductile fracture. A gradual
destruction of microstructure of the titanium material culminates in conditions at the
“local” level that are conducive to crack extension to occur at locations of the prevailing
local high stress intensities. The microscopic cracks tend to propagate in the direction of
the tensile stress axis, suggesting the important role of normal stress in enhancing tensile
deformation. Since crack extension under quasi- static loading occurs at the high local
stress intensities comparable with the fracture toughness of the material, the presence of a
healthy population of voids of varying size has a detrimental influence on strain-to-failure
associated with ductile fracture.
On a macroscopic scale, tensile fracture of this material in the longitudinal
orientation was at an inclination to the far-field stress axis (Figure 9a). Careful
observation of the different regions of the fracture surface was made at high
magnification to delineate the intrinsic fracture features. Isolated and randomly
distributed microscopic voids and a healthy population of ductile dimples were found
covering the transgranular fracture regions (Figure 9b). High magnification observations
in the transgranular region revealed the dimples to be shallow and of varying size coupled
with fine microscopic cracks (Figure 9c). The overload region revealed a combination of
fine microscopic cracks, microscopic voids of varying size and randomly distributed
through the surface, and a large population of shallow dimples, features reminiscent of
locally brittle and ductile failure mechanisms (Figure 9d).

33
For the transverse specimen, overall morphology of the tensile fracture surface
was also at an inclination to the tensile stress axis (Figure 10a). High magnification
observation in the transgranular region revealed features similar to the longitudinal
counterpart, i.e., a combination of microscopic voids of varying size and a large
population of ductile dimples (Figure 10b). The dimples were shallow in nature and of
varying size (Figure 10c). Observation in the tensile overload region revealed features
that were quite similar to those observed in the transgranular region, i.e., microscopic
voids of varying size and shallow dimples of non-uniform size and shape. The features
observed through the fracture surface were reminiscent of locally ductile and brittle
failure mechanisms governing the tensile response of the material under study, Ti – CP
(Grade 2).

34
Figure 9: Scanning electron micrographs showing the tensile fracture surface of
Ti-CP (Grade 2) specimen (orientation: Longitudinal) deformed in
tension:
(a) Overall morphology of tensile fracture surface at an inclination to stress axis.
(b) High magnification of (a) showing population of voids and shallow dimples of
varying size covering the transgranular region
(c) High magnification of (b) showing the morphology and distribution of
dimples and fine microscopic cracks features reminiscent of locally ductile
and brittle failure mechanisms.
(d) The overload region showing microscopic voids, cracks and shallow dimples.
(a)
100m
(b)
20m
(c)
10m
(d)
m

35
Figure 10: Scanning electron micrographs showing the tensile fracture surface of
Ti-CP (Grade 2) specimen (orientation: Transverse) deformed in tension:
(a) Overall morphology of tensile fracture surface at an inclination to stress axis.
(b) High magnification of (a) showing isolated voids and shallow dimples of
varying size covering the transgranular region.
(c) High magnification of (b) showing the morphology and distribution of
dimples and fine microscopic voids features reminiscent of locally ductile
failure mechanisms.
(d) The overload region showing randomly distributed microscopic voids,
microscopic cracks and pockets of shallow dimples.
(a)
100m
(b)
20m
(c)
10m
(d)
m
36
6.5 High Cycle Fatigue Resistance
The cyclic degradation of the strength of a material through the accumulation of
damage is known as fatigue. The fatigue life (Nf) of a structure or a component is
determined as the sum of the number of cycles to crack initiation (Ni) plus the number of
cycles of crack propagation (Np) eventually culminating in failure by fracture. A detailed
study of the cyclic fatigue response of the CP (Grade 2) titanium is important for its
selection and eventual use in a spectrum of performance-critical applications. A
comprehensive understanding of the fatigue behavior of commercially pure titanium
metal is rendered difficult by the presence and role of intrinsic microstructural features
and their specific role in governing the deformation and fracture processes during cyclic
loading. Studies have found and documented that the fatigue properties of the titanium
alloys to be governed by the conjoint influence of (a) surface defects, (b) crystallographic
texture, (c) intrinsic microstructural effects spanning the size and morphology of the beta
grains, colonies of alpha platelets, and (d) the presence and role of other intrinsic
microstructural features [10,27,28]. A few independent studies have shown that during
stress-controlled high-cycle fatigue, the structure-property relationship in commercially
pure titanium and titanium alloys is influenced by the presence, role and contribution of
intrinsic microstructural features. Alloy microstructures that produce a low resistance to
crack initiation, even at low values of applied stress, will usually yield the best endurance
during high-cycle fatigue testing and even tensile resistance [29,30].
The crack initiation characteristics of commercially pure titanium subjected to high-
cycle fatigue have been reported in literature as follows:
37
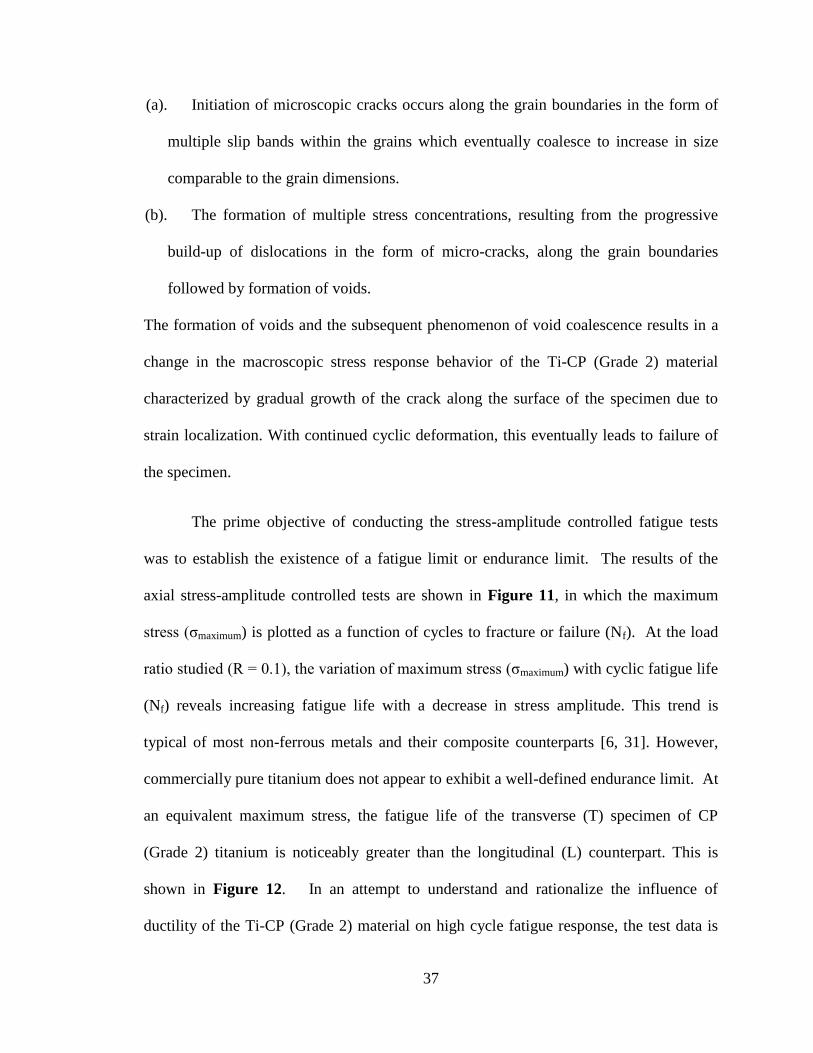
(a). Initiation of microscopic cracks occurs along the grain boundaries in the form of
multiple slip bands within the grains which eventually coalesce to increase in size
comparable to the grain dimensions.
(b). The formation of multiple stress concentrations, resulting from the progressive
build-up of dislocations in the form of micro-cracks, along the grain boundaries
followed by formation of voids.
The formation of voids and the subsequent phenomenon of void coalescence results in a
change in the macroscopic stress response behavior of the Ti-CP (Grade 2) material
characterized by gradual growth of the crack along the surface of the specimen due to
strain localization. With continued cyclic deformation, this eventually leads to failure of
the specimen.
The prime objective of conducting the stress-amplitude controlled fatigue tests
was to establish the existence of a fatigue limit or endurance limit. The results of the
axial stress-amplitude controlled tests are shown in Figure 11, in which the maximum
stress (σmaximum) is plotted as a function of cycles to fracture or failure (Nf). At the load
ratio studied (R = 0.1), the variation of maximum stress (σmaximum) with cyclic fatigue life
(Nf) reveals increasing fatigue life with a decrease in stress amplitude. This trend is
typical of most non-ferrous metals and their composite counterparts [6, 31]. However,
commercially pure titanium does not appear to exhibit a well-defined endurance limit. At
an equivalent maximum stress, the fatigue life of the transverse (T) specimen of CP
(Grade 2) titanium is noticeably greater than the longitudinal (L) counterpart. This is
shown in Figure 12. In an attempt to understand and rationalize the influence of
ductility of the Ti-CP (Grade 2) material on high cycle fatigue response, the test data is

38
re-plotted as the variation of maximum elastic strain with cycles-to-failure (Nf). Herein,
the maximum elastic strain is taken to be the ratio of maximum stress (σmaximum) to the
elastic modulus (E) of the Ti-CP (Grade 2). This is shown in Figure 13. At equivalent
values of maximum elastic strain, the transverse specimen reveals noticeably improved
fatigue life as compared to the longitudinal (L) counterpart.
To understand and rationalize the specific role of microstructure of the Ti-CP
(Grade 2) on high cycle fatigue life at a load ratio of 0.1, the test data is re-plotted to take
into account the strength of the Ti-CP (Grade 2) alloy in the two orientations, namely
longitudinal (L) and transverse (T). When the maximum stress (σmaximum) is normalized
by the material yield strength (σYS), the transverse (T) specimens have noticeably
improved fatigue life when compared to the longitudinal (L) specimens at equivalent
values of the ratio (Figure 12). A near similar trend is observed when the maximum
stress (σmaximum) is normalized by the ultimate tensile strength (σUTS) of the material along
the specific orientation. At equivalent values of the ratio [σmaximum/σUTS], the transverse
(T) orientation reveals improved fatigue life when compared to the longitudinal (L)
counterpart (Figure 14).

39
Figure 11: Variation of maximum stress (σmax) with fatigue life (Nf) for Ti-CP
(Grade 2) at a stress ratio of (R = 0.1)
Figure 12: Variation of the ratio of maximum stress/yield stress (σmax/ σy) with
fatigue life (Nf) for Ti-CP (Grade 2) at a stress ratio of (R = 0.1)

40
Figure 13: Variation of maximum elastic strain (σmax/E) with fatigue life (Nf) for
Ti-CP (Grade 2) at a stress ratio of (R = 0.1)
Figure 14: Variation of the ratio of maximum stress/ultimate tensile stress (σmax/σUTS)
with fatigue life (Nf) for Ti-CP (Grade 2) at a stress ratio of (R = 0.1)

41
6.6 Cyclic Fatigue Fracture
A careful examination of the cyclic fatigue fracture surfaces of the deformed and
failed specimens was conducted in a JEOL scanning electron microscope (SEM) at the
following levels of magnifications:
(A) At low magnification for the purpose of identifying (i) the region of microscopic
crack initiation, and the nature and characteristics of early crack growth, (ii) the
domain of stable crack growth, and (iii) final fracture, i.e., the region of overload.
(B) At gradually increasing magnification in both the region of stable crack growth
and overload with the purpose of identifying or establishing (i) the nature of
damage initiation, (ii) nature of both microscopic and macroscopic crack growth
through the alloy microstructure, and (iii) other fine scale features on the fracture
surface in the region of overload.
For the Ti- CP (Grade 2), the fracture surfaces revealed marginal to no difference
in topographies at the different values of maximum stress (σmaximum) and resultant fatigue
life (Nf). On a microscopic scale, the nature, morphology, and volume fraction of the
intrinsic features on the fatigue fracture surfaces were found not to vary with maximum
stress and resultant fatigue life. Only representative fractographs of the fatigue fracture
surfaces of the Ti- CP (Grade 2), at different values of maximum stress and resultant
cyclic fatigue life, are shown in Figure 15 to Figure 22.

42
6.6.1 Cyclic Fatigue Fracture: Longitudinal Orientation
At a maximum stress of 405 MPa, the longitudinal specimen had a fatigue life of
45,532 cycles. Scanning electron microscopy observations at low magnifications revealed
the overall morphology to comprise a small yet distinct region of crack initiation and
early microscopic crack growth, which appeared like the radiance of the sun (Figure
15a). Careful high magnification observations revealed the region to be flat and near
featureless, populated with extremely fine microscopic cracks that were randomly
distributed (Figure 15b). High magnification observation of the region of slow and
stable crack growth region revealed pockets of shallow striations, reminiscent of
localized micro-plastic deformation (Figure 15c). In the region of overload, observation
revealed a healthy population of dimples intermingled with voids of varying size and
shape, features reminiscent of locally ductile failure mechanisms (Figure 15d). In the
terminal stages of stable crack growth and approaching overload, the fatigue fracture
surface revealed fine striations intermingled with a healthy population of fine
microscopic cracks. The fine microscopic cracks grow in increments and eventually
coalesce to form macroscopic cracks (Figure 16).
For a test specimen that was cyclically deformed at a lower maximum stress of
366 MPa with a resultant fatigue life of 125,559 cycles, the fatigue fracture surface
revealed distinct regions of crack initiation and overload (Figure 17a). The transition
from crack initiation and early crack growth to stable crack growth to overload was
distinct as seen in (Figure 17b). High magnification observation in the region of slow
and stable crack growth revealed pockets of well-defined striations reminiscent of
localized microplastic deformation (Figure 17c). The overload region was rough and

43
comprised essentially of microscopic voids of varying size and shape intermingled with
shallow dimples, features reminiscent of locally ductile failure processes (Figure 17d).
High magnification observation in the region immediately prior to the onset of a short
region of unstable crack growth and overload revealed pockets of striations within the
grains, microscopic cracking along the grain boundaries, and microscopic cracking at and
along grain boundary triple junctions (Figure 18).
Thus, for the longitudinal (L) orientation the microscopic fracture features
observed for the specimens deformed at high maximum stress, resultant short fatigue life
(Nf), and low maximum stress, resultant long fatigue life (Nf), were essentially similar.

44
Figure 15: Scanning electron micrographs of the fatigue fracture surface of
Ti-CP (Grade 2) specimen (orientation: Longitudinal) deformed in cyclic
fatigue under a maximum stress of 405MPa with a fatigue life (Nf) of
45,532 cycles:
(a) Overall morphology showing the different regions.
(b) Fine microscopic cracks in the region of early crack growth.
(c) Pockets of shallow striations in the region of stable crack growth.
(d) Healthy population of dimples and voids of varying size and shape in
the region of overload.
(a)
100m
(b)
20m
(c)
10m
(d)
m

45
Figure 16: Scanning electron micrographs of the fatigue fracture surface of
Ti-CP (Grade 2) specimen (orientation: Longitudinal) deformed in cyclic
fatigue under a maximum stress of 405MPa with a fatigue life (Nf) of
45,532 cycles, showing growth and eventual coalescence of the fine
microscopic cracks to form a macroscopic crack.
m

46
Figure 17: Scanning electron micrographs of the fatigue fracture surface of
Ti-CP (Grade 2) specimen (orientation: Longitudinal) deformed in
cyclic fatigue under a maximum stress of 366MPa with a fatigue life (Nf)
of 125,559 cycles:
(a) Overall morphology showing distinct regions of crack initiation and
overload.
(b) The transition region from crack growth to overload.
(c) Pockets of well defined striations in the region of stable crack growth.
(d) Microscopic voids of varying size and shape intermingled with
dimples on the overload surface.
(a)
100m
(b)
20m
(c)
5m
(d)
m
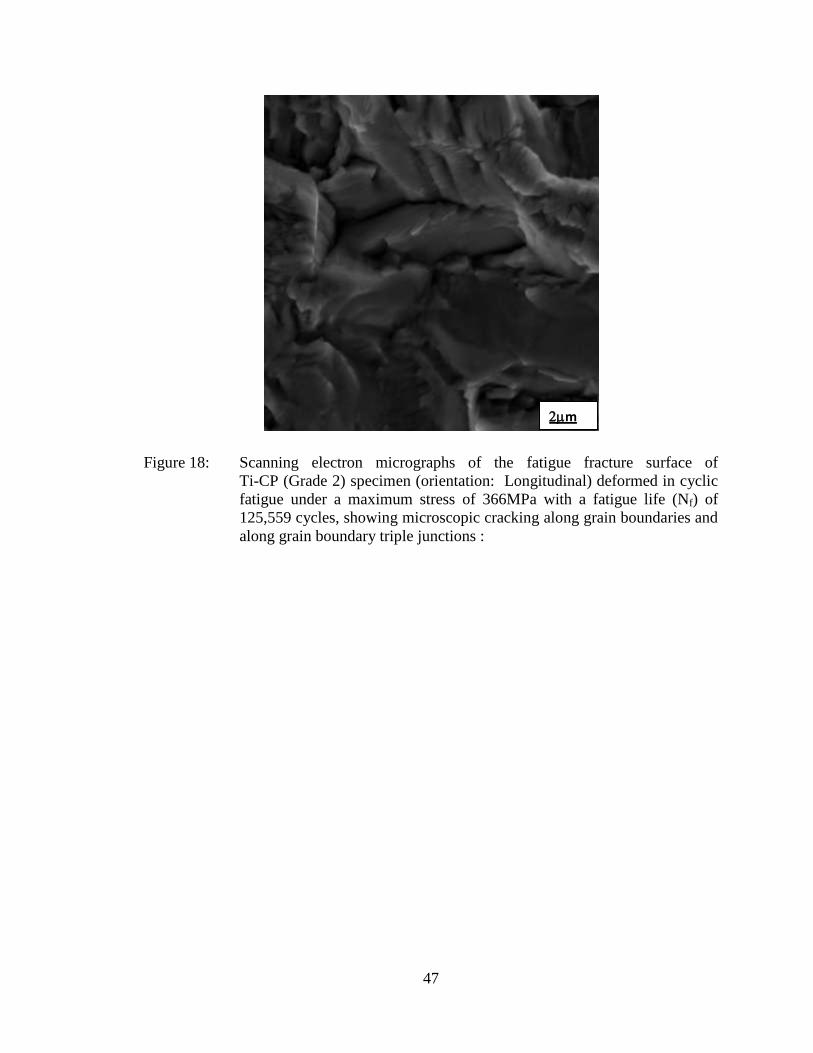
47
Figure 18: Scanning electron micrographs of the fatigue fracture surface of
Ti-CP (Grade 2) specimen (orientation: Longitudinal) deformed in cyclic
fatigue under a maximum stress of 366MPa with a fatigue life (Nf) of
125,559 cycles, showing microscopic cracking along grain boundaries and
along grain boundary triple junctions :
m

48
6.6.2 Cyclic Fatigue Fracture: Transverse Orientation
Compared to samples oriented in the longitudinal direction, the transverse (T)
oriented specimens of the Ti- CP (Grade 2) provided evidence of enhanced cyclic fatigue
resistance at the same value of maximum stress at a load ratio of 0.1. At a maximum
stress of 399 MPa and resultant fatigue life of 72,773 cycles, the intrinsic features
observed on the fracture surface are as shown in (Figure 19). The overall fracture
surface revealed distinct regions of crack initiation, stable crack growth followed by
overload (Figure 19a). High magnification observation in the region between stable
crack growth and overload revealed a healthy population of voids of varying size and
shape intermingled with dimples; features reminiscent of locally ductile failure
mechanisms (Figure 19b). The overload region revealed a population of voids of
varying size and dimples. During repeated cyclic deformation, the fine microscopic
voids grow and eventually coalesce to form a microscopic crack (Figure 19c).
The test specimen cyclically deformed at a lower maximum stress of 387 MPa
had a cyclic fatigue life of 234,351 cycles. The overall morphology of the fatigue
fracture surface is as shown in (Figure 20a). Scanning electron microscopy observations
of the region of stable crack growth (Figure 20b) at higher magnifications revealed a
gradual progress of fatigue damage through the microstructure in the radial direction
(Figure 20b). High magnification observation of the transgranular regions of the fatigue
fracture surface revealed pockets of well-defined striation like features (Figure 20c).
Microscopic voids of varying size and shape coupled with shallow dimples were found
covering the region of unstable crack growth (Figure 22d). The transgranular regions in
the domain of stable crack growth were populated with fine microscopic cracks (Figure

49
21), which tend to grow progressively during repeated cyclic deformation and eventually
coalesce to form macroscopic cracks having a random orientation and distribution
(Figure 22b). At the higher allowable magnifications of the electron microscope fine
and shallow striation-like features, reminiscent of localized micro-plastic deformation,
were found covering the transgranular region of the fatigue fracture surface (Figure 22c).

50
Figure 19: Scanning electron micrographs of the fatigue fracture surface of
Ti-CP (Grade 2) specimen (orientation: Transverse) deformed in cyclic
fatigue under a maximum stress of 399MPa with a fatigue life (Nf) of
72,773 cycles:
(a) Overall morphology showing the regions of crack initiation and early
crack growth and overload.
(b) Voids of varying size and shape and a healthy population of dimples.
(c) Growth and coalescence of the fine microscopic voids to form a
microscopic crack.
(a)
100m
(b)
20m
(c)
10m

51
Figure 20: Scanning electron micrographs of the fatigue fracture surface of
Ti-CP (Grade 2) specimen (orientation: Transverse) deformed in cyclic
fatigue under a maximum stress of 387MPa with a fatigue life (Nf) of
234,351 cycles:
(a) Overall morphology showing the two distinct regions of crack
initiation and early crack growth and overload.
(b) Progress of fatigue damage in the region of stable crack growth.
(c) High magnification of (b) showing well-defined striations in the region
of stable crack-growth.
(d) Microscopic voids of varying size and shape along with shallow
dimples in the region of unstable crack growth.
(a)
100m
(b)
20m
(c)
5m
(d)
m

52
Figure 21: Scanning electron micrographs of the fatigue fracture surface of
Ti-CP (Grade 2) specimen (orientation: Transverse) deformed in cyclic
fatigue under a maximum stress of 387MPa with a fatigue life (Nf) of
234,351 cycles, showing the transgranular region in the region of stable
crack growth with a population of fine microscopic cracks and well
defined striations.
m

53
Figure 22: Scanning electron micrographs of the fatigue fracture surface of
Ti-CP (Grade 2) specimen (orientation: Transverse) deformed in cyclic
fatigue under a maximum stress of 356MPa with a fatigue life (Nf) of
957,815 cycles:
(a) Overall morphology showing the two distinct regions of crack
initiation and early crack growth and overload.
(b) Progress of fatigue damage in the region of stable crack growth.
(c) High magnification of (b) showing well defined striations in the region
of stable growth.
(d) Microscopic voids of varying size and shape along with shallow
dimples in the region of unstable crack growth.
(a)
100m
(b)
20m
(c)
5m
(d)
m

54
Under the influence of a far-field applied stress, the fine microscopic voids present on the
fatigue fracture surface did appear to have undergone limited growth thereby providing
evidence for contributions from the presence of constraint-induced triaxiality on failure
of the Ti- CP (Grade 2) matrix. The limited growth of the fine microscopic voids under
the influence of an externally applied far-field stress coupled with lack of their
coalescence as the dominant fracture mode inhibits the fracture from being all-ductile.
This suggests that the plastic deformation properties of Ti- CP (Grade 2) in the as-
received fully annealed condition are visibly altered by the presence of “local”
constraints. Under the influence of repeated cyclic stressing, only a few of the fine
microscopic voids appeared to have undergone limited growth to facilitate their linkage
by coalescence. The halves of these voids are the shallow dimples that were observed
covering the transgranular and overload regions of the fatigue fracture surface. The lack
of formation of ductile dimples, as a dominant fracture mode, is attributed to the presence
of “local” constraints in plastic flow on the commercially pure titanium metal matrix and
not to the limited ductility of the metal.
The occurrence of microscopic cracking at and along the grain boundaries and
grain boundary triple junctions is a direct result of the strength of the titanium material in
this particular orientation. This is attributed to the presence of a large area fraction of
weakened high angle grain boundaries that are parallel to the longitudinal direction. The
preference for cracking along the grain boundaries results in a gradual loss of the
through-thickness constraint causing an essentially plane strain fracture process to be
divided into several plane stress fractures. The resultant beneficial influence of crack tip
plasticity and tensile ductility is offset or limited by the occurrence of constraints in

55
deformation. It is the intrinsic microstructural features coupled with constraints in matrix
deformation that promote the occurrence of failure through the grain boundaries.
Continued propagation of the microscopic cracks along with the macroscopic cracks,
through the commercially pure titanium microstructure, causes a progressive drop in
load-carrying capability of the test specimen and eventually culminating in failure.
Based on an observation of the fracture surfaces of the test samples that were
cyclically deformed over the range of stress amplitudes, the fracture plane of the
deformed and failed specimen was essentially perpendicular to the loading axis,
suggesting the importance of tensile stress in inducing and/or promoting fracture. Few of
the voids that were created by the presence of intrinsic microstructural features did not
grow extensively in the direction of the applied stress, which is generally the case for
ductile failure of metallic materials. The observed lack of extensive void growth suggests
that the overall strain that induces fracture is controlled by the conjoint influence of the
void nucleation strain, crack propagation strain, and linkage strain.

56
PART- A
CHAPTER VII
CONCLUSIONS [Ti-CP (GRADE 2)]
A study of the high-cycle fatigue and final fracture behavior of test specimens
machined from a commercially pure titanium (Grade 2) fully annealed plate stock for the
two different orientations, i.e. longitudinal and transverse, provides the following key
observations:
1. The as-received material in the fully annealed condition revealed the primary alpha
(α) grains to be intermingled with small pockets of the beta (β) grains. Observation at
the higher allowable magnifications of the optical microscope revealed very fine
alpha (α) phase lamellae located within the beta (β) grains.
2. A critical comparison of the elastic modulus of this material for the two orientations
reveals the modulus to be 8 % higher in the longitudinal direction as compared to the
transverse orientation.
3. The yield strength and tensile strength of this CP (Grade 2) titanium is higher for the
longitudinal orientation when compared to the transverse orientation. The ultimate
tensile strength of the CP titanium plate stock is marginally higher than the yield
strength indicating the tendency for strain hardening of the material beyond yield to
be low.
57
4. The Ti- CP (Grade 2) plate stock in both the longitudinal (L) and transverse (T)
orientations had adequate ductility, quantified in terms of elongation-to-failure (εf),
which makes it readily receptive and easily conducive for mechanical working
operations. Both elongation-to-failure and reduction-in-area were marginally higher
in the longitudinal orientation when compared to the transverse orientation.
5. The maximum stress (σmaximum) versus fatigue life (Nf) curve shown by this material is
quite different from those non-ferrous metals that exhibit a well defined endurance
limit. When compared at equal values of maximum stress at a load ratio of 0.1, the
fatigue life of the transverse specimen is noticeably greater than the longitudinal
counterpart. At equivalent values of maximum elastic strain, the transverse
specimens revealed noticeably improved fatigue life when compared one-on-one to
the longitudinal counterparts.
6. At a chosen load ratio of 0.1, the cyclic fatigue fracture surfaces revealed minimal
differences in the nature and volume fraction of the intrinsic features on the fracture
surface as a function of maximum stress and resultant cyclic fatigue life. The regions
of crack initiation and early microscopic crack growth and stable crack growth were
essentially flat and transgranular. The region of stable crack growth did reveal a
population of fine microscopic and macroscopic cracks coupled with “pockets” of
well-defined striations reminiscent of the occurrence of micro-plastic deformation at
the local level. The overload region was covered with a healthy population of
dimples of varying shape and fine microscopic voids of varying size reminiscent of
the locally operating failure mechanisms.

58
PART-B
CHAPTER I
LITERATURE REVIEW [Ti-6Al-4V]
In this chapter, a brief review of the published literature encompassing the
domains of processing, microstructure and mechanical behavior of the titanium alloy
Ti-6Al-4V is presented. Among the earliest titanium alloys developed in the United
States during the early 1940s, Ti‐6Al‐4V emerged to be the most popular alloy, which
was widely chosen and used for aerospace and other performance‐critical applications
spanning both the defense and civilian sectors. Owing to its excellent mechanical
properties like high specific strength (σ/ρ), stiffness, corrosion resistance, good erosion
resistance in environments spanning a range of aggressiveness, acceptable mechanical
properties at elevated temperature coupled with the ability to withstand and function at
elevated temperatures, this alloy of titanium has gradually found varied use in aerospace
and other space‐related applications. The main factors that facilitate the selection and use
of titanium alloys are the following:
(a) Weight reduction (substitute to steel or nickel‐ base alloys)
(b) Application temperature (substitute to aluminum, steel or nickel based alloys)
(c) Corrosion resistance (substitute to aluminum alloys or low alloyed steels)
(d) Galvanic compatibility with polymer matrix (substitute to aluminum alloys)
(e) Space limitation (substitute to Aluminum alloys).

59
The need to reduce costs while concurrently not compromising on the growing demand
for maximization of component performance has motivated manufacturers of end
components to adopt a life cycle approach to material selection for purposes of design.
Besides, the need for a healthy combination of good mechanical properties, other factors
like cost, machinability, castability and weldability are also important and must be
considered in the selection and use of a titanium alloy for a performance specific
application. The other areas where titanium alloys have been chosen for use include the
following [32]
1. To prevent the propagation of fatigue cracks in aircraft fuselages by placing thin
narrow rings around the aluminum fuselage.
2. Use of Ti‐3Al‐2.5V for hydraulic tubing in aircrafts has resulted in a weight
reduction of up to 40% compared to tubes that are made of steel.
3. Commercial purity titanium is used where high corrosion resistance is required
coupled with moderate strengths. Aircraft floors surrounding onboard kitchens
and toilets are the areas where emphasis and importance of the corrosive
environment comes into picture.
4. The piping system for de‐icing equipment is manufactured from unalloyed
titanium.
5. For other important parts, such as, aircraft landing gear and cockpit windows have
been constructed from forged titanium despite its huge cost.
Compared with the aircrafts manufactured for use in the civil commercial sector, the use
of alloys of titanium in military aircraft is noticeably higher [32]. The alloys of titanium
account for 30‐ 50% of the weight of a modern fighter jet. Most of this weight can be

60
found in the engine bay of an aircraft where temperatures are so high that aluminum and
its alloys cannot be used as a viable alternative. The key difference in the selection and
use of titanium alloys in commercial aircraft market compared to the military aircraft
market is that overall cost effectiveness is important for commercial aircraft, while high
performance requirements govern their selection and use for the military aircraft. The
noticeably high machining cost that is typical of titanium forgings has created a need for
an effective optimization of the forging processes.
Major improvements in gas turbine efficiency have been made possible due to the
introduction of titanium alloys for the key rotating parts. The need for more efficient use
of titanium alloys is restricted by the inefficiency of the extremely conservative nature of
fatigue life prediction for the alloys of titanium. Bache et al [33] have tried to examine
the early crack growth phase and the factors involved in the formation of quasi‐cleavage
facets. The parameters like stress redistribution, microstructure and grain‐refinement
were studied. It has been established through earlier research that manipulation of the
microstructural conditions in near α (alpha) and α/ β (alpha/beta) alloys can be used to
achieve the desired mechanical properties. While a fine grain size gives good ultimate
and yield strength and resistance to fatigue crack initiation, a coarse lamellar structure
provides improved toughness, fatigue crack propagation resistance and creep
compatibility. Bimodal structures can be produced, which give an optimized combination
of both fatigue and creep resistance. Traditional design procedures, which rely on ‘life to
first crack’ methodology have been in use and they rely primarily on the stress‐fatigue
life data obtained from S‐N curves combined with statistical data to establish a safe cyclic
life for a given set of operating stress conditions. Though these techniques have been

61
proven to be safe, they are conservative and thus inefficient. In spite of improved
processing technologies and reliable non-destructive evaluation methodologies, the
assumption of inherent flaws in the material for calculating the safe life was considered to
be conservative and inefficient. Studies are being conducted in order to create a „total
life‟ philosophy, which combines the best of these two design philosophies. But a
thorough understanding of fatigue crack initiation and crack growth behavior is essential
for such studies.
Crack initiation in the α / β (alpha/beta) titanium alloys was found to be
associated with formation of quasi‐cleavage facets, which are formed under both static
and cyclic loading conditions [33]. These facets are considered to be the result of
separation at the intense slip bands under the action of a tensile stress normal to the plane
of slip [33]. Stress‐redistribution is assumed to play a major role in this process. The
effects of grain size and mechanical anisotropy have clearly shown that processing
techniques controlling these features have a direct effect on the fatigue performance
through control of the formation of quasi‐cleavage facets [33]. Also, under certain
circumstances, the deliberate introduction of a strong global texture was found to
significantly improve the fatigue response of the materials chosen and studied in
comparison with critical in‐service stresses or strains. The mechanical performance is
governed by the basal texture and strong textures can be achieved by rolling [33]. In these
studies, a uniform strain rate (ε ) of 0.0016 % / min was applied to cylindrical specimens
of 6mm diameter and 10mm gage length. An increase in elastic modulus, yield stress and
ultimate tensile stress was often reported for the transverse orientation [33]. However,
strain control fatigue data at 20°C indicates a stronger fatigue performance for specimens

62
oriented in the longitudinal direction. Interestingly, under load control conditions, where
the maximum and minimum stress levels are fixed, the fatigue performance
characteristics are reversed with transverse orientations providing longer fatigue lives
[33].
Tokaji et al [34] have studied the fatigue properties of near –alpha titanium alloys,
which are considered as high temperature resistance alloys. Fatigue tests were performed
on Ti‐6Al‐4V at the elevated temperatures of 623K and 723K and the fatigue behavior of
the material was carefully examined and evaluated. Fatigue specimens having 6mm
width, 4mm thickness and 20 mm gauge length were machined in the longitudinal
direction. A shallow notch of depth of 0.5mm was introduced for the purpose of
observation of crack initiation and its subsequent growth through the alloy
microstructure. The mechanical properties of the material at room temperature were
determined to be:
(i). Proof stress = σ0.2 = 880Mpa,
(ii). Tensile strength = σB = 933MPa,
(iii). Elongation (Єf) of 14%, and
(iv). Reduction in area (RA) of 26%.
Cyclic fatigue test were performed using an electro‐hydraulic fatigue testing
apparatus at a frequency of 10Hz and a sinusoidal wave form at: (a) room temperature,
(b) 623K, and (c) 723K. The temperature of the specimen was controlled using an
induction heating system and temperature control was found to be well within 1% of the
desired temperature [34].

63
The researchers noted that the tensile strengths obtained using fatigue specimens
at 623K was 602 MPa and at 723K, it was measured to be 402MPa. Their results revealed
a significant reduction in strength with an increase in test temperature. The failure and
fracture surfaces were significantly different between samples deformed at room
temperature and the sample deformed at an elevated temperature. Based on the results
obtained from their exhaustive experiments, the researchers have concluded that an
increase in temperature led to a significant loss of fatigue strength [34]. A similar trend
was observed for fatigue strength in terms of fatigue ratio at the higher temperatures and
the fracture surfaces were found to be predominantly brittle for the sample cyclically
deformed at the higher temperatures than the sample cyclically deformed at ambient
temperature. Early crack initiations and rapid growth of the small fatigue cracks were
observed at the higher temperatures indicating that fatigue life is governed by the
formation, growth and eventual coalescence of small fatigue cracks [34].
Morrissey et al., [27] collected data on the high‐cycle fatigue behavior of titanium
alloys at low stress ratios and frequencies. However, for applications like turbine engines,
higher frequencies and stress values will be experienced by the chosen material. Due to
the inherent difficulties in achieving test conditions that can simulate high frequencies
and loads, limited data was collected and documented. Since titanium is a strain-rate
sensitive material their independent investigation aimed at studying the fatigue behavior
of Ti‐6Al‐4V at higher frequencies of the order of 1 kHz, which was closer to the actual
service conditions. The fatigue tests were performed at 70 Hz, 400 Hz and 1800 Hz at
three different stress ratios [R] of R =0.1, R= 0.5 and R =0.8. The Ti‐6Al‐4V alloy was
subjected to heat treatment. The material properties in the longitudinal direction were
64
determined to be σy = 980 MPa and σUTS = 1030 MPa. Two different testing systems
were utilized in their study with the 70 Hz and 400 Hz tests performed on a custom built
high frequency testing apparatus consisting of a pneumatic actuator for applying the static
load and an electromagnetic shaker for the superimposed high frequency load. The tests
at 1800Hz were performed using a prototype design for applying loads at very high
frequencies. For the tests at 70 Hz and 400 Hz, the researchers found the scatter in test
data to be little (less than 5%) [27]. However, there was an appreciable amount of scatter
for the tests at the highest frequency, i.e., 1800Hz. Further, they observed a significant
frequency effect for the Ti‐6Al‐4V at the lower stress ratios. As the frequency increased,
the stress required for failure of the sample following 107 cycles was considerably higher
[27]. Many materials to include Ti‐6Al‐4V show a strain rate dependence of plastic flow
during a constant strain rate test. Morrissey et al [27] determined the effect to be smaller
for the stress ratios used in their testing. However, at the higher rates, the effect was
magnified. A relatively small increase in the maximum stress was observed when the
frequency was increased from 70 Hz to 400 Hz and a larger increase in the maximum
stress when the frequency was increased to 1800Hz. As the frequency of loading was
increased, the mobile dislocations had little time to overcome the obstacles through
thermal activation. Consequently there is an apparent reduction in the accumulated plastic
strain. They observed that this to be possible only at the higher stress ratios where plastic
strain can occur. Since fatigue is a phenomenon induced by plasticity, they were able to
convincingly rationalize the observed increase in fatigue strength at the higher
frequencies [27].

65
Filip et al., [35] attempted to study the effect of heat treatment on microstructural
properties of two titanium alloys and its intrinsic influence on strength. The alloys of
titanium studied were (i) Ti‐6Al‐4V, and (ii) Ti‐6Al‐2Mo‐2Cr. They observed the heat
treatment to result in a wide variation in properties of the two titanium alloys. The
properties like yield stress, tensile stress and ductility were noticeably improved through
a bimodal microstructure, whereas the alloy having a lamellar microstructure was
characterized to have a combination of high fracture toughness and high fatigue crack
propagation resistance. For example, with an increase in the cooling rate and content of
β‐stabilizing elements, the thickness and length of the α‐phase decreased. For a cooling
rate in the range of 1.2 K/s to 40 K/s, the microstructure comprised of: (i) stable α and β
phases, and (ii) martensitic phases α‟ (α”) [35]. However, at a low cooling rate of 1.2
Ks-1
a stable lamellar microstructure was observed.
The yield stress of the specimen increased at a constant cooling rate and a
probable cause for the observed behavior was proposed to be due to refinement of the
lamellar microstructure. A reduction in slip length and a decrease in ductility arising from
an inter‐granular fracture mode resulted in intermediate rates of cooling causing the
largest tensile elongation. Regardless of the observed difference in fracture toughness
values, it was observed that all of the specimens revealed an identical fracture surface,
which indicated a fracture mechanism characterized by rapid and unstable crack
propagation [35].
Very few studies have documented the role of foreign‐object damage (FOD) in
the initiation and early growth of small surface fatigue cracks under conditions of high

66
cycle fatigue (HCF). Peters et al., [36] studied the effect of microstructural characteristics
on fatigue crack initiation and fatigue crack growth by comparing a fine grain bimodal
microstructure with a coarse grain beta (β) annealed lamellar microstructure. They
subjected the Ti‐6Al‐4V alloy to carefully controlled thermo‐mechanical treatment to
obtain the required microstructures. In their study, they determined the uniaxial tensile
properties at an initial stress rate of 8x10⁻⁴
s-1
. The lamellar microstructure revealed
higher yield strength (975MPa) compared to the bimodal counterpart (915MPa). In their
research study, the foreign‐object‐damage (FOD) was simulated by high velocity impact
(200‐ 300 m/s) of steel spheres onto the specimen surface. Subsequent to the impact, the
specimens were cycled using a sinusoidal waveform at load ratios of R=0.1 and R=0.5. A
significant reduction in fatigue strength was observed for both microstructures: (i)
lamellar, and (ii) bimodal. The primary cause was determined to be the premature
initiation of fatigue cracks due to stress concentration at the zones of foreign object
damage (FOD) [36]. Also, they observed and recorded an increase in impact velocity to
result in an increase in damage for both microstructures with the FOD initiated
microscopic cracks providing preferred nucleation sites for growth of the fatigue crack.
However, low velocity impacts (< 250 m/s) revealed no microscopic cracking indicating
that low velocity indentations do not provide a realistic simulation of foreign object
damage. A noticeable reduction in high cycle fatigue strength was attributed to the
creation of preferred sites for the premature initiation of fatigue cracks in the zones of
FOD indentation.

67
PART-B
CHAPTER II
MATERIAL [Ti-6Al-4V]
The second material chosen for this study, was provided by Allegheny
Technologies ATI Wah Chang (Albany, OR) in the form of six pieces of Ti‐6Al‐4V to
the following dimensions:
• Plate 0.25″ TK X 12.00″ wide X 36.00″ Long six pieces
The Ti-6Al-4V alloy is receptive to heat treatment and can be solution heat treated and
annealed to achieve the desired strength and properties. The Ti-6Al-4V alloy was
provided by the manufacturer in the fully-annealed condition. The material supplied by
ATI Wah Chang is a commercial titanium alloy and therefore the chemical composition
is proprietary to the supplier. From published literature for similar titanium alloys, the
chemical composition is expected to be as shown in Table 5.
Table 5: Nominal chemical composition (in weight percent) of the titanium alloy
Ti-6Al-4V
Material Ti Al N V C Fe H O
Ti-6Al-4V 90.0 6.0 0.05 4.0 0.1 0.4 0.02 0.20
68
PART-B
CHAPTER III
TEST SAMPLE PREPARATION [Ti-6Al-4V]
The test samples used in this study were prepared as per the specifications
prescribed in the standard ASTM E-8. The samples were precision machined from the as-
provided annealed plate stock both in transverse (T) and longitudinal (L) orientations. In
case of the longitudinal orientation, the specimens were machined such that the major
stress axis was parallel to the rolling direction, whereas, in case of the transverse
orientation, the specimens were machined such that the major stress axis is perpendicular
to the rolling direction of the alloy plates. The test samples used in this study were
identical to the Ti-CP (Grade 2) specimens. A schematic of the test specimen used for
tensile and high-cycle fatigue tests is given in the Figure 2.

69
PART-B
CHAPTER IV
EXPERIMENTAL PROCEDURES [Ti-6Al-4V]
4.1 Initial microstructure characterization
An initial characterization of the microstructure of the as-provided material was
done using a low magnification optical microscope. Samples of desired size were cut
from the as-received stock of the Ti-6Al-4V and mounted in bakelite. The mounted
samples were then wet ground on progressively finer grades of silicon carbide
impregnated emery paper using copious amounts of water both as a lubricant and as a
coolant. Subsequently, the ground samples were mechanically polished using five-micron
diamond solution. Fine polishing to a perfect mirror-like finish of the surface of the
Ti-6Al-4V was achieved using one-micron diamond solution as the lubricant. The
polished samples were subsequently etched using a reagent that is a solution mixture of
5-ml of nitric acid (HNO3), 10 ml of hydrofluoric acid (HF) and 85 ml of water (H2O).
The polished and etched surface of the samples of Ti-6Al-4V was observed under an
optical microscope and photographed using bright field illumination technique.
4.2 Hardness testing
Hardness of a material is the mechanical property defined as the resistance offered
by the material to indentation i.e. permanent deformation and cracking [22].

70
The hardness was measured using a Vickers (Hv) micro hardness test machine. The test
itself is simple and a nondestructive method that is easy to perform and widely used for
the purpose of determining the mechanical properties of monolithic metals and their alloy
counterparts.
The macro-hardness measurements (RC) were made on a Rockwell hardness
machine using an indentation load of 140 Kgf, a minor load of 10 Kgf, 120 degree
diamond cone, a dwell time of 10 seconds and the value read on the „C‟ scale. The
macro- hardness tests were also done on the polished surface of the titanium alloy test
specimen. Two samples of Ti-6Al-4V were examined for micro-hardness and macro-
hardness measurements. The results of the micro-hardness and macro-hardness tests are
summarized in Table 6 and Table 7.

71
Table 6: A compilation of macrohardness measurements made on the Ti-6Al-4V
Table 7: A compilation of macrohardness measurements made on the Ti-6Al-4V
Alloy
Trial 1 Trial 2 Trial 3 Trial 4 Trial 5 Average
Sample 2A
Ti-6Al-4V
Vickers
hardness 340.41 325.20 332.72 334.61 340.46 334.68
Rc 25 27 - 30 25 26.75
Sample 2B
Ti-6Al-4V
Vickers
hardness 330.88 342.44 332.74 327.11 338.51 334.36
Rc 28 25 25 27 28 26.6
Alloy
Trial 1 Trial 2 Trial 3 Trial 4 Trial 5 Average
Sample 2A
Ti-6Al-4V
Vickers
hardness 286 286 302 279 286 287.8
Rc 28 28 30 27 28 28.2
Sample 2B
Ti-6Al-4V
Vickers
hardness 286 294 310 279 286 291
Rc 28 29 31 27 28 28.6

72
4.3 Mechanical testing
Tensile and high cycle fatigue tests were conducted on the specimens to
systematically study the tensile deformation, cyclic fatigue and final fracture behavior for
the Ti-6Al-4V alloy. The details of the tests are given in the following sections.
4.3.1 Tensile tests
Uniaxial tensile tests were performed on a fully-automated, closed-loop servo-
hydraulic mechanical test machine [INSTRON-8500 Plus] using a 100 kN load cell. The
tests were conducted at room temperature (300 K) and in the laboratory air (Relative
Humidity of 55 pct) environment. The test specimens were deformed at a constant strain
rate of 0.0001/sec. An axial 12.5-mm gage length clip-on type extensometer was
attached to the test specimen at the gage section using rubber bands. The stress and strain
measurements, parallel to the load line, and the resultant mechanical properties, such as,
stiffness, strength (yield strength and ultimate tensile strength), failure stress and ductility
(strain-to-failure) was provided as a computer output by the control unit of the test
machine. The average values of yield strength obtained from the tensile tests were used
for calculating the following data required for the high-cycle fatigue tests.
(a) Yield load based on the yield stress obtained from the tensile tests.
(b) Maximum stresses, as percentages of the yield stress of the alloy for purpose of
testing the specimens under conditions of stress amplitude-controlled fatigue.

73
4.3.2 High cycle fatigue tests
The stress-amplitude controlled high cycle fatigue tests were performed using a
sinusoidal waveform at a stress ratio [R = Minimum Stress (σmin) / Maximum Stress
(σmax)] of 0.1 .The cyclic loading of the test specimen was conducted at a frequency of
5Hz. At a given stress ratio [R = σminimum / σmaximum], the fatigue tests were conducted
over a range of stress amplitudes to establish the variation of maximum stress (σmaximum)
with cyclic fatigue life (Nf).
The data collected from the high-cycle fatigue test is used to establish the
following relationships.
1. Variation of maximum stress (σmax) with fatigue life (Nf).
2. Variation of the ratio of maximum stress/yield stress (σmax/σy) with fatigue life (Nf).
3. Variation of maximum elastic strain (σmax/E) with fatigue life (Nf).
4. Variation of the ratio of maximum stress/ultimate tensile stress (σmax/σUTS) with
fatigue life.
The fatigue test data for cylindrical samples of the Ti – 6Al-4V (at R = 0.1) are
summarized in Appendix B.
4.4 Failure-damage analysis
The fracture surfaces of the deformed and failed tensile specimens of Ti-6Al-4V
were comprehensively examined in a scanning electron microscope (SEM) to determine
the macroscopic fracture mode and to concurrently characterize the fine scale topography
of the tensile fracture surface for the purpose of establishing microscopic mechanisms
governing fracture. The distinction between the macroscopic mode and microscopic

74
fracture mechanisms is based entirely on the magnification level at which the
observations are made. The macroscopic mode refers to the overall nature of failure
while the microscopic mechanisms relate to the local failure processes, such as: (i)
microscopic void formation, (ii) microscopic void growth and coalescence, and (iii)
nature, intensity and severity of the fine microscopic and macroscopic cracks dispersed
through the fracture surface. The samples for observation in the SEM were obtained
from the failed tensile specimens by sectioning parallel to the fracture surface.

75
PART-B
CHAPTER V
RESULTS AND DISCUSSION [Ti-6Al-4V]
5.1 Initial Microstructure
The microstructure of an alloy is an important factor that determines its
mechanical properties to include tensile properties, fracture toughness, fatigue resistance
and resultant fracture behavior. The optical microstructure of the Ti-6Al-4V alloy is
shown in Figure 23 at three different magnifications. These figures reveal that the as-
received, undeformed microstructure of the Ti-6Al-4V alloy to be slightly different when
compared to Ti -CP (Grade2). The difference is primarily in the volume fraction,
morphology, size, and distribution of the intrinsic micro-constituents in the
microstructure.
At equivalent high magnification (500 x), the intrinsic microstructural
constituents of the Ti-6Al-4V, is shown in Figure 23b bringing out clearly the size,
morphology, volume fraction and distribution of the alpha (α) and beta (β) phases.
Observations of the Ti-6Al-4V alloy over a range of magnifications spanning very low to
high magnification revealed a duplex microstructure consisting of the near equiaxed
alpha (α) and transformed beta (β) phases.

76
The primary near equiaxed shaped alpha (α) grains (light in color) was well distributed in
a lamellar matrix with transformed beta (dark in color) (Figure 23c). The size of both
the alpha grains and the transformed β grains range from 10 to 15 microns. The presence
of trace amounts of aluminum and oxygen in the Ti-6Al-4V alloy contributes to
stabilizing and strengthening the alpha (α) phase, which is overall beneficial for
enhancing hardenability, increasing strength, and improving the response kinetics of the
alloy to heat treatment [26].
5.2 Hardness
Hardness is defined as the resistance offered by a material to permanent
indentation. A hardness test is the most economical, reliable and efficient method for
determining the mechanical properties of a metal. The presence of intrinsic variations in
the microstructural features i.e., the alpha and beta phases, does cause a variation in the
properties measured across a cross-section of the alloy sample.
5.2.1 Microhardness measurement
The Vickers microhardness measurements were made from edge-to-edge across
the center of a sample mounted in Bakelite. Multiple measurements were made in order
to compensate for the variation of hardness values across the sample cross-section. The
cumulative effect of strengthening observed in the material can be attributed to the
presence of the intrinsic microstructural features like the alpha and beta phases and also a
net weakening effect, due to the presence of processing-related defects like (i) fine
microscopic voids and pores, and (ii) fine microscopic cracks that are intercepted by the
pyramidal indenter resulting in a decreased value for microhardness of the specimens [23,

77
24]. It is further observed that the hardness values when plotted reveal marginal spatial
variability with an average value of 330 kg/mm2 for the Ti-6Al-4V alloy. We conclude
from a comparative study of the hardness values of Ti-6Al-4V and Ti-CP (Grade 2), that
the commercially produced and annealed alloy is noticeably harder than commercially
pure (Grade 2) titanium.

78
Figure 23: Optical micrographs showing the key micro-constituents, their
morphology and distribution, in the Ti-6Al-4V alloy at three different
magnifications.
20 µm 100 µm
(b) (a)
50 µm
(c)

79
Figure 24: A profile showing the variation of microhardness values across the length
of fully annealed Ti-6Al-4V alloy.
5.2.2 Macrohardness measurement
The macrohardness values (Table 6) across the length of the specimen were
measured on the Rockwell C scale, with an average value of 290 kg/mm2 for the Ti-6Al-
4V alloy. However, the micro-hardness value of 330 kg/mm2
is significantly higher than
the macro-hardness value of 290 kg/mm2
as shown in Figure 26. The observed lower
macro-hardness for the Ti-6Al-4V alloy when compared to its micro-hardness is
attributed to the presence of the processing-related defects, such as (i) fine microscopic
voids and pores, and (ii) fine microscopic cracks.

80
Figure 25: A profile showing the variation of macrohardness values across the length
of fully annealed Ti-6Al-4V.
Figure 26: Bar graph depicting the average microhardness and macrohardness values
of Ti-6Al-4V alloy.
0
100
200
300
400
Microhardness
Macrohardness
Microhardness Macrohardness
Ti - 6Al-4V
Vic
ke
r's h
ard
ne
ss H
(k
g/m
m2)

81
5.3 Tensile Properties
The room temperature tensile properties of the Ti-6Al-4V alloy are summarized
in Table 8. The results reported are the mean values based on duplicate tests. The elastic
modulus, yield strength, ultimate tensile strength, elongation to failure and strength at
failure (fracture) were provided as an output of the PC-based data acquisition system.
The yield strength was determined by identifying the stress at a point on the engineering
stress versus engineering strain curve where a straight line drawn parallel to the elastic
portion of the stress versus strain curve at 0.2% offset intersects the curve. The ductility
is reported as elongation-to-failure over a gage length of 12.7 mm. This elongation was
measured using a clip-on extensometer that was attached to the gage section of the test
specimen [24].
Table 8: Summary of the room temperature tensile properties of Ti- 6Al-4V
[Results are mean values based on duplicate tests]
Material Oreintation
Elastic
Modulus
Yield
Strength UTS
Elongation
GL=0.5"
(%)
Reduction
in Area
(%)
Tensile
Ductility
ln(Ao/Af)
(%) msi GPa ksi MPa ksi MPa
Ti-6Al-4V Longitudinal 18 126 137 948 154 1060 7.8 23.8 27
Transverse 20 137 152 1047 171 1181 11.5 21.7 25
ASM
Handbook - 17 114
115-
160
800-
1100
130-
180
900-
1200 - - -

82
The representative stress versus strain curves for the Ti-6Al-4V alloy for both the
longitudinal (L) and transverse (T) orientations are shown in Figure 27 and Figure 28.
The modulus of elasticity of the Ti-6Al-4V alloy was determined to be 126 GPa in the
longitudinal orientation and 137 GPa in the transverse orientation. The yield strength of
the alloy in the annealed condition is determined to be 948MPa (137ksi) in the
longitudinal orientation and 1047 MPa (152 ksi) in the transverse orientation. The
ultimate tensile strength of the alloy is 1060MPa (154 ksi) in the longitudinal orientation
and 1181 MPa (171 ksi) in the transverse orientation. The ultimate tensile strength of the
Ti-6Al-4V alloy is marginally higher than the yield strength, i.e., about 10 percent,
indicating the work hardening rate beyond yield to be low. The elongation- to-failure (εf)
of the alloy is 7.8% in the longitudinal orientation and 11.5% in the transverse
orientation. The reduction-in-area of the alloy was 24% in the longitudinal orientation
and 22% in the transverse orientation and accords well with the annealed condition of the
alloy microstructure. The yield strength and tensile strength values of the alloy conform
well with the values obtained and reported by the manufacturer (ATI Wah Chang) and
recorded in ASM Metals Handbook [37]. Variation of stress with plastic strain, as shown
in Figure 27 reveals the Ti-6Al-4V to be marginally harder in the transverse orientation
when compared to the longitudinal orientation. The strain hardening exponent (n) of the
alloy is 0.095 for the transverse orientation and 0.085 for the longitudinal orientation as
shown in Figure 28.

83
Figure 27: Influence of test specimen orientation on engineering stress versus
engineering strain curve of the Ti-6Al-4V alloy.
Figure 28: The monotonic stress versus strain curve for the Ti-6Al-4V alloy.
0 5 10 15 200
200
400
600
800
1000
1200
ENGINEERING STRAIN (%)
EN
GIN
EE
RIN
G S
TR
ES
S(M
pa)
Ti-6Al-4V
L- LONGITUDINAL
T- TRANSVERSE
T
L
TRUE STRAIN(true
)
1
TR
UE
ST
RE
SS
(
tru
e)
1000
LONGITUDINAL
TRANSVERSE
Ti-6Al-4V
0.8600
800
2000
n=0.095
n=0.085 K= 895 Mpa
K= 1002 Mpa
0.9 0.95

84
5.4 Tensile Fracture Behavior
An exhaustive examination of the tensile fracture surfaces of both the longitudinal
and transverse specimens in a scanning electron microscope (SEM) revealed the specific
role played by intrinsic microstructural features and microstructural effects on strength
and ductility properties of the specific titanium material. Representative fractographs of
the tensile fracture surface of the Ti-6Al-4V alloy for the longitudinal specimen are
shown in Figure 29 and for the transverse orientation in Figure 30.
Due to the occurrence and presence of fairly high localized stress intensities at
selected points through the microstructure, the corresponding strain is conducive for:
(i) the nucleation and early growth of the microscopic voids, and (ii) the eventual
coalescence of the microscopic and macroscopic voids to occur at low to moderate stress
levels [25, 26]. This result in the early initiation and presence of very fine microscopic
cracks distributed through the fracture surface [16]. During far-field loading, the fine
microscopic voids tend to grow, or increase in size, and eventually coalesce with each
other. The halves of these voids are the shallow dimples visible on the fracture surface.
Coalescence of the fine microscopic cracks results in a macroscopic crack that is favored
to propagate in the direction of the major stress axis. The irreversible plastic deformation
that is occurring at the “local” level is responsible for aiding the growth of the cracks
through the microstructure. The fine microscopic and macroscopic cracks tend to
propagate in the direction of the major stress axis, suggesting the important role played
by normal stress in promoting tensile deformation. Since a gradual extension of both the
microscopic and macroscopic cracks under quasi-static loading essentially occurs at the
high local stress intensities comparable with the fracture toughness of the material, the
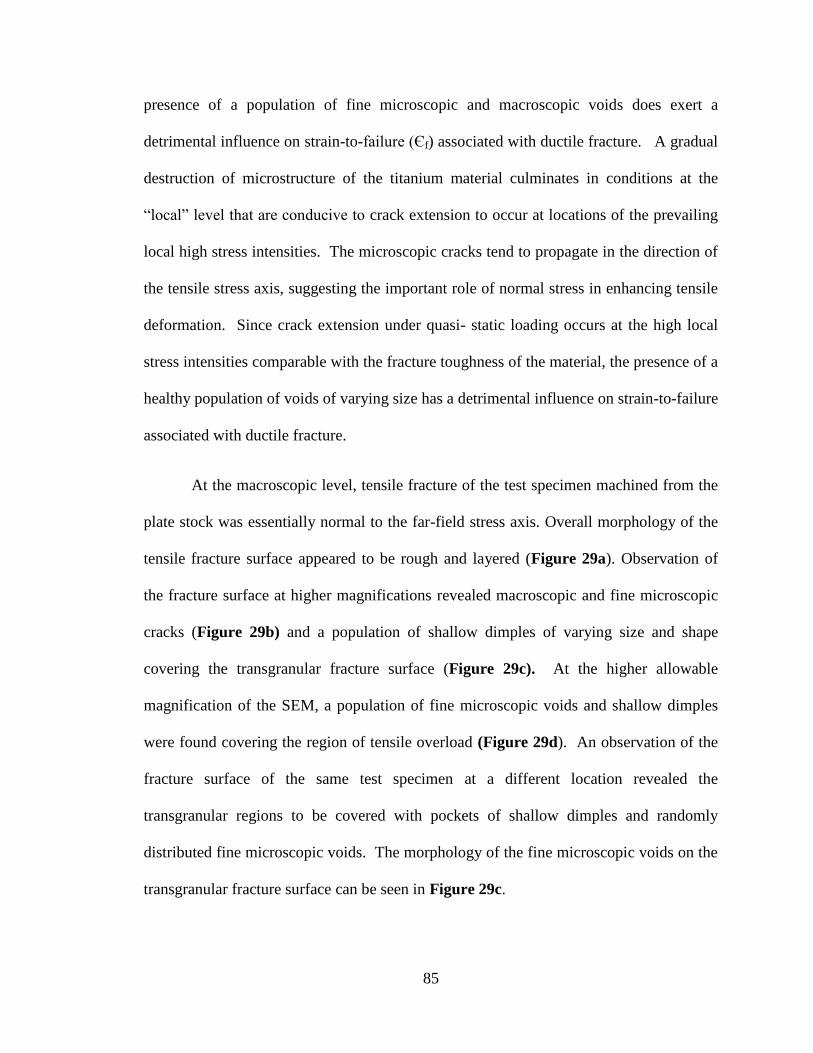
85
presence of a population of fine microscopic and macroscopic voids does exert a
detrimental influence on strain-to-failure (Єf) associated with ductile fracture. A gradual
destruction of microstructure of the titanium material culminates in conditions at the
“local” level that are conducive to crack extension to occur at locations of the prevailing
local high stress intensities. The microscopic cracks tend to propagate in the direction of
the tensile stress axis, suggesting the important role of normal stress in enhancing tensile
deformation. Since crack extension under quasi- static loading occurs at the high local
stress intensities comparable with the fracture toughness of the material, the presence of a
healthy population of voids of varying size has a detrimental influence on strain-to-failure
associated with ductile fracture.
At the macroscopic level, tensile fracture of the test specimen machined from the
plate stock was essentially normal to the far-field stress axis. Overall morphology of the
tensile fracture surface appeared to be rough and layered (Figure 29a). Observation of
the fracture surface at higher magnifications revealed macroscopic and fine microscopic
cracks (Figure 29b) and a population of shallow dimples of varying size and shape
covering the transgranular fracture surface (Figure 29c). At the higher allowable
magnification of the SEM, a population of fine microscopic voids and shallow dimples
were found covering the region of tensile overload (Figure 29d). An observation of the
fracture surface of the same test specimen at a different location revealed the
transgranular regions to be covered with pockets of shallow dimples and randomly
distributed fine microscopic voids. The morphology of the fine microscopic voids on the
transgranular fracture surface can be seen in Figure 29c.

86
The fractographs of the test specimen machined from the transverse orientation of the as-
provided plate stock are shown in Figure 30. The failure was typical cup-and-cone type.
The overall morphology of the cone surface was rough (Figure 30a). An array of fine
microscopic cracks were surrounded by a population of dimples and voids of varying
size, features reminiscent of both locally brittle and locally ductile failure mechanisms
(Figure 30b). At regular intervals, deep-seated macroscopic cracks were evident on the
fracture surface (Figure 30c). The macroscopic cracks result as a consequence of the
growth and eventual coalescence of the fine microscopic voids. The overload region
revealed a population of dimples of varying size and shape, and fine microscopic voids
(Figure 30d). Overall, the presence of a sizeable population of fine microscopic voids
and macroscopic voids coupled with isolated microscopic cracks contributes to lowering
the actual strain-to-failure associated with ductile fracture. Isolated cracks in deep
pockets, surrounded by a population of shallow dimples of varying size and fine
microscopic voids was observed at higher magnification (Figure 30b). Observation of
the transgranular surface region revealed the fine microscopic cracks to be surrounded by
a population of microscopic voids and dimples reminiscent of locally brittle and ductile
failure mechanisms. The dimples observed were of varying size but shallow in depth.

87
Figure 29: Scanning electron micrographs of the tensile fracture surface of Ti-6Al-4V
specimen (orientation: Longitudinal) deformed in tension, showing:
(a) Overall morphology of tensile fracture surface
(b) High magnification of (a) showing macroscopic crack in the
transgranular region
(c) A microscopic crack surrounded by population of shallow dimples
(d) The overload region showing coalescence of microscopic voids to
form a microscopic crack and surrounded by shallow dimples
(a)
200m
(b)
10m
(c)
5m
(d)
2m

88
Figure 30: Scanning electron micrographs of the tensile fracture surface of Ti-6Al-4V
specimen (orientation: Transverse) deformed in tension, showing:
(a) Overall cup and cone morphology of tensile fracture surface
(b) High magnification of (a) showing microscopic crack, population of
voids and dimples in the transgranular region
(c) High magnification of (b) showing the morphology and distribution of
microscopic cracks, voids and dimples on the transgranular fracture
surface
(d) The overload region showing coalescence of microscopic voids to
form a microscopic crack and surrounded by shallow dimples.
(a)
200m
(b)
20m
(c)
5m
(d)
1m

89
5.5. High cycle fatigue resistance
The cyclic degradation of the strength of a material through the accumulation of
damage is known as fatigue. The fatigue life (Nf) of a structure or a component is
defined as the sum of the number of cycles to crack initiation (Ni) plus the number of
cycles of crack propagation (Np), which eventually leads to failure by fracture. A
detailed study of the cyclic fatigue response of the Ti-6Al-4V is important for its
selection and subsequent use in a wide array of performance-critical applications. An
understanding of failure and damage mechanisms governing failure is made difficult by
the underlying intrinsic microstructural features. It has been established by previous
research that the fatigue properties of the titanium alloys are governed by the cumulative
influence of: (a) surface defects, (b) crystallographic texture, and (c) microstructural
characteristics to include the size and morphology of the beta grains, colonies of alpha
platelets [38]. Alloy microstructures that produce a low resistance to crack initiation,
even at low values of applied stress, will usually yield the best endurance during high
cycle fatigue testing and even tensile testing [21]. The cyclic fatigue test is the most
widely used technique to establish the endurance limit of a chosen metal by essentially
determining the variation of maximum stress (σmaximum) or stress amplitude (Δσ/2) with
fatigue life as quantified by the number of cycles to failure (Nf). Metals, alloys and other
materials based on metal matrices, which are used at stress levels below the endurance
limit may be cycled indefinitely.
The high-cycle fatigue test is the most widely used technique to establish the
endurance limit of a metal by essentially determining the variation of maximum stress
(σmaximum), or stress amplitude (Δσ/2), with fatigue life (Nf). For small, highly stressed

90
components, fatigue life is often controlled by cyclic plasticity and relatively rapid
growth of the fine microscopic cracks through the microstructure of the titanium alloy.
For larger components that operate at low stress levels, the fatigue life is controlled by
microscopic crack formation and their subsequent growth through the microstructure.
The kinetics of crack nucleation in this Ti-6Al-4V alloy is governed by mutually
interactive influences of the following: (i) the rate of cooling, (ii) volume fraction and
size of the alpha phase, and (iii) local stress concentration effects or surface residual
stress [9-12]
At the load ratio studied (R = 0.1), the variation of maximum stress (σmaximum)
with cyclic fatigue life (Nf) reveals increasing fatigue life with a decrease in stress
amplitude. This trend is typical of most non-ferrous metals and their composite
counterparts [2-3]. At the higher levels of equivalent maximum stress, the results indicate
the fatigue life to be more or less identical in both the transverse and longitudinal
orientations.

91
Figure 31: Variation of maximum stress (σmax) with fatigue life (Nf) for Ti- 6Al-4V
alloy at a stress ratio of (R =0.1).
Figure 32: Variation of the ratio of maximum stress/yield stress (σmax/ σy) with
fatigue life (Nf) for Ti- 6Al-4V alloy at a stress ratio of (R =0.1)

92
Figure 33: Variation of maximum elastic strain (σmax/E) with fatigue life (Nf) for Ti-
6Al-4V alloy at a stress ratio of (R =0.1).
Figure 34: Variation of the ratio of maximum stress/ultimate tensile stress (σmax/σUTS)
with fatigue life (Nf) for Ti- 6Al-4V alloy at a stress ratio of (R =0.1)

93
5.6 Cyclic Fatigue Fracture
The fracture surfaces of the high-cycle fatigue test specimens were exhaustively
studied under a JEOL scanning electron microscope (SEM) at the following levels of
magnification:
(a) In order to identify the site of microscopic crack initiation, the region of stable
crack growth and to study the kinetics of early crack growth, a low magnification
was used.
(b) Gradually increasing levels of magnification were used for studying the nature of
damage initiation, crack propagation, cyclic fracture behavior and overload region
morphology.
For the Ti-6Al-4V alloy, marginal difference was observed in the topographies at various
levels of maximum stress and corresponding fatigue life for both the longitudinal and
transverse specimens. On a microscopic scale, the nature and morphology of the fracture
surfaces did not vary extensively with maximum stress and fatigue life. The
representative fractographs of the fatigue fracture surfaces of Ti-6Al-4V at different
values of maximum stress and corresponding fatigue life are shown in Figure 35 to
Figure 43
It is well known that high-cycle fatigue life, in general is dependent on the
initiation and propagation of the fatigue cracks. Much of the fatigue life is spent in
initiation of these fatigue cracks [10]. Microstructural features whether formed during
initial heat treatments or during subsequent fabrication of the welded structural members,
can change the high-cycle fatigue characteristics of the material. Different welding

94
methods can cause a significant variations in the microstructural features like the
formation and presence of fine microscopic pores that act as crack initiation sites
[10].The microstructure of the as-provided Ti-6Al-4V alloy used in this study is
characterized as a duplex microstructure consisting of the near equiaxed alpha (α) and
transformed beta (β) phases. Previous researchers have established fatigue cracking in the
Ti-6Al-4V alloy to initiate along grain boundaries. During continued cyclic deformation
of the specimens, a gradual accumulation of fracture features across the transgranular
surface leads to the formation of localized failure sites with resultant accumulation of
strain at the microscopic levels. When the strain at these localized stress concentration
exceeds a critical value, microscopic crack initiation occurs, which is fuelled by a
continued application of stress leading to a progressive accumulation of micro-plastic
deformations at the „local‟ level [23]. Continuous cyclic deformation coupled with the
gradual crack propagation resulting from coalescence of the fine microscopic voids leads
to a macroscopic crack and a resultant drop in the load-carrying capability of the test
specimen eventually culminating in failure.
5.6.1 Cyclic Fatigue Fracture: Longitudinal orientation
At a maximum stress of 829MPa, the longitudinal specimen had a fatigue life of
255,334 cycles. Low magnification images of scanning electron microscopy revealed the
existence of a confined region of crack initiation and propagation. Early microscopic
crack growth can be observed to be radially extending from a point of crack initiation
(Figure 35b). On carefully studying these regions at high magnifications, we observe this
region to be essentially featureless, containing very fine microscopic cracks, which
exhibit a random distribution across this region (Figure 35c). For almost all the samples

95
at varying maximum stress levels, the overload region revealed the presence of shallow
dimples indicative of a locally ductile failure mechanism (Figure 35d and Figure 36d).
For a test specimen cyclically deformed at a maximum stress of 811MPa with a
resultant fatigue life of 674,128 cycles, distinctive crack initiation and overload regions
were observed. (Figure 36a). In the terminal stages of stable crack propagation,
formation of a transition zone between stable and unstable crack growth occurs (Figure
36b). High magnification observations of the stable and unstable crack growth regions
reveal a healthy population of macroscopic and fine microscopic voids (Figure 36c),
which, during a repetitive cyclic loading can lead to the phenomenon of void coalescence
eventually resulting in the formation of fine microscopic cracks and shallow dimples
(Figure 36d). The transgranular region (Figure 37b), when observed at high
magnifications showed a healthy distribution of pockets of fine shallow striations (Figure
37c) in the region of early crack initiation and propagation and well defined striations
(Figure 38) in the region of stable crack growth indicative of localized micro-plastic
deformation mechanism. Thus, for the longitudinal orientation, the microscopic fracture
characteristics observed across a range of maximum stress values are essentially similar.
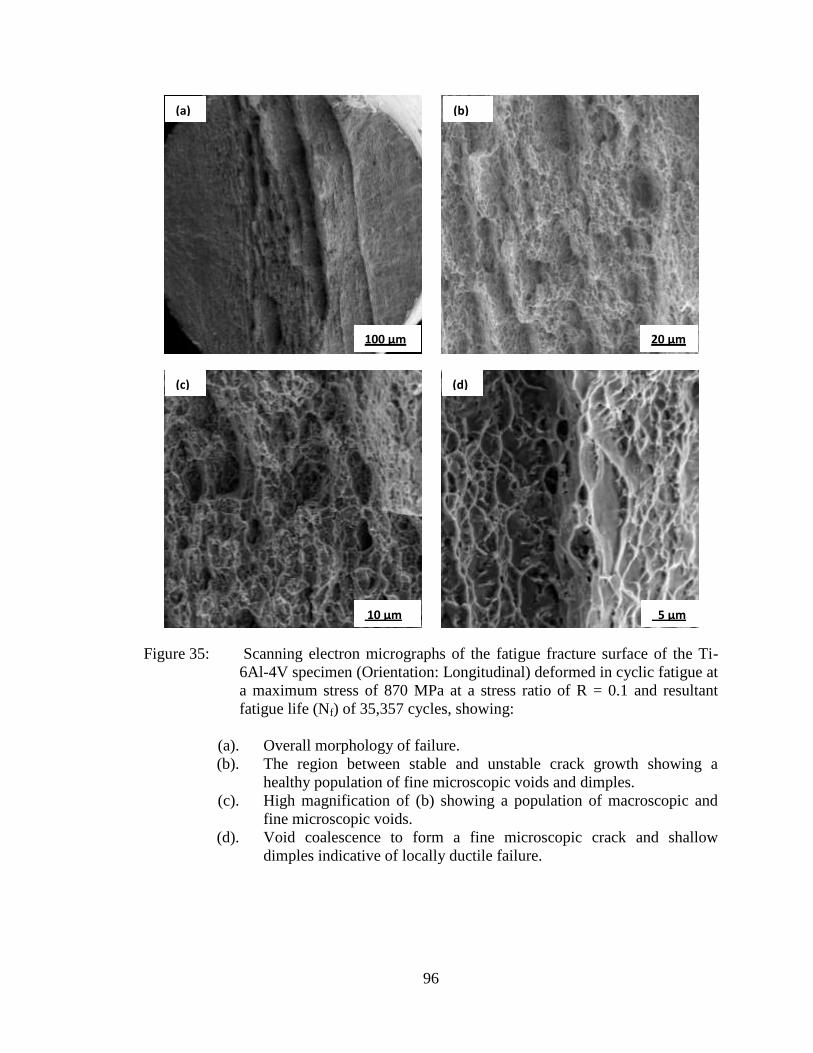
96
Figure 35: Scanning electron micrographs of the fatigue fracture surface of the Ti-
6Al-4V specimen (Orientation: Longitudinal) deformed in cyclic fatigue at
a maximum stress of 870 MPa at a stress ratio of R = 0.1 and resultant
fatigue life (Nf) of 35,357 cycles, showing:
(a). Overall morphology of failure.
(b). The region between stable and unstable crack growth showing a
healthy population of fine microscopic voids and dimples.
(c). High magnification of (b) showing a population of macroscopic and
fine microscopic voids.
(d). Void coalescence to form a fine microscopic crack and shallow
dimples indicative of locally ductile failure.
100 μm
(a)
20 μm
(b)
10 μm
(c)
5 μm
(d)

97
Figure 36: Scanning electron micrographs of the fatigue fracture surface of the
Ti-6Al-4V specimen (Orientation: Longitudinal) deformed in cyclic
fatigue at a maximum stress of 829 MPa at a stress ratio of R = 0.1 and
resultant fatigue life (Nf) of 255,334 cycles, showing:
(a). Overall morphology of failure.
(b). The region of crack initiation and radial outward progression of fatigue
damage.
(c). The transgranular surface: flat and near featureless in the region of
early crack growth.
(d). Shallow dimples covering the region of overload reminiscent of
locally ductile failure.
200 μm
(a)
50 μm
(b)
10 μm
(c)
5 μm
(d)
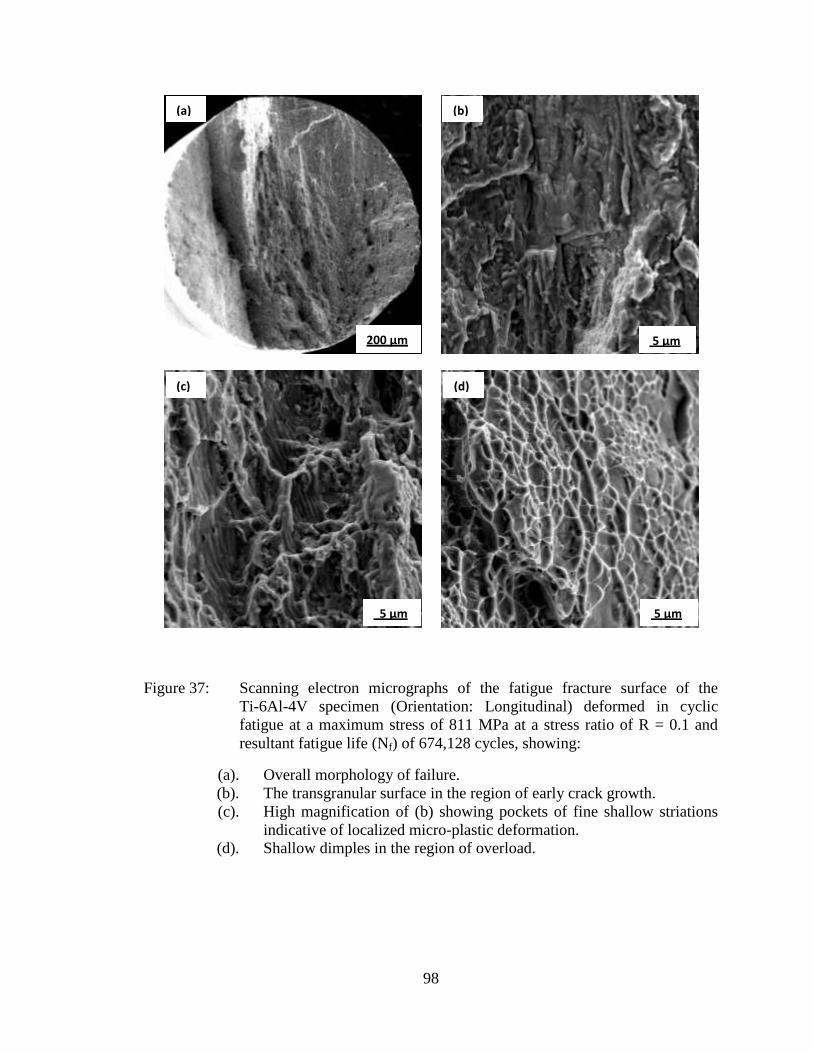
98
Figure 37: Scanning electron micrographs of the fatigue fracture surface of the
Ti-6Al-4V specimen (Orientation: Longitudinal) deformed in cyclic
fatigue at a maximum stress of 811 MPa at a stress ratio of R = 0.1 and
resultant fatigue life (Nf) of 674,128 cycles, showing:
(a). Overall morphology of failure.
(b). The transgranular surface in the region of early crack growth.
(c). High magnification of (b) showing pockets of fine shallow striations
indicative of localized micro-plastic deformation.
(d). Shallow dimples in the region of overload.
200 μm
(a)
5 μm
(b)
5 μm
(c)
5 μm
(d)

99
Figure 38: Scanning electron micrographs of the fatigue fracture surface of the
Ti-6Al-4V specimen (Orientation: Longitudinal) deformed in cyclic
fatigue at a maximum stress of 811 MPa at a stress ratio of R = 0.1 and
resultant fatigue life (Nf ) of 674,128 cycles, showing well defined
striations in the region of stable crack growth indicative of micro-plastic
deformation.
1μm

100
5.6.2 Cyclic Fatigue Fracture: Transverse orientation
Following the same trend as the specimens oriented in longitudinal direction, the
transverse oriented specimens of Ti-6Al-4V alloy exhibit almost identical fatigue lives at
higher stress levels at a load ration of 0.1. At a maximum stress of 962 MPa and resultant
fatigue life of 40,664 cycles, the intrinsic fracture surface characteristics are shown in
Figure 39. For a specimen subjected a maximum stress of 900MPa and resultant fatigue
life of 425,984 cycles, the overall fracture surface morphology revealed the presence of
distinctive regions of crack initiation and radial propagation across the transgranular
surface (Figure 40a). High magnification of the region of early crack growth (Figure
40b) showed a random distribution of fine microscopic cracks (Figure 40c).
The characteristic features on the overload surface like fine microscopic voids and
shallow dimples can be observed on the fracture surface for specimens across a range of
maximum stress values (Figure 40d and Figure 41b). Fine and shallow striations were
found in random locations in the region of stable crack growth indicative of a localized
ductile failure mechanism (Figure 41a). The test specimen cyclically deformed at a
lower maximum stress of 823 MPa had a fatigue life of 581,951 cycles. The overall
morphology of the fracture surface showing the radial propagation of fatigue damage is
shown in Figure 42a. Scanning electron microscopy of the transgranular fracture surface
region revealed a population of fine microscopic cracks evenly distributed across the
region (Figure 42b).

101
High magnification observations of the fine microscopic cracks revealed the non linear
nature of crack propagation as seen in Figure 42c. Irrespective of the maximum stress
applied to cyclically deform the specimen, the region of unstable crack growth is
characterized by the presence of a healthy population of shallow dimples (Figure 42d
and Figure 43).
102
Figure 39: Scanning electron micrographs of the fatigue fracture surface of the
Ti-6Al-4V specimen (Orientation: Transverse) deformed in cyclic fatigue
at a maximum stress of 962 MPa at a stress ratio of R = 0.1 and resultant
fatigue life (Nf) of 40,664 cycles, showing:
(a). Overall morphology of failure.
(b). The region of early crack growth: flat and near featureless.
(c). Pockets of shallow striations in the region of stable crack growth.
(d). A healthy population of fine microscopic voids in the region of
overload.
100 μm
(a)
10 μm
(b)
1 μm
(c)
5 μm
(d)

103
Figure 40: Scanning electron micrographs of the fatigue fracture surface of the
Ti-6Al-4V specimen (Orientation: Transverse) deformed in cyclic fatigue
at a maximum stress of 900 MPa at a stress ratio of R = 0.1 and resultant
fatigue life (Nf) of 425,984 cycles, showing:
(a). Overall morphology of failure showing region of initiation and radial
progression of fatigue damage.
(b). High magnification of region of early crack growth.
(c). High magnification observation of the region of early crack growth
showing a random distribution of fine microscopic cracks.
(d). A population of voids and dimples in the region of overload.
100 μm
(a)
20 μm
(b)
2μm
(c)
5μm
(d)

104
Figure 41: Scanning electron micrographs of the fatigue fracture surface of the
Ti-6Al-4V specimen (Orientation: Transverse) deformed in cyclic fatigue
at a maximum stress of 900 MPa at a stress ratio of R = 0.1 and resultant
fatigue life (Nf) of 425,984 cycles, showing:
(a). Fine and shallow striations found in random pockets in the region of
stable crack growth.
(b). Healthy population of fine microscopic voids of varying shape
intermingled with dimples.
1μm
(a)
1μm
(b)

105
Figure 42: Scanning electron micrographs of the fatigue fracture surface of the
Ti-6Al-4V specimen (Orientation: Transverse) deformed in cyclic fatigue
at a maximum stress of 823 MPa at a stress ratio of R = 0.1 and resultant
fatigue life (Nf) of 581,951 cycles, showing:
(a). Overall morphology of showing radial propagation of fatigue damage.
(b). A healthy population of fine microscopic cracks covering the
transgranular fracture surface region.
(c). High magnification of (b) showing non-linear nature of fine
microscopic cracks.
(d). A healthy population of shallow dimples in the region of unstable
crack growth.
50 μm
(a)
10 μm
(b)
5 μm
(c)
2 μm
(d)

106
Figure 43: Scanning electron micrographs of the fatigue fracture surface of the
Ti-6Al-4V specimen (Orientation: Transverse) deformed in cyclic fatigue
at a maximum stress of 823 MPa at a stress ratio of R = 0.1 and resultant
fatigue life (Nf) of 581,951 cycles, showing pockets of shallow striations
reminiscent of local microplastic deformation.
1μm

107
PART-B
CHAPTER VI
CONCLUSIONS [Ti-6Al-4V]
A study of the high cycle fatigue and final fracture behavior of test specimens
machined from a Ti-6Al-4V fully annealed plate stock for the two different orientations,
i.e. longitudinal and transverse provides the following key observations:
1. The Ti-6Al-4V alloy exhibited a duplex microstructure consisting of the near
equiaxed alpha (α) and the transformed beta (β) phases. The primary near equiaxed
shaped alpha (α) grains was well distributed in a lamellar matrix with transformed
beta grains.
2. The yield strength and ultimate tensile strength of Ti-6Al-4V is nearly equal both in
the longitudinal orientation and in the transverse orientation indication a more or less
isotropic nature of the material. In both orientations, the tensile strength is higher than
the yield strength indicating the occurrence of noticeable work hardening beyond
yield.
3. There is a marginal to no influence of microstructure on high-cycle fatigue life of
both orientations of the alloy and conforms well with the observed results , within the
limits of experimental scatter, to no difference in cyclic fatigue life at a given load
ratio (R=0.1).

108
4. At the chosen load ratio of 0.1 the fatigue fracture surfaces revealed minimal to no
difference in the nature, distribution and volume fraction of the intrinsic features on
the fracture surface as a function of maximum stress and resultant fatigue life. The
region of crack initiation and early microscopic crack growth and a short, yet distinct,
region of stable crack growth were essentially flat and transgranular. A population of
fine microscopic and macroscopic cracks was evident in the region of stable crack
growth approaching overload. Also evident in this region were pockets of well
defined striations indicative of the occurrence of micro-plastic deformation at the
local level. The region of overload was covered with a population of shallow dimples,
fine microscopic voids and isolated macroscopic void and cracks, features
reminiscent of the locally governing failure mechanisms. During repeated cyclic
loading, the fine microscopic cracks coalesce to form macroscopic crack.

109
REFERENCES
1. Askeland, D. R. "The Science and Engineering of Materials." In The Science and
Engineering of Materials, by D. R. Askeland, 443. 2007.
2. ASM Metals Handbook: Fatigue and Fracture. Vol. 19. ASM Handbook, 2003.
3. Boehlert, C. J., C. J. Cowen, S. Tamirisakandala, D. J. McEldowney, and D. B.
Miracle. "In situ scanning electron microscopy observations of tensile
deformation in a boron-modified Ti-6Al-4V alloy." Scripta Materialia 55, no. 5
(September 2006): 465-468.
4. Eylon, D., A. Vessel, Y. Combres, R. R. Boyer, P. J. Bania, and R. W. Schutz.
Journal of Metals 46 (1994): 14-16.
5. Filip, R., K. Kubiak, W. Ziala, and J. Sieniawski. "The effect of microstructure on
the mechanical properties of Ti‐6Al‐4V." International Journal of fatigue 21
(1999): 679-685.
6. Froes, F. H., T. Yau, and H. G. Weidenger. "Titanium, Zirconium and Hafnium."
Chap. 8 in Materials Science and Technology: Structure and Properties of Non-
ferrous Alloys, by F. H. Froes, T. Yau and H. G. Weidenger, edited by K. H.
Matucha, 401. 1996.
7. Howard, E. Boyer, ed. Hardness testing. ASM International, 1987.
8. Kuruvilla, M., and T. S. Srivatsan. Key Engineering Materials 378-379 (2008):
271-298.
9. "Processing and Fabrication of Advanced." Proceeding of Sixteenth International
Symposium. Singapore, 2007. 370-388.
10. Lee, E. W., S. Lee, N. J. Kim, and J. Oh. "Correlation of fatigue properties and
microstructure in investment cast Ti-6Al-4V welds." Materials Science and
Engineering A 340 (2003): 232-242.
11. Li, Y. G., M. H. Loretto, D. Rugg, and W. Voice. "Acta Materialia." 49 (2001):
3011-3017.
12. M. J. Donachie, Jr. Titanium- a technical guide. Second Edition. 2000.

110
13. Morrissey, R. J., D. L. McDowell, and T. Nicholas. "Frequency and stress ratio
effects in high cycle fatigue of Ti‐6Al‐4V." International Journal of fatigue 21
(1999): 679-685.
14. Osman, E., T. Troy, L. Ying, M. Wes, and L. J. Enrique. "Enhanced tensile
strength and high ductility in cryomilled commercially pure titanium." Scripta
Materialia 60, no. 7 (April 2009): 586-589.
15. Paulo de campos, P., and J. C. Bressiani. Materials research 8, no. 4 (April 2005):
440-443.
16. Peter, M., A. Gysler, and G. Lutjering. Metallurgical Transactions 15A (1984):
597-605.
17. Peters, J. O., and R. O. Ritchie. "Foreign‐object damage and high cycle fatigue:
role of microstructure in Ti-6Al-4V." International Journal of Fatigue 23 (2001):
413-421.
18. Poondla, N., T. S. Srivatsan, A. Patnaik, and M. Petraroli. "A study of the
microstructure and hardness of two titanium materials: Commercially pure and
Ti-6Al-4V." Journal of Alloys and Compounds 486, no. 1-2 (November 2009):
162-167.
19. Sadananda, K., and A.K. Vasudevan. "Fatigue crack growth behavior of titanium
alloys." International Journal of Fatigue 27, no. 10-12 (2005): 1255–1266.
20. Salischev, G. A., and Yu. S. Mironov. "Effect of grain size on mechanical
properties of commercially pure Titanium." Russian Physics Journal 44, no. 6
(2001): 596-601.
21. Sanders, Jr. T.H., and J. T. Staley. Edited by M. Meshi. Materials Park: ASM
International, 1979. 467.
22. Schauerte, L. "Titanium in automotive production." Advanced Engineering
materials 5, no. 6 (2003): 411-418.
23. Schutz, R. W., and H. B. watkins. Materials Science and Engineering 243, no. 1-2
(March 1998): 305-315.
24. Seagle, S. R. Materials Science and Engineering 213, no. 1-2 (1996): 1-7.
25. Semenova, I. P., G. Kh. Salimgareeva, V. V. Latysh, T. Lowe, and R. Z. Valiev.
"Enhanced fatigue strength of commercially pure Ti processed by severe plastic
deformation." Materials science and Engineering A 503 (2009): 92-95.
26. Shatil, G., and D. J. Smith. "Ductile fracture of commercial purity titanium at
room temperature." Fatigue and Fracture of Engineering Materials and Structures
23, no. 10 (2000): 825-833.

111
27. Sibum, H. Advanced Engineering Materials 5, no. 6 (June 2003): 393-398.
28. Soares, R. S., A. G. Luis, V. L. Geraldo, and H. Guilherme Elias Pessanha.
"Effect of thermal treatments on tensile strength of commercially cast pure
titanium and Ti-6Al-4V alloys." Journal of Materials Science: Materials in
Medicine 16, no. 8 (August 2005): 759-766.
29. Srivatsan, T. S., and M. Kuruvilla. "Microstructure, Hardness, Tensile
Deformation, Cyclic Fatigue and Fracture Behavior of Ti-Al-V-Fe-O Alloy: Role
of Sheet Stock." Final Technical Report, ATI Wah Chang, 2007.
30. Srivatsan, T. S., M. Kuruvilla, and L. Park. "Microstructure, Hardness, Tensile
Deformation, Cyclic Fatigue and Fracture Behavior of Ti-Al-V-Fe-O2 Alloy."
Key Engineering Materials 378-379 (2008): 271-298.
31. Starke, Jr., E. A., and G. Lutjering. "Fatigue and Microstructure." Edited by M.
Meshii. Materials Park: ASM International, 1979. 205.
32. Takao, K., and K. Kusukawa. "Low cycle fatigue behavior of commercially pure
titanium." Materials Science and Engineering A 213 (1996): 81-85.
33. Tal-Gutelmacher, E., and D. Eliezer. "Hydrogen cracking in titanium based
alloys." Journal of Alloys and Compounds 404-406 (2005): 621-625.
34. Tan, M. J., X. J. Zhu, and S. Thiruvarudchelvan. "Cavitation phenomenon of
commercially pure titanium." Journal of Materials Processing Tech. 191, no. 1-3
(August 2007): 202-205.
35. Terada, D., S. Inoue, and N. Tsuji. "Microstructure and mechanical properties of
commercial purity titanium severely deformed by ARB process." Journal of
Materials Science 42 (2007): 1673‐1681.
36. Tokaji, K. "High cycle fatigue behavior of Ti‐6Al‐4V alloy at elevated
temperatures." Scripta Materialia 54 (2006): 2143-2148.
37. Valentine, N. Moiseyev. Titanium Alloys: Russian Aircraft and Aerospace
Application. Taylor& Francis, 2006.
38. Vanderhasten, M., L. Rabet, and B. Verlinden. "Ti-6Al-4V: Deformation map and
modelisation of tensile behaviour." Materials and Design 29, no. 6 (2008): 1090-
1098.
39. Wallace, J. M., and R. W. Neu. "Fretting Fatigue crack nucleation in Ti‐6Al‐4V."
Fatigue Fracture and Engineering materials and Structures 26 (2006): 199-214.
40. Wessel, J. K. The Handbook of Advanced Materials. Edited by J. K. Wessel. Oak
Ridge, Tennessee, 2004.

112
41. Wiskott, H.W. J., T. Doumas, S. S. Scherrer, U. C. Belser, and C. Susz.
"Mechanical and structural characteristics of commercially pure grade 2 Titanium
welds and solder joints." Journal of materials science: Materials in medicine 12
(2001): 719-725.

113
APPENDICES

114
APPENDIX A
TABLES SHOWING HIGH CYCLE FATIGUE TEST DATA, AND STRESS AND
LOAD CALCULATIONS FOR Ti- CP (GRADE 2)
Table 7: A summary of the high-cycle fatigue tests conducted on Ti-CP (Grade 2)
(Orientation: Longitudinal) specimens at a load ratio of R=0.1
SPECIMEN ID Nf σYS % σmax σmax/σys σmax/E σmax/σUTS
P4-L7 45532 94 406.08 0.940 0.003531 0.724
P4-L12 49463 93 401.76 0.930 0.003494 0.716
P4-L10 72565 92 397.44 0.920 0.003456 0.708
P4-L11 125564 85 367.2 0.850 0.003193 0.655
P4-L6 409467 80 345.6 0.800 0.003005 0.616
Table 8: A summary of the high-cycle fatigue tests conducted on Ti-CP (Grade 2)
(Orientation: Transverse) specimens at a load ratio of R=0.1
SPECIMEN ID Nf σYS % σmax σmax/σys σmax/E σmax/σUTS
P4-T14 47639 106 404.92 1.060 0.003749 0.871
P4-T19 72777 104 397.28 1.040 0.003679 0.854
P4-T17 117157 101 385.82 1.010 0.003572 0.830
P4-T15 234351 98 374.36 0.980 0.003466 0.805
P4-T18 957816 87.5 334.25 0.875 0.003095 0.719

115
Table 9: A summary of the input data and fatigue life for the high-cycle fatigue
tests conducted on Ti-CP (Grade 2) (Orientation: Longitudinal) specimens
at a load ratio of R=0.1.

116
Table 10: A summary of the input data and fatigue life for the high-cycle fatigue
tests conducted on Ti-CP (Grade 2) (Orientation: Transverse) specimens at
a load ratio of R=0.1.

117
APPENDIX B
TABLES SHOWING HIGH CYCLE FATIGUE TEST DATA,
STRESS AND LOAD CALCULATIONS FOR Ti-6Al-4V
Table 11: A summary of the high-cycle fatigue tests conducted on Ti-6Al-4V
(Orientation: Longitudinal) specimens at a load ratio of R=0.1.
SPECIMEN ID Nf σYS % σmax σmax/σys σmax/E σmax/σUTS
L7 35737 94.5 870.35 0.95 0.006908 0.85
L5 38740 92 847.32 0.92 0.006725 0.83
L12 255334 90 828.9 0.90 0.006579 0.81
*L8 34724 89.5 824.3 0.90 0.006542 0.81
*L11 1e6+57365 89 819.69 0.89 0.006505 0.80
L3 674128 88 810.48 0.88 0.006432 0.79
*L10 1.00E+06 87.5 805.88 0.88 0.006396 0.79
L9 (*7.3)x 105 85/85.5 787.46 0.86 0.006250 0.77
L6 1.00E+06 82.5 759.83 0.83 0.006030 0.74
Table 8: A summary of the high-cycle fatigue tests conducted on Ti-6Al-4V
(Orientation: Transverse) specimens at a load ratio of R=0.1.
SPECIMEN ID Nf σYS % σmax σmax/σys σmax/E σmax/σUTS
T6 40664 93.5 962.12 0.94 0.007023 0.83
T5 202376 90 926.1 0.90 0.006760 0.80
T4 425984 87/87.5 900.38 0.88 0.006572 0.78
T7 445229 84 864.36 0.84 0.006309 0.75
*T10 3824 80 823.2 0.80 0.006009 0.71
T11 581951 80 823.2 0.80 0.006009 0.71
T8 34427 79.5 818.06 0.80 0.005971 0.71
T12 1000000 75 771.75 0.75 0.005633 0.67
T9 Buckled - - - - -

118
Table 5: A summary of the input data and fatigue life for the high-cycle fatigue
tests conducted on Ti-6Al-4V (Orientation: Longitudinal) specimens at a
load ratio of R=0.1

119
Table 6: A summary of the input data and fatigue life for the high-cycle fatigue
tests conducted on Ti-6Al-4V (Orientation: Transverse) specimens at a
load ratio of R=0.1

120
APPENDIX C
PROCEDURE FOR PERFORMING THE TENSION TEST ON THE INSTRON-8500
SERVO HYDRAULIC TESTING MACHINE
Step 1: Switch on the POWER.
1. Switch on the power switch on the power surge bar.
2. Turn on the water flow for the hydraulic plant.
3. Switch on the computer and the CPU.
4. Switch <ON> the actuator.
5. Press <LOW> button for 5 seconds.
6. Then press <HIGH>
7. Check for the status in the message console on the monitor to make sure that it
does not show any errors or warnings.
Step 2: Calibrate the load.
1. Right click on the load module on the console, and click on “Calibrate”.
2. Click “Next” four times until the screen shows “Start” and click “Start” for the
calibration to complete.
121
3. The calibrate signal in the load area will blink continuously and stop, upon
completion of CALIBRATION.
4. Uncheck the ticked boxes for overwriting the calibration settings and click
“Finish”
Step 3: Specimen Loading.
1. Press <Load Protect> <ON>
2. Fix the specimen into the grips, this can be done by fixing the lower end of the
specimen first and then moving the actuator <UP> so that the specimen is in place
and the then the upper end of the specimen can be fixed firmly into the grips.
Step 4: Recalibrate the load with specimen attached.
1. This is done because, while fixing the specimen some load was exerted on the
actuators. To negate that load-effect, we need to re-calibrate the load.
2. Turn load protector <OFF>
3. Right click on the load module on the console, and click on “Calibrate”.
4. Click “Next” four times until the screen shows “Start” and click “Start” for the
calibration to complete.
5. The calibrate signal in the load area will blink continuously and stop, upon
completion of CALIBRATION.

122
6. Uncheck the ticked boxes for overwriting the calibration settings and click
“Finish”.
Step 5: Calibration of the strain gage.
1. Attach the strain gage plug to the strain socket.
2. Right click on the load module on the console, and click on “Calibrate”.
3. Click “Next” four times until the screen shows “Start” and click “Start” for the
calibration to complete.
4. The calibrate signal in the load area will blink continuously and stop, upon
completion of CALIBRATION.
5. The calibration of the strain gage is done WITHOUT fixing the strain gage to the
specimen.
Step 6: Fixing the strain gage to the specimen.
1. Once the specimen is firmly in the grips and the strain gage has been calibrated,
the strain gage must be fixed onto the specimen at the center of the gage length of
the specimen (the region where failure is predicted).
2. Ensure that the PIN remains in the strain gage until both the arms of the strain
gage are fixed onto the specimen with the aid of rubber bands.
3. Right Click on the load module to turn the <LOAD PROTECT> <ON>

123
4. Once the arms of the strain gage are fixed onto the specimen with the help of
rubber bands, remove the pin.
5. It is advisable that the pin be removed gently, so as not to disturb the strain
calibration.
6. The calibration can be done again to ensure the reading of strain on the console is
close to zero.
Step 7: Choosing the program to run the tension test.
1. Choose Bluehill 2.0 on the desktop.
2. Create a Test method: choose a tension test method present in the list as per the
sample and its geometry.
3. File Open Test methods: (UDAY/Ti-6Al-4V Tension test).
4. Click OK.
5. Check for the parameters of the tensile test method: Check all the specimen
dimensions, test parameters and data storage parameters.
6. Set Strain control rate = 0.6%/min (This will depend on the material being tested)
7. Once the settings are set up, return to the HOME SCREEN.
8. Select the TEST icon.
9. Enter a file name for the test. (Example: Ti-6Al-4V (L-3))
10. Click OK and click next until the “Start Test” button is enabled.

124
11. Click on “Start Test” button. The test will begin and the graph on the computer
screen will show the variation of stress with strain (if chosen).
12. The test will stop when the sample fails.
13. Remove one of the two rubber bands; insert the PIN back into the strain gage and
remove the other rubber band, and place the strain gage safely in the box.
14. Right Click on the load module to turn the <LOAD PROTECT> <ON>
15. Remove the specimen from the grips.
16. The computer is programmed to give the print out of the data and the graph for
reference.
17. Click on “Next” until “Finish Test” button is enabled. Click “Finish Test”.
18. Ensure that you see a green progress bar indicating that the raw data collected
during the test is saved to the specified location.
19. Press < low> on the actuator controller for 5 seconds and then switch <OFF>.
20. Turn off the water supply and switch <OFF> the computer CPU and the monitor.

125
APPENDIX D
PROCEDURE FOR PERFORMING A HIGH CYCLE FATIGUE TEST ON THE
INSTRON-8500 SERVO HYDRAULIC TESTING MACHINE
Step 1: Switch on the POWER.
1. Switch on the power switch on the power surge bar.
2. Turn on the water flow for the hydraulic plant.
3. Switch on the computer and the CPU.
4. Switch <ON> the actuator.
5. Press <LOW> button for 5 seconds.
6. Then press <HIGH>
7. Check for the status in the message console on the monitor to make sure that it
does not show any errors or warnings.
Step 2: Calibrate the load.
1. Right click on the load module on the console, and click on “Calibrate”.
2. Click “Next” four times until the screen shows “Start” and click “Start” for the
calibration to complete.

126
3. The calibrate signal in the load area will blink continuously and stop, upon
completion of CALIBRATION.
4. Uncheck the ticked boxes for overwriting the calibration settings and click
“Finish”.
Step 3: Specimen Loading.
1. Press <Load Protect> <ON>
2. Fix the specimen into the grips, this can be done by fixing the lower end of the
specimen first and then moving the actuator <UP> so that the specimen is in place
and the then the upper end of the specimen can be fixed firmly into the grips.
Step 4: Recalibrate load with specimen attached.
1. This is done because, while fixing the specimen some load was exerted on the
actuators. To negate that load-effect, we need to re-calibrate the load.
2. Turn load protector <OFF>
3. Right click on the load module on the console, and click on “Calibrate”.
4. Click “Next” four times until the screen shows “Start” and click “Start” for the
calibration to complete.
5. The calibrate signal in the load area will blink continuously and stop, upon
completion of CALIBRATION.

127
6. Uncheck the ticked boxes for overwriting the calibration settings and click
“Finish”.
Step 6: Choosing the program for the FATIGUE test.
1. Choose the SAX program from the desktop.
2. Create a Test method: choose a fatigue test method present in the computer as per
the sample and its geometry using File Open Test methods: (UDAY/Ti-6Al-
4V Fatigue test).k OK.
3. Click on the waveform generator, ensure that all the test requirements reflect on
the screen, example: the waveform, this can be sinusoidal, triangular etc.., start
ramp: 0.1 second, the frequency: 5Hz
4. Check for the parameters of the fatigue test method: Enter the values for the
amplitude and mean load values based on the calculations.
5. The end of the test was set at 1,000,000 cycles.
6. Save the test at a desired location with a proper name.
7. Ensure that the cycle counter is reset to ZERO before the test begins.
8. Go to Test Start Test. Click OK to start the test.

128
Step 7: Removal of specimen after failure.
1. Once the test sample has failed, lower the actuator to ensure sufficient space for
the removal of the failed specimen.
2. Ensure that the raw data is saved at the specified location.
3. Press < low> on the actuator controller for 5 seconds and then switch <OFF>.
4. Turn off the water supply and switch <OFF> the computer CPU and the monitor.

129
APPENDIX E
PROCEDURE FOR PERFORMING LOOP SHAPING FOR A GIVEN STRESS RATIO
AND MATERIAL ON THE INSTRON-8500 SERVO HYDRAULIC TESTING
MACHINE
Step 1: Switch on the POWER.
1. Switch on the power switch on the power surge bar.
2. Turn on the water flow for the hydraulic plant.
3. Switch on the computer and the CPU.
4. Switch <ON> the actuator.
5. Press <LOW> button for 5 seconds.
6. Then press <HIGH>
7. Check for the status in the message console on the monitor to make sure that it
does not show any errors or warnings.
Step 2: Calibrate the load.
1. Right click on the load module on the console, and click on “Calibrate”.
2. Click “Next” four times until the screen shows “Start” and click “Start” for the
calibration to complete.

130
3. The calibrate signal in the load area will blink continuously and stop, upon
completion of CALIBRATION.
4. Uncheck the ticked boxes for overwriting the calibration settings and click
“Finish”.
Step 3: Specimen Loading.
1. Press <Load Protect> <ON>
2. Fix the specimen into the grips, this can be done by fixing the lower end of the
specimen first and then moving the actuator <UP> so that the specimen is in place
and the then the upper end of the specimen can be fixed firmly into the grips.
Step 4: Recalibrate load with specimen attached.
1. This is done because, while fixing the specimen some load was exerted on the
actuators. To negate that load-effect, we need to re-calibrate the load.
2. Turn load protector <OFF>
3. Right click on the load module on the console, and click on “Calibrate”.
4. Click “Next” four times until the screen shows “Start” and click “Start” for the
calibration to complete.
5. The calibrate signal in the load area will blink continuously and stop, upon
completion of CALIBRATION.

131
6. Uncheck the ticked boxes for overwriting the calibration settings and click
“Finish”.
Step 5: Loop shaping with a test specimen.
1. Right click on the load module on the console, and click on “General” Option.
2. Click on the “PID” tab and note down the values for the fields proportional,
Integral, derivative and Lag.
3. Click on the “Properties” tab and modify the value of the field, “Tuning
disturbance amplitude” to a small value say 0.5 kN.
4. Click on “Auto-tune now” and wait for the process to complete.
5. Now, Click on the “PID” tab and note down the values for the fields‟
proportional, Integral, derivative and Lag. Repeat steps 3 and 4 with gradually
incrementing the Tuning disturbance amplitude value until the values of the above
field remains more or less constant.
Step 7: Removal of specimen after Loop tuning.
1. Once the loop tuning is complete, enable specimen protect and carefully remove
the specimen.
2. Press < low> on the actuator controller for 5 seconds and then switch <OFF>.
3. Turn off the water supply and switch <OFF> the computer CPU and the monitor.