
A study of high strength, heat treated plain carbon steels
79
Scholars' Mine Scholars' Mine Masters Theses Student Theses and Dissertations 1966 A study of high strength, heat treated plain carbon steels A study of high strength, heat treated plain carbon steels Ing Shing Chien Follow this and additional works at: https://scholarsmine.mst.edu/masters_theses Part of the Metallurgy Commons Department: Department: Recommended Citation Recommended Citation Chien, Ing Shing, "A study of high strength, heat treated plain carbon steels" (1966). Masters Theses. 5783. https://scholarsmine.mst.edu/masters_theses/5783 This thesis is brought to you by Scholars' Mine, a service of the Missouri S&T Library and Learning Resources. This work is protected by U. S. Copyright Law. Unauthorized use including reproduction for redistribution requires the permission of the copyright holder. For more information, please contact [email protected].
Transcript of A study of high strength, heat treated plain carbon steels

Scholars' Mine Scholars' Mine
Masters Theses Student Theses and Dissertations
1966
A study of high strength, heat treated plain carbon steels A study of high strength, heat treated plain carbon steels
Ing Shing Chien
Follow this and additional works at: https://scholarsmine.mst.edu/masters_theses
Part of the Metallurgy Commons
Department: Department:
Recommended Citation Recommended Citation Chien, Ing Shing, "A study of high strength, heat treated plain carbon steels" (1966). Masters Theses. 5783. https://scholarsmine.mst.edu/masters_theses/5783
This thesis is brought to you by Scholars' Mine, a service of the Missouri S&T Library and Learning Resources. This work is protected by U. S. Copyright Law. Unauthorized use including reproduction for redistribution requires the permission of the copyright holder. For more information, please contact [email protected].

A STUDY OF HIGH STRENGTH, HEAT TREATED
PLAIN CARBON STEELS
BY
ING SHING .• CHIEN -I ?3 7-
A
THESIS
submitted to the faculty of
THE UNIVERSITY OF tiSSOURI A'.r ROLLA
in partial fulfillment of the requirements for the
degree of
MASTER OF SCIENCE IN METALLURGICAL ENGINEERING
Rolla, Missouri
1966
Approved by

ACKN<lVLlillG.Elill~T
The author wishes to express his gratitude to Dr. Fred
Kisslinger for his advice, encouragement and assistance in the
execution of this work and preparation of this thesis.
He also wishes to acknowledge the assistance and counsel of
Dr. H. P. Leighly, Jr.
Thanks are due Prof. R. F. Davidson for his cooperation and
assistance in making the tensile testing facilities available.
The assistance and cooperation of the other faculty members
Of the Department of Metallurgical Engineering at the University
of Missouri at Rolla is gratefully acknowledged.
ii
In addition, the author is indebted to the Laclede ~teel Company
at Alton, Illinois,and to the Interlake Steel Company at Chicago,
lllinois,for their generosity in supplying steel for this investi
gation.

LIST OF FIGU~
LIST OF TABLES
I. INTRODUCTION
II. LITERATURE RE.VIEW
TABLE OF CONTENTS
III. EXPERIMENTAL PROCEDURE
A. STEELS STUDIED
B. HEAT TRF...ATING
C. TENSlLE TESTING
D. ELECTRON MICROSCOPY
IV. EXPERIMENTAL RESULTS
A. STEEL A
B. STEELS B, C AND D
C. STEEL E
D. S TEJI.l, F
V. DISCUSSION OF RESULTS
A. GENERAL
B. COMPARISON OF STEELS STUDIED
VI. CONCLUSIONS
BIBLIOGRAPHY
VITA
iii
Page
iv
vi
1
.3
9
1.4.
20
24
30
34
37
49
56
62
68
70
72

iv
LIST OF FIGURES
FIGURES Page
1. Microstructure Of Steel B After Straightening And Annealing
From 1450°F. 12
2. Microstructure Of Steel D After Straightening And Annealing
From 1450°F. 12
3. Microstructure Of Steel E After Annealing From 1450°F. 15
4. Hardness Traverses On Hardened Samples Of Steel A Showing
Extent Of Decarburization 17
5. Hardness Traverses On Hardened Samples Of Steel C Showing
Extent Of Decarburization 17
6. Microstructure At Surface Of Sample Of Steel E Hardened From
1550°F. Surface Imbedded In Granular Charcoal During Heating 18
7. Microstructure A. t Surface Of Sample Of Steel E Hardened From
l550°F. Surface Exposed To Air During Heating 18
8. Round Tensile Test Sample In Tensile Tester.(Lower Pulling
Bar Displays Ball And Socket Joint). 21
9. Templin Grips With Strip .Sample 21
10, Jaws Used In Templin Grips For Holding Strip Samples 23
11. General View Of Device For Thinning Samples For Transmission
Electron Microscopy 26
12. Bracket And Grinding Shaft Inside Of Thenning Device 26
13. Interior Of Thinning Device Showing Sample In Place Under
Grinding Shaft 27
14. Fractured Tensile Test Samples Of Steel A 33
15. Fractures In High Carbon Steel Round Tensile Test Samples 38

v
FIGURES Page
16. Effect Of Quenching Medium On The Tensile ~trength Of Steel E 40
17. Tensile Strength Data Obtained On Steel E
18. Elongation Data Obtained On Steel E 46
19. Side View Of Fractures In Strip Samples 47
20. Edge View Of Fractures In Strip Samples.(Near Edge Of Samples
Was Ground Flat To Show The Nature Of Fracture Surface Better~ 47
21. Tensile Strength Data Obtained On Steel F 52
22. Elongation Data Obtained On Steel F 53
23. Side View Of Strip Samples Of Steel F ~
~. Tensile Strength-Elongation Relationship Observed For Steel A 58
25. Tensile Strength-Elongation Relationship Observed For Steel E 65
26. Tensile Strength-Elongation Relationship Observed For Steel F 65

LIST OF TABLES
TABLES
I. Compositions Of Steels Studied
II. Heat Treatment Conditions And Tensile Test Results For
Steel A
III. Effect Of Hardening Temperature On Hardness And Cracking
Tendency Of Steel B
IV. Heat Treatment Conditions And Tensile Test Results For
vi
Page
10
31
35
Steel B, C And D 36
V. Effect Of Quenching Medium On Steel E 39
VI. Heat Treatment Conditions And Tensile Test Results For
Steel E 42
VII. Heat Treatment Conditions And Tensile Test Results For
Steel F 51

I INTRODUCTION
This work was undertaken as the initial step in a program of
studying brittleness in carbon steel that has been heat treated to
high strength levels.
1
The trend in modern technology is toward higher tensile strengths.
In practice, only alloy steels are commonly heat treated to very high
strength levels. AISI 4340 is one of the more commonly used steels when
high strength is desired. It is also becoming almost standard practice
to use some of the tool steels or highly alloyed maraging steels for
high strength structural components.
For this study high strength in a heat treated steel is arbitrari
ly assumed to be 300,000 psi tensile strength. A certain minimum carbon
content is probably required if 300,000 psi tensile strength is to be
produced in the steel by heat treatment. Since not all heats of carbon
steel are sufficiently ductile at high strength levels to permit the
making of meaningful tensile test~ the major effort in this thesis
project has been devoted to searching for a steel that can be used as
a reference material in a study of brittleness and to developing
techniques to be used in working with high strength steel.
Unfortunately,the search for a reference steel has not been
completely successful. However, it has been possible to heat treat
round tensile test bars to tensile strengths over 300,000 psi. The
procedure was relatively simple and involved no protective atmosphere
or elaborate fixtures for holding the samples during the heat treatment.
Machining round tensile test samples required too much care and expense.
It became necessary to change to a less expensive strip type sample.
2
Strip samples of about 250,000 psi tensile strength were prepared
and tested. It is believed that the testing procedure will be satis
factory for strip samples with tensile strengths over 300,000 psi when
the material is obtained.
A limited amount of work has been done on the preparation of
samples for transmission electron microscope studies. The procedure
for making thin sections requires further refinement.

'II. LITERATURE REVIIM
The literature on brittleness is extensive. Much of this
literature deals with brittle failures in materials such as mild steel
which is ordinarily considered to be ductile. The brittle failures
of some liberty ships during the last war and other failures of this
type initiated the stu:dy of this phenomenon. There is also much in the
literature on various types of brittleness found in quenched and
tempered steels. Both these segments of the literature deal with
brittleness or lowered ductility in steels at strength levels under
150,00Q-200,000 psi.
When steels are heat treated to ver.y high strength, it becomes
much less ductile than it is at lower strength levels. It may become
brittle and it is the kinds of brittleness encountered in steels with
very high tensile strength that is of interest in this study. The
meaning of brittleness will be discussed before mentioning the kinds
of brittleness to be studied in high strength steels.
* Boyd (1) says, "Brittleness is one of those properties or materials
which everyone understands but nobody can define". Brittleness probably
means very different things to different peop!..,,. The terms 11brittle 11
and "ductile" are used in two entirely different wayst to describe the
properties of the material and also to describe the fracture process.
Ductile materials like mild steel, for example, fai1 in a brittle
manner as mentioned above. This dual usage sometimes causes confusion.
Boyd takes the position that metals cannot be classified easily
on the basis of their ~lative brittleness. He claims this is so
because va.rl.ous !'actors can determine how the metal will fracture.
*no. in ( ) refers to references.
Boyd was primarily concerned with brittle failures in mild steel.
His distinction between brittleness and toughness is a convenient
concept and will be described.
Fractures can be classified in one of two "modes":
by shear or by cleavage. Either of these modes of fracture can be
further cla.asified into one cf two "kinds": stable and unstable.
It is primarily the kind of fracture that determines whether it is
tough or brittle.
In the shear mode of fracture,the individual grains in a
polycrystalline sample elongate and reduce their cross section by
deforming plastically. Eventually their cross sectiois are reduced
4
to essentially sero area and then they separate giving rise to a
fracture surface which appears to contain the ends of broken fibers.
This .appearance of t.he fracture surface is responsible for the term
"fibrous fracture". When cleavage occurs, the individual grains separate
parallel to a cr,rstallographic plane known as the cleavage plane.
These" ruptured surt&ces of the individual grains are relatively flat
and more or less randomly oriented. They give the fracture surface
of the sample a bright, "cryatalline11 appearance.
A stable kind of fracture is one whose propagation can be
controlled by controlling the external load. An appreciable amount
of deformation of the metal occurs during a stable fracture and it
is neceasar,y to maintain a aufficiently high stress level in the
•terial or the fracture stops. It the a tress in a member or part of
a structure is reduced as a consequence -ot the initial stages of
crackiD.g, crack propagation stope and the fracture does not spread

completely through the section.
During unstable fracture,the crack propagates, once initiated,
ri:thout maintaining the external load. This kind of fracture is
~en and uncontrollable. Propaga-tion of the crack is very rapid.
It approaches the speed of sound after it sta.rts to grow and it is
not possible to arrest the fracture by reducing the external load.
Boyd's arbitrary definitions distinguish between brittle and
tough fractures on the basis of whether the fracture is stable or
unstable. A brittle fracture is unstable while a tough fracture is
stable.
The distinction between stable and unstable fracturing depends
upon the relationship between the plastic energy· released by the
progress ot a fracture and the amount of work that DlUSt be1done
during fracture. The Griffith theocy of crack propagation deals with
this phenomenon in brittle. materials. Orowan subsequently modified
the Griffith theory to account for the behavior of me~a which are
not completely brittle materials.
5
Szczepanski (2} discusses the Griffith theor,y and its modification
by Orowan. The Griffith theor,y applies to completel7 brittle materials.
It assumes there is no plastic deformation and the only energy needed
for crack propagation is the surface energy of the new fracture surfaces.
During brittle fracture sufficient elastic energy is stored in the
material to allow crack propagation without energy being supplied from
an external source. However, the crack must be initiated before it can
propagate. The Griffith theory indicates that there is a certain
minimum aise of notch or crack in a brittle material that will cause

6
a fracture to propagate at a certain stress level .•
Experimental results on glass agree with the Griffith theor.y.
However, the Griffith theory does not apply to metals because metals
are not completely brittle. ~'ven when a metal fails in a brittle manner
there is some plastic deformation. The amount of energy required to
deform the metal is much greater than the surface energy of the
fracture surfaces. Orowan found the energy of plastic deformation was
1000 times as great as the surface energy of the fracture surfaces.
Orowan modified the Griffith theory t.o account for the plastic defor
mation that occurs in metals and was able to calculate more realistic
minimum crack sizes for initiation of brittle fractures in metals.
Petch (3) discusses the difference between toughness and
brittleness. He distinguishes between the fracture behavior of a
tough or ductUe material and that of a brittle material on the basis
of the amount of deformation occurring during fracture. This is somewhat
similar to the modified G~~ttith theory. A brittle material is notch
sensitive. A notch causes a localized high stress which initiates
a crack. Ver.y little plastic deformation is associated with the fracture
process,and even when the crack grows out of the region of high stress
into a region where the stress is at a more nor.mal level, the elastic
energy stored in the material is still sufficient to supply the
energy needed for crack propagation. This kind of fracture is unstable.
The propagation of the crack accelerat,es to a velocity approaching
that of sound and a brittle fracture spreads completely across the
section.
,A. to~h ·o~ ductile material is. not notch BE:tnsitive. A crack may

start in the vicinity of a notch or other stress raiser. However,
when the crack progresses away from the notch into a region of more
normal stress,the crack ceases to grow unless straining continues
to maintain a high stress.
7
It is common to associate very high hardness and tensile strength
in steel with low ductility or brittleness. However, while ductility,
as indicated by percent elongation or reduction of area in a tensile
test,ordinarily decreases as tensile strength increases, a steel does
not necessarily become brittle when it is heat treated to high strength.
Kisslinger (4) found that steels which have similar properties
when -they are in a soft condition can become very different when
they are heat treated to high strength levels. He found it was possible
to develop a heat treating procedure that could yield steel strip
with a tensile strength over 300,000 psi. However, only steel from a
limited number of heats responded to the treatment. Unfortunately,
the steel from a large proportion of the heats of the grade of steel
being studied became brittle when they were subjected to the treatment.
This unexpected variation in supposedly similar steels precluded
commercial exploitation of the material and the heat treatment.
The work of Kisslinger on heat treating straight carbon steels
to high strength levels was abandoned because of the variation in
properties of different heats, and also because of an anticipation of
another type of brittleness in the high strength material which has
been referred to as 11static fatigue" or 11delayed fracturen. This type
of embrittlament (5 , 6).haa been associated with hydrogen absorption
and has been found to be at least partially irreversible. At the time
Kisslinger's work was done no attempt was made to determine the
cause of the variation in properties of the steel from different
heats of the carbon steel or the susceptibility of the steel to
static fatigue.
Static fatigue is a phenomenon in which a high strength steel
fails when subjected to a constant load (5 , 6). A steel that has
been embrittled can exhibit nor.mal properties in a normal tensile
test. However, when a constant load is applied to a sample of the
steel, it is found that there is an incubation period during which
a crack is for.med at a point of stress concentration like a notch.
There is another period of slow growth of the crack and finally
the sample fractures in a brittle manner.
8
Static fatigue in high strength steel is markedly different from
the brittleness found in mild steel. The tendency toward brittle
fracture in mild steel is enhanced by rapid loading and low temper
ature (1 , 3) .while the tendency toward brittle fracture in high
strength, heat treated steel is enhanced by slow strain rate and
higher temperature (5).
The literature on brittleness in very high strength, heat treated
steel is limited, to a large extent, to alloy grades (6). Apparently
it has been easier to avoid brittleness in high strength steel by
using alloy steels than·it has been to develop procedures for elimi
nating this er~·ect in the carbon steels. The potential applications
of straight carbon steel in high strength,heat treated strip, sheet
and wire products where low hardenability is no serious handicap
indicates that further study of this material is justified.

III. E.XPER:DIDJTAL PROCEDURE
A. STEELS S 'IUD lED
The compositions of the steels used in this investigation are
given in Table I. These steels were examined to determine if they
satisfied the requirements set down for a reference material in a
study of brittleness in high strength steel:
a. The composition must be such that heat treatment will develop
high tensile strength.
b. The steel must have sufficient ductility at high strength levels
to permit tensile testing.
c. A relatively large quantity of steel from a single heat must
be available to permit completing the work with one steel.
d. The steel should be from a known source, and steel from different
heats of the same grade should be available from this source
for additional studies.
e. The steel must be in a for.m suitable for heat treating and
testing.
Some difficultywas experienced in obtaining quantities of steel
strip of the proper composition for this work. Bar stock which was
originally used is much more readily available.
Steel A was used only for preliminary work on developing heat
treating procedures and tensile testing techniques. It was not avai
lable in sufficient quantity to complete the study and its source was
unknown. This steel was in the form of ~ inch square bar stock and
was in the annealed condition. Uetallographic examination showed a
normal ferrite-coarse pearlite microstructure.
9

10
Table I. Compositions Of Steels Studied.
No. Steel c p Mn s Si Cu Ni Cr Sn
A AISI 1042 .49 .006 .?8 .022 .19 .06 .017 .046 .007
B Hot Rolled Bar .65 .012 .88 .026 .23 .16 .090 .047 .016
c Hot Rolled Bar .65 .013 1.0 .030 .23 .13 .076 .053 .018
D Hot Rolled Bar • 63 .012 .88 .037 .20 .14 .(162 .052 .010
E Strip .24 .023 1.14 .040 .09 .10 .030 .054 .015
F Strip • 61 .015 1.01 .052 .29 .27 .092 .069 .032

11
Steels B, C and D were part of a shipment of six steels from
different heats of carbon steel similar to AISI 1065. This material
was in the form of i inch round bars. It was received in short lengths
cut from a coil and was presumably in the hot rolled, air cooled
condition.
These steels were heated to l450°F and straightened by hammering
0 them on an anvil. The pieces were reheated to 1450 F, held at
temperature for one hour and slow cooled in the furnace.
Work was done on only three of the six heats because the cost
of machining round tensile test bars became prohibitive. As will be
mentioned below these test bars must be finished extremely well for
high strength steels and this required much shop time.
Steels B am ·C machined in a satisfactory manner, but steel D
did not. The machine shop complained of "hard spots 11 in steel D.
A metallographic examination of the six steels revealed a
coarse pearlitic structure in all. Steels B and C were essentially
completely lamellar pearlite with the microstructure shown in Figure
1. Steel D and the other three o t the six hea. ts all had partially
spheroidized pearlite in their microstructures. The microstructure
of steel D is shown in Figure 2. The .,hard spots" \Vere not revealed
in this examination,but there was reason to believe that additional
machining problems would be encountered with these steels if the
work were pursued.
The cost of the round tensile test bars was high, somewhere
between 110 and $15 per machined sample. In the e~rly stages of the
work_,heat treating difficulties were prevalent. Even if every sample
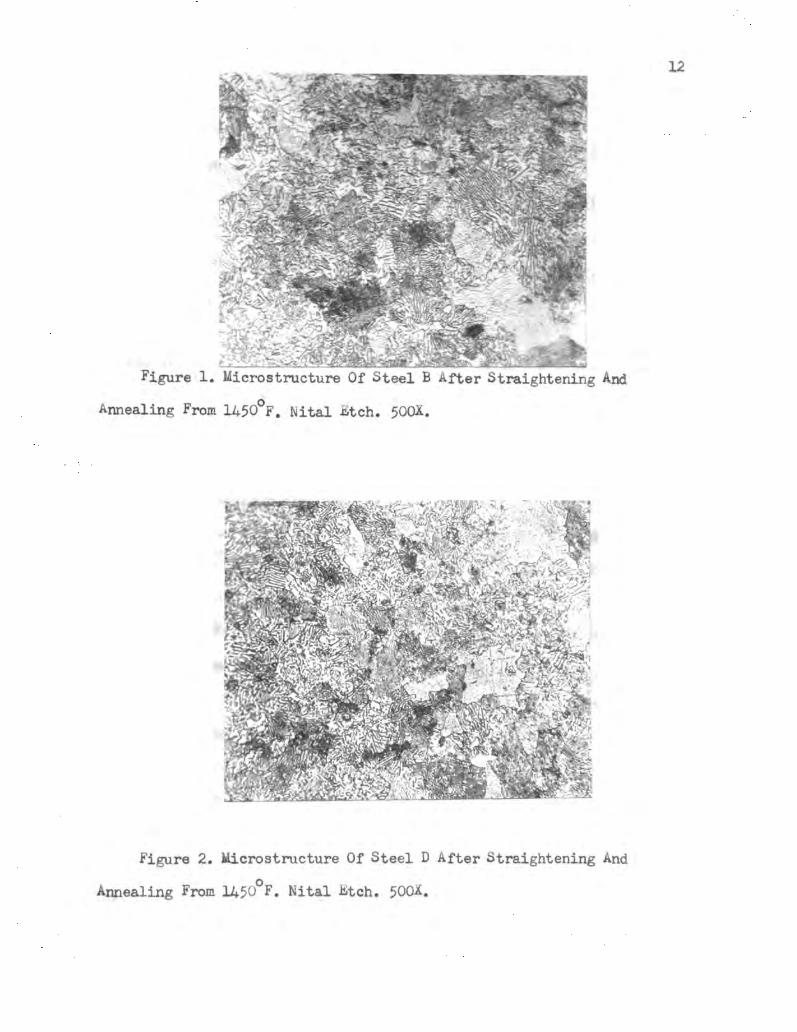
Figure 1. Microstructure Of Steel B After Straightening And
Annealing From 1450°F. Nital Etch. 500X.
Figure 2. Microstructure Of Steel D After Straightening And
Annealing From 1450°F. Nital Etch. 500X.
13
survived the heat treatment and yielded data, the cost of machining
the round test bars was considered excessive. It was decided to
change to a strip sample which would completely eliminate the cost
of machining tensile test samples. Strip samples could be cut from a
coil of material, heat treated and tested without machining.
It might be appropriate to mention here that the round samples
with threaded ends were originally selected to facilitate study of
static fatigue. Raring and Rinebolt (7) have described a simple and
inexpensive device for applying static loads to this type sample.
This device is very similar to a proving ring. The sample is held
by grips inside the ring. One of the pulling bars has a threaded
end extending through the ring. A nut on the outside of the ring is
tightened to obtain the load. Deflection of the ring is measured to
indicate the load. These rings eliminate the necessity of using expen
sive tensile testers for long time tests.
Steel E was obtained shortly after the round test samples were
abandoned and was claimed to be a high carbon strip. No analysis
was available at the time. For this reason,samples of the steel were
annealed and examined to estimate its carbon content. The relative
amount of ferrite and pearlite in the annealed structure of this
steel indicated its carbon content was no more than about 0.3 percent.
Subsequent analysis gave 0.24 percent carbon as shown in Table I.
While the carbon content of steel E was considered to be too
low,it was the only strip available and, therefore, it was used to
develop tensile testing techniques for this type sample.
Steel E had been anneal&d by heating to 1450°F and slow cooling

14
in furnace. This treatment put the steel in the spheroidized condition
shown in .Figure 3. Steel E was in the form of a coil of 0.047x0.747
inch strip.
~ventually a high carbon steel strip, steel F, was obtained
whose dimensions were 0.042x0.?64 inches. The chemistr.y of the coil
was acceptable but. this steel was obtained from a mill that rolled
very little strip of these dimensions. While the mill was more than
willing to supply material from their strip they had few heats to
draw upon. This bad news indicated that it would take years to
accumulate steels from a sufficient number of heats to do the proposed
work.A dj_fferent source of steel was located and six different
samples of strip were obtained. It was not possible to test any of
these steels because the tensile test jaws were damaged before the
steel arrived and no more tensile testing of strip could be done.
B. HEAT TREATING
Hardening was done in a Hevi-Duty electric muffle type furnace.
The work chamber measured 13 inches wide, St inches high, and 41
inches deep. The controller on the furnace held the temperature
within a temperature range of about l)-20°F when the furnace was
0 operated at about 1550 F,which was the most common austenitizing
temperature used in this study.
The furnace was heated to the desired austenitizing temperature
and held for several hours before the samples were quenched. The
temperature was measured at regular intervals during the heat treatment.
Several different procedures were tried to prevent distortion
of the round samples during hardenifl8. The procedure that was

Figure 3. Microstructure Of Steel E After Annealing From
1450°F. Nital Etch. 500X.
15

adopted as most suitable was to place a container of granular
hardwood charcoal in the furnace and lay the samples horizontally
on this bed of charcoal. This seemed to support the samples well
and keep them straight.
The strip samples were merely laid on the clean hearth of the
furnace during heating. Quenc.t:Ung was done in either water or oil.
16
There was no protective atmosphere in the furnace during
hardening. Several of the round tensile test bars were exarr~ned
after heat treatment to determine the extent of decarburization.
Hardness traverses were made on mer.allograf,hic samples with a Kent ron
microhardness tester. The Knoop hardness was measured and converted
into Rockwell C hardness. The hardness traverse data are shown in
Figure 4 and l''igure 5. ·rhe depth of decarburization was 0.004-o.oos
inches in the samples examined.
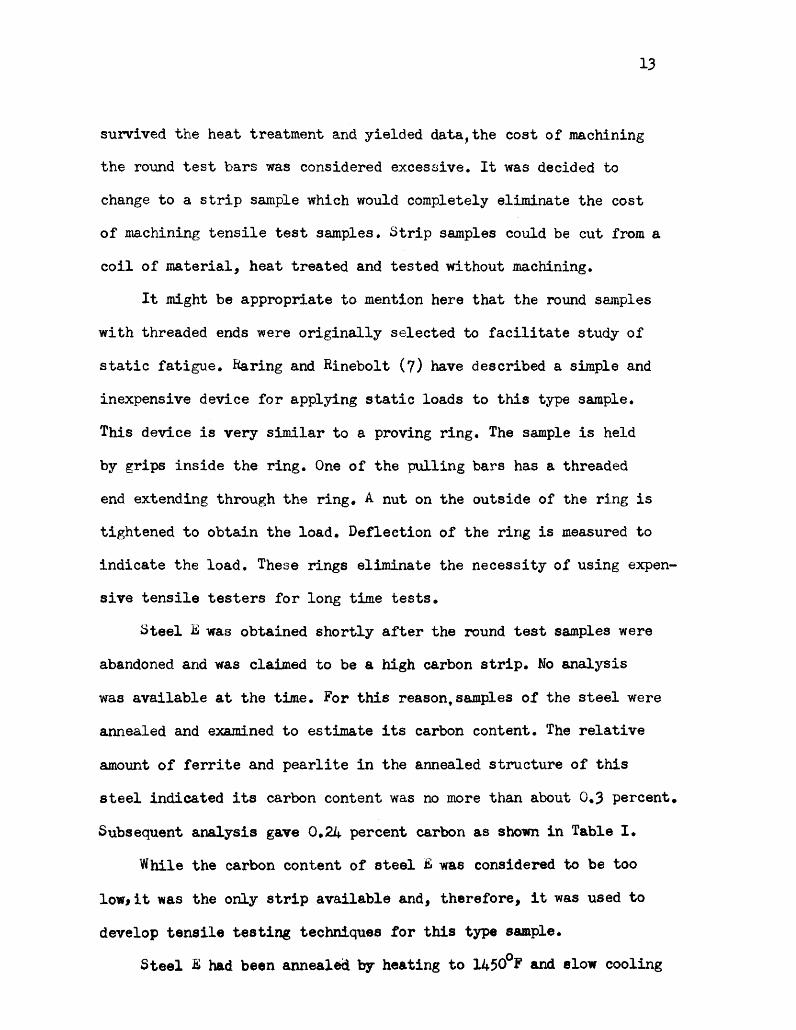
Several pieces of steel E were hardened with part of the piece
imbedded in the granular charcoal and part of the sample out of the
charcoal exposed to the air. Figure 6 shows the microstructure of
the surface that was covered by the charcoal while Figure 7 shows a
part of the surface exposed to the air. The layer of ferrite grains
on the surface covered by the charcoal indicates decarbur·ization
was more severe where the surface of the steel was in contact with
the charcoal.
It is possible that at the hardening temperature of 1550°F ,
the 00-00z-N2 atmosphere in the bed of charcoal yielded a scale on
the material that was less protective than the scale on that part of
the su~face exposed to air. The qxide layer on steel can interfere

o Sample A-2
6 Sample A-"/
x Sample A-5
.002 .004 .006 .008 .010 .012 .014 .016
Distance From Surface, Inches.
Figure 4. Hardness Traverses On Hard6ned Samples or Steel A
Showing Extent or Decarburization •.
65
• (.) 60 : : : ~ : (l)
~ 55 0 n:! ~
"' ~ 50 0 Sample G-2
~ ~ Sample C-3 :I: 45
~ Sample~
40
.002 .004 .006 .008 .010 .012 .014 .016
Distance From Surface, Inches.
Figure 5. Hardness Traverses On Hardened Samples Of Steel C
Showing Extent Ot Decarburization.
17
Figure 6. Microstructure At Surface Of 0ample Of Steel E
Hardened From l550°F.' Surface Imbedded In Granular Charcoal During
Heating. Nital Etch. 500X.
Figure 7. Microstructure At burface Of Sample Of Steel E
Hardened From l550°F. Surface Exposed To Air During Heating.
Nital Etch, 500X.
18

with decarburization.
Tensile test results obtained on steel A indicated that the
decarburization produced in the heat treating operation did not
prevent the attainment of tensile strengths of 300,000 psi.
19
Tempering was done in a second but smaller Hevi-Duty electric
muffle furnace. The work chamber of this furnace measured 7~ inches
wide, 5 inches high and 15! inches deep. This furnace was equipped
with an input controller as well as a temperature controller. A
temperature survey of this furnace showed that the maximum. temperature
variation was !2.5°F when the furnace was operated below 800°F.
The temperature variation was determined as a function of position
inside the furnace and as a function of time during the control cycle.
Several bricks were put in the tempering furnace to serve as
heat reservoirs. This m:l.nim.ized the temperature drop when the furnace
door was opened. The temperature was measured at frequent intervals
during tempering and it was found to hold within t2.5°F of the
tempering temperatures reported.
Unless otherwise stated in the results, samples were tempered
within one or two hours after hardening. Dut-ing this time the samples
were cleaned to remove scale and quenching medium and checked for
hardness. For a given tempering temperature,all the samples were
put in the furnace at the same time and·the,Y were removed individually
after the proper tempering time. All samples were.air cooled after
tempering.

C. TJ£N3ILE TESTING
Tensile testing hard steel samples requires much more attention
than the testing of the more common softer materials. In particular,
for hard, high strength steels special care must be exercised in the
preparation of round tensile test bars. Tool marks and other defects
in a sample which might not affect the results of a test on a soft
and ductile steel sample can cause premature failure in a hard
sample whose tensile strength is high and ductility low. The jaws
and/or grips are also important for high strength samples. The
sample must have freedom of movement to insure axial loading. Again,
a slight bending action might be tolerated by a soft sample but
usually not by a hard one.
As was mentioned above, the cost of machining round tensile
test bars was well over #10 per sample which is much more than the
usual machiPing charge for tensile test samples. This was because
of the special care that had to be exercised in the machining. The
first six samples were not machened with great care. They showed
20
tool marks and the threaded end sections were not perfectly concentric
with the gage length. These samples failed at these defects and it
is presumed that they did not give. good tensile test data. Subsequent
samples were more carefully machined and they were also polished to
eliminate tool marks. These more carefully machined samples failed
in the gage length and gave higher tensile strengths.
Figure 8 shows a round tensile test sample in the tester. The
pulling bar on the lower grip has been removed from the lower block
to show the ball and socket joint used in all tests.

Figure 8. Round T nsile Test Sample In Tensile Tester. ( Lower
Pulling Bar Displays Ball And Socket Joint).
Figure 9. Templin Grips ith ~trip Sample.
21

22
The method of holding the strip samples for tensile testing
is shown in Figure 9. The Templin grips were held by the same pulling
bars as were used for round samples.
Figure 10 shows a set of jaws. The pieces on the left in Figure
10 are the solid half of the jaw and show a side view on the top
and the serrated gripping surface at the bottom. The jaw on the
right side of Figure 10 consists of two pieces: a tapered piece
with a cylindrical seat and a half round piece with the serrated
gripping surface. The two piecea are shown together in the upper
jaw and separately in the lower jaw which shows a side view of the
half round and an oblique view of the cylindrical seat in the tapered
piece. These jaws and grips spread the gripping action uniformly over
a rather large area and allowed the sample sufficient freedom to
align itself for axial loading.
The tensile test samples used in this work were non-standard
samples. The round tensile test samples were 3/16 inch diameter. A
standard 3/16 inch sample should have a 3/4 inch gage length. A gage
length of 3 inches was used in this study. The longer gage length
was chosen to permit measuring larger elongation.
Strip samples were prepared by cutting a piece of strip about
10 inches long from the coil. There was no machining done on these
samples. There was at least 6 inches of sample between the grips.
Because of the small amount of elongation displayed by the
high strength steel it was decided to measure only the uniform
elongation outside the fracture zone of the sample. This procedure
avoided error due to improper alignment when assembling the two pieces

23
Figure 10. Jaws Used In Templin Grips For Holding Strip Samples.

of the sample after the test.
Elongation was measured by painting one side of the sample
and scribing a series of marks along the whole gage length. The
marks on both the round samples and strips were t inch apart. After
the srunple fractured in the tensile test,the marks on the longer
half of the sample were used·to obtain the elongation. In this way
the greatest amount of elongation possible was measured.
D. ELECTRON MICROSCOPY
While no actual results were obtained with the electron micro
scope, some effort was expended in attempting to prepare transmission
samples. Since this was the initial effort to prepare sruAples ot
this type at the University of Missouri at Rolla the work will be
described briefly.
The high strength steel samples must be thinned without altering
their structure. Preparation of the thin sections was attempted in
several ways: by electrolytic polishing, by chemical polishing, and
by mechanical thinning.
The literature on electrolytic polishing of metals is extensive
(8,9,10). Tegart (8) reviews the subject and gives many references.
The use of electrolytic polishing for electron microscopy is described
by Thoma.s ( 9).
For electrolytic polishing,an attempt was made to start with
stripaampiee that had been ground down to approximately 0.005 inches
on a belt grinder. The electrolytic polish was supposed to reduce the
sample to a thickness suitable for a. microscope sample. The edges of
the sample were painted with a stop-off lacquer before polishing.
25
The electrolyte and working conditions were:
~lectrolyte: 133 ml. glacial acetic acid., 25 grams chromium
trioxide and 7 ml. water.
Cathode: Stainless steel.
Temperature: 20°C.
Voltage: 20-25 volts.
Current density: 10- 15 amp/ dm2•
Very little success was had with this procedure because the sample
tended to be perforated rather than uniformly thinned. The only
thin material was at the edges of the holes. This thin material
was in a very narrow band and had a very steep thickness gradient.
It was not usable as a sample. Several regions were found in one
sample near the perforations which appeared to be thin enough for
examination by the electron microscope but they were ver.y small and
were never found in the electron microscope. The major difficulty
with this procedure was believed to be the nonuniform thickness of
the sample after the belt grinding.
It was believed that if a sample could be thinned by some mechanical
or other means to a unifor.m thickness of several ~usandths of an
inch, perhaps 0.002-0.005 inches, the electrolytic polishing procedure
might be much more successful.
Grinding the thin sections without heating the samples was a
problem. A device for slow grinding to avoid heating was constructed
and is shown in Figures 11, 12 and 13. In Figure 11, the metal cup A
rests on a spring B and is free to move up or down on the guides C.
A shaft D, is tumed by a l~boratory stirrer moter E. A bracket

Figure 11. General View Of Device For Thinning Samples For
Transmission Electron Microscopy.
Figure 12. Bracket nd Grinding Shaft Inside Of Thinning Device.
26

Figure 13. Interior Of Thinning Device Shol ing Sample In Place
Under Grinding haft.
27

welded to the inside of the cup and visible in Figures 12 and 13
kept the axis of the rotating shaft perpendicular to the bottom of
the cup.
The sample was clamped to the bottom of the cup beneath the
rotating shaft, Figure 13. A suspension of silicon carbide abrasive
with oil as the liquid medium was put in the cup. The motor was
28
turned on and the shaft was allowed to grind a thin spot in the sample.
A fin, attached to the bottom of the shaft stirred the oil and kept
the abrasive in suspension.
The rate of thinning with this device seemed to depend on how
well it was adjusted. It was not knovnn what the important variables
were but it was found that sometimes the grinding rate was ver,y slow
and sometimes relatively rapid. As a consequence of the inability
to control the rate of grinding no thin sections were produced. The
device ground holes in the samples because it was not practical to
watch it constantly and grinding always seemed to be unexpectedly
rapid toward the end of the process.
This grinding device seemed to have promise although there may
be better or faster procedures for producing thin sections. The device
was to be modified by incorporating a stop that would prevent grinding
away the thin section after it had been produced.
Chemical polishing (11) was also attempted as a thinning
procedure. Samples were immersed in a solution of 500 grams chromium
trioxide in 150 ml. concentrated sulfuric acid at room temperature.
The 0.047 inch and 0.042 inch strips became thin in the solution,but
they did not give thin sections of uniform thickness. The solution

dissolved the steel near the edges more rapidly than it dissolved the
central part of the sample.
29
Much additional work is needed on the preparation of transmission
electron microscope samples.

IV. EXPERIMENTAL KESULTS
A. STEEL A
This steel was a comercial grade of AISI 1042 steel. The supply
of this steel was very limited and it was used with the expectation
of merely developing heat treating and testing techniques. It
developed 300,000 psi tensile strength and was the only steel to
do so in this study.
This steel was hardened from 155cPF by quenching into water. It
was tempered at 4oaPF. There was not enough stock to per.mit study
of other tempering temperatures. The results are shown in Table II.
30
Table II gives the sample number, heat treating details,
information on cracking,and the tensile test results. The two columns
under 11 Cracksn indicate the location or any cracks that were observed
visually in the samples. An "x" in the "Center" column indicates
a crack was present within the gage length of the sample. An "x" in
the 11Ends" column indicates that a crack was found on one or both
of the threaded ends of the sample.
Samples A-1 to A-6 were the first six samples machined. The
machine shop was given the sample dimensions but no other special
instructions. These samples were machined without special care and
showed tool marks especially near the ends of the reduced section in
the radius area. A number of these samples failed at the location of
the tool amrks and indicated that much more care was needed in
machining the samples. ( See the bottom sample in Figure 14. )
The first six samples were not supported well during the hardening
operation and were no longer straight after heat treatment. This,

31
Table II. Heat Treatment Conditions And Tensile Test Results For Steel A.
Sample Heat Treatment Cracks T.S., E1on-No. Time at 15500F TemPer;Lng Center. Ends. 1000 gation,
II in:. Temp., ~F. Time, Min. psi percent.
A-2 30 400 15 X 275
A-3 30 400 15 229 o.o
A-4 30 400 60 279 2.0
A-5 30 400 120 X 208
A-6 15 450 60 X 240
A-1 15 1000 60 X
A-12 15 400 15 316 1.5
A-ll 15 400 30 X X 287 1.0
A-10 15 400 60 311 2.5
A-8 1$ 400 60 X 214 1.0
A-7 15 400 60 329 2.3
A-9 15 400 120 297 1.7
32
along with the poor machining,probably lowered the tensile test results.
Subsequent samples were machined much more carefully and were
polished with fine abrasive paper. These later samples were also
supported during hardening by a bed of granular charcoal which
prevented noticeable distortion. Table II shows that two of the last
six samples cracked during heat treatment and gave low test results.
The other four samples gave tensile strengths of 300,000 psi or more.
The elongation was measured outside the fracture area and does
not include local elongation which occurred in the vicinity of the
fracture. For this reason, the elongation data was especially low.
On the four good samples,the percent el~gation ranged between 1.5
and 2.5 percent. The reduction of area was measured on these four
good samples. Samples A-7 and A-12 showed 37.5 percent reduction of
area while samples A-9 and A-10 each shdwed 31.0 percent.
The appearance of some of the fractured samples is shown in
Figure 14. The top two samples were two good samples, A-10 and A-12.
The large amount of necking is visible on these samples.
The third and fourth samples from the top in Figure 14 are A-1
and A-8, respectively, and showed the effect of cracks. A-1 had a
longitudinal crack within the gage length and this sample failed in
the cracked region. Sample A-8 showed a crack in the threaded end
section and it failed at the cracked end. The heat treating cracks
usually could be seen on the samples after heat treating. They were
readily visible with a lOX magnifying glass and some could be seen
with the unaided eye.
The bottom sample in Figure 14 is A-3,and it showed the effect

33
Figure 14. Fractured 1'ensile Test Samples Of Steel A.
of poor sample preparation. The radius on this sample did not blend
in well with the reduced section and it also showed tool marks. The
sample failed at the radius under a relatively low load.
B. STEELS B, C AND D
34
These steels of approximately 0.65 percent carbon were water
quenched from 1550°F. Since a large portion of the samples cracked,
the effect of quenching temperature was investigated in an attempt to
reduce or eliminate this cracking. Table III showa the results of
quenching steel B from lower temperatures. Small samples, ~ inch
diameter by 3/16 inch thick, were austenitized at 1425, 1450 and
1475°F for 15 minutes and water quenched. The 1425°F sample cracked
and did not hard en as much as the others • This indica ted that quenching
would have to be from at ieast l450°F and also that a milder quench
should be used.
The study of quenching procedure was not continued because it
was decided that the cost of machining round tensile test bars was
too high. It was decided to abandon these steels and to change to
a strip type tensile test sample.
The data accumulated on steels B, C and D before the work on
them was discontinued are shown in Table IV. Most of the samples had
cracked during heat treating. The tensile strengths were relatively
low and the elongation was zero on all samples. Some of the samples
expanded so much during heat treating that the threaded ends would
not fit the grips. Nothing was done to correct this defect because
most of these samples were cracked. These samples are indicated by

35
Table III. Effect Of Hardening Temperature On Hardness And Cracking
Tendency Of Steel B
Austenizing Hardness Tem5erature Crack ( Rockwell C ) Microstructure
F
Side 1: 60,62,54,58. Banite and 1425 X
Side 2: 59,61,62,63. Martensite
Side 1: 62,62,63,63. 1450 Martensite
Side 2: 63,62,63,62.5.
Side 1: 63,62,62,63. 1475 X Ma.rtensi te
Side 2: 63,63,63,63.

36
Table IV. Heat Treatment Conditions And Tensile Test Results For
Steel B, C And D.
T.S. ~1.on-Sample Hardenine: Tem:eering Crack 1000 gation,
No. Temp., <5F. Time,:Min. Temp.,°F. Time,Min. Center. Ends. psi Percent
B-3 1550 15 300 30 X
B-4 1550 15 300 60 X 61.5 o. B-1 1550 15 400 30 XX
B-2 1550 15 400 60 1.42 o. B-5 1475 15 500 30 X 163 o. B-6 1475 15 500 60 X 109 o. B-7 1475 15 600 30 238 o. B-8 1475 15 600 60 X it
B-9 1475 15 800 30 X * B-10 1475 15 800 60 * B-11 1475 15 1000 30 X * B-12 1475 15 1000 60 X * C-3 1475 15 300 30 192 o. C-4 1475 15 300 60 X X 60 o. C-1 1475 15 400 30 X 152 o. C-2 1475 15 400 60 218 o. D-1 1450 15 X ~-
D-2 1450 15 X * D-3 1450 15 X *
* Sample was not tested because the sample would not fit into grips
after heat treatment.

37
an asterisk in the tensile strength column.
Figure 15 shows a number of the fractures in these steels.
Cracks were found in all of these samples except the one on the lower
right. The left and middle samples in the upper row had longitudinal
cracks within the gage length. The cracks can be seen starting at
the lower edge of these samples and running in toward the center.
The upper right and lower left samples had circumferential cracks
in the threads and failed at these oracks. The lower middle sample
had a longitudinal crack running from the reduced section to the
end of the sample. This sample and the lower right sample failed
at the end of the reduced section. None of the samples of steels
B, C or D showed any measurable elongation or reduction of area.
C. STEa E
Metallographic examination of annealed samples of steel E
indicated a carbon content of 0.3 percent or less instead of the
0.60 percent carbon that was desired. In the work on steels B, C and
D, it was found that water quenching caused cracking, therefore, oil
quenching was used on the high carbon steels. It was decided to try
water quenching on this lower carbon steel. For this reason samples
were quenched in oil and water to detenn.ine the most suitable quenching
procedure for this steel. These samples were austenitized for 12
0 . 50 minutes at 1550 F, quenched, and tempered at 41 F. The results of
this work are shown in Table V and Figure 16. None of these samples
cracked. Water quenching gave higher tensile strengths. These data
indicated water quenching should be used on this steel and it was

Figure 15. Fra·ctures In High Carbon teel Round Tensile
Test Samples.
38

39
Table V. Effect Of Quenching Medium On Steel E.
Quench Medium Tempering Time, Min. T .s., 1000 psi
Water 15 188
Water 30 190
Water 60 188
Water 120 185
Oil 15 179
Oil 30 185
Oil 60 184
ou 120 180

. •n
200
& 190 0 0
~
160
o Water Quench
A ·.Oil Quench
60 120
Tempering Time, Minutes.
Figure 16. Effect Ot Quenching lledium On The Tensile
Strength Ot Steel B.
40

41
adopted in all subsequent heat treating.
Table VI gives the results obtained on steel ~. rf.he samples
0 0 tempered at 240 F and 380 F were hardened together from a temperature
0 0 between 1550 F and 1650 F. The other samples were all hardened from
l550°F. The austenitizing time was 15 minutes. The samples tempered
at 240°F and 380°F were left at room temperature over night before
tempering. All the other samples were tempered immediately after
quenching. Tempering temperature and time are shown for each
sample in Table VI.
The hardness of each sample was measured at one or both ends
after quenching and again after tempering. This served as a check
on the heat treating procedure. The final hardness is recorded in
Table VI. After tempering at l000°F and 1200°F the hardnesses fell
below the Rockwell C scale and final hardness was not measured on
these samples.
The last column indicates by an "x11 that the fracture extended
into the portion of the sample held by the jaws. While low tensile
test results might be expected from samples that failed in the jaws,
this did not appear to be true for all samples • .Samples with low
ductility and low tensile strength tended to be samples that failed
in the jaws. However, there were other samples that failed in the
jawsand did not give low tensile test data. The tensile strength data
for steel E are shown as a function of tempering time with tempering
temperature as the parameter in Figure 17. The highest tensile strengths
were obtained. at -the lowest tempering tempe~a ture of 240°F. The tensile
strength decreased with increase in tempering temperature as would

42
Table VI. Heat Treatment Conditions And Tensile Test Results For Steel E
s-ample Tem~ring T. s., Elongation, Hardness, Failed No. TewP·' Time, 1000 flsi percent Rockwell C in
-' F Min. Jaws E.:..~o 159 o. 50 X
E-1* 240 5 186 0.5 46 X
E-2* 240 5 153 o. 48 X
E-3 240 15 204 2.6 48 E-4 240 15 211 2.1 48 E-5 240 30 206 1.8 48 E-6 240 30 2~ 2.6 48 E-rr•- 240 60 205 2.3 48 X
E-8 240 60 210 3.1 48 E-9 240 120 209 2.9 47 X
E-10* 240 120 153 o. 48
E-ll 250 5 200 48 E-12 250 5 135 o. 50 X
E-13 250 10 209 1.5 49 E-14 250 10 206 1.6 49 E-15 250 15 199 1.3 47 E-16 250 15 2(]7 1.3 48 X
E-17 250 30 202 1.4 49 X
E-18 250 30 199 1.5 47 X
E-19 250 60 2Cfl 1.6 50 X
E-20 250 60 206 49 E-21 250 90 205 1.6 48 E-22 250 90 208 49 E-23 250 120 202 2.5 48 X
E-24 250 120 204 2.3 48
E-25 380 5 199 0.5 48 X
.E-26 380 5 201 2.2 48 X
E-27 380 15 202 2.6 46 E-28 380 15 175 o. 46 X
E-29 380 30 200 2.7 46 X
E-30 380 30 199 3.1' 45 E-31 380 60 192 3.1 44 E-32 380 60 190 3.6 43 E-33 380 120 188 2.3 44 X
E-34 380 120 190 2.6 43 X

43
Table VI. ( Continued )
Sample Tem:eering T. s., Elonp;atinn, Hardness Failed No. Tamp., Time, 1000 psi percent Rockwell C in
F Min. Jaws E-35 445 5 19'7 2.7 48 E-36 445 5 202 2.5 47 E-37 445 10 198 1.) 47 X
E-38 445 10 198 1.3· 47 E-39 445 15 193 46 E-40 445 15 194 1.9 46 E-41 445 30 188 2.4 43 E-42 445 30 192 44 X
E-43 445 60 184 1.5 41+ X
E-44 445 60 185 1.0 44 X
E-45 445 90 173 42 X
E-46 445 90 181 1.6 44 E-47 445 120 183 43 E-48 445 120 181 2.0 43
E-49 1000 5 124 4.0 E-50 1000 5 113 1.6 E-51 1000 5 119 2.0 E-52 1000 15 111 2.8 E-53 1000 15 108 1.8 E-54 1000 15 108 4.5 E-55 1000 30 103 4.0 E-56 1000 30 108 4.7 E-57 1000 30 105 5.7 E-58 1000 60 105 3.9 X
E-59 1000 60 99.5 5.8 E-60 1000 60 1r::J7 4.8
r.:-61 1200 5 95 5.2 E-62 1200 5 92.5 ?.l E-63 1200 5 97 7.8 E-64 1200 15 89 7.0 E-65 1200 15 89 7.8 E-66 1200 15 89 8.8 E-67 1200 30 86 10.0 E-68 1200 30 86 7.9 E-69 1200 30 88 7.8 E-70 1200 60 76 7.8 E-71 1200 60 74.5 12.5 E-72 1200 60 71.7 10.0
* Fractured perpendicular to stress axis in a brittle manner.

44
210 240°F ')(
~ " It 25cPF 200
)(
190 A 380°F A
415°P cr
180 445°F
d
• 170 •ri
240°F Tempering Temp. (I) 0 ~
8 160. 0 )( 250 F Tempering Temp. rl
4 0
~ 380 F Tempering Temp. .c: ~ 150
b 415°F Tempering Temp~ t: I) ~
~ 140 d 445°P Tempering Temp. G)
~. • 1000°P Tempering Temp. 0)
-== 130 Q) 0 foot 9 1200 P Tempering Tamp.
70 s-1015 30 4S 60 90 120
Tempering Time, Minute.
Figure ·17. TeneUe Strength Data Obtained On Steel E.

45
be expected. At 240°F,tenaile strength did not fall off with tempering
time up to two hours. Samples tempered at higher temperatures showed
a decrease in tensile strength, the decrease was greater and more
rapid the higher the tempering temperature.
The elongation measured on these samples was the uniform
elongation measured outside the fracture zone. This elongation data
was low,and might be somewhat lower than a conventional elongation value
which includes localized elongation in the fracture area where the
sample necks do\~. In many of these samples necking was relatively
small and a conventional elongation value might not have been different
from the uniform elongation actually measured. The elongation data
for tempering temperatures between 240°F and 445°F were between 1.5
and 3.0 percent. 'fhese data are tabulated in Table VI and shown as
a function of tempering time in Figure 18.
The higher tempering temperatures were used to put the steel into
a ductile condition in order to determine the magnitude of the uniform
elongation for a ductile material. Tempering at 1000°F gave an elongation
of only about 5.0-5.5 percent while l200°F gave 10.0-11.0 percent.
In spite of the low values of elongation, the appearance of
the fractures (dtscribed below) on most of these samples indicated
that the samples failed with a ductile shear type fracture. In
addition, samr;les i-12 and £i-29 gave fractures that appeared to be
ductile but their elongation was nil. All the other samples of this
steel gave ductile fractures and measurable elongation.
Figures 19 and 20 show different fractures found in the st-rip
samples and will be used to clarify the fracture terminology used

46
12
11
12ocPP 10
0 0 240 F Tempering Temp.
9 '·X 0 250 P Tempering Temp.
0 ·6 380 F Tempering Temp.
8 d 0
445 P Tempering Temp • • ~7 0 • 1000 F Tempering Temp. Q) () ~ '1200°F Tempering Tamp. Q)
p.. 6 ~ ·, ': .~ ~ 0 ' '.
•rt . :~ '; ...,. ~5 l000°P
s &14
24cPF 3
)800F 4 ~ A
2 445°P ~
250°P 1
0
5 1015 30 45 60 90 12>
Tempering Time 1 Jlinute.
Figure 18. El.onga tion Data Obtained On Steel E.

Figure 19. Side View Of Fractures In Strip Samples. About 1.5X.
igure 20. ~ge Vi~ Of Fractures In Strip Samples.
(Near Ed e Of Samples as Ground Flat To how The Nature Of
Fracture '~rface Better).About 2X.
47

in this thesis.
Ductile fractures in strip samples were either 1145° to the
edge" or "45° to the side" of the sample .• The two samples at the
left in Figure 19 and the second sample from the left in Figure 20
show fractures at 45° to the edge of the sample. The edge view of
the latter sample in Figure 20 shows an appreciable necking and
reduction of area.
The two samples on the right side of Figure 19 show fractures
at 45° to the side of the sample. These fractures are more or less
' 0 at 90 to the edge of the sample. However, the edge view of this
type sample on the left in Figure 20, shows that the fracture is not
perpendicular to the stress axis. The fracture is at approximately
45° i h , to the s des of t e samp~e.
The ductility indicated by the fractures varied. The fracture
surface of the lower left sample in Figure 19 is straight and smooth
48
and is typical of samples showing higher elongation values. This type
fracture could be expected to show necking such as that in the second
sample from the left in Figure 20. On'the other hand, fractures at
45° to the edge of the sample might display a zig-zag path of fracture
such as that shown by 1)pper left sample in Figure 19. '!'his zig-zag
type fracture was found in samples showing lower ductility and less
necking than the straight fractures at 45° to the edge of the sample.
The fractures at 45° to the side varied too. The sample at
lower right side of Figure 19 showed a more or leas smooth and straight
fracture surface. The upper right sample in Figure 19 showed a small
part of the fracture on the right side of the sample at 45° to the

49
edge of the sample. The remaining portion of the fracture was somewhat
discontinuous. In two areas the fracture surface can be seen running 0
-down at 45 to the near side of the sample. Near the center the fracture
surface cannot be seen because it runs up at 45° to the near side of
the sample.
Some fractures appeared to be cleavage or brittle type fractures.
The two samples on the right side of Figure 20 were this type and
showed fracture surfaces that were perpendicular to the stress axis.
~xcept for the four samples ~1, E-2, ~?-and b-10, which gave
brittle fractures, all samples of steel b failed with ductile fractures
at 45° to the edge of the sample. Samples tempered at lower temperatures
and for shorter times showed zig-zag fracture paths while the higher
tempering times tended to give samples whose fractures were straight
and smooth.
D. STEEL F
~rhis high carbon strip with 0.61 percent carbon was hardened
by austenitizing at 1550°F for 15 minutes and oil quenching. A
number of samples of this steel had been quenched in water and
all of these samPles had cracked.
The samples tempered at 550°F and 700°F were hardened at the
same time as the 400°F tempered s8Jllples but their tempering
temperatures were not decided until after the tensile test results
on the 400°F samples were examined. For this reason the samples
tempered at 550°F and 700°F were not tempered right after hardening.
These samples were kept for two days after hardening before tempering.

In order to minimize the possibility of cracking during this two
days the sampes were kept in an oven at l50°F. All the other
samples were placed in the tempering furnace within two hours after
quenching.
'rhe results of the heat treating of steel F are shown in Table
VII in Figures 21 and 22. The highest tensile strength was found in
the samples tempered at 600°F. The tensile strength decreased as
the tempering time increased when samples were tempered at 600°F
and above. Tempering below 600°F caused tensile strength to increase
as tempering time increased up to about one hour. Samples of steel F
were not tempered more than one hour but the curves in Figure 21
indicate that at 400°F and 550°F the tensile strength may reach a
maximum after about one hour.
The ductility was essentially constant for all tempering times
used at each tempering temperature except 650°F. At 4000F the
ductility was nil for all tempering times.
At 400°F the fractures were perpendicular to the stress axis.
These fractures were similar to the brittle fractures in the two
samples on the right side of Figure 20. Samples tempered at 550°F
and higher had fractures which were both 45° to their sides and
45° to the edges. As shown in Figure 23 a part of the fracture at one 0
or both edges of the sample was at 45 to the edge of the sample
while the remainder of the fracture was at 45° to the side.
Three samples were tempered at l200°F as indicated in Table VII.
The sample tempered for 15 minutes had been water quenched and
had a transverse quench crack. This sample failed at the crack and
showed a brittle fracture after tensile testing. It gave a low
50
51
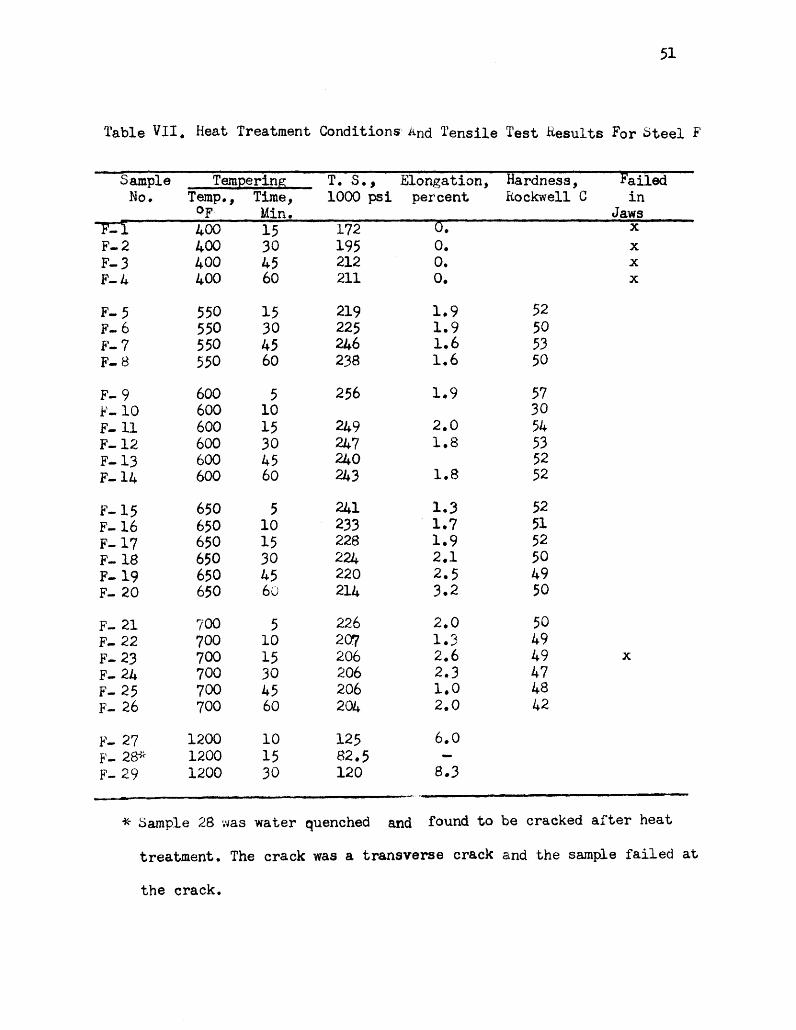
'fable VII. Heat Treatment Conditions· And Tensile Test Results For Steel F
Sample TemEering T. S., Elongation, Hardness, Failed No. Temp., Time, 1000 psi percent ft.ockwel1 C in
OF Min. Jaws F-l 400 15 172 o. X
F-2 400 30 195 o. X
F-3 400 45 212 o. X
F-4 400 60 211 o. X
F- 5 550 15 219 1.9 52 F-6 550 30 225 1.9 50 F-7 550 45 246 1.6 53 F-8 550 60 238 1.6 50
F- 9 600 5 256 1.9 57 F-10 600 10 30 F-11 600 15 249 2.0 54 F-12 600 30 247 1.8 53 F-13 600 45 240 52 F-14 600 60 243 1.8 52
F-15 650 5 241 1.3 52 F-16 650 10 233 1.? 51 F-17 650 15 228 1.9 52 F-18 650 30 224 2.1 50 F-19 650 45 220 2.5 49 F- 20 650 60 214 3.2 50
F- 21 700 5 226 2.0 50 F- 22 700 10 2CTI 1.3 49 F- 23 700 15 206 2.6 49 X
F- 24 700 30 206 2.3 47 F- 25 700 45 206 1.0 48 F- 26 700 60 204 2.0 42
F- 27 1200 10 125 6.0 F'- 2~~ 1200 15 82.5 F- 29 1200 30 120 8.3
* .Sample 28 was water quenched and found to be cracked after heat
treatment. The crack was a transverse crack and the sample failed at
the crack.

'\ . '
260
250-
5 10 15 45
o 4ocPF Tempering Temp. x. 5500F Tempering Temp. • 60CPF Tempering Temp. a 6Srf? Tempering Temp. q 700°F Tempering Temp.
60
Tempering Time, Minute. ,,.-
Figure 21. TeneUe .strength Data Obtained On Steel F.
52

·s 10 15
•
.30
0 o 400 F Tempering Temp. JC 55cPF Tempering 'l'emp. • 60cPF Tempering '1' emp. d 65rPF Tempering 'l'emp. ~ 7ooPP Tempering Temp •
• •
45 60
·rempering Time, Minute.
Figure 22. Elongation Data Obtained On Steel F.
53

54
Figure 23 . Side Vievlf Of trip Samples Of Steel F. About 1. SX.

tensile strength. The other two samples gave elongations of 6.0 and
8.3 percent and it is interesting to note that the fractures in
these two sampleswere at 45° to the edge. These fractures were
straight with no zig-zag components.
The two samples on the left side of igure 23 displayed an
effect which was not easy to show in a photograph and which was
not observed in any of the other steels • A thin region where shear
deformation had occurred could be seen in these samples. It started
at one edge of the fracture and extended across the sample at an
angle of 45°. This region is the light line starting at the left
edge of the fracture and running upward and to the right of the
upper left sample in Figure 23. The lo er sample on the left side
of Figure 23 shows the region as a dark appearing streak starting
at the right side of the fracture and running downward and to the
left. The metal in this thin region had deformed by a shearing action
during the tensile test. Many of the samples of steel F showed this
shear band.
55

56
V. DISCUbSIOl·~ OF Rl!SULTS
Tensile testing of hardsteels whose tensj_le strengths are high
and elongation low presents a somewhat different problem from the
testing of steels at more common strength levels with their relatively
high ductility. Much more attention to sample preparation and testing
technique is necessary to obtain meaningful test data from the hi~h
strength material.
Except for fibers and thin strip, a certain amount of ductility
is necessary otherwise tensile testing is difficult regardless of care
exercised in performing the test. For various reasons which are dis
cussed below, it is believed that only steel A of the various steels
studied in this investigation can be considered to be a "ductile
materialn after it has been heat treated to high strength levels.
It seems reasonable to assume that ductility limits the load
that can be applied to a sample of a high strength steel. ~pparently
high strength steel becomes notch sensitive. Because of this, failure
is initiated by imperfections in the sample when the amount of elon
gation possible is low. When the ductility of the material is high,
the imperfections are not so effective in initiating failure. The
imperfections can be due to sample preparation such as tool marks
or internal or structural imperfections such as inclusions.
The first six samples machined from steel A demonstrated the
importance of s~~ple preparation. These samples had tool rr~rks and
other machining defects. Sample A-3 failed under a load corresponding

57
to a tensile strength of 229,000 psi while A-4 failed at 279,000
psi, Table II. Samples A-12,A-10 and A-7 were machined well and were
also kept straighter during heat treatment than the above two samples.
A-12 was given the same heat treatment as A-3. A-12 developed 316,000
psi and 1.5 percent uniform elongation. A-10 and A-7 had the same
heat treatment as A-4 and these two samples ~howed 311,000 psi and
329,000 psi at 2.5 percent and 2.3 percent elongation, respectively.
i-olishing the surfaces of samples A-12, A-10 and A-7 apparently
increasr3d the load carrying ability of these samples measurably.
In Figure 24, the tensile strengths of the eight S8..!'!t.ples of' steel
A are plotted against their elongation 'Nithout consideration for the
variation in heat treatment. The amount of data is very limited but
it does indicate a tendency for samples with more elon._gation to give
higher tensile strength. A tendency of high strength steels to
show higher tensile strength as elongo.tion increases was also observed
by Kisslinger (4). A tendency for measured strength to be higher when
elongation is greater in high strength steel may mean th~t the samples
always fail because of notch sensitivety. Notches or stress raisers
of one kind or the other are always present and may be initiating
failure. Apparently, the more plastic deformation possible in the
sample the less sensitive it is to the im.perfections and the larger
the load it will support. Therefore, a higher· strength might be
measured as elongation increases even though the actual strength of
the sd.Inple may not change appreciably.
In addition to the ductility of the sample affecting the tensile
test resultS when testine: hi:::;h strength steels, the tensile testing
technique also is a very important consideration. Toward the end of

0
0 0
Q
0
220'-i 0
o.o 0.5 1.0 1.5 2.0 2.5 3.0 3.5
Elongation, Percent.
Figure 24. TensUe Strength-Elongation Relationship Observed
For Steel A.
58

59
this study six different strip steels were received. Samples from
these steels were heat treated.but when they were ready for tensile
testing it was found that the jaws used for this work had been misused
by someone and damaged. It was not possible to test the samples of
these six steels with the damaged jaws. An attempt was made to test some
of these samples in other tensile testers with different types of
jaws that did not give the sample the freedom given by the Templin
grips (shown in Figure 9). ~very attempt at testing the samples with
the other grips resulted in failure inside the jaws at very low loads.
Several dozen tests were tried with no meaningful results. No data
could be collected on the six steels.
The first six samples of steel & were heat treated in such a
manner that they suffered appreciable distortion. It is not possible
to say how this affected tensile test results, but this defect in the
samples probably had an effect. Distortion,which would cause a bending
action during tensile testing,is probably more important the larger
the cross section of the sample. In relatevely thin samples,such
as the strip of approximately 0.040-0.050 inch thickness., very appre
ciable distortion of the strip can be tolerated.
The importance of quenching medi1w in the hardening operation
was indicated by the work done or the higher .carbon steels studied.
Water quenching was apparently too severe for steel of 0.6o-0.65
percent carbon. ~en though cracks were not found in some of the
samples of steels B, C and D,the low tensile test results on these
steels may indicate that all the samples were damaged by water

60
quenching. All the samples of steel F that were water quenched showed
quench cracks.
Ductility is a relative ter.m. Because elongation of high strength
steel is low,a non-standard sample and procedure was adopted in this
study to measure uniform elongation outside the fracture zone. It was
anticipated that:. this might give a better indication of ductility
than conventional elongation data. The elongation measured in this
study is undoubtly lower than the elongation that would be obtained
on standard samples using conventional procedures. The samples of
' 0 0 steel ~ tempered at the high temperatures, 1000 F and 1200 F, give
some indication of the comparison between the uniform elongation
measured here and conventional elongation.
Samples of steel ~ tempered ;.for one hour at l000°F. ·and l20o0F
should have been in a relatively ductile condition. At 1000°F this
steel showed about 5.5 percent unifor.m elongation while at 12ooPF
it gave about 10 percent. An indication of comparable conventional
elongation of ductile sheet steel can be found in the data in the
Metals Handbook (12). The elongation of three classes of low carbon
sheet steel of "commercial quality" and '1o·rawing quality" is given to
be in the range of 30-45 percent. This conventional elongation data
was obtained on sheet metal samples of 2 inch gage length and i inch
width. On this type sample,the local elongation at the fracture area
of a ductile steel apparently is a large part of the total elongation
measured. bince the 0.24 percent carbon in steel ~ may be higher than
the carbon content of the steels covered by the Metals Handbook,
steel~ may not be as ductile as the sheet steel&But it seems reasonable

to believe that the steel E samples,after tempering at l000°F or
1200°F,would have given a conventional elongation, were they tested
as standard sheet samples, much closer to the 30-45 percent reported
in the Metals Handbook than to the 5-10 percent as measured in this
study.
The type of fracture in the strip samples seemed to be related
to the ductility of the material. A fracture at 45° to the edge of
61
the sample appeared to indicate more ductility than fractures at
0 45 to the side of the sample. The lower carbon steel E was considered
to be more ductile than the higher carbon steel F. Fractures in steel
E were at 45° to the edge. Samples tempered at lower temperatures
and for shorter times gave fractures at 45° to the edge which were
not straight but zig-zag shaped. At higher tempering temperatures
and longer times the fractures became straight. Steel F samples showed
brittle type fractures after 400°F tempering. Tempering at 55cPF to
700°F gave samples that fractured at 45° to the side. The more ductile
samples tended to show fracture surfaces which were composed of
segments, some segments at 45° to the edge and some at 45° to the
side. Samples of steel F tempered at 1200°F fractured at 45° to
the edge.
These observations indicate that high strength strip samples
of very low ductility tend to give fractures that are perpendicular
to the stress axis. Somewhat ductile samples fracture at 45° to the
side of the strip while the more ductile samples fracture at 45° to
the edge. The type of fracture surface indicates the relative amount
of ductility in strip samples.

62
B. COMPAH.ISON OF' STEELS SWDI:BD
Steel A which was used for the preliminary work on heat treating
and tensile testing was the only steel used in this study that appeared
to possess sufficient ductility at high strength to permit attaining
300,000 psi in a tensile test. As indicated above.this steel indicated
a tendency to show an increase in tensile strength as elongation
increased. This is believed to be the behavior of a steel that is
ductile at high strength.
Steel A showed 31.0-37.5 percent reduction of area at the
300,000 psi strength level. The ductility was sufficient to permit
reaching 287,000 psi tensile strength and 1.0 percent elongation in
a cracked sample, A-11. None of the other steels gave any measurable
elongation in cracked samples.
It should also be recognized that the heat treatment of steel
A cou.ld not be explored because of a lack of stock. The only tempering
temperature used on this steel was 400°F. This temperature produced
samples that showed over 30 perc~nt reduction of area. This indicated
that a lower tempering temperature could be used to get even higher
tensile strength than the slightly more than 300,000 psi measured.
It is believed that steel A would easily show tensile strengths over
350,000 psi if samples were heat treated properly.
Steel A is probably the type of steel that was being sought as
a reference material; a steel that is ductile at high strength
levels. Unfortunately,the steel was not available in sufficient
quantity to permit study, its source was unknown,and it was in a
form that required machining of tensile test samples.
Steels B, C and D did not yield samples that were considered to

63
be ductile and of high strength. However, the quenching procedure used
was not suitable for these steels and it is probable that an
insufficient amount of work was done on these steels to evaluate
their characteristics.
On the basis of the results obtained in this stuqy,steels E and
F did not appear to be ductile when heat treated for high strength.
It is possible that the tensile strength attainable in steel E was
limited because of its low carbon content and that attaining 300,000
psi in this steel was not possible. Steel E was of relatively low
carbon content and was appreciably more ductile than steel F. However,
it would appear that even steel E was not particularly ductile
when heat treated in a manner intended. to produce its maximum tensile
strength.
One reason for thinking steels ~ and F were not ductile at high
strength was the observed relationship between hardness and tensile
strength in these steels. The samples of steel E that showed tensile
strengths.in the range 200,000 psi to 210,000 psi had hardnesses of
about Rockwell C 48. According to the correlation between hardness
and tensile strength given in ASTM Spec. E48-43T (13), Rockwell C
48 should be equivalent to 230,000 psi. Since the correlation is
only considered to be accurate to about 10 percent it might appear
that E followed the correlation. However, it is considered significant
that the strength of steel E is low.
Samples of steel A had hardnesses of about Rockwell C 56-57
which should correspond to tensile strengths of about 295,000 to
305,000 psi. The samples of steel A had tensile strengths of

297,000 psi to 329,000 psi and three of the four values were greater
than 305,000 psi.
64
This observed relationship between hardness and tensile strength,
and the apparent tendency of the measured tensile strength of high
strength steel to be higher as ductility increases,leads the author
to believe that if steel E were ".ductile If, its measured tensile
strength would be much higher; its tensile strength would be 230,000
psi or more. Steel F also showed a measured tensile strength lower
than the hardness-tensile strength correlation value. ~amples of
steel F with tensile strengths of about 250,000 psi had hardnesses
of about Rockwell C 53-54 which is equivalent to a tensile strength
of about 275,000 psi. Sample F-9 had a hardness of Rockwell C 57
which is equivalent to 305,000 psi while the measured tensile strength
was only 256,000 psi. It should be mentioned that this sample was temper
ed only 5 minutes and this short tempering time could be responsible
for low ductility. In any event, steel F like steel ~,did not give
strengths er1ual to those of the hardness-tensile strength correlation,
and it is believed this could be due to a lack of ductility.
It is interesting to examine the relationship between tensile
strength and elongation in steels E and F. The data are shown in
Figures 25 and 26. In Figure 25,the strengths of the steel E samples
tempered at 240°F, 250°F and 380°F have been plotted against their
elongation and in Figure 26 the corresponding data are shown for steel
F samples tempered at 550°F, 600°F and 650°F. For steel E,the elongation
covered a range of approximately 1.5-3.0 percent while tensile strength
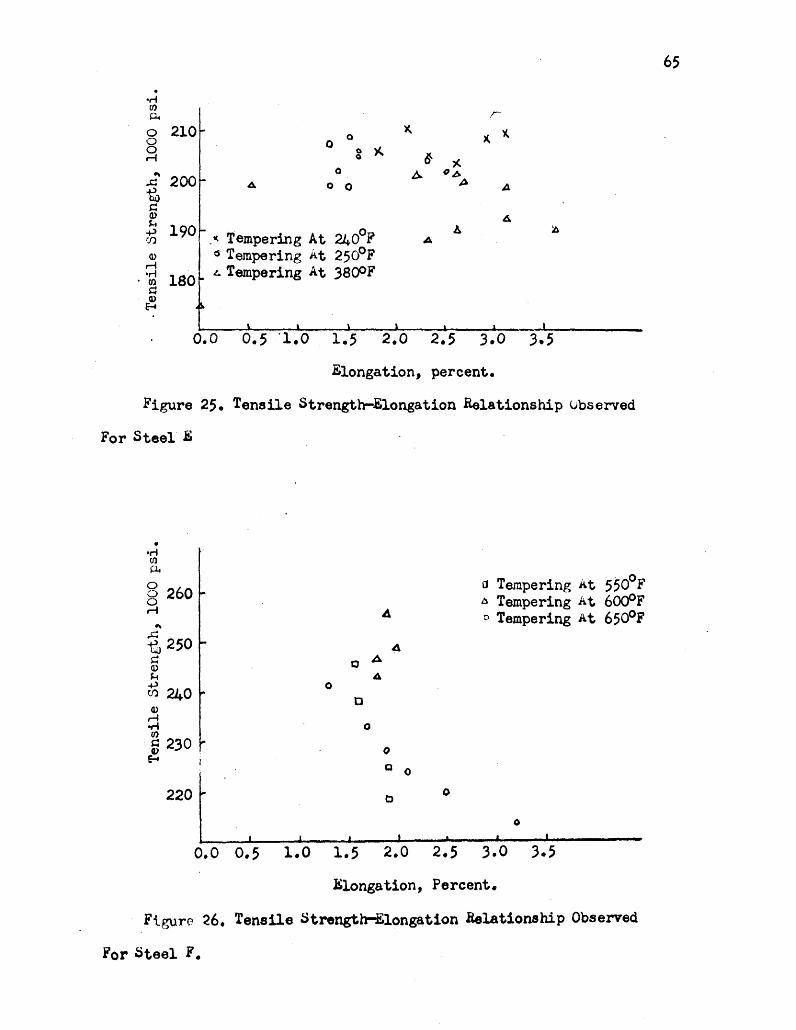
. •r-t fJ)
0.. r
0 0 0 r-1 ~
..c fa
~ ~ ~ 0 0
0 )(. 8-0
){ 0 t:. {}.6
A 0 0 ~ .A
~ Q) ~
+> (f)
Q)
r-1 •r-t 180 ·m
A . 0 A
-~ Tempering At 240 F A
1$ Tempering At 250°F 4 Tempering At 3800F
~ Q)
E-t
o.o
Elongation, percent.
Figure 25. Tensile Strength-Elongation Relationship ubserved
For Steel E
. •rl fJ)
0..
g 260 0 r-1
220 t I
o.o o.;
0
I 1.0
4
4 Q A
A
D
0
0
c 0
b
' I
1.5 2.0
Elongation,
11 Tempering At 550°F A Tempering At 6000F o Tempering At 650°F
0
0 I I I
2.5 ).0 ).5
Percent.
Ftgur0 26. Tensile Strengt~longation Relationship Observed
For Steel F.
65

66
was relatively constant in the 200,000 psi to 210,000 psi range.
On the other hand, the elongation of the steel F samples was relatively
constant at about 1.5-2.0 percent while the tensile strengths varied
over the range of 220.000 psi to 250,000 psi. As mentioned above,
it is believed that in high strength steels there is a tendency for
tensile strength to increase as ductility increases. There was no
indication of this tendency in the steel :b; or the steel F data. This
is interpreted as an indication that these steels were not really
ductile at high strength levels. In .fact, the samples of steel F
tempered at 650°F seemed to show the reverse tendency; strength
seemed to go down as elongation went up. 'rhis is interpreted as
an indication that steel.< F was not sufficiently ductile at this
strength level to permit valid tensile tests.
As mentioned above, the tensile test data on steel F is sus
picious. The carbon content of this steel was high enough to permit
reaching 300,000 psi tensile strength and it seems reasonable to
believe that samples tempered at 400°F should approach this value if
it were ductile at high strength levels. However, samples tempered
at 400°F gave no elongation and low tensile strengths. The different
shape of the two low temperature curves shown in Figure 21, might
be due to bad tensile test data.
The data on steel E, shown in Figure 17, appeared to be better
than the data on steel F if the data for short tempering times
were ignored. The data for tempering times less than 15-30 minutes
was erratic while that for longer tempering times appeared to be
more or less as it might be expected. At 240°F the strength did not

appear to be affected appreciably by tempering for times up to
t~·Jo hours. At 250°F, the strength began to drop during the first two
hours of tempering. At higher tempering temperatures the strength
showed a more rapid decrease and a greater decrease as the tempering
temperature increased.
An anomaly in the data which can be recognized but cannot be
explained is the higher elongation of the steel E samples tempered
at 240°F and 380°F than that of the 250°F and 445°F samples. After
tempering 1-2 hours at 240°F and 380°F the elongation is about 3.0
percent while it is only about 1.5 percent at 250°F and 445°F. There
was a little difference in heat treatment of these materials. The
0 0 samples tempered at 240 F and 380 F were hardened at a higher temper-
67
ature and they were held overnight at room temper~ture before tempering.
This difference in treatment does not seem sufficient to account
for the difference in properties.

VI. CONCLUSIONS
As a result of the data collected and the observations made
during the course of this investigation the following conclusions
have been reached:
1. Ductility is a very important .property of high strength
steels. The amount of ductility necessar.y is not known, but a certain
amount is necessary to per~t meaningful tensile testing at very
high tensile strengths. It might be more correct to say that low
notch sensitivity or some other characteristic which is related in
some way to ductility is the necessary property that permits tensile
testing of high strength steels.
2. Sample preparation and tensile testing technique are much
more important for high strength steels than for more common metals
and alloys whose ductility is relatively high.
3. The type of fracture obtained in strip samples indicates
the relative amount of ductility of the material. Fractures at 45°
to the edge of the strip indicate more ductility than fractures at
45° to the side of the strip. Relatively smooth or straight fractures
indicate more ductility than irregular or zig-zag fractures.
4. With respect to the hardness-tensile strength correlation,
high strength steels of lower ductility probably give tensile
strengths on the low side of the correlation while steels of high
ductility probably give tensile strengths on the high side.
5. Steel A was believed to be the only steel studied that was
68

"ductile" at high strength levels. Steels E and F were believed to
lack ductility when heat treated for maximum tensile strength. Steels
B, G and D were not studied sufficiently to evaluate their character
istics at high strength levels.
6. If a steel is ductile at high strength levels it can be
hardened in air and will give high strength even if the surface is
somewhat oxidized and decarburized. A protective atmosphere during
heat treating is not absolutely necessary to develop high strength
in the steel.
69

BIBLIOGRAPHY
1. C.M. Boyd (1961) Engineering Aspects Of Toughness And Brittleness
In Metal, Toughness And Brittleness In Metals. New York,
Interscience Publishers Inc., p. 13-36.
2. M. Szczepanski (1962) The Brittleness Of Steel. N~v York, John
Wiley & Sons, Inc. 460 p.
3. N.J. Petch (1961) The Definition And Significance Of Toughness
And Brittleness In Metals, Toughness And Brittleness In Metals.
New York, Interscience Publishers Inc., p. 3-12.
4. F. Kiss1inger (1965) Private Communication.
5. Troiano (1960) The Role Of Hydrogen And Other Interstitials In
The Mechanical Behavior Of Metals. Trans. ASM vo1. 52, p. 54.
6. A.R. Elsea And E.E. Fletcher (1964) Hydrogen-Induced, Delayed,
Brittle Failures Of High-strength Steels. Battelle Memorial
Inst. DMIC Report 196, p. l5Lh
7. Raring And Rinebolt (1956) A Small And Inexpensive Device For
Sustained Loading Testing. ASTM Bull. no. 213, p. 74-76.
8. W.J. Tegar (1959) The Electrolytic And Chemical Polishing Of
Metals. 2nd ed., Pergamon Press Ltd. New York. 200, p.
9. Gareth Thomas (1961) Transmission Electron Microscopy Of Metals.
John Wiley & Sons, Inc., New York. 350, p.
10. George L. Kehl (1949) The Principle Of Metallographic Laborator,y
Practice. 3rd ed., New York, McGraw-Hill Book Company. p, 26.
11. Jacquet, Pierre, A. (1956) Electric and Chemical Polishing.
New York, vol. 1, p. 66.
70

12. Metals Handbook (1961) Properties And Selection Of Metals.
8th. ed., .Metals Park, Novelty, Ohio. vol. 1, p. 83.
13. Crafts Lamont (1949) Hardenability And ~teel Selection. Pitman
Publishing Corp., New York. p • 256.
71

72
VITA
Ing-shing, Chien was born on February 24, 1937, at Teipai, Taiwan.
After graduation from Cheng-Kuo Senior Middle School, he entered
Taiwan Provincial Cheng-Kung University in 1956 and graduated in
1960 with B. s. degree in Metallurgical ~gineering.
He served one year in the Ar.my in Taiwan. After being discharged
from the Army, he worked for the Taiwan Metal Mining & Refining Corp.
from 1961 to 1964 as an engineer supervising work on the refining of
copper and also doing some plant design.
In September of 1964, he came to the United States and entered
the University of Missouri at Rolla as a graduate student.
He worked at the Lindberg Steel Treating Company, Melrose
Park, Illinois during the summer of 1965 as a heat treater.


![Anja Pfennig and Axel Kranzmann · heat treated steels [33]. Cvijović and G. Radenković showed that the corrosion resistance of duplex steels with chromium contents even as high](https://static.fdocuments.net/doc/165x107/5fd7f3d768a48552033c234e/anja-pfennig-and-axel-heat-treated-steels-33-cvijovi-and-g-radenkovi-showed.jpg)


