A Study of Factors
142
A STUDY OF FACTORS THAT AFFECT THE CHOICE OF CONSUMERS TOWARDS BUNDLED MEALS IN THE FOOD SERVICE INDUSTRY A Thesis Presented To The Faculty of College of Business and Economics De La Salle University In Partial Fulfillment Of the Requirements for the Degree Master of Science in Marketing By Franchette Pascual-Poon December 2005
-
Upload
darwyn-mendoza -
Category
Documents
-
view
26 -
download
12
description
Research
Transcript of A Study of Factors
A STUDY OF FACTORS THAT AFFECT THE CHOICE OF CONSUMERS
TOWARDS BUNDLED MEALS IN THE FOOD SERVICE INDUSTRY
A Thesis Presented To
The Faculty of College of Business and Economics
De La Salle University
In Partial Fulfillment
Of the Requirements for the Degree
Master of Science in Marketing
By
Franchette Pascual-Poon
December 2005
ACKNOWLEDGMENTS
I would like to thank my family, who supported me in my academic endeavor
from start to finish. My friends and classmates in and out of the Masteral Program, who
helped me with projects, research, and for just being there for me. To the De La Salle
Faculty members and my professors, specially my thesis adviser Ms. Julie Tañada, who
imparted their wisdom and knowledge to give this paper direction. To Maxim’s Tea
House which helped me gain research material and data to hasten the pace of finishing
my paper. Last but not least, to God, to whom nothing is impossible. He is the reason
why I am so blessed, He has guided me always and He has guided me again to do my
best and accomplish this task all this I do in His name.

ABSTRACT
Limited menus, self-service, takeout orders and high turnover have long
characterized fast-food restaurants. Capturing or retaining market position is intuitively
tied to keeping up with the preference of the Filipino consumers in this study, particularly
those in Metro Manila.
The most recent trend in fast food restaurants has been toward value pricing.
While it was a novelty for a short time to McDonalds, value pricing has become a part of
almost every competitor herein referred to as “value meals” McDonalds is bringing
attention to its value menu by spending an estimated $10 million on a national advertising
campaign focused on its value meals. In the light of this situation in the food service
industry, the researcher determined that the factors affecting the choice of consumers
towards value meal is affordable price and taste. It described the profile of value meal
consumers in Metro Manila. Using Factor analysis the following clusters emerged:
experiencer, it/sports enthusiast, home centered individuals, entertainment oriented,
health conscious and those that spends their time wisely.
Findings indicated that bundled meal is preferred to ala carte menu in the fast
food outlets however there is no significant correlation between the demographics
(pertaining to age, gender, civil status and income only) except education as to the
likelihood of purchasing bundled meal.
Purchase occasion & consumption frequency showed no positive relationship to
the preference of bundled meals. Physical surrounding in the same manner was not
found to influence decision to purchase bundled meal although menu board and
promotions garnered sizeable mentions posting a majority in the tabulated survey.

Primary data was captured using focus group discussion and a structured
questionnaire was utilized through a face to face survey. The variables were analyzed
using non-parametric statistical tool Chi square, Kolmogoriv-Smirnov goodness of fit test
and contingency coefficient.
Results of this investigation are discussed to help provide specific indicators of
consumer behavior towards bundled food “value meals” which could serve as bases for
marketing strategy formulation by practitioners specifically for Maxim’s Tea House with
which the researcher has an affiliation.

TABLE OF CONTENTS
Page
Acknowledgement------------------------------------------------------------------------------ ii
Abstract------------------------------------------------------------------------------------------- iii
List of Tables------------------------------------------------------------------------------------ vii
List of Figures----------------------------------------------------------------------------------- x
List of Appendices------------------------------------------------------------------------------ xi
Chapters
I. THE PROBLEM AND ITS BACKGROUND-------------------------------- 1
Introduction------------------------------------------------------------------- 1
Situation Analysis------------------------------------------------------------ 4
Theoretical Framework------------------------------------------------------ 7
Operational Framework----------------------------------------------------- 9
Statement of the Problem---------------------------------------------------- 10
Objectives of the Study------------------------------------------------------- 10
Assumptions of the Study---------------------------------------------------- 12
Significance of the Study----------------------------------------------------- 12
Scope and Limitation---------------------------------------------------------- 14
Definition of Terms------------------------------------------------------------ 15
II. REVIEW OF RELATED LITERATURE---------------------------------------- 18
Promotions----------------------------------------------------------------------- 18
Pricing---------------------------------------------------------------------------- 20

Choice Behavior---------------------------------------------------------------- 21
Bundling------------------------------------------------------------------------- 22
Value Meals--------------------------------------------------------------------- 22
Conclusion----------------------------------------------------------------------- 26
III. METHODOLOGY----------------------------------------------------------------- 28
Research Design---------------------------------------------------------------- 28
Sampling Technique------------------------------------------------------------ 29
Data Collection Method-------------------------------------------------------- 35
Data Analysis Method---------------------------------------------------------- 38
IV PRESENTATION AND DATA ANALYSIS-----------------------------------47
Psychographic Profiling--------------------------------------------------------48
Dining in Fast Food Outlets----------------------------------------------------62
Meal Preference------------------------------------------------------------------65
Factors Considered in Meal Choice-------------------------------------------69
Purchase Situations--------------------------------------------------------------80
Socio-Demographic Profile----------------------------------------------------92
V CONCLUSION AND RECOMMENDATIONS-------------------------------101
Bibliography---------------------------------------------------------------------------------------108
Appendices-----------------------------------------------------------------------------------------112

LIST OF TABLES
Table Page 1 Population of NCR cities/municipalities----------------------------------------------30
2 Sample Size Breakdown by Population Quotas--------------------------------------34
3 Variables, Hypotheses, Objectives and Statistical Treatment---------------------- 41
4 Highly Rated Activities and Interests Describing Fast Food Consumers---------50
5 Agreement – Disagreement to Lifestyle Statements--------------------------------- 51
6 Communalities---------------------------------------------------------------------------- 54
7 Total Variance Explained--------------------------------------------------------------- 56
8 Component Matrix----------------------------------------------------------------------- 57
9 Rotated Component Matrix------------------------------------------------------------- 58
10 Frequency of Dining in a Fast Food Outlet by Gender and Age Groups--------- 62
11 Fast Food Outlet Dined In Most Often------------------------------------------------ 64
12 Type of Meal Usually Ordered when Dining in a Fast Food Outlet--------------- 65
13 Chi Square One-Sample Test Statistics----------------------------------------------- 66
14 Type of Meal Ordered the Last Time Dined in a Fast Food Outlet---------------- 66
15 Fast Food Outlet Dined In the Last Time Ordered a Value Meal------------------ 67
16 Frequency of Dining in a Fast Food Outlet vs.What is Usually Ordered--------- 68
17 Contingency Coefficient Test Statistics----------------------------------------------- 69
18 Factors Considered Important when Choosing a Particular Menu Item---------- 69
19 Chi Square Test Statistics: Factors Considered Important in Meal Choice------ 71
20 Importance Ratings of Factors Considered in Menu Item Selection-------------- 73
21 Kolmogorov-Smirnov One-sample Test: Importance Ratings of Meal
Choice Factors---------------------------------------------------------------------------- 74
22 Importance Rating of Meal Choice Factor 1------------------------------------------ 75
23 Importance Rating of Meal Choice Factor 2------------------------------------------ 76
24 Importance Rating of Meal Choice Factor 3------------------------------------------ 76
25 Importance Rating of Meal Choice Factor 4------------------------------------------ 76
26 Importance Rating of Meal Choice Factor 5------------------------------------------ 77
27 Importance Rating of Meal Choice Factor 6------------------------------------------ 77

28 Importance Rating of Meal Choice Factor 7------------------------------------------ 77
29 Importance Rating of Meal Choice Factor 8------------------------------------------ 78
30 Importance Rating of Meal Choice Factor 9------------------------------------------ 78
31 Importance Rating of Meal Choice Factor 10---------------------------------------- 78
32 Importance Rating of Meal Choice Factor 11---------------------------------------- 79
33 Importance Rating of Meal Choice Factor 12---------------------------------------- 79
34 Importance Rating of Meal Choice Factor 13---------------------------------------- 79
35 What Influences Meal Choice when in a Fast Food Outlet------------------------- 80
36 Contingency Test Statistics: What Influences Meal Choice when in a
Fast Food Outlet vs. What Usually Order in a Fast Food Outlet-------------------81
37 Usual Companion when in a Fast Food Outlet vs. What Usually Order
in a Fast Food Outlet--------------------------------------------------------------------- 82
38 Contingency Test Statistics: Usual Companion when in a Fast Food
Outlet vs. What Usually Order in a Fast Food Outlet------------------------------- 83
39 Usual Companion in a Fast Food Outlet vs. What Usually Order in a Fast
Food Outlet (Observed Frequencies vs. Expected Frequencies)------------------- 84
40 Chi Sq Test for Independence & Contingency Coefficient Test for
Correlation:Usual Companion vs.What Usually Order in a Fast Food Outlet--- 85
41 Occasion Attended when in Fast Food Outlet vs. What Usually Order
in a Fast Food Outlet-------------------------------------------------------------------- 86
42 Contingency Coefficient Test Statistics: Occasion Attended when
in Fast Food Outlet vs. What Usually Order in a Fast Food Outlet--------------- 87
43 Occasion Attended when in Fast Food Outlet vs. What Usually Order in a
Fast Food Outlet (Observed Frequencies vs. Expected Frequencies)------------- 88
44 Chi Sq Test for Independence and Contingency Coefficient Test for
Correlation (Occasion Attended when in Fast Food Outlet vs.Usual Order)----- 89
45 Time of Day Usually Dine in Fast Food Outlet vs. What Usually Order
in a Fast Food Outlet--------------------------------------------------------------------- 89
46 Contingency Coefficient Test Statistics: Time of Day Usually Dine
in Fast Food Outlet vs. What Usually Order in a Fast Food Outlet--------------- 90

47 For Whom Usually Buy when in Fast Food Outlet vs. What Usually
Order in a Fast Food Outlet------------------------------------------------------------- 91
48 Contingency Coefficient Test Statistics: For Whom Usually Buy
when in Fast Food Outlet vs. What Usually Order in a Fast Food Outlet-------- 92
49 Age Group vs. What Usually Order in a Fast Food Outlet------------------------- 93
50 Contingency Coefficient Test Statistics: Age Group vs. What Usually
Order in a Fast Food Outlet------------------------------------------------------------- 93
51 Gender vs. What Usually Order in a Fast Food Outlet------------------------------ 93
52 Contingency Coefficient Test Statistics: Gender vs. What Usually
Order in a Fast Food Outlet------------------------------------------------------------- 94
53 Civil Status vs. What Usually Order in a Fast Food Outlet------------------------- 95
54 Contingency Coefficient Test Statistics: Civil Status vs. What Usually
Order in a Fast Food Outlet------------------------------------------------------------- 95
55 Monthly Household Income vs. What Usually Order in a Fast Food Outlet----- 96
56 Contingency Coefficient Test Statistics: Monthly Household Income
vs. What Usually Order in a Fast Food Outlet--------------------------------------- 96
57 Social Class vs. What Usually Order in a Fast Food Outlet------------------------ 97
58 Contingency Coefficient Test Statistics: Social Class vs. What Usually
Order in a Fast Food Outlet------------------------------------------------------------- 97
59 Educational Attainment vs. What Usually Order in a Fast Food Outlet---------- 98
60 Contingency Coefficient Test Statistics: Educational Attainment
vs. What Usually Order in a Fast Food Outlet--------------------------------------- 98
61 Educational Attainment vs. What Usually Order in a Fast Food Outlet:
Observed Frequencies vs. Expected Frequencies------------------------------------99
62 Chi Sq Test for Independence & Contingency Coefficient Test for Correlation
Educational Attainment vs. What Usually Order in a Fast Food Outlet----------100

LIST OF FIGURES
Figure Page 1 Sample Value Meal Discount------------------------------------------------------------5 2 Price Comparison of Value Meals vs. Ala Carte--------------------------------------6 3 Benefit Congruency Framework of Sales Promotion Effectiveness----------------7 4 Operational Framework-------------------------------------------------------------------9

LIST OF APPENDICES
Page
1 Socio-Economic Classification of Philippine Homes-------------------------------112
2 FGD Guide------------------------------------------------------------------------------- 113
3 Summary of Findings FGD-------------------------------------------------------------115
4 Questionnaire-----------------------------------------------------------------------------126
5 Results of Questionnaire Pre-Testing------------------------------------------------- 132

CHAPTER I
THE PROBLEM AND ITS BACKGROUND
Introduction
Packaging your products and services can be a powerful marketing technique to
move more products and services and add more value. By packaging I am not talking
about how you wrap up the package. I am talking about the “package offer” you present
to your customer, sometimes called a bundled offer. A great example of this strategy is
presented to you nearly every day at fast food restaurants. When you buy a “happy meal”
for your child, you are buying a package deal. Instead of purchasing a soft drink, fries,
and burger separately, it all comes together in one happy meal package (they even throw
in a toy!). Bundling is so common in the fast food industry that 98% of all sales are
package sales. (David Frey, Power of Bundling) By combining different items to create a
so-called bundle, companies have one of the most powerful weapons available for
repositioning themselves as a provider of premium products or services.
Bundling as a promotion is not only applicable to the food service industry. It is
common in many industries; this promotion emerged in economics theory in the 1970’s
as a strategy to maximum sales. A good example is Microsoft Corporation using
bundling to great success in the 1990’s. By bundling its Microsoft Word and Excel, it
outgrew and rendered its competitors like WordPerfect obsolete. In the Philippines,
PLDT has come up with its own bundling scheme. If you subscribe to PLDT DSL and
pay right away you get a free printer with the DSL connection. When utilized properly
and in timely fashion, bundling can provide increased revenues to suppliers and added
benefits to consumers. The practice of bundling in its many forms affects primarily
consumers and providers and can be a rewarding strategy. Bundling is so simple that
even neighborhood beauty salons have come up with their own bundling promotions.
You can see their promotions written in cartolina and taped at the side of the door “free
shampoo for every haircut”. Companies can increase sales by bundling various services;
a growing trend in the Philippines, but the strategy is not as simple as throwing a couple
of products together and slapping on a discounted price. (Prof. Agarwal, State University
of New York)
Like any other kind of promotions, bundling has its benefits to the company.
First, assembling multiple products or services to sell in a package not only increases
your overall sales but also gives you the ability to sell slow moving merchandise. Just
like in some groceries when you buy Colgate toothpaste sometimes they bundle it with
Palmolive soap, bundling a market leader to sell a slow moving soap which is not the
market leader. The second benefit is it automatically upsells your customers without
having to ask for it. This is true when fast food companies are promoting a new product.
They usually bundle the new product with an old time favorite. In a sense you buy the old
time favorite but you have to get the new product as well. Third, bundling lowers your
marketing costs because it allows you to move multiple types of products or services
through one advertisement. This is evident in the new ordering board of McDonald’s.
They post big pictures of their main products, which is the hamburger, and put only one
picture of Coke and French fries on the side. By doing this they have lowered their cost
in printing because they placed the value meal menu and a la carte menu on the same
ordering board. People get to choose whether to order the burger only or get the value
meal in just one ordering board. Lastly, it promotes a higher perceived value to your
customers. Bundling gives the customer a hedonic benefit. By choosing a value meal the
customer not only gets to save a little cash but also is satisfied in the fact that he got
additional food items as well.
There are many types of bundling, from pure bundling (wherein the product is
only available as a bundle) to mixed bundling (the product is priced separately and as a
bundle). Sales rebates is another form of bundling the vendor rebates money to buyers
who meet defined spending levels. In Premium bundling, the bundle is priced higher
than the prices of the items separately. The researcher would like to concentrate on the
bundling promotion that suits the thesis most, which is mixed bundling.
The researcher will concentrate in the fast food market value meals to further
understand the intricate workings of how the customer responds to value meals. What
makes a good bundle, what are the market segments that opt for bundling? The
researcher is affiliated with Maxim’s Tea House, a fast food company, and feels that this
is the best way to help the company come up with better promotions to help increase
sales.

Situational Analysis
It does not take an economist to see that Filipinos like to eat and will spend a
major part of their incomes on food. If the economy continues its steady climb (Family
Income & Expenditure Survey FIES 2003), the food and restaurant sector will continue to
bubble with more activity. The middle class will continue to expand and it will be very
good for business. For the fast food industry the most important factor would be the
middle class that has become stronger with economic growth in recent years. Mr. Yang
of McDonalds believes the entry of new fast food restaurant is likely to level off after
some time. There will be attrition and it is the efficient ones that will stay.
Fast food is presently attracting considerable consumer interest since it is among
the top fastest growing markets. The FCB grid developed by Richard Vaughn of the
Foote, Cone & Belding Advertising Agency classifies fast food with low-involvement
“feel” products along with soaps, soft drinks and snacks. Firms must determine the
marketing strategies that they need to adjust in order to adapt successfully in this dynamic
and fast changing market.
McDonalds Corporation popularized value meals. The McSaver's Value Meals
were launched around the time of the economic crunch in the late '80s or early ‘90s. It
was a response to consumers seeking more value for their money. The idea was of
bundling items to offer a complete meal (including side item and drink) at a discount (vs.
if all items bought at an ala carte price). The commercials aired then literally depicted a
father computing his savings on calculator at the restaurant. Other fast food chains
followed. Jollibee came up with Apat na Sikat Meals, Wendy’s with their Combo Meals.
Not only those in the burger type of business but evident in the Chinese fast food with
Chowking’s Almuchow; Maxim’s Sulit Sarap and Maximeals and in the pizza sector
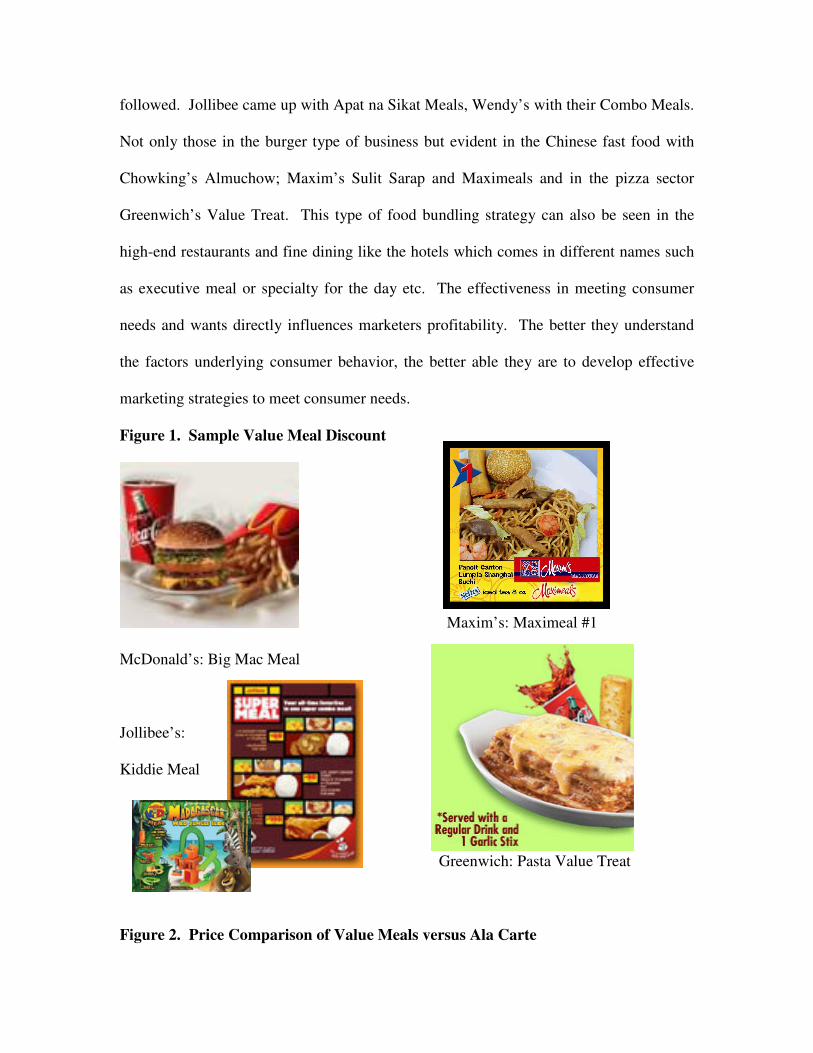
Greenwich’s Value Treat. This type of food bundling strategy can also be seen in the
high-end restaurants and fine dining like the hotels which comes in different names such
as executive meal or specialty for the day etc. The effectiveness in meeting consumer
needs and wants directly influences marketers profitability. The better they understand
the factors underlying consumer behavior, the better able they are to develop effective
marketing strategies to meet consumer needs.
Figure 1. Sample Value Meal Discount
Maxim’s: Maximeal #1
McDonald’s: Big Mac Meal
Jollibee’s:
Kiddie Meal
Greenwich: Pasta Value Treat
Figure 2. Price Comparison of Value Meals versus Ala Carte
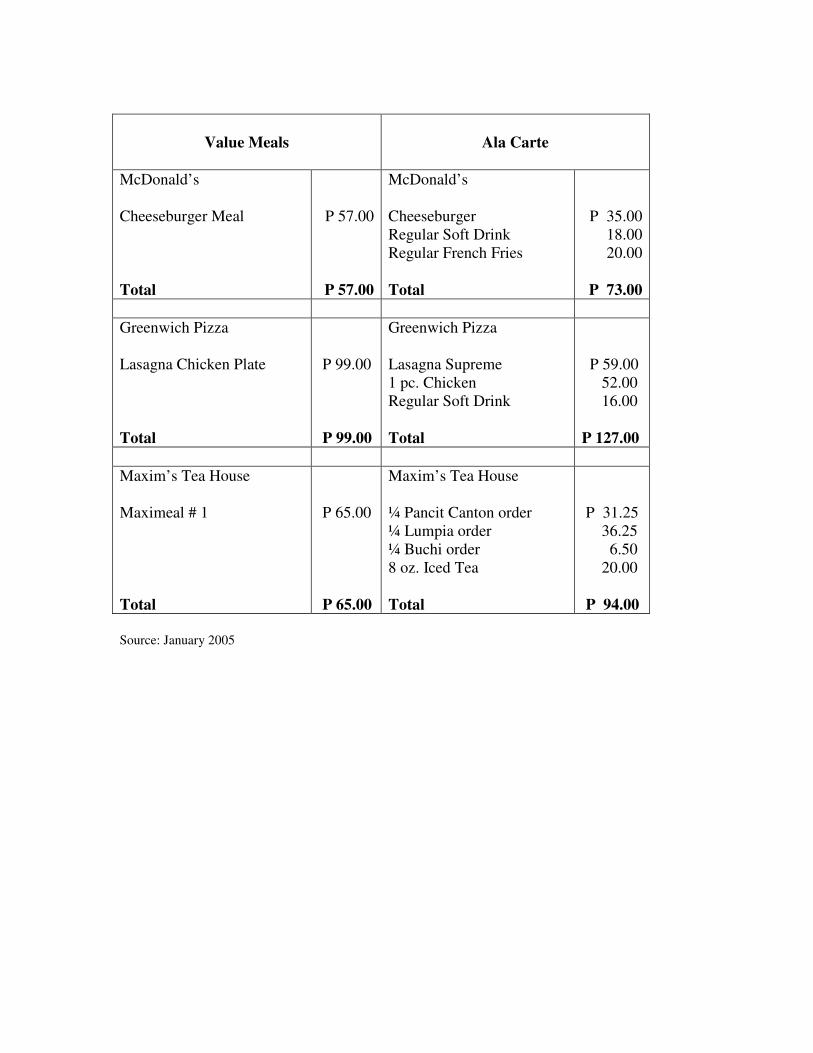
Value Meals
Ala Carte
McDonald’s Cheeseburger Meal Total
P 57.00
P 57.00
McDonald’s Cheeseburger Regular Soft Drink Regular French Fries Total
P 35.00 18.00 20.00
P 73.00
Greenwich Pizza Lasagna Chicken Plate Total
P 99.00 P 99.00
Greenwich Pizza Lasagna Supreme 1 pc. Chicken Regular Soft Drink Total
P 59.00 52.00 16.00 P 127.00
Maxim’s Tea House Maximeal # 1 Total
P 65.00 P 65.00
Maxim’s Tea House ¼ Pancit Canton order ¼ Lumpia order ¼ Buchi order 8 oz. Iced Tea Total
P 31.25 36.25 6.50 20.00 P 94.00
Source: January 2005
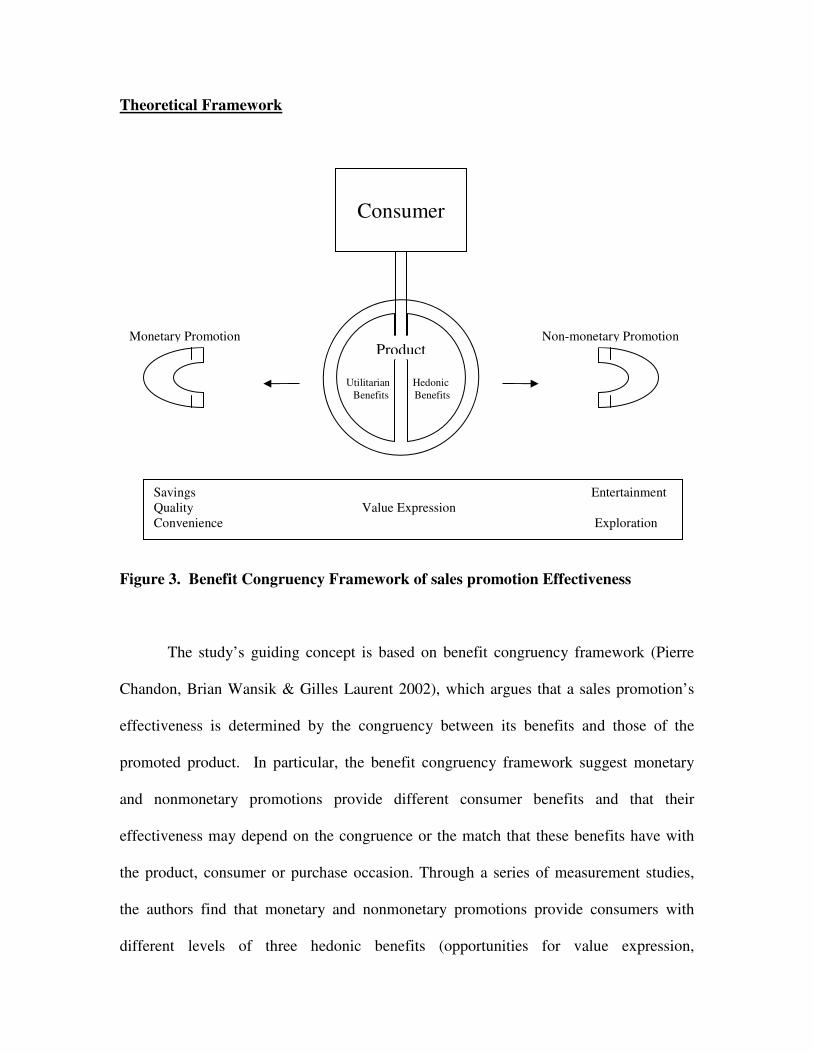
Theoretical Framework
Figure 3. Benefit Congruency Framework of sales promotion Effectiveness
The study’s guiding concept is based on benefit congruency framework (Pierre
Chandon, Brian Wansik & Gilles Laurent 2002), which argues that a sales promotion’s
effectiveness is determined by the congruency between its benefits and those of the
promoted product. In particular, the benefit congruency framework suggest monetary
and nonmonetary promotions provide different consumer benefits and that their
effectiveness may depend on the congruence or the match that these benefits have with
the product, consumer or purchase occasion. Through a series of measurement studies,
the authors find that monetary and nonmonetary promotions provide consumers with
different levels of three hedonic benefits (opportunities for value expression,
Consumer
Product Monetary Promotion Non-monetary Promotion
Utilitarian Benefits
Hedonic Benefits
Savings Entertainment Quality Value Expression Convenience Exploration

entertainment, & exploration) and three utilitarian benefits (savings, higher product
quality, & improved shopping convenience). The benefits are defined as follows: savings
benefits would refer to the monetary savings that the sales promotions provide. However
sales promotions may also enable consumers to upgrade to higher-quality products by
reducing the price of otherwise unaffordable products (quality benefit). Sales promotions
can also reduce consumer search and decision costs and therefore improve shopping
convenience (convenience benefit). Furthermore, sales promotions can enhance
consumers’ self-perception of being smart or good shoppers and provide an opportunity
to reaffirm their personal values (value expression benefit) Because they create an ever
changing shopping environment, sales promotion can also provide stimulation and help
fulfill consumers’ need for information and exploration (exploration benefit). Finally,
sales promotions are often simply fun to see or use (the entertainment benefit). According
to most models of consumer choice, consumers evaluate products on the basis of the
benefits they provide weighted by the importance of these benefits. The weighting of the
benefits varies across products, purchase occasions and individuals (Eagy and Chaiken
1993; Meyer & Kahn 1991).
The various importance of benefits sought implies in turn, that the effectiveness
of a sales promotion is higher when its benefits are congruent with those sought for the
purchase occasion. Simply stated, the benefit congruency principle proposes that sales
promotions are more effective in influencing brand choice when they provide the benefits
that have the largest weight in the evaluation of a purchase alternative.
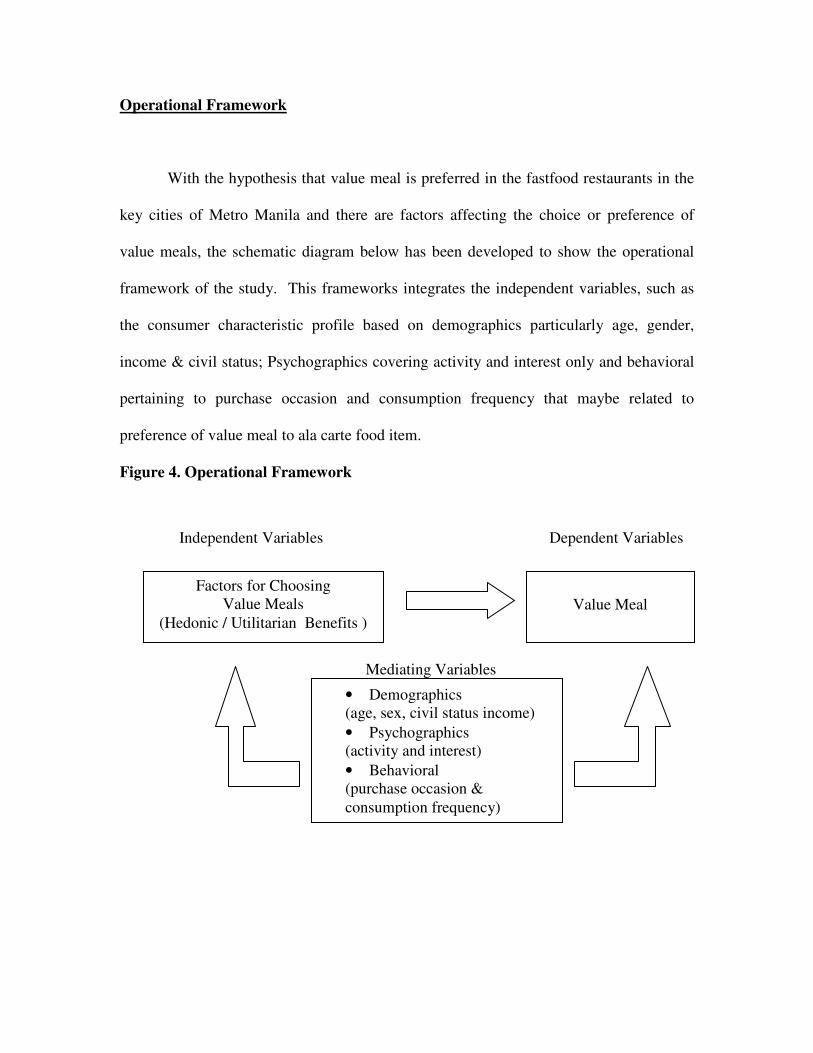
Operational Framework
With the hypothesis that value meal is preferred in the fastfood restaurants in the
key cities of Metro Manila and there are factors affecting the choice or preference of
value meals, the schematic diagram below has been developed to show the operational
framework of the study. This frameworks integrates the independent variables, such as
the consumer characteristic profile based on demographics particularly age, gender,
income & civil status; Psychographics covering activity and interest only and behavioral
pertaining to purchase occasion and consumption frequency that maybe related to
preference of value meal to ala carte food item.
Figure 4. Operational Framework
Mediating Variables
Value Meal
Independent Variables Dependent Variables
Factors for Choosing Value Meals
(Hedonic / Utilitarian Benefits )
• Demographics (age, sex, civil status income) • Psychographics (activity and interest) • Behavioral (purchase occasion & consumption frequency)

Statement of the Problem
The primary objective of this study is to gather reasons or factors in choosing
value meals. It will also explore and illustrate consumer behavior and preferences in
selecting value meals in the foodservice industry.
Objectives of the Study
Specifically, this study has the following objectives:
1. To find out the preference of the consumer between value meals and items bought
at an ala carte price.
2. To determine the factors why consumers choose value meals.
3. To identify the profile of a value meal consumer in the key cities of Metro Manila
3.1 Demographics ( age, sex, income and status)
3.2 Psychographics (activities and interests)
3.3 Behavioral (purchase occasion)
Below are the Hypotheses to be tested in the study:
H1: Consumers visiting a fast food restaurant are more likely to purchase all forms of
bundled product offers (value meal only, value meals and other menu items) over an
individual selection of items in the menu.
H2a: Affordable pricing is a significant factor influencing consumers in meal choice.
H2b: Ease of Ordering is a significant factor influencing consumers in meal choice.

H3: Consumers belonging to younger age brackets (15-25) are more likely to choose
bundled meals than their older (26-59) counterparts.
H4: Consumers from middle to lower income households are more likely to choose
bundled meals than those from upper income households.
H5: Meal Choice is largely influenced by promotions such as discounts and
giveaways.
H6: Consumers dining alone are more likely to choose bundled meals. Consumers
dining with family/friend are more likely to order a la carte menu items.
H7: Consumers dining in fast food outlets for no special occasion are more likely to
order bundled meals. Consumers celebrating special occasions are more likely to
order ala carte menu items.
H8: Consumers dining during major day segments (breakfast, lunch, dinner) will
more likely order bundled meals than consumers dining at odd hours.
H9: Consumers buying meals for themselves will more likely opt for bundled meals
than consumers who buy for others.
H10: Consumers who regularly (i.e. more frequent than once a month) dine in fast
food outlets are more likely to order bundled meals than consumers who are not
regular fast food outlet patrons.
Assumptions of the Study
1. The sample population drawn from major malls in the key cities of Metro Manila
is representative of the general trend since most fast food restaurants are located
inside the malls.

2. Choice and purchase likelihood rating measures consumer preference.
3. Fast food consumption is fairly homogenous relative to socio-economic criterion.
Such that quota or screening for respondents did not include specific
demographics on social classes rather it is classified largely based on their
incidence of falling into the category upon tabulation of results.
4. The pre-tested questionnaire identified and eliminated potential problems in the
administration of the actual survey.
Significance of the Study
Significance to Industry/Business. Manila is fast becoming a mecca of sorts for
food. Not too long ago Manila was the sort of city that foreign restaurant chains skipped
in favor of Hong Kong, Bangkok or Jakarta. The turnaround in the Philippine economy,
its growing middle class and its vibrant and competitive local entrepreneurship base have
changed all that. Those who have been in the food business for a long time say things are
heating up. With the proliferation of restaurants in the food industry, everybody both
foreign and local is vying for the disposal income of the Filipino. In the public speech
during the conference “The Art of Marketing Warfare” in October 2003 , Jollibee’s
Marketing VP made mention of five factors for their success : 1. excellent products 2.
friendly, efficient service i.e. service with a smile in line with the Bee happy campaign 3.
constant improvement with focus on store design 4. distinct and ownable brand identity
and 5. superior value for money. Bundling in the fastfood restaurant referred to in this
study as value meal is the fifth and essential factor for success. Once a promotion which

is construed with a given time frame, it is now a fixed part of the menu selection offered
by most fastfood restaurant. Only it comes in different names such as value treat,
executive meals, combo meals, sulit sarap meals, apat na sikat meals and many more.
Franchisees, entrepreneurs and investors should see much opportunity in offering the
right selection and combination of value meals.
Significance to Managers in the Fast Food Sector. Fast food market is a top
growing market providing economic values that depend on income growth levels and
respond to social changes (time saving). Studying how and when a bundling promotion
work, the framework will have implication on improving effectiveness of a bundling as a
promotional tool as they increase their presence in the marketing mix.
Significance to the Academe. This study may serve as a reference for students in
their future research work. Bundling is a marketing strategy not only applicable to the
food industry but to other areas of business as well such as the airline, telecom ,
accounting services and a host of businesses. As for the teachers, this study may be used
as a guide and as an example to clearly explain to their students the topic related to the
study.
Scope and Limitations
The study primarily probed the factors for choosing value meals and non-value
meal items. Secondly, it determined the profile of value meal and non-value meal

consumers as to demographics pertaining only to age, gender, income and civil status;
psychographic characteristics defined by lifestyle variables: activities and interests; and
behavioral pattern which focused on purchase situations and fast food consumption
frequency. The researcher has identified that purchase situations are characterized by
displays (physical surrounding), social surroundings (who are present when purchasing
value meal, the occasion), time (breakfast, lunch, between meals, dinner) and task
definition (purchasing for oneself or for the family, friends). Thirdly it explains the
correlation existing between the profile of the consumer and the reasons for preference to
value meal. Finally the researcher examines out preference between value meal and
items bought at an ala carte price in the key cities of Metro Manila.
The primary data gathered to fulfill the objectives of the study are focus group
discussion and a face to face survey (using questionnaire) of male and female
respondents belonging to the age group of 15 to 60 years old. Qualified respondents are
screened on their recency of food outlet patronage. That is, they must have eaten in a fast
food outlet or a casual dining restaurant in the past three months.
Due to the large scope of the food industry affecting the financial resources and
time constraint, the researcher limited the study to consumers in the fast food and casual
dining restaurants only.
The study employed the use of quota and purposive sampling, a non-probability
type of sampling since the researcher is affiliated with a fast food chain (Maxims Tea
House). This is the venue where qualified respondents may be intercepted for interview.
Survey will be collected from four key cities in Metro Manila where Maxims has an

outlet. Simple random method with the aid of table of random numbers was used to
determine the areas where the survey will be conducted. These are Makati (Glorietta
Mall), Mandaluyong ( SM Megamall), San Juan (Greenhills) and Quezon City (SM
NorthEdsa Mall). The malls in the Philippines host the most number of fasfood
restaurant outlets and the researcher has chosen the flagship malls in Manila where
people from different walks of life is represented. The area of coverage is limited due to
funding shortage to support a bigger-scale research.
Definition of Terms
Fastfood -- is a multi-billion dollar industry which is continuing to grow at a rapid pace
in the early 21st century in many countries as fewer people cook at home. Fast food is
often highly processed and prepared in an industrial fashion, i.e., with standard
ingredients and methodical cooking and production methods. It is served usually in
cartons or bags in a rapid manner in order to minimize costs. Fast food is usually finger
food that can be eaten quickly and without cutlery. Fast food often consists of fish and
chips, sandwiches, pitas, hamburgers, breaded chicken, french fries, chicken nuggets,
tacos, pizza etc.
Value Meal -- a type of mixed bundling strategy. A combination of food and drinks and
to some a mixture of food from appetizer to dessert at a discounted price when compared
to buying the items individually in a menu selection.
Bundled Meal –popularly termed value meal. As the term value meal is coined by
McDonalds. The generic term to refer to package or combination of food and drinks at a
discounted price.
Bundling – is a marketing strategy under promotions that cleverly combines different
items to create a so called bundle; putting together related products for sale at a single
price.
Mixed bundling – the bundled products and individual products are available for
purchase. McDonald’s fast food restaurant’s Value Meals are an excellent example of
this bundle. It is the most common form of bundling.
Consumers – one that consumes; someone who utilizes economic goods for the
satisfaction of human wants. In this study the consumers referred to are those belonging
to the age group of 15-60 years old, has eaten in a fastfood restaurant in the past three
months and a resident of Metro Manila.
Low involvement – purchases that are less important or risky, and are not worth the
consumer’s time and effort; the choice is characterized by limited decision-making.
Hedonic Values – satisfaction is based on pleasurable experiences and emotions that
result from using the product; the consumer makes an overall judgment based on the total

consumption experience. Benefits that are noninstrumental, experiential, and affective;
they are appreciated for their own sake, without further regard to their practical purposes.
Utilitarian Values – Primarily instrumental, functional, and cognitive. They provide
customer value by being a means to an end. Satisfaction is determined by the degree to
which the product meets expectations on functional attributes such as savings gained
when purchasing a value meal.

CHAPTER II
REVIEW OF RELATED LITERATURE
Promotions
Are monetary savings the only explanation for consumer response to a sales
promotion? If not how does the different consumer benefits of a sales promotion
influence its effectiveness? By doing a series of measurement studies, Pierre Chandon,
Brian Wansink and Gilles Laurent (2000) found out that monetary and nonmonetary
promotions provide consumers with different levels of three hedonic benefits namely
opportunities for value expression, entertainment, and exploration; and three utilitarian
benefits obtained savings, higher product quality, and improved shopping convenience.
To answer the second question, the authors develop a benefit congruency framework,
which argues that a sales promotion’s effectiveness is determined by the utilitarian or
hedonic nature of the benefits it delivers and the congruence these benefits have with the
promoted product. The research showed that for high equity brands, monetary
promotions are more effective for utilitarian products than for hedonic products. There is
ample empirical support for benefit congruency framework, in the literature on
persuasion (Eagly and Chaiken 1993). For example, Edwards (1990) finds that hedonic
information on the smell of a beverage is more persuasive than utilitarian information on
its storage requirements when the attitude toward the beverage is based on hedonic
benefits (taste) than when it is based on utilitarian benefits (nutrition). Theories of
attitude change can account for the effects of benefit congruency. Functional theories of
attitudes contend that persuasion is enhanced when a persuasive message emphasizes the
utilitarian or hedonic function that provides the motivational basis of the attitude to be
modified (Kat 1960). Similarly, Fishbein and Ajzen (1975) argue that persuasions are
more effective when they address the salient beliefs underlying the attitude to be
changed, that is the beliefs that are the most important antecedents of an attitude. Finally,
the compatibility principle (Tversky, Sattath and Slovic 1988) suggests that consumers
weight more heavily the dimension of an object (say its utilitarian benefits) when it is
compatible with or similar to their goal (say choosing between two utilitarian alternatives
as opposed to choosing between two hedonic alternatives).
A primary motivation for offering price promotions is to stimulate sales of regular
price merchandise. In the study conducted by Francis J. Mulhern and Daniel T. Padgett
(1995) they matched actual purchases of individual shoppers with an in-store survey to
determine the relationship between regular price and promotion purchasing. The results
showed that there is a positive relationship between regular price and promotion
purchases, because among shoppers who identify the promotion as one of their reasons
for visiting the store, ¾ make regular price purchases as well. ¼ of the shoppers were
there to purchase the promotion only.

Pricing
Another study “Pricing a bundle of Products or Services: The Case of Nonprofits”
(1996) stated that pure bundling or mixed bundling is the choice of profit maximizing
firms. Mixed bundling still being the most preferred bundling strategy, mixed bundling
means the product can be priced separately and as a bundle. This is further proven by the
journal “Transaction Decoupling: How Price Bundling Affects the Decision to
Consume”, in this journal by Dilip Soman and John T. Gourville (2001) it states that
price bundling is widespread; manufacturers and retailers routinely offer multiple
products for a single, bundled price. These authors built on the sunk cost literature by
Thaler (1980) and predicted that price bundling leads to a disassociation or “decoupling”
of transaction costs and benefits, and decreasing a consumer’s likelihood of consuming a
paid-for service. The authors show that the decreased attention to sunk costs brought
about by price bundling can be either cognitively driven or motivationally driven.
Bradlow and Rao (2000) merged an established methodology the “Bayesian
Modeling” and an existing utility model Farquhar and Rao’s (1976) balance model. The
balance model explicitly considers how a decision maker categorizes various attributes
and uses them in evaluating a collection. They wanted to describe individual choices
among assortments of multiattributed items. This approach is ideally suited to
developing an understanding of the differences in choice processes of individual decision
makers. Such an application is particularly useful in the area of direct target marketing.
The study indicates that consumers are heterogeneous: Some customers are price

sensitive and unresponsive to the attributes, and others are sensitive to the features of the
product but do not necessarily want more of these features. This proves that some
consumers are price sensitive to bundles and others are more keen on what is included in
the bundle, just like in choosing the Maximeals the researcher would like to know
whether consumers are more interested in the price or what products are included in the
meal.
Choice Behavior
Trijp, Hoyer and Inman addressed two key issues that have received inadequate
attention in the choice behavior literature on variety seeking. First, they separated true
variety-seeking behavior from derived varied behavior. Second, they hypothesized
variety-seeking behavior to be a function of the individual difference characteristic of
need for variety and product category-level characteristics that interact to determine the
situations in which variety seeking is more likely to occur relative to repeat purchasing
and derived varied behavior. They tested their hypotheses in a field study which tested
both the intensity of brand switching and the underlying motives for their switching
behavior. The results showed that variety seeking behavior does not occur for all
products to the same extent and identify several product category-level determinants of
variety seeking behavior. It did not state which products have the most effect in variety
seeking behavior.
Bundling
Bundling is a pricing strategy which takes many forms, but its principal
characteristic is offering a package consisting of two or more goods and services, or a
combination of these, that makes the main product more attractive to consumers than
purchasing the goods separately. Sellers try to influence consumer preferences; demand
for the product should be price inelastic. Benefits in favor of bundling include demand
inducement or revenue enhancement, improvement in cost via better scales of economies
and faster movement of inventory. The market presents varied forms of demand
relationships among clearly identifiable consumer classes; one frequently encounters
mixed bundling, wherein the bundled products can be sold separately or jointly. Delfino
and Tanchuco (Manila Bulletin 8/30/2004)
Bundling unquestionably raises profits. The common marginal cost of the bundle
insures the profitability of bundling, as long as prices are chosen appropriately. Profits
are better with the modified bundling or mixed bundling than with none. Jannett Highfill
(International Advances in Economic Research 5/1/2001)
Value Meals
Value meals, they are the rage among students and the favorite of ordinary
salaried employees. The inexpensive and popular value meals are being offered by
fastfood chains, restaurants, cafeterias and lately, even by exclusive proprietary clubs. It
is the answer to the yearnings of weary housewives whose everyday budget for the kids
at school and the working husband is being stretched far too long. Value meals are a
combination of two or more foodstuff plus, a cola or juice drink. Value meals were first
introduced to shoppers in the late 1980s they were known as combo meals then, the
promotional idea immediately caught the fancy of diners. Suppliers like soft drink
companies, bakeries, plastic cups and foam packs also enjoyed big volume orders from
their traditional institutional clients due to value meals. (Manila Bulletin 9/1/2002)
Research show that consumers rate Value Meals as the second most important reason for
selecting a quick service restaurant, first reason is restaurant location, and consumers who
purchase value meals generally seize the opportunity to upsize. (Mediaweek 10/18/1993)
Offering value meals sandwich or entrée, chips or a side, plus a beverage and maybe even
dessert, is the most effective way to increase revenue in corporate dining facilities,
according to a recent study. Other than value meals operators say the best way to
improve is via offering coupons, posting limited-run menu items, implementing cashless
payment, delivery to offices, and call-in ordering for take-out. (Food Service Director
2002)
The Hamburger and sandwich segment of the fast food industry posted sales
increases of 5% and 7%, respectively, for the fiscal year ending August 1994, according
to a report by the NPD Group Inc. Major industry trends include continued reduction of
operational costs, offering value-priced combination meals, and emphasizing basic
burgers and other items. While the burger segment as a whole did well, the performance

figures from many companies were not so rosy. Competition, already cutthroat, has
intensified, with everyone now pitching super value prices. (Restaurant Business 1995)
Here is a look at how the Value Meals are doing in the fastfood market. What are
the reasons for its success, and how much of company sales are from value meals.
Burger King, moved to further boost value meal sales, launched 3 new value meals
catering to the consumers’ need for choices. Value Meals are significantly important
menu offerings as they represent approximately 40% of main menu purchases and 51%
of Burger King sales. Value Meals had been introduced to the stores since 1994 and is
the product offering the greatest cost savings to consumers while also offering a greater
profit margin for restaurants, according to Dana Frydman, senior director, product
marketing for Burger King Corp. (Mediaweek 10/18/1993)
McDonald’s contacted its ad roster shops to dole out an estimated $10 million on
a national promotional campaign related to its Value Meals. McDonald’s Value Meals
accounts for 45% of the total sales in the stores. (Brandweek 12/13/2001) The Big Mac
Value Meal alone in mid 1993 claimed that purchases of its Value Meals packages
accounted for 45% of all the system’s transactions. (America’s Top 2000 Brands 1993)
Simplicity is the new way for McDonald’s Corp., simplify its core business, expand
restaurant concepts and create retail opportunities, all the while improving customer
service and satisfaction. McDonald’s is ramping up on a consumer rewards program; it is
aimed at tracking customer behavior to improve customer frequency. Customers visiting
a McDonald’s outlet will gain points toward prizes from partners such as Walt Disney

Co. and Mattel. The company is considering using the program for boosting sales for
after school and on weekends. (Advertising Age 4/2/2001).
Wendy’s and Hardee’s started bundling specially priced meal combos. They have
committed themselves to specialty burgers and sandwiches, pitched more as “real food”.
At mid year 1993, Wendy’s showed 6% growth and Hardee’s sales increased 13% from
last year where the overall quick service restaurant segment grew comparatively at just
over 3%. (America’s Top 2000 Brands 1993) Wendy’s core strategy of value pricing
balanced with premium sandwich offers has proved a winner. Now they are accelerating
unit expansion, continuing improvement of existing operations and of their franchising
system. Hardee’s was among the last of the burger chains to succumb to the value menu
lure, its campaign “Choice Values” was launched last June. Its Choice Values response
features a two-tiered menu of 99cents sandwiches and $1.99 complete meals, including a
double cheeseburger one piece chicken and biscuit, and junior chicken filet, augmented
by small fries and small drinks.
Jack-in-the-Box also introduced value meal offerings in 1994, under the title
Supreme Value Combos. The company is stressing the combo meals’ convenience
aspect rather than strictly the price point.
By the ends of summer Pizza Hut has lined up a four stage entertainment marketing
initiative to take its marketing schedule through the end of the year with a cross
promotion with home video rental giant Blockbuster Entertainment, Disney video sell
through megapromo with Aladdin, a link-up with Time Warner’s Home Box Office,
offering a free month of the cable movie service with purchase, and a Christmas Kid Pack
promotion tied to Steven Spielberg’s more kid friendly We’re Back: A Dinosaur Story.
Pizza Hut, used its Blockbuster and HBO ties logically to promote home delivery of its
new Bigfoot mega-pizza, an effort to steal share from steadily rising Little Caesars,
whose basic point of different for years has been its “Pizza! Pizza!” two pies for the price
of one offer. (America’s Top 2000 Brands 1993)
Domino’s Pizza is introducing two new value meals “Pepperoni Mania Value
Meals” these Value Meals offer two combinations of pizzas, side orders and drinks.
Allan Ang, Dommal Food Services General Manager, said, “This is our way of saying
‘thanks’ to our loyal customers. We also hope to attract new customers.” The value meal
saves the customers 16 cents as compared with when they order the items separately.
(New Straits Times 10/12/2002)
Conclusion
The acceptance of value meals is spreading nationwide and popularity is drawing
a crowd appeal. These days it is common to see media advertisements and printed
handouts heralding various combinations of dishes and drinks, all in a irresistibly lower
price range. “It used to be a once of month event. But now we have these promotions
everyday because that is what diners and customers hunger for” exults Bob Cardoni
president of Cubao food stallholders association. (lifted from Manila Bulletin Editorial
September 1, 2002).
So, whether one is in the mood for a combo meal in Quiapo, Greenbelt Makati or
at Fort Bonifacio, the economies of scale of value meals are proving to be cost-effective
proposition to patrons as well as entrepreneurs. Marketers must emphasize the value or
benefit of what they are offering and therefore it is best to understand the underlying
factors affecting the choice of value meals in order to be relevant and competitive in
strategy.

CHAPTER III
METHODOLOGY
Research Design
There are three generally recognized categories of research based on the nature of
information to be gathered, namely, exploratory, descriptive and causal (Naresh
Malhotra 2004; Lehmann, Gupta and Steckel 1998). This study employs the first two
categories.
There is, sadly, a noted absence of substantial studies in the local food service
industry specifically investigating the value meal phenomenon that can be publicly and
freely accessed. Fast food outlets like Jollibee and McDonald’s do have studies of this
sort but are largely for internal use only. These research efforts are generally
commissioned to third party research agencies that would automatically render such
studies as proprietary to these fast food client companies. While there may be syndicated
fast food industry studies conducted by research agencies, such may only be acquired via
purchase and with a high price tag attached. Thus, the exploratory approach lays the
groundwork intended to uncover initial data patterns or characteristics of variables
(Edralin 2000) that should serve as bases for further investigative efforts. These data
patterns may be translated to observed behavioral responses of the study’s target market
relative to value meal consumption, e.g., what drives them to choose a value meal

offering among all other menu items or what degree of importance is attributed to each of
these factors on the eventual meal choice.
This study moves the research initiative a notch higher by utilizing the descriptive
approach with the exploratory research results serving as valuable inputs. As the name
suggests, this phase intends to accurately describe the variables of interest as identified in
the study (Naresh Malhotra 2004), namely, purchase likelihood, factors considered in
choosing value meals, value meal consumer profile as defined by demographics,
psychographics and behavior. The status quo is presented through a survey and the
relationships among variables are established through correlation studies
(http://www.okstate.edu/ag/agedcm4h/academic/aged-5980a/5980/newpage110.htm,
June 2005) --- both of which are undertaken in this study.
Sampling Technique
The target population as defined by the study included every male and female consumer
residing in Metro Manila with ages ranging from 15 to 60 years old. An additional
selection criterion was included based on recency of food outlet patronage stipulating that
all respondents must have dined in a fast food outlet or casual dining restaurant within the
past 3 months to qualify. The 3-month time frame ensures that respondents’ dining out
experiences is current enough for them to remember when prompted with specific
questions. Note that no further requirement was made as to a respondent’s economic
status (i.e., must belong to classes AB and C or only to classes C and D) as the study

assumed fast food consumption to be fairly homogeneous relative to said demographic
criterion. The study, however, will still have to classify respondents as belonging to a
particular economic status but largely based on their incidence of “falling into” these
classes. The classification guide is given in Appendix A.
Given the need to strike a balance between cost and efficiency considerations, this
study chose to generate non-probability samples via quota sampling. Quotas were set
based on population proportions defined by the selected age brackets and gender. Of the
total 17 cities and municipalities in Metro Manila, the number of cities/municipalities to
include in the survey was judgmentally determined to be 4 as sufficient to represent the
target population. The latest population data (2000) from the National Statistics Office
(http://www.census.gov.ph/data/pressrelease-
/2003/pr0312tx.html, June 2005) were used as basis for computing pertinent population
proportions as tabulated below.
Table 1. Population of NCR cities/municipalities
Distributed by Age Group and Gender
TOTAL COUNT PERCENT AGE GROUP
Male Female % Male Female
15-24 972,219 1,115,576 32% 31% 34%
25-34 919,353 953,877 29% 29% 29%
35-44 665,465 672,135 21% 21% 20%
45-60 569,424 579,515 18% 18% 17%
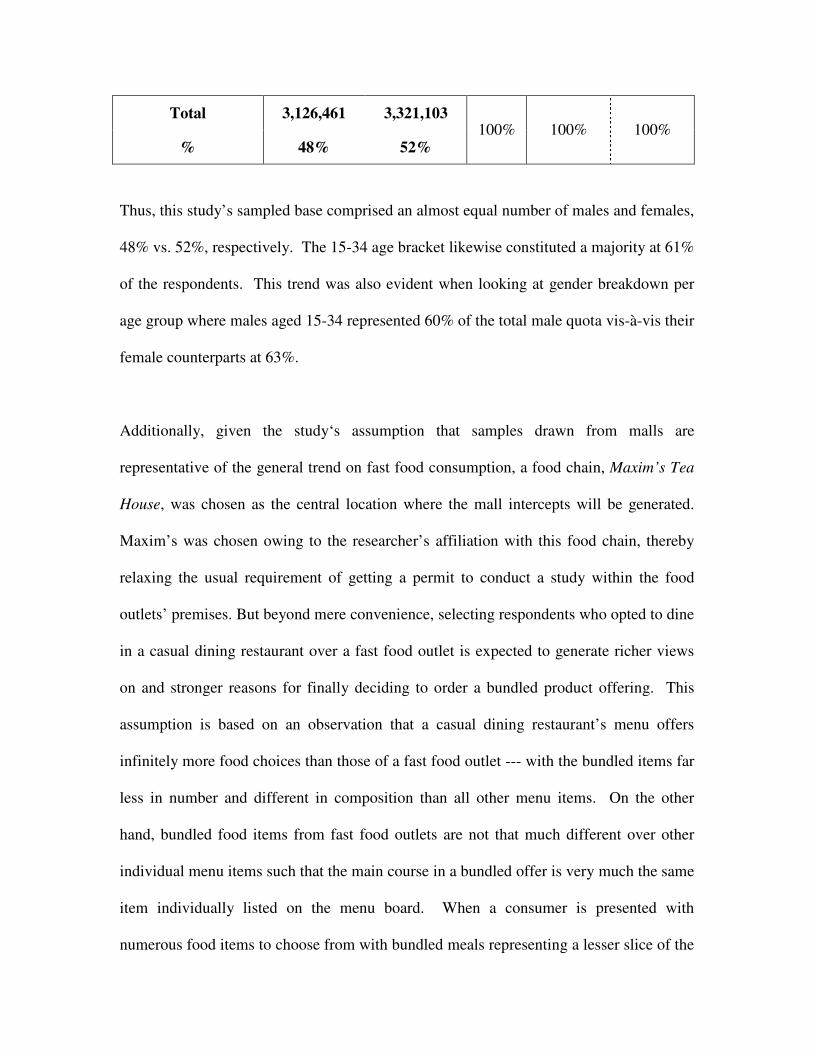
Total 3,126,461 3,321,103
% 48% 52% 100% 100% 100%
Thus, this study’s sampled base comprised an almost equal number of males and females,
48% vs. 52%, respectively. The 15-34 age bracket likewise constituted a majority at 61%
of the respondents. This trend was also evident when looking at gender breakdown per
age group where males aged 15-34 represented 60% of the total male quota vis-à-vis their
female counterparts at 63%.
Additionally, given the study‘s assumption that samples drawn from malls are
representative of the general trend on fast food consumption, a food chain, Maxim’s Tea
House, was chosen as the central location where the mall intercepts will be generated.
Maxim’s was chosen owing to the researcher’s affiliation with this food chain, thereby
relaxing the usual requirement of getting a permit to conduct a study within the food
outlets’ premises. But beyond mere convenience, selecting respondents who opted to dine
in a casual dining restaurant over a fast food outlet is expected to generate richer views
on and stronger reasons for finally deciding to order a bundled product offering. This
assumption is based on an observation that a casual dining restaurant’s menu offers
infinitely more food choices than those of a fast food outlet --- with the bundled items far
less in number and different in composition than all other menu items. On the other
hand, bundled food items from fast food outlets are not that much different over other
individual menu items such that the main course in a bundled offer is very much the same
item individually listed on the menu board. When a consumer is presented with
numerous food items to choose from with bundled meals representing a lesser slice of the

pie, it naturally follows that the probability of finally opting for ala carte items far
outweighs a bundled meal choice. Thus, for consumers to order bundled product
offerings in a food outlet that serves more ala carte items is definitely an event that may
not be attributed to just chance variation. This scenario will be explored more fully
among consumers coming from a casual dining restaurant (such as Maxim’s) than in a
fast food outlet (such as Jollibee or McDonald’s).
The sampling frame consisted of a listing of all Maxim’s branches within Metro
Manila. The four Maxim’s sites that were included in the survey were selected through
simple random sampling via a Table of Random Numbers resulting into outlets located in
the cities of Quezon City, Mandaluyong, Makati and San Juan as the study’s areas of
coverage. Thus, intercepts were conducted at a Maxim’s branch inside the following
malls:
1. SM City North Edsa ……………. Quezon City
2. SM Megamall …………………... Mandaluyong
3. Glorietta ………………………… Makati
4. Greenhills Shopping Center ……. San Juan
Given that major malls are melting pots of consumers from all over the
metropolis, the above locations should be able to generate a cross-section of value meal
patrons from which this study will be drawing insights.
Note, however, that this does not imply a residence restriction on sample
generation, i.e., a respondent will still qualify even if he/she resided outside these cities

but within Metro Manila as long as he/she falls within the age and gender quotas to be
met.
Estimation of the sample size took into account the following basic considerations
(Naresh Malhotra 2004; Lehmann, Gupta and Steckel 1998; Roberto 1987):
1. Confidence level (z) – This represents the error in the estimation process. This z
value is indicative of the confidence with respect to the accuracy of the estimate
of the variable of interest yielded by the sample data. That is, a generally
preferred 95% confidence level (with z = 1.96 which this study adopted) says that
this study can be wrong 5% of the time in accepting the estimated proportion from
the sample as the true proportion.
2. Margin of error (MOE) – This corresponds to the error of the estimate. The
generally tolerated MOE of 5% (as this study is willing to tolerate) says that an
estimated proportion as a measure of the variable of interest derived from the
sample data will approximate the true proportion within limits of +5%.
3. Variability – Data variability is a measure of the degree of homogeneity of the
population relative to the variable(s) under study. Measured in proportion, this
takes the form “p(1-p),” where p is the proportion this study is interested in.
However, since no prior variability estimate is available (e.g., standard deviation),
the study took a conservative stance and assumed that maximum variability
existed in value meal consumption among target consumers. Given that p is a
proportion, its values range between 0 and 1. Thus, assigning values to p within

this range and computing variability of p(1-p), the maximum point is reached
when p = .50. The study, thus, adopted a p of 0.50.
Using the sample size formula below with the foregoing considerations in mind
yields a sample size of approximately 400 respondents. This is further broken down
(Table 2) applying the population proportions from Table 1.
n = z2 [p(1-p)] = (1.96)2 (.50)(1-.50)
(MOE)2 (.05)2
n = 384 � 400 respondents
Table 2. Sample Size Breakdown by Population Quotas
PERCENT SAMPLE SIZE AGE GROUP
Male Female Male Female
15-24 31% 34% 60 69
25-34 29% 29% 57 59
35-44 21% 20% 41 42
45-60 18% 17% 35 36
Total 400 respondents ……….. 194 206
% 48% 52%
As a final note, the breakdown per city followed a proportionate distribution
where the 400 sample size was equally distributed among the selected Maxim’s branches
in Metro Manila. Thus, there were 100 respondents interviewed in each Maxim’s branch
located in the cities of Mandaluyong, Makati, San Juan and Quezon City.
Data Collection Method
Primary data gathering is the selected data collection method executed in two
phases involving both the exploratory and descriptive research approaches.
The initial phase was exploratory through the focus group discussion (FGD)
intended to elicit responses to be used as options for close-ended questions in the second
phase of the study. Two sessions were conducted with both panels representing the target
market based on age, gender, past 3-month product usage criterion and past 4-week fast
food visit. Panel membership was made up of about 8-10 respondents per group. The
first group consisted of the younger set of male and female respondents from AB and C
households whose ages ranged from 15 to 25 and the second group comprised their older
male and female counterparts belonging to the 26 to 59 age bracket similarly from classes
AB and C. The discussion guide (Appendix B) included questions that were asked
during the large-scale survey phase. The sessions were conducted on August 13, 2005.
The exploratory research report and transcriptions of the actual discussions are provided
in Appendix C.
The descriptive phase of the study was executed through a survey using face-to-face
interviews conducted inside selected Maxim’s Tea House outlets (given the researcher’s

affiliation with this food chain and the appropriateness of choosing a casual dining
restaurant over a fast food outlet as the central location for respondent generation as
previously discussed) located in Metro Manila malls earlier enumerated. Prospective
respondents were intercepted and invited to participate in the study. Those willing
enough to spare a few minutes of their time were interviewed either while waiting for
their orders (if the order takes long to be served) or right after dining (if the order is
served almost immediately). Fieldwork ran during August 31 – September 30, 2005.
The interviews were aided by a structured questionnaire consisting of the
following four major parts (Roberto 1987) which this study adhered to (Appendix D):
1. The introduction portion;
2. The screening portion;
3. The core portion; and
4. The classification portion.
The introduction was brief and direct as it disclosed to prospective respondents
that the interviewer is conducting a survey on fast food outlets in the area and that the
interview should not take more than 15 minutes.
The screening portion ensured that the predetermined respondent criterion based
on recency of food outlet patronage (must have dined in a fast food outlet or casual
dining restaurant within the past 3 months) and sample size quotas based on age, gender
and city proportions will be met with strict accuracy. Note that the term “city
proportions” here refers to the sample size broken down equally into 100 respondents
generated from each mall outlet enumerated earlier (not respective population
proportions).
The core portion represented by sectional subgroups B-E intended to measure the
identified variables of interest, i.e., Section B – Preference for specific menu items and
fast food outlets, Section C – Factors considered important in meal choice (initially asked
through a close-ended question and subsequently through the use of a rating scale
measuring attitude toward each meal decision factor), Section D – Purchase situations (as
measured by questions on influence of physical surroundings on actual purchase, usual
companion, occasion at time of purchase, usual time of day when visiting fast food
outlets, for whom usually buy) and Section E – Psychographic profile as measured by the
degree of agreement along a 5-point rating scale to statements describing activities and
interests. Showcards (visual aids handed to respondents that usually contain rating
scales, answers to close-ended questions, list of attributes) were used to facilitate the
interview process and to ensure that the respondent understood each question clearly.
The final portion, classification, collected demographic information per
respondent (e.g., socio-economic class, educational attainment, occupation, working
status, civil status, household income, and ownership of facilities in the home) as
additional profiling variables.
All questions were phrased in English with corresponding Filipino translations to
cater to all types of respondents with seeming preference for either language.
Questionnaire pretesting was likewise done following Roberto’s “rule of five” (1987),
i.e., pretesting with no more than five respondents (Appendix E for results). All
respondents from both the FGD and survey phases received tokens.
Data Analysis Method
The absence of formal studies on value meal consumption in the local fast food
industry suggests that the data drawn from this study’s sampled base of respondents
cannot be assumed to have originated from a population with a known distribution (e.g.,
normal or binomial). Thus, nonparametric (or “distribution-free”) techniques of
hypothesis testing were most appropriate for analyzing this type of data. The following
three tests were used in proving whether or not there existed relationships between
variables under study:
1. Chi square (�2) one-sample test
Use of this test is ideal for testing the “goodness-of-fit” between the observed
number of responses per category vis-à-vis an expected number based on the null
hypothesis (Siegel 1956). This is also appropriate when a nominal level of
measurement is achieved such that observations fall into discrete categories
enabling data enumeration (for instance, consumption and non-consumption of
value meals – Q#B3; factors considered in meal choice – Q#C1).

2. Kolmogorov-Smirnov one-sample test
Similar to the chi square one-sample test, this test is also ideal for testing
“goodness-of-fit” between the observed distribution of sample values vs. values
under the null hypothesis. The difference between both tests is that the
Kolmogorov-Smirnov one-sample test takes into account rank ordering which,
therefore, requires an ordinal level of measurement at the very least (Siegel 1956).
This requirement is met as importance ranks based on a 5-point importance scale
were assigned by respondents to a specific meal decision factor (Q#C2).
3. Contingency coefficient C
This test is ideal for measuring the extent of relation between 2 sets of attributes
consisting of an unordered series of frequencies (Siegel 1956). The level of
measurement needs to be nominal for each variable of interest at the very least.
Specific to the study, these variable pairs are as follows:
a. Meal preference vs. Age groupings (Q#B3 and Q#A2)
b. Meal preference vs. Gender (Q#B3 and Gender Screening – Questionnaire
Section A)
c. Meal preference vs. Civil status (Q#B3 and Civil Status – Questionnaire
Section F)
d. Meal preference vs. Monthly household income (Q#B3 and Monthly
household income – Questionnaire Section F)
e. Meal preference vs. each of the following Purchase situations as
characterized by:
i. Physical surroundings (Q#B3 and Q#D1)
ii. Social surroundings (Q#B3 and Q#D2)
iii. Occasion (Q#B3 and Q#D3)
iv. Time segment (Q#B3 and Q#D4)
v. Task definition (Q#B3 and Q#D5)
f. Meal preference vs. Fast food consumption frequency (Q#B1 and Q#D5)
g. Meal preference vs. Psychographic variables (Q#B3 and Section E)
Factor analysis was also employed in profiling these respondents according to
their activities and interests. Respondents were handed 13 psychographic statements that
may or may not describe them and were asked to state their degree of agreement using a
5-point agree-disagree rating scale (Questionnaire Section E). As the objective of factor
analysis is to summarize or group together highly correlated variables (Lehmann, Gupta
and Steckel 1998), this analytical method should be able to reduce these 35 statements or
variables into a smaller number for simplification purposes and greater ease of
manageability with minimum information loss. Note, however, that this method does not
take the form of Ho vs. Ha that tries to infer the relation between meal preference and
respondents’ psychographic make-up. The correlation of interest here is discovering the
inherent relationship among the psychographic variables that will be used to profile value
meal and non-value meal consumers.

All other questions on the questionnaire that do not involve hypothesis testing
(Q#B2, Q#B4, Q#B5) were described through observed frequencies and corresponding
percentages.
Table 3. Variables, Hypotheses, Objectives and Statistical Treatment
Measurement
Variables Hypothesis Objectives
Statistical
Treatment
H1: Purchase
likelihood
H1: Consumers visiting fast
food outlets and casual dining
restaurants are more likely to
purchase all forms of bundled
product offers (value meals
only, value meals and other
menu items).
Obj1: To find out
the preference of
consumers between
value meals and
items bought at an
ala carte price
Chi square (�2)
one-sample test
� = 0.05
H2: Factors
considered in meal
choice
H2a1: Low price/Affordable
pricing is a significant factor
influencing consumers in meal
choice.
H2a2: Ease of ordering is a
significant factor influencing
consumers in meal choice.
Obj2: To
determine the
factors why
consumers choose
certain meal items
over all other menu
offerings
Chi square (�2)
one-sample test
� = 0.05
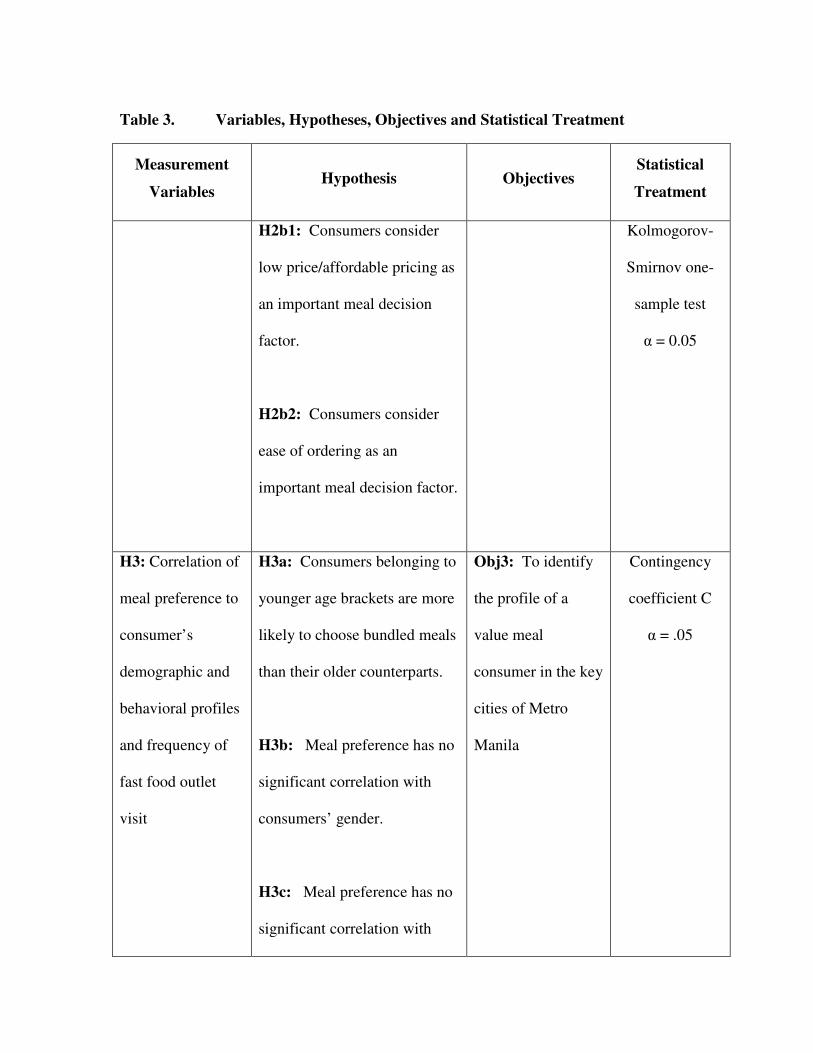
Table 3. Variables, Hypotheses, Objectives and Statistical Treatment
Measurement
Variables Hypothesis Objectives
Statistical
Treatment
H2b1: Consumers consider
low price/affordable pricing as
an important meal decision
factor.
H2b2: Consumers consider
ease of ordering as an
important meal decision factor.
Kolmogorov-
Smirnov one-
sample test
� = 0.05
H3: Correlation of
meal preference to
consumer’s
demographic and
behavioral profiles
and frequency of
fast food outlet
visit
H3a: Consumers belonging to
younger age brackets are more
likely to choose bundled meals
than their older counterparts.
H3b: Meal preference has no
significant correlation with
consumers’ gender.
H3c: Meal preference has no
significant correlation with
Obj3: To identify
the profile of a
value meal
consumer in the key
cities of Metro
Manila
Contingency
coefficient C
� = .05

Table 3. Variables, Hypotheses, Objectives and Statistical Treatment
Measurement
Variables Hypothesis Objectives
Statistical
Treatment
consumers’ civil status.
H3d: Consumers from middle
to lower income households
are more likely to choose
bundled meals than those from
upper income households.
H3e: Meal preference has no
significant correlation with
consumers’ educational
attainment.
H3f: Meal choice is largely
influenced by promotions such
as discounts and give-aways.
H3g: Consumers dining alone
are more likely to choose
bundled meals.
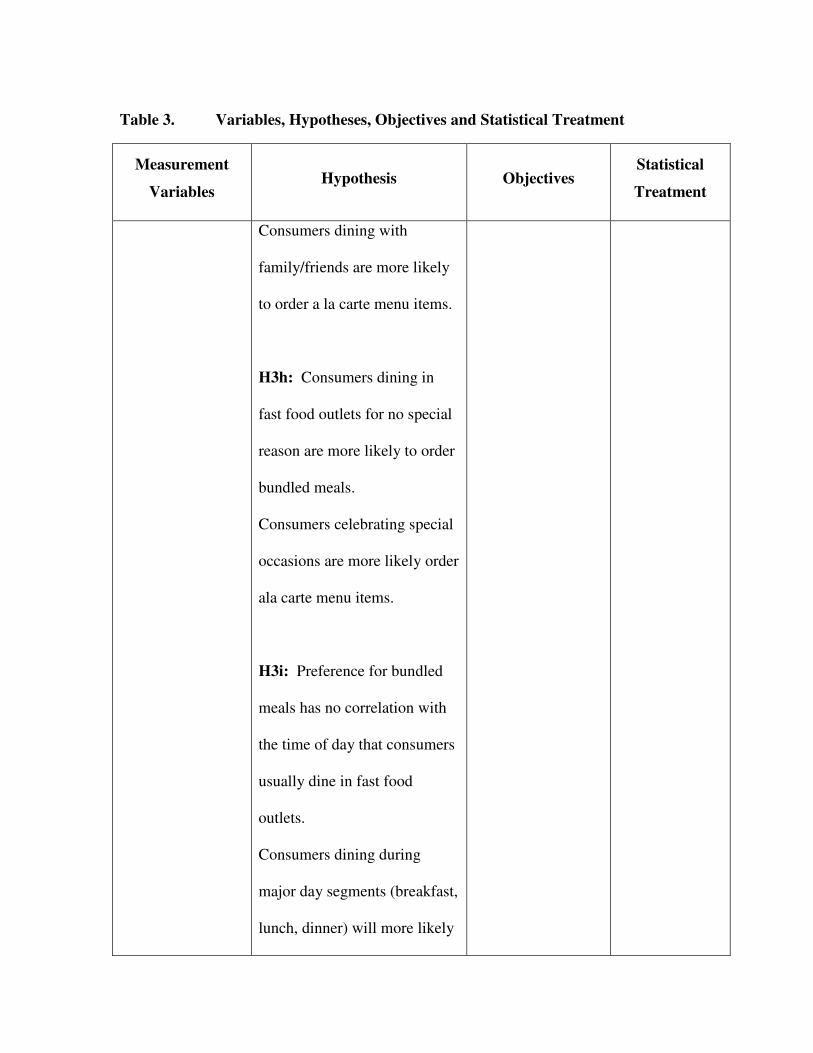
Table 3. Variables, Hypotheses, Objectives and Statistical Treatment
Measurement
Variables Hypothesis Objectives
Statistical
Treatment
Consumers dining with
family/friends are more likely
to order a la carte menu items.
H3h: Consumers dining in
fast food outlets for no special
reason are more likely to order
bundled meals.
Consumers celebrating special
occasions are more likely order
ala carte menu items.
H3i: Preference for bundled
meals has no correlation with
the time of day that consumers
usually dine in fast food
outlets.
Consumers dining during
major day segments (breakfast,
lunch, dinner) will more likely

Table 3. Variables, Hypotheses, Objectives and Statistical Treatment
Measurement
Variables Hypothesis Objectives
Statistical
Treatment
order bundled meals than
consumers dining at odd hours.
H3j: Consumers buying meals
for themselves will more likely
opt for bundled meals than
consumers who buy for others.
H3k: Consumers who
regularly (i.e., more frequent
than once a month) dine in fast
food outlets are more likely to
order bundled meals than
consumers who are not regular
fast food outlet patrons.

CHAPTER IV
PRESENTATION AND DATA ANALYSIS
Generation of closed ended responses to questions on Section C of the survey
questionnaire is the main output of the exploratory research phase of this study. From
Appendix C the focus group discussion (FGD) yielded 13 considerations that fast food
consumers generally take into account when choosing what to order from a menu
selection. The following closed ended responses appear on Section C of the survey
questionnaire:
1. Affordably priced
2. Taste
3. Ease of ordering
4. Completeness of food combinations
5. Big serving size
6. Availability of menu item
7. Affinity towards menu item ("nakasanayan")
8. Trial of new product offering
9. Type of food in mind
10. Promotion (discounts, give-aways)
11. Variety of menu choices
12. Recommendation of others
13. Attractiveness of visual ads

Results of the survey are presented below in the form of frequency tables and
cross tabulations generated using SPSS 13. The hypothesis testing and factor analysis
outputs were likewise ran through the same statistical software and corresponding tables
similarly presented and discussed in support of the decision to accept a hypothesis or not.
Discussion of succeeding results is broken down into sections as presented on the survey
questionnaire. Where applicable, the rest of the FGD results will be incorporated into the
survey findings that follow.
Description of Respondents via Psychographic Profiling
The FGD results revealed the following lifestyle habits and practices that the
target market normally observed:
1. The identified consumer segments generally spend a considerable amount of time
outside their homes. They are only at home when no specific activity is planned.
Thus, the home is seen as a place for relaxation, for doing personal stuff and for
bonding with other household members.
2. Bonding, therefore, is an important aspect of their lives such that most of their
activities are normally done with someone else --- be they friends or family
members. There are seldom occasions when they engage in activities by
themselves.

3. Their leisure activities generally include TV viewing, radio listening, malling,
shopping, eating out and involvement in sports activities.
4. Health consciousness among the older market segment is more apparent. Thus,
engaging in regular sports activities and a cautious food intake relative to
resulting benefits or implications are quite evident.
5. Malling is prevalent among both the young and the older market segments. The
latter, however, sees malling more as a necessity than a want.
6. Dining out is likewise a habitual routine among both market segments. Given that
bonding is important to them, as well as the basic need to feed themselves, dining
out in fast food outlets has become a regular activity done outside the home.
Thus, the study tried to incorporate the above findings into the survey
questionnaire via the 23 lifestyle statements focusing on activities and interests that were
handed to respondents to be rated using a 5-point agree/disagree scale. Statements
garnering the highest top box and top 2 box ratings are tabulated below (Table 4) while
the distribution of ratings for all statements is found on Table 5.

Table 4. Highly Rated Activities and Interests Describing Fast Food Consumers
TOP BOX TOP 2 BOX LIFESTYLE STATEMENTS
Base = 400
I enjoy being in the company of friends and/or family. 71% 89%
It's worth paying extra for quality goods. 56% 86%
I enjoy watching TV and home videos. 40% 70%
I am particular about what I eat. 40% 71%
I like to try out new food products. 40% 75%
I try to eat healthier food these days. 39% 73%
I would like to spend my vacation traveling to far and different places. 37% 59%
I like dining out. 35% 62%
I would rather spend my free time at home than go out. 31% 59%
I am concerned about health but tend not to do much about it. 30% 64%
A majority of target consumers appears to value social interaction and
understands the price of quality. While they seem to enjoy quiet times at home, they
likewise aspire to travel. Health is a concern, as well as food.

Tab
le 5
. A
gree
men
t – D
isag
reem
ent t
o L
ifest
yle
Stat
emen
ts
5 4
3 2
1 L
IFE
STY
LE
ST
AT
EM
EN
TS
No.
%
N
o.
%
No.
%
N
o.
%
No.
%
T
otal
1 W
hen
I see
a n
ew b
rand
on
the
shel
f, I o
ften
buy
it ju
st to
see
wha
t it's
lik
e.
73
18%
11
0 28
%
111
28%
60
15
%
46
12%
40
0
2 It
's w
orth
pay
ing
extr
a fo
r qua
lity
good
s.
223
56%
12
1 30
%
44
11%
6
2%
6 2%
40
0
3 I w
ould
rath
er s
pend
my
free
tim
e at
ho
me
than
go
out.
125
31%
11
1 28
%
92
23%
34
9%
38
10
%
400
4 I a
m c
once
rned
abo
ut h
ealth
but
tend
no
t to
do m
uch
abou
t it.
120
30%
13
6 34
%
89
22%
33
8%
22
6%
40
0
5 I a
m p
artic
ular
abo
ut w
hat I
eat
. 16
0 40
%
125
31%
82
21
%
21
5%
12
3%
400
6 I o
ften
buy
take
-out
mea
ls to
eat
at
hom
e.
76
19%
87
22
%
126
32%
71
18
%
40
10%
40
0
7 I r
eally
enj
oy c
ooki
ng.
111
28%
80
20
%
110
28%
49
12
%
50
13%
40
0
8 I s
hop
arou
nd a
lot t
o ta
ke a
dvan
tage
of
spe
cial
s or
bar
gain
s.
94
24%
10
1 25
%
104
26%
58
15
%
43
11%
40
0
9 I t
ry to
eat
hea
lthie
r foo
d th
ese
days
. 15
7 39
%
134
34%
78
20
%
19
5%
12
3%
400

Tab
le 5
. A
gree
men
t – D
isag
reem
ent t
o L
ifest
yle
Stat
emen
ts
5 4
3 2
1 L
IFE
STY
LE
ST
AT
EM
EN
TS
No.
%
N
o.
%
No.
%
N
o.
%
No.
%
T
otal
10
I lik
e at
tend
ing
soci
al o
ccas
ions
like
w
eddi
ngs,
bir
thda
ys, p
artie
s, e
tc.
83
21%
11
0 28
%
103
26%
43
11
%
61
15%
40
0
11
I lik
e di
ning
out
. 13
9 35
%
108
27%
98
25
%
37
9%
18
5%
400
12
I lik
e sp
endi
ng m
y fr
ee ti
me
in
mal
ls.
86
22%
88
22
%
130
33%
59
15
%
37
9%
400
13
I lik
e to
try
out n
ew fo
od p
rodu
cts.
15
8 40
%
143
36%
74
19
%
20
5%
5 1%
40
0
14
I do
volu
ntee
r wor
k in
my
com
mun
ity o
r in
scho
ol.
58
15%
12
9 32
%
100
25%
56
14
%
57
14%
40
0
15
I enj
oy s
urfi
ng th
e in
tern
et.
96
24%
84
21
%
97
24%
61
15
%
62
16%
40
0
16
I enj
oy w
atch
ing
TV
and
hom
e vi
deos
. 16
1 40
%
120
30%
91
23
%
19
5%
9 2%
40
0
17
I fol
low
the
late
st tr
ends
and
fa
shio
ns.
73
18%
11
8 30
%
134
34%
40
10
%
35
9%
400
18
I lik
e go
ing
to th
e m
ovie
s.
101
25%
10
2 26
%
141
35%
35
9%
21
5%
40
0
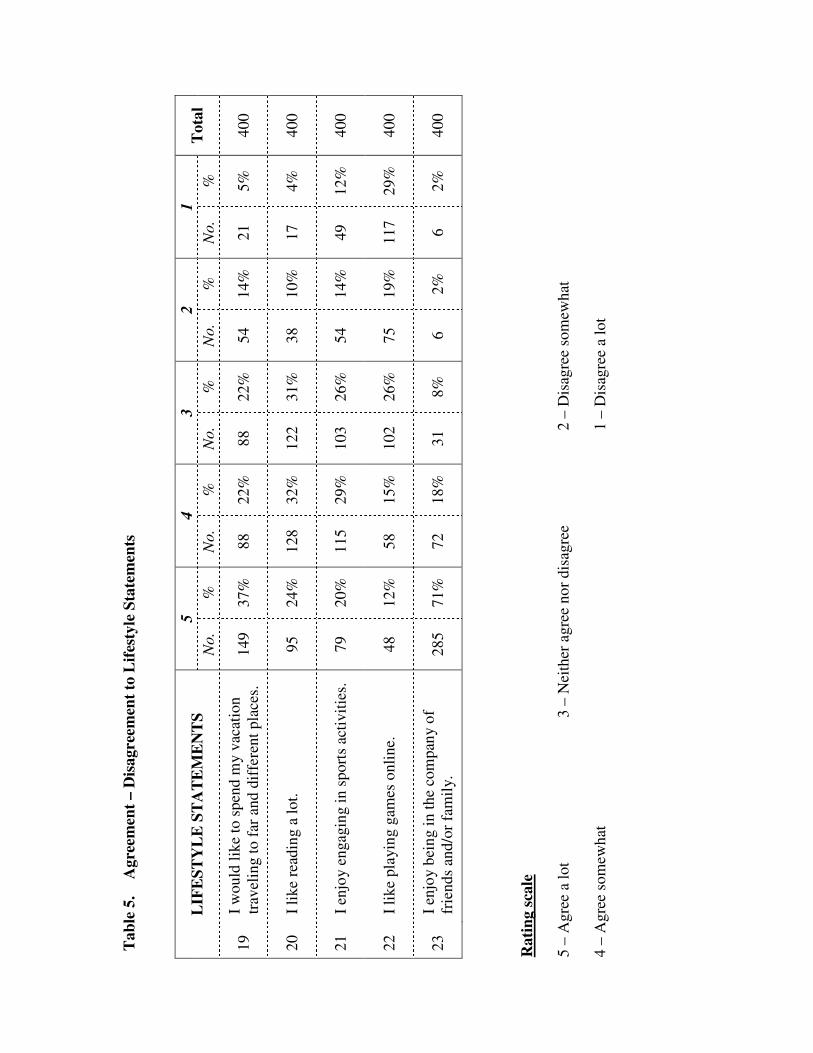
Tab
le 5
. A
gree
men
t – D
isag
reem
ent t
o L
ifest
yle
Stat
emen
ts
5 4
3 2
1 L
IFE
STY
LE
ST
AT
EM
EN
TS
No.
%
N
o.
%
No.
%
N
o.
%
No.
%
T
otal
19
I wou
ld li
ke to
spe
nd m
y va
catio
n tr
avel
ing
to fa
r and
dif
fere
nt p
lace
s.
149
37%
88
22
%
88
22%
54
14
%
21
5%
400
20
I lik
e re
adin
g a
lot.
95
24%
12
8 32
%
122
31%
38
10
%
17
4%
400
21
I enj
oy e
ngag
ing
in s
port
s ac
tiviti
es.
79
20%
11
5 29
%
103
26%
54
14
%
49
12%
40
0
22
I lik
e pl
ayin
g ga
mes
onl
ine.
48
12
%
58
15%
10
2 26
%
75
19%
11
7 29
%
400
23
I enj
oy b
eing
in th
e co
mpa
ny o
f fr
iend
s an
d/or
fam
ily.
285
71%
72
18
%
31
8%
6 2%
6
2%
400
Rat
ing
scal
e
5 –
Agr
ee a
lot
3 –
Nei
ther
agr
ee n
or d
isag
ree
2
– D
isag
ree
som
ewha
t
4 –
Agr
ee s
omew
hat
1 –
Dis
agre
e a
lot

In profiling the target market based on lifestyle patterns, factor analysis was
employed for a) data reduction, i.e., reducing the original 23 statements to a smaller
number of uncorrelated statements to describe the market’s activities and interests, and b)
detection of structure in the relationships among the lifestyle variables, i.e., variable
classification. Results are shown on Tables 6-9.
Table 6 enumerates communalities or variance approximations per statement that
are accounted for --- “initial” as explained by all factors and “extraction” as explained by
the factors that form part of the factor solution. Of particular interest in this table are the
extraction communalities. Note that lifestyle statements 1, 7 and 17 have relatively low
extraction communalities --- implying that only 44%, 48.5% and 49.5% of the respective
variances observed in those 3 variable statements may be accounted for by the factor
solution. Hence, an option to consider is dropping these lifestyle statements from the
analysis.
Table 6. Communalities Initial Extraction
Activities/Interests 1 1.000 0.441 Activities/Interests 2 1.000 0.562 Activities/Interests 3 1.000 0.640 Activities/Interests 4 1.000 0.601 Activities/Interests 5 1.000 0.597 Activities/Interests 6 1.000 0.532 Activities/Interests 7 1.000 0.485 Activities/Interests 8 1.000 0.584 Activities/Interests 9 1.000 0.724
Activities/Interests 10 1.000 0.626 Activities/Interests 11 1.000 0.550 Activities/Interests 12 1.000 0.658 Activities/Interests 13 1.000 0.765 Activities/Interests 14 1.000 0.548 Activities/Interests 15 1.000 0.636
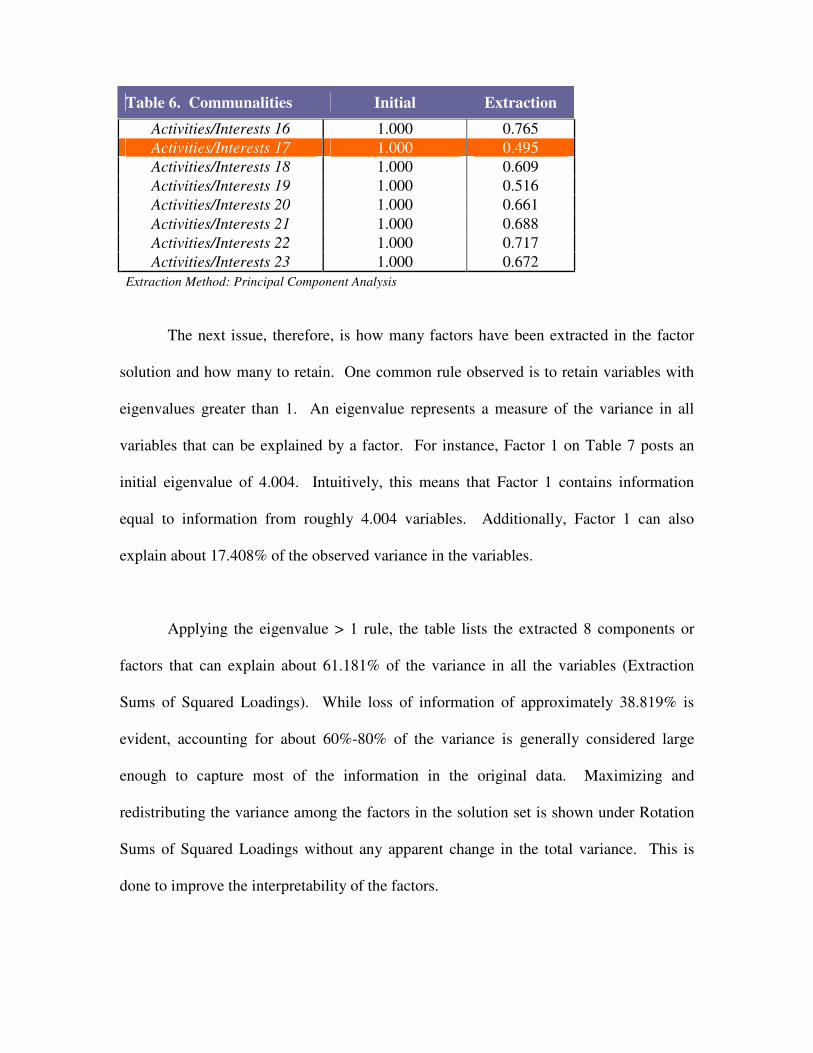
Table 6. Communalities Initial Extraction
Activities/Interests 16 1.000 0.765 Activities/Interests 17 1.000 0.495 Activities/Interests 18 1.000 0.609 Activities/Interests 19 1.000 0.516 Activities/Interests 20 1.000 0.661 Activities/Interests 21 1.000 0.688 Activities/Interests 22 1.000 0.717 Activities/Interests 23 1.000 0.672
Extraction Method: Principal Component Analysis
The next issue, therefore, is how many factors have been extracted in the factor
solution and how many to retain. One common rule observed is to retain variables with
eigenvalues greater than 1. An eigenvalue represents a measure of the variance in all
variables that can be explained by a factor. For instance, Factor 1 on Table 7 posts an
initial eigenvalue of 4.004. Intuitively, this means that Factor 1 contains information
equal to information from roughly 4.004 variables. Additionally, Factor 1 can also
explain about 17.408% of the observed variance in the variables.
Applying the eigenvalue > 1 rule, the table lists the extracted 8 components or
factors that can explain about 61.181% of the variance in all the variables (Extraction
Sums of Squared Loadings). While loss of information of approximately 38.819% is
evident, accounting for about 60%-80% of the variance is generally considered large
enough to capture most of the information in the original data. Maximizing and
redistributing the variance among the factors in the solution set is shown under Rotation
Sums of Squared Loadings without any apparent change in the total variance. This is
done to improve the interpretability of the factors.
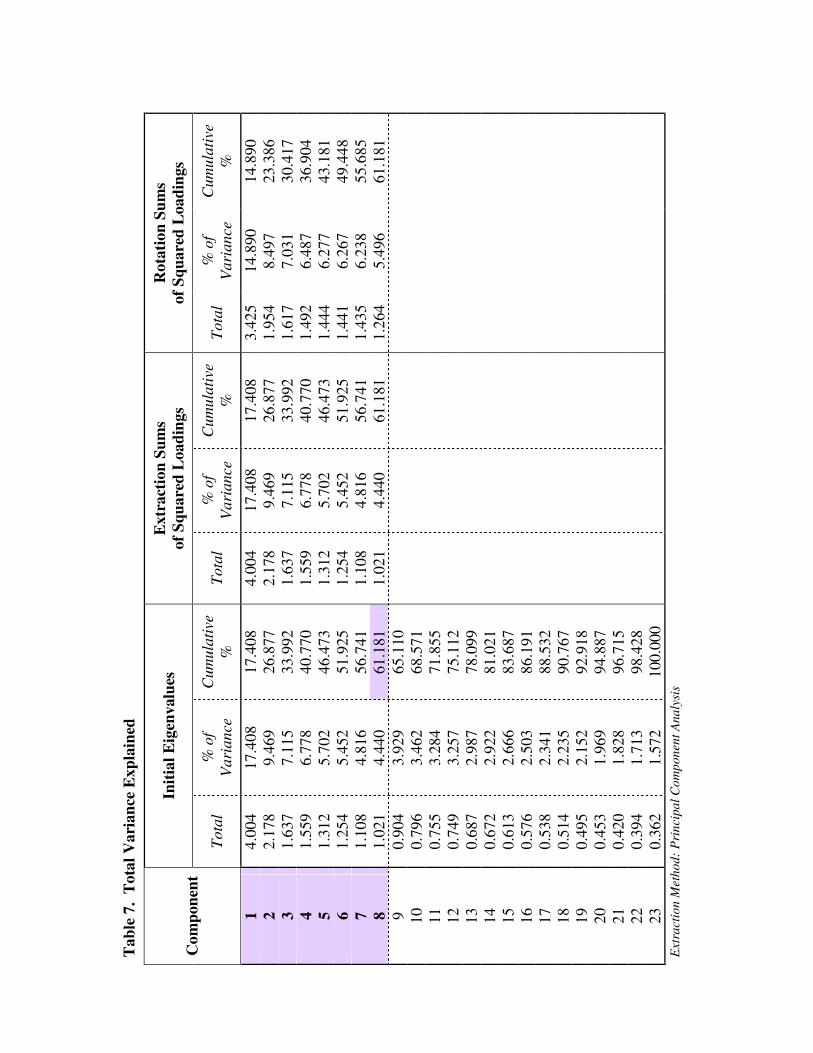
Tab
le 7
. T
otal
Var
ianc
e E
xpla
ined
Initi
al E
igen
valu
es
Ext
ract
ion
Sum
s of
Squ
ared
Loa
ding
s R
otat
ion
Sum
s of
Squ
ared
Loa
ding
s C
ompo
nent
To
tal
% o
f V
aria
nce
Cum
ulat
ive
%
Tota
l %
of
Var
ianc
e C
umul
ativ
e %
To
tal
% o
f V
aria
nce
Cum
ulat
ive
%
1 4.
004
17.4
08
17.4
08
4.00
4 17
.408
17
.408
3.
425
14.8
90
14.8
90
2 2.
178
9.46
9 26
.877
2.
178
9.46
9 26
.877
1.
954
8.49
7 23
.386
3
1.63
7 7.
115
33.9
92
1.63
7 7.
115
33.9
92
1.61
7 7.
031
30.4
17
4 1.
559
6.77
8 40
.770
1.
559
6.77
8 40
.770
1.
492
6.48
7 36
.904
5
1.31
2 5.
702
46.4
73
1.31
2 5.
702
46.4
73
1.44
4 6.
277
43.1
81
6 1.
254
5.45
2 51
.925
1.
254
5.45
2 51
.925
1.
441
6.26
7 49
.448
7
1.10
8 4.
816
56.7
41
1.10
8 4.
816
56.7
41
1.43
5 6.
238
55.6
85
8 1.
021
4.44
0 61
.181
1.
021
4.44
0 61
.181
1.
264
5.49
6 61
.181
9
0.90
4 3.
929
65.1
10
10
0.79
6 3.
462
68.5
71
11
0.75
5 3.
284
71.8
55
12
0.74
9 3.
257
75.1
12
13
0.68
7 2.
987
78.0
99
14
0.67
2 2.
922
81.0
21
15
0.61
3 2.
666
83.6
87
16
0.57
6 2.
503
86.1
91
17
0.53
8 2.
341
88.5
32
18
0.51
4 2.
235
90.7
67
19
0.49
5 2.
152
92.9
18
20
0.45
3 1.
969
94.8
87
21
0.42
0 1.
828
96.7
15
22
0.39
4 1.
713
98.4
28
23
0.36
2 1.
572
100.
000
Ext
ract
ion
Met
hod:
Pri
ncip
al C
ompo
nent
Ana
lysi
s
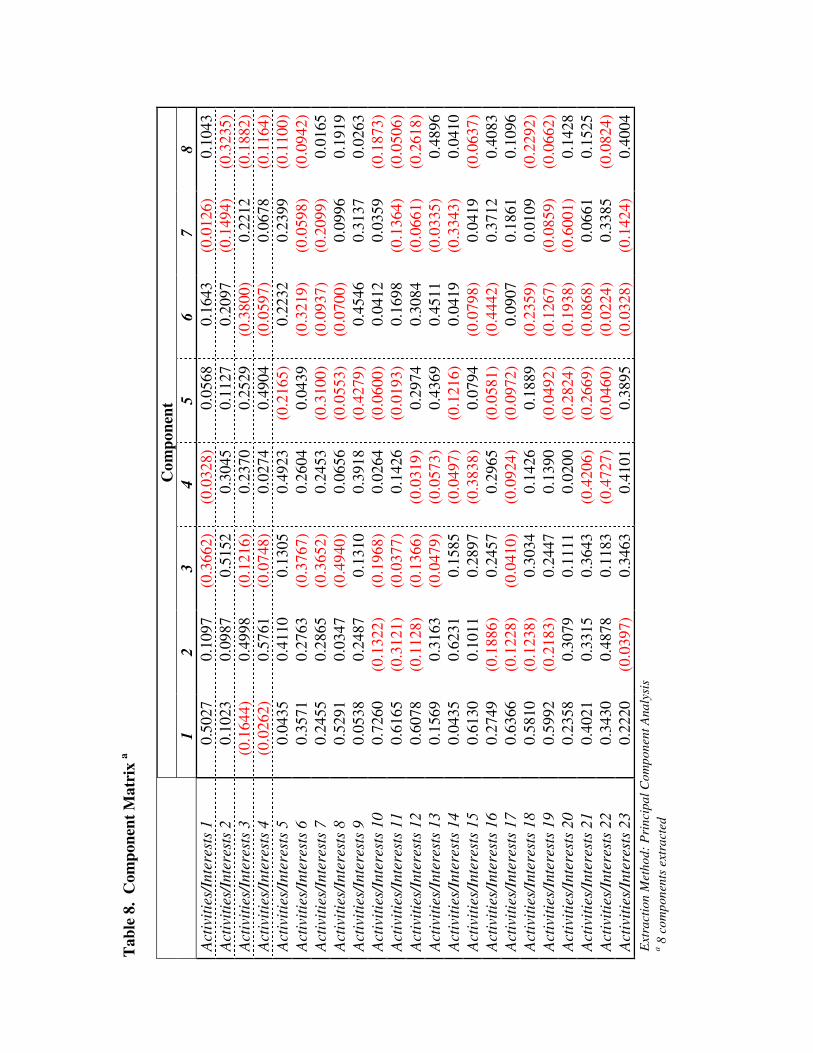
Tab
le 8
. C
ompo
nent
Mat
rix
a
Com
pone
nt
1
2 3
4 5
6 7
8 A
ctiv
ities
/Int
eres
ts 1
0.
5027
0.
1097
(0
.366
2)
(0.0
328)
0.
0568
0.
1643
(0
.012
6)
0.10
43
Act
iviti
es/I
nter
ests
2
0.10
23
0.09
87
0.51
52
0.30
45
0.11
27
0.20
97
(0.1
494)
(0
.323
5)
Act
iviti
es/I
nter
ests
3
(0.1
644)
0.
4998
(0
.121
6)
0.23
70
0.25
29
(0.3
800)
0.
2212
(0
.188
2)
Act
iviti
es/I
nter
ests
4
(0.0
262)
0.
5761
(0
.074
8)
0.02
74
0.49
04
(0.0
597)
0.
0678
(0
.116
4)
Act
iviti
es/I
nter
ests
5
0.04
35
0.41
10
0.13
05
0.49
23
(0.2
165)
0.
2232
0.
2399
(0
.110
0)
Act
iviti
es/I
nter
ests
6
0.35
71
0.27
63
(0.3
767)
0.
2604
0.
0439
(0
.321
9)
(0.0
598)
(0
.094
2)
Act
iviti
es/I
nter
ests
7
0.24
55
0.28
65
(0.3
652)
0.
2453
(0
.310
0)
(0.0
937)
(0
.209
9)
0.01
65
Act
iviti
es/I
nter
ests
8
0.52
91
0.03
47
(0.4
940)
0.
0656
(0
.055
3)
(0.0
700)
0.
0996
0.
1919
A
ctiv
ities
/Int
eres
ts 9
0.
0538
0.
2487
0.
1310
0.
3918
(0
.427
9)
0.45
46
0.31
37
0.02
63
Act
iviti
es/I
nter
ests
10
0.72
60
(0.1
322)
(0
.196
8)
0.02
64
(0.0
600)
0.
0412
0.
0359
(0
.187
3)
Act
iviti
es/I
nter
ests
11
0.61
65
(0.3
121)
(0
.037
7)
0.14
26
(0.0
193)
0.
1698
(0
.136
4)
(0.0
506)
A
ctiv
ities
/Int
eres
ts 1
2 0.
6078
(0
.112
8)
(0.1
366)
(0
.031
9)
0.29
74
0.30
84
(0.0
661)
(0
.261
8)
Act
iviti
es/I
nter
ests
13
0.15
69
0.31
63
(0.0
479)
(0
.057
3)
0.43
69
0.45
11
(0.0
335)
0.
4896
A
ctiv
ities
/Int
eres
ts 1
4 0.
0435
0.
6231
0.
1585
(0
.049
7)
(0.1
216)
0.
0419
(0
.334
3)
0.04
10
Act
iviti
es/I
nter
ests
15
0.61
30
0.10
11
0.28
97
(0.3
838)
0.
0794
(0
.079
8)
0.04
19
(0.0
637)
A
ctiv
ities
/Int
eres
ts 1
6 0.
2749
(0
.188
6)
0.24
57
0.29
65
(0.0
581)
(0
.444
2)
0.37
12
0.40
83
Act
iviti
es/I
nter
ests
17
0.63
66
(0.1
228)
(0
.041
0)
(0.0
924)
(0
.097
2)
0.09
07
0.18
61
0.10
96
Act
iviti
es/I
nter
ests
18
0.58
10
(0.1
238)
0.
3034
0.
1426
0.
1889
(0
.235
9)
0.01
09
(0.2
292)
A
ctiv
ities
/Int
eres
ts 1
9 0.
5992
(0
.218
3)
0.24
47
0.13
90
(0.0
492)
(0
.126
7)
(0.0
859)
(0
.066
2)
Act
iviti
es/I
nter
ests
20
0.23
58
0.30
79
0.11
11
0.02
00
(0.2
824)
(0
.193
8)
(0.6
001)
0.
1428
A
ctiv
ities
/Int
eres
ts 2
1 0.
4021
0.
3315
0.
3643
(0
.420
6)
(0.2
669)
(0
.086
8)
0.06
61
0.15
25
Act
iviti
es/I
nter
ests
22
0.34
30
0.48
78
0.11
83
(0.4
727)
(0
.046
0)
(0.0
224)
0.
3385
(0
.082
4)
Act
iviti
es/I
nter
ests
23
0.22
20
(0.0
397)
0.
3463
0.
4101
0.
3895
(0
.032
8)
(0.1
424)
0.
4004
E
xtra
ctio
n M
etho
d: P
rinc
ipal
Com
pone
nt A
naly
sis
a 8 c
ompo
nent
s ex
trac
ted
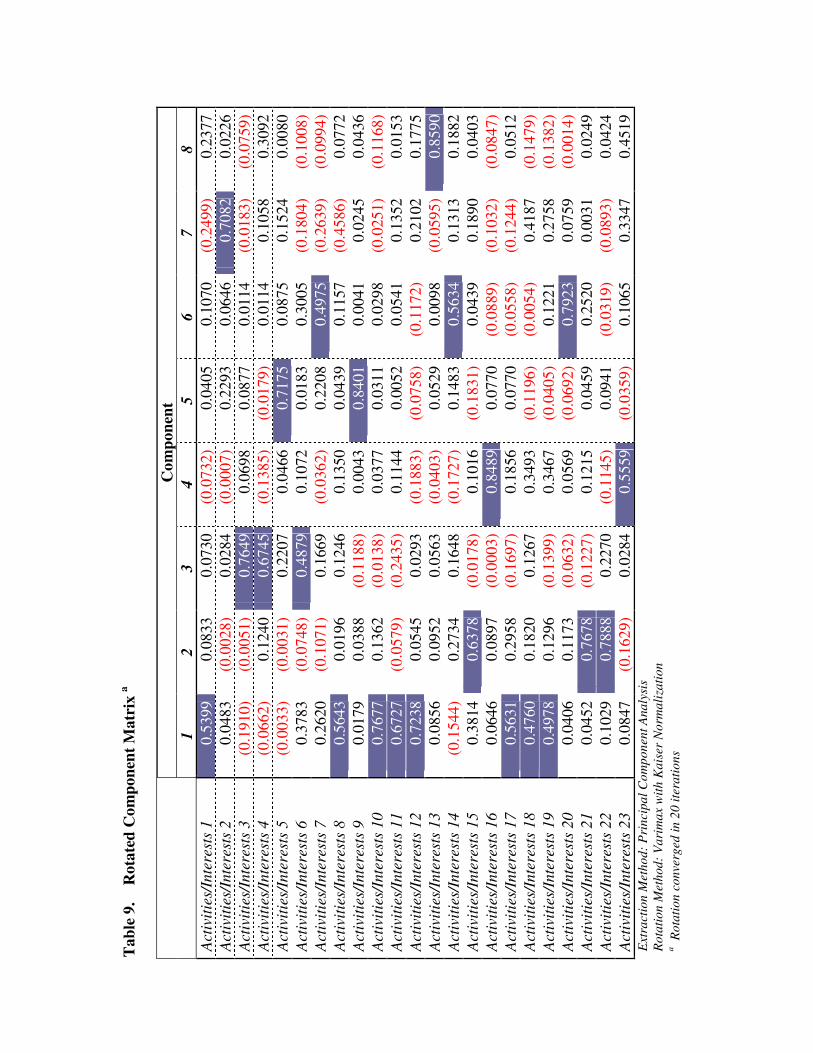
Tab
le 9
. R
otat
ed C
ompo
nent
Mat
rix
a
Com
pone
nt
1
2 3
4 5
6 7
8 A
ctiv
ities
/Int
eres
ts 1
0.
5399
0.
0833
0.
0730
(0
.073
2)
0.04
05
0.10
70
(0.2
499)
0.
2377
A
ctiv
ities
/Int
eres
ts 2
0.
0483
(0
.002
8)
0.02
84
(0.0
007)
0.
2293
0.
0646
0.
7082
0.
0226
A
ctiv
ities
/Int
eres
ts 3
(0
.191
0)
(0.0
051)
0.
7649
0.
0698
0.
0877
0.
0114
(0
.018
3)
(0.0
759)
A
ctiv
ities
/Int
eres
ts 4
(0
.066
2)
0.12
40
0.67
45
(0.1
385)
(0
.017
9)
0.01
14
0.10
58
0.30
92
Act
iviti
es/I
nter
ests
5
(0.0
033)
(0
.003
1)
0.22
07
0.04
66
0.71
75
0.08
75
0.15
24
0.00
80
Act
iviti
es/I
nter
ests
6
0.37
83
(0.0
748)
0.
4879
0.
1072
0.
0183
0.
3005
(0
.180
4)
(0.1
008)
A
ctiv
ities
/Int
eres
ts 7
0.
2620
(0
.107
1)
0.16
69
(0.0
362)
0.
2208
0.
4975
(0
.263
9)
(0.0
994)
A
ctiv
ities
/Int
eres
ts 8
0.
5643
0.
0196
0.
1246
0.
1350
0.
0439
0.
1157
(0
.458
6)
0.07
72
Act
iviti
es/I
nter
ests
9
0.01
79
0.03
88
(0.1
188)
0.
0043
0.
8401
0.
0041
0.
0245
0.
0436
A
ctiv
ities
/Int
eres
ts 1
0 0.
7677
0.
1362
(0
.013
8)
0.03
77
0.03
11
0.02
98
(0.0
251)
(0
.116
8)
Act
iviti
es/I
nter
ests
11
0.67
27
(0.0
579)
(0
.243
5)
0.11
44
0.00
52
0.05
41
0.13
52
0.01
53
Act
iviti
es/I
nter
ests
12
0.72
38
0.05
45
0.02
93
(0.1
883)
(0
.075
8)
(0.1
172)
0.
2102
0.
1775
A
ctiv
ities
/Int
eres
ts 1
3 0.
0856
0.
0952
0.
0563
(0
.040
3)
0.05
29
0.00
98
(0.0
595)
0.
8590
A
ctiv
ities
/Int
eres
ts 1
4 (0
.154
4)
0.27
34
0.16
48
(0.1
727)
0.
1483
0.
5634
0.
1313
0.
1882
A
ctiv
ities
/Int
eres
ts 1
5 0.
3814
0.
6378
(0
.017
8)
0.10
16
(0.1
831)
0.
0439
0.
1890
0.
0403
A
ctiv
ities
/Int
eres
ts 1
6 0.
0646
0.
0897
(0
.000
3)
0.84
89
0.07
70
(0.0
889)
(0
.103
2)
(0.0
847)
A
ctiv
ities
/Int
eres
ts 1
7 0.
5631
0.
2958
(0
.169
7)
0.18
56
0.07
70
(0.0
558)
(0
.124
4)
0.05
12
Act
iviti
es/I
nter
ests
18
0.47
60
0.18
20
0.12
67
0.34
93
(0.1
196)
(0
.005
4)
0.41
87
(0.1
479)
A
ctiv
ities
/Int
eres
ts 1
9 0.
4978
0.
1296
(0
.139
9)
0.34
67
(0.0
405)
0.
1221
0.
2758
(0
.138
2)
Act
iviti
es/I
nter
ests
20
0.04
06
0.11
73
(0.0
632)
0.
0569
(0
.069
2)
0.79
23
0.07
59
(0.0
014)
A
ctiv
ities
/Int
eres
ts 2
1 0.
0452
0.
7678
(0
.122
7)
0.12
15
0.04
59
0.25
20
0.00
31
0.02
49
Act
iviti
es/I
nter
ests
22
0.10
29
0.78
88
0.22
70
(0.1
145)
0.
0941
(0
.031
9)
(0.0
893)
0.
0424
A
ctiv
ities
/Int
eres
ts 2
3 0.
0847
(0
.162
9)
0.02
84
0.55
59
(0.0
359)
0.
1065
0.
3347
0.
4519
E
xtra
ctio
n M
etho
d: P
rinc
ipal
Com
pone
nt A
naly
sis
Rot
atio
n M
etho
d: V
arim
ax w
ith K
aise
r N
orm
aliz
atio
n a R
otat
ion
conv
erge
d in
20
itera
tions

The two preceding tables show the respective factor loadings for each variable
(lifestyle statement) on the unrotated components (Table 8) and the rotated components
(Table 9). As the central output for factor analysis, the factor loadings represent the
correlation coefficients between the factors and variables and form the bases for labeling
the factors in the solution set. Loadings of at least 0.6 are generally considered high vis-
à-vis 0.4 as considerably low. Between the unrotated component and rotated component
matrices, the latter matrix presents a more readable output as to which lifestyle statement
loads heavily on a factor (note highlighted cells).
The 8 factors in the solution set are as follows. Labels have likewise been
provided to classify the lifestyle statements for ease of interpretation. Note that the
labeling process is rather subjective and the labels that follow are those that seem to make
the most sense.
Factor 1: “Experiencer”
a. When I see a new brand on the shelf, I often buy it just to see what it's like.
b. I shop around a lot to take advantage of specials or bargains.
c. I like attending social occasions like weddings, birthdays, parties, etc.
d. I like dining out.
e. I like spending my free time in malls.
f. I follow the latest trends and fashions.
g. I like going to the movies.
h. I would like to spend my vacation traveling to far and different places.

Factor 2: “It/Sports Enthusiast”
a. I enjoy surfing the internet.
b. I enjoy engaging in sports activities.
c. I like playing games online.
Factor 3: “Home-centered”
a. I would rather spend my free time at home than go out.
b. I am concerned about health but tend not to do much about it.
c. I often buy take-out meals to eat at home.
Factor 4: “Entertainment-oriented”
a. I enjoy watching TV and home videos.
b. I enjoy being in the company of friends and/or family.
Factor 5: “Health conscious”
a. I am particular about what I eat.
b. I try to eat healthier food these days.
Factor 6: “Spends time wisely”
a. I really enjoy cooking.
b. I do volunteer work in my community or in school.
c. I like reading a lot.

Factor 7: “Quality-focused”
a. It's worth paying extra for quality goods.
Factor 8: “Risk-taker”
a. I like to try out new food products.
Value meal consumers may, thus, be described to fall into any of these 8
segments. They may be experiencers or those who love social activities and new
products, are fashion-oriented and like to travel. There are some who might be described
as adventure seekers who love both the outdoor (sports) and indoor (internet surfing,
online gaming) activities. Still another segment is fond of spending quiet times at home.
Entertainment for some is key as they prefer to be in the company of friends and relatives
or when by themselves, would prefer to watch movies or home videos. Health is one
concern, as well as wise use of their spare time as evidenced by hobbies or community
work. They may be rather discriminating when buying because they wouldn’t mind
spending more for quality. Another segment may be described as risk-takers when it
comes to food choice as they are not apprehensive about trying out new food products.
Further tests using these descriptors may be done in future studies to find out
which segments the target market seems to cluster most or if these lifestyle variables do
affect menu choice.

Dining in Fast Food Outlets
The FGD results revealed that eating out is a habitual practice given that the target
market spent most of their time outside their homes and that there is a prevalence of
several food outlets in the metropolis. Dining in was generally the more common service
availed of when in fast food outlets compared to either take-out or delivery. This was
validated when survey results pointed to a majority (66%) of responses among total
respondents clustering around the “once a week” to “2-6x a week” dining out
frequencies, with the “2-6x a week” frequency posting the most mentions from about 4-
in-10 of target consumers. The remaining fourth of respondents visited fast food outlets
at least once a week (Table 10).
A similar clustering of responses consistent across gender and age groups was
evident within the same dining out frequencies --- at least once a week to at most 6x
times a week (Table 10).
Table 10. Frequency of Dining in a Fast Food Outlet by Gender and Age Groups
Gender Age Groups Total FREQUENCY OF DINING
OUT Male Female 15-24 25-34 35-44 45-60 No. %
Everyday 5% 6% 5% 7% 2% 7% 22 6%
2-6 times a week 45% 38% 49% 42% 34% 34% 165 41%

Table 10. Frequency of Dining in a Fast Food Outlet by Gender and Age Groups
Gender Age Groups Total FREQUENCY OF DINING
OUT Male Female 15-24 25-34 35-44 45-60 No. %
Once a week 22% 28% 23% 22% 27% 33% 101 25%
2-3 times a month 18% 18% 15% 20% 27% 11% 72 18%
Once a month 6% 4% 1% 7% 8% 6% 20 5%
Less than once a month 2% 2% 2% 1% 1% 6% 8 2%
Once every 2 months 1% 1% 2% 0% 0% 3% 4 1%
Less than once every 2 months 0% 0% 1% 0% 0% 0% 1 0%
Less than once every 3 months 2% 2% 3% 2% 1% 0% 7 2%
191 209 130 117 83 70 Total 100% 100% 100% 100% 100% 100% 400 100%
Trial of almost all fast food outlets is apparent in the FGD results, with mentions
recorded for McDonald’s, Jollibee, KFC, Pizza Hut, Greenwich, Chowking, Burger King
and Shakey’s. Regular patronage, however, was reserved for the first three fast food
outlets (i.e., McDonald’s, Jollibee, KFC). This was validated in the survey results that
follow.

When asked which fast food outlet total respondents visited most often, Jollibee
garnered the most mentions at 32%. Regular patronage of the McDonald’s outlet came in
a close second from among a fourth of respondents, while KFC trailed behind with a 12%
share (Table 11). Note that this was likewise the trend observed across male and female
target consumers. Regular patronage across age groups, however, was markedly different
among the 15-24 bracket where shares between Jollibee and McDonald’s were almost the
similar, while those aged 45-60 patronized less of these two fast food outlets.
Table 11. Fast Food Outlet Dined In Most Often
Gender Age Groups Total FAST FOOD OUTLET Male Female 15-24 25-34 35-44 45-60 No. %
Jollibee 32% 32% 33% 34% 35% 23% 128 32% McDonald's 21% 25% 34% 21% 14% 19% 94 24%
KFC 11% 13% 9% 15% 12% 11% 48 12% Maxim's Tea House 1% 0% 1% 0% 0% 0% 43 11%
Chowking 8% 8% 7% 9% 8% 9% 32 8%
Pizza Hut 1% 1% 1% 1% 1% 1% 10 3%
Greenwich 3% 1% 2% 1% 4% 1% 8 2%
Tokyo Tokyo 1% 0% 0% 0% 0% 1% 8 2%
Shakey's 2% 1% 2% 1% 2% 3% 7 2%
Goldilocks 2% 3% 3% 1% 1% 6% 4 1%
Sbarro 1% 0% 1% 0% 1% 1% 3 1%
Wendy's 2% 2% 2% 1% 1% 4% 2 1%
Burger King 12% 10% 5% 14% 16% 11% 1 0%
Red Ribbon 1% 0% 0% 0% 1% 1% 1 0%
Others 3% 2% 1% 3% 2% 7% 11 3%
191 209 130 117 83 70 Total 100% 100% 100% 100% 100% 100% 400 100%

Meal Preference
The target market’s dining out experience was further examined to find out what
particular meal type they usually order when in fast food outlets. The FGD results noted
value meals as the more prevalent menu choice when in fast food outlets.
When surveyed, a majority confirmed this exploratory finding as 58% of the
target market indicated preference for value meals and other menu items (Table 12).
Additionally, approximately 3 out of every 10 of total respondents ordered value meals
only. Hence, a total 86% of target consumers were likely to order value meals (whether
individually or with other a la carte menu items) when dining out in fast food outlets.
Table 12. Type of Meal Usually Ordered when Dining in a Fast Food Outlet
MEAL ORDERED No. %
Value meal only 110 28%
Value meal and other items in the menu 233 58%
Individual menu items only 57 14%
Total 400 100%
When tested for significance (Table 13), results yielded acceptance of hypothesis
H1: Consumers visiting fast food outlets and casual dining restaurants are more likely to
purchase all forms of bundled product offers (value meals only, value meals and other
menu items) at � = .05. A la carte menu items are, therefore, the less popular food choice
among food outlet patrons.

Table 13. Chi Square One-Sample Test Statistics: What Usually Order in a Fast Food Outlet
Observed N Expected N Residual Value meal only 110 133.3 -23.3 Value meal and other items in the menu 233 133.3 99.7 Individual menu items only 57 133.3 -76.3
Total 400 Chi-Square(a) 122.285 Df 2 Asymp. Sig. .000
a 0 cells (.0%) have expected frequencies less than 5. The minimum expected cell frequency is 133.3.
As a further check for consistency, when respondents were asked what they
ordered the last time they were at a fast food outlet. And true enough, a collective
majority did mention value meals, as well as other menu items (Table 14).
Table 14. Type of Meal Ordered the Last Time Dined in a Fast Food Outlet
MEAL ORDERED No. %
Value meal only 130 32%
Value meal and other items in the menu 220 55%
Individual menu items only 50 12%
Total 400 100%
Those who indicated preference for value meals only or in combination with other
menu items were asked from which fast food outlet they ordered these meals the last time
they dined out. Similarly, the top two fast food outlets, Jollibee and McDonald’s,
previously frequented by the identified target market consistently emerged as the most

mentioned outlets they were at the last time they dined out --- implying a strong sense of
brand loyalty towards these fast food outlets (Table 15).
Note that Maxim’s Tea House managed to come in third surpassing KFC.
Maxim’s Tea House’s “outlet dined in most often” share was 11% (Table 11) vs. its share
of 14% as the “outlet dined in the last time ordered a value meal” (Table 15). This
seeming consistency may be attributed to all respondents being intercepted inside
Maxim’s and were probably regular patrons. This result may have been incidental in this
study; hence, repeating this under different data gathering parameters will probably not
yield similar results relative to Maxim’s patronage shares.
Table 15. Fast Food Outlet Dined In the Last Time Ordered a Value Meal
FAST FOOD OUTLET No. %
Jollibee 105 30% McDonald's 69 20% Maxim's Tea House 50 14% KFC 35 10% Chowking 28 8% Tokyo Tokyo 9 3% Greenwich 8 2% Burger King 7 2% Wendy's 7 2% Pizza Hut 6 2% Goldilocks 4 1% Shakey's 2 1% Sbarro 2 1% Others 18 5%
Total 350 100%

Another area of interest was establishing whether there existed any correlation
between frequency of dining out and purchase likelihood of a particular menu item. The
following cross tabulation (Table 16) showed that a majority of target consumers who
regularly (i.e., more frequent than once a month) dined out showed no particular leaning
towards a menu offering. The clustering of responses across all menu offerings was
consistently observed to fall within the “once a week” and “2-6x a week” dining out
frequencies.
Table 16. Frequency of Dining in a Fast Food Outlet vs. What Usually Order in a Fast Food Outlet
MEAL
ORDERED DINING FREQUENCY
Value meal only
Value meal and other items in the
menu
Individual menu items
only Total
Everyday 10 8 4 22 2-6 times a week 43 98 24 165 Once a week 27 58 16 101 2-3 times a month 15 49 8 72 Once a month 9 10 1 20 Less than once a month 0 6 2 8 Once every 2 months 3 0 1 4 Less than once every 2 months 0 1 0 1 Less than once every 3 months 3 3 1 7
Total 110 233 57 400
Hence, testing for significance (Table 17) validated the preceding observation of
no difference between both variables given that the probability of occurrence associated
with the test statistic is definitely greater than � = .05. Thus, hypothesis H3k:
Consumers who regularly (i.e., more frequent than once a month) dine in food outlets are
more likely to order bundled meals than consumers who are not regular food outlet

patrons cannot be accepted at the predetermined � = .05. The likelihood of ordering
value meals is not dependent on the frequency of dining in food outlets.
Table 17. Contingency Coefficient Test Statistics: Frequency of Dining in a Fast
Food Outlet vs. What Usually Order in a Fast Food Outlet
Symmetric Measures Value Approx. Sig. Nominal by Nominal Contingency Coefficient 0.230 0.134 N of Valid Cases …………………………………. 400
Factors Considered in Meal Choice
A predetermined list of considerations relevant to selecting a particular item from
among all other items on the menu was provided to respondents as they were asked to
identify which of these factors were important to them in their food choice. Multiple
answers were allowed per respondent. The following tabulation (Table 18) revealed
price and taste considerations as foremost in a majority of respondents’ minds when
deciding what particular meal to order at fast food outlets.
Table 18. Factors Considered Important when Choosing a Particular Menu Item
FACTORS No. %
Affordably priced 292 73% Taste 246 62% Ease of ordering 121 30% Completeness of food combinations 100 25% Big serving size 99 25% Availability of menu item 87 22% Affinity towards menu item ("nakasanayan") 66 17% Trial of new product offering 52 13%

Table 18. Factors Considered Important when Choosing a Particular Menu Item
FACTORS No. % Type of food in mind 50 13% Promotion (discounts, give-aways) 47 12% Variety of menu choices 41 10% Recommendation of others 38 10% Attractiveness of visual ads 32 8% Others 2 1%
Testing the above for significance (Table 19) substantiated hypothesis H2a1:
Low price/Affordable pricing is a significant factor influencing consumers in meal choice
at the predetermined � = .05. Price sensitivity is, therefore, an issue among consumers
when deciding what to order when dining in food outlets --- giving weight to the
prevalence of value meals as common food choices.
Hypothesis H2a2: Ease of ordering is a significant factor influencing consumers
in meal choice, however, cannot be accepted at � = .05. While it may be argued that
“ease of ordering” and “completeness of food combinations” likewise garnered sizeable
mentions, this study chose to limit the choice of factors to only those posting a majority
of “Yes” mentions. This is the logical decision given that the test statistics confirmed a
significance of response proportions to both “Yes” and “No” options across factors. That
is, the breakdown of responses for “ease of ordering” and all factors following it posted
significance for the “No” responses (not important). The target consumers, therefore, are
not greatly influenced by said factors in menu selection (value meals or otherwise) when
in fast food outlets.

Table 19. Chi Square Test Statistics: Factors Considered Important in Meal
Choice
Whether consider factor as important
or not FACTOR
Yes No
Chi-Square
a df Asymp.
Sig.
Affordably priced 292 108 84.64 1 0.000 Taste 246 154 62.41 1 0.000 Ease of ordering 121 279 127.69 1 0.000 Completeness of food combinations 100 300 100.00 1 0.000 Big serving size 99 301 21.16 1 0.000 Availability of menu item 87 313 102.01 1 0.000 Affinity towards menu item ("nakasanayan") 66 334 179.56 1 0.000
Trial of new product offering 52 348 219.04 1 0.000 Type of food in mind 50 350 282.24 1 0.000 Promotion (discounts, give-aways) 47 353 225.00 1 0.000 Variety of menu choices 41 359 234.09 1 0.000 Recommendation of others 38 362 262.44 1 0.000 Attractiveness of visual ads 32 368 252.81 1 0.000 Others 2 398 392.04 1 0.000
a 0 cells (.0%) have expected frequencies less than 5. The minimum expected cell frequency is 200.0. Having identified which factors were deemed important in menu item selection,
the next step involved determining the degree of importance that the target market
attached to each of these factors. Factor ratings of “5” and “4” should be able to provide
a fairly indicative measure of importance. However, top box ratings (“5”), ideally,
provide the best indication of the target market’s sentiments towards any particular
factor. Thus, considering top 2 box ratings (“5” & “4”) on importance receiving a
majority of mentions as exhibited on Table 20 would indiscriminately lead to the
conclusion that consumers are influenced by all identified factors relative to menu

selection. But limiting the choice to just top box ratings with scores higher than 50%
once more singled out “taste” and “affordably priced” as the principal determinants of
what consumers would usually order at a fast food outlet.
When tested for significance (Table 21), the Kolmogorov-Smirnov test confirmed
that the observed clustering of responses on certain importance ratings for each decision
factor was significantly different across the 5-point importance scale --- consistent across
all factors. But as earlier stated, the concentration of responses was observed to fall only
between ratings “5” and “4” across all decision factors --- implying that target consumers
were not too keen on determining the degree of importance that each factor exerted on
their menu selection process. However, it has earlier been argued on that this study will
discriminately select such factors with majority top box ratings on importance. Hence,
between hypotheses H2b1 and H2b2 enumerated on Table 19, the study accepts only
H2b1, i.e., low price/affordable pricing as an important factor that highly influence
consumers in their choice of menu items to order when dining in fast food outlets. Thus,
the consumers’ decision to order value meals when in food outlets is significantly
affected more by low price/affordable pricing than any other factor.
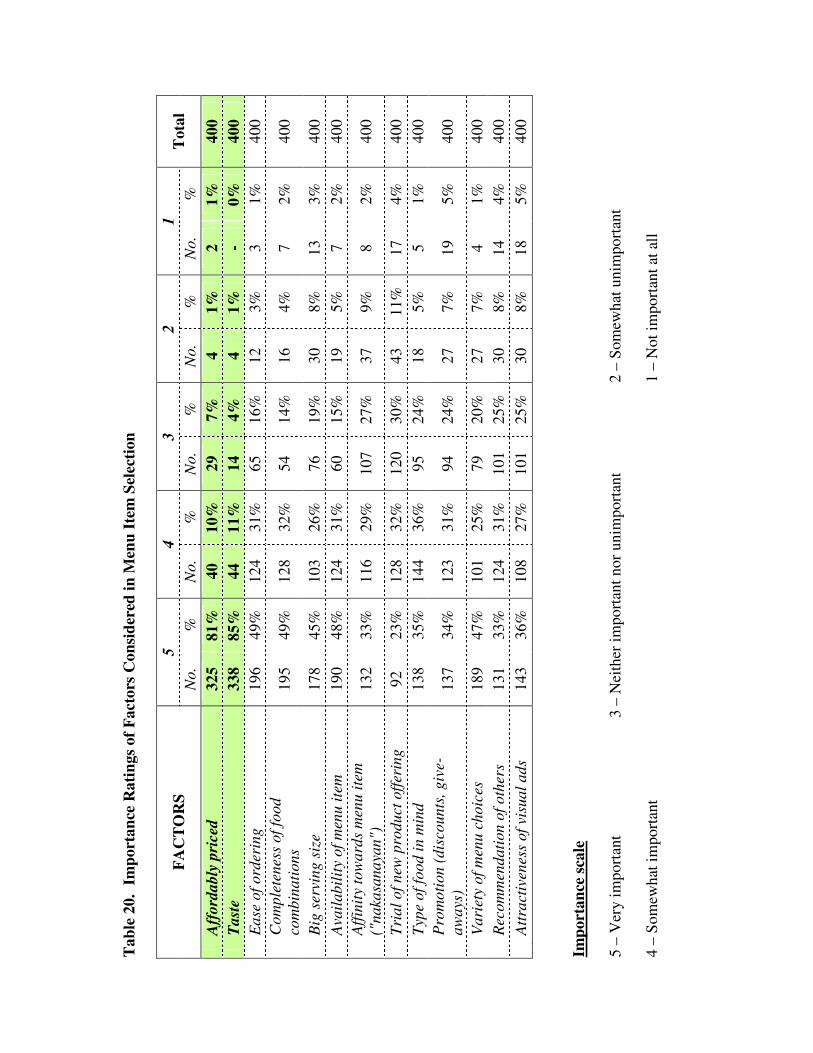
Tab
le 2
0. I
mpo
rtan
ce R
atin
gs o
f Fac
tors
Con
side
red
in M
enu
Item
Sel
ectio
n
5 4
3 2
1 FA
CT
OR
S N
o.
%
No.
%
N
o.
%
No.
%
N
o.
%
Tot
al
A
ffor
dabl
y pr
iced
32
5 81
%
40
10%
29
7%
4
1%
2 1%
40
0
Tast
e 33
8 85
%
44
11%
14
4%
4
1%
- 0%
40
0
Eas
e of
ord
erin
g 19
6 49
%
124
31%
65
16
%
12
3%
3 1%
40
0
C
ompl
eten
ess
of fo
od
com
bina
tions
19
5 49
%
128
32%
54
14
%
16
4%
7 2%
40
0
B
ig s
ervi
ng s
ize
178
45%
10
3 26
%
76
19%
30
8%
13
3%
40
0
Ava
ilabi
lity
of m
enu
item
19
0 48
%
124
31%
60
15
%
19
5%
7 2%
40
0
A
ffini
ty to
war
ds m
enu
item
("
naka
sana
yan"
) 13
2 33
%
116
29%
10
7 27
%
37
9%
8 2%
40
0
Tr
ial o
f new
pro
duct
offe
ring
92
23
%
128
32%
12
0 30
%
43
11%
17
4%
40
0
Type
of f
ood
in m
ind
138
35%
14
4 36
%
95
24%
18
5%
5
1%
400
P
rom
otio
n (d
isco
unts
, giv
e-aw
ays)
13
7 34
%
123
31%
94
24
%
27
7%
19
5%
400
V
arie
ty o
f men
u ch
oice
s 18
9 47
%
101
25%
79
20
%
27
7%
4 1%
40
0
Rec
omm
enda
tion
of o
ther
s 13
1 33
%
124
31%
10
1 25
%
30
8%
14
4%
400
A
ttrac
tiven
ess
of v
isua
l ads
14
3 36
%
108
27%
10
1 25
%
30
8%
18
5%
400
Impo
rtan
ce sc
ale
5 –
Ver
y im
port
ant
3 –
Nei
ther
impo
rtan
t nor
uni
mpo
rtan
t
2 –
Som
ewha
t uni
mpo
rtan
t
4 –
Som
ewha
t im
port
ant
1 –
Not
impo
rtan
t at a
ll
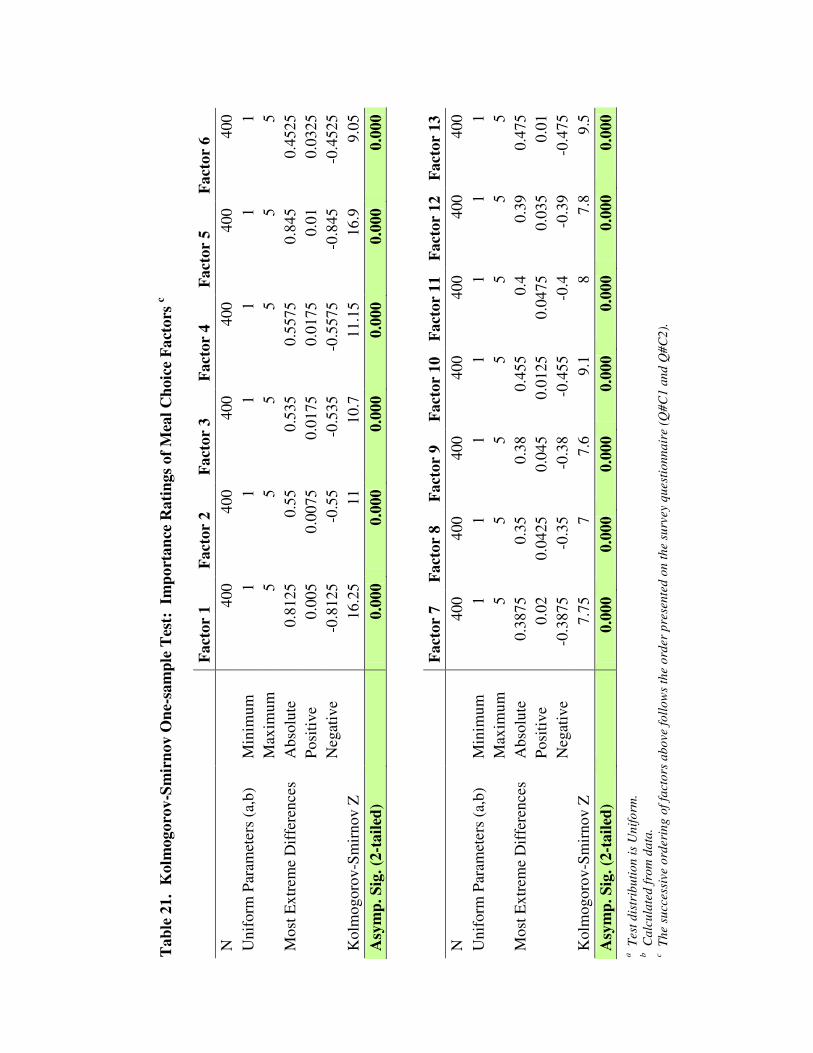
Tab
le 2
1. K
olm
ogor
ov-S
mir
nov
One
-sam
ple
Tes
t: I
mpo
rtan
ce R
atin
gs o
f Mea
l Cho
ice
Fact
ors c
Fact
or 1
Fa
ctor
2
Fact
or 3
Fa
ctor
4
Fact
or 5
Fa
ctor
6
N
40
0 40
0 40
0 40
0 40
0 40
0 U
nifo
rm P
aram
eter
s (a
,b)
Min
imum
1
1 1
1 1
1
Max
imum
5
5 5
5 5
5 M
ost E
xtre
me
Dif
fere
nces
A
bsol
ute
0.81
25
0.55
0.
535
0.55
75
0.84
5 0.
4525
Posi
tive
0.00
5 0.
0075
0.
0175
0.
0175
0.
01
0.03
25
N
egat
ive
-0.8
125
-0.5
5 -0
.535
-0
.557
5 -0
.845
-0
.452
5 K
olm
ogor
ov-S
mir
nov
Z
16
.25
11
10.7
11
.15
16.9
9.
05
Asy
mp.
Sig
. (2-
taile
d)
0.
000
0.00
0 0.
000
0.00
0 0.
000
0.00
0
Fa
ctor
7
Fact
or 8
Fa
ctor
9
Fact
or 1
0 Fa
ctor
11
Fact
or 1
2 Fa
ctor
13
N
40
0 40
0 40
0 40
0 40
0 40
0 40
0 U
nifo
rm P
aram
eter
s (a
,b)
Min
imum
1
1 1
1 1
1 1
M
axim
um
5 5
5 5
5 5
5 M
ost E
xtre
me
Dif
fere
nces
A
bsol
ute
0.38
75
0.35
0.
38
0.45
5 0.
4 0.
39
0.47
5
Posi
tive
0.02
0.
0425
0.
045
0.01
25
0.04
75
0.03
5 0.
01
N
egat
ive
-0.3
875
-0.3
5 -0
.38
-0.4
55
-0.4
-0
.39
-0.4
75
Kol
mog
orov
-Sm
irno
v Z
7.75
7
7.6
9.1
8 7.
8 9.
5 A
sym
p. S
ig. (
2-ta
iled)
0.00
0 0.
000
0.00
0 0.
000
0.00
0 0.
000
0.00
0 a T
est d
istr
ibut
ion
is U
nifo
rm.
b Cal
cula
ted
from
dat
a.
c The
suc
cess
ive
orde
ring
of f
acto
rs a
bove
follo
ws
the
orde
r pr
esen
ted
on th
e su
rvey
que
stio
nnai
re (Q
#C1
and
Q#C
2).

The succeeding cross tabulations (Tables 22-34) examine the degree of
importance that value meal and non-value meal consumers place on the previously
identified meal decision factors.
Note that there was not much difference observed in perceived importance among
both types of consumers across a majority of factors. That is, Factors 1-6 and 13 were
deemed “very important” in their choice of ordering either value or non-value meal items
when in fast food outlets (Tables 22-27 and 34). All other factors posted a mere plurality
of mentions spread across the “very important”, “somewhat important” and “neither
important nor unimportant” ratings assigned by consumers from each meal segment.
Table 22. Importance Rating of Meal Choice Factor 1 vs. What Usually Order in a Fast Food Outlet
FACTOR 1 Affordably priced
Value meal only
Value meal and other items in
the menu
Individual menu
items only Total %
Very important 84 200 41 325 81% Somewhat important 15 18 7 40 10% Neither important nor unimportant 9 14 6 29 7%
Somewhat unimportant 2 0 2 4 1% Not important at all 0 1 1 2 1%
Total 110 233 57 400 100%
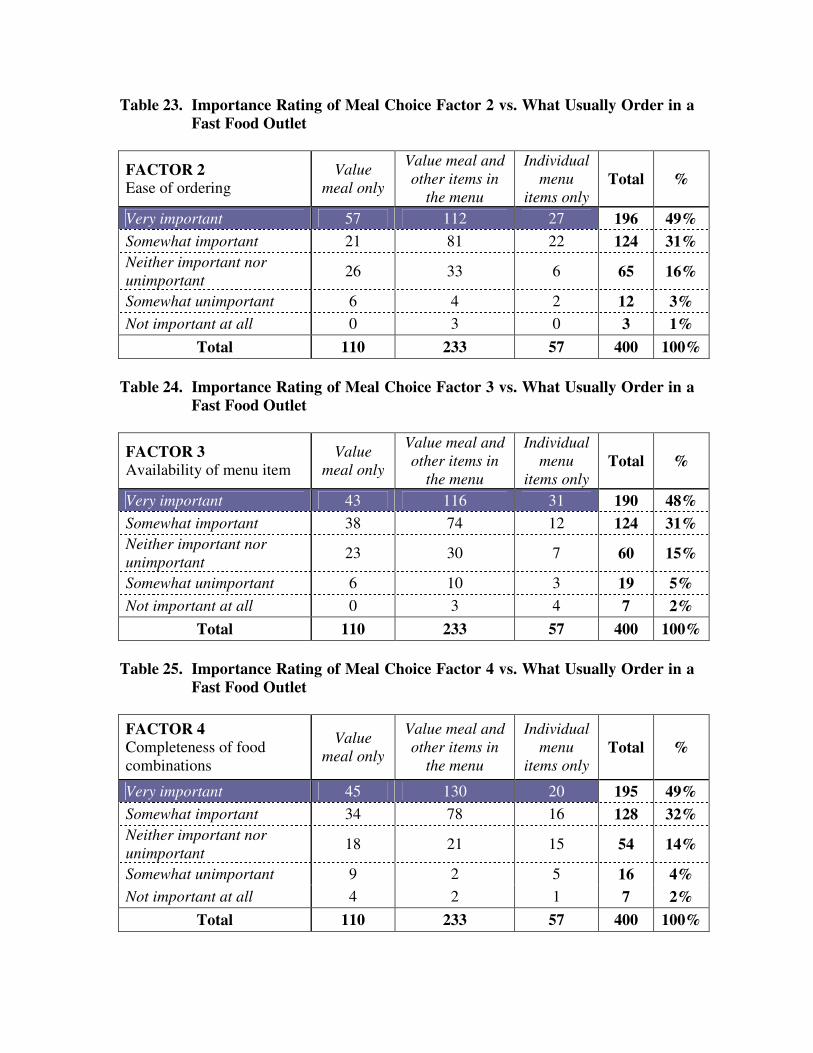
Table 23. Importance Rating of Meal Choice Factor 2 vs. What Usually Order in a Fast Food Outlet
FACTOR 2 Ease of ordering
Value meal only
Value meal and other items in
the menu
Individual menu
items only Total %
Very important 57 112 27 196 49% Somewhat important 21 81 22 124 31% Neither important nor unimportant 26 33 6 65 16%
Somewhat unimportant 6 4 2 12 3% Not important at all 0 3 0 3 1%
Total 110 233 57 400 100% Table 24. Importance Rating of Meal Choice Factor 3 vs. What Usually Order in a
Fast Food Outlet
FACTOR 3 Availability of menu item
Value meal only
Value meal and other items in
the menu
Individual menu
items only Total %
Very important 43 116 31 190 48% Somewhat important 38 74 12 124 31% Neither important nor unimportant 23 30 7 60 15%
Somewhat unimportant 6 10 3 19 5% Not important at all 0 3 4 7 2%
Total 110 233 57 400 100% Table 25. Importance Rating of Meal Choice Factor 4 vs. What Usually Order in a
Fast Food Outlet FACTOR 4 Completeness of food combinations
Value meal only
Value meal and other items in
the menu
Individual menu
items only Total %
Very important 45 130 20 195 49% Somewhat important 34 78 16 128 32% Neither important nor unimportant 18 21 15 54 14%
Somewhat unimportant 9 2 5 16 4% Not important at all 4 2 1 7 2%
Total 110 233 57 400 100%

Table 26. Importance Rating of Meal Choice Factor 5 vs. What Usually Order in a Fast Food Outlet
FACTOR 5 Taste
Value meal only
Value meal and other items in
the menu
Individual menu
items only Total %
Very important 92 204 42 338 85% Somewhat important 13 23 8 44 11% Neither important nor unimportant 5 3 6 14 4%
Somewhat unimportant 0 3 1 4 1% Not important at all 0 0 0 0 0%
Total 110 233 57 400 100% Table 27. Importance Rating of Meal Choice Factor 6 vs. What Usually Order in a
Fast Food Outlet
FACTOR 6 Big serving size
Value meal only
Value meal and other items in
the menu
Individual menu
items only Total %
Very important 47 114 17 178 45% Somewhat important 26 60 17 103 26% Neither important nor unimportant 21 41 14 76 19%
Somewhat unimportant 11 14 5 30 8% Not important at all 5 4 4 13 3%
Total 110 233 57 400 100% Table 28. Importance Rating of Meal Choice Factor 7 vs. What Usually Order in a
Fast Food Outlet FACTOR 7 Affinity towards menu item (“nakasanayan”)
Value meal only
Value meal and other items in
the menu
Individual menu
items only Total %
Very important 37 81 14 132 33% Somewhat important 33 66 17 116 29% Neither important nor unimportant 27 62 18 107 27%
Somewhat unimportant 11 21 5 37 9% Not important at all 2 3 3 8 2%
Total 110 233 57 400 100%
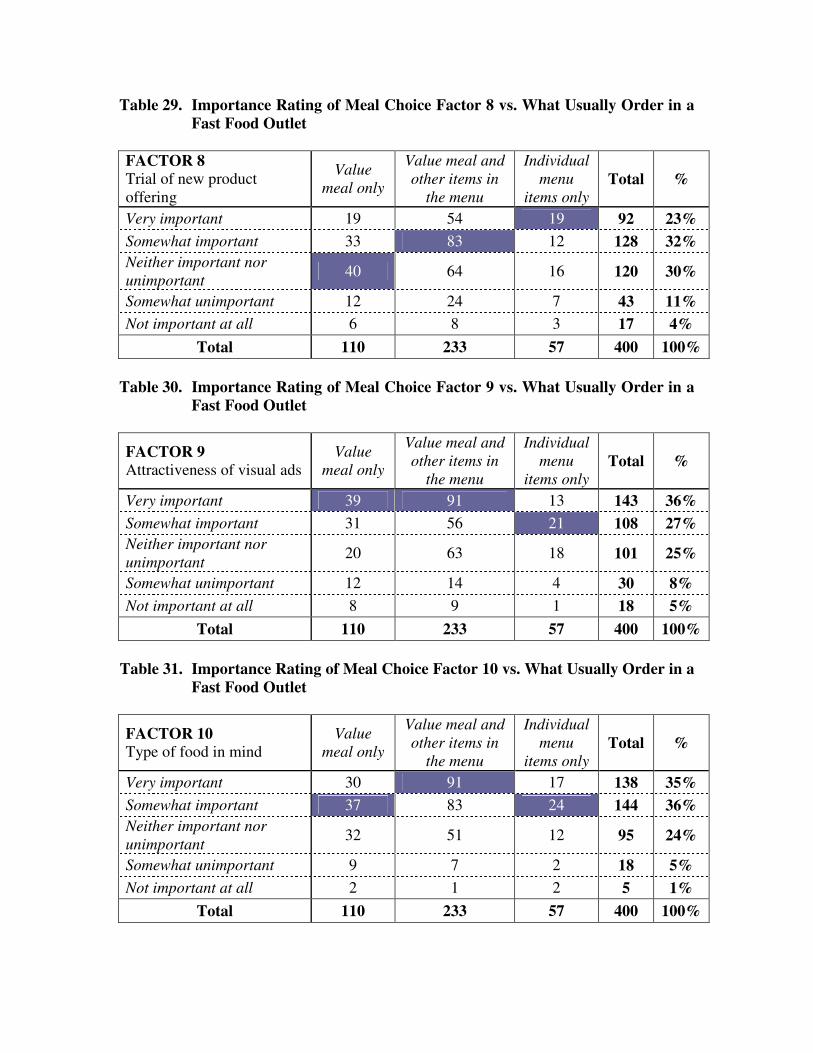
Table 29. Importance Rating of Meal Choice Factor 8 vs. What Usually Order in a Fast Food Outlet
FACTOR 8 Trial of new product offering
Value meal only
Value meal and other items in
the menu
Individual menu
items only Total %
Very important 19 54 19 92 23% Somewhat important 33 83 12 128 32% Neither important nor unimportant 40 64 16 120 30%
Somewhat unimportant 12 24 7 43 11% Not important at all 6 8 3 17 4%
Total 110 233 57 400 100% Table 30. Importance Rating of Meal Choice Factor 9 vs. What Usually Order in a
Fast Food Outlet
FACTOR 9 Attractiveness of visual ads
Value meal only
Value meal and other items in
the menu
Individual menu
items only Total %
Very important 39 91 13 143 36% Somewhat important 31 56 21 108 27% Neither important nor unimportant 20 63 18 101 25%
Somewhat unimportant 12 14 4 30 8% Not important at all 8 9 1 18 5%
Total 110 233 57 400 100% Table 31. Importance Rating of Meal Choice Factor 10 vs. What Usually Order in a
Fast Food Outlet
FACTOR 10 Type of food in mind
Value meal only
Value meal and other items in
the menu
Individual menu
items only Total %
Very important 30 91 17 138 35% Somewhat important 37 83 24 144 36% Neither important nor unimportant 32 51 12 95 24%
Somewhat unimportant 9 7 2 18 5% Not important at all 2 1 2 5 1%
Total 110 233 57 400 100%
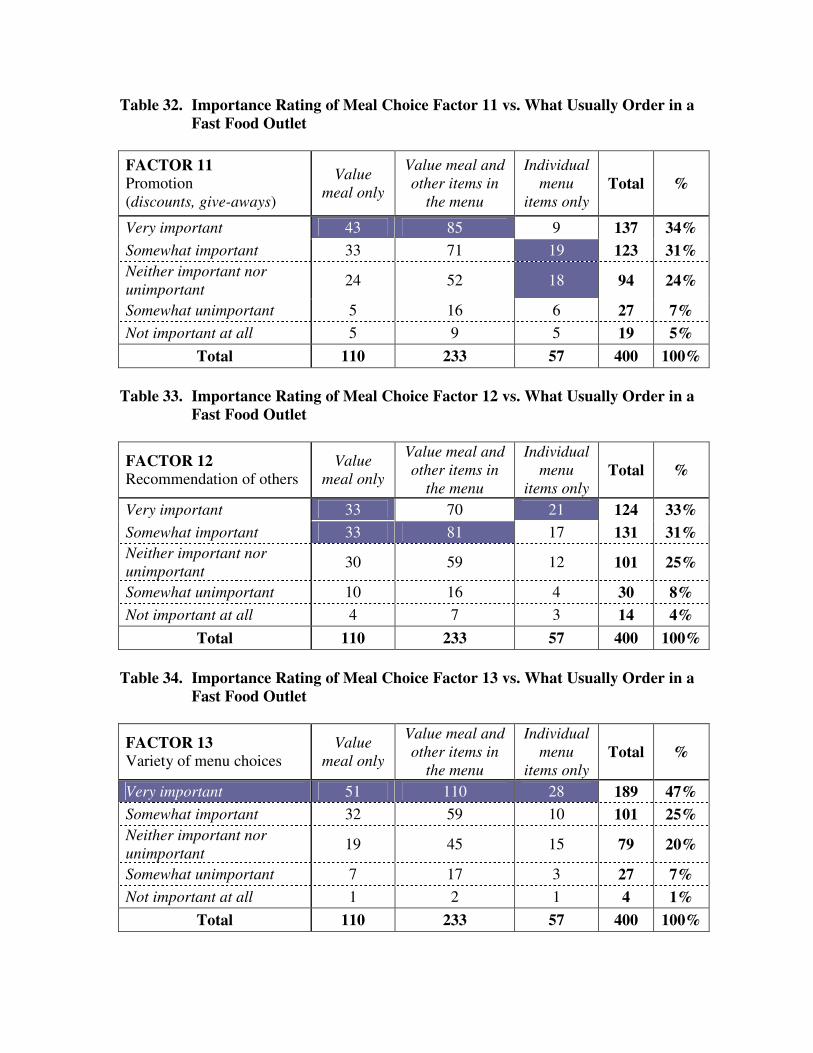
Table 32. Importance Rating of Meal Choice Factor 11 vs. What Usually Order in a Fast Food Outlet
FACTOR 11 Promotion (discounts, give-aways)
Value meal only
Value meal and other items in
the menu
Individual menu
items only Total %
Very important 43 85 9 137 34% Somewhat important 33 71 19 123 31% Neither important nor unimportant 24 52 18 94 24%
Somewhat unimportant 5 16 6 27 7% Not important at all 5 9 5 19 5%
Total 110 233 57 400 100% Table 33. Importance Rating of Meal Choice Factor 12 vs. What Usually Order in a
Fast Food Outlet
FACTOR 12 Recommendation of others
Value meal only
Value meal and other items in
the menu
Individual menu
items only Total %
Very important 33 70 21 124 33% Somewhat important 33 81 17 131 31% Neither important nor unimportant 30 59 12 101 25%
Somewhat unimportant 10 16 4 30 8% Not important at all 4 7 3 14 4%
Total 110 233 57 400 100% Table 34. Importance Rating of Meal Choice Factor 13 vs. What Usually Order in a
Fast Food Outlet
FACTOR 13 Variety of menu choices
Value meal only
Value meal and other items in
the menu
Individual menu
items only Total %
Very important 51 110 28 189 47% Somewhat important 32 59 10 101 25% Neither important nor unimportant 19 45 15 79 20%
Somewhat unimportant 7 17 3 27 7% Not important at all 1 2 1 4 1%
Total 110 233 57 400 100%
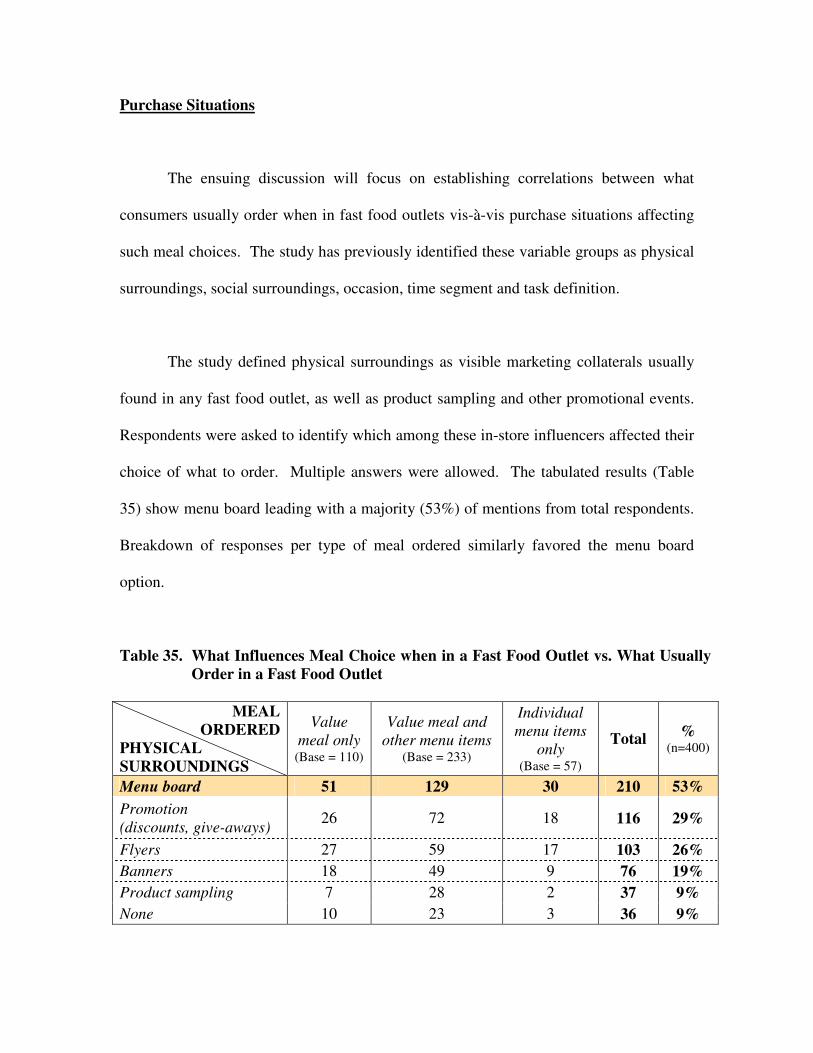
Purchase Situations
The ensuing discussion will focus on establishing correlations between what
consumers usually order when in fast food outlets vis-à-vis purchase situations affecting
such meal choices. The study has previously identified these variable groups as physical
surroundings, social surroundings, occasion, time segment and task definition.
The study defined physical surroundings as visible marketing collaterals usually
found in any fast food outlet, as well as product sampling and other promotional events.
Respondents were asked to identify which among these in-store influencers affected their
choice of what to order. Multiple answers were allowed. The tabulated results (Table
35) show menu board leading with a majority (53%) of mentions from total respondents.
Breakdown of responses per type of meal ordered similarly favored the menu board
option.
Table 35. What Influences Meal Choice when in a Fast Food Outlet vs. What Usually Order in a Fast Food Outlet
MEAL
ORDERED PHYSICAL SURROUNDINGS
Value meal only
(Base = 110)
Value meal and other menu items
(Base = 233)
Individual menu items
only (Base = 57)
Total % (n=400)
Menu board 51 129 30 210 53% Promotion (discounts, give-aways) 26 72 18 116 29%
Flyers 27 59 17 103 26% Banners 18 49 9 76 19% Product sampling 7 28 2 37 9% None 10 23 3 36 9%
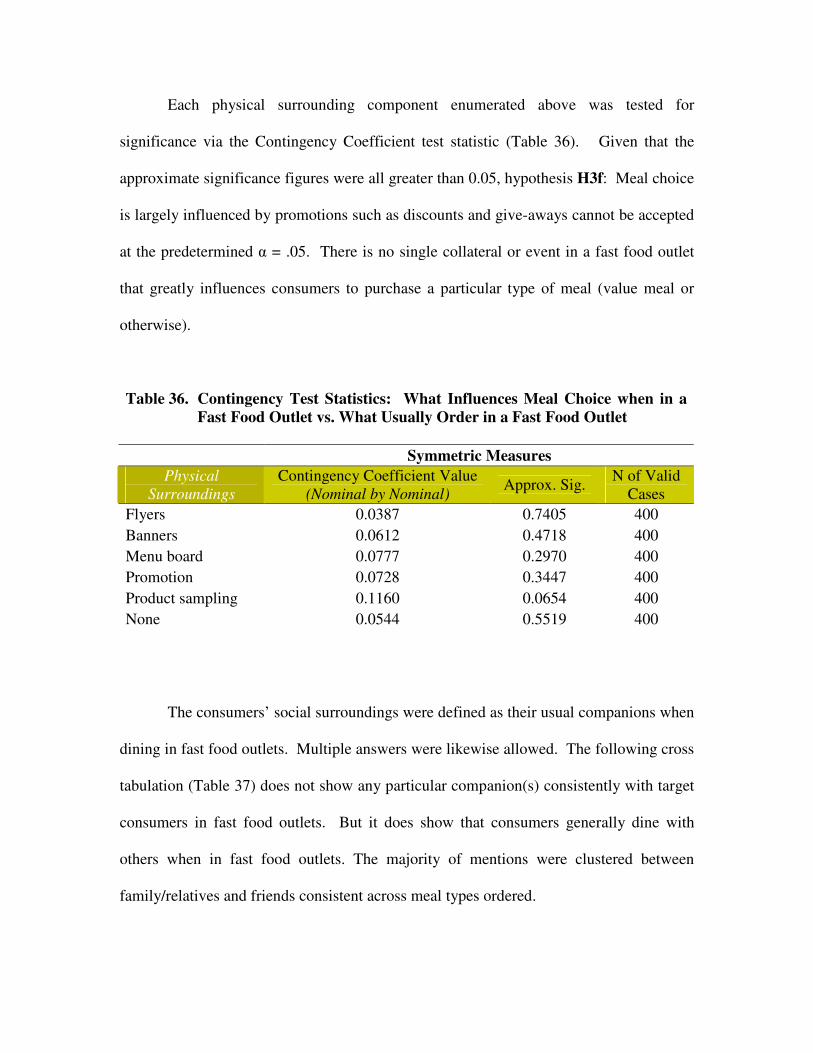
Each physical surrounding component enumerated above was tested for
significance via the Contingency Coefficient test statistic (Table 36). Given that the
approximate significance figures were all greater than 0.05, hypothesis H3f: Meal choice
is largely influenced by promotions such as discounts and give-aways cannot be accepted
at the predetermined � = .05. There is no single collateral or event in a fast food outlet
that greatly influences consumers to purchase a particular type of meal (value meal or
otherwise).
Table 36. Contingency Test Statistics: What Influences Meal Choice when in a Fast Food Outlet vs. What Usually Order in a Fast Food Outlet
Symmetric Measures
Physical Surroundings
Contingency Coefficient Value (Nominal by Nominal) Approx. Sig. N of Valid
Cases Flyers 0.0387 0.7405 400 Banners 0.0612 0.4718 400 Menu board 0.0777 0.2970 400 Promotion 0.0728 0.3447 400 Product sampling 0.1160 0.0654 400 None 0.0544 0.5519 400
The consumers’ social surroundings were defined as their usual companions when
dining in fast food outlets. Multiple answers were likewise allowed. The following cross
tabulation (Table 37) does not show any particular companion(s) consistently with target
consumers in fast food outlets. But it does show that consumers generally dine with
others when in fast food outlets. The majority of mentions were clustered between
family/relatives and friends consistent across meal types ordered.

Table 37. Usual Companion when in a Fast Food Outlet vs. What Usually Order in a
Fast Food Outlet
MEAL ORDERED
USUAL COMPANION
Value meal only
(Base = 110)
Value meal and other menu items
(Base = 233)
Individual menu items only (Base = 57)
Total % (n=400)
Family / Relatives 38 86 31 155 39% Friends 42 85 18 145 36% Self / Alone 14 33 3 50 13% Officemates 12 29 5 46 12% Schoolmates 7 4 1 12 3%
Similar to physical surroundings, each of the above identified social surrounding
variables was tested for significance. Of the five usual companions, only family/relatives
managed to post a significance measure less than 0.05 (Table 38). But what this means is
that the proportion of those who did not choose family/relatives was significantly higher
from those who did. For all other social surrounding variables, the test failed to detect
any significant difference between respective proportions of responses choosing a
particular variable vs. those who did not. And this is evidently so since the preceding
table showed that no single social surrounding variable managed to register responses
well above the 200 mark.
Thus, hypothesis H3g: Consumers dining alone are more likely to choose bundled
meals while consumers dining with family/friends are more likely to order a la carte
menu items cannot be accepted at an � = .05. Moreover, even those dining in groups
(family/relatives and friends) obviously opted for bundled meals. There is no correlation
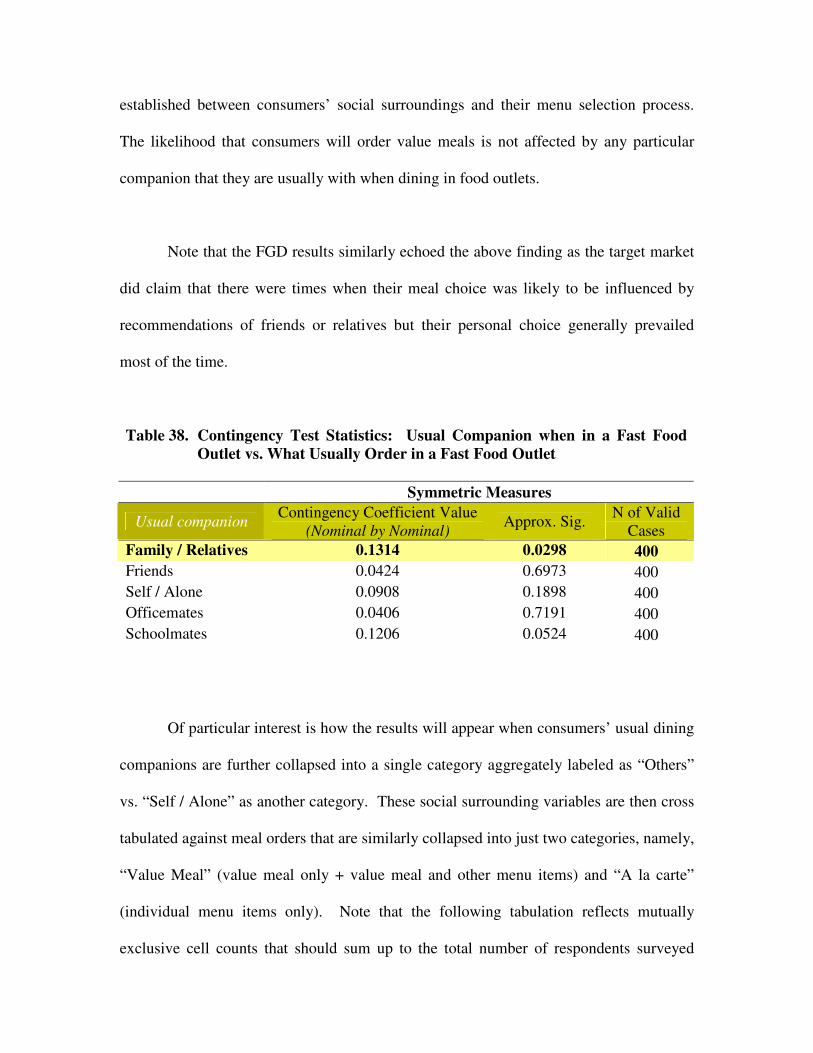
established between consumers’ social surroundings and their menu selection process.
The likelihood that consumers will order value meals is not affected by any particular
companion that they are usually with when dining in food outlets.
Note that the FGD results similarly echoed the above finding as the target market
did claim that there were times when their meal choice was likely to be influenced by
recommendations of friends or relatives but their personal choice generally prevailed
most of the time.
Table 38. Contingency Test Statistics: Usual Companion when in a Fast Food Outlet vs. What Usually Order in a Fast Food Outlet
Symmetric Measures
Usual companion Contingency Coefficient Value (Nominal by Nominal) Approx. Sig. N of Valid
Cases Family / Relatives 0.1314 0.0298 400 Friends 0.0424 0.6973 400 Self / Alone 0.0908 0.1898 400 Officemates 0.0406 0.7191 400 Schoolmates 0.1206 0.0524 400
Of particular interest is how the results will appear when consumers’ usual dining
companions are further collapsed into a single category aggregately labeled as “Others”
vs. “Self / Alone” as another category. These social surrounding variables are then cross
tabulated against meal orders that are similarly collapsed into just two categories, namely,
“Value Meal” (value meal only + value meal and other menu items) and “A la carte”
(individual menu items only). Note that the following tabulation reflects mutually
exclusive cell counts that should sum up to the total number of respondents surveyed

(400). For instance, if a respondent happens to dine in with both friends and officemates
most of the time, then the corresponding count is not “2” but just “1” under “Others” vs.
the earlier tabulation that gives both variables 1 count each. There are, however, still a
few respondents who equally claim dining in with others or just by themselves most of
the time. A separate category is, thus, created for this and aptly labeled as “Self or
Others.” Table 39 below shows the resulting breakdown of responses (“Observed”
column), as well as the expected frequencies. It is quite evident from the tabulation that
both types of consumers (i.e., value meal or a la carte) generally dine in with others when
in fast food outlets.
Table 39. Usual Companion when in a Fast Food Outlet vs. What Usually Order in a Fast Food Outlet: Observed frequencies vs. Expected frequencies
MEAL ORDERED Value meal A la carte USUAL COMPANION Observed Expected Observed Expected
TOTAL
294 53 Others
298 49 347
42 3 Self / Alone
39 6 45
7 1 Self or Others
7 1 8
TOTAL 343 57 400
Testing for independence between row and column classifications using the Chi
Square test does not yield a significant result at α = 0.05 (Table 40). This is further
supported by the preceding cross tabulation (Table 39) between social surrounding
variables and type of meal ordered showing no great deviation between the observed

frequencies and expected counts. Similarly, the Contingency Coefficient test for
correlation is not significant at α = 0.05 (Table 40). This is to be expected since the
Contingency Coefficient incorporates the Chi Square value in computing its test statistic
and the significance of the Contingency Coefficient is dependent on the significance of
the Chi Square statistic. The difference between both tests is that the Contingency
Coefficient takes a step further and provides a measure of the degree of association
between variables, not just the existence of association.
Therefore, results from both significance tests echo the earlier conclusion that the
type of meal consumers order is not dependent on who they are with when dining in fast
food outlets. Hypothesis H3g: Consumers dining alone are more likely to choose
bundled meals while consumers dining with family/friends are more likely to order a la
carte menu items once again cannot be accepted at � = .05. Value meals are popular
menu choices among consumers dining in groups or by themselves.
Table 40. Chi Square Test for Independence and Contingency Coefficient Test for
Correlation: Usual Companion when in a Fast Food Outlet vs. What Usually Order in a Fast Food Outlet
Value Df Asymp. Sig. (2-sided) Pearson Chi-Square 2.435 a 2 0.296 N of Valid Cases 400 a 1 cell (16.7%) has expected count less than 5. The minimum expected count is 1.14. Value Approx. Sig. Contingency Coefficient 0.078 0.296 Nominal by Nominal N of Valid Cases 400

Occasion was another purchase situation variable that the study wanted to
correlate with what consumers usually order when in fast food outlets. The cross
tabulation below (Table 41) does not show any apparent association with specific
occasions driving purchase of a particular meal type. In fact a high majority of target
consumers dined in fast food outlets during no special occasion --- consistent across types
of meal ordered. This was likewise the FGD finding when both market segments (i.e.,
young and old) agreed that there need not be any special occasion to avail of services
offered in fast food outlets.
Table 41. Occasion Attended when in Fast Food Outlet vs. What Usually Order in a Fast Food Outlet
MEAL
ORDERED OCCASION
Value meal only
Value meal and other menu items
Individual menu items only Total %
Birthday 4 17 8 29 7% Date 4 4 1 9 2% Reunion 4 2 1 7 2% Anniversary 2 1 3 6 2% Christening 1 0 1 2 1% Business meeting 0 1 1 2 1% No occasion 95 208 42 345 86%
Total 110 233 57 400 100%
The Contingency Coefficient test statistics (Table 42) proved that a significant
correlation exists between the occasion attended and type of meal usually ordered when
in fast food outlets --- but only because the option “no occasion” was included as another

occasion variable. The “no occasion” option garnered a high majority of responses that
led to the test yielding significant results. There was no strong link suggesting that
special occasions will be reason enough to order a la carte menu items as it appeared on
the preceding cross tabulation that even those who celebrated special occasions in fast
food outlets were almost equally likely to order both value meals and a la carte items.
Thus, hypothesis H3h stating that “Consumers dining in fast food outlets for no
special reason are more likely to order bundled meals” is accepted at an � = .05. There is
clearly no correlation between occasions attended when in a fast food outlet vis-à-vis
what consumers usually order. Thus, the alternate statement stating that “Consumers
celebrating special occasions are more likely order ala carte menu items” is not a valid
conclusion.
Table 42. Contingency Coefficient Test Statistics: Occasion Attended when in Fast Food Outlet vs. What Usually Order in a Fast Food Outlet
Symmetric Measures Value Approx. Sig.
Nominal by Nominal Contingency Coefficient 0.2398 0.0179 N of Valid Cases …………………………………. 400
Similar to the preceding statistical treatment of social surrounding variables, all
occasion variables will be collapsed into just one category labeled as “Special occasion”
while the “No occasion” category remains as is. Meal ordered categories will also be
collapsed into 2 categories as has earlier been done --- “Value meal” and “A la carte.”
The resulting cross tabulation is exhibited on Table 44 where it also shows observed and

expected frequencies occurring under type of occasion vs. type of meal ordered. Note
that the predominant clustering of responses falls under the “No occasion” event across
both types of meal ordered.
Table 43. Occasion Attended when in a Fast Food Outlet vs. What Usually Order in a Fast Food Outlet: Observed frequencies vs. Expected frequencies
MEAL ORDERED Value meal A la carte
OCCASION Observed Expected Observed Expected TOTAL
40 15 Special occasion
47 8 55
303 42 No occasion
296 49 345
TOTAL 343 57 400
Testing for significance using both the Chi Square test for independence and the
Contingency Coefficient test for correlation yields associated probabilities of occurrence
lower than α = 0.05 for both test statistics (Table 44). This suggests sufficient evidence
that the type of meal ordered is associated with the occasion attended when dining in fast
food outlets. This supports the conclusion earlier arrived at where hypothesis H3h
stating that “Consumers dining in fast food outlets for no special reason are more likely
to order bundled meals” is once again accepted at � = .05. Consumers indiscriminately
order value meals regardless of the occasion they are celebrating when in fast food
outlets.
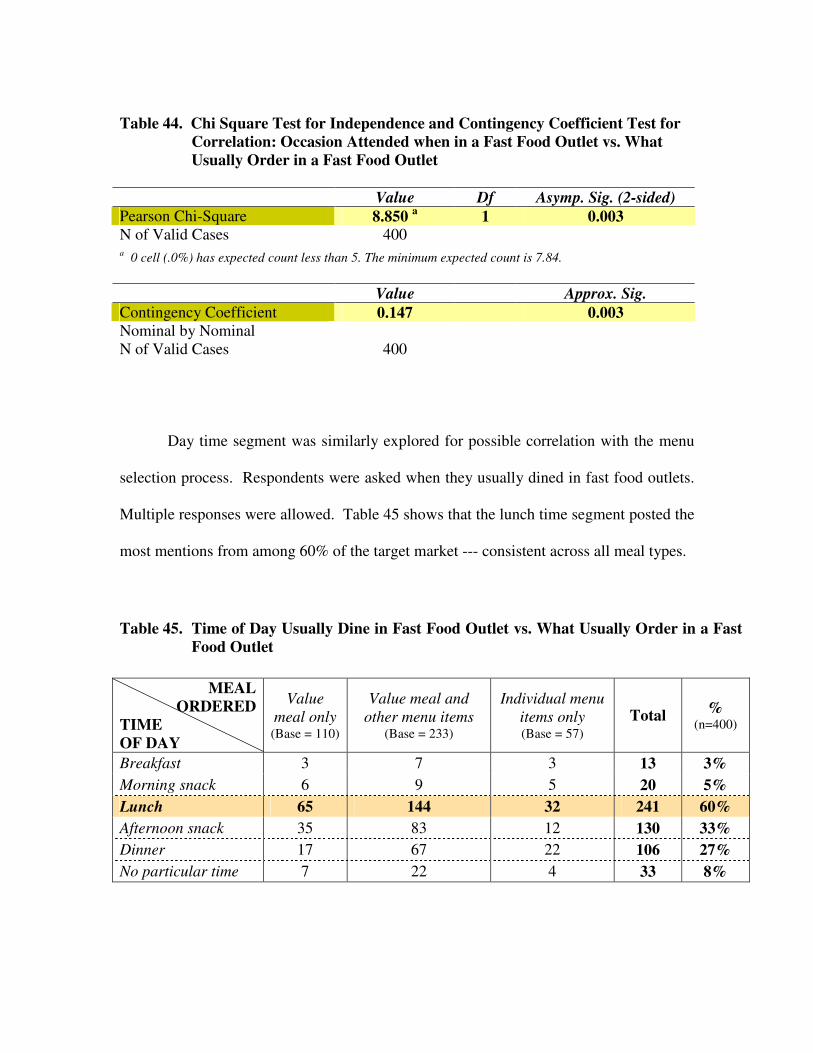
Table 44. Chi Square Test for Independence and Contingency Coefficient Test for
Correlation: Occasion Attended when in a Fast Food Outlet vs. What Usually Order in a Fast Food Outlet
Value Df Asymp. Sig. (2-sided) Pearson Chi-Square 8.850 a 1 0.003 N of Valid Cases 400 a 0 cell (.0%) has expected count less than 5. The minimum expected count is 7.84. Value Approx. Sig. Contingency Coefficient 0.147 0.003 Nominal by Nominal N of Valid Cases 400
Day time segment was similarly explored for possible correlation with the menu
selection process. Respondents were asked when they usually dined in fast food outlets.
Multiple responses were allowed. Table 45 shows that the lunch time segment posted the
most mentions from among 60% of the target market --- consistent across all meal types.
Table 45. Time of Day Usually Dine in Fast Food Outlet vs. What Usually Order in a Fast Food Outlet
MEAL
ORDERED TIME OF DAY
Value meal only
(Base = 110)
Value meal and other menu items
(Base = 233)
Individual menu items only (Base = 57)
Total % (n=400)
Breakfast 3 7 3 13 3% Morning snack 6 9 5 20 5% Lunch 65 144 32 241 60% Afternoon snack 35 83 12 130 33% Dinner 17 67 22 106 27% No particular time 7 22 4 33 8%
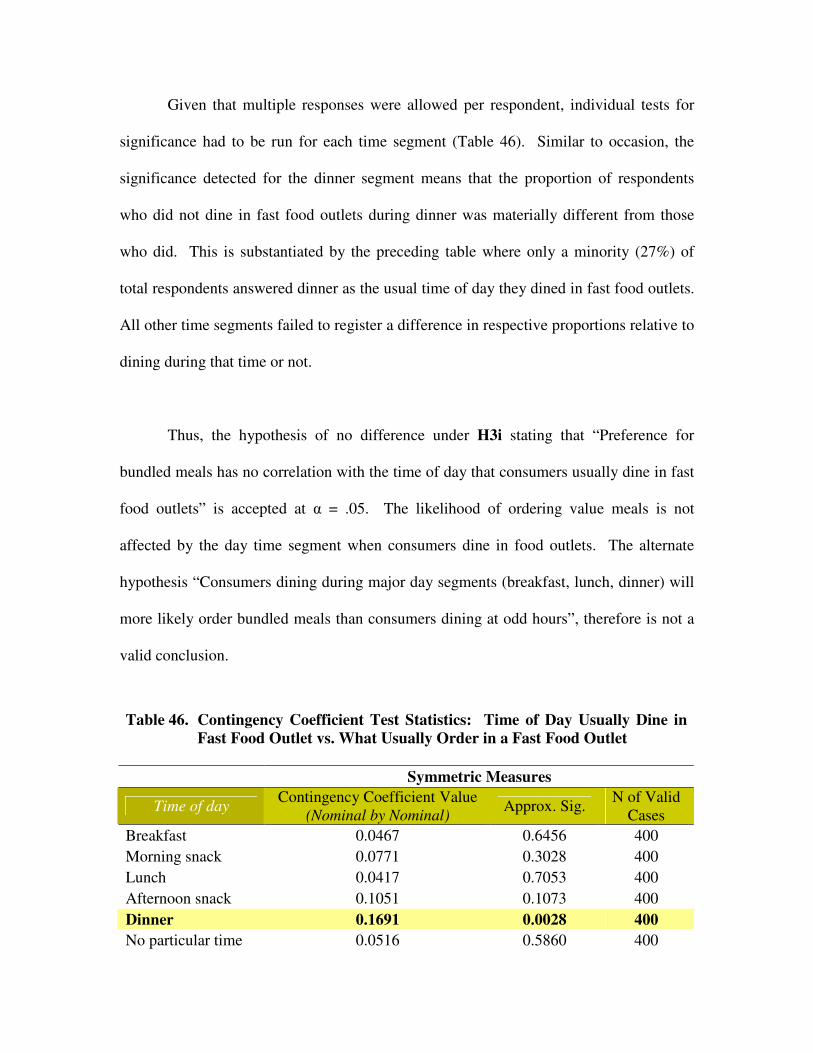
Given that multiple responses were allowed per respondent, individual tests for
significance had to be run for each time segment (Table 46). Similar to occasion, the
significance detected for the dinner segment means that the proportion of respondents
who did not dine in fast food outlets during dinner was materially different from those
who did. This is substantiated by the preceding table where only a minority (27%) of
total respondents answered dinner as the usual time of day they dined in fast food outlets.
All other time segments failed to register a difference in respective proportions relative to
dining during that time or not.
Thus, the hypothesis of no difference under H3i stating that “Preference for
bundled meals has no correlation with the time of day that consumers usually dine in fast
food outlets” is accepted at � = .05. The likelihood of ordering value meals is not
affected by the day time segment when consumers dine in food outlets. The alternate
hypothesis “Consumers dining during major day segments (breakfast, lunch, dinner) will
more likely order bundled meals than consumers dining at odd hours”, therefore is not a
valid conclusion.
Table 46. Contingency Coefficient Test Statistics: Time of Day Usually Dine in Fast Food Outlet vs. What Usually Order in a Fast Food Outlet
Symmetric Measures
Time of day Contingency Coefficient Value (Nominal by Nominal) Approx. Sig. N of Valid
Cases Breakfast 0.0467 0.6456 400 Morning snack 0.0771 0.3028 400 Lunch 0.0417 0.7053 400 Afternoon snack 0.1051 0.1073 400 Dinner 0.1691 0.0028 400 No particular time 0.0516 0.5860 400
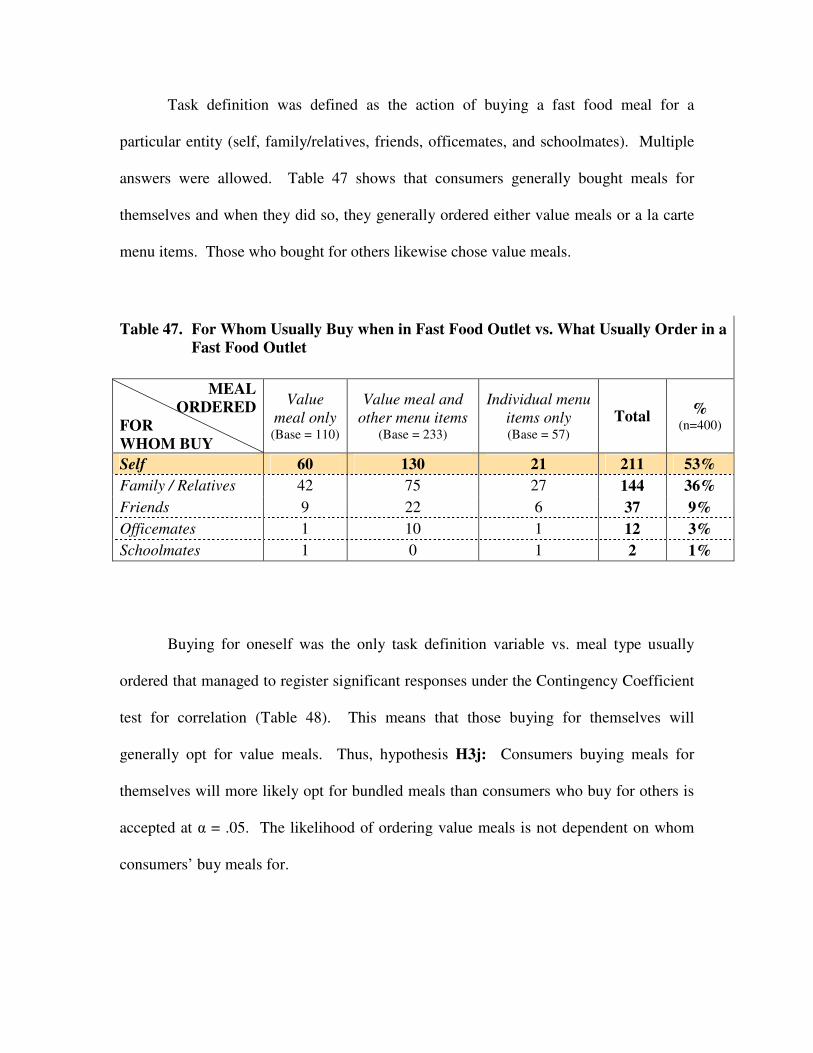
Task definition was defined as the action of buying a fast food meal for a
particular entity (self, family/relatives, friends, officemates, and schoolmates). Multiple
answers were allowed. Table 47 shows that consumers generally bought meals for
themselves and when they did so, they generally ordered either value meals or a la carte
menu items. Those who bought for others likewise chose value meals.
Table 47. For Whom Usually Buy when in Fast Food Outlet vs. What Usually Order in a Fast Food Outlet
MEAL
ORDERED FOR WHOM BUY
Value meal only
(Base = 110)
Value meal and other menu items
(Base = 233)
Individual menu items only (Base = 57)
Total % (n=400)
Self 60 130 21 211 53% Family / Relatives 42 75 27 144 36% Friends 9 22 6 37 9% Officemates 1 10 1 12 3% Schoolmates 1 0 1 2 1%
Buying for oneself was the only task definition variable vs. meal type usually
ordered that managed to register significant responses under the Contingency Coefficient
test for correlation (Table 48). This means that those buying for themselves will
generally opt for value meals. Thus, hypothesis H3j: Consumers buying meals for
themselves will more likely opt for bundled meals than consumers who buy for others is
accepted at � = .05. The likelihood of ordering value meals is not dependent on whom
consumers’ buy meals for.

Table 48. Contingency Coefficient Test Statistics: For Whom Usually Buy when in Fast Food Outlet vs. What Usually Order in a Fast Food Outlet
Symmetric Measures For whom usually
buy Contingency Coefficient Value
(Nominal by Nominal) Approx. Sig. N of Valid Cases
Self 0.1293 0.0334 400 Family / Relatives 0.1099 0.0866 400 Friends 0.0260 0.8736 400 Officemates 0.0904 0.1927 400 Schoolmates 0.0910 0.1879 400
Socio-Demographic Profile
The value meal and non-value meal market segments will be profiled relative to
socio-demographic variables such as age group, gender, civil status, monthly household
income, social class and educational attainment. Cross tabulations among variables of
interest and corresponding correlation tests will be presented in the succeeding
discussions.
The cross tabulation on Table 49 of age groups vis-à-vis type of meal usually
ordered at fast food outlets shows no clustering of a majority of responses within a
particular cell(s). Thus, when tested for significance, no correlation was detected at � =
.05 (Table 50). Therefore, hypothesis H3a: Consumers belonging to younger age
brackets are more likely to choose bundled meals than their older counterparts cannot be
accepted at the predetermined level of significance. Age does not affect the likelihood of
ordering value meals.

Table 49. Age Group vs. What Usually Order in a Fast Food Outlet
MEAL ORDERED
AGE GROUP
Value meal only
Value meal and other items in the menu
Individual menu items only Total
15 – 24 44 71 15 130 25 – 34 31 70 16 117 35 – 44 15 55 13 83 45 – 60 20 37 13 70 Total 110 233 57 400
Table 50. Contingency Coefficient Test Statistics: Age Group vs. What Usually
Order in a Fast Food Outlet
Symmetric Measures Value Approx. Sig. Nominal by Nominal Contingency Coefficient 0.1400 0.2381 N of Valid Cases …………………………………. 400
Gender breakdown per type of meal ordered did not appear to lean towards only
males or only females (Table 51). The test for significance consequently failed to prove a
correlation existed between gender and type of meal ordered at fast food outlets (Table
52). Hypothesis H3b: Meal preference has no significant correlation with consumers’
gender is, therefore, accepted at � = .05. Gender does not affect the likelihood of
ordering value meals. Therefore, both male and female consumers order bundled meals.
Table 51. Gender vs. What Usually Order in a Fast Food Outlet
MEAL ORDERED
GENDER
Value meal only
Value meal and other items in the menu
Individual menu items only Total
Male 58 111 22 191 Female 52 122 35 209 Total 110 233 57 400
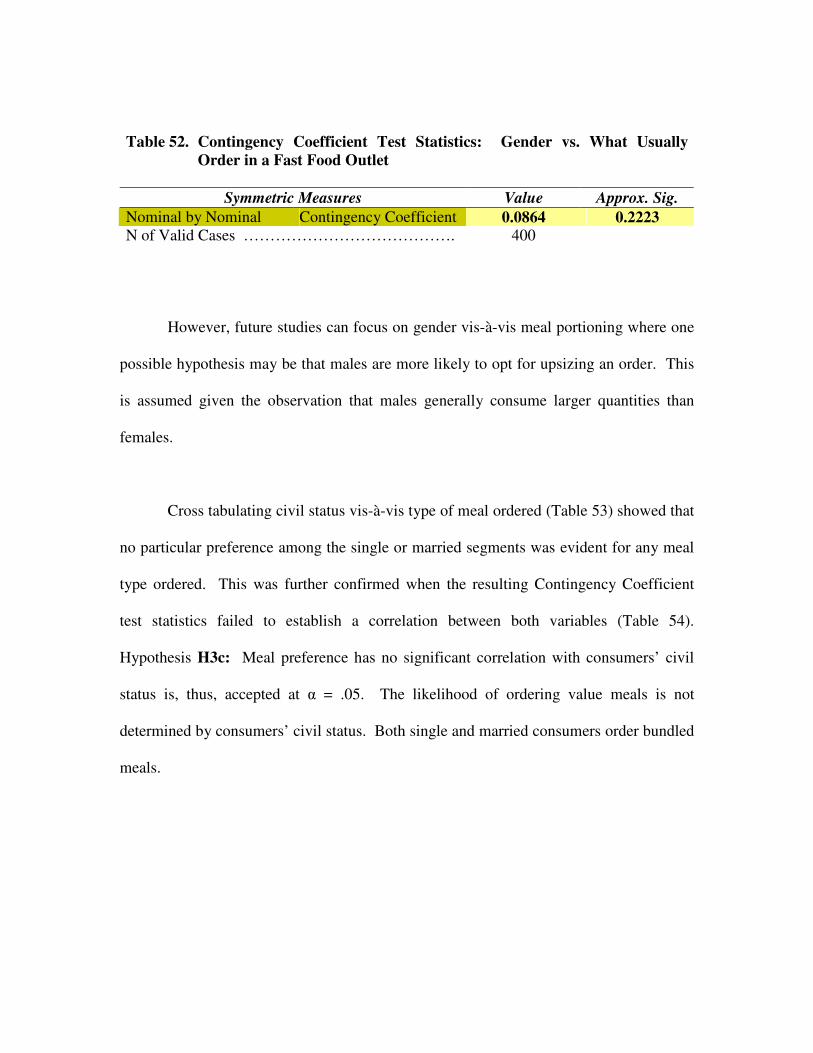
Table 52. Contingency Coefficient Test Statistics: Gender vs. What Usually Order in a Fast Food Outlet
Symmetric Measures Value Approx. Sig.
Nominal by Nominal Contingency Coefficient 0.0864 0.2223 N of Valid Cases …………………………………. 400
However, future studies can focus on gender vis-à-vis meal portioning where one
possible hypothesis may be that males are more likely to opt for upsizing an order. This
is assumed given the observation that males generally consume larger quantities than
females.
Cross tabulating civil status vis-à-vis type of meal ordered (Table 53) showed that
no particular preference among the single or married segments was evident for any meal
type ordered. This was further confirmed when the resulting Contingency Coefficient
test statistics failed to establish a correlation between both variables (Table 54).
Hypothesis H3c: Meal preference has no significant correlation with consumers’ civil
status is, thus, accepted at � = .05. The likelihood of ordering value meals is not
determined by consumers’ civil status. Both single and married consumers order bundled
meals.
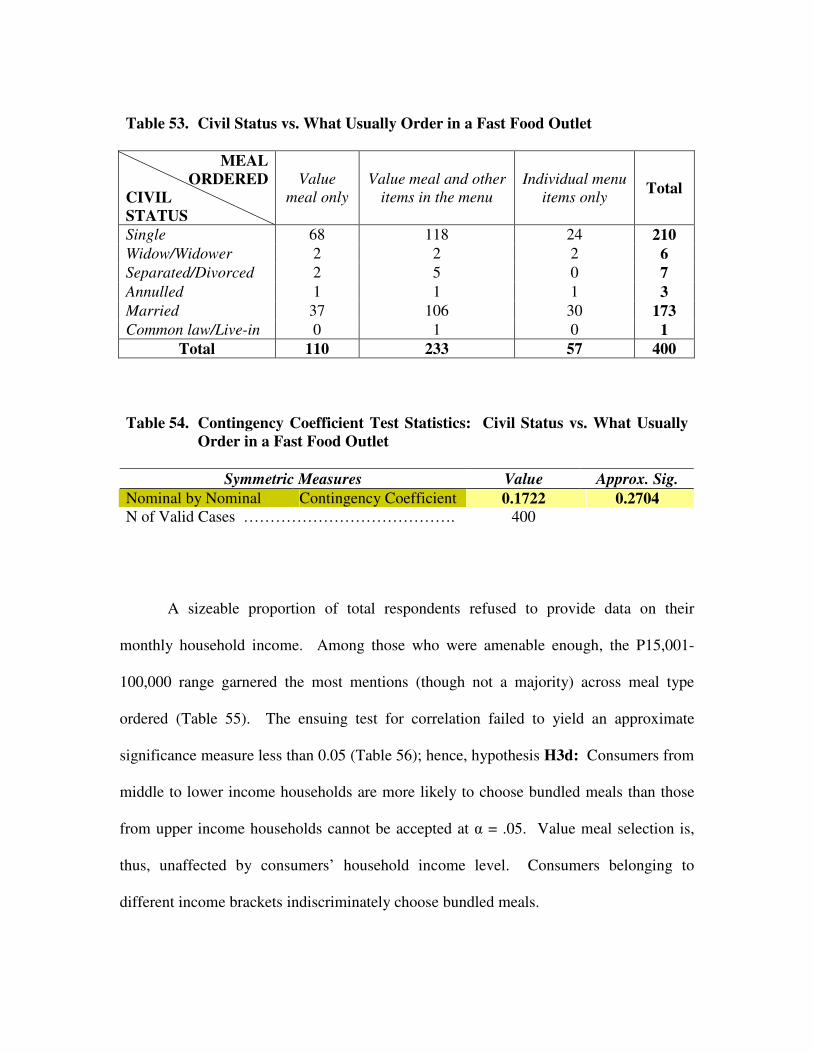
Table 53. Civil Status vs. What Usually Order in a Fast Food Outlet
MEAL ORDERED
CIVIL STATUS
Value meal only
Value meal and other items in the menu
Individual menu items only Total
Single 68 118 24 210 Widow/Widower 2 2 2 6 Separated/Divorced 2 5 0 7 Annulled 1 1 1 3 Married 37 106 30 173 Common law/Live-in 0 1 0 1
Total 110 233 57 400
Table 54. Contingency Coefficient Test Statistics: Civil Status vs. What Usually
Order in a Fast Food Outlet
Symmetric Measures Value Approx. Sig. Nominal by Nominal Contingency Coefficient 0.1722 0.2704 N of Valid Cases …………………………………. 400
A sizeable proportion of total respondents refused to provide data on their
monthly household income. Among those who were amenable enough, the P15,001-
100,000 range garnered the most mentions (though not a majority) across meal type
ordered (Table 55). The ensuing test for correlation failed to yield an approximate
significance measure less than 0.05 (Table 56); hence, hypothesis H3d: Consumers from
middle to lower income households are more likely to choose bundled meals than those
from upper income households cannot be accepted at � = .05. Value meal selection is,
thus, unaffected by consumers’ household income level. Consumers belonging to
different income brackets indiscriminately choose bundled meals.

Table 55. Monthly Household Income vs. What Usually Order in a Fast Food Outlet
MEAL
ORDERED MO. HH INCOME
Value meal only
Value meal and other items in the menu
Individual menu items only Total
P8,000 and below 12 12 1 25 P 8,001 - 15,000 22 53 10 85 P 15,001 - 100,000 33 72 13 118 P 100,001 and above 5 16 6 27 No answer/Don't know/Refused 38 80 27 145
Total 110 233 57 400
Table 56. Contingency Coefficient Test Statistics: Monthly Household Income vs. What Usually Order in a Fast Food Outlet
Symmetric Measures Value Approx. Sig.
Nominal by Nominal Contingency Coefficient 0.1714 0.1464 N of Valid Cases …………………………………. 400
Future correlation studies involving monthly household income as a variable
should be subject to further refinement such that income gradation permits classification
into low, medium and high levels. Additionally, the P15,001–100,000 bracket is
considerably big and can still be subdivided into smaller intervals such as P15,001–
50,000 and P50,001–100,000. Introducing these intervals in the survey might have
resulted into different clustering patterns and possibly, a different significance test
outcome.

Table 57 classified total respondents into social classes with Class C posting a
majority of mentions across meal type ordered. However, the resulting correlation test
failed to establish any association between both variables at � = .05 (Table 58). Given
that household income is unquestionably correlated to social class, then it is not
surprising that said variable is likewise not significantly associated with consumers’
menu selection process. This mirrors the preceding test results correlating meal type
ordered with monthly household income. There is no sufficient evidence to prove that
the likelihood of ordering value meals is affected by consumers’ socioeconomic class.
Table 57. Social Class vs. What Usually Order in a Fast Food Outlet
MEAL ORDERED
SOCIAL CLASS
Value meal only
Value meal and other items in the menu
Individual menu items only Total
AB 15 47 9 71 C 60 122 41 223 D 33 61 6 100 E 2 3 1 6
Total 110 233 57 400
Table 58. Contingency Coefficient Test Statistics: Social Class vs. What Usually
Order in a Fast Food Outlet
Symmetric Measures Value Approx. Sig. Nominal by Nominal Contingency Coefficient 0.1658 0.0795 N of Valid Cases …………………………………. 400
The cross tabulation between educational attainment and what consumers
typically order when in fast food outlets shows a concentration of responses around those
who completed college across meal types ordered (Table 59). The corresponding

correlation test returned significant measures (Table 60), establishing a strong association
between both variables. Thus, hypothesis H3e: Meal preference has no significant
correlation with consumers’ educational attainment is rejected at � = .05. This implies
that educational attainment does have an inherent effect on consumers’ menu selection
process.
Table 59. Educational Attainment vs. What Usually Order in a Fast Food Outlet
MEAL ORDERED
EDUCATIONAL ATTAINMENT
Value meal only
Value meal and other items in the
menu
Individual menu items
only Total
No formal education 1 0 0 1 Some elementary 1 0 0 1 Completed elementary 1 0 0 1 Some high school 4 1 0 5 Completed high school 11 10 2 23 Some vocational 4 7 2 13 Completed vocational 6 7 3 16 Some college 25 42 13 80 Completed college 47 132 28 207 Post graduate 3 23 1 27 Don't know/Refused 7 11 8 26
Total 110 233 57 400
Table 60. Contingency Coefficient Test Statistics: Educational Attainment vs.
What Usually Order in a Fast Food Outlet
Symmetric Measures Value Approx. Sig. Nominal by Nominal Contingency Coefficient 0.2994 0.0060 N of Valid Cases …………………………………. 400
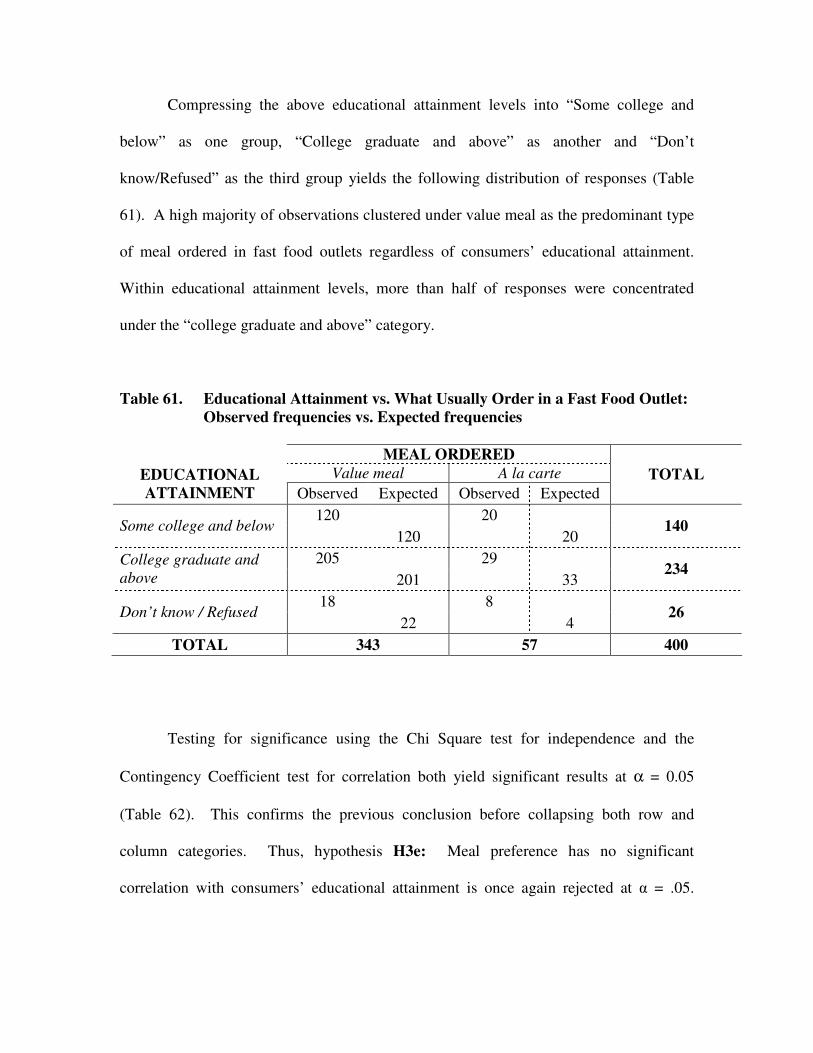
Compressing the above educational attainment levels into “Some college and
below” as one group, “College graduate and above” as another and “Don’t
know/Refused” as the third group yields the following distribution of responses (Table
61). A high majority of observations clustered under value meal as the predominant type
of meal ordered in fast food outlets regardless of consumers’ educational attainment.
Within educational attainment levels, more than half of responses were concentrated
under the “college graduate and above” category.
Table 61. Educational Attainment vs. What Usually Order in a Fast Food Outlet: Observed frequencies vs. Expected frequencies
MEAL ORDERED
Value meal A la carte EDUCATIONAL ATTAINMENT Observed Expected Observed Expected
TOTAL
120 20 Some college and below
120 20 140
205 29 College graduate and above 201 33
234
18 8 Don’t know / Refused
22 4 26
TOTAL 343 57 400
Testing for significance using the Chi Square test for independence and the
Contingency Coefficient test for correlation both yield significant results at α = 0.05
(Table 62). This confirms the previous conclusion before collapsing both row and
column categories. Thus, hypothesis H3e: Meal preference has no significant
correlation with consumers’ educational attainment is once again rejected at � = .05.

Educational attainment is associated with the type of meal (value meals, in particular)
that consumers order when in fast food outlets.
Table 62. Chi Square Test for Independence and Contingency Coefficient Test for Correlation: Educational Attainment vs. What Usually Order in a Fast Food Outlet
Value df Asymp. Sig. (2-sided) Pearson Chi-Square 6.467 a 2 0.039 N of Valid Cases 400 a 1 cell (16.7%) has expected count less than 5. The minimum expected count is 3.71. Value Approx. Sig. Contingency Coefficient 0.126 0.039 Nominal by Nominal N of Valid Cases 400
Note however that accepting the foregoing conclusions following test results from
Tables 60 (original educational attainment levels) and 62 (collapsed educational
attainment categories) is not supported by the reality that in Metro Manila a high majority
of Filipino consumers did reach the collegiate level vs. those who did not (given the high
emphasis on education in our culture) hence, resulting into the obvious clustering at that
point that proved to be significant. If the scope of this study were on a nationwide level,
a different distribution of responses might have been evident and possibly a different
significance outcome.

CHAPTER V
CONCLUSION AND RECOMMENDATION
Dynamics Toward Patronage of Fast Food Outlets
Considering the habitual eating habit and the annoyingly presence of fast foods
everywhere, target market groups regardless of socio-demographic profile are likely to
have tried a multitude of fast food. The more frequently visited fast food by these target
market groups include McDonald’s, Jollibee and KFC.
From the focus group discussion it was derived that the decision making process
when choosing for a fast food outlet to patronize varies among the target market groups.
While collaborative decision-making process is usually adopted by young age segments
(15-25), the older age segments (26-59) are more lenient as they usually let their
companions in deciding which one to go to. From the results of Contingency Coefficient
treatment it can be seen that the likelihood of consumers ordering value meals is not
affected by any particular companion that they are with when dining in fast food outlets.
Whether they are alone or with the company of others they will still opt for bundled
meals
Relatively, while there are times when choice of food to order are likely to be
influenced by the recommendations of friends or relatives, generally personal choice
prevails most of the time. The survey revealed positive correlation of consumers buying
for themselves to bundled meals than consumers who buy for others.

Among the target market groups, various considerations are taken into account as
well when choosing for a food item to order in a fast food. The degree of importance in
their consideration however established that affordable pricing and taste significantly top
the rating.
Perception/Consumption/Purchase of Food Bundles
Saliency of food bundle promo’s or popularly termed value meals is high. In fact
it is generally perceived favorable and beneficial for it offers savings, value for money
and convenience. Disadvantage noted lies only on the instance when food bundle does
not match food craved for.
While several fast food outlets may be associated with the different terms more
commonly used to denote a bundled meal, McDonalds enjoy equity for “value meal.”
Adding value to a meal is subjective and depends on how a person qualifies the term,
hence, the fast food that is considered to offer the “best” value meal may vary among
target market segment.
Contingency coefficient rejected the hypothesis that consumers who regularly
dine in fast food outlets are more likely to order bundled meals than consumers who are
not regular food outlet patrons. Therefore the likelihood of ordering value meals is not
dependent on the frequency of dining in food outlets.
It is a general trend among the target market to frequently order a value meal each
time they go to a fast food outlet. Fact is, there is no evidence from the survey that there
is a difference in socio-demographic profile between those who regularly order value
meals and those who don’t. However it can be noted that the tabulation and the

corresponding correlation test established a strong association between educational
attainment and food choice. Accepting the foregoing conclusions following test results
from Tables 60 (original educational attainment levels) and 62 (collapsed educational
attainment categories) is not supported by the reality that in Metro Manila a high majority
of Filipino consumers did reach the collegiate level vs. those who did not (given the high
emphasis on education in our culture); hence, resulting into the obvious clustering at that
point that proved to be significant. Survey might yield a different result when done in the
provinces or nationwide since the study is limited to key Cities of Metro Manila.
Likewise, there is no established difference as to occasions or time of the day when value
meal is to be ordered or not. Generally, fast food is value meal. The only cases when
value meal is not ordered depend on the following:
• When food craved for is not included in any of the value meals
offered
• When deciding companions feels that those who would avail of it
would not be able to consume all the food offering in the value
meal, hence a waste.
• When value meal is perceived not to satisfy food craving or fill up
hunger.
Receptivity to Promotions/Advertising Campaigns for Food Bundles
Target market groups are well informed of the promotional campaigns adopted
for value meals. In fact they consider such a considerable motivator to their purchase
consumption of value meals. However the study’s statistical treatment result state that
there is no significant correlation to the physical surrounding and the choice of meal
ordered. Although based on survey frequency alone most prominent promo that
motivates purchase include merchandising visuals in-store, free items (toys) and
sampling.
Lifestyle Habits and Practices
Malling has become a way of life among the target market groups. However
differing behavior seem to prevail between the two market groups as while the younger
age segment (15-25) feels that it is a need, the older age segment (26-59) finds it more of
a necessity than a need. Such is deduced considering the frequency of doing and the
reason for doing such an activity.
Regardless of socio-demographic profile, target market groups spend their time
generally outside their home either at work, school or other activities that suit their needs.
Such that dining out like malling has been a prevalent routine. In fact it does not take any
special occasion to do such an activity. Regular eating out are generally done in fast
foods.
Recommendation
The study revealed that packaged prices are sought after and attract diners to the
establishment like magnets. Bundled meals (value meals) are definitely a boon to the
family’s purse that is why it is widely accepted. With the strong push of the Maxim’s
bundled meal “maximeal” they can get more discounts and longer credit line with
suppliers like plastic cups, foam packs, drink companies etc.
A combination of factors affect the consumer’s choice of bundled meal but the
most mention and significantly correlated with meal decision are affordable pricing and
taste which is characteristic of a utilitarian value. With this in mind fast food companies
should carefully evaluate their food combinations as well as adapt to the majority of the
Filipino taste and appetite. This might be the reason why KFC recently launched the P29
chicken steak meal with superb flavor and reasonable price. It is therefore suggested to
Maxim’s to sit down with their chefs and create an irresistible treat to consumers.
Consumer’s choice of bundled meals is not bounded by any socio-demographic
profile whether young or old, male and female, married or single, middle or higher
income household, less education or high education …..bundled meal is a popular order
in fast food outlets. Strategy in terms of marketing campaign should have appeal to the
general family. It is therefore recommended that a particular fast food restaurant conduct
its own study to find out who are the dominant key decision influencers for choosing a
particular fast food outlet that they may determine their primary target market and thus
develop campaign material intended for them.
No occasion situation is more prevalent reason for dining in fast food outlet and
ordering of bundled meals. It was not established that during special occasion there is
preference for ala carte menu therefore it is recommended to offer special package food
combinations and treats for particular occasions such as birthday, graduation, baptismal
and reunions as this maybe an additional source of increasing profit for value
meal/bundled meal sales. For instance Maxims can offer dimsum “bilao” this Christmas
Season for a discounted price. It should be cheaper compared to buying the dimsum in a
one order size.
According to the results of the study Meal Choice is not greatly influenced by any
single collateral or event in the fast food outlet (physical surrounding). Although a
majority of responses clustered around “menu board” as what might prompt them to
notice and order bundled meal. With this, fast food outlet particularly Maxim’s should
consider an attractive menu board with visuals of the food package that is eye-catching
and mouth watering with its corresponding affordable price tag. Promotions and Product
Sampling although statistically not significant influencer also plays a role to encourage
bundled meal offer. Therefore it is highly suggested to come up with interesting
promotion to support the sales of bundled meal. For instance, since the people of Metro
Manila are technology crazed society Maxim’s could offer an hour of wireless internet
access for a value meal order. Technology and fast food is quite a combination to offer a
great way to unwire, unwind and enjoy extra value meal and catch up on email. For busy
people who rely on laptops and PDAs it makes a lot of sense. The concept fits many
types of consumers benefiting from high speed access while escaping from the office or
school for a few minutes. Understanding the importance of value, speed, convenience
and ease of service are for today’s time-pressed consumers and with a good promotion
Maxim’s can be a relevant choice out there.
Further research can be made investigating total food industry including fine
dining restaurants and factors affecting the choice of meals. Areas such as value meal
upsizing could also be correlated to specific demographics that might affect the sales of
bundled meal. Psychographic descriptors deducted from this study could still be
extracted to find out which segment of the target market seems to cluster most or if such
lifestyle variable affects menu choice. Future correlation studies involving monthly
household income as a variable should be subject to further refinement such that income
gradation permits classification into low, medium and high levels. Additionally, the

P15,001–100,000 bracket is considerably big and can still be subdivided into smaller
intervals such as P15,001–50,000 and P50,001–100,000. Introducing these intervals in
the survey might have resulted into different clustering patterns and possibly a different
significance test outcome. The research can also be replicated in other areas such as
provincial since it was limited to Metro Manila. Further external validity can be achieved
by applying this research in other regions in the Philippines for a comparison of results
across areas.

BIBLIOGRAPHY
Books
Assael, Henry. Consumer Behavior and Marketing Action. 6th Edition. New York
University, 1998.
Chan, T.S. Consumer Behavior In Asia: Issues and Marketing Practice. Haworth Press
Inc., 1999.
Edralin, Divina. Business Research Concepts and Applications. De La Salle University
Press, Inc. 2000.
Go, Josiah. Contemporary Marketing Strategy in the Philippine Setting (Updated
Edition). April 1996
Lehmann, Donald R., Sunil Gupta and Joel H. Steckel. Marketing Research. New York:
Addison-Wesley Educational Publishers, Inc., 1998.
Malhotra, Naresh. Marketing Research An Applied Orientation 4th Edition. Pearson
Prentice Hall 2004.
Moutinho, Luiz, Mark Goode and Fiona Davies. Quantitative Analysis in Marketing
Management. John Wiley & Sons Ltd. 1998.
Roberto, Eduardo L. Applied Marketing Research. Quezon City: Ateneo de Manila
University Press, 1987.
Siegel, Sidney. Nonparametric Statistics for the Behavioral Sciences. International
Student Edition. McGraw-Hill Kogakusha Ltd., 1956.

Periodicals
Asim Ansari, S. Siddarth and Charles Weinberg. “Pricing a Bundle of Products or
Services: The Case of Nonprofits.” Journal of Marketing Research Vol XXXIII
(February 1996) 86-93.
Chandon, Pierre; Wansik Brian and Laurent Gilles. “A Benefit Congruency Framework
of Sales Promotion Effectiveness.” Journal of Marketing Vol.64 (October
2000), 65-81.
Dilip Soman and John T. Gourville. “Transaction Decoupling: How Price Bundling
Affects The Decision to Consume.” Journal of Marketing Research Vol
XXXVIII (February 2001) 30-44.
Eric T. Bradlow and Vithala R. Rao. “ A Hierarchical Bayes Model for Assortment
Choice.” Journal of Marketing Research Vol XXXVII (May 2000) 259-268.
Francis J. Mulhern and Daniel T. Padgett. “The Relationship Between Retail Price
Promotions and Regular Price Purchases.” Journal of Marketing Vol.59
(October 1995) 83-90
Jannet Highfill “Mixed Bundling with Profit and Sales Objectives” International
Advances in Economic Research; May 1, 2001
Joel Tanchuco and Neriza Delfino. “Business Focus: The Benefits of Bundling.” Manila
Bulletin; August 30, 2004.
Wubker Georg. “Bundles’ Effectiveness is Often Undermined” Marketing News;
March 18, 2002
News Article “Pizza Chain Introduces Pepperoni Value Meals” New Strait Times;
October 12, 2002
News Article “Add-tie-ins to Menu Enticement” Mediaweek; October 18, 1993
News Article “Burger King Corp. Introduced Three-tiered Value Meals” Newswire;
April 23, 2001
News Article “Beyond Your Next Renovation: B&I Volume Increases with Value Meals;
Daily Specials” Food Service Director; October 15, 2002
News Article by Bob Sperber “McD Beefing Up Value Meals” Brandweek; December
3, 2001
News Article by Carol Casper “Cutting the Mustard” Restaurant Business; February 10,
1995
Opinion and Editorial. “Why Value Meals are Popular.” Manila Bulletin; September 1,
2002.
Supplement “Add tie-ins to Menu Enticement; Discount Wars Over the Last Four Years
Have Increasingly Made Brand Loyalty Moot in Fast Food” America’s Top 2000
Brands; 2002
Internet
www.census.gov.ph
www.cbsnews.com “Save By Bundling”
www.wikipedia.org (encyclopedia)
www.jollibee.com.ph
www.okstate.edu/ag/agedcm4h/academic/aged5980a/5980/newpage110.htm, June 2005. Key, James P. “Research Design in Occupational Education.”

Interviews Conducted
Rara Naval
Research Manager
McDonalds Philippines
Email sent on December 11, 2004
Dr. Antonio Conception
Chairman Marketing Management DLSU
Corporate Marketing Research Manager, San Miguel Corp.
Email sent on November 7, 2004
Bill Marvin
Author “Guest Based Marketing: How to Increase Restaurant Sales Without
Breaking your Budget” 1997
Restaurant Doctor
Email sent November 2004

APPENDIX B
PROPOSED FOCUS GROUP DISCUSSION GUIDE
I. Introduction/Warm Up (5 mins.) 1. Brief Introduction of purpose of meeting, confidentiality of survey
2. Discussion of rules, i.e., no right or wrong answer, take turns in answering questions 3. Brief introduction of moderator and participants
II. Warm-Up/ Lifestyle Habits Information (20 mins.)
� How do you go about your day? Describe your typical day? What time wake up and your activities after? What time do you end your day? � When are you most likely at home (daypart/time/day of the week)? What activities
do when at home? How often do such activity? Companions when doing so? � (Aside from work) What activities do you do during weekdays? How about
weekends? � What activities do you do out of home? Where do activities? Companions when
doing so? How often engage in such activity? � When engaging in (activity) who do you usually spend it with ? � What leisure activities do you do when your just alone? What about when with
friends? Family/kins? � Where do you spend such leisure/entertainment activities? Who do you spend it
with? Additional Probes if not mention in leisure activities: � Do you go out malling? What activities do you do in a mall? How often do such
activity? � Do you indulge yourself in dining or eating out?
III. Eating out Habits (15 minutes)
� What types of food outlets patronized when eat out/dine-in? Probe: Do you patronize the services of a fast food outlet? What services avail of, i.e., dine-in, take out, delivery? � How often patronize services of fast food or quick service restaurant for specific
services? � Occasions/Time of the day when visit fast food outlet/quick service restaurants? � Companions when dine-in at fast food/quick service restaurant? � Amount spent usually spent when eat out/dine-in at fast food restaurant � Which fast food outlet/quick service restaurant have they availed service from? Which is most often? Why most often? � Who usually decides which fast food /quick service restaurant to patronize? � Foods usually ordered when dine-in in fast food/quick service restaurants? � Whether take out food when dine in? Occasions when take out food? How often take out food? � For whom usually take out food? � What foods usually take out?

IV. Consumption/Purchase Patterns for Value Meals/Food Bundled Promo (30 minutes)
� How do you normally choose the food to order in a fast food /quick service restaurant? Whether take a look at the menu or already have a planned food to order prior to visiting the outlet/restaurant?
� What usually is the basis for ordering a food item? What motivates them to order a food item? Who usually decides what to order?
� Whether avail of value meals/food bundled promo when availing services of fast food /quick service restaurant? When do they avail of value meals/food bundled promo, i.e., dine-in or take out? � How often order value meal/food bundled promo when visit fast food/quick service
restaurant? Compare ratio of ordering value meal to ordering individual meals, how many percent of the time would you order a value meal each time you go to a fast food/quick service restaurant?
� Reasons why opt to order value meals/food bundled promo/Factors that motivated to order value meals/food bundled promo
� When ordering a value meal/food bundled promo, what do you consider or take into account when choosing which value meal to order? Why consider such? Which would you prefer ordering a value meal or ordering individual meals/menu? Why?
� Occasions/Time of the day avail of value meals/food bundled promo. During what instances would you avail of a value meal/food value promo? Why?
� Companions when avail of value meals/food bundled promo � For whom order value meals/food bundled promo? During what occasion order value
meal/food bundled promo for them, i.e., dine-in or take out? Why order such for them during such occasion?
V. Attitude and Perception Towards Value Meals/Food Bundled Promo (20 minutes)
Intro: You mention to order value meals or food bundled promo when availing the services of fast food /quick service restaurant, I would like to understand further your perception of value meals and food bundled promo.
� How or where did you get to know about value meals/food bundled promo in fast food /quick service restaurant you visit or patronize?
� What is your perception of value meals/food bundled promo? � What if any do you like about it? What about the things that you don’t like about it? � Are there benefits or advantages derived from ordering a value meal/food bundled
promo? If so, what do you think are the benefits or advantages? Any disadvantage? � Which fast food outlet/quick service restaurant that you have gone do you think offers the
best value meal or food bundled promo? Why did you say so? What is it in their value meals that made you think it is best? What things do you look for or expect in a value meal or food bundled promo for it to be acceptable to you?
VI. Receptivity to Promotions (10 minutes)
� Are you aware of promotional advertisements or campaigns for value meals? If yes, what promotional campaigns are you aware of?
� Where do you usually find or see such promotional campaigns or advertisements? Have you seen any clippings for discounts or promos on value meals in brochures or magazines? Do you usually collect this promo discount coupons? If no, why not?
� What promotional campaigns would be acceptable to you for such food offerings? VII. Closing/Wrap up ( Estimated Time 100 minutes)

APPENDIX C
FGD SUMMARY OF FINDINGS
A. Prevailing Lifestyle Habits and Practices The lifestyle habits of the target market groups under study reveal that while there are some similarities, there appears to be some variations as well. For instance, one of the most prominent similarities is the fact that the target market groups spend a lot, if not most of their time outside of their homes. The youngest age group (15-20 years old), generally spends at least half of the day in school. After school, during lunch breaks or even short vacant periods, they either go to the malls, or indulge themselves in other activities with their friends or schoolmates, still outside of their homes. On the other hand, those above 25 years old are most of the time out of their homes because they are pre-occupied with work. Established routines of those between 21 to 25 years old more or less is a cross section of the youngest and older market segments (15-21 or 26 years and above) Variations may be noted however as to the time they conduct their daily activities. While the older age group being more work oriented, normally starts their day during weekdays as early as 5:30 in the morning and latest at 9 or 10 am if worked late the previous day, those from the 15-25 years old age groups are more relaxed with their time waking up earliest at 9 am and latest even 12 noon.
Actually I wake up 11 or 12, watched TV then probably 2-3Pm go out, after that 7-8 pm dinner, around 8:30 or 9 go out again. I wake up 11 am tapos at 3 pm I go out then I go home 9 pm
(Class AB, 21 -25 years old)
Siguro pag gising ko mga 9 am, breakfast, tapos ready na for school. After school , lalabas kami ka-klaseko sa Mall up to 7PM Mga 10 am po, breakfast, then lalabas para makipagkwentuhan, then ligo tapos pasok na.
(Class C 15-20 years old)
We drive our children to school so I usually wake up at 5:30 afterwards straight to the office usually 10 am. My schedule after lunch is unpredictable so can be home by 5 pm or midnight. With difficulty, I pull up from bed quarter to 7, have breakfast, wash off, head for the office before 8:30 finish up at 6:30 pm,

(Class AB 26-59 years old) Usually wake up at 6 am, quick breakfast, leave the house by 7:15, office about 8:30 go home 6:30 to 7 at home by 8 Early person ako, so I wake up at 5AM, quick breakfast, leave the house 6:15 in the office by 6:30-7 am, then work the whole day, head home 6:30-7 pm. Rest, kung may magyaya, go out
(Class C 26-59 years old)
Similarly, both target market groups makes it a point to spend at least a day of the week at home. Differences rest however on the day when they are usually at home and the activities they indulge in when at home. Among those 15-25 years old, they take their time to indulge themselves in doing personal stuffs like working on the computer, watching TV, chatting on the phone and doing some household chores when at home. On the other hand, the older age segment (26 and above) take their time to rest and enjoy relaxing moments by themselves or with the family members. Activities more likely engage in include, reading, getting in-touch with relatives through email, cleaning household fixtures, cooking for the family, tinkering the piano, watching TV or simply spending time with their kids. As to the time they are home, the younger age segment seems to have unpredictable time when they are mostly at home. Such instances happen either when they do not have classes or work during weekdays or have no activities outside of home during weekends. Meanwhile, the older age segment generally is more predictable making it a point to be home at least a day during weekends. What do you do when at home…
Tumutulong po ako sa mama ko sa pag luto, pagligpit ng bahay at yon po nanunuod ng TV. Naglilinis ng bahay, inaasikaso yong mga kapatid ko. Pag Sunday po kasi usually nagigising na ako ng 12 o’clock tapos kakain po, manunuod ng TV hanggang mag hapon na po iyon.
(Class C 15-20 years old) Wala, or telephone din, watch TV Watching TV and computer

TV or DVD (Class AB, 21 -25 years old)
I would say I’m home during weekends, that’s the time I can relax, do the things that I want to do, my personal errands, whether its just staring at the window, smoking, that’s for me at home. Normally I define home when I can stay up in bed more than 10 hours during weekends.
(Class C, 25 -59 years old) Weekends, the whole day, sleep, watch TV, play the piano, read books. We usually try to be home during weekends. Funny our kids do not want to go out, they want to stay home.
(Class AB, 25 -59 years old)
Companions are inevitable among the target market groups. In most instances while doing an activity or so, it is more likely that they do these activities with a companion. Among the younger group, activities outside of the home are generally carried out with their friends or schoolmates. It is surprising that kins and relatives are seldom or an occasional companion when engaging in activities outside the home. Family and relatives are more often companions when engaging in activities inside the home. In contrast, while there is also evidence of friends as outdoor activity companions among the older age segment, family members either wives, husbands, kids, grandchildren, parents, nephews or nieces more likely prevail. One other revelation among the older age segment is the fact that, some activities are preferred to be done just by themselves.
I get the kids on Sunday and we go malling…. Every other weekends we go home to Binangonan to be with my mom and dad, so some sort of family gathering Kasi for example gusto kong pumunta sa mall, ayokong magdrive kaya kasama ko siya (husband).
Any activities done alone?
Parlor and sometimes I just would like to go to a coffee shop I make it a point na at least Thursday I have a date for myself. I have been wanting to have a Robbie day…. Shopping, kasi my husband would complain ang dami dami mong tinitingnan, don’t touch, so I don’t end up buying anything.

(26 -59 years old) Indulging in leisure activities is likewise prevalent among the target market groups. A diversity of leisure activities is quite apparent however. Relatively, while some leisure activities are evident to both, the incidence of engaging in such activities, their purpose in doing such activities, the companions they do it with, the places they frequent for such activities varies considerably as well. TV viewing among the 15-25 years old is a frequent habit in fact, as soon as they wake up in the morning and at any time they are in the house such activity is being conducted to while away time. On the other hand, among the older ones, such activity is done quite seldom and if ever they do, only as a form of relaxation and as a tool to fall asleep. Radio listening is another leisure activity more commonly engaged in. While both target market groups tune into the radio quite frequently, i.e., almost everyday, variations as to the stations and programs each target market groups tune into as well as the time and place where they conduct such activity is likewise notable. For instance among the younger age segment, radio listening is usually done in the evening at home and more often, they are tuned into musical programs. Meanwhile, it has been a habit among the older age segments (26 and above) to tune into news programs every morning or musical programs while driving to the office in the morning or driving home in the afternoon or evening. Engaging in sports activities among the target market groups is likewise apparent. Comparatively, both admit that when they do engage in such activities friends are likely to be their frequent companions. Noteworthy however is the fact that, incidence of engaging in such activities seems more frequent among the older age segments, i.e., at least once a week., unlike the younger age group which happens sporadically, i.e., when they just feel like it or they just thought of it as a means of gathering their group. This is not surprising since the older age segment considers such activities not only a form of relaxation but leisure as well, not to mention being more health conscious and more adhering to the value of health fitness because of their age than the younger age segment. Sports activities of which the younger age segment would likely engage in whenever they do so include badminton, table tennis, and basketball. Note that most of the sports activities take more than one person to happen, a proof of the need for companions. On the other hand, the older ones are likely to engage in motor or mountain biking, scuba diving, gym work-outs and regular brisk walking, some of which they would likely do on their own.

Malling is almost a way of life to both target market groups. While both groups never miss to go to the malls in a week’s time, a diverse malling habit is displayed. Incidence of malling among those 15-25 years old is quite frequent, i.e., an average of 3-4 times a week and if they do they spend longer hours, i.e., 3 to even 15 hours each visit (longer during the weekends). When at the malls, this age segment are likely to meet friends, do shopping, watch movies, dine-out, play computer games, or simply just stroll or roam around to while away time. To those 26 years and above, malling is more of a necessity rather than a need unlike the younger ones. In fact, if they can help it they would like to veer away from going to the malls. The older age segment go to the malls more likely because it’s the nearest place to dine and the fast foods are there, they need to shop for groceries, personal items for themselves or their kins, they’d like to bring their grandchildren to amusement centers, they want to please their girlfriend because she likes to shop in the mall or simply because the workplace is situated in the malls. As such, they visit the mall less frequent, i.e., once a week or less often. How often do you go to the mall and what activities do you do in the mall?
Not really, unless I have to please my girlfriend, average twice a month.
Once a week primarily because kung sino ang kasama ko not because I want to.
Once a month, kuripot ako eh. Attending to my grandchildren, naglalaro sila sa amusement center while I sit in one side reading. Twice a month. On the average, once a week as a driver, napipilitan din magpunta ruon.
(26 -59 years old) Further distinction as to malling habits pertains to the amount spent when inside the mall. The younger age groups since under a budget are likely to spend between Php 200 to 500 for their usual activities in the mall. On the other hand, since the older age groups are likely to go out with the family or would go to the malls because they are to shop for some items every time they visit the mall, though under budget constraint, tend to spend even higher, more likely Php 500 to 1,500 per visit.

Eating out is seemingly inevitable to both groups as most of their time is spent outside of their home. Amongst the younger age segment, it has become a usual habit to eat out prior or after an activity in the mall. Likewise, they find such occasions as a venue to be with their friends and peers or occasionally with their families. Such is also the case amongst the older age segment except that it’s more of an occasion to be with their families rather than their friends and peers. While there are instances when dining out are done to celebrate special occasions like birthdays, anniversaries or family reunions, it has become more of a daily routine to both segment because of the necessity, hence, needs no particular occasion to do so. With the prevalence of several food outlets in the metropolis and since it has become a habitual practice among the target market groups to eat out, it is not surprising to note that they have tried a myriad of food outlets ranging from the simple carinderia, to fine dining and more specially the countless fast foods which likely includes, McDonalds, Jollibee, KFC, Wendy’s, Chowking, Pizza Hut etc. Variations however lie on the fact that fast foods are more frequently visited compared to the other types of food outlets because its cheaper, offers faster service and as one customer would say, “it’s annoyingly everywhere” . B. Dynamics Towards Patronage of Fast foods Both target market segments appear to have tried almost all types of fast food outlets. More prominent however are burger joints, chicken and pizza houses. To cite a few, such would include McDonald’s, Jollibee, KFC, Pizza Hut, Greenwich, Chowking, Burger King, Shakey’s with the first three being most regularly patronized. Services availed of from a fast food outlet differs somehow. While the younger age segment particularly those from middle income group would have availed of both dine-in and take out services only, those from the upper income segment have likely availed of all the services offered in the same manner as the older age segment. Generally though, dine-in is the type of service regularly availed.

Availing of take out service seems more frequent among the younger age segment compared to the older age segment (average twice a week vs. seldom). When such is availed, it is more likely for themselves (more apparent among younger age group) or for their kins (both segments). Amongst the younger age segment, food take out likely happen when they are in a rush and they feel that what they have taken is “bitin” , when they want to take some dessert while they stroll or when one of their kins requested them to do so. Among the older age segment, take out happens when there are leftovers and they want to bring such to their pets or when they found the food offering in the outlet worth trying by friends or other relatives. Delivery service are not often availed of or not availed at all. Propensity to avail the service is more notable among the older age group (average once every two weeks or less often). Both market segments somehow agree that it takes no special occasion when availing the services of fast foods. In fact both segments confirm that there’s no specific time preference when to eat in a fast food, meaning this could be anytime either breakfast, lunch, dinner or snack time in the afternoon. Among the younger age group, companions when eating in a fast food are more frequently friends, schoolmates, and occasionally family members. Meanwhile, family members or relatives and officemates are usually the more common companions of the older ones. Decision making process when choosing for a fast food outlet to patronize varies among the target market groups. While the younger age groups either choose by voting amongst their companions, the older age segment thinks otherwise, sometimes they let their companions decide which fast food to patronize or go with the flow of who’s buying for the food.
The magic word is who’s buying e di dun ako. Minsan ayoko na mag isip so I let who ever I am with to decide.
(26 -59 years old) Amount spent per dining occasion in a fast food more or less range from as low as Php 50 to 120 for one person and to about Php 250 to as high as 1,000 if with companion (older age group).

The younger age segments appear less critical when choosing for a fast food outlet to patronize compared to the older segment. Amongst the younger ones, they choose the fast food to patronize on the basis of accessibility, quality of food, i.e., taste, price offering/affordability and affinity “ nakasanayan”. On the other hand , the older age segment would likely include fast service, food offering (combination meals or variety of food offerings), cleanliness of outlet and reputation in their consideration as well. C. Consumption /Purchase Patterns for Food Items/Value meals Choice of food to order when visiting a fast food outlet varies during each eating occasion. However, decisiveness seems more evident among the older age segment as usually they have already thought of the food they would initially order prior to going to the outlet. What’s surprising about this age group is the fact that despite having a planned menu in mind to order, they take their time to look at the menu board and check what’s new in the fast food outlet as well for possible additional order.
Me I have fishburger in mind before I enter. Yes , I have a plan but I listen to the offer usually given at the counter Me usually, alam ko na what to order but it has always been a habit to look at the menu board to know what’s new Oo, may favorite na ako, but still look at the menu board baka may bago
(26-59 years)
The younger age segment on the other hand, decides on a case to case basis. There are times when prior to getting to the outlet a menu in mind had been set because of affinity or cravings for the food item, there are also times when they just plan when at the store and look at the menu board first of what fits their budget or what’s new.
Sometimes na prior to going there meron na, may time naman na duon na.
Titingin muna sa menu board
Hindi na kasi yon na ang lagi kong inoorder Ganuon din, depende na lang kung may bagong food
Budget muna kung ano ang magmamatch sa budget ko.
(15-21 years old)

Varied considerations are taken into account when choosing for a food item to order, it may be noted however that such consideration appear to be common to both target segments. More likely, they would consider, the price, the taste, value for money (whether they get their money’s worth in terms of quantity, price and completeness of food offering), Mood ( whether hungry or would want to take light meal or cravings for food item), ease of ordering, availability, attractiveness of food visual advertisements, variety of choices, recommendation of friends and promo offerings. Generally, burgers, fries, pasta, chicken and the very popular value meal are frequently ordered food items during each eating occasion in a fast food outlet. Further, food ordering process though sometimes driven by recommendation is more of a personal decision. Irregardless of time, value meals as choice option during dine-in occasion in fast food is more prevalent. While in some instances value meal is also a choice option during take out occasion such is more apparent among the older age segment and those from class C homes from the younger age segment who would likely take out for their kins. Ordering ala-carte during take out seems more apparent among the younger age segment from the Upper income class. Further, value meal as a food choice option during dine-in occasion spreads across socio-demographic profile of target market groups. While it is apparent that value meal is generally ordered when visiting a fast food outlet because of its affordability, the convenience, i.e., ease of ordering , the fast and quick service, value for money, there are certain instances when such are not availed of as follows:
• When food desired to eat is not included in any of the value meals offered • When deciding companion feels that the children may not be able to eat
up all the food offering in the value meal • When value meal is perceived not to satisfy or fill up hunger
Considering that there are several value meals currently being offered, basis for choosing a value meal to order are likewise subjected to the same criteria as when they are choosing for a general food to order in a fast food.

D. General Perception Towards Value meals Overall, awareness to value meals is high. This may be attributed to the wide communication and advertising campaigns being adopted for the product both in-store and on media. Proof of the strong saliency of value meals among target market groups is the fact that when they are presented with several terms commonly used by specific fast foods to advertise a value meal, it is likely that 6-7 out of the 8 terms presented are associated with the right fast food outlet. Result of the association exercise reveal that McDonald’s holds equity for the term value meals particularly among the younger age group. While there is also likelihood to associate the term to McDonalds among the older group, there appears to be some indication of such being also associated with Jollibee. Value meal is generally perceived favorable. Both target market groups find the idea of value meal beneficial because of price consideration, value for money, i.e., completeness of food offering, convenience, i.e., ease of ordering and fast service. Only unfavorable concern cited about the value meal is the fact that the food combination are fixed and that no value meals actually matches the their desires during a given purchase time. While the younger age market are quick to utter a fast food that they perceive to have the best value meal, the older age segment are more critical saying that they have not yet seen so far or they not yet tried so far the best value meal offer. To them value meal would mean, quality food, i.e., good taste, enough serving at the same time priced affordably. E. Receptivity to Promotions for Value meals Both target market groups are generally aware of the promotional campaigns adopted for value meals. In fact they praise the visual advertisements for the product saying that indeed it motivates them to buy the product and that sometimes they are driven to purchase the food item because of the way the products are presented and used as in-store merchandising materials. Promo Coupons are likewise salient and welcomed as at one point in time they have collected and made use of or availed of such promotional campaign. It is quite apparent though that such is not much a motivator to drive them to go to the fast food on purpose and avail of the products. Availing such promotional materials is quite incidental.

Product sampling, freebies such as toys and other personalized items are more welcomed as promotional items to further motivate product purchase. Likewise to encourage target market groups to continue patronizing value meals, the adopting a point system that would provide free gas or even free parking fee is suggested, such suggestion being more apparent among the older age segment.

APPENDIX D
Respondent # Good morning/afternoon/evening. I am [your name], an independent researcher conducting a survey on fast food outlets in this area. I’d like to ask you a few questions that should take a maximum of only 15 minutes of your time. Magandang umaga/tanghali/hapon/gabi po. Ako po ay si [your name], isang independent researcher na may ginagawang survey tungkol sa mga fast food outlets sa lugar na ito. Maaari po ba kayong matanong ng ilang katanungan na hindi po hihigit sa 15 minuto lamang? A. SCREENING 1. When was the last time you visited a fast food outlet?
Kailan po kayo huling pumunta/bumisita sa isang fast food outlet?
Within the past 3 months 1 � CONTINUE More than 3 months ago 2 � TERMINATE
2. What is your age?
Ano po ang edad ninyo? [RECORD ACTUAL]
Below 15 1 � TERMINATE 35-44 4 � CONTINUE 15-24 2 � CONTINUE 45-60 5 � CONTINUE 25-34 3 � CONTINUE Above 60 6 � TERMINATE
NOTE TO INTERVIEWER: Record gender. Male 1 � CONTINUE if age and gender quota is still not met. OTHERWISE, TERMINATE. Female 2 � CONTINUE if age and gender quota is still not met. OTHERWISE, TERMINATE.
3. Where do you live? Saan po kayo nakatira?
Caloocan 1 Parañaque 10 Las Piñas 2 Pasay 11 Makati 3 Pasig 12 Malabon 4 Pateros 13 Mandaluyong 5 Quezon 14 Manila 6 San Juan 15 Marikina 7 Taguig 16 Muntinlupa 8 Valenzuela 17
CONTINUE
IF 100 MALL
QUOTA IS STILL NOT
MET
Navotas 9
CONTINUE IF 100 MALL
QUOTA IS STILL NOT
MET Outside Metro Mla 18 � TERMINAT
E
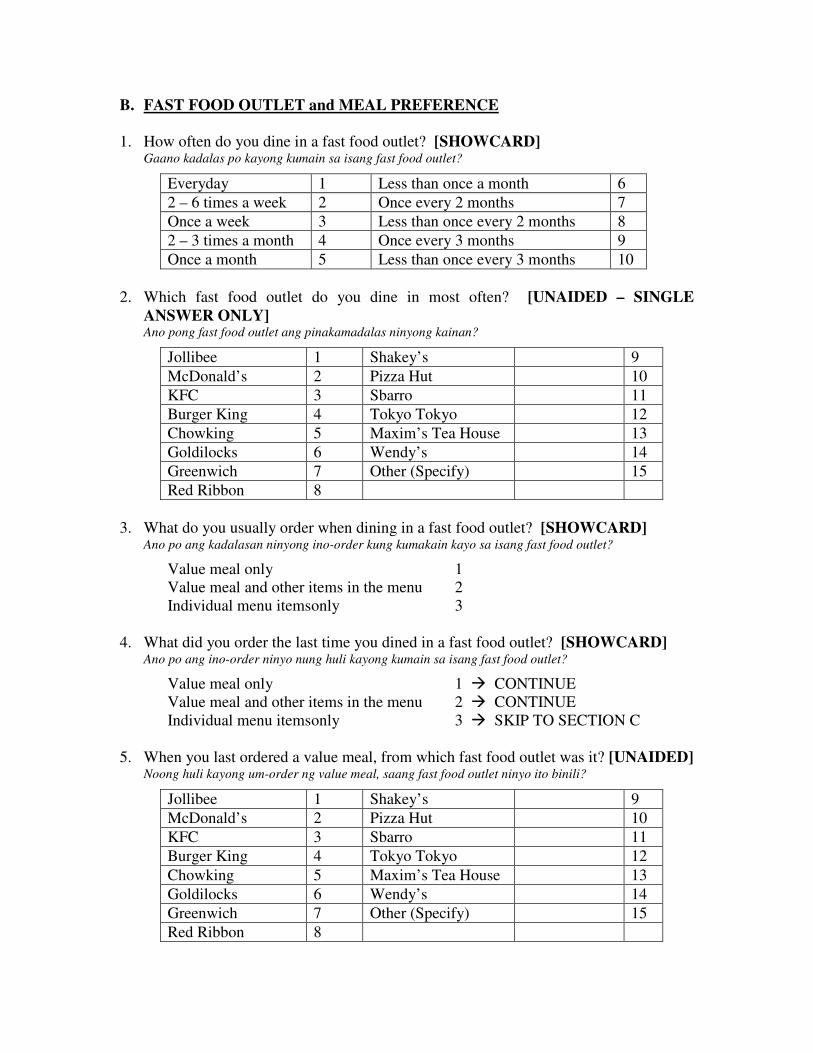
B. FAST FOOD OUTLET and MEAL PREFERENCE 1. How often do you dine in a fast food outlet? [SHOWCARD]
Gaano kadalas po kayong kumain sa isang fast food outlet?
Everyday 1 Less than once a month 6 2 – 6 times a week 2 Once every 2 months 7 Once a week 3 Less than once every 2 months 8 2 – 3 times a month 4 Once every 3 months 9 Once a month 5 Less than once every 3 months 10
2. Which fast food outlet do you dine in most often? [UNAIDED – SINGLE
ANSWER ONLY] Ano pong fast food outlet ang pinakamadalas ninyong kainan?
Jollibee 1 Shakey’s 9 McDonald’s 2 Pizza Hut 10 KFC 3 Sbarro 11 Burger King 4 Tokyo Tokyo 12 Chowking 5 Maxim’s Tea House 13 Goldilocks 6 Wendy’s 14 Greenwich 7 Other (Specify) 15 Red Ribbon 8
3. What do you usually order when dining in a fast food outlet? [SHOWCARD]
Ano po ang kadalasan ninyong ino-order kung kumakain kayo sa isang fast food outlet?
Value meal only 1 Value meal and other items in the menu 2 Individual menu itemsonly 3
4. What did you order the last time you dined in a fast food outlet? [SHOWCARD]
Ano po ang ino-order ninyo nung huli kayong kumain sa isang fast food outlet?
Value meal only 1 � CONTINUE Value meal and other items in the menu 2 � CONTINUE Individual menu itemsonly 3 � SKIP TO SECTION C
5. When you last ordered a value meal, from which fast food outlet was it? [UNAIDED]
Noong huli kayong um-order ng value meal, saang fast food outlet ninyo ito binili?
Jollibee 1 Shakey’s 9 McDonald’s 2 Pizza Hut 10 KFC 3 Sbarro 11 Burger King 4 Tokyo Tokyo 12 Chowking 5 Maxim’s Tea House 13 Goldilocks 6 Wendy’s 14 Greenwich 7 Other (Specify) 15 Red Ribbon 8
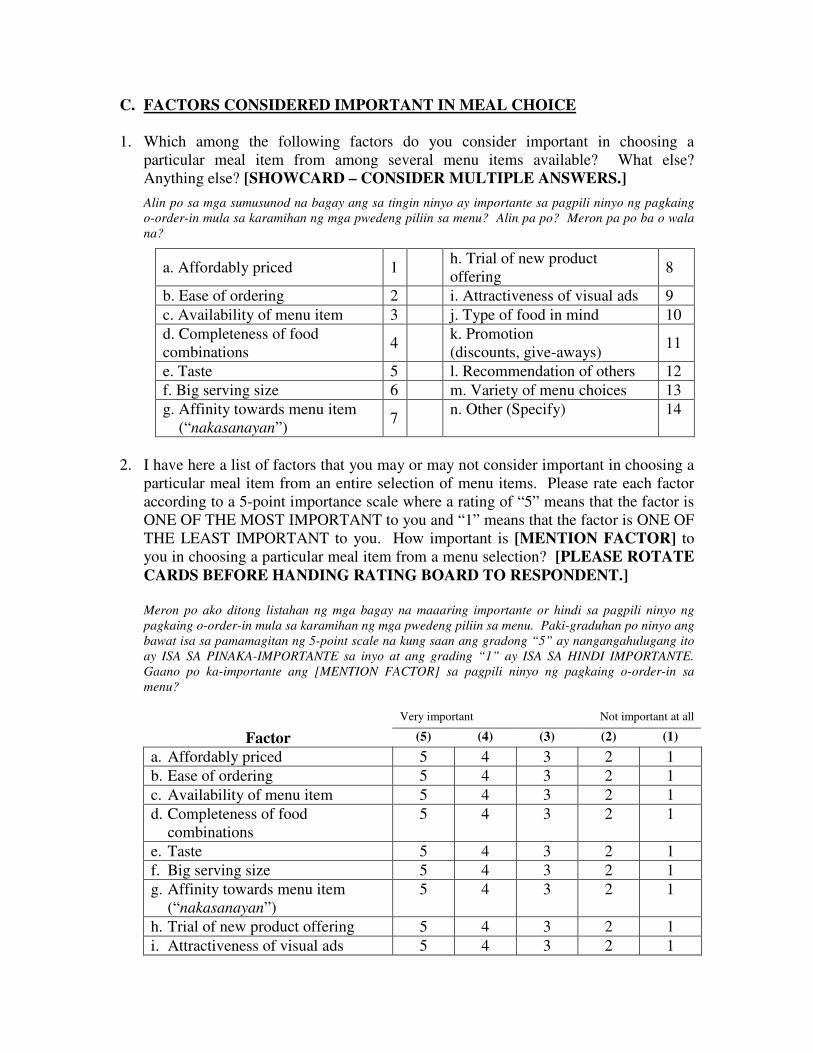
C. FACTORS CONSIDERED IMPORTANT IN MEAL CHOICE 1. Which among the following factors do you consider important in choosing a
particular meal item from among several menu items available? What else? Anything else? [SHOWCARD – CONSIDER MULTIPLE ANSWERS.]
Alin po sa mga sumusunod na bagay ang sa tingin ninyo ay importante sa pagpili ninyo ng pagkaing o-order-in mula sa karamihan ng mga pwedeng piliin sa menu? Alin pa po? Meron pa po ba o wala na?
a. Affordably priced 1 h. Trial of new product offering 8
b. Ease of ordering 2 i. Attractiveness of visual ads 9 c. Availability of menu item 3 j. Type of food in mind 10 d. Completeness of food combinations 4 k. Promotion
(discounts, give-aways) 11
e. Taste 5 l. Recommendation of others 12 f. Big serving size 6 m. Variety of menu choices 13 g. Affinity towards menu item (“nakasanayan”) 7 n. Other (Specify)
14
2. I have here a list of factors that you may or may not consider important in choosing a
particular meal item from an entire selection of menu items. Please rate each factor according to a 5-point importance scale where a rating of “5” means that the factor is ONE OF THE MOST IMPORTANT to you and “1” means that the factor is ONE OF THE LEAST IMPORTANT to you. How important is [MENTION FACTOR] to you in choosing a particular meal item from a menu selection? [PLEASE ROTATE CARDS BEFORE HANDING RATING BOARD TO RESPONDENT.] Meron po ako ditong listahan ng mga bagay na maaaring importante or hindi sa pagpili ninyo ng pagkaing o-order-in mula sa karamihan ng mga pwedeng piliin sa menu. Paki-graduhan po ninyo ang bawat isa sa pamamagitan ng 5-point scale na kung saan ang gradong “5” ay nangangahulugang ito ay ISA SA PINAKA-IMPORTANTE sa inyo at ang grading “1” ay ISA SA HINDI IMPORTANTE. Gaano po ka-importante ang [MENTION FACTOR] sa pagpili ninyo ng pagkaing o-order-in sa menu?
Very important Not important at all
Factor (5) (4) (3) (2) (1) a. Affordably priced 5 4 3 2 1 b. Ease of ordering 5 4 3 2 1 c. Availability of menu item 5 4 3 2 1 d. Completeness of food
combinations 5 4 3 2 1
e. Taste 5 4 3 2 1 f. Big serving size 5 4 3 2 1 g. Affinity towards menu item
(“nakasanayan”) 5 4 3 2 1
h. Trial of new product offering 5 4 3 2 1 i. Attractiveness of visual ads 5 4 3 2 1

Very important Not important at all
Factor (5) (4) (3) (2) (1) j. Type of food in mind 5 4 3 2 1 k. Promotion (discounts, give-aways) 5 4 3 2 1
l. Recommendation of others 5 4 3 2 1 m. Variety of menu choices 5 4 3 2 1
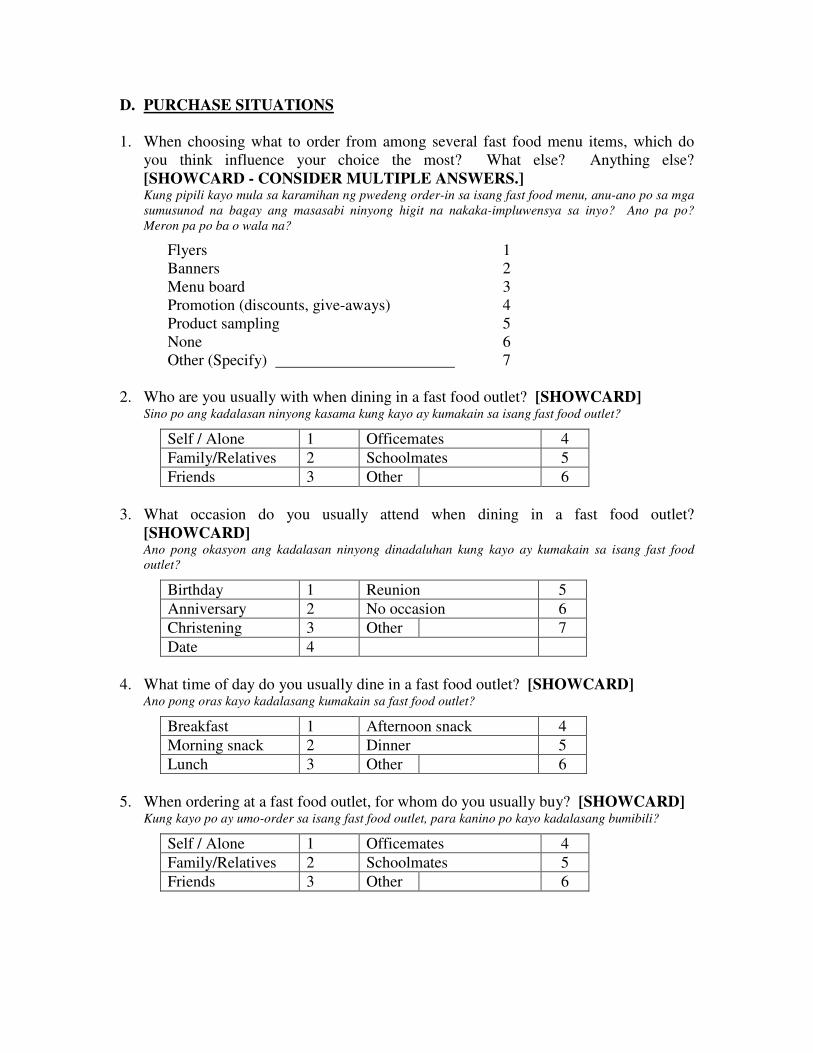
D. PURCHASE SITUATIONS 1. When choosing what to order from among several fast food menu items, which do
you think influence your choice the most? What else? Anything else? [SHOWCARD - CONSIDER MULTIPLE ANSWERS.] Kung pipili kayo mula sa karamihan ng pwedeng order-in sa isang fast food menu, anu-ano po sa mga sumusunod na bagay ang masasabi ninyong higit na nakaka-impluwensya sa inyo? Ano pa po? Meron pa po ba o wala na?
Flyers 1 Banners 2 Menu board 3 Promotion (discounts, give-aways) 4 Product sampling 5 None 6 Other (Specify) 7
2. Who are you usually with when dining in a fast food outlet? [SHOWCARD] Sino po ang kadalasan ninyong kasama kung kayo ay kumakain sa isang fast food outlet?
Self / Alone 1 Officemates 4 Family/Relatives 2 Schoolmates 5 Friends 3 Other 6
3. What occasion do you usually attend when dining in a fast food outlet?
[SHOWCARD] Ano pong okasyon ang kadalasan ninyong dinadaluhan kung kayo ay kumakain sa isang fast food outlet?
Birthday 1 Reunion 5 Anniversary 2 No occasion 6 Christening 3 Other 7 Date 4
4. What time of day do you usually dine in a fast food outlet? [SHOWCARD]
Ano pong oras kayo kadalasang kumakain sa fast food outlet?
Breakfast 1 Afternoon snack 4 Morning snack 2 Dinner 5 Lunch 3 Other 6
5. When ordering at a fast food outlet, for whom do you usually buy? [SHOWCARD]
Kung kayo po ay umo-order sa isang fast food outlet, para kanino po kayo kadalasang bumibili?
Self / Alone 1 Officemates 4 Family/Relatives 2 Schoolmates 5 Friends 3 Other 6

E. PSYCHOGRAPHIC PROFILE I have here a list of statements that may or may not describe you. Please indicate your agreement or disagreement to the following statements using a 5-point scale where “5” means that you definitely agree and “1” means that you definitely disagree to how each statement describes you. [PLEASE ROTATE CARDS BEFORE HANDING RATING BOARD TO RESPONDENT.]
Meron po ako ditong ilang mga pangungusap na maaaring naglalarawan sa inyo o hindi. Sabihin po ninyo kung gaano kayo sumasang-ayon o hindi sa mga sumusunod na pangungusap sa pamamagitan ng 5-point scale na kung saan ang gradong “5” ay nangangahulugang talagang sumasang-ayon kayo at ang gradong “1” ay talagang hindi kayo sumasang-ayon sa paglalarawan sa inyo ng bawat pangungusap.
Agree a lot Disagree a lot
Statement (5) (4) (3) (2) (1) 1. When I see a new brand on the shelf, I often buy it just
to see what it's like. 5 4 3 2 1
2. It’s worth paying extra for quality goods. 5 4 3 2 1 3. I would rather spend my free time at home than go out. 5 4 3 2 1 4. I am concerned about health but tend not to do much
about it. 5 4 3 2 1
5. I am particular about what I eat. 5 4 3 2 1 6. I often buy take-out meals to eat at home. 5 4 3 2 1 7. I really enjoy cooking. 5 4 3 2 1 8. I shop around a lot to take advantage of specials or
bargains. 5 4 3 2 1
9. I try to eat healthier food these days. 5 4 3 2 1 10. I like attending social occasions like weddings,
birthdays, parties, etc. 5 4 3 2 1
11. I like dining out. 5 4 3 2 1 12. I like spending my free time in malls. 5 4 3 2 1 13. I like to try out new food products. 5 4 3 2 1 14. I do volunteer work in my community or in school. 5 4 3 2 1 15. I enjoy surfing the internet. 5 4 3 2 1 16. I enjoy watching TV and home videos. 5 4 3 2 1 17. I follow the latest trends and fashions. 5 4 3 2 1 18. I like going to the movies. 5 4 3 2 1 19. I would like to spend my vacation traveling to far and
different places. 5 4 3 2 1
20. I like reading a lot. 5 4 3 2 1 21. I enjoy engaging in sports activities. 5 4 3 2 1 22. I like playing games online. 5 4 3 2 1 23. I enjoy being in the company of friends and/or family. 5 4 3 2 1

F. DEMOGRAPHICS
SOCIO-ECONOMIC CLASS CIVIL STATUS FACILITIES FOUND IN THE HOMEAB 1 Single 1 Running water 1Upper C 2 Widow / Widower 2 Electricity 2Broad C 3 Married 3 Radio 3D 4 Separated / Divorced 4 TV 4E 5 Annulled 5 Black & White 5
Common Law / Live-in 6 Color 6w/ Cable 7
EDUCATIONAL ATTAINMENT VHS/VCD/LASER/DVD 8(SHOWCARD) HH R LAST AMOUNT PAID FOR ELECTRICITY Stereo 9No formal education 1 1 P ___________________ Piano/Organ 10Some elem 2 2 P 300 & below 1 Oven Toaster 11Completed elem 3 3 P 301 - 500 2 Coffee Maker 12Some HS 4 4 P 501 - 1,000 3 Turbo Broiler 13Completed HS 5 5 P 1,001 - 1,500 4 Range with Oven 14Some vocational 6 6 P 1,501 - 2,000 5 Microwave Oven 15Completed vocational 7 7 P 2,001 - 5,000 6 Refrigerator 16Some college 8 8 P 5,001 - 10,000 7 Washing Machine 17Completed college 9 9 P 10,001 - 15,000 8 Air Conditioner 18Post graduate 10 10 P 15,001 - 25,000 9 Water Heater (installed) 19Don't know/Refused 99 99 P 25,001 and up 10 Water Purifier 20
Don't Know / Refused 99 Not Installed 21Installed 22
OCCUPATION OF HOUSEHOLD HEAD HOME OWNERSHIP Automobile 23Own house 1 Telephone 24Renting 2 Cellphone 25Neither own nor rent 3 Computer 26
With Internet 27OCCUPATION OF RESPONDENT Without Internet 28
MONTHLY HOME RENTAL (if renting) MONTHLY HOUSEHOLD INCOMEP ___________________ (SHOWCARD)
P 2,000 and below 1 P 8,000 and below 1WORKING STATUS OF RESPONDENT P 2,001 - 5,000 2 P 8,001 - 15,000 2
Working 1 P 5,001 - 20,000 3 P 15,001 - 100,000 3Non-working 2 P 20,001 and up 4 P 100,001 & up 4Student 3 Don't Know / Refused 99 Don't Know / Refused 99
NOTE TO INTERVIEWER:
Do not fill out.
Name of Respondent (optional) Contact nos.
END OF INTERVIEW. THANK RESPONDENT and GIVE TOKEN.

APPENDIX E
RESULTS OF QUESTIONNAIRE PRE-TESTING Based on the pre-testing of questionnaire conducted on July 30, 2005 in Maxims MH Del Pilar branch (outside the mall outlet), the following amendments were applied so as to make the research instrument more reliable and accurate in measuring the variables: 1. Respondents gave more than one answer to the factor they consider important in choosing a particular meal (C1). To allow multiple answers there was a note to the questionnaire that says “consider multiple answers.” That was also the reason why follow up questions of "What else" and "Anything else" was inserted. 2. Respondents identified a combination of answer to the question about physical surrounding as an influence to what they order (D1). Again multiple answers was considered. If they say that they order out of habit/experience, then that means that none of the collaterals or promos (or what the researcher collectively term as "physical surroundings") influence them in any way. Then the additional choice "None" was inserted. 3. In the Screening portion, the researcher incorporated the 17 MMla areas in the questionnaire so it won’t be hard for the interviewer to flip through an additional page. 4. In the tagalong translation of the question pertaining to meal preference ( B1-B4 ) the word “bumisita” was replaced with “kumain” to clarify the English thought of the sentence. 5. Respondents gave two additional factors considered in meal choice. This was incorporated in question C1 & C2 (convenience and variety to choices). 6. For question pertaining to purchase situation, the researcher added choice of companion to question D1 and D5 identified as “officemates” 7. The Psychographic statements were cut down from 35 to 23 as this was the tolerable number that the respondents were willing to answer.