Entrepreneur & Family-Owned Businesses Newsletter - April 2012

The Journal of Entrepreneurial Finance The Journal of Entrepreneurial Finance
Volume 12 Issue 3 Summer 2008 Article 6
12-2008
A Study of Entrepreneur and Small Businesses' Required Returns A Study of Entrepreneur and Small Businesses' Required Returns
and Empirical Observation of Actual Entrepreneurial Returns and Empirical Observation of Actual Entrepreneurial Returns
Attained Attained
Charles John Conrick, IV Dickinson State University
Follow this and additional works at: https://digitalcommons.pepperdine.edu/jef
Recommended Citation Recommended Citation Conrick, IV, Charles John (2008) "A Study of Entrepreneur and Small Businesses' Required Returns and Empirical Observation of Actual Entrepreneurial Returns Attained," Journal of Entrepreneurial Finance and Business Ventures: Vol. 12: Iss. 3, pp. 93-114. Available at: https://digitalcommons.pepperdine.edu/jef/vol12/iss3/6
This Article is brought to you for free and open access by the Graziadio School of Business and Management at Pepperdine Digital Commons. It has been accepted for inclusion in The Journal of Entrepreneurial Finance by an authorized editor of Pepperdine Digital Commons. For more information, please contact [email protected], [email protected], [email protected].
A Study of Entrepreneur and Small Businesses’ Required Returns and Empirical Observation of Actual
Entrepreneurial Returns Attained
Dr. Charles John Conrick, IV Dickinson State University
The purpose of this study was to examine previous Uterature on Entrepreneurs’ and small businesses’ (hereinafter simply, Entrepreneurs) required rates of return coupled with empirical observation of small business returns. It is hoped that this study provides Entrepreneurs with a guideline of what they should expect to earn in the marketplace given the risk they take coupled with an analysis of what actually has happened. Previous returns were compiled from the Institute of Business Appraisers (IBA) database of small business sales from the years 1982 to 2000. Additionally, publicly traded, large company earnings and returns were gathered for the same time frame from Standard and Poor’s (S&P) Compustat database. Both sets of data are large samples, approximately 11,000 from IBA and 19,000 from S&P. Thus, it is assumed that statistical power of sampling error is minimized and returns reflect approximate reality.
A review of current literature indicates that only seminal work has been done on required, rational, rates of return for Entrepreneurs. Much work has been done on large, pubhcly traded stocks. The purpose of this paper is to explore previous work and attempt to provide more evidence on Entrepreneurs’ required and actual returns.
I. Purpose of the Study and Theoretical BasisThe purpose of the study was to examine the returns that Entrepreneurs and small
business persons (hereinafter synonymous) would rationally require given the risks taken in
* Dr. Charles Conrick is an Assistant Professor of Business and Finance at Dickinson State University in Dickinson, North Dakota. He is a Certified Public Accountant, a Chartered Financial Analyst, and a Certified Financial Planner. His research interests include Entrepreneurial and small business risk-retum assessment having prepared numerous small business valuations professionally prior to embarking on a career in academia. Dr Conrick has previously published results o f research work in Business Valuation Review and presented findings at the annual meeting o f the Financial Management Association and the Academy of Entrepreneurial
Finance.

their enterprises. Secondly, in Part Two, actual returns accomplished by Entrepreneurs are presented. In order to accomplish this, the approach is that Entrepreneurs have a choice between entering into their own business or alternatively, investing in the universe of financial instruments available to achieve a required rate of return given their propensity to take risk and to make rational decisions. These are two critical constructs. A review of existing literature on Entrepreneurial decision making indicates that much of the Entrepreneur’s decision to “go on his/her own” is predicated on behavioral finance motives. These include 1. Risk Tolerance, 2. Other Pecuniary Benefits and Costs, 3. Nonpecuniary Benefits, 4. Preference for Skewness, and 5. Overoptimism and Misperceived Risk (Moskowitz and Vissing-Jorgensen, 2002). If an assumption is made that any or all of these behavioral motives play a large part in the decision to begin or continue Entrepreneurial activities, it is possible that rational investment decision making is not paramount. Certainly, psychic income is worth something, perhaps much, taken individual by individual. In addition, one Entrepreneur may be perfectly satisfied with an X rate of return whereas another requires X + X" given the same or greater level of risk. Quantification of behavioral issues, not the topic of this study, is an area of great research potential.
Estimating the Required Return for EntrepreneursPerhaps one of the most interesting studies done to date is the work of Kerins, Smith,
and Smith (2004). In this study, “Opportunity Cost of Capital for Venture Capital Investors and Entrepreneurs”, the authors make the lucid argument that “Risk tolerance cannot justify an investment that is expected to provide total benefits that are less than the expected pecuniary return of an equally risky investment in the market.” In short, an Entrepreneur considering an enterprise with an expected return similar to the Standard and Poors’ (S&P) 500 Index (a surrogate for market return) would have to balance the assessment with the purported risk of the venture.
The arithmetic average of the S&P 500 (market) over the period 1928 to 2006 is approximately 11.77%, the geometric average is 9.86%, and the standard deviation is approximately 19.79%. The logic from Kerins, Smith, and Smith would correctly convey that an Entrepreneur must rationally contemplate the rate of return and risk from past and expected market returns prior to his/her decision to assume risks that may offer returns insufficient to compensate for that risk. Carrying this logic further, the surrogate return for the “risk-free” rate, US Treasury Bills over the same time frame has been approximately 3.9% with a standard deviation of 3.07%. Treasury Bills are generally considered risk free due to their short maturity and lack of default risk. For simplicity’s sake, Kerins, Smith, and Smith use rounded numbers of market returns of 10% with a standard deviation of 20% and a risk free rate of 4% to construct an interesting model to evaluate required returns for an Entrepreneur given risk and lack of diversification, especially considering that the Entrepreneur, in many cases, has 100% or only slightly less of his/her equity holdings invested in the business. Investment counselors decry lack of diversification as perhaps the single biggest risk in asset allocation stemming from a study done by Ibbotson and Sinquefeld (1982). This study is recognized as one of the most authoritative on the reasons for diversification indicating that most of the explanation for returns on a portfolio is the result of asset allocation as opposed to individual stock picks.
Virtually all Finance or Investment textbooks state that any investment is exposed to two types of risk, systematic (non-diversifiable) and unsystematic (diversiflable). A well
94 A Study of Entrepreneur and Small Businesses" Required Returns. .. {Conrick)

diversified investor virtually eliminates unsystematic risk leaving only the systematic or market risk which cannot be diversified av^ay from. Thus, the argument from Kerins, Smith, and Smith is perfectly logical in light of modem financial theory. That is, the Entrepreneur must attempt to price unsystematic (diversifiable) risk when making a full or partial commitment to an Entrepreneurial venture. This argument stems from the heretofore mentioned research which forms the underlying premise of modem financial theory and the basis of the Capital Asset Pricing Model (CAPM).
Kerins, Smith, and Smith use the CAPM as a method of attempting to discover the “cosf ’ of the unsystematic risk in the case of the Entrepreneur making either a full or partial commitment to a venture. An example from the Kerins, Smith, and Smith paper is replicated here to clarify the actual findings presented later in this paper.
The single factor CAPM model can be expressed as r. =rj. + -r^ ) where;
n = Required retum on an investment. rf= The Risk free rate.Vm = The market retum.PMkt^ The investment’s Beta with the market.p Mia can be expressed as the [pim cJt]/ (Jm where:pirn = the correlation between the market and the investment in a venture.Gi= the standard deviation of the investment in an Entrepreneurial venture. cFm = the standard deviation of the market, taken in its entirety.
13 CJiRearranging terms; — provides an estimate of total risk of a venture.
p im Om
Specifically, the standard deviation of the investment’s returns divided by the standard deviation of the market factors out the correlation between the investment and the market providing a “Total” Beta which would, by implication, include both systematic and
unsystematic risk (Damodaran, 2002). — is a relative standard deviation measure whichOm
includes all the risk taken in the venture including that not correlated with the market. The Total Beta, in theory, including systematic and unsystematic risk can be characterized as
- P j ^ Thus, if an Entrepreneurial venture’s expected standard deviation of returns wasP im
estimated at 25% with 20% correlation with market returns, an estimate of expected retum
would be- 4% + — (l0% -4% ) = 11.5% using the Total Beta approach. Assuming the •20 , , .
Entrepreneur was well diversified, a small investment in an Entrepreneurial venture could, mtheory, have a required retum of which with the aforesaid numbers would
equate to: 4% + .25(10% - 4%) = 5.5%.
n ^ ^ 25 in this example whereas Total Beta = 1.25.(7 20%
The Journal o f Entrepreneurial Finance & Business Ventures, Vol. 12, Iss. 3 95

96 A Study of Entrepreneur and Small Businesses' Required Returns. .. (Conrick)
If it is assumed that a venture had a PMkt of 1.25 and an assumed pim of 20%, the Total1 25
Beta would be computed as: — . Solving fox Pm Yields Ptoi= 6.25. The required return of0.20
the venture under these assumptions would be 4%+ 6.25(10%-4%) = 41.5%. Thus, the relationship between Total Beta is clearly dependent on the observed Pmu and the estimates of Pim and cTj. A venture with a Total Beta of 6.25 that is assumed to have di pim of 100% would
have to have an assumed cr, of = cr. =125%.1.00 .20
As pointed out by Kerins, Smith, and Smith, the Entrepreneur is not well diversified if he/she provides a full commitment to the venture and must consider this “underdiversification” in their portfolio decision. Kerins, Smith, and Smith argue that using market data, as shown above, underestimates opportunity cost and therefore utilize a certainty equivalent CAPM model in an attempt to estimate the cost to the Entrepreneur for the lack of diversification. This article will not explain all the rationale employed by Kerins, Smith, and Smith and the interested reader should access their article for the complete derivation of the model. However, it is sufficient to observe that the Entrepreneur using the Total Beta approach may well infer that his/her required return on a venture given the sample data would be 11.5% assuming a fiill commitment to the venture. As noted above, this estimate of a required return would require an estimate of Pmt of .25 and Pfot = 1-25. This assumption, according to Kerins, Smith, and Smith fails to adequately account for the Entrepreneur’s under-diversification.
In valuation theory, unsystematic or company specific risk is often estimated as a premium added to the CAPM model cited above. In the above example, an analyst may begin with the risk free rate, add the market equity risk premium, a factor for small company systematic risk, and finally add a factor for company specific risk based on comparables, a factor method, or a rule of thumb applicable to a particular industry. Thus, given the numbers cited above, the required return for a well diversified investor into a venture with a market Beta of 1.25 may be calculated as -r^ ) + e = 4% + 1.25(10% - 4%) + e, where e
is a factor estimated as the company specific risk component. If e is estimated to be 10%, by whatever method used, the required return used to discount future income or cash flows would be 11.5% + 10% = 21.5%. Unfortunately, this method appears prone to subjectivity and may well not capture the true risk component or the risk of under-diversification.
Kerins, Smith, and Smith’s model approaches the problem through a unique approach by treating investment in the market as a zero NPV opportunity. The effect of underdiversification in the model is subsequently assigned to the investment in an Entrepreneurial venture. Certainly, an argument can be made that investment in the market is not a zero NPV opportunity. However, by making this assumption, Kerins, Smith, and Smith are able to construct a model using modem financial theory, certainty equivalents, measures of variance, and weightings which are intuitively elegant and attempt to mathematically capture the cost of “true” under-diversification to an Entrepreneur.
For example, using the numbers fi*om above, Kerins, Smith, and Smith’s model computes the present value of an Entrepreneurial venture as:

The Journal o f Entrepreneurial Finance & Business Ventures. Vol. 12. Iss. ,? 97
C F y-D T / _ p v , mr y ^ y --------------------
Where:PVev= Present Value of the Entrepreneur’s venture.CFy - Risk free Cash flow of a venture at expiry.rv= Computed Beta comparable required return on the venture.pv,m = Correlation between venture and market.Vf - the risk free rate.
Given a $1.00 investment into the venture now, the computed Present Value of the Entrepreneur’s venture at t = I is:
-« .6 3 9 .1 + .04
This implies that the return for a full commitment by the Entrepreneur would be
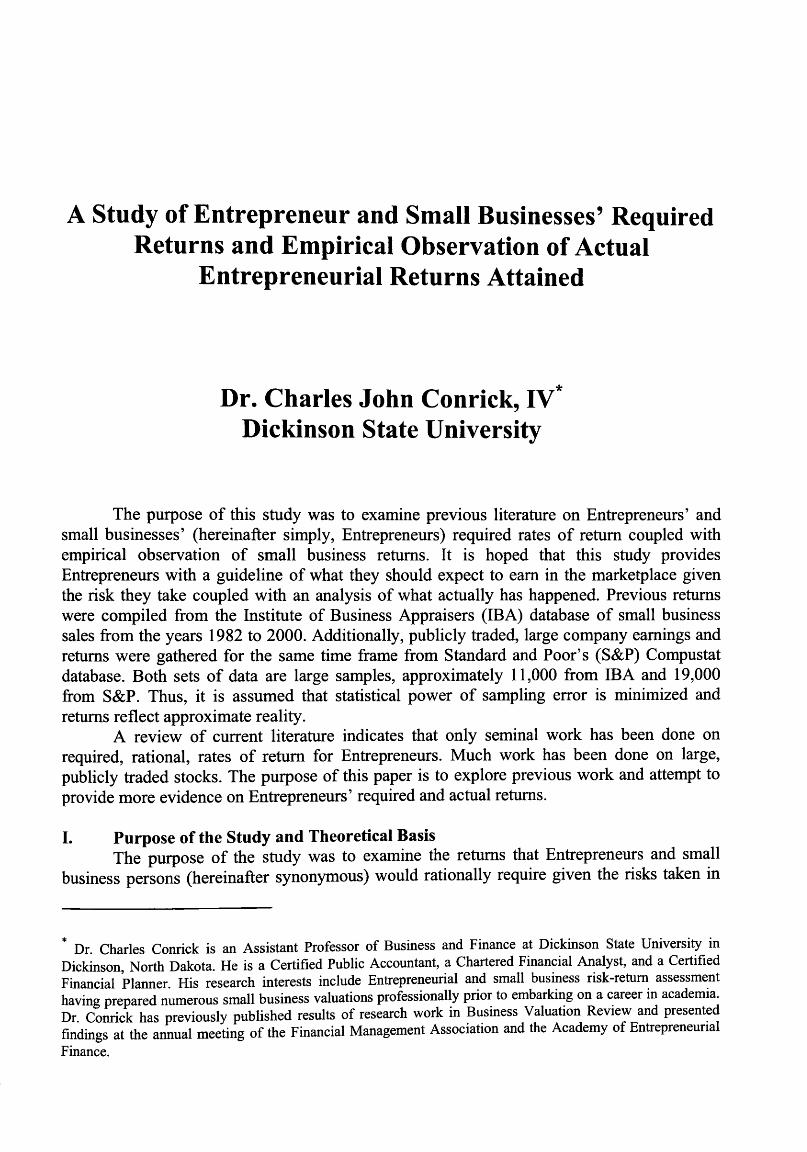
~ .564 or 56.4% as opposed to the 11.5% contemplated by the Total Beta approach.639presented earlier. An argument can be made that the Total Beta approach accounts for total risk due to its focus on the contrast of the standard deviation of a venture’s retums being divided by the standard deviations of the market. In theory, both systematic and unsystematic risk are accounted for with the Total Beta approach eliminating the need to compensate for Company Specific risk denoted as the premium, e, earlier. The main thrust of the points made by Kerins, Smith, and Smith appear to relate to risk attributable to under-diversification and not necessarily or only to Company Specific risk. The model can be utilized to value full and partial commitments to an Entrepreneurial venture. Table I illustrates the theoretical opportunity cost given a percentage weight invested in an Entrepreneurial venture and its correlation with the risk of the market as measured by the standard deviation.
For example, an Entrepreneur placing 40% in a Venture, 60% (100% - 40%) in the market, assuming the Venture is 20% correlated with the market, and fiirther assuming a comparable firm Beta of 1.25 would encounter an approximate opportunity cost of 44.5% on the Entrepreneurial venture as indicated by the percentage in the framed box. Thus, the Entrepreneur in the case above would invest 60% in the market with a 10% expected retum and 40% in the venture and should expect to discount future cash flows at approximately 44.5%. With a partial commitment, the weightings are actually complicated by the computed present value of the Entrepreneurial Venture. In this example, the NPV of the market commitment is .60 with an expected retum of .06 for a total of .66. The expected retum of the venture is .40 times 1.115 equals .446. Making the assumption that the market is a zero NPV

98 A Study o f Entrepreneur and Small Businesses * Required Returns. .. (Conrick)
opportunity, the present value of the portfolio is = .909. The NPV of the Venture is .909
309- .60 = .309 which is -^ ^ « 3 4 % o f the Entrepreneur’s present value wealth. Thus, to be
precise, 66% of wealth would be invested in the market and 34% would be invested in the venture with the expectation that 44.5% would need to be the return on the venture due to under-diversification. By implication, this premium for under-diversification should also apply to an investor purchasing only one publicly traded stock as he/she would not be well diversified either. For example, an investment in only one large, publicly traded firm, such as IBM would be subject to systematic and unsystematic risk attributable solely to IBM. Therefore, Kerins, Smith, and Smith’s model appears to be a lucid method of capturing the opportunity cost of both systematic and unsystematic risk for any venture using the market as the benchmark for adequate diversification or elimination of unsystematic, company specific risk. ^
It is interesting to note in Table I that the estimated opportunity cost given 100% correlation with the market is calculated to be 41.5% regardless of the weight placed in the venture. This is analogous to the earlier described Total Beta approach where an investment with an observed ^Mkt of 1.25 and a pim of 0.20 was found to require a 41.5% retum. Essentially, this is due to the use of the market as a zero NPV opportunity where unaccounted for variance in an Entrepreneurial venture is accounted for by assigning it to the venture while leaving the market (systematic) variance constant. If the pim = 100%, the di must equal 125% and ^Mkt = 6.25. Thus, the expected retum of the venture using the model would be 4% + 6.25(10% - 4%) = 41.5% regardless of the weights placed in the venture and the market.
The work done by Kerins, Smith, and Smith provides a unique and intuitively logical way of addressing Entrepreneurial required returns given either full or partial commitments.
Sliwoski (1999) provides other evidence to assess required rates of retum for Entrepreneurs. Sliwoski quotes the empirical observations of James Schilt (1991).Schilt studied small business risk premiums and categorized the risks into specific descriptions of business types. These risk premiums were based on an analysis of published data as available from Stocks, Bonds, Bills, and Inflation (SBBI) along with Schilt’s own experience and observations as an analyst of closely held businesses. The risk premiums are shown in Table II.
Schilt concludes, after fiirther study of these discount rates, that they still appear to have validity as discount rates added to the risk free rate. Thus, the risk premiums include the equity risk premium, industry risk, and the company specific risk. Unlike the model discussed by Kerins, Smith, and Smith, Schilt’s observations are empirically based and do not purport to address the notion of the under-diversification many Entrepreneurs are subject to.
Robert Slee (2004), in an original and cutting edge text entitled Private Capital Markets, states his belief that private equity markets are relatively inefficient as contrasted to public equity markets due primarily to lack of opacity. Slee states “the capital asset pricing model or other predictive models are not suitable for use in creating the expected rates of retum in the private markets.” This is an issue that is open to debate as the public capital
The calculations in Table I were made by this author and assume a correct interpretation of Kerins, Smith, and Smith’s model. Errors, if any, are those o f the author o f this article.

markets do serve as, at least, a foundation for perceived private equity returns. However, Slee’s work is innovative and logical in that he portends to view the nuances of private equity returns in an entirely new light. Slee presents a theory of a “private capital line” which primarily consists of the expected returns of capital providers in the private markets. These returns are replicated from Slee’s book in Table III.
It is important to note that these rates are also empirically based in that they represent actually observed required rates of return of these capital providers. Arguably, equity financing returns can be inferred to begin with the Equity Mezzanine Capital classification which implies required private equity returns in a range from about 30% to as high as about 53%.
AssumptionsGiven the aforesaid discussion, the following assumptions appear to meet a rational
and valid set of conclusions:
1. An Entrepreneur must eam the Vf, the risk free rate which is assumed to be approximately 4% as stated earlier.
2. An Entrepreneur, in order to meet or exceed a rational investor’s requirement to eam at least, the return which accounts for systematic risk, must eam a retum which meets or exceeds the retum on a surrogate for a well diversified market. In this study, the surrogate for the market retum, rm, is assumed to be about 10% which is the approximate geometric retum of the S&P 500 since 1928. Thus, the equity risk premium is estimated to be 10% - 4% = 6%.
3. An Entrepreneur must consider the excess risk (volatility) that has been empirically been shown to be indigenous to small companies. This is often calculated by observing the historical retums on S&P 500 small cap stocks which have historically retumed approximately 2.3% more than S&P 500 large cap stocks.^
4. An Entrepreneur must consider the excess risk associated with exposure to unsystematic or company-specific (diversifiable) risk based on his/her level of commitment to an Entrepreneurial venture. The excess retum required for unsystematic risk is arguably, the vaguest measure due to lack of market data coupled with the fact that every venture generates its own specific risks. The Total Beta approach can be used to estimate a particular firm’s exposure to unsystematic risk and would vary from one entity to another dependent onindustry type or class.
5. An Entrepreneur must consider, again based on his/her level of commitment to a venture, a required retum for under-diversification. If an Entrepreneur is primarily invested in a single Entrepreneurial venture, unsystematic risk and under-diversification must be considered. The model proposed by Kerins, Smith, Smith provides a method of estimating under-diversification. The computations gleaned from Table I indicate that the required premium for under-diversification is significant.
The Journal o f Entrepreneurial Finance & Business Ventures, VoL 12. Iss. 3 99
Source: Ibbotson & Associates. Stocks, Bonds, Bills, and Inflation.

It is doubtful that most Entrepreneurs truly consider these five conclusions when making a decision to invest in an Entrepreneurial venture. A valid argument can also be made that, if totally considered, few Entrepreneurs would choose to invest capital, human or pecuniary, in a venture if they believed they had to discount future cash flows at rates of return in a range of 40% and greater. Conversely, the survival rate of new ventures is alarmingly low. Dunne, Roberts, and Samuelson (1988) found that 61.5% of firms exited the manufacturing industry within five years of a census and that 79.6% exited within ten years. According to the U.S. Small Business Administration, approximately 33% of new employer firms exit within two years of inception and about 56% exit within four years.^ In short, the odds of long term success for a startup Entrepreneur are low. This provides further argument for assessment of risk in the Entrepreneur’s venture decision.
However, as reported by the Small Business Administration (SBA), there are 25.8 million small businesses in the U.S. Further, small businesses generate 60 to 80% of net new jobs annually, employ 50.6% of the private sector workforce, represent 97% of all the exporters of goods, and represent 99.7% of all employer firms. It is obvious that Entrepreneurs comprise a major force in the U.S. and global economy regardless of how risk and return is accounted for or estimated.
It would seem logical to assume that Entrepreneurs are aware that upon entering any new venture, they would encounter competitive forces. A corollary to that assumption would be that the rational Entrepreneur would want to earn at least as much or more than competitors in similar industries. For example, an Entrepreneur starting a small construction company or restaurant should presume that he/she can earn a rate of return on his/her investment, human or pecuniary, equivalent to his/her competition. Assuming that a fair rate of return for construction companies is about 25% of Sales, the new entrant would undoubtedly attempt to recover that rate, or more, in order to substantiate his/her decision to provide the effort required to start and subsequently continue in the venture. This poses a theoretical problem and a critical issue in this analysis. If the market dictates the return, which it arguably does, it is further quite possible and even probable that the Entrepreneur has not truly considered his/her required rate of return as discussed in the five previous assumptions. Ironically, neither can he/her! The particular private market encountered forces the Entrepreneur to conform to market returns in that particular market or exit assuming no Entrepreneur can continue to make abnormal profits for an extended time period. Therefore, it is quite possible that competitive forces determining a particular private market return may preclude an Entrepreneur from earning returns congruent with the five assumptions of economic and financial reality listed above. Moskowitz and Vissing-Jorgensen (2002) state that “Overall, the diversified portfolio of public equity seems to offer a far more attractive risk-retum trade-off than that obtained by the typical entrepreneur.” They also conclude that “The implication is that private equity returns appear low given their risk.”
This conclusion is inconsistent with the earlier presumption of Kerins, Smith, and Smith that “Risk tolerance cannot justify an investment that is expected to provide total benefits that are less than the expected pecuniary return of an equally risky investment in the market.” Nevertheless, both positions appear to be true both empirically and rationally.
100 A Study o f Entrepreneur and Small Businesses^ Required Returns. .. {Conrick)
Source: http://www.score.org/small biz stats.html. June, 2007.

Entrepreneurs do not seem to be adequately rewarded for the risks assumed and can be adjudicated to be economically irrational if they do so. Obviously, either there are behavioral or psychic rewards not factored into this analysis which is quite possible, even probable, or Entrepreneur returns are higher than heretofore contemplated. Part Two of this paper presents evidence of actual Entrepreneurial returns to explore the latter. Further research on behavioral asset pricing will be required to address the former.
II. Presentation of Actual Entrepreneurial ReturnsThe data was obtained from two databases on CD-ROM’s in Microsoft Excel format.
The first is the Standard & Poor’s (S&P) Compustat database, which keeps extensive records on publicly traded stocks in all organized markets dating back to 1963. This data is gathered by S&P for purposes needed by consulting firms, market research firms, governmental use, and academic study. The Compustat database includes data on approximately 10,000 to 15,000 firms depending on the years studied. The data obtained from S&P consists of a random sample of 1,000 publicly traded firms’ financial data covering the time period of 1982 to 2000. The data consists of year-end stock price, sales, net income, earnings before interest and taxes (EBIT), P/E ratio, P/G ratio, P/EBIT ratio, SIC code, and year of data. Thus, this sample resulted in 1,000 firms times 19 years of data for a total of 19,000 data points.
The second database comes fi*om a private, nationally known organization that compiles data on small closely held business sale transactions. This database has been compiled by the Institute of Business Appraisers (IBA) in Plantation, Florida and consists of approximately 18,000 records of small business sales transactions since 1978. The data in the IBA database consists of SIC code, annual sales, annual net earnings as defined by IBA, owner’s compensation, P/E ratio, P/G ratio, sales price, geographic location, and year of sale. The data fi*om the IBA will be used as a surrogate for investment in a small. Entrepreneurial venture.
The Compustat data set represents a large sample of the population of all publicly traded stocks in the US. The IBA database is a large sample of the population of small business sale transactions since 1978 across about 600 SIC codes.
Assumptions and LimitationsThe random sample of 1,000 publicly traded firms’ prices and other data may not be
totally reflective of the entire market. It is also possible that using year-end data may not result in the average price of the stocks during the course of the year. Some analysts argue that year-end selling for tax prices can “artificially” deflate year-end stock prices only to see them rebound in January. This is known as the “January effect (Bodie, Kane, & Marcus, 1998). The “January effect” is an observation and not an empirically proven fact. Therefore, the use of the year-end prices can be argued to be representative of the market s determinationof the stock’s price at that moment.
Another limitation is the use of data from 1982 through 2000 as opposed to using all data available from 1963 and from 2001 to 2006. This limitation exists as the 19 year time period may have captured an unusual time period for the publicly traded markets and may not include several business cycles or external events that occurred prior to 1982. Conversely, this long of a time frame should provide a representative “sample” of time and does capture different economic periods which provide a view of market data in good times and bad. In addition, the IBA database transaction data starts in about 1978. This pairing of data should
The Journal of Entrenreneurial Finance & Business Ventures, Vol. 12. Iss. 3 IQl

provide similar market perceptions of publicly traded shares and small business sale transactions.
There are limitations on the use of the IBA database also. While the IBA database contains about 18,000 data points, it does not include all small business transactions. Thus, while it is the largest database of its kind, it may not totally reflect the entire population of small business sales.
A more important limitation is the accuracy of the IBA database. The IBA depends on reports from business brokers, realtors, accountants, and small business owners. There is a possibility that the data reported to the IBA is not totally accurate for a number of reasons including privacy issues, transcription error, or incorrect accounting methods. For example, the net earnings reported by companies may not be in accordance with US GAAP possibly invalidating the P/E computation. In addition, in order to “smooth” the net earnings figure and avoid issues of excess owner’s compensation, the IBA requests that net earnings be reported as net earnings before tax, interest, and owner’s compensation. The IBA admits that it is occasionally difficult to obtain this precise definition of net earnings from the data reporters. In order to account for the IBA definition of earnings, the P/EBIT ratio of the Compustat data was used as the measure of price to earnings to more accurately draw conclusions between the price to earnings figures of small versus large companies.
The research is based on the assumption that both databases are accurately assembled and represent the two populations from which they are derived. The extent to which the findings can be generalized to the populations of market data are based on these assumptions and limitations.
ProceduresThe data from both sources were uploaded into SPSS, a statistical analysis software
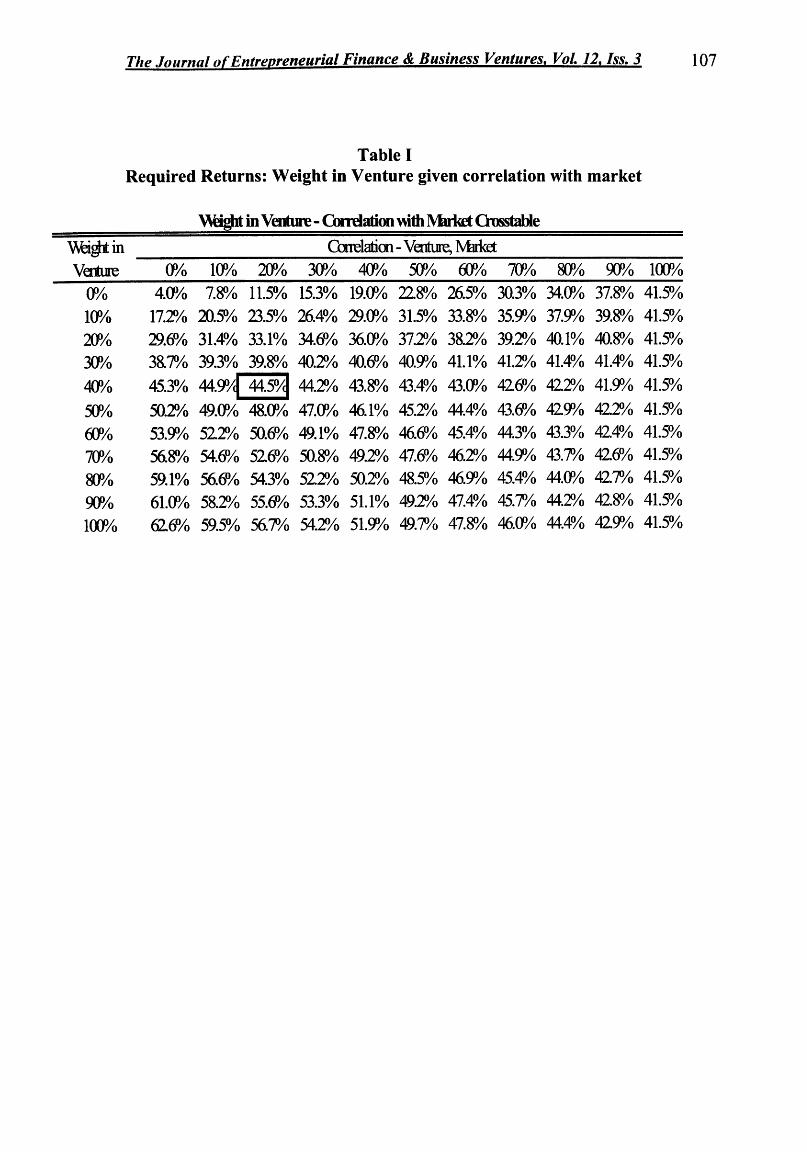
program for examination. Cases missing data were eliminated from fiirther study. Variables of interest were calculated as the EBIT/Price and EBIT/Sales and are hereinafter called Large E_P, Large E_S, Small E_P, and Small E_S where E_P equals EBIT/Price and E_S equals EBIT/Sales. “Large” indicates the publicly traded firms from the S&P 500 database, and “Small” denotes the private, closely held firms from the IBA database. Table IV shows summary statistics for all data:
Outliers were examined by observing both sets of data for observations that fell within the inter-quartile range. Data points outside the inter-quartile range were considered outliers and were eliminated (cleaned) from ftirther consideration. After data cleaning, the cases remaining numbered:
CasesDescription Sample Included Population % Included
102 A Study o f Entrepreneur and Small Businesses* Required Returns. .. {Conrick)
Large E_P N 16,386 19,000 86.2%
Large E_S N 16,317 19,000 85.9%
Small E_P N 10,201 11,562 88.2%
Small E_S N 10,567 11,562 91.4%

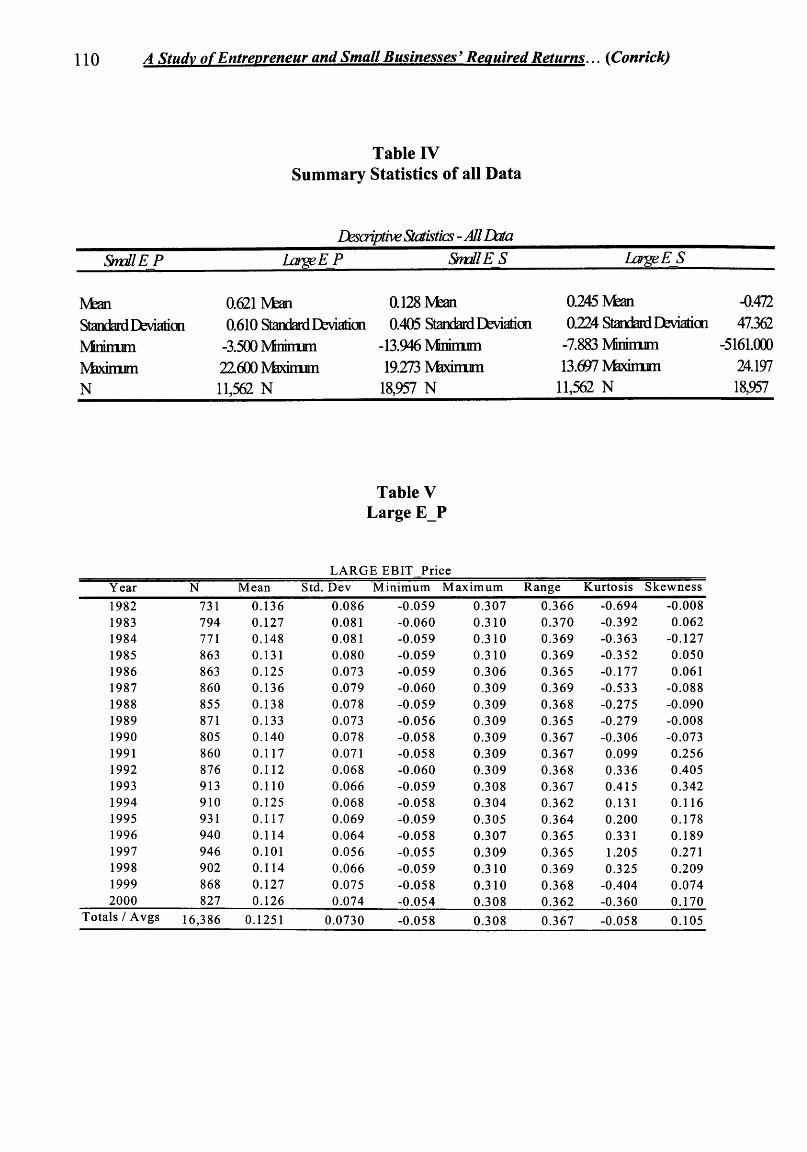
Data Processing and AnalysisTables V through VIII represent the initial exploration of the cleaned data sorted by
Large E_P and E_S contrasted to Small E_P and E_S.The observations indicate that Large E_P averaged 12.5% over the 18 year period
while Small E_P averaged 49.9%. This implies that the approximate pricing multiples for the
Large companies examined sold at an average Price to EBIT of - ^ « 8 0and Small.125
companies sold at an average Price to EBIT of « 2.00. It can further be construed that.499
investors were thus discounting future core operating earnings at an average of about 12.5% for Large firms and about 49.9% for Small firms. These figures appear to imply that the required rates of return, at least on a relative basis, reflect investors’ recognition of higher risk with Small firms along with a required return for lack of diversification as alluded to earlier in the study by Kerins, Smith, and Smith. The return on Sales measured by EBIT to Sales averaged 9.48% for Large firms and 22.6% for Small firms. Thus, pricing multiple averaged
-----« 4.00 while earnings on Sales multiples averaged « 2.39 indicating a
fairly wide disparity between perceived returns on Sales and actual sale prices “traded”. If the Large and Small classes were viewed by the investors as being of equivalent risk (measured using both systematic and unsystematic risk), it could be expected that the higher returns on Sales of the Small firms, 22.6% contrasted to the 9.48% average for Large firms would adequately compensate investors for excess risk involved in investing in a Small venture. In this sample, investors paid an average of $ 8.00 for each $ 1.00 of Large firm operating earnings and $ 2.00 for each $1.00 of Small firm operating earnings. Based only on relative performance on Sales, investors should have paid a multiple of (2.00 * 2.39)« 4.78 for Large firms in lieu of the 8.0 actually observed or the multiple of Small E_S should have been f 10 54^
—— w 4.41 instead of the 2.39 actually observed. Clearly, the investors in both markets . 2.39 j
perceived some other factors in the pricing decision.A linear regression analysis, shown in Table IX, using average Large E_P as the
independent variable and Small E_P as the dependent variable was significant and, holding the intercept at zero, indicated a Beta of 3.926 with a correlation of .9788.The actual correlation of the two data sets was found by drawing a random sample of 1,000 data points from each cleaned set of observations. The descriptive statistics found using a large sample of all the data are shown in Table X:
The summary statistics of the large sample of data indicate that the averages used in Tables V through VIII are representative of the data. The actual correlation between both variable sets is approximately zero. If the average Large E_P and Small E_P regression is used as a surrogate for a proposed Beta for Large predicting Small or , an inference can
be drawn that the required return for an Entrepreneurial Venture could be estimated using the CAPM model. Thus, R^y = r^+ Ps\l - ' '/ ) + Intercept which given the data above would
equate to an overall expected required retum of 4% + 3.926(12.5% - 4% )+12.5%,„,,,,^ , « 49% for a generalized estimate of a required retum
in a small. Entrepreneurial venture. The Intercept is added back to the regression due to the
The Journal o f Entrepreneurial Finance & Business Ventures, Vol. 12. Iss. .? 1Q3

forcing of the intercept at the origin. In effect, the estimated market return equates to being the intercept and only the variability about the origin is being measured by the correlation in the regression. This point estimate of about 49% is very close to the actual Capital Access Points presented by Slee in Table III required by Angel Investors and Factoring Firms of 40% to 50% which, at least intuitively, seems rational. In addition, assuming a low correlation with the market, Kerins, Smith, and Smith’s model in Table I estimates a range of 38.7% to 50.2% required return for investment in an Entrepreneurial venture with weights invested in the venture of 30% and 50% respectively. This return included the premium for under- diversification. Schilt’s method, in Table II, indicated that empirical observations of venture required returns ranged from a low of about 10% to a high of 34%. These rates however, did not include consideration of under-diversification and seem to match up well with the returns actually observed by Small E_S of 22.67% reported in Table VIII.
A final consideration would be the proposed weights to be placed in each of the three considered investment sets, the risk free rate, the market, or the Entrepreneurial venture. This would be a function of the expected returns, standard deviations, and covariance of the returns. Table XI assumes the means and standard deviations as presented for Large E_P and Small E_P with the observed correlation of .004. The minimum variance and optimal portfolio are presented of the two risky assets along with computations of a Capital Allocation Line for an investor assumed to be a mean-variance optimizer desiring a 20% rate of return overall.
The minimum variance portfolio calls for only a 6.36% weight into the venture while an optimal portfolio using the data presented would require placing 27.17% into the Entrepreneurial Venture and 72.83% into the market. Assuming a portfolio 20% required return for an individual investor, 14.38% would be invested at the risk fi*ee rate, 23.26% would be placed into the Entrepreneurial venture and 62.36% would be invested in the market. Clearly, given the data, limitations, and assumptions presented, greater than about a 30% weight placed in an Entrepreneurial venture would be suboptimal.
III. Summary, Conclusions, and ImplicationsThe intent of this analysis was to derive a generalized required return for an
Entrepreneurial venture utilizing the existing literature, empirical observations, and analysis of actual transactions of market and small business data. The mean size of the IBA small business determined by market price is $ 2,530,000. Thus, the analysis examines micro companies contrasted to large, S&P 500 firms which comprise the surrogate for the market return. It follows that the return profiles should range from the risk fi*ee rate through the retum on a large, well organized market, up to a theoretical maximum required by small Entrepreneurs. These returns were found to approximate:
Rf « 4% Rj « 12.5% R^y « 49%
These findings are restricted by the assumptions and limitations in the study coupled with the use of EBIT as the metric for returns generated by the Entrepreneur. Further, these returns would vary from venture to venture given the risk profiles of each venture’s cash flows. The weight of the Entrepreneur’s wealth placed in the venture would also cause the required retum to vary. In short, the findings are broad and not intended as a “cookbook” recipe for all Entrepreneurial ventures.
However, it is assumed that the typical Entrepreneur probably does not consider the five assumptions listed at the end of Part One and almost certainly do not consider the effects
104 A Study of Entrepreneur and Small Businesses* Required Returns. .. {Conrick)

of under-diversification caused by a heavily weighted commitment to an Entrepreneurial venture. The data presented in this study imply that buyers (and sellers) of Entrepreneurial ventures discount future earnings as measured by EBIT by about 49% or at a Price/EBIT (P/EBIT) multiple of about 2. The market’s future earnings are discounted at about 12.5% or a P/EBIT multiple of 8. The generator of earnings, return on Sales is about 9.5% for Large firms and 22.7% for Small. Clearly, the earnings of Large, better diversified portfolios are more highly valued by buyers than earnings of Small, undiversified ventures. However, those same earnings on Sales are the generator of the returns to the Entrepreneur and with a high degree of probability more accurately reflect returns earned by Entrepreneurs than the Sales prices of the small businesses. The inference is that an Entrepreneur considering investment in a venture would tend to expect returns in a range of 20% to 30% as observed by Schilt in Table IL The model presented by Kerins, Smith, and Smith as well as the findings of this study imply that Entrepreneurial returns would need to be in the 40% to 50% range to provide return mean-variance optimization. Based on the findings of this study and those of Kerins, Smith, and Smith, and assuming a generalized required return range for an undiversified, small Entrepreneur of about 45% to 49%, it is possible to solve for an Entrepreneurial “Beta” range of about 42% ^ 49% « 4% + J3 y (10% - 4%) « p^y « 6.3 ^ 7 . 5
The conclusion must be that, viewed solely from a pecuniary perspective. Entrepreneurs do not earn sufficient returns given the risk they take. The position taken by Moskowitz and Vissing-Jorgensen, quoted at the end of Part One of this paper appears to be accurate. Additionally, there are undoubtedly “psychic returns” unmeasured in this study, that accrue to the Entrepreneur which are consciously or subconsciously factored into the decision to enter into an Entrepreneurial venture. This area of Behavioral Finance needs to be researched further to contemplate factors that compensate Entrepreneurs. Slee (2004) puts it well stating “A private business is relative to the value world in which it is viewed”.
For example, consider an Entrepreneur with $ 100,000 to invest in a venture where he/she expects to earn returns of 20%, a standard deviation of 40% and 0% correlation with the market. Will he/she truly contemplate that an optimal portfolio decision, given market returns of 10% and standard deviation of 20%, would consist of placing 40% of the funds into the Entrepreneurial venture and 60% in a market portfolio which would generate an expected return of 14% with a standard deviation of 20%? In reaUty, this type of asset partitioning may not be possible but is it considered? Many, perhaps most. Entrepreneurs would invest the full $ 100,000 into the venture “counting” on making the 20% or greater. Additionally, a great deal of human capital, unaccounted for, would be invested thereby lowering total returns. Conversely, how is psychic income measured implying a greater overall Total return than that which can be measured using any methodology examined heretofore? It is notable that buyers of small Entrepreneurial ventures evidently discounted future cash flows at a mean of 49% to purchase firms that were earning an average of 22% on Sales.
This study raises as many or more questions than it answers. The data indicate that Entrepreneurs, viewed from a purely financial perspective, earn less than required given the risks involved in their ventures. Many are under-diversified. Are they uninformed or irrational? Is psychic income rationally worth more than financial return? What are the behavioral issues? How can they be measured? Shefrin (2007) discusses concepts and measures of Representativeness and Over-optimism. These and many other issues need to be addressed prior to drawing further conclusions.
The Journal o f Entrenreneurial Finance & Business Ventures. Vol. 12. Iss. 3 105

106 A Study of Entrepreneur and Small Businesses* Required Returns. .. (Conrick)
R e f e r e n c e s
Bodie, Z., Kane, A., & Marcus, A. J. (1998). Essentials o f Investments. (3rd ed.). Boston, Massachusetts: Irwin McGraw-Hill.
Damodaran, A. (2002). Investment Valuation: Tools and Techniques for Determining the Value of Any Asset. (2nded.). New York, New York: John Wiley and Sons, Inc.
Dunne, T., Roberts, M.J., & Samuelson, L. (1988). Patterns of Firm Entry and Exit in U.S. Manufacturing Industries. RAND Journal o f Economics, 92,{A) 495-515.
Kerins, F., Smith, J.K., & Smith, R. (2004). Opportunity Cost of Capital for Venture Capital Investors and Entrepreneurs. Journal o f Financial and Quantitative Analysis, 39(2), 385-405.
Moskowitz, T., & Vissing-Jorgensen, A. (2002). IRS valuation methods lag behind business practice. American Economic Review, 92, 745-747.
Schilt, J. H. (1991). Selection of capitalization rates-revisited. Business Valuation Review, 51- 52.
Shefrin, H. (2007), Behavioral Corporate Finance: Decisions that Create Value. New York, New York: McGraw-Hill/Irwin.
Ibbotson, R., & Sinquefeld, R. (1982). Stocks, Bonds, Bills and Inflation: The Past and the Future, 1982 Edition. Charlottesville, Virginia: Financial Research Analyst's Foundation.
Slee, R. (2004). Private Capital Markets. Valuation, Capitalization, and Transfer o f Private Business Interests. (1st ed.). Hoboken, New Jersey: John Wiley and Sons, Inc.
Sliwoski, L. (1999). Case studies: small and mid-size closely held business appraisals. Institute of Business Appraisers Course 1013. Appendix A., A-4.
The Journal o f Entrepreneurial Finance & Business Ventures, Vol. 12, Iss. 3 107
Table IRequired Returns: Weight in Venture given correlation with market
________________ \\yg|ht in Vaiture-Corrdation with Market Orosstable_________________
______________________Correlation - Venture, Nfettet_____________________Venture 0% 10% 20% 30% 40% 50% 60% 70% 80P/o 90% 100%
0% 4.0% 7.8% 11.5% 15.3% 19.0% 228% 26.5% 30.3% 34.0% 37.8% 41.5%
10% 17.2% 20.5% 23.5% 26.4% 29.0% 31.5% 33.8% 35.9% 37.9% 39.8% 41.5%
20% 29.0/0 31.4% 33.1% 34.^/o 36.0% 37.2% 38.2% 39.2% 40.1% 40.8% 41.5%
30% 3&7% 39.3% 39.8% 40.2% 40.6% 40.9% 41.1% 41.2% 41.4% 41.4% 41.5%
44.5"/(| 44.2% 43.8% 43.4% 43.0% 426% 422% 41.9% 41.5%40P/o 45.3% 44.9%
50% 50.2% 49.0% 48.0% 47.0% 46.1% 45.2% 44.4% 43.6% 429% 422% 41.5%
60% 53.9% 52Z>/o 50.e>/o 49.1% 47.8% 46m 45.4% 44.3% 43.3% 424% 41.5>/o
70% 56l8% 54.0>/o 520>/o 50.8% 49.2% 47.6% 462% 44.9% 43.7% 420% 41.5>/o
80% 59.1% 56.0>/o 54.3% 522% 502% 4&5% 46.9% 45.4% 44.0% 427% 41.5%
90% 61.0% 5&2% 55.6% 53.3% 51.1% 49.2% 47.4% 45.7% 442% 428% 41.5%
100% 626% 59.5% 56.7% 54.2% 51.9% 49.7% 47.8% 4&0% 44.4% 429% 41.5%

108 A Study of Entrepreneur and Small Businesses' Required Returns. .. {Conrick)
Table II Schilt’s Risk Premia
Category Description Risk Assumed DiscountPremium Risk Rate
FreeRate
Established businesses with a strong trade 6 -1 0 % 4% 10-14%position, are well financed, have depth in management, whose past earnings have been stable and whose future is highly predictable.
Estabhshed businesses in a more competitive 11 - 15% 4% 15 - 19%industry that are well financed, have depth of management, have stable past earnings and whose future is fairly predictable.
Businesses in a highly competitive industry 16-20% 4% 20-24%that require little capital to enter, no management depth, element of risk is high, although past record may be good.
Small businesses that depend on the special 21-25% 4% 25-29%skill of one or two people. Larger established businesses that are highly cyclical in nature.Future eamings may be expected to deviate widely fi*om projections.
Small “one man” businesses of a personal 26-30% 4% 30-34%services nature, where the transferability of the income stream is in question.

The Journal o f Entrepreneurial Finance & Business Ventures, Vol. 12, Iss. 3 109
Table IIIPrivate Capital Returns as Presented by Slee (2004)
Capital Access Point
Description Expected Expected Expected Return with Return with Return with Prime at 7% Prime at 8%* Prime at 9%*
IRB
504
B&I
ABLl
7(a)
Bank Leasing
C^tive Leasing
CAP Line
BankC/L
ABL2
EWCP
Specialty Leasing
ABL3
Venture Leasing
DMC
EMC
PEG
Factoring L
V/C
Angel
Factoring M
Factoring S
Industrial Revenue Bonds
SBA 504 Loan
Business & Industry Loan
Tier 1 Asset Based Loan
SBA 7(a) Loan
Bank Equipment Leasing
CaptiveA endor Equipment Leasing
SBA CAPline Credit Line
Bank Credit line
Tier 2 Asset Based Loan
SBA Export Working Coital Program
Specialty Equipment Leasing
Tier 3 Asset Based Loan
Venture Capital Leasing
Debt Mezzanine Capital
Equity Mezzanine Capital
Private Equity Group
Large-Volume Factoring
Venture Capital
Angel Investing
Medium-Volume Factoring
Small-Volume Factoring
5.3%
7.3%
8.3%
8.9%
9.4%
10.0%
10.0%
10.2%
10.3%
11.4%
13.3%
14.0%
16.3%
16.5%
22.4%
29.2%
30.0%
34.0%
35.0%
40.0%
45.0%
51.0%
6.3%
8.3%
9.3%
9.9%
10.4%
11.0%
11.0%
11.2%
11.3%
12.4%
14.3%
15.0%
17.3%
17.5%
23.4%
30.2%
31.0%
35.0%
36.0%
41.0%
46.0%
52.0%
7.3%
9.3%
10.3%
10.9%
11.4%
12.0%
12.0%
12.2%
12.3%
13.4%
15.3%
16.0%
18.3%
18.5%
24.4%
31.2%
32.0%
36.0%
37.0%
42.0%
47.0%
53.0%
* Prime rate at various notional amounts. Slee reports 7% only, the 8% and 9% Prime rates are inferred.
110 A Study of Entrepreneur and Small Businesses^ Required Returns... (Conrick)
Table IV Summary Statistics of all Data
Descriptive Statistics - All Data
SntdlEP Lar^EJ* Small E S Large E ^
MeanStandard Eteviatioti Mniniim IVfexmim N
0.621 Nfean0.610 Standard Deviation
-3.500 Mnmim 22600 IVfodmim11,562 N
0.128 Mean0.405 Standard Deviation
-13.946 Mininnm 19.273 Nfednum
18,957 N
0.245 IVtan -0.4720.224 Standard Deviation 47.362
-7.883 Minunm -5161.00013.697 Nfcdnun 24197
11,562 N 18,957
Table V Large E_P
LARGE EBIT Price
Year N Mean Std. D ev Minimum M axim u m Range Kurtosis Skewness
1982 731 0.136 0.086 -0.059 0 .307 0 .366 -0.694 -0.008
1983 794 0.127 0.081 -0 .060 0 .310 0 .370 -0.392 0.062
1984 771 0.148 0.081 -0 .059 0 .310 0 .369 -0.363 -0.127
1985 863 0.131 0.080 -0 .059 0 .310 0 .369 -0.352 0.050
1986 863 0.125 0.073 -0 .059 0 .306 0.365 -0.177 0.061
1987 860 0.136 0.079 -0 .060 0 .309 0 .369 -0.533 -0.088
1988 855 0.138 0.078 -0 .059 0 .309 0.368 -0.275 -0.0901989 871 0.133 0.073 -0 .056 0 .309 0.365 -0.279 -0.0081990 805 0.140 0.078 -0 .058 0 .309 0 .367 -0.306 -0.073
1991 860 0.117 0.071 -0 .058 0 .309 0.367 0.099 0.2561992 876 0.112 0.068 -0 .060 0 .309 0.368 0.336 0.4051993 913 0.110 0.066 -0 .059 0 .308 0 .367 0.415 0.3421994 910 0.125 0.068 -0 .058 0 .304 0.362 0.131 0.1161995 931 0.117 0.069 -0 .059 0.305 0.364 0.200 0.1781996 940 0.114 0.064 -0 .058 0 .307 0.365 0.331 0.1891997 946 0.101 0.056 -0.055 0 .309 0.365 1.205 0.2711998 902 0.114 0.066 -0 .059 0 .310 0.369 0.325 0.2091999 868 0.127 0.075 -0 .058 0 .310 0.368 -0.404 0.0742000 827 0.126 0.074 -0 .054 0 .308 0.362 -0 .360 0.170
Totals / Avgs 16,386 0.1251 0 .0730 -0 .058 0 .308 0.367 -0.058 0.105
The Journal o f Entrenreneurial Finance & Business Ventures, Vol. 12, Iss. 3 HI
Table VI Small E P
SM A LL EBIT PriceYear
T98T1983
1984
1985
1986
1987
1988
1989
1990
1991
1992
19931994
19951996
1997
1998
1999
2000
N
55
129
262
306
231
206
232
761
933
674
750
1,252
791
855737
867
722
235
203
Mean Std. D ev Min imum Maximum Range Kurtosis Skewness
0.340
0.439
0.425
0.441
0.480
0.468
0.4560.499
0.502
0.525
0.559
0.533
0 .592
0 .597
0.589
0.5660.541
0.476
0.466
0.285
0.352
0.313
0.309
0.261
0.272
0.232
0.252
0.256
0.267
0.267
0.269
0.290
0.279
0.284
0.2830.2630.272
0.280
0.002-0.068
-0.144
-0.158
-0.175
-0.006
-0.039
- 0.010-0.073
- 0.200-0.154
- 0.200- 0.200- 0.200- 0.210
-0 .204
-0 .0670.004
0.002
1.091
1.2001.227
1.240
1.165
1.224
1.160
1.255
1.250
1.2501.250
1.259
1.250
1.2571.250
1.2581.250
1.2001.255
1.089
1.268
1.372
1.398
1.340
1.230
1.199
1.265
1.323
1.450
1.404
1.459
1.450
1.4571.460
1.462
1.317
1.196
1.253
-0.182
-1.095
-0 .539
-0.501
- 0.020-0.132
0.236-0 .016
0.080
-0.261-0.254
-0.245
-0.512
-0.476-0.515
-0.373
-0.117-0.160
0.314
0.880
0.302
0.334
0.343
0.490
0.530
0.4830.511
0.560
0.331
0.3130.370
0.145
0.1590.185
0.3150.411
0.438
0.618
T o t a l s / A v g s 10,201 0.4997 0.2782 - 0.111 1.226 1.336 -0.251 0.406
Table VII Large E_S
LARGE EBIT Sales
Year N Mean Std. Dev Minimum Maximum Range Kurtosis Skewness
1982 868 0.093 0.072 -0.089 0.270 0.359 -0.252 0.244
1983 861 0.097 0.073 -0.090 0.270 0.360 -0.322 0.169
1984 861 0.099 0.071 -0.088 0.269 0.356 -0.184 0.189
1985 862 0.093 0.073 -0.087 0.269 0.357 -0.313 0.282
1986 837 0.092 0.073 -0.087 0.267 0.354 -0.150 0.360
1987 849 0.093 0.071 -0.087 0.269 0.356 -0.127 0.440
1988 868 0.097 0.072 -0.088 0.269 0.358 -0.190 0.331
1989 871 0.098 0.070 -0.087 0.270 0.357 -0.190 0.399
1990 880 0.093 0.073 -0.087 0.268 0.355 -0.261 0.387
1991 878 0.087 0.072 -0.088 0.269 0.358 0.003 0.507
1992 863 0.088 0.070 -0.088 0.269 0.356 0.056 0.516
1993 855 0.091 0.068 -0.090 0.265 0.355 0.088 0.459
1994 861 0.095 0.067 -0.077 0.269 0.346 0.047 0.505
1995 866 0.098 0.069 -0.083 0.269 0.352 -0.250 0.368
1996 862 0.100 0.068 -0.082 0.269 0.352 -0.127 0.412
1997 853 0.103 0.068 -0.079 0.270 0.349 -0.094 0.350
1998 835 0.098 0.068 -0.087 0.270 0.357 0.058 0.331
1999 847 0.095 0.068 -0.086 0.270 0.356 -0.158 0.222
2000 840 0.093 0.071 -0.090 0.265 0.355 -0.264 0.275
Totals / A vgs 16,317 0.0948 0.0705 -0.086 0.269 0.355 -0.139 0.355

112 A Study o f Entrepreneur and Small Businesses' Required Returns. .. (Conrick)
Table VIII Small £ S
SMALL EBIT Sales
Year
1982
1983
1984
1985
1986
1987
1988
1989
1990
1991
1992
1993
1994
1995
1996
1997
1998
1999
2000
N
121258
314
222214
227
785
958
704
782
1,311
856
907
773
879
754
231
216
Mean Std. D e v Minimum Maximum Range Kurtosis Skewness
0.186
0.217
0.2020.209
0.260
0.233
0.249
0.226
0.2200.225
0.225
0.221
0.241
0.237
0.255
0.241
0.248
0.197
0.214
0.184
0.187
0.164
0.156
0.150
0 .150
0 .142
0.136
0.132
0.137
0.135
0.131
0.136
0.130
0.138
0.130
0.132
0.125
0.140
-0.077
-0.035
-0.150
-0.119
-0.008
-0.005
- 0.011-0.014
- 0.022-0.127
-0.087
-0.150
-0.129
-0.044
-0.137
-0.048
-0.083
0.0010.001
0.593
0.593
0.600
0.600
0.600
0.589
0.600
0.597
0.600
0.600
0.600
0.600
0.600
0.600
0.593
0.600
0.600
0.568
0.600
0.669
0.629
0.750
0.719
0.608
0.595
0.611
0.610
0.622
0.727
0.687
0.750
0.729
0.644
0.730
0.648
0.683
0.567
0.599
-0.740
-1.057
-0.463
-0.528
-0.750
-0.748
-0.635
-0.386
-0.072
-0.199
-0.140
-0.047
-0.478
-0.176
-0.417
-0.125
-0.387
0.146
- 0.122
0.768
0.494
0.508
0.520
0.303
0.462
0.422
0.593
0.680
0.525
0.628
0.551
0.304
0.545
0.336
0.496
0.415
0.726
0.728
T o t a l s / A v g s 10,567 0.2267 0.1439 -0.065 0.596 0.662 -0.386 0.527

The Journal o f Entrepreneurial Finance & Business Ventures, Vol. 12. Iss. 3 113
Table IXLinear Regression Output and Correlation of Average EBIT to Price
SLMVIARYOUIPUr
R ^^ ion StatisticsMitipleR 0.9788RSquare 0.9581A|ustedR Square 0.9025StaKkdBmor 0.1060Observations 19
ANOVA
df M* F S^ficxmceFR^iession 1 4.6222 4.6?,Z>, 411.45^ 2.37571Erl3Residual 18 0.2022 0.0112Total 19 4.8245
Co^dents Stcmdcff-dEmr tStat P-vdue Lower 95% 0 ^ 9 5 % LcMer95.0P/o Upper95.(P/oIntercept 0 m A m/A m /K miK m/K ^ ALarge E_P 3.926 0.194 20.284 7.55Erl4 3.5197 43330 3.5197 43330
Correlations(a)SmallE P
Std Cross-product
Sig. (1-tailed)
N
(a)
SmallE_PLargeEP
SmallE_P
LargeEP
SmallE_P
LargeEP
10.9788
0.0019
19
LargeEP
0.9788
10.00
19
19
Coefficients have been calculated through the origia

114 A Study o f Entrepreneur and Small Businesses" Required Returns. .. {Conrick)
Table XDescriptive Statistics of 1,000 cases of both E_P and E_S; Cleaned Data
Descriptive Statistics - Sanple o f 1, OOP Cases
Small E P Lar^eE P Small E S LargeE S
Ivfean 0.5324 Mean 0.1250 Mean 0.2553 Nfean 0.1107Standard Deviati(m 0.2765 Standard Deviaticm 0.0750 Standard Deviation 0.1705 Standard Deviation 0.3009Mnirniim -0.1570 Minimum -0.0590 IVBnimum -0.0630 Mnimum -70470
/feximum 1.2590 ]Vfeximum 0.3100 IVfeximum 1.0000 IVfaxinium 0.9810N 1,000 N 1,000 N 1,000 N 1,000
Correlations - Sanple of1,000 CasesSmall E P Large E P Small E ^ Large E ^
Small E_P 1 SmaUE_P 1Large E_P 0.004 1 TargeE P -0.001 1N 1,000 N 1,000
Table XIMinimum Variance, Optimal Portfolio, and Capital Allocation Weights
Mean Variance Allocations
Exp Return Std Deviation Correlation Risk Free -> Investor Req Ret
Weight Risk Free Weight Small Weight Large Exp Return Std Dev
Small49.97%
27.82%
0.0040
4.00%
20.00% Minimum Variance
0.00%
6.36%
93.64%
14.89%
7.07%
Large12.51%
7.30%
Both14.89%
20.16%
Optimal Portfolio CAL Allocations 0.00% 14.38%
27.17% 23.26%
72.83% 62.36%22.69% 20.00%
9.26% 7.93%