A STUDY OF CRACK CLOSURE IN FATIGUE - ntrs.nasa.gov · NASA CONTRACTOR REPORT NASA CR-2319 CO A...
88
NASA CONTRACTOR REPORT NASA CR-2319 CO A STUDY OF CRACK CLOSURE IN FATIGUE by T. T. Shih and R. P. Wei Prepared by LEHIGH UNIVERSITY Bethlehem, Pa. for Langley Research Center NATIONAL AERONAUTICS AND SPACE ADMINISTRATION • WASHINGTON, D. C. • OCTOBER 1973 https://ntrs.nasa.gov/search.jsp?R=19730024067 2018-06-23T09:35:20+00:00Z
Transcript of A STUDY OF CRACK CLOSURE IN FATIGUE - ntrs.nasa.gov · NASA CONTRACTOR REPORT NASA CR-2319 CO A...

N A S A C O N T R A C T O R
R E P O R T
N A S A C R - 2 3 1 9
CO
A STUDY OFCRACK CLOSURE IN FATIGUE
by T. T. Shih and R. P. Wei
Prepared by
LEHIGH UNIVERSITY
Bethlehem, Pa.
for Langley Research Center
NATIONAL A E R O N A U T I C S AND SPACE ADMINISTRATION • WASHINGTON, D. C. • OCTOBER 1973
https://ntrs.nasa.gov/search.jsp?R=19730024067 2018-06-23T09:35:20+00:00Z

1. Report No.
NASA CR-2319
2. Government Accession No.
4. Title and Subtitle
A STUDY OF CRACK CLOSURE IN FATIGUE•f •" ;••'if- *.'..,.
' •' -' !~3.' •,,-•;;;•. , ,,.,.-,
7. Author(s)
T. T. Shih, and R. P. Wei
9. Performing Organization Name and Address
Department of Mechanical EngineLehigh UniversityBethlehem, PA
Bring and Mechanics
12. Sponsoring Agency Name and Address
National Aeronautics and Space AdministrationWashington, D.C. 20546
3. Recipient's Catalog No.
5. Report Date
October 19736. Performing Organization Code
8. Performing Organization Report No.
IFSM-72-25
10. Work Unit No.
501-22-02-01
11. Contract or Grant No.
NGL-39-007-040
13. Type of Report and Period Covered
Contractor Report
14. Sponsoring Agency Code
15. Supplementary Notes
This is a final report.
16. Abstract
Crack closure phenomenon in fatigue was studied by using a Ti-6Al-4V titanium alloy. The
occurrence of crack closure was directly measured by an electrical-potential method, and indirectly
by load-strain measurement. The experimental results showed that the onset of crack closure
depends on both the stress ratio, R, and the maximum stress intensity factor, K . No crack
closure was observed for stress ratio, R, greater than 0.3 in this alloy.
A two-dimensional elastic model was used to explain the behavior of the recorded load-strain
curves. Closure force was estimated by using this model. Yield level stress was found near the
crack tip. Based on this estimated closure force, the crack opening displacement was calculated.
This result showed that onset of crack closure detected by electrical-potential measurement and
crack-opening-displacement measurement is the same.
The implications of crack closure on fatigue crack are considered. The experimental results
show that crack closure cannot fully account for the effect of stress ratio, R, on crack growth,
and that it cannot be regarded as the sole cause for delay.
17. Key Words (Suggested by Author(s))
Fatigue crack growthCrack closureTi-6Al-4V titanium alloy
18. Distribution Statement
Unclassified - unlimited
19. Security Qassif. (of this report)
Unclassified
20. Security Classif. (of this page)
Unclassified
21. No. of
85
22. Price*pomestic, $3-75Foreign, $6.35
For sale by the National Technical Information Service, Springfield, Virginia 22151
TABLE OF CONTENTS
List of Tables ivList of Figures - v
Summary 1
List of Symbols 2
I. INTRODUCTION 4II. MATERIAL AND EXPERIMENTAL WORK 8
A. Material and Specimen 8B. Crack Monitoring System 9C. Environment Control System 11D. Experimental Work 11
1. Electrical Potential Measurements 122. Strain Measurements 13
III. RESULTS AND DISCUSSION 14A. Electrical Potential Measurements 14B. Strain Measurements 16C. The Effects of Stress Ratio and Kmax on Crack Closure 18D. Discussion 19
IV. MODELING FOR CRACK CLOSURE 21A. Analytical Model 21B. Behavior of Load-Strain Curves 24
1. Strain Gage Located Ahead of the Crack Tip 242. Strain Gage Located Just Behind the Crack Tip 253. Strain Gage Located Behind the Crack Tip 26
C. Estimate of Closure Force 27D. Computation of Crack Opening Displacement 28
V. GENERAL DISCUSSION 29VI. CONCLUSIONS 32
TABLES 33FIGURES 36REFERENCES 74APPENDIX 77
iii

LIST OF TABLES
Page
TABLE I Chemical Composition and Tensile Properties 33
TABLE II Strain Gage Position 34
TABLE III Estimated Closure Stress 35
IV

LIST OF FIGURES
Figure Page
1 Schematic Illustration of Load versus Crack-OpeningDisplacement Curve 36
2 Center-Cracked Specimen 3?
3 Potential Leads on a Center-Cracked Specimen 38
4 Schematic Diagram of Electrical-Potential System forCrack Measurement 39
5 Schematic Diagram of Environmental Control System 40
6 Load versus Electrical Potential Curves (Before theCompressive Loading Cycle) 41
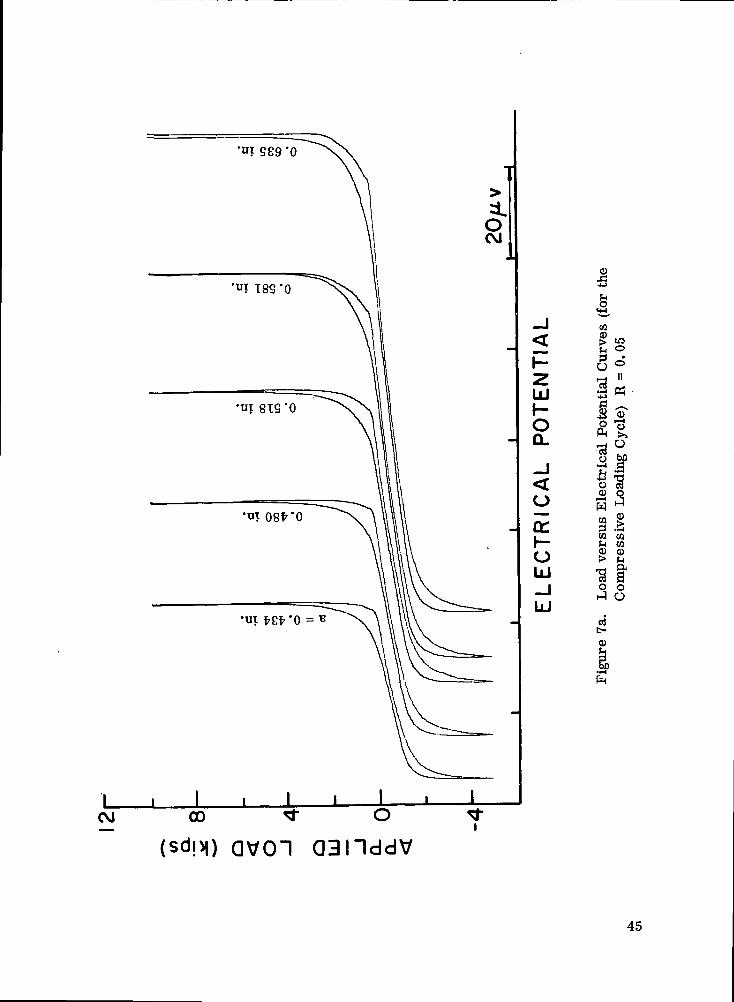
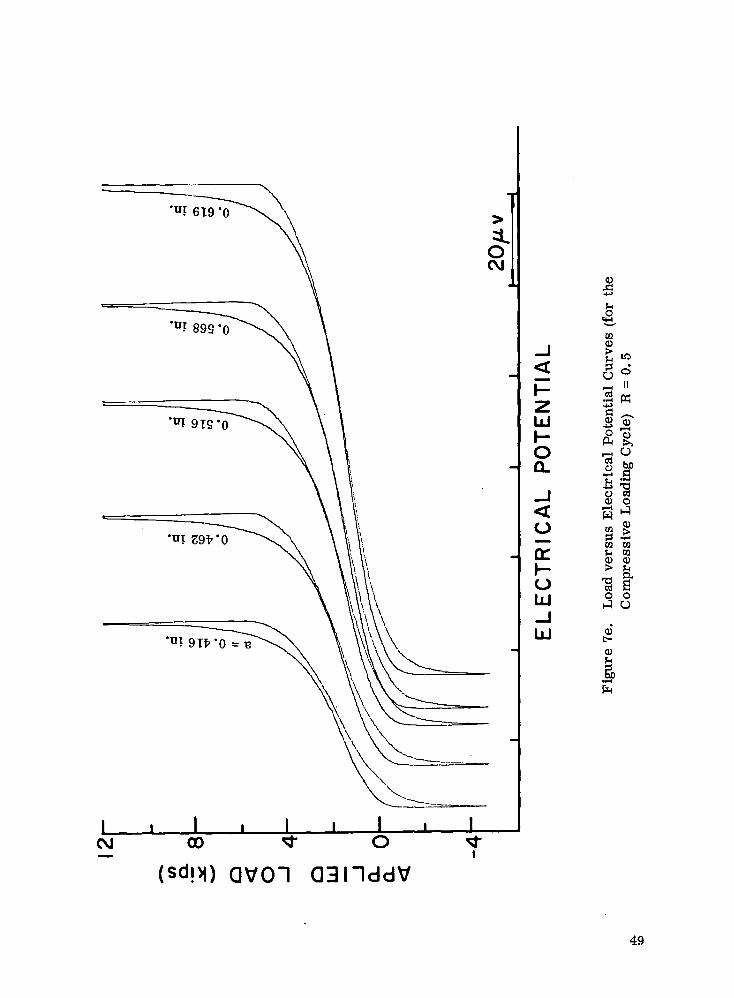
7 Load versus Electrical Potential Curves (for the CompressiveLoading Cycle) 45
8 Load versus Electrical Potential Curves (after theCompressive Loading Cycle) 50
9 Load versus Electrical Potential Curve for an IdealizedCrack in an Elastic Medium 51
10 Load versus Strain Curve for an Idealized Crack in anElastic Medium 52
11 Load versus Strain Curves 53
12 Relationship between U and Kmax f°r Different Stress Ratios 58
13 Superposition Model 60
14 Central Crack of Length 2a in an Infinite Plate with EqualPairs of Splitting Forces at x = +b 61
15 Relationships between Strains and the Position of Unit SplittingForces with Strain Gages Located Ahead of the Crack Tip(a = 0.34 in) 62
16 Relationships between Strains and the Position of UnLt SplittingForces with Strain Gage Located Behind the Crack Tip(a = 0.908 in) 63
17 Typical Load versus Strain Curve for a Strain GageLocated Ahead of the Crack Tip 64
18 Typical Load versus Strain Curve for a Strain GageLocated Just Behind the Crack Tip 65
19 Longitudinal Strain Calculatedby the SuperpositionModel and the Estimated Closure Force 66

Page
20 Comparison of Probable Closure Line with Closure LineIndicated by the Electrical Potential Measurements
21 The Difference between the Plastic Zone Size Near theSurface and in the Center
22 Relationship between Load and Relative DisplacementBetween Gage Points Computed by Using the Superposition 69Model
23 Schematic Shown of the Onset of Crack Closure Detected byThree Different Experimental Techniques
24 Schematic Diagram Illustrating Effective AK forSeveral Cases
25 Crack Growth Rate for Ti-6Al-4V Alloy 72
26 The Effect of Kmtn on Delay 73
VI

A STUDY OF CRACK CLOSURE IN FATIGUE
byT. T. Shih and R. P. Wei
LEHIGH UNIVERSITYBethlehem, Pennsylvania
SUMMARY
Crack closure phenomenon in fatigue was studied by using a TI-6A1-4V titaniumalloy. The occurrence of crack closure was directly measured by an electrical-potentialmethod, and indirectly by load-strain measurement. The experimental results showedthat the onset of crack closure depends on both the stress ratio, R, and the maximumstress intensity factor, Kmax. No crack closure was observed for stress ratio, R,greater than 0.3 in this alloy.
A two-dimensional elastic model, was used to explain the behavior of the recordedload-strain curves. Closure force was estimated by using this model. Yield levelstress was found near the crack tip. Based on this estimated closure force, the crackopening displacement was calculated. This result showed that onset of crack closuredetected by electrical-potential measurement and crack-opening-displacement measure-ment is the same.
The implications of crack closure on fatigue crack are considered. The experi-mental results show that crack closure cannot fully account for the effect of stressratio, R, on crack growth, and that it cannot be regarded as the sole cause for delay.

LIST OF SYMBOLS
a half crack lengthaclose distance between the center of the crack and the contact line
aQ initial half crack length
Aa/A,N rate of fatigue crack growth
A empirical constant
b location of crack splitting force with respect to specimen centerline
B specimen thickness
C empirical constant
E Young's Modulus
f (b) the magnitude and distribution of closure force
K stress intensity factor
Kc the critical stress intensity for failure or fracture toughness
K^n^ the maximum stress intensity factor in a loading cycleIJ-lcLX
Kmean the mean value of stress intensity factor in a loading cycleKmin the minimum stress intensity factor in a loading cycle
AK the range of stress intensity factor in a loading cycle; AK = Kmax - Kr
AKeff the effective range of stress intensity factor in a loading cycle
n empirical constant
P applied load
Pmax the maximum applied load in a loading cyclepmin the minimum applied load in a loading cycle
P the applied load above which the crack is fully open
R stress ratio; R = Smin/Smax = Kmin/Kmax
S applied (gross-section) stress; S = P/BW
Smax the maximum applied stress in a loading cycle
Sm- the minimum applied stress in a loading cycle
SQD crack opening stress above which the crack tip is fully open
AS the range of applied stress in a loading cycle; S = Smax - S
AS jf effective stress range
U effective stress or stress intensity range ratio; U =

v y direction displacementvclosure y direction displacement produced by the closure forcevremote y direction displacement produced by remote loadingvsplitting y-direction displacement produced by two pairs of unit splitting force applied
to the crack faces
V electrical potential between the potential leads
V(a) electrical potential between the potential leads
V(aQ) electrical potential between the potential leads corresponding to half-cracklength a0
W gross specimen width
Z(z), Z(z), Z(z), Z'(z) stress function and its derivatives
£ longitudinal strain
(€y)cjogure longitudinal strain produced by closure force
(£y)remote longitudinal strain produced by remote loading
(^•y)splitting longitudinal strain produced by two pairs of splitting force applied to thecrack faces
\) Poisson ratio
cr applied stress
crx longitudinal stress
cry transverse stress
erys yield strength
Txy shear stress
<j)(x,y) Airy's stress function
vf. harmonic functions; i = 1, 2, 3, 4

I. INTRODUCTION
The importance of fatigue in determining the serviceable life of engi-
neering structures has been well recognized [1], In modern high-performance
structure designed for finite service life, fatigue crack growth occurs over a
significant portion of the useful life of the structure. Information on the
kinetics of fatigue crack growth, therefore, becomes an important aspect of
material selection and design.
It has been shown that the crack tip stress intensity factor, K, defined
by linear elasticity, is the most appropriate parameter for characterizing
crack growth [2,3,4], Several empirical relationships for correlating fatigue
crack growth data have been suggested [2, 5-8]. Paris et&i [7] and Paris and
Erdogan [8] suggested that the primary variable of importance for fatigue crack
growth is the range of the crack tip stress intensity factor, AK, and that the
rate of fatigue crack growth, A a/ A N, may be described by a relationship given
by Equation 1.
A and n are empirical constants. The mean value, or the maximum value of K
(Kmean or 1^ ) hi a given load cycle was thought to have only a secondary
effect on crack growth. Forman et^l [6] recognized that the maximum value
of K, Kmax, can have a significant effect on fatigue crack growth, particularly
at maximum K levels approaching KQ (the critical stress intensity for failure).
They suggested that Equation 1 be modified so that the rate of fatigue crack

growth would approach infinity as Kmax approaches K , Equation 2.
>nAa _ A ( A K ) (2)AN l-RK,- AK
The stress ratio, R, is the ratio between the minimum and maximum K levels
in a load cycle; R = Kmm/Kmax. Reasonable correlation with fatigue crack
growth data in the range of 10~6 to 10~3 inch per cycle (2. 54 x 10~5 to 2.54 x
10 mm per cycle) has been demonstrated [9],
The implicit assumptions in both Equations 1 and 2 are (a) that only the
tensile portion of the load cycle is effective in producing fatigue crack growth,
and (b) that there is no crack closure over the tensile portion of the load cycle,
so that the full tensile range of loading is effective. In a recent series of
experiments on a 2024-T3 aluminum alloy, Elber observed that the load versus
crack-opening-displacement curves exhibited a nonlinear region at the lower
load levels, as indicated schematically in Figure 1 [10]. This behavior was
interpreted in terms of crack closure, that is, physical contact between the
fracture surfaces produced by fatigue. Elber suggested that the crack is
closed at the tip over the lower porition of the loading cycles and becomes
open only after the applied stress exceeded a level Sop (Figure 1) and that
fatigue crack growth can occur only during that portion of the loading cycle in
which the crack is fully open. Based on this suggestion, an effective stress
range, ASgg, and an effective stress range ratio, U, were defined.
smax - sop(d;"° °max -
Smax and Sm^n are the maximum and minimum values of the applied stress in

a given cycle; and Sop is the crack opening stress. U can be defined equiva-
lently in terms of the effective stress intensity range, AKeff, and /\K.
Kmax - Kop= ~ - ^7- (4)
^max ^mm
K is the crack opening stress intensity factor corresponding to SQp. Elber
further suggested that the crack growth relationship be written in the following
form:
(AKeff)n = C (UAK)n (5)
Based on a limited range of data, Elber suggested that the effective
stress range ratio, U, is a function of the stress ratio, R, and is independent
°f Smax, or ^max' For the 2024-T3 aluminum alloy sheet, U is given simply
by Equation 6, for R value ranging from -0. 1 to 0. 1.
U = 0.5 + 0.4R -O . l^R^O.7 (6)
Using this empirical result, Elber showed that Equation 5 provided a better fit
to the experimental data than either Equation 1 or Equation 2 [10]. Because
Equation 6 was based on a very limited amount of data and because much of the
data was obtained under conditions of net-section yielding, this relationship for U
should be considered only as a preliminary estimate and must be verified by
additional experimentation. Thus far, no independent verification of this result
has been reported, although some direct evidence for closure has been given by
Buck et al [11-13]. Nevertheless, Elber's concept of effective stress range has
been adopted by several authors [14,15], and the expression for U (Equation 6)
has been accepted and used without question by others [16-18].

The principal purpose of this work is: (a) to provide independent verifi-
cation of the crackclosure phenomenon; (b) to determine the effects of stress
ratio, R, and maximum stress intensity factor, Kmax, on closure; and (c) to
develop an analytical model for estimating the magnitude and distribution of
the closure forces. The experimental and analytical studies are carried out
within the framework of linear-elastic fracture mechanics. A T1-6A1-4V alloy
sheet is used in the experimental studies on closure. Crack closure is mea-
sured directly by means of an electrical potential technique, and indirectly by
measurements of strains in the neighborhood of the crack tip. The implications
of this study to the understanding of several practical problems in fatigue crack
growth are considered.
Acknowledgment is extended to Mr. J. H. FitzGerald for his invaluable
contributions to the experimental work.

II. MATERIAL AND EXPERIMENTAL WORK
A. Material and Specimen
A 0. 2-inch-thick (5. 08 mm) mill annealed Ti-6Al-4V alloy plate was used
in this investigation. The chemical composition, and longitudinal and trans-
verse tensile properties of this alloy are given in Table I.
Three-inch-wide (76.2 mm) by 16-inch-long (406 mm) center-cracked
specimens (Figure 2), oriented in the long transverse (TL) direction, were
used in the fatigue crack growth and crack closure studies. The initial center
notch, about 0.4 inch (about 10 mm) long, was introduced by electro-discharge
machining (EDM). The specimens were precracked in fatigue either at loads to be
used in the subsequent studies, or through a decreasing sequence of loads that
terminated at these loads. The precracking procedure provided fatigue cracks
about 0. 08 inch (about 2mm) in length from the ends of the starter notches cor-
responding to a half-crack length of about 0..3 inch (7. 6 mm), and ensured that
the subsequent tests will be unaffected by the starter notch geometry and by the
residual stress produced by EDM. Both precracking, and the crack growth and.
crack closure experiments were carried out in a 100,000-lb, capacity MTS
system closed-loop electrohydraulic testing machine. Load control was esti-
mated to be better than + 1 percent.
The stress intensity factor, K, for the center-cracked specimen was
computed from Equation 7:
PK = - - /Tta sec (TTa/W) (7 )
where P = applied load, B = specimen thickness, W= gross specimen width,
and a = half crack length. The secant term is a correction for finite specimen
8

width [19] which closely approximates the series correction obtained by Isida
[20].
B. Crack Monitoring System
An electrical potential method was used for monitoring crack growth and
closure utilizing a continuous recording system. This method is based on an
increase in electrical resistance of the specimen with crack growth. A con-
stant current is applied to the specimen, and changes in electrical potential
are measured between fixed points above and below the crack, Figure 3. A
schematic diagram of the system is shown in Figure 4. The relationship
between the electrical potential, V, half crack length, a, and the distance
between the two fixed measurement points, 2y, for the central cracked speci-
men is given by Equation 8:
cosh/cosh TTy/W\
i"1 \cos -fla/W/V (ao) cosh"1 /cosh Try/'
\cos TTa0/W,
This equation, derived by Johnson [21] was used as an analytical calibration
curve. The electrical potential method provides measurements of average
crack length through the thickness, as opposed to the visual methods which
give measurements of the crack length at the specimen surface only. This
method has been shown to agree well with other crack measuring techniques
for a number of materials tested in various environments, provided that crack
tunneling is taken into account [22].
This method of crack measurement has several advantages. It permits

measurements of crack length while the crack is completely covered, thus giving
complete freedom for using environmental chambers which may completely
cover the crack area. Since changes in electrical potential reflect electrical
shorting, vis-a-vis, physical contact, across the crack surfaces, these changes
provide direct measures of crack closure. The other important advantages are
that it gives a continuous measurement of crack length as a function of time and
that it permits continuous recording of load-potential curves. By using a
working current of about 2.1 amperes, this system provided an average mea-
surement sensitivity of about 0. 0025 inch (0. 064 mm) in half crack length, a,
per microvolt (juv) changes in potential (that is, 0. 0025 inch/jiv, or 0. 064 mm
juv) for these specimens. Resolution is better than 0. 001 inch, or 0. 025 mm.
For autographic recording of the load versus potential data used in the
crack closure studies, an alternate amplification procedure was used in place
of the system shown in Figure 4. The electrical potential signal from the
specimen was applied directly to the input of a d-c amplifier in the MTS
Systems testing machine. The output from this amplifier was reduced by a
preset d-c signal, and the difference signal was amplified further in the x-y
recorder and recorded. Because these amplifiers were designed for signal
levels in the millivolt range, and the changes in electrical potential were in
the microvolt range, the background noise tended to be higher with this
method, The reduced signal to noise ratio, however, did not seriously affect
the closure results (see Figure 6, for example) and was acceptable in view of
the improved convenience in measurement.
10

C. Environment Control System
Preliminary experiments indicated that an insulating oxide layer formed
on the fracture surfaces of specimens tested in air. This insulating oxide
layer interferred with the measurement of crack closure by the electrical
potential method, and gave values that underestimated the extent of closure.
To circumvent this problem, all electrical potential measurements of closure
were carried out on specimens tested in dehumidified argon that had been further
purified by a titanium sublimation pump. A schematic diagram of the environ-
ment control system used in these experiments is shown in Figure 5.
Purification was achieved by passing ultrahigh purity argon through a
molecular sieve drier, and a series of cold traps at about -140°C. Further
purification was obtained by passing the argon through a titanium sublimation
pump (TSP) in line with the gas purification system. The TSP was operated
as a getter, and was connected directly to the environment chamber through a
high conductance tube. To reduce possible back diffusion of impurities, the
argon was discharged through an additional cold trap and a silicone fluid trap.
The effectiveness of this purification system has been demonstrated by Wei
and Ritter [23].
D. Experimental Work
Two independent methods were used to study the crack closure phenome-
non. Crack closure was measured directly by using the electrical potential
method. Indirect measurements of crack closure were made by measuring
strains in regions near the crack tip. To simplfy experimentation, only one of
11

the methods was used on each test specimen. The effects of both R and Kmax
were examined.
Closure experiments were carried out, at suitable crack length intervals,
on specimens that have been fatigued under constant load-amplitude cycling at
selected stress ratios, R. Stress ratios of 0. 05, 0.1, 0. 2, 0. 3 and 0.5 were
used with the electrical potential method. For the strain measurements, only
R of 0. 05 was utilized. A constant maximum load, Pmax> of 12,000 Ib
(53. 38 kN) was used for all the tests except for those at R = 0. 05. For the
tests at R = 0. 05, Pmax of 10, 000 Ib. (44.48 kN) was used. Fatigue cracks
were extended from an initial length of about 0. 3 inch to about 0. 9 inch (or,
from about 7.6 to 23 mm). The corresponding values of Kmax ranged from
about 15 to 33 ksi-in^ (16. 5 to 36. 3 MN-m~3/2) for the test at a Pmax of
10, 000 Ib. (44.48 kN), and from about 17 to 40 ksi-in^ (18. 7 to 44 MN-nT3/2)
for tests at Pmov of 12, 000 Ib. (53. 38 kN).IJJLcwC
1. Electrical Potential Measurements
Electrical potential measurements of crack closure were carried
out on specimens that were fatigued in dehumidified argon (see section on
Environment Control System). Fatigue cracks were extended to various selec-
ted lengths under constant load-amplitude cycling at 5 Hz. for prescribed R
and Pmax' Cyclic loading was interrupted at selected crack length intervals,
with the load at Pmax, and the closure experiments were performed. The fol-
lowing sequences were utilized and constitute one set of closure experiments:
(a) the specimen was unloaded from Pmax to Pmui, and then reloaded to Pmax;
12

(b) the specimen was then unloaded from Pmax into compression to about 4, 000
Ib. (17.79 kN compression), and reloaded to Pmax; and (c) finally, step (a) was
repeated. These procedures were carried out using the one-cycle loading feature
on the MTS machine operated at 0. 01 Hz. Autographic recordings of load
versus change in electrical potential (vis-a-vis, change in apparent crack
length - crack closure) were made during each of the aforementioned steps.
2. Strain Measurements
For convenience, specimens for the strain measurements were
fatigued in air. Metal foil strain gages, with 0.015 inch (0.38 mm) gage length,
were used. Up to 4 strain gages were mounted at various locations on the
specimen surface adjacent to the line of intended crack prolongation (see
Table 2 for specific locations for the strain gages). Fatigue cracks were
extended under constant amplitude cyclic loading at 5 Hz., with Pmax =
10,000 Ib. (44.48 kN) and R = 0.05. Cyclic loading was again interrupted at
selected intervals (to approximate those of the electrical potential measure-
ments) for the closure studies. Here, only the load sequence Pmax to 4, 000 Ib.
compression (-17. 79 kN) back to Pmax was used. Autographic recordings of
load versus strain were made during these unloading and reloading cycles.
13

III. RESULTS AND DISCUSSIONS
In this section, the experimental results will be summarized. The
results of the electrical potential and strain measurements will be considered
separately. The effects of stress ratio, R, and maximum stress intensity
factor, Kmax, on crack closure will be discussed. Detailed interpretations of
these experimental results and correlations with an approximate analysis will
be given in the following section on analytical modeling.
A. Electrical Potential Measurements
Typical load versus change in electrical potential curves are shown in
Figure 6-8 for the sets of crack closure experiments described in paragraph
D-l of Section II. Figure 6 depicts those for loading sequence (a) — Pmax to
pmin to pmax; Figure 7, those for sequence (b) — Pmax to -4000 Ib. (-17. 79 kN)
to Pmax; and Figure 8, those for sequence (c) — Pmax to pmin to pmax —
following the sequence into compression. Each of the curves corresponds to
a different crack length, and thus corresponds to a different value of Kmax.
Sensitivity ranged from about 0. 005 in/uv. (0.13 mm/pv.) to 0. 002 in/uv
(0. 05 mm/uv), corresponding to crack lengths, a, of 0. 3 to 0. 8 in. , respectively.
Changes in electrical potential reflects electrical (and, hence physical)
contact between the fracture surfaces, and thus provide a direct measure of
crack closure. For a crack in an elastic medium, the crack surfaces are expected
to be completely separated (open) under an externally applied tensile load, and to
be in complete contact (fully closed) in compression. Load versus change in electrical
14

potential curves for this idealized case are expected to follow the behavior
indicated by Figure 9. In the tensile region, the electrical potential assumes
some value V(a) corresponding to the prevailing crack length. As the applied
load is reduced through zero into compression, the electrical potential under-
goes a step-wise change from V(a), and assumes a value V(ao), corresponding
to that for some initial finite-width notch of length a0, or a value corresponding
to the uncracked specimen. In reality, if crack closure occurs, it is expected
to proceed from the crack tip and extend gradually back towards the initial
notch. This gradual change is reflected in the actual experimental data,
Figures 6-8. Initial deviation from V(a) can be identified with the onset of
crack closure. This point can be identified with the crack opening stress,
Sop, used by Elber [10], and will be utilized in computing U. (Note that, aside
from the identification with the onset of crack closure, no further physical
significance is assumed or implied. Further discussion of this point will be
given in a later section.) The influences of R and Kmax on the onset of crack
closure will be considered separately in a later section.
It is useful to consider the nature of the load versus change in electrical
potential curves in some detail, which serves to qualify the experimental
results and provides some physical insight into the crack closure phenomenon.
It is important to recognize that the electrical potential measurements provide
measures of the average (through the thickness average) crack lengths, and
15

that the identification of a change in electrical potential with an increment of
crack closure is based on the assumption that the electrical conductance across
the fracture faces approximates that of the undamaged material. It is believed
that this assumption was reasonably well met, and was correct in the case of
compression loading based on the agreement between the electrical potential
under compression loading and that of the uncracked specimen. Irrespective
of this assumption, the point for the onset of crack closure can be identified
with good accuracy.
From the experimental data, it can be seen that the paths of the unloading
and reloading curves were somewhat different. The differences are particularly
apparent in those cases where the specimens were loaded into compression.
The differences were caused in part by short-term drift and electrical noise in
the measurement circuit. The principal difference, Figure 7, was produced,
most likely by crushing of the fracture surfaces, and by refracturing of regions
of the fracture surfaces that had become "cold welded" during compression.
B. Strain Measurements
For an idealized crack in an elastic medium, as considered in the pre-
vious section, the load versus strain curves will exhibit two types of behavior
depending on whether the strain gage is located ahead of, or behind the crack
tip. For a gage that is located ahead of the crack tip, the idealized behavior
would be that shown in Figure 10(a). In the tension region, the behavior is
linear and reflects the stress (strain) concentration effect of the crack. In
compression, the slope of the load-strain curve corresponds to that of an
16

uncracked specimen. The abrupt change in slope at zero load reflects the
abrupt change in stiffness as this idealized crack changes from a fully open to
a fully closed configuration. Figure 10(b) illustrates the idealized load-strain
behavior, when the strain gage is located behind the crack tip. In the com-
pression region, the load strain curve again corresponds to that of an uncracked
specimen. In the tension region, since the strain (stress) is essentially unloaded
by the presence of the crack, changes in strain with load become very small.
Similar to the case represented by Figure 10(a), the abrupt change in slope at
zero load is again that associated with opening and closing of the crack.
The load versus strain behavior for cracks in real material is repre-
sented by the curves shown in Figures 11. The load was again cycled from
Pmax into compression, and then back to Pmax- The curves represent mea-
surements made on two separate gages, and reflect changes in load-strain
behavior as the crack tip approached and then moved away from the gage. The
substantial deviations in behavior from those of the idealized crack again reflects
the gradual nature of the closure process. The onset of closure can be detected
most easily when the crack tip is close to the strain gage, and is determined
by the deviation from linear behavior in the tension region. The loads at which
the onset of closure began correlate well with the loads obtained from the
electrical potential measurements. A more detailed discussion of these results
is best made in terms of an analytical model, and will be deferred.
17

C. The Effects of Stress Ratio and Kmax on Crack Closure
On the basis of the electrical potential data, Figures 6 and 7, the effect
of stress ratio, R, and the maximum stress intensity, Kmax, on crack closure
may be considered. Crack closure is considered to begin when the electrical
potential deviates from the value at full load. The point for the onset of crack
closure is consistent with that defined by Elber [10] on the basis of crack opening
displacement measurements. The results are shown in Figure 12, in terms of U
(the effective stress range ratio, U, as defined by Elber). It is to be emphasized
again that U is to be interpreted here only in terms of the onset of crack closure.
No further physical significance is assumed or implied.
U and Pop, corresponding to the onset of crack closure, are shown in
Figures 12a and 12b as functions of Kmax for various R. These results clearly
indicate that the onset of closure is a function of stress ratio, as well as a func-
tion of Kmax and hence of crack length. For R greater than 0.3, no crack closure
was observed (i.e. Pop < Pmm), and U = 1. For values of R below 0.3, U is a
function of Kmax above certain Kmax values, and is independent of Kmax (i.e. U
approaches 1) below these Kmax values, Figure 12a. It is dependent on Kmax in
an intermediate range, and becomes mildly dependent on Kmax at high Kmax
levels. The latter region corresponds to the range in which Pop becomes nearly
constant, Figure 12b. These results are qualitatively consistent with the physical
model (see next section) that suggested an influence of stress ratio, R, and are
consistent with the probable dominance of the surface plastic zones on closure.
18

The results are, however, in contrast with those reported
by Elber [10] for a 2024-T3 aluminum alloy. The differences, of course, can
be attributed in part to the differences in materials. The principal causes,
however, reside in Elber's data. First, because of the limited range of data
(obtained mostly at high Kmax levels) and of the inherent uncertainties in the
results, Elber's assertion that U is independent of Kmax cannot be regarded as
being conclusive. Second, most of Elber's data were obtained
under conditions above net section yielding. As such, the utility of the data and
of the suggested relationship between U and R is questionable. Further independ-
ent verifications are needed.
D. Discussion
Based on the experimental observations, the following processes for
crack closure are envisioned. The physical basis for closure can best be des-
cribed by comparison with idealized cases. For an idealized stationary crack
(infinitesimally thin slit) in an elastic medium, the crack surfaces are expected
to be completely separated (open) under an externally applied tensile load.
The separation between the crack faces (crack opening displacement), can be
defined by linear elastic analysis [24]. Upon unloading to zero load, the crack
opening displacement would return to zero along the full length of the crack.
For an idealized stationary crack in an elastic-plastic medium, the crack
opening displacements (crack contour) under tension are expected to be larger
than those of the elastic case at the same load, as a result of plastic
19

deformation ahead of the crack tip [25], Because of this plastic deformation,
residual crack opening displacements will remain following the reduction to zero
load, and no crack closure would be indicated.
Real cracks, however, are formed as a result of highly localized defor-
mation and separation at the crack tip, and are expected to behave quite dif-
ferently. It is envisioned that the process of deformation and separation (for
example, that suggested by Krafft [26,27]) followed by compaction, would pro-
duce a highly deformed layer. This layer, defined as "a layer of residual ten-
sile strain left in the wake of the crack tip, " [10] delineates an effective crack
contour with crack opening displacements that are, in all probability, smaller
than those of an equivalent elastic crack. On unloading, the surfaces of this
layer may come into contact and give rise to the observed results. Of course,
the degree of compaction depends on the ratio between the minimum and maxi-
mum loads in a cycle, that is, on stress ratio, R. Hence the onset of crack
closure is expected to be a function of R. Since the extent of the residual defor-
mation is dependent on Kmax, the onset of crack closure is expected to be a
function of Kmax, also. The observations of experimental results support this
model.
20

IV. MODELING FOR CRACK CLOSURE
A two-dimensional elastic model is used to assist in the interpretation of
experimental results. It is recognized that such a model cannot truly repre-
sent the real physical problem, which is one that involves elastic-plastic
behavior, with unloading, and is most probably three-dimensional in nature
[28], Nevertheless, it is felt that some semi-quantitative understanding can be
obtained. In the following sections a brief description of the model is given,
and the qualitative features of the model are discussed in terms of the observed
load-strain behavior. On the basis of the model and the experimental data,
estimates of the crack closure forces and the load versus crack opening displace-
ment curves are made and discussed.
A. Analytical Model
The model chosen is that of a notch-like crack in a homogeneous, iso-
tropic elastic body loaded by remote tension and by distributed compressive forces,
representing forces produced by crack closure, on the crack faces as shown in
Figure 13. The magnitude and distribution of the distributed forces are expected to
depend on the degree of closure. It is assumed that the crack faces remain
separated, and the only manifestation of closure is the artifical introduction of
closure forces. It is further assumed that the closure forces are uniformly
distributed through the thicKness (that is, in the z-direction), and vary only in
the x-direction, or along the crack length direction. The problem is then
treated as one of generalized plane stress. Based on these assumptions, the
21

stresses (strains) at any point can be obtained by superposition, Figure 13.
This model is analogous to the strip yield model proposed by Dugdale [29], and
is expected to provide reasonable approximate solutions for stresses (strains)
away from the crack tip. The approximations are expected to be poor, how-
ever, in the near-tip region.
For a plate containing a central through-thickness crack of length 2a, the
strain at any point and the relative displacement between any two points in the
plate may be determined by using the Westergaard method and the appropriate
stress functions [24]. The Westergaard method and the derivation of the rele-
vant strain and displacement equations are summarized in the Appendix. The
longitudinal strain, ^y, and displacement, v, produced by'remote loading on a
finite width plate are given by Equations 9 and 10:
' v'remote" W
a' \ / n a/sec (io)
For the present discussions, these equations are assumed to be valid also for
compression loading, since the crack is assumed to be notch-like and to remain
separated. The longitudinal strain and displacement produced by the distributed
closure forces are obtained by integration of the solutions for two pairs of unit
splitting forces applied to the crack faces, Figure 14. The longitudinal strain
and displacement by the unit splitting forces are given by Equations 11 and 12:
22
££- (ii)w
_ (1+mtm
splitting *
(12)^ _ ;.v. Ha n \\ ft a
The longitudinal strain and displacement produced by the distributed crack
closure forces are then given by Equation 13 and 14:
<Ev>closure=L <Ev>splitting f<b> db (13)/close
/• a(E6,.) , = f (E£ ) ..... f(b) db * *v y closure I a y splitting v
' close
The longitudinal strain and displacement produced by the combination of
remote loading and crack closure forces are then obtained by the superposition
of the solutions given by Equation 15 and 16:
Ev = (Ev)remote+<Ev Closure (15>
E€y= (E £y)remote+ (E £y) closure
The following definitions of terms were used for the previous equations:
z = x + i y ; x,y, coordinate of the point
E, )/ = Young's modulus and Poisson ratio respectively
23

B, W = thickness and width of the specimen, respectively
b = the distance between the center of the crack and splitting force
a close = 'he distance between the center of the crack and the contactline
f(b) = the magnitude and distribution of closure force
Vsec (TTa/W) = correction factor for the finite width specimen
Unfortunately, the magnitude and distribution of the crack closure forces
are not known. Under "the assumptions of the model, an estimate may be made
on the basis of the crack closure data and the load-strain results. Before pro-
ceeding with this estimate, qualitative features of this model may be examined
and discussed in terms of the load-strain results.
B. Behavior of Load-Strain Curves
To facilitate the discussion of the load-strain curves, the longitudinal
strains at fixed gage locations produced by unit splitting forces were computed
as a function of the location of these forces, and are shown in Figures 15 and 16.
Two different crack lengths were chosen. For one, all of the gages were
located ahead of the crack tip; and the other, all behind the crack tip. The
crack tips were sufficiently far away from the gages in both cases such that
the approximations would be reasonable. Some specific cases are discussed
below.
1. Strain Gage Located Ahead of the Crack Tip
A typical load-strain record for a strain gage located ahead of the
crack tip is shown in Figure 17. This curve deviated from the load-strain
24

curve for a notch-like elastic crack whenever the crack closure occurred.
Whenever there is crack closure, compressive forces acting on the crack sur-
faces are expected. These closure forces produce tensile strain at the point
ahead of the crack tip, just like a wedge force acting on the crack (Figure 15).
The tensile strain produced by the closure forces makes the load-strain curves
deviate from the idealized one. Upon further unloading, both the closed area
and the closure force increase, so that the strain-load curve deviates further
away from the idealized curve. The shadowed area depicted in Figure 17 repre-
sents the effect of the closure force.
2. Strain Gage Located Just Behind the Crack Tip
A typical load-strain curve for a strain gage located just behind the
crack tip is shown in Figure 18. Initial deviation from the curve for the notch-
like elastic crack before the onset of crack closure may be attributed to the
onset of reversed yielding [30]. Once closure occurred, the curve deviated
substantially from the idealized one. Now, the closure forces work like dis-
tributed forces acting on a straight boundary, and produce compressive strain
on the gage points. The shadowed area in Figure 18 depicts the influence of the
closure force and the cross hatched area shows approximately the influence of
reversed yielding. Since the strain caused by closure forces and by reversed
yielding are compressive instead of tensile, the shadowed area in Figure 18 is
on the other side of the idealized curve when compared with the shadowed area
in Figure 17.
It should be noted that the rate of decrease of strain was very high just
25

after the onset of crack closure, and slowed down and approached a constant with
further unloading. The initial rapid decrease was caused by both the rapid
increase in closed area and of the closure force effect. As the contact line
moved further away from the strain gage, the closure force on the newly closed
area produced little additional strain on the strain gage. Hence, the rate of
decrease became principally a function of the remotely applied load.
3. Strain Ga%e Located Far Behind the Crack Tip
For constant amplitude loading, the electrical potential measurements
indicated that the onset of crack closure occurred at increasingly higher loads
with increasing Kmax, that is, with increasing crack lengths, Figure I2b.
Strain gage measurements (Figure lib) appear to suggest, however, that the
onset of crack closure occurred at progressively lower loads for the longer
crack lengths. This apparent discrepancy was caused by the reduction in sensi-
tivity when the strain gage is far away from the crack tip and can be explained
in terms of the influence line depicted in Figure 16. Although the onset of crack
closure actually occurred at a higher load for a longer crack length (as indicated
by the electrical potential method), the strain produced at the gage location
(when the crack tip was well past the gage) was small because of its remoteness
from the closure forces near the crack tip. (Of course, the strain produced at
the gage location by reversed yielding at the crack tip would have been small
also). The strain gage could sense the effect of crack closure only when the
contact line approached the gage. This occurred at loads much lower than that
at the onset of closure, as shown in Figure lib. Examination of Figure 11 shows
that the strain produced by the splitting force changed signs depending on the
26

location of the force in relation to the strain gage; being tensile over certain
regions far removed from the strain gage and compressive near the gage. This
change in sign, in combination with changes in magnitude with location, is con-
sistant with the observed behavior.
C. Estimate of Closure Forces
An estimate of the magnitude and distribution of the closure force may be
made on the basis of the superposition model, and experimental data on closure
and on load-strain variations. The estimate was made for the case of R = 0. 05,
since electrical potential measurements of crack closure and companion load-
strain data were available. The extent of crack closure (through-thickness
average) was determined from the electrical potential records, Figure 7(b).
Closure forces with assumed magnitude and assumed distribution over the
closed region were then used, in conjunction with the corresponding remote
loading, to calculate the longitudinal strain (by numerical integration of Equation
16) at the gage location and compared with the experimental load-strain data.
Typically, uniform closure forces (producing yield level stresses) were applied
to a region near the crack tip, and rapidly decaying forces were applied to the
remainder of the closed region. This distribution was considered to be consistent
with the physical model. The forces that produced the best fit with the experi-
mental data (Figure 19) were considered to be a reasonable estimate of the
closure forces. Closure forces determined by this iterative procedure are
shown in Table 3 and appear to be reasonable. A portion of the closure force at
the crack tip may be regarded as a contribution from the compressive yield
zone, although such an identification was not made explicitly.
27

In arriving at these estimates, the distribution of closure forces was
assumed to be constant in the thickness direction, and the crack front and the
closure line were assumed to be straight and perpendicular to the specimen sur-
face. Actually, the contact area would resemble that illustrated in Figure 20.
This assumed three-dimensional distribution is quite reasonable, since the
permanent tensile deformation near the surface is much larger than that in the
center, because of the difference of plastic zone size (Figure 21). In this case,
the distribution of the closure force must be solved as a three-dimensional pro-
blem. Because of this two dimensional approximation, the procedure for esti-
mating the closure forces may be used only when the strain gage is located
close to the crack tip.
D. Computation of Crack Opening Displacement
The relative displacement between several pairs of points in the longitu-
dinal direction (that is, crack opening displacement) were computed by using
the superposition model, and the magnitude and distribution of closure force
estimated previously. The equations used in this computation are Equations 9,
11, 13, and 15.
The computed displacements are depicted in Figure 22. These curves are
similar to those observed by Elber [10], Figure 1, and suggest that the onset of
crack closure detected by several experimental techniques would be the same,
Figure 23.
28

V. GENERAL DISCUSSIONS
It has been shown that the crack tip stress intensity factor, K, defined by
linear elasticity, is the most appropriate parameter for characterizing crack
growth [2, 3,4], Because of a lack of understanding of the mechanism for
fatigue crack growth, no fundamental fatigue crack growth laws have been pro-
posed. The various "so-called" laws are empirical representations of avail-
able experimental data. In proposing the relationship given by Equation 1,
Paris assumed that AK was the most significant parameter, and that stress
ratio, R, (or, Kmean; or 1^ ) is of only secondary importance.* In practi-
cal cases, the effect of R can be important. Attempts have been made to incor-
porate the influence of R into the growth rate relations, again through empiri-
cal correlation [5, 6].
With the observation of crack closure, it is thought that a viable physical
basis for explaining the influence of R on fatigue crack growth had been devel-
oped [10]. Because of closure, the effective stress intensity range, AKe£f,
may differ considerably from the applied AK, and is a function of R. Elber
showed that good agreement with experimental data was obtained on this basis.
Unfortunately, several questions remain unresolved. Firstly, Elber argued
that as soon as crack closure begins, the singularity at the crack tip is removed.
Thus, the corresponding K value at the onset of crack closure is to be regarded
as the KjnJn hi the load cycle; that is, a truncation of the lower portions of the
load cycles. Experimental results from this investigation show the strains ahead of the
* Environmental effects will not be considered in this discussion.
29

crack tip continue to decrease with unloading beyond this point, Therefore, since
fatigue damage is related to the cyclic strain range, the effective Km{n is likely
to be somewhat lower than the level at the onset of closure (Figure 24). These
differences in viewpoint cannot be resolved by the approximate two-dimensional
model developed in this report. Secondly, because of the preliminary nature of
Elber's closure data (see Introduction), the correlation between the rate of
fatigue crack growth and AKeff given by Equation 5 requires additional verifi-
cation . Recent data obtained by FitzGerald and Wei [31] indicate that there is
an effect of R on fatigue crack growth, for R values from 0. 05 to 0. 9, in the
T1-6A1-4V alloy used in this study, Figure 25. The present results indicate
the absence of closure at R greater than 0.3. Hence, crack closure is likely
to be only one of several factors that contribute to the observed R effect.
The importance of delay, or retardation in the rate of fatigue crack growth,
produced by load interactions in variable-amplitude loading on the accurate pre-
diction of fatigue lives has been well recognized for some time [32,33,34],
Jonas and Wei [35] showed that the phenomenon of delay is very complex and
can depend on a broad range of loading variables. Due to a lack of physical
and phenomenological understanding of the effects of load interactions on fatigue
crack growth, no successful model has been proposed to account for delay.
In general, delay effects have been attributed to such things as crack tip
blunting [36], residual stress ahead of the crack tip [34], and more recently,
crack closure proposed by Elber [10]. The first two of these theories do not
lend themselves to direct experimental observation. The third, crack closure
30

proposed by Elber, may be verified experimentally by determining if delay
occurs in the absence of closure. For a loading spectrum depicted on Figure
26, there should not be any crack closure occurring for Km[n equal to or
greater than 12 ksi /in, (R ^ 0.3), according to the result of the last section.
However, significant amount of delay was observed, Figure 26. This
experimental result shows again that crack closure cannot be regarded as the
sole cause for delay.
The present series of experiments have shown that crack closure can and
does occur. Its occurrence is dramatically evidenced by changes in electrical
potential, strain and crack opening displacement with load. However, crack
closure cannot account for all of the observed fatigue behavior. Additional
research is needed to better establish its significance.
31

VI. CONCLUSION
The following conclusions can be made on the basis of the experimental
results on the Ti-6Al-4V alloy:
1. Crackclosure does occur during fatigue. For the TI-6A1-4V alloy,
closure was observed at stress ratios, R, between 0.05 and 0.3.
2. The extent of closure can be determined by electrical-potential mea-
surement method with reasonable accuracy.
3. The stress intensity factor at the onset of closure depends on the stress
ratio, R, and on Kmax.
4. Onset of closure can be detected by measurements of such quantities
as electrical potential, crack-opening displacement, and strain.
5. The closure force near the crack tip was estimated to produce yield
stresses. A part of this estimated closure force may be attributed to the
plastic zone.
6. Crack closure cannot be regarded as the sole cause for the various
observed phenomena for fatigue. For example, it cannot completely account
for the influence of stress ratio, R, on fatigue crack growth; neither can it
fully explain the delay phenomenon under variable-amplitude loading.
32

TABLE 1
Chemical Composition and Tensile Properties(Reactive Metal Ingot No. 293831, Lot 05)
Chemical Composition - Weight Percent(Ingot Analysis)
£ N Fe Al V O H (ppm) Tis
0.03 0.013 0.13 6.2 4.2 0.12 90 Balance
Tensile Properties*
Direction
Transverse
(Average)
Longitudinal
(Average)
Yield Strengthksi (MN/m2)
TensileStrength
ksi (MN/m2)
Elongationin 2 in.
percent
149.5 (1,031)
149.8 (1,033)
148. 3 (1, 023)
149. 2 (1, 029)
141. 1 (973)
141.9 (978)
141.5 (976)
152.6 (1,052)
153.4 (1,058)
151.4 (1,044)
152.5 (1,051)
150.7 (1,039)
151.0 (1,041)
151.8 (1,047)
151.2 (1,042)
12.5
12.5
11.7
12.2
11.7
11.7
12.5
12.0
* Production annealed 1,450°F, 15 min. + air cool.
33
TABLE II
Strain Gage Position(inch)
Position
X
Y
GageA
0.347
0.036
GageB
0.496
0.083
GageC
0.644
0.036
GageD
0.797
0.079
X
Ba DAD ca
34

w
CQCQCD
§
ss->CQ
w
^H
.1
CO
c-
IIcd
!COinCO
oIIOS
CMCQ _CQ Z?CD CO
CQ ""'
TH
CQ ^~.
™ °ra2 ^CQ
^^
CM •??X s•a
" n
iH*SX J
^-*
CD — .CO .£3
rt°-
CM
CQ Z?CQ tQ
£ •££.CQ
T-H
CQ -05 'm
CQ
^x1 J
—
x"1 S'-
CQ J?
r2 °
cS°-
O
w"73 aCP ' 4
l ^1,aa
CO
oCO
cr>t-o
comCO
o
CM
0
<35^t*
O
coc-o
oCO
CO
CO
o
CM
CO
0
T-)
o
m
C55• t1
0
enCO
0
0CMC-
O
Oc-
«
COinCO
o
CM
CO
o
enino
in0
o
oo
en•*F
O
COen
0
oocf
o
ot>
^
COinCO
o
CMCO
o
mCOmo
o
o
00
O;^J*
O
COen
0
CMmm0
oCO
in
COinCO
o
CM
CO
o
ent-
o
in•oi
o
oo
enJ1
0
coen
0
in
o
o00
00
COinCO
o
CM
CO
o
coCO
o
TH
1
o
o
en^
o
coen
o
00COCO
0
o00
00
COinCD
O
CM
CO
o
COoCO
o
CM1
O
in
CO•-i
en"*
o
COen
o
COooCM
O
O00
00
COinCO
o
CM
CO
o
1-100CM
o
CO1
35

xO
CO
Q.O
CO
I-zLU2UJo<_JQ_COQ
c
CO
sf-lu
0}
IEilh v•" u^O Q
3SQ>
SS3H1S Q3HddV
36

8'
<L
0
^
EDM Starter Notch
Fatigue Crack
Dia.* I"
Figure 2. Center-Cracked Specimen
37

A
IPOTENTIALLEADS
\
V
Q
~~e
AV
AV
i —i ,
yi r
„ -*w »r-
A
\CURRENTLEAD
CURRENTLEAD
-L-
V
Figure 3. Potential Leads on a Center-Cracked Specimen
38

a:UJ
5o
zUJ
i-^AAJ-^VW^
1a
10>
O
fi
w"8
p.2tsa
•<*<(D
• h
39

UJ
wCQ
-3
o13
I•3
9
0)
1Pn
Q- Ox oz> o:
40

OGi 'O
T LZL '0
•OT 169*0
'0
! T6S'0
•at OfrS '0
68^*0
LU»-oQ_
O
a:\-oUJ_lLd
WO
T6S'0
! 90S*0 =
O 00 CD
avon
Figure 6a. Load versus Electrical Potential Curves (beforethe Compressive Loading Cycle) (R = 0.1)
41

828 "0
182,'0
TSL 'O oo
989'0
2,89*0
989 *0
LJh-OQ_
SSQ'O
•TIT 88S'0
QV01 Q3llddV
O
o:HOUJ_JLU
Figvire 6b. Load versus Electrical Potential Curves (beforethe Compressive Loading Cycle) (R = 0. 2)
42

" 288
•WT Z8L'(
989'0
"0
ASS'O
989'0
085'0
"0
•fj ZWQ
>.
CO
<
h-•2.UJ\-oCL
-J<O
orK-OUJ-IUJ
•uj 068'0
7k
•«T if'S'O =
ICO
aanddvc\j
Figure 6c. Load versus Electrical Potential Curves (beforethe Compressive Loading Cycle) (R = 0. 3)
43

SU '0 >- _ ^
6T9 '0
89S "0
919*0 I LU
•o J a.
91^*0
*«T OSS '0
Figure 6d. Load versus Electrical Potential Curves (beforethe Compressive Loading Cycle) (R = 0.5)
44
LU_JLU
O 00 CD ^ C\J
1CVJ
. 1 , 1CO ^
V1 1
O1*-
UJHOQ.
O
a:HuUJ_jUJ
rtt>
avO~l Q3HddV
45

oC\J
L_CM
h-
LUh-Oa..j
o
oUJ-JUJ
CO
ICQ
•a "•I «
Ifh -S-e -o
« >s -5CO CQf-l CQCD 01
i-3
•st-
<D
oven
46

985'0
SSS'O
'0
WO =
LUHOCL
oEHoUJ_JUJ
CVJ GO
£ ,8o
O «
gaGB S
0> 0)
IIo oJ O
ot-0)
QVOH Q3HddV
47

I 1 I
oC\J
UJI-o0.
o
oUJ_lUJ
c\j oo sr o
(sdi>|) oven Q3HddV
ICQCD
U
£5
S £
IjfJ2 Jqo w0) Oi—i jW M
SiCQ CQp CQ
•ato oJ U
73C-
48
Ldh-OCL
<O
A o:uLU_lUJ
CO
6.^ •o °•a "«
•a
o(U
o>3 -Sw 10^4 W0) (U> fe•i so oiJ O
01t-01
CO *• O
QV01 Q3HddV
49

'u* L99 '000
! 6T9'0
9TS'0
'0
LUI-oQ_
9IKO
298 '0
'0
O
o:HOLU-JUJ
TJTCVJ CD ID *t
QVOl Q3HddVCVJ
Figure 8. Load versus Electrical Potential Curves (after theCompressive Loading Cycle)
50

LOAD
V ( Q )
V ( Q O )
ELECTRICAL POTENTIAL
Figure 9. Load versus Electrical Potential Curve for anIdealized Crack in an Elastic Medium
51

LOAD
STRAIN
(Q)
LOAD
STRAIN
(b)Figure 10. Load versus Strain Curve for an Idealized Crack
in an Elastic Medium
(a) Strain Gage Located Ahead of the Crack Tip
(b) Strain Gage Located Behind the Crack Tip
52

CC
<N
IEH<B0>M
•« r*
O Bf_, <£>
O M«w O
Se-
ll.
cd t-H •*o M.
<D
c\J o
QVOl 031-lddV
53

z<tct\-(/>
1
\11
I
4
<M
31E-*
<B. ®
< *
0> '% £o «,n «5 oyM •
*°<» u^ !»^T:0 aat^S eoCD •
1 O•a «3^
tw

I I
(sdivi)c\j o
Q3HddV
CVJ
H0)
. 0)Q CO
I Oii ii
fH
>
55

\
OO
\ \CO 5f
(sd!M)
X\.\
"x.\
,cvj o cvi
avon Q3iiddv
orCO
IN
i —
•aH0)
. <DQ oa
OS^1 t-o o
1-1 .to <=>
o ..s-aeS t-£ ?W ^4» °rt II
3^T3rHrH0)
S-
Sf
56

or
<M
.2
Ha>
. oQ w
fc t-o o
<w .w <=>S iia::o ..a ^oJ c>h en
^C"'
^°S ||
01
CM CsJ
57

I
o 00d
CDd
UlUJg.XDUJg
dOg.XDLUg
lOro
000)
oro
ra
J".— T3
* 8
o IE .a
C\J
CO
"3tf
CMi-H
0>
58

mro
X
ro
59

1sWO
a>a
coT-H
Q)
PH
60

Figure 14. Central Crack of Length 2 a in an Infinite Platewith Equal Pairs of Splitting Forces at x = +b
61

x y(a) 0.347 0.036
(b) 0.496 0.083
(c) 0.644 0.036
(d) 0.799 0.079
0.08 0.16 0.24 0.32 0.40b-ln.
Figure 15. Relationships between Strains and the Position of UnitSplitting Forces with Strain Gages Located Ahead ofthe Crack Tip (a = 0.34 in.)
62

x y
(a)0.347 0.036(b) 0.495 0.083(c) 0.644 0.036(d) 0.798 0.079
0.18 0.36 0,54b-in.
0.72 0.90
Figure 16. Relationships between Strains and the Position of UnitSplitting Forces with Strain Gage Located Behind theCrack Tip (a = 0. 908 in.)
63

LOAD (kips)i
3
-2
-2
-3
2 4STRAIN (100 A* in/in)
0 = 0.302x = 0.347y = 0.036
Figure 17. Typical Load versus Strain Curve for a Strain GageLocated Ahead of the Crack Tip
64

0 = 0.349x= 0.347
y = 0.036
-6
CrackClosure
LOAD (kips)
4'
ReverseYielding
-2
-3
STRAIN (100^ in/in)
Figure 18. Typical Load versus Strain Curve for a Strain GageLocated Just Behind the Crack Tip

woa^&
OJO
>> 0)
•° s"5 «I °43 oO T(
C5 W£ WW o
•a s.3 -g
II
oven
66

IndicatedClosure Line
Indicated CrackFront
Actual CrackFront
ProbableClosure Line
( Shaded Area = Aa x b )
Figure 20. Comparison of Probable Closure Line with Closure LineIndicated by the Electrical Potential Measurements
67

0>uo
ooo
<D
N••402
0>
§N
O
rt O
fi w0) QJ
«2 8
I<N
V
I£
68

10
8
W» £+
Q. 6j*
o
Q I Q
0=0.656
x=0.55 y=0.05
x=0.6 y=0.05
x = 0.645 y=0.05
2 4E ( 2 v ) ( l 0 3
8
Figure 22. Relationship between Load and Relative Displacementbetween Gage Points Computed by Using the Super-position Model
69

LJ W
11
1I
L X0
^
11
|1
1|Q.
Q?
\>
111i|i|
UJcr:Dc/)<LU2_j<HZUJ1-On
c
J
XO
Q.
o?
LU2UJo:
UJ
cc
•o3o&CDQcpa .
•s §^
CD•f?
o o>Q I
Xo
Q.
o?
O >>
CO(N
UJ
h-^ £!5UJ I3
LUS
•
QOO
70

xo
CLo
c'£
LU
HOJLOVd A1ISN31NI SS3H1S
I^^U
W
rtUw
Iw
xO
Q.
o?avcn
<N
0>
71

oo
,LU
(T
Oa:(D
o<a:o
ICT4
10-6
10-7
10'r810 100
AK - ksiyirTFigure 25. Crack Growth Rate for TI-6A1-4V Alloy
72

if)
oCVJ
00co
^^a§.3S
o
C «(-l__ W
CO<N
CD
ro CJ
sapAo 0001 - °N
73

REFERENCES
1. H. F. Hardrath, "Fatigue and Fracture Mechanics," AIAA paper No.70-512, April 1970.
2. P. C. Paris, "The Fracture Mechanics Approach to Fatigue1,1 Proc.10th Sagamore Conf., Syracuse University Press (1965).
3. S. R. Swanson, F. Cicci and W. Hoppe, ASTM 416 (1968).
4. H. H. Johnson and P. C. Paris, J. of Eng. Fracture Mech., jL, (1968)
5. D. Broek and J. Schijve, "The Influence of the Mean Stress on the Pro-pagation of Fatigue Cracks in Aluminum Alloy Sheet," NLR-Tech. Rep.M 2111 (1963).
6. R. G. Forman, V. E. Kearney, and R. M. Engle, "Numerical Analysisof Crack Propagation in Cyclically Loaded Structures," J. of Basic Eng.,J59, 3 (Sept. 1967).
7. P. C. Paris, M. P. Gomez and W. E. Anderson, "A Rational AnalyticTheory of Fatigue," The Trend in Engineering, 13, 9, (1961).
8. P. C. Paris and F. Erdogan, J. of Basic Engineering, Trans. ASME,1963.
9. C. M. Hudson and J. T. Scardina, Eng. Fracture Mech., No. 1, (1969).
10. W. Elber, ASTM STP 486 (1971).
11. O. Buck, C. L. Ho, H. L. Marcus and R. B. Thompson, ASTM STP513, (1972).
12. O. Buck, C. L. Ho and H. L. Marcus, reported in "The Symposium onFracture and Fatigue," Washington, D. C. (1972).
13. C. L. Ho, O. Buck and H. L. Marcus, "Application of Strip Model toCrack Tip Resistance andCrack Closure Phenomena," presented atSixth National Symposium on Fracture Mechanics, Philadelphia, Aug.1972.
14. R. A. Schmidt, and P. C. Paris, "Threshold for Fatigue Crack Pro-pagation and the Effects of Load Ratio and Frequency," presented atSixth Annual Fracture Mechanics Symposium, Philadelphia, Aug. 1972.
74

15. M. Katcher and M. Kaplan, "Effect of R Factor and Crack Closure onAluminum and Titanium Alloys," presented at Sixth Annual FractureMechanics Symposium, Philadelphia, Aug. 1972.
16. V. W. Trebules, R. Roberts, and R. W. Hertzberg, "The Effect ofMultiple Overload on Fatigue Crack Propagation in 2024-T3 AluminumAlloy, " presented at Sixth Annual Fracture Mechanics Symposium,Philadelphia, Aug. 1972.
17. R. W. Hertzberg and E. F. J. Von Euw, "Crack Closure and FatigueStriations," Met. Trans. 4, 887 (1973).
18. E. F. J. Von Euw, "Effect of Overload Cycle(s) on Subsequent FatigueCrack Propagation in 2024-T3 Aluminum Alloy, " Ph, D. dissertation,Lehigh University (1971).
19. W. F. Brown, Jr. and J. E. Srawley, ASTM STP 410 (1966).
20. Isida, "Crack Tip Stress Intensity Factor for the Tension of an Eccen-trically Cracked Strip," Lehigh University, Dep. of Mech. Rep. (1965).(see Reference 19)
21. H. H. Johnson, Materials Research and Standards, 5 (1965).
22. C. Y. Li andR. P. Wei, Materials Research and Standards, 6(1966).
23. R. P. Wei and D. L. Ritter, J. of Materials, ASTM (June 1972).
24. P. C. Paris and G. C. Sih, ASTM STP 381 .{l96^).
25. F. A. McClintock and G. R. Erwin, ASTM STP 381 (1965).
26. J. M. Krafft, Trans. ASM,58, 691 (1965).
27. J. M. Krafft, (discussion) ASTM STP 415 (1967).
28. R. P. Wei and T. T. Shih, "Delay hi Fatigue Crack Growth1,1 Int'l J. ofFracture Mechanics (in press).
29. D. S. Dugdale, J. Mech. Phys. Solids, _8 (1960).
30. J. R. Rice, ASTM STP 415 (1967)
31. J. FitzGerald and R. P. Wei, to be published by ASTM (copies are availablefrom the authors).
32. R. H. Christensen, Proceedings - Crack Propagation Symposium,Cranfield, College of Aeronautics (1962).
75

33. J. Schijve, Fatigue Crack Propagation in Light Alloy Sheet Material andStructures, Kept. MP 195, National Luchtvaartlaboratorium (Amsterdam)(August 1960).
34. C. M. Hudson and H. F. Hardrath, NASA TN D-960 (1961).
35. O. Jonas and R. P. Wei, Int'l. J. Fract. Mech., _7 (1971), 116-118.
36. C. M. Hudson and H. F. Hardrath, "Investigation of Variable Loadingon Fatigue Crack Propagation," NASA Tech. Note D-1803 (1965).
76

APPENDIX
The equation of equilibrium for two dimensional elastic problems can be
found in any elementary text of the theory of elasticity.
, 0 A-ldX 9^
Txy - 7y*
The strain-displacement relationships and Hook's law lead to the compatibility
equation.
(-$* i£) (&*<*)• °As is easily checked, equations A-l are satisfied by an Airy's stress function,
<£ (x, y), if the stress components are defined as follows:
A-3
Substitutions of Equation A-3 into Equation A- 2 gives the biharmonic equation
= 0 A 4A'4
For a specific problem, the stress function, <£ , must satisfy Equation A-4 and
the appropriate boundary conditons. Theory of functions of complex variables
provides a powerful tool for the solution of two-dimensional elasticity problems.
77

Define a complex variable, z, by
z = x + i y A-5
If a function of this complex variable, Z(z) > is analytic then its derivatives
exist, that is,g- dz"£j — -.dz
z-§fdZ A-6
,_ dZZ-~dT-
Let Z = ReZ + ilm Z, then the Cauchy Rieman conditions state that:
^— Iml = - ^ ReZ = ImZax
It follows that
V2 (Re!) = V ( I m ) = 0
Similarly, all derivatives of Z have harmonic real and imaginary parts. If
the Yl are each harmonic, that is
y2^- = 0 A-8
then any stress function in the form
A~9
will automatically satisfy the Equation A-4.
In conformity with Equations A-5 - A-9, Westgaard defined an Airy
stress function, 5 , by
78
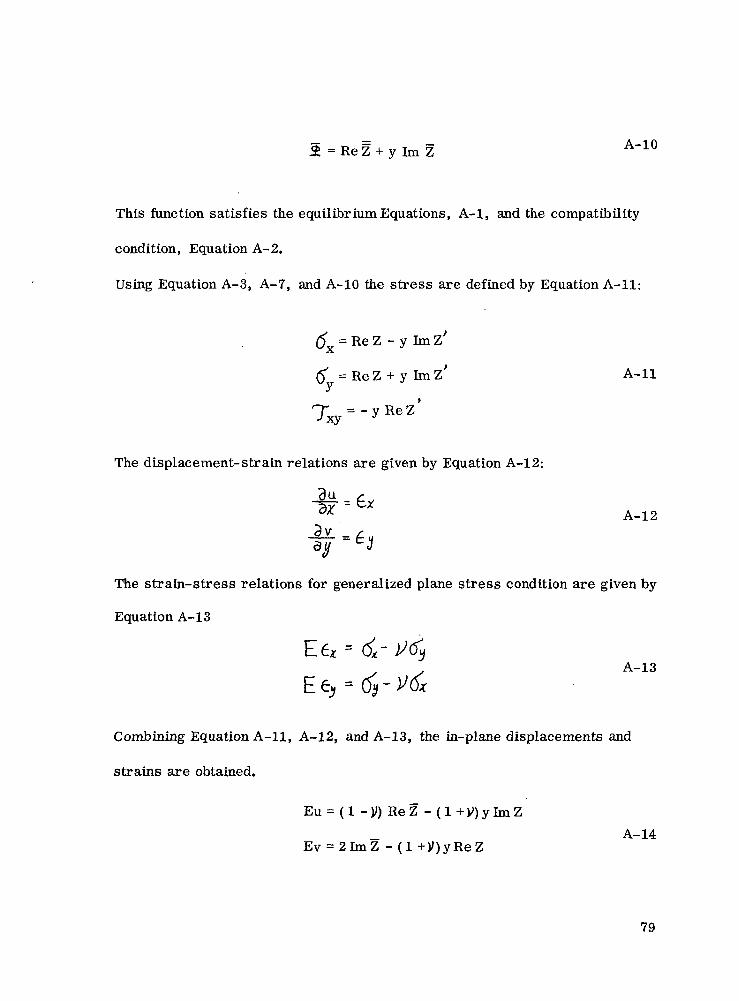
A"10
This function satisfies the equilibrium Equations, A-l, and the compatibility
condition, Equation A- 2.
Using Equation A-3, A-7, and A-10 the stress are defined by Equation A-ll:
= Re Z - y Im zX
= ReZ + y ImZ' A-ll•7
= - y Re Z 'xy J
The displacement- strain relations are given by Equation A-12:
a /•~ ^* A-12
The strain-stress relations for generalized plane stress condition are given by
Equation A- 13
E£* = <i-^(5A- 13
Combining Equation A-ll, A-12, and A-13, the in-plane displacements and
strains are obtained.
Eu = ( 1 - V) Re Z - ( 1 + V) y Im ZA- 14
Ev = 2ImZ - (1 + V ) y R e Z
79

E6 = (1-V)Re Z - (1+V)y ImZX.
A-15
For a central crack of length 2a in an infinite plate with uniform biaxial stress
at infinity, the stress function is given by Equations A-16 [24]:
Z = 6 z/jz*-tfA-16
The longitudinal strain and displacement at a point A(x, y) are then obtained
from Equations A-14 and A-15.
E6 = ( " !->>) Re•J
A-17
Ev = <S [2 Imjjz2- a2)- (1 +^) y Re
The stress function for a central crack with two equal pairs of splitting forces
at x = +b (Figure 14) is given by Equations A-18.
Z =
Z =
2P , -1-7Ttan ,
2P2 2
a -bA-18
Z = -2P
™» »»—
IT
80

The longitudinal strain and displacement at a point A(x, y) is then given by
Equations A-19.
2P
(z2-b2)/z2-ai
2z2/a2-
(z2- b2)2/z2-a2
a2/a2- b2
(z2-b2)J(z2- a2)3
A-19
Ev = . 2(z2-b2)
NASA-Langley, 1973 32 CR-2319 81

NATIONAL AERONAUTICS AND SPACE ADMINISTRATION
WASHINGTON. D.C. 2O546
OFFICIAL BUSINESS
SPECIAL FOURTH-CLASS RATEBOOK
ATIONAL AERONAUTICS AND
SPACE ADMINISTRATION
451
POST.M.\STKH :If r i i i l r l i v r r a l l l f i S r r i i c u i 111*Postal M a n u a l ) I )n Not H i - t u r n
"The aeronautical and space activities of the United States shall beconducted so as to contribute . . . to the expansion of human knowl-edge of phenomena in the atmosphere and space. The Administrationshall provide for the widest practicable and appropriate disseminationof information concerning its activities and the results thereof."
—NATIONAL AFRONAITICS AND SPACE ACT OF 1958
NASA SCIENTIFIC AND TECHNICAL PUBLICATIONSTECHNICAL REPORTS: Scientific andtechnical information considered important,complete, and a lasting contribution to existingknowledge.
TECHNICAL NOTES: Information less broadin scope but nevertheless of importance as acontribution to existing knowledge.
TECHNICAL MEMORANDUMS:Information receiving limited distributionbecause of preliminary data, security classifica-tion, or other reasons. Also includes conferenceproceedings with either limited or unlimiteddistribution.
CONTRACTOR REPORTS: Scientific andrerhnica! information generated under a NASAcontract or grant and considered an importantcontribution to existing knowledge.
TECHNICAL TRANSLATIONS: Informationpublished in a foreign language consideredto merit NASA distribution in English.
SPECIAL PUBLICATIONS: Informationderived from or of value to NASA activities.Publications include final reports of majorprojects, monographs, data compilations,handbooks, sourcebooks, and specialbibliographies.
TECHNOLOGY UTILIZATIONPUBLICATIONS: Information on technologyused by NASA that may be of particularinterest in commercial and other non-aerospaceapplications. Publications include Tech Briefs,Technology Utilization Reports andTechnology Surveys.
De/cii/s on the availability of these pub/icofions may be obfained from:
SCIENTIFIC AND TECHNICAL INFORMATION OFFICE
N A T I O N A L A E R O N A U T I C S A N D S P A C E A D M I N I S T R A T I O N
Washington, D.C. 20546