A study of by-catches in herring bait nets in Newfoundland ...
20
C S A S Canadian Science Advisory Secretariat S C C S Secrétariat canadien de consultation scientifique * This series documents the scientific basis for the evaluation of fisheries resources in Canada. As such, it addresses the issues of the day in the time frames required and the documents it contains are not intended as definitive statements on the subjects addressed but rather as progress reports on ongoing investigations. * La présente série documente les bases scientifiques des évaluations des ressources halieutiques du Canada. Elle traite des problèmes courants selon les échéanciers dictés. Les documents qu’elle contient ne doivent pas être considérés comme des énoncés définitifs sur les sujets traités, mais plutôt comme des rapports d’étape sur les études en cours. Research documents are produced in the official language in which they are provided to the Secretariat. This document is available on the Internet at: Les documents de recherche sont publiés dans la langue officielle utilisée dans le manuscrit envoyé au Secrétariat. Ce document est disponible sur l’Internet à: http://www.dfo-mpo.gc.ca/csas/ ISSN 1480-4883 © Her Majesty the Queen in Right of Canada, 2002 © Sa majesté la Reine, Chef du Canada, 2002 Research Document 2002/031 Document de recherche 2002/031 Not to be cited without Permission of the authors * Ne pas citer sans autorisation des auteurs * A study of by-catches in herring bait nets in Newfoundland, 2001 Étude des prises accessoires dans les filets de pêche au hareng-appât à Terre-Neuve en 2001 D. G. Reddin, R. Johnson and P. Downton Science Branch Department of Fisheries and Oceans P. O. Box 5667 St. John’s, Newfoundland A1C 5X1
Transcript of A study of by-catches in herring bait nets in Newfoundland ...

C S A SCanadian Science Advisory Secretariat
S C C SSecrétariat canadien de consultation scientifique
* This series documents the scientific basis forthe evaluation of fisheries resources inCanada. As such, it addresses the issues ofthe day in the time frames required and thedocuments it contains are not intended asdefinitive statements on the subjectsaddressed but rather as progress reports onongoing investigations.
* La présente série documente les basesscientifiques des évaluations des ressourceshalieutiques du Canada. Elle traite desproblèmes courants selon les échéanciersdictés. Les documents qu’elle contient nedoivent pas être considérés comme desénoncés définitifs sur les sujets traités, maisplutôt comme des rapports d’étape sur lesétudes en cours.
Research documents are produced in theofficial language in which they are provided tothe Secretariat.
This document is available on the Internet at:
Les documents de recherche sont publiés dansla langue officielle utilisée dans le manuscritenvoyé au Secrétariat.
Ce document est disponible sur l’Internet à:http://www.dfo-mpo.gc.ca/csas/
ISSN 1480-4883© Her Majesty the Queen in Right of Canada, 2002
© Sa majesté la Reine, Chef du Canada, 2002
Research Document 2002/031 Document de recherche 2002/031
Not to be cited withoutPermission of the authors *
Ne pas citer sansautorisation des auteurs *
A study of by-catches in herring baitnets in Newfoundland, 2001
Étude des prises accessoires dansles filets de pêche au hareng-appâtà Terre-Neuve en 2001
D. G. Reddin, R. Johnson and P. Downton
Science BranchDepartment of Fisheries and Oceans
P. O. Box 5667St. John’s, Newfoundland A1C 5X1

2
ABSTRACT
The effect of bycatches of Atlantic salmon (Salmo salar) and cod (Gadus morhua)in thebait fishery in inshore Newfoundland was investigated. Levels of bycatches in 2001 wereexamined by analysing the license file for numbers of fishers and location fished,conducting a phone survey to determine how many fishers actively fished, fishingexperimentally with bait nets and traditional herring nets, surveying catches in bait nets byEnforcement Staff and studying tag returns of repeat spawners from Campbellton River.Data from DFO Licensing Section indicated that in 2001 there were about 3,600 licencedbait fishers in Newfoundland and Labrador. A phone survey of licensed bait net fishersindicated that about 46% actively fished for herring in 2001 and that bait was obtainedprincipally for the lobster (Homarus americanus) fishery followed by crab (Chionoecetesopilio) and cod fisheries. Experimental fishing was carried out in three locations and atotal of six salmon, one sea trout (Salvelinus fontinalis) and one smolt were caught.Numbers of salmon found in pelagic nets during patrols by Enforcement Staff and thenumbers of salmon reported during herring index fishery were very low. Overallconclusions, based on the information presented for 2001, were that the legal fishery forherring to use as bait has a low incidence of salmon or cod being caught but that thebycatch of pollock (Pollachius virens) could be important. Bycatches can be reduced bycontrolling the sites fished and eliminating those near salmon runs or with high bycatchesof salmonids and groundfish, setting nets at least one fathom deep, and setting nets parallelto shore where possible. The setting of nets parallel to shore may increase the bycatch ofpollock and reduce the catch of herring (Clupea harengus).
3
RÉSUMÉ
Nous avons étudié l’impact des prises accessoires de saumons atlantiques (Salmosalar) et de morues (Gadus morhua) dans la pêche côtière à l’appât à Terre-Neuve.Nous avons examiné les niveaux de prises accessoires de 2001 en effectuant uneanalyse du dossier des permis pour connaître le nombre de pêcheurs et leurs lieux depêche, un sondage téléphonique afin de déterminer le nombre de pêcheurs actifs, unepêche expérimentale à l’aide de filets de pêche de poisson-appât et de filets àharengs traditionnels, une surveillance des prises dans les filets de pêche de poisson-appât (réalisée par le personnel chargé de l’application de la loi) et une étude desrecaptures de saumons marqués ayant déjà frayés dans la rivière Campbellton. Desdonnées de la Section des permis de Pêches et Océans Canada montrent qu’il y avaiten 2001 environ 3 600 pêcheurs de poisson-appât détenteurs d’un permis à Terre-Neuve et au Labrador. Un sondage téléphonique de ces pêcheurs a révéléqu’environ 46 % d’entre eux ont pêché activement le hareng en 2001 et que lehareng-appât a principalement servi à la pêche au homard (Homarus americanus),mais aussi à la pêche au crabe des neiges (Chionoecetes opilio) et à la morue. Nousavons effectué une pêche expérimentale à trois endroits et nous avons pris au totalsix saumons, une truite de mer (Salvelinus fontinalis) et un saumoneau. Les prisesde saumons trouvées dans les filets pélagiques par le personnel chargé del’application de la loi et les prises de saumons signalées dans la pêche indicatrice duhareng étaient très peu élevées. En nous appuyant sur les données de 2001, nousconcluons que la pêche légale du hareng-appât entraîne peu de prises accessoires desaumons ou de morues, mais que les prises accessoires de goberges(Pollachius virens) pourraient être importantes. Le nombre de prises accessoirespeut être diminué en interdisant la pêche près des parcours de migration du saumonou aux endroits où les prises accessoires de salmonidés et de poissons de fond sontimportantes, et en plaçant les filets à au moins une brasse de profondeur et, sipossible, parallèlement à la rive. Les prises accessoires de goberges pourraientaugmenter et les prises de harengs (Clupea harengus) diminuer dans des filetsmouillés parallèlement à la rive.
4
INTRODUCTION
Many species of fish are currently low in abundance in Atlantic Canada. This is especiallyso for Atlantic salmon, a species which is currently declining over most of its range inNorth America (Anon. 2000). As well, Atlantic cod is in low abundance at least in someareas of the Newfoundland Region (Anon. 2001). The causes of these declines havevariously been attributed to fishing and climate (Dempson et al. 1998). Fishing gear and,in particular gillnets, while being directed at one species frequently catch other non-targeted species. The catches of these other species, labelled bycatches, frequently gounrecorded particularly when it is illegal to retain them. Bycatches are frequently blamedas the cause of declines of some of these non-target species and such is the case withsalmon. Therefore, it is important to examine and quantify the magnitude of bycatches inall fishing gear.
The main focus of this project was to assess the numbers and species caught in pelagic gearfished to catch herring and mackerel (Scomber scombrus) for bait. In addition, thepotential for reducing bycatches by setting gear parallel to shore compared to perpendicularwas examined.
METHODS
The approaches used to examine the level of bycatches in nets set for bait were severalfold. We examined the licensing data to learn about the amount of gear being fished andit’s distribution. The relative magnitude of bycatches was investigated through records ofFisheries and Oceans made by Enforcement Staff, a phone survey of bait net fishermen,experimental fishing by nets set for bait and in other experimental gear. Effect of bait netson a single salmon stock were derived from the results of tagging experiments carried outon repeat spawning salmon at Campbellton River.
Licence Data
The Fisheries and Oceans (DFO) Licensing Section is responsible for issuing licenses tofishers for all species fished. The Licensing Section provided information current to 27April, 2001 on fishers name and home port, fishing area, and NAFO Division.
Telephone Survey of Bait Net Fishers
A telephone survey was conducted using the data received from the Licensing Section tocontact fishers for more detailed information on their fishing activities. In total, 1,211 baitnet fishers out of 3,538 licensed were contacted and asked the following questions:
1. Did you actively fish bait nets in 2001?2. What community did you fish from?3. What type of bait net was fished, i.e. herring, flounder or both?4. Number of nets actively fished?

5
5. Fathoms of net actively fished?6. Date when fishing began and ended in 2001?7. What fishery was the bait used for?8. Species and numbers of fish caught other than herring?
Herring Index Fishery
In 2001, Herring Index Fishers were asked to record the catch of all species in the herringindex fishery nets. The intent of the herring index fishery is to collect information essentialto the herring stock assessment program and as such utilises standard herring gill netsfished at standard locations and dates (Wheeler et al. 1999). At each site, there was about164 m of net fished divided equally into nets of mesh sizes 51 mm, 57 mm, 64 mm, 70 mm,and 76 mm.
Surveys by Enforcement Staff
Fisheries and Oceans Enforcement Staff were requested to record the number of pelagicgill nets that were checked during their marine patrols. Also date, location and numbersand species of fish in the net when hauled were recorded.
Experimental Fishing
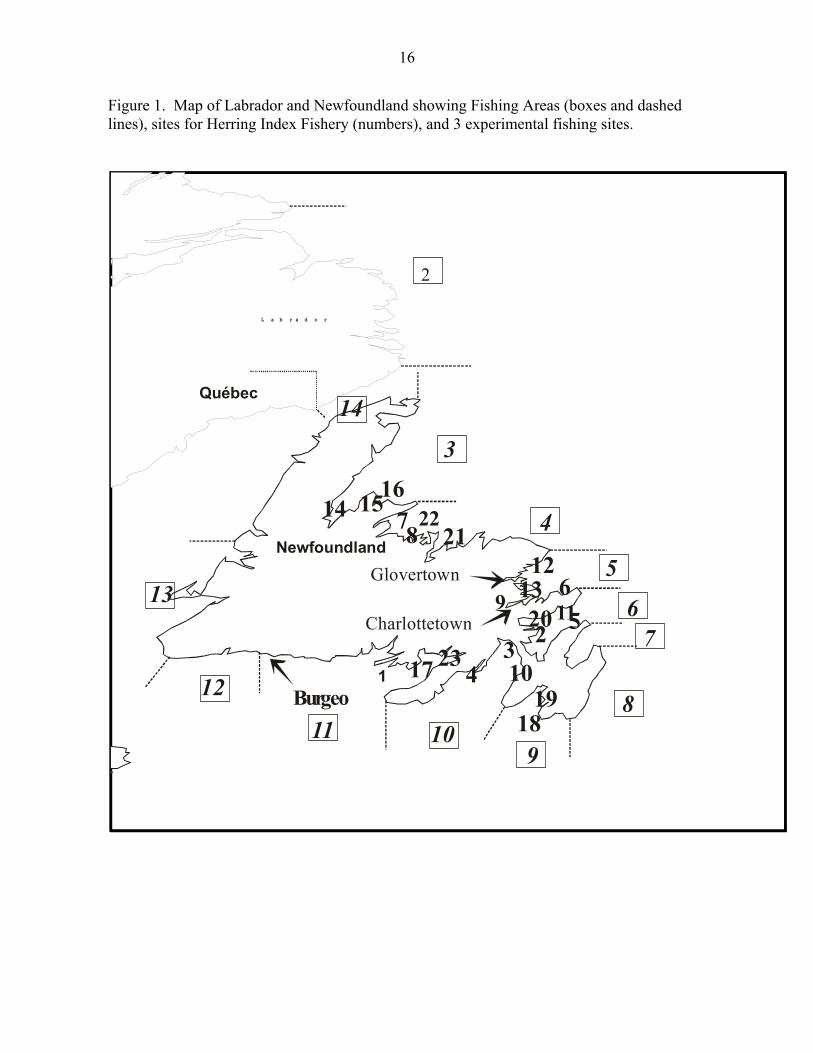
In order to provide an independent source of information on species potentially retained ingill nets set for bait, four sites were selected to conduct experimental fishing. The netswere checked daily and catch removed and recorded. Fisheries and Oceans Staff werepresent at all times when the nets were checked and Fisheries and Oceans staff recordedspecies and numbers of fish caught. The four sites were at Charlottetown and Glovertownboth in Bonavista Bay, Burgeo on the South Coast, and in St. Mary’s Bay (Fig. 1). The sitein St. Mary’s Bay was dropped as the bait fishery there had closed. Fishers were hired toset and haul their own gear in locations where bait nets had previously been set. ResourceManagement chose the general locations and specific fishers were hired on the basis ofrecommendations made by the Fishery Officer in the area.
Charlottetown: Charlottetown is located in Clode Sound along the east side of BonavistaBay. Three salmon rivers run into this sound: Northwest River, Southwest River andSalmon River. Salmon returning to any of these rivers would pass by the Charlottetownarea and the experimental bait nets set there. The nets in this area are set close to thecommunity and are all within visual range of the community. The nets were set paralleland perpendicular to shore but in a manner to reflect the bait fishery norm in the area.
Glovertown: is located in Bonavista Bay at the mouth of the Terra Nova River, a majorsalmon river. The nets were set parallel and perpendicular to shore but in a manner to

6
reflect the bait fishery norm in the area. The nets in this site are approximately 12 km (6miles) from Glovertown, just outside the caution signs for the Terra Nova River.
Burgeo: is located on the south coast of Newfoundland with several salmon rivers in itsimmediate vicinity. The bait fishery in this area is the most active of the three areasstudied as there is a hook and line cod fishery there requiring bait. The cod fishery is basedon an individual quota system and as such it continues on for a longer period of the yearthan in other areas and bait is required longer and later in the season than in the other studyareas. The nets were set parallel and perpendicular to shore but in a manner to reflect thebait fishery norm in the area.
Effects on salmon stock in Campbellton River
In order to demonstrate the effect of bait nets on a salmon stock, Floy tagging data fromrepeat spawners previously published for Campbellton River was utilized. Number of tagsrecovered were expressed as a percent of the total and per 1000 returns to the countingfence at Campbellton River. Details on the Floy tagging study are given in Downton et al.(2001).
RESULTS
Licence data
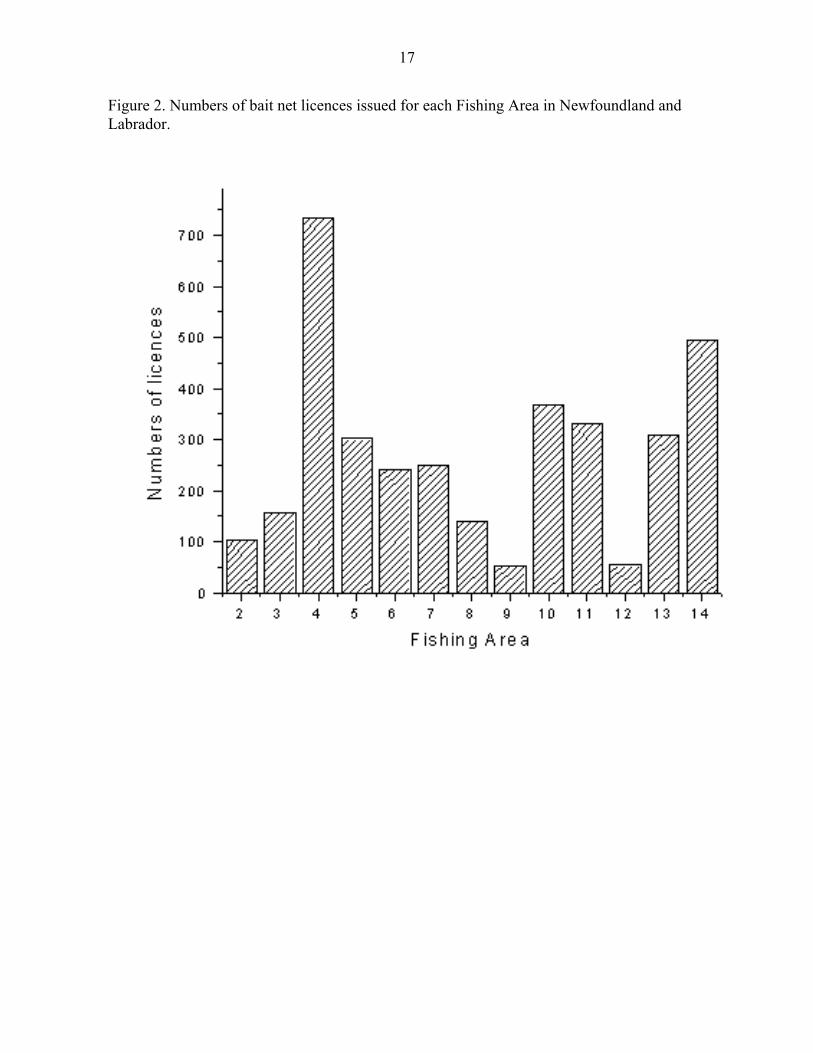
There were 3,538 bait net licenses issued by Fisheries and Oceans as of 27 April, 2001(Table 1). They are distributed around the island of Newfoundland and along the coast ofsouthern Labrador (Fig. 2). The highest concentration of bait net licences inNewfoundland is in Fishing Area 4 with 20.8% of the total number of licences and thelowest is in Fishing Area 12 with 1.5%. There were no licenses issued for Fishing Area 1in northern Labrador. Each licencee is permitted to fish two nets of maximum length of 40fathoms and maximum mesh size of 67 mm. In order to receive a licence to fish for baitthey must have a valid fishing licence for a species requiring bait, i.e. lobster. Nets must beset one fathom below the surface of the water and in Fishing Areas 12-14 in westernNewfoundland all nets must be set parallel to the shore.
Telephone survey of bait net fishers
In total, 1,211 or about 34% of 2001 bait net licencees were contacted by phone and, ofthese, 557 fished for herring for bait in 2001. The other licencees either did not fish orfished exclusively for winter flounder (Pseudopleuronectes americanus) to use as bait. Itis important to differentiate between those fishers setting nets for herring as bait from thosesetting nets for winter flounder. This is because bait nets for flounder are set on the bottomand as such would have minimal bycatch of salmonids. Most active fishers were fishingfor herring and mackerel and also for flounder with only a few fishing solely for flounder.
7
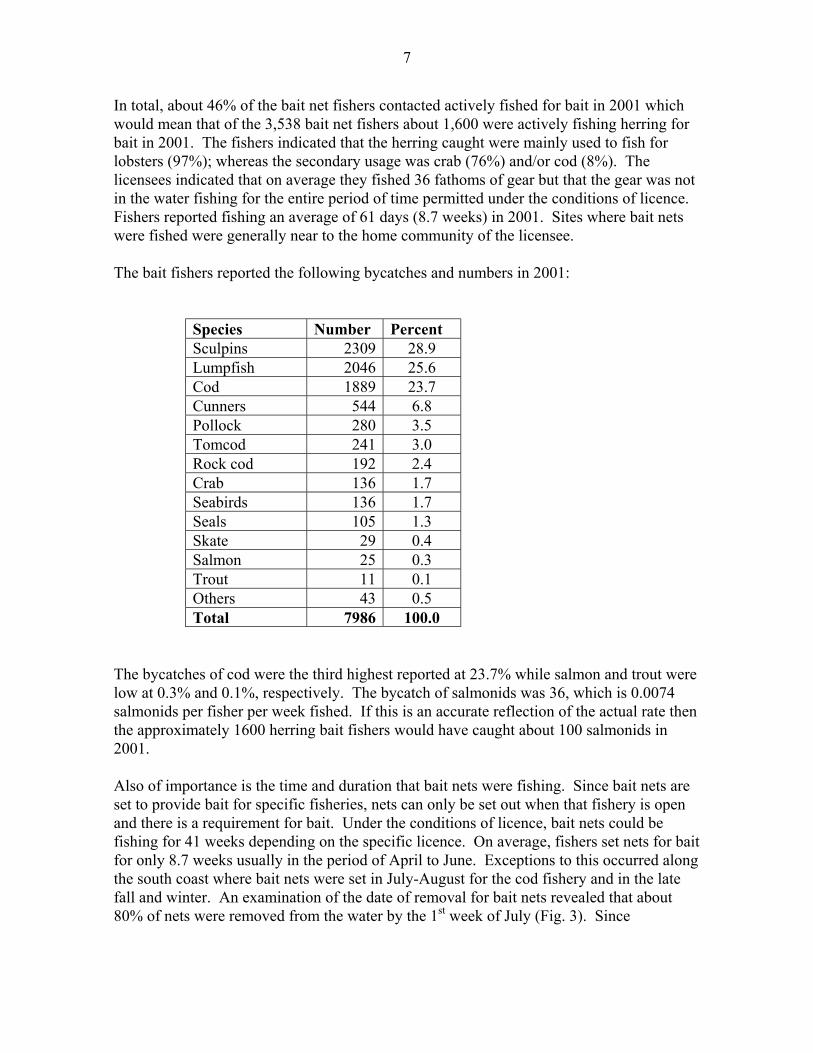
In total, about 46% of the bait net fishers contacted actively fished for bait in 2001 whichwould mean that of the 3,538 bait net fishers about 1,600 were actively fishing herring forbait in 2001. The fishers indicated that the herring caught were mainly used to fish forlobsters (97%); whereas the secondary usage was crab (76%) and/or cod (8%). Thelicensees indicated that on average they fished 36 fathoms of gear but that the gear was notin the water fishing for the entire period of time permitted under the conditions of licence.Fishers reported fishing an average of 61 days (8.7 weeks) in 2001. Sites where bait netswere fished were generally near to the home community of the licensee.
The bait fishers reported the following bycatches and numbers in 2001:
Species Number PercentSculpins 2309 28.9Lumpfish 2046 25.6Cod 1889 23.7Cunners 544 6.8Pollock 280 3.5Tomcod 241 3.0Rock cod 192 2.4Crab 136 1.7Seabirds 136 1.7Seals 105 1.3Skate 29 0.4Salmon 25 0.3Trout 11 0.1Others 43 0.5Total 7986 100.0
The bycatches of cod were the third highest reported at 23.7% while salmon and trout werelow at 0.3% and 0.1%, respectively. The bycatch of salmonids was 36, which is 0.0074salmonids per fisher per week fished. If this is an accurate reflection of the actual rate thenthe approximately 1600 herring bait fishers would have caught about 100 salmonids in2001.
Also of importance is the time and duration that bait nets were fishing. Since bait nets areset to provide bait for specific fisheries, nets can only be set out when that fishery is openand there is a requirement for bait. Under the conditions of licence, bait nets could befishing for 41 weeks depending on the specific licence. On average, fishers set nets for baitfor only 8.7 weeks usually in the period of April to June. Exceptions to this occurred alongthe south coast where bait nets were set in July-August for the cod fishery and in the latefall and winter. An examination of the date of removal for bait nets revealed that about80% of nets were removed from the water by the 1st week of July (Fig. 3). Since

8
substantial salmon runs occur in the July-August period and as most bait nets were out ofthe water in 2001 at this time, potential bycatch is obviously minimized during this time.
Herring Index Fishery
In total, there were 23 Herring Index Fishers in 2001. They are distributed from White Bayin Fishing Area 3 to Fortune Bay in Fishing Area 11 (Table 2, Fig. 1). There were none inFishing Areas 12 – 14 on the West Coast. Fishing dates ranged from 31 March to 20 Julyfor a total of 777 fishing days. The gear is different than bait nets in that the herring indexnets are constructed much deeper than typical bait nets. Also, the mesh sizes fished rangedfrom 51 to 76 mm while bait nets are restricted to mesh sizes less than 67 mm. Thesedifferences in the type of gear should lead to greater catch efficiency for the index fisherynets compared to bait nets, i.e. the catch of salmon would be potentially higher in the indexnets. In total, there were eight salmonids caught and reported by the 23 fishers in 2001.The eight salmon were repeat spawners and were caught in Notre Dame Bay by the samefisher. There were no other salmonids reported. There were 0.07 salmon caught by indexfishers for each week fished.
Surveys by Enforcement Staff
During patrols of coastal waters by Fisheries and Oceans Enforcement Staff, there were889 pelagic gillnets checked for violations during May to October. In total, there were 20salmon found during coastal patrols.
Experimental Fishing
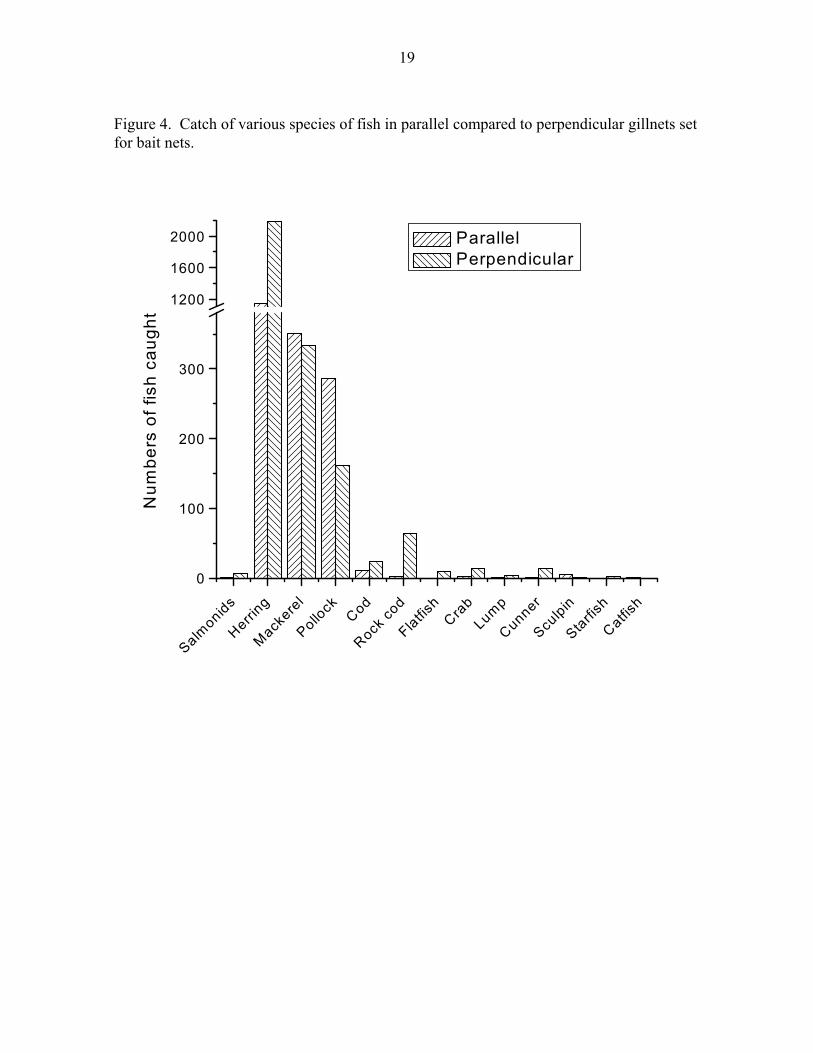
Experimental fishing was conducted at three sites (Charlottetown, Glovertown, andBurgeo) during June to August, 2001 (Table 3, Fig. 1). The most common species caughtduring the experimental fishing were herring and mackerel supporting the contention thatthe nets were set in potential bait net berths (Fig. 4). In total, there were eight salmonidscaught at the three sites during the experimental fishing. The eight fish consisted of sixsalmon, one salmon postsmolt, and one sea brook trout. There were no salmonids caught atCharlottetown while six salmonids were caught at Glovertown and two at Burgeo. Theeight salmonids were caught over a total of about 7 weeks of fishing for a rate of 1.2salmonids per week. Of the eight salmonids caught only one was caught in the nets setparallel to shore and seven were caught in the perpendicular set nets (Fig. 4). While lowoverall these results would tend to support the benefits of reducing salmonid bycatch bysetting all bait nets parallel to shore, wherever possible. Also of note is that the fishersinvolved in the study reported that bycatches of salmon in herring gear were rare in theirareas, in spite of their proximity to major salmon rivers.
There were also several other species caught in the experimental nets besides salmonids,mackerel and herring (Table 3). Pollock were the most abundant of the other species
9
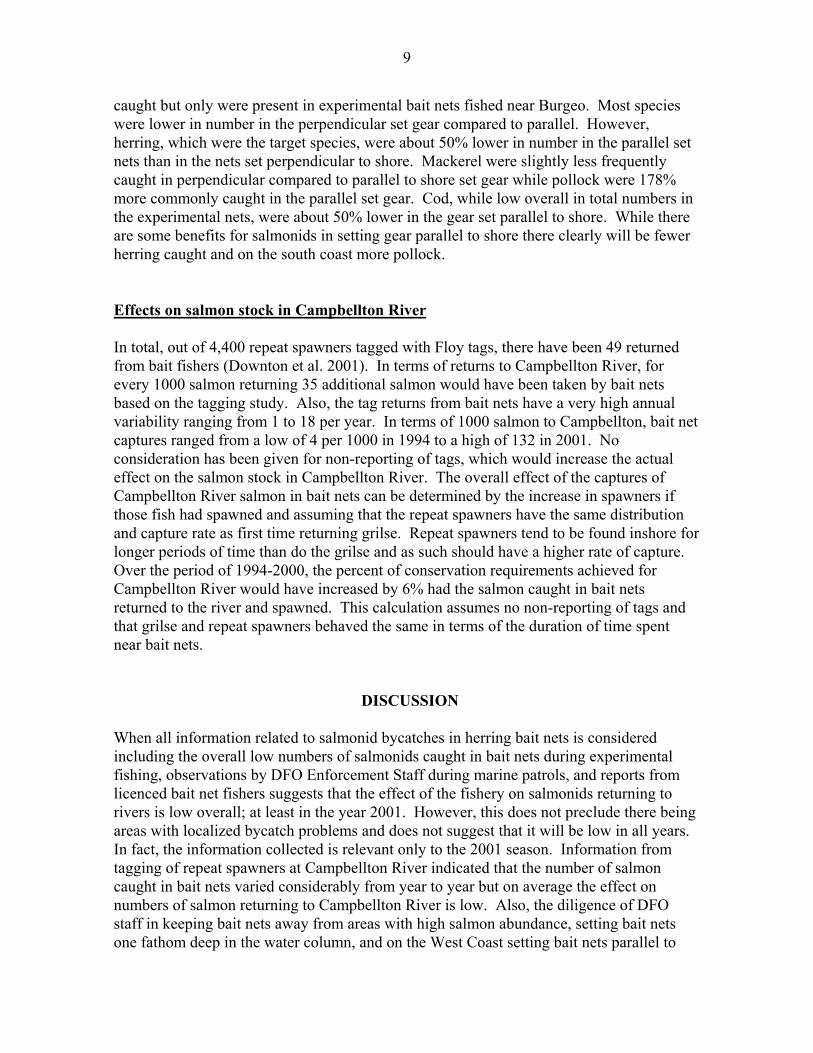
caught but only were present in experimental bait nets fished near Burgeo. Most specieswere lower in number in the perpendicular set gear compared to parallel. However,herring, which were the target species, were about 50% lower in number in the parallel setnets than in the nets set perpendicular to shore. Mackerel were slightly less frequentlycaught in perpendicular compared to parallel to shore set gear while pollock were 178%more commonly caught in the parallel set gear. Cod, while low overall in total numbers inthe experimental nets, were about 50% lower in the gear set parallel to shore. While thereare some benefits for salmonids in setting gear parallel to shore there clearly will be fewerherring caught and on the south coast more pollock.
Effects on salmon stock in Campbellton River
In total, out of 4,400 repeat spawners tagged with Floy tags, there have been 49 returnedfrom bait fishers (Downton et al. 2001). In terms of returns to Campbellton River, forevery 1000 salmon returning 35 additional salmon would have been taken by bait netsbased on the tagging study. Also, the tag returns from bait nets have a very high annualvariability ranging from 1 to 18 per year. In terms of 1000 salmon to Campbellton, bait netcaptures ranged from a low of 4 per 1000 in 1994 to a high of 132 in 2001. Noconsideration has been given for non-reporting of tags, which would increase the actualeffect on the salmon stock in Campbellton River. The overall effect of the captures ofCampbellton River salmon in bait nets can be determined by the increase in spawners ifthose fish had spawned and assuming that the repeat spawners have the same distributionand capture rate as first time returning grilse. Repeat spawners tend to be found inshore forlonger periods of time than do the grilse and as such should have a higher rate of capture.Over the period of 1994-2000, the percent of conservation requirements achieved forCampbellton River would have increased by 6% had the salmon caught in bait netsreturned to the river and spawned. This calculation assumes no non-reporting of tags andthat grilse and repeat spawners behaved the same in terms of the duration of time spentnear bait nets.
DISCUSSION
When all information related to salmonid bycatches in herring bait nets is consideredincluding the overall low numbers of salmonids caught in bait nets during experimentalfishing, observations by DFO Enforcement Staff during marine patrols, and reports fromlicenced bait net fishers suggests that the effect of the fishery on salmonids returning torivers is low overall; at least in the year 2001. However, this does not preclude there beingareas with localized bycatch problems and does not suggest that it will be low in all years.In fact, the information collected is relevant only to the 2001 season. Information fromtagging of repeat spawners at Campbellton River indicated that the number of salmoncaught in bait nets varied considerably from year to year but on average the effect onnumbers of salmon returning to Campbellton River is low. Also, the diligence of DFOstaff in keeping bait nets away from areas with high salmon abundance, setting bait netsone fathom deep in the water column, and on the West Coast setting bait nets parallel to

10
shore should help in keeping salmonid bycatch low. Furthermore, as a disincentive, anyfisher with lucrative fishing licences such as lobster or crab could potentially lose the rightto fish by abusing their fishing privileges by purposely trying to catch salmon under theguise of fishing for bait. The bycatch of cod was also low overall. Other than the targetspecies of herring and mackerel, pollock occurred in the highest numbers but only inexperimental fishing near Burgeo. Pollock were also more numerous in nets set parallel toshore rather than perpendicular. The high bycatch of pollock is probably due to the factthat different from cod and other groundfish, pollock spends much of its time movingthrough the water column rather than on the bottom (Scott and Scott 1988).
Reddin (1978) from a survey of DFO Enforcement Staff provided estimates of bycatch invarious types of non-salmon gear including herring bait nets. It was estimated that 29% ofsalmon landings in 1976 on the Island of Newfoundland occurred as a bycatch in non-salmon gear. Overall, it was estimated that bait nets took 64% of the total bycatch. Also,Reddin (1978) indicated from catches in salmon research gear that 95% of the salmoncaught were in the upper 2 m of net. It was from this study that the requirement arose toset the headropes of herring bait nets at least one fathom deep in the water. Also at thattime Enforcement Staff were directed to ensure that nets were not set in areas withpotentially high numbers of salmon. It is presumably these changes and perhaps annualvariability that has reduced the problem of salmonid bycatches in bait net gear.
Dempson et al. (1999) reported numbers of salmon observed at counting facilities withmarks, some of which occurred due to encounters with fishing gear. The percentages ofsalmon so marked, varied from site to site as well as annually, but generally were less than20%. Are the numbers of marked salmon consistent with a low overall removal ormortality due to bait net gear? There are several different types of fishing gear in thewater, both legal and illegal, that can potentially mark salmon including salmon gear set bypoachers both in freshwater and in the sea. Also, predators can be responsible for some ofthese marks. In addition, for salmon returning to rivers along the south coast of the islandof Newfoundland there is a legal, albeit small, commercial and recreational net fishery inSt. Pierre-Miquelon area that can mark salmon. Because the numbers of salmon involvedcannot be quantified it is impossible to judge if overall numbers of marked salmon areconsistent with low levels of bycatch in bait nets.
Fishing for bait is an important aspect of fishing activities due to high cost of bait and theincreased need for bait with the development of the inshore crab fishery. The lower quotasof groundfish available for harvest in many areas in the last few years also means theprofitability of fishing enterprises has decreased dramatically making the need forinexpensive bait more important. In spite of the requirement for bait, it is essential toexamine the level of bycatches of all species in each directed fishery as levels of mortalityare becoming critical for some species. This is especially so for cod and salmon that haveexperienced significant declines in abundance in recent years. For salmon, the return ratesto counting facilities in some areas are lower than when there was a commercial salmonfishery.
11
Overall conclusion is that the bait fishery where gear is legitimately set for herring ishaving little effect on salmon returns; at least from information on the 2001 fishery. Also,the bycatch of cod in bait nets appears to be minimal. However, bycatch of pollock alongthe south coast was high. It is recommended that bait nets continue to be set at least onefathom deep in the water. The requirement on the west coast of Newfoundland to set netsparallel to shore rather than perpendicular should be expanded to other areas of theprovince where and when practical to do so. However, Resource Managers should beaware that in some areas of the south coast setting nets parallel to shore will increase thebycatch of pollock and for all areas will decrease the catch of herring. Also, there could besome sites where bycatches of salmonids are of concern and DFO Enforcement Staffshould continue efforts to ensure that bait nets are kept away from areas of potentially highsalmon abundance. Since the need for bait is reduced by mid-June in most areas of theisland of Newfoundland, requiring the removal of bait nets while salmon are running alongthe coast would appear to be potentially a very effective method for reducing salmonidbycatch further and should be considered.
ACKNOWLEDGEMENTS
The assistance of fishers Dennis Chaulk Sr., Dennis Chaulk Jr., Frank Oram, and JimDominey is gratefully acknowledged. DFO Enforcement and Resource Management staffwho were involved at several stages of planning and execution of this project were essential toits success.
12
REFERENCES
Anon. 2000. Report of the Working Group on North Atlantic Salmon. ICES CM2000/ACFM:13, 301 p.
Anon. 2001. Northern (2J+3KL) Cod. CSAS Stock Status Report A2-01. 16 p.
Dempson, J.B., D.G. Reddin, M.F. O’Connell, J. Helbig, C.E. Bourgeois, C. Mullins, T.R.Porter, G. Lilly, J. Carscadden, G.B. Stenson, and D. Kulka. 1998. Spatial andtemporal vaiation in Atlantic salmon abundance in the Newfoundland-Labradorregion with emphasis on factors that may have contributed to low returns in 1997.CSAS Res. Doc. 98/114, 161 p.
Downton, P. R., D. G. Reddin, and R. W. Johnson. 2001. The status of Atlantic salmon(Salmo salar L.) in Campbellton River, Notre Dame Bay (SFA 4), Newfoundland in2000. DFO, CSAS Res. Doc. 2001/034, 73 p.
Reddin, D. 1978. Report on the salmon by-catch in miscellaneous marine fishing gear,1976, Newfoundland and Labrador. Fish. Mar. Serv. MS Rep. 1461: 23 p.
Scott, W. B. and M. G. Scott. 1988. Atlantic fishes of Canada. Can. Bull. Fish. Aquat.Sci. 219: 713 p.
Wheeler, J.P., B. Squires, and P. Williams. 1999. Newfoundland East and Southeast CoastHerring - An Assessment of Stocks to the Spring of 1998. CSAS Res. Doc.1999/13.

13
Table 1. Extant bait net licences issued by Licencing Section, DFO, St. John’s,Newfoundland as of 27 April, 2001.
Fishing Area Number Percent1 0 02 102 2.93 156 4.44 734 20.85 302 8.56 242 6.87 250 7.18 141 4.09 53 1.510 368 10.411 331 9.412 54 1.513 310 8.814 495 14.0Total 3538 100.0

14
Table 2. List of herring index fishers and activities including bycatch of salmonids in 2001.
Fishing Days Net Headrope Bottom Gear SalmonNumber Area Area Start End Fished type Depth (m) Depth (m) Amount (m) Caught
1 11 Harbour Breton, South Coast 30-Apr 1-Jun 33 Deep 2 37 152 02 6 Thornlea, Trinity Bay 20-Apr 13-Jun 51 Deep 2 15 152 03 10 Swift Current, Placentia Bay 2-Apr 1-May 30 Deep 2 18 152 04 10 Red Hr. Placentia Bay 14-May 8-Jun 26 Deep 1 13 152 05 6 Heart's Content, Trinity Bay 7-May 8-Jun 33 Deep 0.5 22 152 06 5 Tickle Cove, Bonavista Bay 6-May 6-Jun 26 Deep 1 18 15 07 4 Jacksons Cove, Notre Dame Bay 11-Jun 11-Jul 31 Deep 2 37 152 08 4 Leading Tickles, Notre Dame Bay 2-Jun 2-Jul 31 Deep 1-2 25 152 09 5 Charlottetown, Bonavista Bay 1-Jun 30-Jun 30 Deep 2 25 152 010 10 Long Hr., Placentia Bay 6-Apr 5-May 30 Deep 4 27 152 011 6 New Bonaventure, Trinity Bay 14-May 20-Jul 49 Deep 2 20 152 012 5 Wareham/ Fair Is., Bonavista Bay 21-May 19-Jun 30 Deep 1 19 152 013 5 Salvage, Bonavista Bay 18-May 1-Jul 45 Deep 1 20 - 014 3 Sop's Arm, White Bay 24-Jun 20-Jul 27 Deep 2 21 152 015 3 Westport, White Bay 8-Jun 9-Jul 32 Deep 1 22 152 016 3 Ming's Bight, Baie Vert Peninsula 28-May 27-Jun 31 Deep 2 18 152 017 11 Belloram, Fortune Bay 21-Apr 15-May 25 Deep 4 128 152 018 9 Mall Bay, St. Marys Bay 20-Apr 25-May 44 Deep 1 17 152 019 9 O'Donnells, St. Marys Bay 5-May 14-Jun 41 Deep 2 22 152 020 6 Hickman's Hr., Trinity Bay 12-May 15-Jun 30 Deep 4 37 152 021 4 Herring Neck, Notre Dame Bay 7-May 18-Jun 43 Deep 2 22 152 022 4 Point au Bay, Notre Dame Bay 7-May 2-Jun 27 Deep 1 11 152 823 11 Harbour Mille, Fortune Bay 31-Mar 1-May 32 Deep 4 32 152 0
Date

15
Table 3. Summary of results from experimental fishing in Newfoundland, 2001.
No. of CatchArea Fishing dates nets Orientation Salmon Smolt Trout Herring Mackerel PollockCod Tom cod Rock cod FlatfishCrab Lump Cunner Sculpin StarfishCatfish
Charlottetown June 11 - June 23 2 Parallel 0 0 0 94 0 0 9 2 3 0 3 1 1 3 0 13 Perpendicular 0 0 0 1132 0 0 15 0 54 10 14 4 14 1 3 0
Glovertown June 13 - June 23 2 Parallel 0 0 0 42 0 0 0 0 0 0 0 0 0 0 0 02 Perpendicular 4 1 1 63 0 0 6 0 10 0 0 0 0 0 0 0
Burgeo June 27 - July 3 2 Parallel 1 0 0 236 241 221 0 0 0 0 0 0 0 0 0 02 Perpendicular 1 0 0 230 25 158 2 0 0 0 0 0 0 0 0 0
Burgeo July 4 - 10 1 Parallel 0 0 0 195 54 0 0 0 0 0 0 0 0 0 0 02 Perpendicular 0 0 0 256 190 3 0 0 0 0 0 0 0 0 0 0
Burgeo August 6 - 12 2 Parallel 0 0 0 576 56 65 0 0 0 0 0 0 0 2 0 02 Perpendicular 0 0 0 515 119 0 0 0 0 0 0 0 0 0 0 0
Burgeo total All dates 5 Parallel 1 0 0 1007 351 286 0 0 0 0 0 0 0 2 0 06 Perpendicular 1 0 0 1001 334 161 2 0 0 0 0 0 0 0 0 0
All sites All dates Parallel 1 0 0 1143 351 286 9 2 3 0 3 1 1 5 0 1Perpendicular 5 1 1 2196 334 161 23 0 64 10 14 4 14 1 3 0
Totals 6 1 1 3339 685 447 32 2 67 10 17 5 15 6 3 1
16
Figure 1. Map of Labrador and Newfoundland showing Fishing Areas (boxes and dashedlines), sites for Herring Index Fishery (numbers), and 3 experimental fishing sites.
L a b r a d o r
Québec
1
2
4
56
78
9
10
11
12
14 1516
17
1819
20
2122
23 3
Burgeo
GlovertownNewfoundland
Charlottetown
2
3
4
5
67
8
91011
12
13
14
17
Figure 2. Numbers of bait net licences issued for each Fishing Area in Newfoundland andLabrador.

18
Figure 3. Counts and cumulative counts of date of setting out (left) and removal (right) ofbait nets in Newfoundland, 2001.
0.010.1
1
5
20406080
95
99
99.9
Feb 15Mar 7
Mar 27Apr 16
May 6May 26
Jun 15Jul 5
Jul 25Aug 14
0
50
100
150
200
250
300
Cou
nts
Cum
ulat
ive
Cou
nts
0.1
1
5
204060
80
95
99
99.9
May 6
May 26
Jun 15
Jul 5
Jul 2
5
Aug 14Sep 3
0
50
100
150
200
250
300
Cou
nts
Cum
ulat
ive
Cou
nts
19
Figure 4. Catch of various species of fish in parallel compared to perpendicular gillnets setfor bait nets.
Salmonids
Herring
Mackere
l
Pollock Cod
Rock co
d
Flatfish
Crab
Lump
Cunner
Sculpin
Starfish
Catfish
0
100
200
300
1200
1600
2000
Num
bers
of f
ish
caug
ht
Parallel Perpendicular