A Study into Membership Attrition and Retention at Golf...
36
A Study into Membership Attrition and Retention at Golf Clubs in Queensland - September 2009
Transcript of A Study into Membership Attrition and Retention at Golf...

A Study into Membership Attrition and Retention at Golf Clubs in Queensland
- September 2009


Golf Queensland - Membership Attrition & Retention Report - 2009
3
FORWARD
As the peak body for golf clubs and district associations in Queensland, Golf
Queensland is pleased to present the first study of attrition and retention of golf club membership conducted within Australia.
The study is part of an overall objective of Golf Queensland’s strategic plans to assist clubs improve and retain membership levels.
This objective is of growing importance as it is very apparent that, like other States of Australia, Queensland golf clubs have generally been experiencing a slow decline in membership numbers over a number of years.
Golf Queensland has determined that a proactive stance should be taken to meet this challenge and this study was commissioned to take the important first step in developing an understanding of the membership participation dynamics in Queensland.
As well as raising awareness of such trends, the study report provides practical strategies that can be used by clubs to improve membership retention.
It should be noted this material is intended as a starting point and not an end in itself.
We hope the study’s findings andrecommendations will be used at the club committee or management level as a stimulus for discussions on how the individual club can better address the membership challenge.
Golf Queensland will also follow up with the development of other resources and the sharing of information at various forums. I commend the report to all golf club and district administrators.
Lindsay Ellis
CEO Golf Queensland

Golf Queensland - Membership Attrition & Retention Report - 2009
4INTRODUCTION
As the golf industry faces a myriad of wider challenges in the early 21st
century, demand for golf club membership in Queensland is currently in decline. Notwithstanding the importance of generating new member demand, in the current economic climate, membership retention in golf clubs is now equally as important.
Actively developing strategies to reduce membership attrition will offer the industry some protection as adult lifestyles change to meet the demands of modern living. Developing such strategies may also negate any slowdown in state population growth and associated new member demand.
Should membership attrition rates be reduced, all parts of the golf industry will benefit as the industry truly capitalises on the underlying new demand for golf club membership that does currently exist.
As the revenue stream to Golf Queensland from future member capitation fees increases, more funds will be available to further develop golf in the state of Queensland.
In order to make a positive impact on retention and reduce attrition, the respective retention and attrition rates currently and historically evident in the market must first be established.
Golf Queensland has therefore engaged Jeff Blunden Advisory Services (JBAS) to undertake such a study so that these numbers can be identified, as well as providing a number of strategies which will aid in the greater retention of club members across Queensland.
Once this detail is established, Golf Queensland will be better equiped to assist clubs to develop their own strategies in the area of membership retention.
Report BackgroundIntroduction
A• nalysis of current and historical membership data provided by Golf Queensland.Analysis of the new member numbers •recorded per club, by gender for the period 2005 to 2008, as provided by Golflink.The joint analysis of both datasets to •determine by club, by gender and by region, the attrition rates historically recorded at clubs in Queensland.
The development and delivery of an •on-line club survey, which sought from each club in Queensland information about the retention strategies currently employed at their clubs. The development and explanation of a •number of strategies which will aid in the greater retention of members across Queensland.
Scope of WorksThe following scope of works was undertaken in the delivery of this report:

Golf Queensland - Membership Attrition & Retention Report - 2009
5
INTRODUCTION
Contents Population 6 Historical population & club membership trends
Population Growth Population Distribution Key Points - Population Membership 10 Queensland club membership analysis
Historical trends Membership growth vs population growth State golf participation rates Club membership numbers by gender Geographic regions Club membership numbers by region Regional share Key Points - Membership Attrition 16 Queensland Club Membership attrition statistics
Introduction New Members New member gender mix Lost members Market attrition rate Attrition by gender Analysis by club size Lost members by club size Key Points - Club attrition
Retention Strategies 24 Membership retention strategies
Introduction Club survey results The wider market Member satisfaction Member playing patterns The club product and value proposition Member survey detail Transition of junior members Retention checklist Survey findings and conclusion
Addendum 32 Clubs by region

Golf Queensland - Membership Attrition & Retention Report - 2009
6POPULATION
Demand for any product or service is a factor of the market that can potentially consume it. In the golf industry’s case, demand for golf club membership is therefore a factor of the size of the local population that services a club.
Given this natural link, a review of total population numbers and the movement seen in the Queensland market is appropriate as it assists in putting club membership numbers and trends into a wider market context.
The state of Queensland has enjoyed considerable population growth in the past thirty years. Government records show that total population in the state has grown by nearly 110% since 1976 and is currently estimated at 4.35 million people.
Since 2001, growth of 20% has been recorded, largely fuelled by overseas migration and natural population increases. As a result the average annual population growth rate of 2.5% is a whole percentage point higher than the national average over the past 10 years.
Estimated Queensland population at 31 December 2008:
Queensland 4,349,500Australia 21,643,900Qld share of national population 20.1%
Population growth (12 months to 31 December 2008):
Queensland 2.5%Australia 1.9%Qld share of national growth 26.3%
Queensland components of population increase:
12 mths to Dec 2008 % of growth
Net overseas migration 49,700 46.6Natural increase 35,800 33.5Net interstate migration 21,200 19.9Total 106,700 100.0
Historical Population and Club Membership Trends

Golf Queensland - Membership Attrition & Retention Report - 2009
7
POPULATION
Analysis of population data reveals that the population level in the south east corner has grown by 17% since 2001, slightly above the wider state growth rate of 15% over the same period.
It is more than double that of the inland regional area, where a 7% increase in population has been recorded since 2001.Results by region are summarised in the following table.
Source: ABS; Regional Population Growth, Australia, Cat. No. 3218.0 (1996 to 2006); Population by Age and Sex,
Regions of Australia, Cat. No. 3235.0 (2007).
Note *: Metropolitan region is defined as Brisbane Statistical Region
Region 2001 2007 % Change
Metropolitan * 1,629,133 1,856,966 14%
Other South East 1,126,598 1,343,903 19%
Total South East 2,308,888 2,695,601 17%
Regional – coastal 970,207 1,111,362 15%
Regional – inland 349,851 374,468 7%
Regional – Total 1,320,058 1,485,830 13%
Total 3,628,946 4,181,431 15%
Population Growth
The specific government statistical areas with the higher levels of growth within each of the regions areas follows:
• Other SEQ: Gold Coast +24% Sunshine Coast +23%• Regional Inland: West Moreton +13%• Regional Coastal: Mackay +19% Far North +13% Northern +13% Far North +13% Fitzroy +12%

Golf Queensland - Membership Attrition & Retention Report - 2009
8POPULATION
Key Points - Population
Population in the state has grown by nearly 110% since 1976 and is currently estimated ›
at 4.35 million people.
Since 2001, growth of 20% has been recorded largely fuelled by overseas migration and ›
natural population increases.
The average annual population growth rate of 2.5% is a whole percentage point higher ›
than the national average over the past 10 years.
Population in the south east segment has grown by 17% since 2001, slightly above the ›
wider state growth rate of 15% for the same period.
The inland regional areas have recorded a 7% increase in the population base since ›
2001.
The south east corner of Queensland now accounts for over 75% of Queensland’s total ›
population.
SOURCE: ABS; Regional Population Growth, Australia, Cat. No. 3218.0 (1996 to 2006); Population by Age and Sex,
Regions of Australia, Cat. No. 3235.0 (2007)
The south east corner of Queensland now accounts for over 75% of Queensland’s total population. In the past ten years this geographic mix has changed only slightly with the south eastern segment mix growing by approximately 2% points.
This has been driven by growth in non metropolitan areas, and the regional mix has declined by the same amount.
This growth has resulted in the following geographic distribution of Queensland’s population base.
Metropolitan 44%•
Other SE QLD 32%•
Regional Coastal 20%•
Regional Inland 3% •
Population Distribution
Geographical Distribution


Golf Queensland - Membership Attrition & Retention Report - 2009
10MEMBERSHIP
At the heart of any golf club is club membership. Over the past thirty years demand for golf club membership in Queensland has grown by approximately 80% and is reasonably consistent with the growth rate seen in the wider population.
The annual average growth rate of 2% recorded since 1977 is near three times greater than the national average of 0.7% over the same period.
In the last decade however, from 1998 to 2008, this rate has slowed, particularly in the second half of this 10 year period. At the end of 1997 demand for club membership had reached over 78,000, and by 2002 membership had grown by a further 4% to reach a state peak of 81,700. From that 2002 peak, numbers have declined by 8% and by year end 2008, approximately 75,000 people were members of golf clubs in Queensland.
Queensland Club Membership
SOURCE: ABS; Regional Population Growth, Australia, Cat. No. 3218.0 (1996 to 2006); Population by Age and Sex,
Regions of Australia, Cat. No. 3235.0 (2007) & Golf Australia.
Population and Club Membership Growth – 1976 to 2007
Historical Trends
Like-year population and club membership numbers are plotted on the following graph. As the graph illustrates, club membership trend closely followed the growth trend in the wider state population up until 2001 with an almost perfect (1.0) correlation ratio of +0.99.
Since this time, despite continued population growth, club membership numbers have declined, with the correlation relationship now exactly the inverse to total population growth at negative 1.0.
ourstralia, Cat. No. 3218.0 ( of
Membership growth vs population growth

Golf Queensland - Membership Attrition & Retention Report - 2009
11
MEMBERSHIP
An overview of the wider participation levels in golf help to put these club trends into perspective. The level of participation in golf (and in all sports) is measured by the Australian Sports Commission (ASC) via its annual Exercise, Recreation and Sport Survey (ERASS).
The ASC have reported the following levels of total participation in golf in Queensland since 2001, that is the number of people aged over 15 years of age who played at least one round of golf each year.
These results reflect all golfers, be they club members or social golfers.
The total participation in golf has grown by 13% over the period (against a 20% increase in total participation), as participation has averaged 6% of the population since 2003. The male participation rate is approximately 4 times that of females, averaging approximately 10%. The five year average of the total golf demand pool, reveals that club golfers account for approximately 40% of all golfers in Queensland.
Year Male Female Total Participation rate %
Club Golf %
2001 157,500 45,500 203,000 7% 40%
2002 180,700 49,500 230,200 8% 35%
2003 169,100 54,000 223,100 8% 35%
2004 185,600 29,500 215,100 7% 35%
2005 171,000 38,600 209,600 7% 36%
2006 143,700 38,800 182,500 6% 42%
2007 129,600 27,400 157,000 5% 48%
2008 184,000 46,300 230,300 7% 33%
% growth 01 - 08
17% 2% 13% -- --
5 year average
162,800 36,100 198,900 6% 40%
State Golf Participation Rate
SOURCE: ASC ERASS Reports

Golf Queensland - Membership Attrition & Retention Report - 2009
12MEMBERSHIP
Club membership numbers in Queensland slightly exceeded 75,000 at the end of 2008. The male playing base accounted for 80% of this total, a consistent percentage of the total playing base for the past ten year period.
As reported, an 8% decline in member numbers has been recorded since membership numbers peaked in 2001.
This number is largely impacted by a greater fall in female member numbers with the male and female declines recorded being 7% and 12% respectively over this period. The rate of decline however has recently slowed, to be just 1% since 2004.
These numbers are summarised in the following table.
2001 2004 2008 % change 01 - 08
% change 04 - 08
Male 64,755 60,685 60,144 -7% -1%
Female 16,930 15,367 14,858 -12% -3%
Total 81,685 76,052 75,002 -8% -1%
% Male Membership
79% 80% 80% -- --
Source: Golf Queensland
Club Membership Numbers by Gender
The following five general geographic regions have been established for this report.
The south east region of Queensland has been further split into four regions.
Geographic Regions
Region Number of Clubs Ave. Club Size % of Market
Northern 46 183 11 %
Eastern 31 139 6 %
Central 6 24 < 1 %
Southern 23 41 1 %
Brisbane 17 999 23 %
Sunshine Coast 34 426 19 %
Gold Coast 27 528 19 %
Other SEQ 68 232 21 %
Total SEQ 146 421 82 %
Total QLD 252 299 100 %
* Refer Addendum - page 32 - for lists of clubs within each geographical region.
Source: Golf Queensland

Golf Queensland - Membership Attrition & Retention Report - 2009
13
MEMBERSHIP
Reviewing membership numbers by region identifies that different trends are evident at the sub market level.
Equal declines are evident in the large south east Queensland region, with above average losses seen in both the Brisbane metropolitan market, as well as the Gold Coast.
The Sunshine Coast region has been the standout performer for the state, recording +9% growth since 2001, as population in the region grew by 23%.
In other regional areas the Central and Southern areas have seen the greatest falls in club membership, declining by 29% and 26% respectively, as population numbers in regional inland areas grew by 4%.
As mentioned previously, a noticeable slowing of the state-wide trend has occurred since 2004 across all regions.
The Brisbane market has recorded a further 4% fall in member numbers with most other areas of the state (except for the Southern region) stabilising somewhat. The growth rate recorded in the Sunshine Coast market also noticeably slowed from +9% to +1%.
In terms of gender mix, most regions are consistent with the state average, though slightly greater female share is evident in the Gold Coast and Southern regions.
Membership numbers by region for the period 2001 to 2008 are summarised in the following table:
Region 2001 2004 2008 % Change 01 - 08
% Change 04 - 08
Av % Male
Brisbane 19,942 17,530 16,782 -16% -4% 80%
Gold Coast 16,276 14,232 14,252 -12% 0% 78%
Sunshine Coast
13,261 14,300 14,467 +9% +1% 79%
Other SEQ 16,864 15,840 15,825 -6% 0% 82%
Total SEQ 66,343 61,902 61,326 -8% -1% 80%
South 1,279 1,127 943 -26% -16% 75%
East 4,829 4,182 4,214 -13% 1% 82%
Central 201 142 142 -29% 0% 86%
North 9,033 8,699 8,377 -7% -4% 80%
Total 81,685 76,052 75,002 - 8% -1% 80%
Club Membership Numbers by Region
Source: Golf Queensland

Golf Queensland - Membership Attrition & Retention Report - 2009
14MEMBERSHIP
Given the large difference between the respective sizes of the geographic markets in Queensland, the percentage movement results reported can be misleading as to identifying what the actual key source market/s behind the reported results are.
The following table identifies the reported difference in numbers from 2001 to 2008 and the share of the difference that this number represents.
As highlighted below, over 75% of the total losses have been recorded in the metropolitan Brisbane and Gold Coast markets with 25% of the losses coming from regional markets.
Region Number of Clubs Variance 2001 to 2008
% Share of Variance
Brisbane 17 3,160 47%
Gold Coast 27 2,024 30%
Sunshine Coast 34 (1,206) (18%)
Other SEQ 68 1,039 16%
Total SE Qld 146 5,017 75%
South 23 336 5%
East 31 615 9%
Central 6 59 1%
North 45 656 10%
Total 251 6,683 100%
Regional Share
Source: Golf Queensland
Golf Queensland - Membership Attrition & Retention Report - 2009
15
MEMBERSHIP
Key Points - Club Membership
Over the past thirty years demand for golf club membership in Queensland has grown ›
by approximately 80%.
The annual average growth rate of 2% recorded since 1977 is near three times greater ›
than the national average of 0.7% over the same period as population increases have
continued to increase the general demand pool.
At the end of 1997 demand for club membership had reached over 78,000 people and ›
by 2002 membership had grown by a further 4% to reach a state peak of 81,700 people.
From that peak, numbers have since slid by approximately 8% and approximately ›
75,000 people are now members of golf clubs in Queensland.
The average participation rate for golf in the six year period to 2007 was approximately ›
7% with the male participation rate of 10% being approximately 4 times that of females.
For the more recent period 2004 to 2007, this participation rate has fallen by almost a ›
full percentage point to 6%, as generally less of both males and females social golfers
have participated in golf.
Club membership numbers in Queensland slightly exceeded 75,000 at the end of 2008. ›
The male playing base accounted for 80% of this total, a consistent percentage of the ›
total playing base for the past ten year period.
An 8% decline in member numbers has been recorded since membership numbers ›
peaked in 2001. This number is largely impacted by a greater fall in female member
numbers with the male and female declines recorded being 7% and 12% respectively
over this period. The rate of decline however has recently slowed, to be just 1% since
2004.
The Sunshine Coast region has been the standout performer for the state, recording +9% ›
growth since 2001 and 1% since 2004.
Over 75% of the total losses have been recorded in the metropolitan Brisbane and Gold ›
Coast markets with 25% of the membership losses coming from regional markets, as the
wider market mix settled at 82% - 18% for these regions.

Golf Queensland - Membership Attrition & Retention Report - 2009
16ATTRITION
As outlined in the previous section, demand for golf club membership in Queensland is currently in decline. Notwithstanding the importance of generating new demand, in the current climate the annual retention of members in golf clubs is now as equally important.
Reported year end membership numbers are the annual net result of current members plus new members less resigned members. The previous section highlighted the recent trends in this number, being an 8% and 1% decline since 2001 and 2004 respectively.
Until now, the number of new and resigned members recorded each year have never been formally measured, nor has the resultant calculation of the state’s annual attrition rate been performed, (that being the number of club members who resign their membership each year divided by total current members).
Using the annually reported Golf Queensland membership numbers, and new member numbers sourced from GolfLink, the state’s annual club member attrition rate is outlined in this report for the first time.
Once this calculation is performed, Golf Queensland and its member clubs will better understand what level of real, new demand exists for golf club membership as well as the size of the annual resignation pool. Having such information available will help the industry develop relevant strategies to address both issues.
Recent data from 2006 to 2008 has been utilised, with a 3 year average reported to smooth out any one year irregularities.
Queensland Club Membership Attrition Statistics
Introduction
New MembersNew members are a key demand source for golf clubs in Queensland. New member data for the period 2006 to 2008 provided from Golflink identifies the current level of new member demand evident in Queensland’s golf clubs.
As outlined below, the level of new membership demand in Queensland golf clubs has averaged 17% over the past three year period, being approximately 12,500 new members.
The Gold Coast and Other SE Qld markets has generated above average new demand levels of over 20%, with the SE Qld market accounting for over 80% of new demand. Above average new demand levels are also evident in the East and Northern regions of the state.
The table opposite summarises this information.

Golf Queensland - Membership Attrition & Retention Report - 2009
17
ATTRITION
Region 2006 2007 2008 3 year Average
% of
Membership
% of new
Membership
demand
Brisbane 2,211 1,674 1,815 1,900 11% 15%
Gold Coast 2,851 3,237 2,789 2,959 21% 23%
Sunshine Coast
2,009 2,526 2,279 2,271 16% 18%
Other SEQ 3,093 3,289 3,247 3,210 21% 25%
Total SEQ 10,164 10,726 10,130 10,340 17% 81%
South 62 61 70 64 6% 1%
East 670 776 1,021 822 19% 6%
Central 12 22 24 19 13% 0%
North 1,241 1,555 1,731 1,509 18% 12%
Total 12,149 13,140 12,976 12,755 17% 100%
The makeup of these new demand numbers in terms of gender is also of interest. For the past ten year period, male members have accounted for approximately 80% of total membership demand.
In the past three years the percentage of new members who are male has been 83%. The Other SE Qld region and the Southern region, with new demand male gender percentages of 86 % and 87 % respectively, exceed this average.
New Member Gender Mix
The table and graph above indicate that there is genuine new interest in membership of Queensland golf clubs each year, with
recent trends indicating that the majority of this demand is male.
Source: Golf Queensland

Golf Queensland - Membership Attrition & Retention Report - 2009
18ATTRITION
The opposite of new member attraction is lost members. Having identified the number of new members recorded each year, the number of members lost each year can subsequently be calculated. Lost member data for the period 2006 to 2008 identifies that there is currently a large amount of annual attrition occurring within Queensland’s golf clubs. As outlined below, the level of lost membership demand in Queensland golf clubs has averaged 17% over the past three year period, being approximately 12,600 lost members.
This rate, being slightly greater than the new member rate, explains why total membership numbers have declined by 1% over the three-year period measured.
The Gold Coast and Other SE Qld markets has generated above average lost member levels of over 20%, with the SE Qld market accounting for over 81% of all lost members. The table below summarises this information.
Region 2006 2007 2008 3 year
Average
% of
Membership
% of lost
Membership
Brisbane 2,248 1,764 2,044 2,019 12% 16%
Gold Coast 2,230 3,655 2,716 2,867 20% 23%
Sunshine Coast
1,840 2,808 1,882 2,177 15% 17%
Other SEQ 3,093 3,214 3,030 3,112 20% 25%
Region 2006 2007 2008 3 year
Average
% of
Membership
% of lost
Membership
Total SEQ 9,411 11,441 9,672 10,175 17% 81%
South 109 93 91 98 10% 1%
East 442 716 1,033 730 17% 6%
Central 0 46 20 22 15% 0%
North 1,097 1,735 1,966 1,599 19% 13%
Total 11,059 14,031 12,782 12,624 17% 100%
Lost Members
Source: Golf Queensland, JBAS

Golf Queensland - Membership Attrition & Retention Report - 2009
19
ATTRITION
Market Attrition RateThe table below summarises the respective performance of each market in terms of overall positive and negative member movement. It indicates that no one market, other than the small Southern market, stands out in terms of having greater retention success or measurably less attrition occurring.
The table below summarises the new and lost members as a percentage of total membership, and the variance that results from lost members being greater than new members (a negative variance) or vice versa.
Region % New Members
% Lost Members Variance Outcome
Brisbane 11% 11% -1% Negative
Gold Coast 21% 20% 1% Positive
Sunshine Coast 16% 15% 1% Positive
Other SE Qld 21% 20% 1% Positive
Total SE Qld 17% 17% -1% Positive
South 7% 10% -4% Negative
East 18% 17% 1% Positive
Central 13% 15% -2% Negative
North 18% 19% -1% Negative
Total 17% 17% -1% Negative
Source: Golf Queensland, JBAS

Golf Queensland - Membership Attrition & Retention Report - 2009
20ATTRITION
Analysis of the same data by gender does however identify that some meaningful movement is occurring in each of the different markets. The Northern and Southern markets have each recorded opposite trends when comparing results by gender, with both having positive female retention ratios and negative male ratios.
In the key south east market, female retention ratios are also in the positive, as negative male numbers pull back the performance of the total market.
Regional movement by gender is illustrated in the following maps.
Attrition by Gender
Northern Region
Female +0.8% Male -4.2%
Eastern Region
Female -2.8%Male -1.7%
Central Region
Female +4.8% Male -2.6%
Southern Region
Female -6.5% Male -4.1%
South East
Brisbane Female +1.8%Brisbane Male -2.9%GC Female +1.7%GC Male -2.9%S’Coast Female +0.8%S’Coast Male -2.2%Other SE Female +0.8%Other SE Male -2.7%

Golf Queensland - Membership Attrition & Retention Report - 2009
21
ATTRITION
Undertaking a similar type of analysis by club size helps identify whether different size clubs have different retention and attrition characteristics.
Only clubs with members at the end of 2008 have been included in the following analysis.
Analysis by club Size
Club Size 3 year Average – New Members
% of Membership
< 300 members 2,398 15%
300 to 700 3,523 18%
700 to 1000 2,336 16%
> 1000 members 2,403 10%
The opposite of new member attraction is lost members. Having identified the number of new members recorded each year by club size, the same can be calculated for the number of members lost each year. These results largely mirror the new member results.
The 300 to 700 member size club recorded the largest number of lost members, when measured as a percentage of total membership, with the 1000 plus member clubs recording the lowest level of attrition at 9% of membership.
Lost Members by club size
Club Size 3 year Average – Lost Members
% of Membership
< 300 members 2,466 15%
300 to 700 3,610 19%
700 to 1000 2,409 16%
> 1000 members 2,291 9%
Source: Golf Queensland, JBAS
Source: Golf Queensland, JBAS

Golf Queensland - Membership Attrition & Retention Report - 2009
22ATTRITION
Key Points - Club Attrition
The level of new membership demand in Queensland golf clubs has averaged 17% over ›
the past three year period, being approximately 12,500 new members.
The Gold Coast and Other SE Qld markets has generated above average new demand ›
levels of over 20%, with the SE Qld market accounting for over 80% of new demand.
Over 75% of the total membership losses have been recorded in the metropolitan ›
Brisbane and Gold Coast markets with 25% of the losses coming from regional markets.
For the past ten year period male members have accounted for approximately 80% of ›
total membership demand.
The Other SE Qld region and the Southern region have recorded new male members ›
percentages of 86% and 87% respectively in the past three year period.
The level of lost membership demand in Queensland golf clubs has averaged 17% over ›
the past three year period, being approximately 12,600 lost members per year.
The Gold Coast and Other SE Qld markets has generated above average lost member ›
levels of over 20%, with the SE Qld market accounting for over 81% of all lost members.
The Northern and Southern markets have each recorded opposite trends when ›
comparing results by gender, with both having positive female retention ratios and
negative male ratios.
In the key south east market, female retention ratios are also in the positive, as negative ›
male numbers pull back the performance of the total market.
The club size that has recorded the highest level of new members, when measured ›
as percentage of total membership, is the 300 to 700 member category with a 3 year
average of 18% new member demand.
The 1000 plus member clubs deliver the lowest level of new member demand at an ›
average 3 year rate of 10% of total members.
With an annual average of 19%, the 300 to 700 member size clubs have recorded the ›
largest number of lost members, when measured as a percentage of total membership.
›


Golf Queensland - Membership Attrition & Retention Report - 2009
24Retention Strategies
Overall, the analysis of membership dynamics has revealed that there is significant annual attrition occurring within Queensland’s golf clubs.
Importantly however there is also evidence of significant annual new demand for club membership. Whilst this demand may have been supported by the above average population growth experience across the state for the last 20 years, should the annual attrition be reduced, and new member demand sustained, all parts of the club industry stand to benefit.
This is a significant opportunity for clubs and intuitively it is proposed that retaining existing members is an easier strategy than recruiting new ones.
This chapter also outlines some suggested strategies that clubs should have in place to better increase their chances of reducing member attrition and improving member retention.
Member Retention Strategies
Summary
As part of this study, a club survey was conducted of clubs across Queensland; specifically seeking information about the retention strategies they currently employ at their clubs.
Fifty five clubs responded to the survey, being a 20% response rate.
Approximately 57% of respondents were from clubs located in the south east region of Queensland. Results from this study are referenced in the relevant sections on the following pages.
A number of retention strategies are outlined that will assist in reducing membership attrition.
Club Survey Results

Golf Queensland - Membership Attrition & Retention Report - 2009
25
Retention Strategies
This requirement is a much overlooked reality of club membership. Members will remain members as long as they are satisfied with what they are receiving from the club. This goes to the value proposition that the annual fee makes, the general level of service received, and satisfaction with the key areas of the club. In order to accurately gauge member satisfaction, regular surveying
should occur. Such surveys will gather feedback about club facilities and will provide the club with regular opportunities to address any issues that arise.
It is recommended that clubs formally survey their members at least every two years.
Member satisfaction
Demand for golf club membership is a function of local population numbers. It is therefore vital that you understand what is happening with regard to population numbers in the region that your club services as this information will help you tailor membership offers that best suit the “new” market. Population growth naturally indicates a growing demand pool but the important information to gather is what the make-up of this growth is.
It may be retiring couples, it may be young families. Both require different strategies to attract them to club membership. Knowing your market also extends to clubs in your immediate area. Their performance will help to put your performance in some market context.
100% of surveyed clubs stated that they understood what was happening in terms of population growth in their immediate area.
The wider market
A regular proxy for member satisfaction is playing frequency - as frequency typically impacts the club’s value proposition. If a member is playing a lot of golf, they will more likely be more satisfied than a member who is not playing a lot of golf. The project survey, using a rating scale of 1 (poor) to 5 (very well), asked how well clubs understand their member playing patterns. The average survey response being 3.6.
Despite this finding and the stated knowledge of playing patterns, 76% of surveyed clubs reported that they do not periodically contact members with low facility utilisation.
Given the link between playing frequency and satisfaction, it is recommended that clubs regularly track member playing frequencies and communicate with those with low frequency.
Member playing patterns

Golf Queensland - Membership Attrition & Retention Report - 2009
26Retention Strategies
A key determinant to club membership is whether the cost of such membership reflects the quality of the facilities to be enjoyed. In almost all cases, pricing must be determined by the value offered to the member, not the cost to deliver the service. Should the latter be the reason for making pricing decisions, clubs are at risk to value and price being separated and not being reflective of one another.
The project survey asked clubs whether they host new member evenings and/or special member events. The survey found that currently 50% of clubs host new member events and that 60% of clubs conduct special events for members.
In order to increase the perceived value of club membership (over and above the average cost to play), it is recommended that all clubs conduct both new member and existing member events throughout the year.
As many clubs in Queensland rely on public golf green fees to supplement their annual revenue streams, attention must also be given to the cost of public play versus the cost of membership. Ignoring this comparison and not having appropriate payment options in place will only encourage attrition.
It is recommended that clubs understand the cost of public golf versus the average cost of member play and in order to make membership appealing, have payment options available that do not require significant lump sum transactions to be made.
The club product and the value proposition

Golf Queensland - Membership Attrition & Retention Report - 2009
27
Retention Strategies
The reason for attrition is that members choose to leave a club. The question that needs to be asked is why? The project survey asked clubs what the top four stated reasons for leaving the club were. They were:
Change in residential location: 27%•
Time constraints: 26%•
Increasing family commitments: 25%•
Not receiving value for money: 13%•
An inflexible club offer, old age and health reasons were the other less noted reasons for resignation.
These survey findings identify where the opportunities to reduce attrition might be. Little can done about attrition caused by moving residential locations as past industry research has found that 80% of golfers will travel only up to 30 minutes to play regular golf. Also little can be done by the club about age and health issues.Increasing time constraints and family commitments (may be one and the same reason for some people) are however two reasons that do encourage further questioning. Is it that there is no time available to play at all or is it that there are currently not enough adequate opportunities/events in the time that is available to play? This feedback can be obtained via a resigned
member’s survey, which probes for more detail behind the decision to resign. It is this detail, when consistently collected and analysed, which could potentially reveal an opportunity for a club to retain more of its members.
The project survey asked clubs whether they surveyed resigned members. It found that currently only 16% of clubs survey their resigned members. This vital information is therefore not being collected at a majority of clubs across the state and as a result, clubs do not know what potential actions or club offers could have convinced a resigned member to actually retain their membership.
In an ideal club world, no member should leave because they haven’t received value for money. It is the club’s responsibility to ensure to the best of its ability that this occurs.
It is recommended that all clubs undertake resigned member surveys, seeking to understand the reason for resignation and whether the club could have done anything to help them keep their membership.
Why members are leaving

Golf Queensland - Membership Attrition & Retention Report - 2009
28Retention Strategies
The following information should be collected and measured in any member resignation survey.
Age•Gender•Membership category•Length of membership at club•Handicap•Level of playing frequency recorded in •their last year of membershipGeneral level of satisfaction in the final •year of their membershipReason for leaving•
Once collected trends that may materialise can be questioned and then potentially actioned (new offers, adjusted terms etc). Such a process will ensure that the club’s membership offer (or offers) will always remain reasonably up to date with member needs and expectations.
Approximately 80% of clubs surveyed stated that they do retain resigned member records. It is therefore recommended that clubs review this information to determine whether any actionable trends by age, gender, category or length of membership may be apparent , that they then be questioned as to possible cause and actioned accordingly.
Member survey detail
The successful transition of junior members to full members is regarded as another key member retention outcome. As is often stated, junior golfers are the future of the game. Industry research has found that once exposed to the game at a junior level, take up rates in later life will be greater. This take-up will also be at a more capable (skill) level.
As more capable golfers play more golf and spend more money and become the core market for the industry, increased exposure of golf to juniors and there retention will benefit all involved with the game.A number of basic strategies are available for club to increase their retention of junior golfers. The project survey asked clubs what strategies they pursued in order to better retain Junior members.
It found that:
Staged increases in annual fees are •offered by 56% of clubsThe definition of “Junior” has been •extended to a more modern and relevant age at 27% of clubs (e.g 24 years old)No additional “top up” joining fee is •payable by a Junior member at 51% of clubs.
It is recommended that all clubs consider the above three strategies in order to increase retention of Junior members.Should clubs put all of the above member retention strategies in place, the level of annual membership attrition will likely reduce as the club better accommodates and satisfies its members.
Transition of junior members

Golf Queensland - Membership Attrition & Retention Report - 2009
29
Retention Strategies
The following checklist is provided so clubs can check what strategies they have in
place, and what they need to address when considering member retention and attrition.
Retention Checklist
Tick General Strategy
Measure attrition on an annual basis. What gets measured gets acted on
Communicate to all members on a regular basis
Measure member rounds frequency
Communicate direct with members with low frequency
Survey your members at least every two years
Consider your membership structures – are they relevant for today’s market?
Conduct resigned member surveys – what are they telling you?
Conduct new and existing member events – the goal is to add value to the annual fee paid
Know your market – both wider population and regional peers
Ensure you have payment flexibility
Limit barriers for transition from Junior to Adult membership
Incentivise members to introduce new members

Golf Queensland - Membership Attrition & Retention Report - 2009
30Retention Strategies
The club survey undertaken as part of this project by Golf Queensland, and the responses received, provide further support for the effect of the above mentioned strategies.
Analysis of the data received enabled each club’s attrition and retention rate to be calculated for the past 12 month period.
Notwithstanding the micro market challenges regarding product diversity, market supply and demand, and the positive impact of attrition with regard to waiting lists and entrance fee income, the analysis undertaken showed that those clubs who undertake more of the above practices are more likely to have lower attrition levels and greater levels of member retention than those clubs that do not.
Should clubs put all of the above member retention strategies in place, the level of annual membership attrition will likely reduce as the club finds itself able to better accommodate and satisfy the needs of its members.
A full version of the Study into membership Attrition and Retention at Golf Clubs in Queensland is available for download from the Golf Queensland website.
To download the report or read the report online visit:-
www.golfqueensland.org.au/reports
Survey Findings and Conclusion
About JBAS
JBAS is acknowledged as one of Australia’s leading providers of independent golf industry advisory services.
Jeff Blunden, the Director of JBAS, created and managed the Golf Advisory Business Unit for Ernst & Young from 2001 to mid 2006, before spending some time in roles with both Golf Australia and Troon Golf prior to formally creating JBAS in late 2008.
Jeff has undertaken almost all of the major industry research projects in recent years and has worked on a number of industry specific engagements for clients that include numerous golf clubs and administration bodies.
For more information on JBAS please visit www.jbadvisory.com.au

Golf Queensland - Membership Attrition & Retention Report - 2009
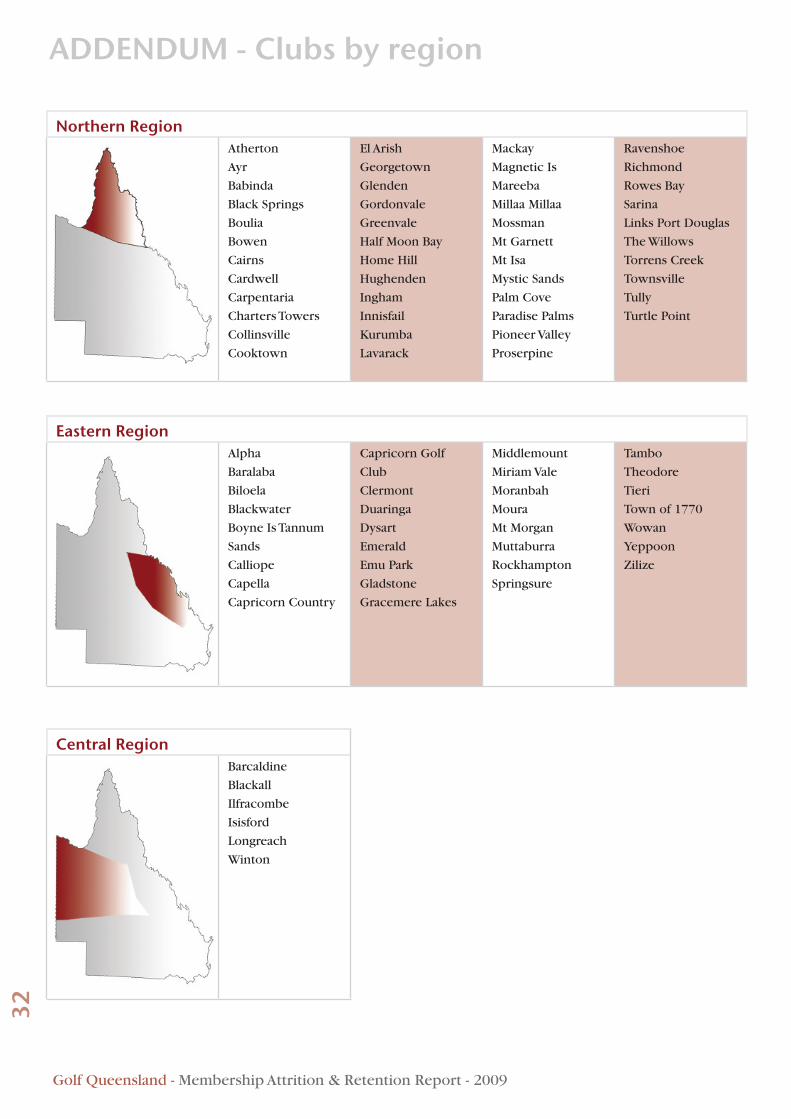
32ADDENDUM - Clubs by region
Northern RegionAtherton
Ayr
Babinda
Black Springs
Boulia
Bowen
Cairns
Cardwell
Carpentaria
Charters Towers
Collinsville
Cooktown
El Arish
Georgetown
Glenden
Gordonvale
Greenvale
Half Moon Bay
Home Hill
Hughenden
Ingham
Innisfail
Kurumba
Lavarack
Mackay
Magnetic Is
Mareeba
Millaa Millaa
Mossman
Mt Garnett
Mt Isa
Mystic Sands
Palm Cove
Paradise Palms
Pioneer Valley
Proserpine
Ravenshoe
Richmond
Rowes Bay
Sarina
Links Port Douglas
The Willows
Torrens Creek
Townsville
Tully
Turtle Point
Eastern RegionAlpha
Baralaba
Biloela
Blackwater
Boyne Is Tannum
Sands
Calliope
Capella
Capricorn Country
Capricorn Golf
Club
Clermont
Duaringa
Dysart
Emerald
Emu Park
Gladstone
Gracemere Lakes
Middlemount
Miriam Vale
Moranbah
Moura
Mt Morgan
Muttaburra
Rockhampton
Springsure
Tambo
Theodore
Tieri
Town of 1770
Wowan
Yeppoon
Zilize
Central RegionBarcaldine
Blackall
Ilfracombe
Isisford
Longreach
Winton
Golf Queensland - Membership Attrition & Retention Report - 2009
33
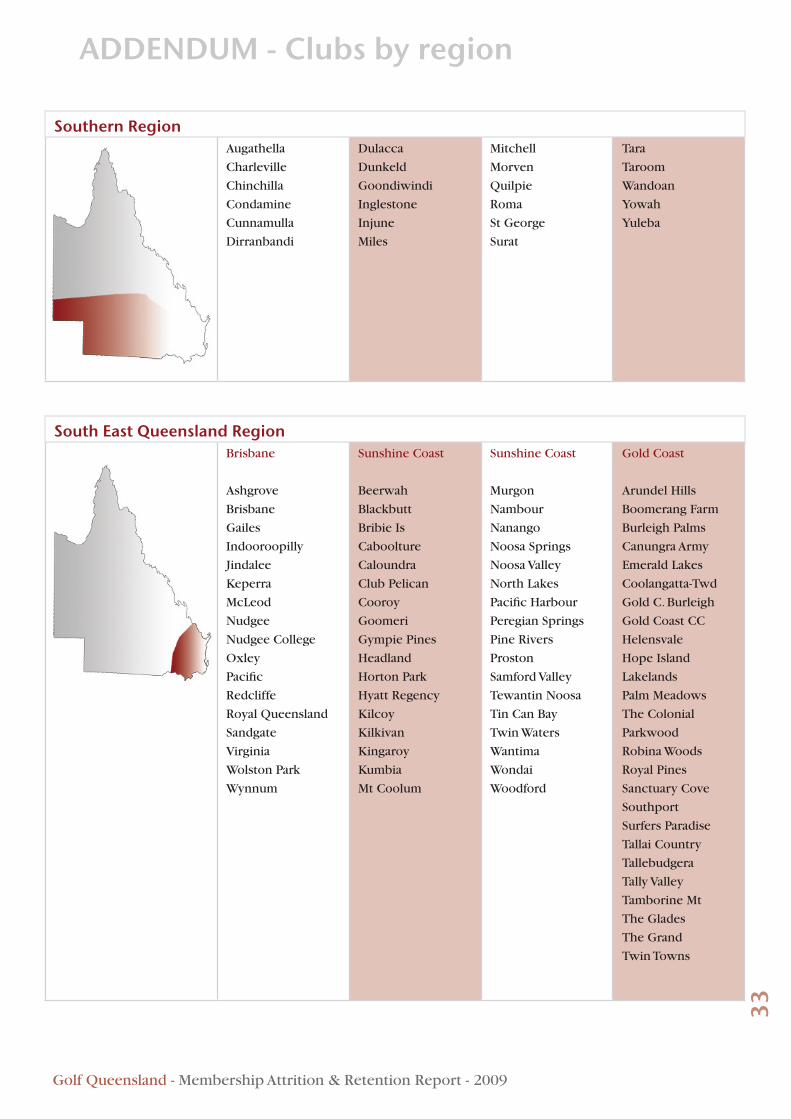
ADDENDUM - Clubs by region
Southern RegionAugathella
Charleville
Chinchilla
Condamine
Cunnamulla
Dirranbandi
Dulacca
Dunkeld
Goondiwindi
Inglestone
Injune
Miles
Mitchell
Morven
Quilpie
Roma
St George
Surat
Tara
Taroom
Wandoan
Yowah
Yuleba
South East Queensland RegionBrisbane
Ashgrove
Brisbane
Gailes
Indooroopilly
Jindalee
Keperra
McLeod
Nudgee
Nudgee College
Oxley
Pacific
Redcliffe
Royal Queensland
Sandgate
Virginia
Wolston Park
Wynnum
Sunshine Coast
Beerwah
Blackbutt
Bribie Is
Caboolture
Caloundra
Club Pelican
Cooroy
Goomeri
Gympie Pines
Headland
Horton Park
Hyatt Regency
Kilcoy
Kilkivan
Kingaroy
Kumbia
Mt Coolum
Sunshine Coast
Murgon
Nambour
Nanango
Noosa Springs
Noosa Valley
North Lakes
Pacific Harbour
Peregian Springs
Pine Rivers
Proston
Samford Valley
Tewantin Noosa
Tin Can Bay
Twin Waters
Wantima
Wondai
Woodford
Gold Coast
Arundel Hills
Boomerang Farm
Burleigh Palms
Canungra Army
Emerald Lakes
Coolangatta-Twd
Gold C. Burleigh
Gold Coast CC
Helensvale
Hope Island
Lakelands
Palm Meadows
The Colonial
Parkwood
Robina Woods
Royal Pines
Sanctuary Cove
Southport
Surfers Paradise
Tallai Country
Tallebudgera
Tally Valley
Tamborine Mt
The Glades
The Grand
Twin Towns

Golf Queensland - Membership Attrition & Retention Report - 2009
34
South East Queensland - OtherAllora
Bargara
Bay Islands
Beaudesert
Bell
Biggenden
Boonah
Boonooroo
Borneo Barracks
Brookwater
Bundaberg
Burrum District
California Creek
Carbrook
Castles Road
Cecil Plains
Chambers Pines
City-Toowoomba
Clifton
Coral Cove
Crows Nest
Dalby
Eatonvale
Eidsvold
Esk
Fraser Lakes
Gainsborough
Gatton Jubilee
Gayndah
Gin Gin
Goombungee
Hattonvale
Hervey Bay
Hills Education
Inglewood
Innes Park
Ipswich
Isis
Jandowae
Karana Downs
Killarney
Kooralbyn Valley
Laidley
Logan Country
Lowood
Maryborough
Millmerran
Monto
Mt Warren Park
Mt. Perry
Mundubbera
North Stradbroke
Oakey
Oakwood Park
Pittsworth
RAAF Amberley
Redland Bay
Riverlakes
Rosewood
Sandy Gallop
Stanthorpe
Texas
Toogoolawah
Toowoomba
Village Links
Wallangarra
Warwick
Windaroo
ADDENDUM - Clubs by region


36