A Strategic Insight Into Carsharing Market … · expected to see a decline in car ownership for...
17
A Strategic Insight Into Carsharing Market Developments and Dynamics Franck Leveque Vice President Automotive & Transportation Europe Vice President Automotive & Transportation Europe September 21 st 2011
Transcript of A Strategic Insight Into Carsharing Market … · expected to see a decline in car ownership for...

A Strategic Insight Into Carsharing Market Developments and Dynamics
Franck Leveque
Vice President Automotive & Transportation EuropeVice President Automotive & Transportation Europe
September 21st 2011

Agenda
A review of the key urbanisation trends driving the development of new mobility solutions
Definition of the current market size (membership & vehicles) and growth expected in Europe
2
An assessment of the various business models and leading organisations
Key conclusions and takeaways to drive Car-Sharing adoption
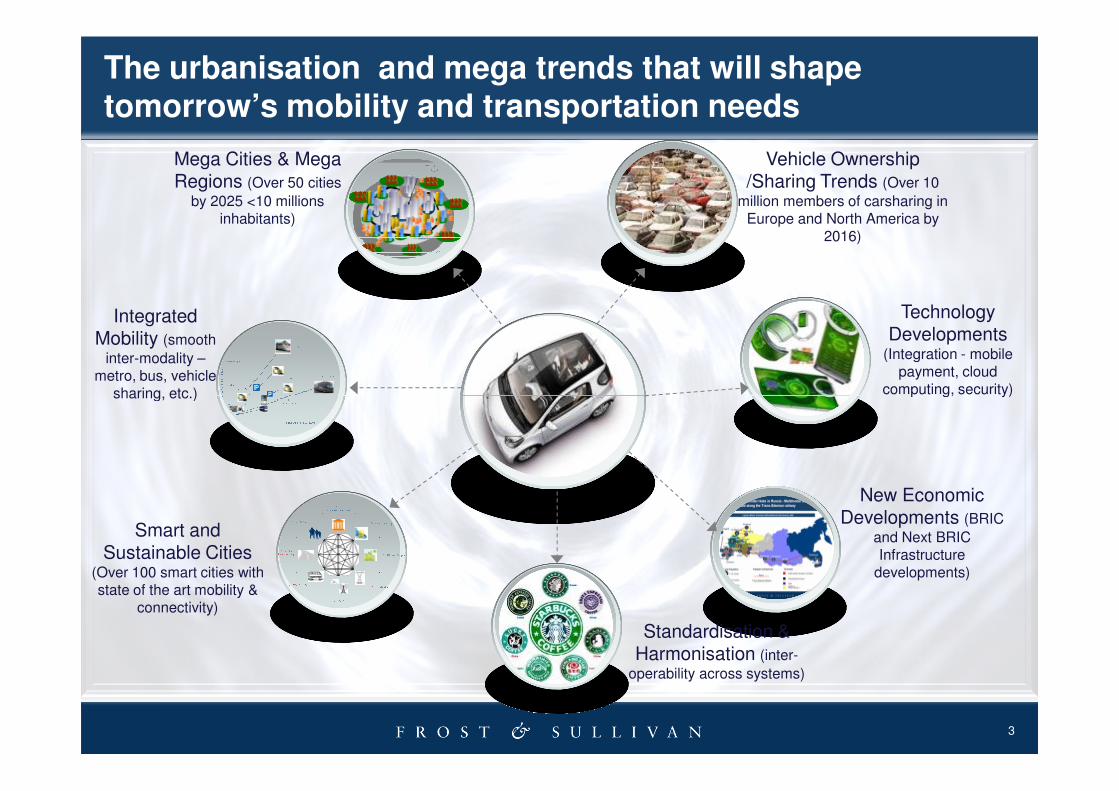
The urbanisation and mega trends that will shape tomorrow’s mobility and transportation needs
Integrated Mobility (smooth
inter-modality –metro, bus, vehicle
sharing, etc.)
Mega Cities & Mega Regions (Over 50 cities
by 2025 <10 millions inhabitants)
Vehicle Ownership/Sharing Trends (Over 10
million members of carsharing in Europe and North America by
2016)
Technology Developments
(Integration - mobile payment, cloud
computing, security)
3
Smart and Sustainable Cities
(Over 100 smart cities with state of the art mobility &
connectivity)
sharing, etc.) computing, security)
New Economic Developments (BRIC
and Next BRIC Infrastructure
developments)
Standardisation & Harmonisation (inter-
operability across systems)
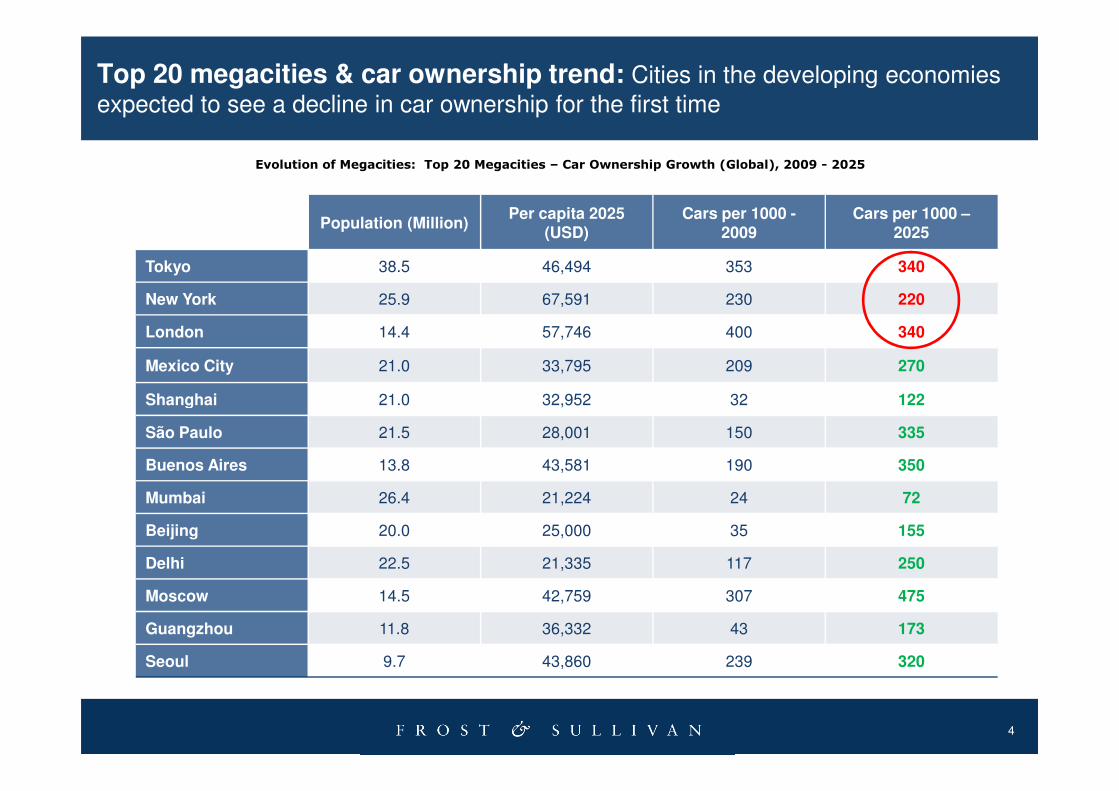
Top 20 megacities & car ownership trend: Cities in the developing economies
expected to see a decline in car ownership for the first time
Population (Million)Per capita 2025
(USD)Cars per 1000 -
2009Cars per 1000 –
2025
Tokyo 38.5 46,494 353 340
New York 25.9 67,591 230 220
London 14.4 57,746 400 340
Mexico City 21.0 33,795 209 270
Shanghai 21.0 32,952 32 122
Evolution of Megacities: Top 20 Megacities – Car Ownership Growth (Global), 2009 - 2025
4
Shanghai 21.0 32,952 32 122
São Paulo 21.5 28,001 150 335
Buenos Aires 13.8 43,581 190 350
Mumbai 26.4 21,224 24 72
Beijing 20.0 25,000 35 155
Delhi 22.5 21,335 117 250
Moscow 14.5 42,759 307 475
Guangzhou 11.8 36,332 43 173
Seoul 9.7 43,860 239 320
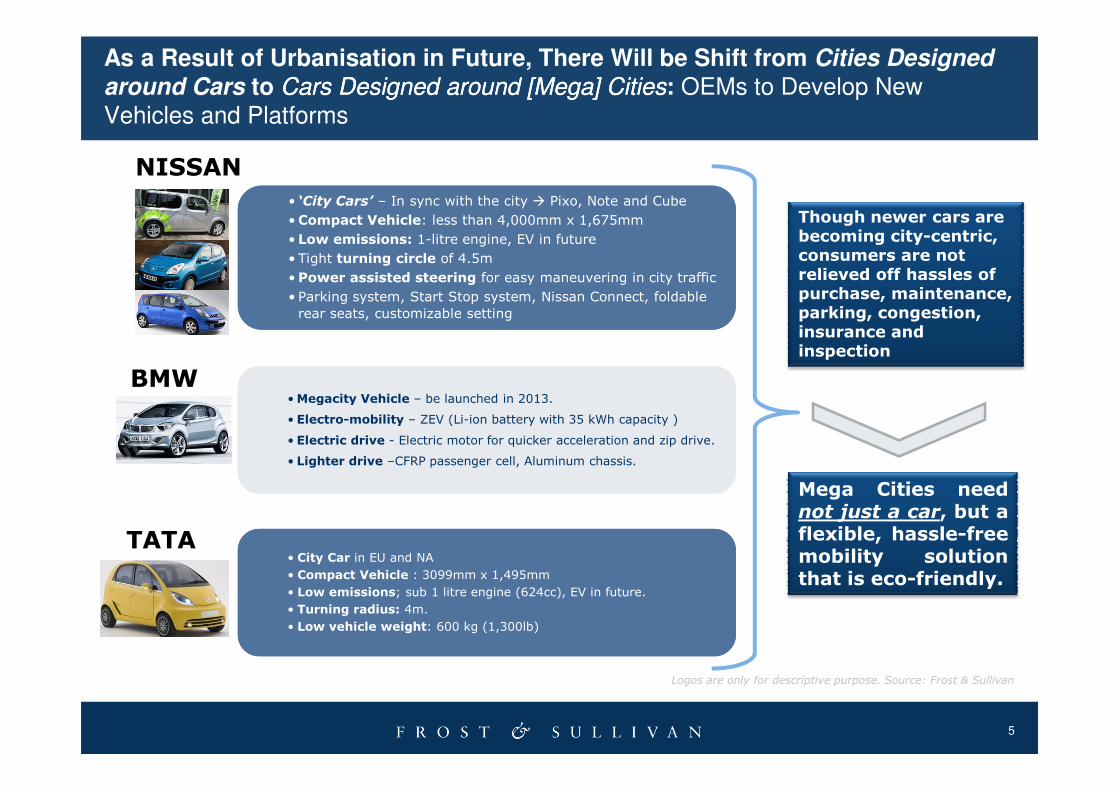
As a Result of Urbanisation in Future, There Will be Shift from Cities Designed
around Cars to Cars Designed around [Mega] CitiesCars Designed around [Mega] Cities: OEMs to Develop New
Vehicles and Platforms
•Megacity Vehicle – be launched in 2013.
• ‘City Cars’ – In sync with the city � Pixo, Note and Cube
•Compact Vehicle: less than 4,000mm x 1,675mm
• Low emissions: 1-litre engine, EV in future
• Tight turning circle of 4.5m
•Power assisted steering for easy maneuvering in city traffic
• Parking system, Start Stop system, Nissan Connect, foldable
rear seats, customizable setting
NISSAN
BMW
Though newer cars are becoming city-centric, consumers are not relieved off hassles of purchase, maintenance, parking, congestion, insurance and inspection
5
•Megacity Vehicle – be launched in 2013.
• Electro-mobility – ZEV (Li-ion battery with 35 kWh capacity )
• Electric drive - Electric motor for quicker acceleration and zip drive.
• Lighter drive –CFRP passenger cell, Aluminum chassis.
• City Car in EU and NA
• Compact Vehicle : 3099mm x 1,495mm
• Low emissions; sub 1 litre engine (624cc), EV in future.
• Turning radius: 4m.
• Low vehicle weight: 600 kg (1,300lb)
Logos are only for descriptive purpose. Source: Frost & Sullivan
TATA
Mega Cities neednot just a car, but aflexible, hassle-freemobility solutionthat is eco-friendly.

MemberCarsharing subscriber base to be 14 Million in EU by 2020
Vehicle 200,000 shared vehicles expected in Europe by
2020
Potential MarketFrance, United Kingdom, Germany andSwitzerland to hold around 75% of
Carsharing Vehicles & Members (World), 2010-2020
Opportunities in Car Sharing 2020: Carsharing to emerge as additional business
opportunity for automotive manufacturer for customer retention and long term
sustainability
Worldwide 32 Million
subscriptions expected by 2020
0
100
200
300
400
500
600
0
10
20
30
40
50
60
Th
ou
san
ds
Millio
ns Member Vehicle
6
Usage of Electric VehicleBy 2016, 1 in 5 vehicles of thecarsharing vehicle fleet is expected tobe a battery powered EV.
Switzerland to hold around 75% ofRevenue Share in 2016.
Vehicles (Thousands)
Revenue GenerationThe revenue potential of carsharingmarket is expected to be € 7 billion by2020 in Europe.
Members (in Million )
00
2010 2011 2012 2013 2014 2015 2016 2017 2018 2019 2020

Carsharing Customer Profile - Potential Impacts and Benefits of Carsharing are
Easily Understood by Educated Consumers
General Profile
• Gender: Male: ~ 60%,Female - ~ 40%
• Average age group: Mid – 30’s
• Growing age group: 25 – 30
• Each carsharing vehicle removes 8-10 private vehicles off the roads
• In Germany, statistically, each carsharing vehicle is used by 35- 40 members
Education
• About 60% of Carsharing users are university graduates or hold advanced degrees
7
• About 60% of Carsharing users are university graduates or hold advanced degrees
• This age group finds carsharing more in-line with their needs and expenditure
• Growing target group: College and university campus students
• Currently, more than 80% of Italian Carsharing Members are working professionals
Demographics & Demand
• Customers: Residential: ~ 83-87%; Corporate: ~ 12-17%; Universities: ~ 2-4%
• Miles Travelled: Individual: 15 trips x 20 miles. Business: 30 trips x 32 miles (annually)
• Potential Target Group: Universities, Government, Private fleet vehicles
• Average trip per day: 2 -3 hours; 23 miles; 2 -3 trips per month
• Vehicle demand adjustment: Excess demand from Rental companies handled by CSOs
Source: Frost & Sullivan

Country Benchmarking: National Framework is Needed to BringCarsharing into Mainstream Transportation Solutions
High Mobility Management
The United Kingdom
Germany
Switzerland
France
The Netherlands
Sweden
Mobility management represents acountry’s interest in the areas of -
� Promotion of clean vehicles� Sustainable transportation� Awareness of sustainable mobility� Road pricing schemes� Travel awareness on modality
Benchmarking of Carsharing Countries (Europe), 2010
8
Low Mobility Management
High Federal Support
Low FederalSupport
Source: Frost & Sullivan
GermanyItaly
Spain
BelgiumAustria
Federal support includes the following -
� State Funding� Parking policies� Incentives to CSOs and subscribers
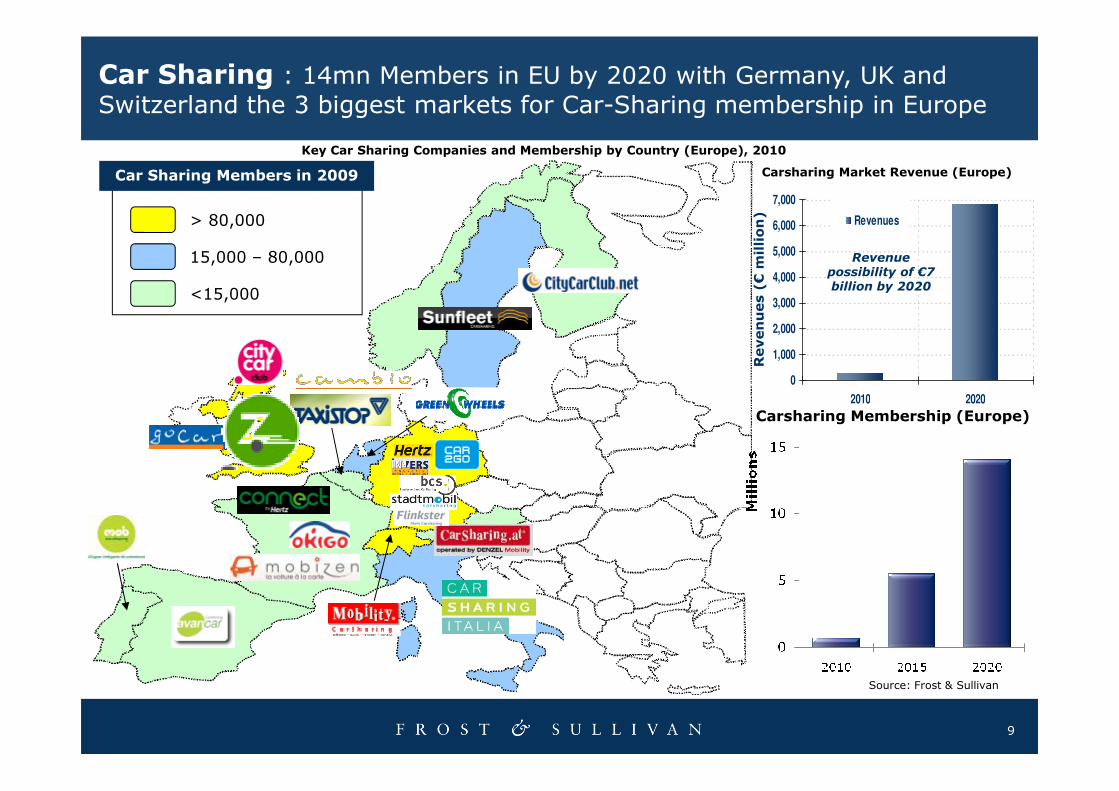
> 80,000
15,000 – 80,000
<15,000
Key Car Sharing Companies and Membership by Country (Europe), 2010
Car Sharing : 14mn Members in EU by 2020 with Germany, UK and Switzerland the 3 biggest markets for Car-Sharing membership in Europe
Car Sharing Members in 2009
0
1,000
2,000
3,000
4,000
5,000
6,000
7,000
2010 2020
Revenues
Revenues (€million)
Revenue possibility of €7 billion by 2020
Carsharing Market Revenue (Europe)
9
Carsharing Membership (Europe)
2010 2020
Source: Frost & Sullivan

France
OthersSpain The United Kingdom
60%
80%
100%
France, The United Kingdom, Germany and Switzerland are Expectedto Together Hold Around 75% of the Revenue Share in 2016
Revenue Growth CAGR 2010–2017
Key – Revenue Potential in 2017:
> 100 - < 500 € Million
> 500 € Million
> 40 - < 100 € Million
< 40 € Million
Total Revenue Forecasts for Carsharing Market – by Country (Europe), 2010 - 2017
Partnership between localauthorities and operators hasdelivered successful schemes, esp.in London, where 4000 newparking bays are expected by 2013
Lack of governmentsupport to limit adoptionand saturate the market.
Fewer number of mainstream operators tolimit expansion andcarsharing coverage.
10
Belgium
Austria
Germany
Italy
The Netherlands
Switzerland
Sweden
0%
20%
40%
0 20 40 60 80 100
Revenues in 2010 (€ Million)
Revenue Growth CAGR 2010
• Higher hourly charge/mileage charge of EVs compared to traditional powertrain vehicles are likely to increase
revenue share for countries such as France and the United Kingdom and they are expected to have a revenue CAGR of
80% and 55% respectively
Bubble Size: 2016 Members
Note: All figures are rounded; the base year is 2009. Source: Frost & Sullivan
and saturate the market.
Note: Others include, Denmark, Finland, Greece, Ireland, Luxembourg, Portugal

8%
16%
24%
16,287
77,254
9,000
12,000
15,000
2012
2014
Vehicles
Around 77,000 Vehicles Expected in the Carsharing market by 2016, Potential to Replace More Than 1 Million Vehicles
Total Forecasts for Carsharing Vehicles (Europe), 2010 and 2016
Vehicles CAGR : 28.6%
Germany The United Kingdom Switzerland France Others
11
35%
27%
18%
17%
3%
24%
28%
2010 2016
0
3,000
6,000
The United
Kingdom
Germany Switzerland France Others
Vehicles
• Vehicles replaced would lead to reduced congestion, parking spaces and with EVs being an attraction, there is a
significant emission reduction that can be achieved due to carsharing alone.
estimated
Note: All figures are rounded; the base year is 2009. Source: Frost & SullivanNote: Others include Austria, Belgium, Italy, The Netherlands, Spain, Sweden, Denmark, Finland,Greece, Ireland, Luxembourg, Portugal

Future Mobility Concepts: The Concept of a Dynamic Transport Solution Integrating Different Modes Under a Single Entity to make Personal Transportation Easy and Simple
MultiModality Paving way to Mobility Integrators – One Stop Shop Mobility Solutions provider
Suburbs
Intercity
TRAVEL DISTANCE
Private CarsIntercity Bus
Intercity Train
Mobility Integrator
Transport Operators
Rail Bus
Carsharing
Bikes
Telecom Operators
Online Mobility Booking Agencies:
Long Distance Mobility
12
Future Mobility is not just about vehicles, it is a convergence of different industry sectors that is
interacting seamlessly Mobility Integrators (MI) to offer various types of mobility solutions to complement commuters inter-modality and multi-
modality travel split.
City
TRAVEL DISTANCE
TRAVEL DISTANCEDestination
PublicTransportation
Private Cars
Carsharing
Micro-mobility
Intercity Bus
Technology Solutions Provider
WEB 2.0WEB 2.0
MOBILE MOBILE 2.02.0
Technology Evolution
Short Distance Urban Mobility
Payment Engine
EV Charging, Telematics Providers

UK and Germany, which Comprise 60% of EU member Market Share are to be Driven by For-profit Carsharing Businesses
Non-profit Co-operativeFor-profit
FinancingSponsorships,
subscriptions and grants
Easy access to capital
Subscribers or members
Growth Potential Low High Medium
Geography
• Germany
• The United Europe wide
• Sweden
•Germany
Type of Business Models and Forecast (Europe), 2010 and 2017
2010
13
Geography • The United Kingdom
Europe wide •Germany
• Switzerland
Geographic Expansion
Local InitiativesHigh potential for
growthMostly regional initiatives
Government Support
High Low Low / Medium
• Leasing an individual private vehicle into a carsharing fleet.• Insurance, technology and reservation taken care by the CSO.• CSOs can acquire/lease a vehicle at a lower cost while the individual can lease anunused vehicle.• Revenue sharing potential for both CSOs and the car-leasing individual.
Note: All figures are rounded; the base year is 2009. Source: Frost & Sullivan
2017
Peer-to-peer Carsharing
estimated

One-way trips crucial for a typical Pay-As-You-Drive Carsharing Model
Pro
fit
Bu
sin
es
s M
od
el
• Pay-by-the minute and On-demand mobility concept with 200 smart cars in Stuttgart by 2012
Co
op
era
tive
Bu
sin
es
s M
od
el
• Reserve, Drive, Refuel & Return
• 1250 stations with 2500 cars across Switzerland
14
Fo
r-P
rofi
t B
us
ine
ss
Mo
de
l
• 600k Rentals completed in Ulm since March 2009
• Fleet of 300 smart fortwo's Micro Hybrids
• Maximum €12.90 per hour
• Open-ended, floating parking and one-way trips possible.
• 90% of car rentals in Ulm project used one-way trips C
oo
pe
rati
ve
Bu
sin
es
s M
od
el
• 16 vehicles across 10 tariff plans
• Only round-trips allowed
• Drive credit worth CHF 25 for referral scheme
• 2300 – 0700 hrs at 50% daytime tariff rates
• Tie-up with Hertz & Avis for the car-rental scheme to share weekend and holiday demand

Roadmap of CSOs by Demographics (Europe), 2007- 2015
Carsharing is Currently an Urban Phenomenon and Competition to Drive For-profit Companies to Semi-urban and Rural Areas
DEMOGRAPHICS
SEMI -
URBAN
URBAN Traditional CSO (Cambio, Sunfleet)
Traditional CSO
Rental Companies
Traditional CSO
Rental Companies (Avis, Hertz)
Integration with Carpooling (Zimride)
15
Source: Frost & Sullivan
Key: High Presence
Medium Presence
Low Presence
2007 2011 2015
DEMOGRAPHICS
RURAL
SEMI
URBAN
Traditional CSO Traditional CSO
Rental Companies Rental Companies
Rental Companies
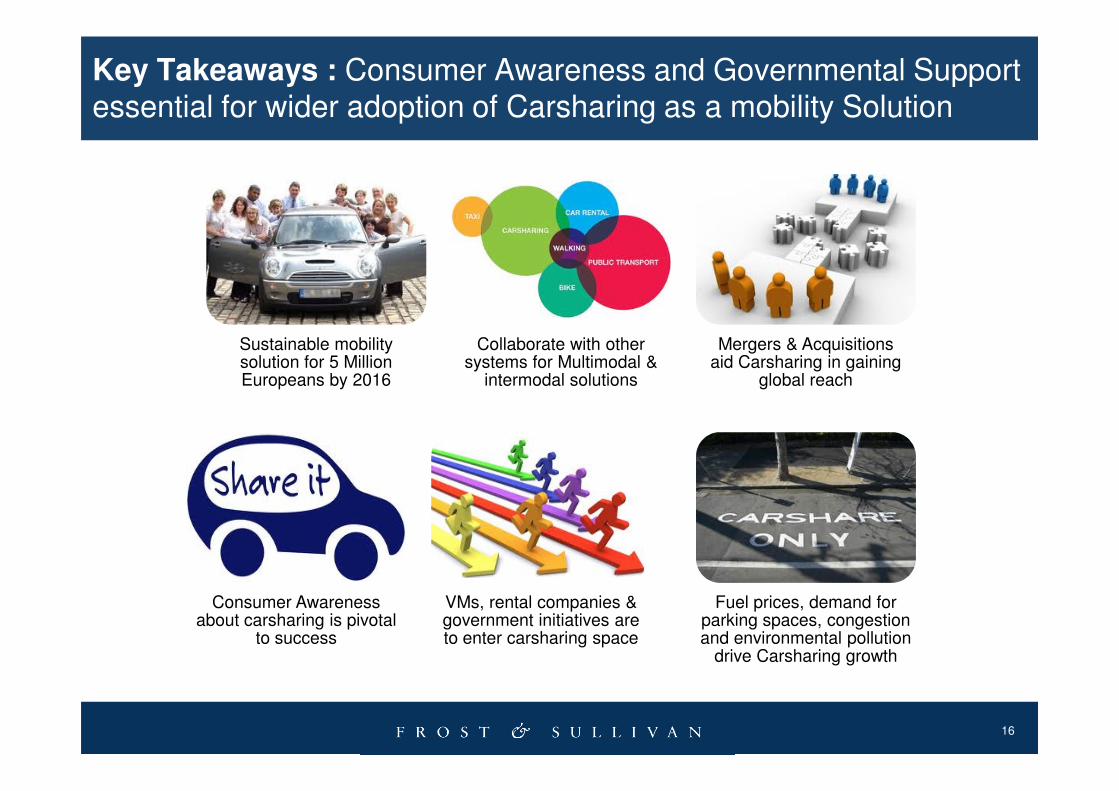
Key Takeaways : Consumer Awareness and Governmental Support essential for wider adoption of Carsharing as a mobility Solution
Sustainable mobility solution for 5 Million Europeans by 2016
Collaborate with other systems for Multimodal &
intermodal solutions
Mergers & Acquisitions aid Carsharing in gaining
global reach
16
Consumer Awareness about carsharing is pivotal
to success
VMs, rental companies & government initiatives are to enter carsharing space
Fuel prices, demand for parking spaces, congestion and environmental pollution
drive Carsharing growth

Contact Details
THANK YOU
17
Frost & Sullivan4, Grosvenor GardensLondon SW1W 0DHUnited Kingdom
www.frost.com
Franck Leveque
Vice President Growth Consulting, Automotive
& Transportation
Direct: +49 (0)69 770 33 21
Mobile: +49 (0)151 27 67 08 24
Email : [email protected]