
A stochastic simulation framework for truck and shovel ... · demonstrated through the application...
11
Introduction There are three different mechanisms of discrete, continuous, and hybrid material transportation in open mines, including (but not limited to) (i) truck and shovel system (discrete), (ii) slurry piping (continuous), and (iii) in-pit crusher and conveyor belts (hybrid). Although each mechanism has its own advantages, the truck and shovel system is the dominant method of material loading and handling in open pit mines, owing to its high production rate, excellent flexibility, relatively low operating and capital costs, and good maintainability. General objectives of optimal equipment selection include (i) meeting the long- and short-term requirements of production rates, (ii) human and equipment safety, (iii) environmental protection, and (iv) economic operations (Figure 1). The two most important decision factors regarding selection of a truck and shovel system are the equipment geometry and size. Geometry (equipment width, weight, turning radius, swing angle, etc.) is controlled mostly by mine design and layout, as well as the operational constraints. After selection of a favorable geometry based on the constraints, the next step is to select the equipment manufacturer. Once the geometry and manufacturer are selected, the next step is to decide on the models (bucket size) and required numbers of each unit. Because of the undeniable effect of a proper truck-shovel system selection and sizing plan on open pit mines economics, many researchers have tried to study this issue using different techniques such as linear programming (Edwards, Malekzadeh, and Yisa, 2001), analytical hierarchy process (Ayağ, 2007), nonlinear programming (Søgaard and Sørensen, 2004), genetic algorithms (Aghajani, Osanloo, and Akbarpour, 2007; Marzouk and Moselhi, 2003), mixed integer programming (Camarena, Gracia, and Cabrera Sixto, 2004), machine repair modelling (Krause and Musingwini, 2007), queuing theory (Komljenovic, Paraszczak, and Fytas, 2004), and conventional spreadsheet calculations based on experience, engineering judgment, and manufacturers’ catalogues (Burt et al., 2005). Due to the large number of parameters that affect the system performance and the stochastic nature of the input variables, developing a deterministic mathematical optimization solution for the problem is extremely difficult, if not impossible (Haldar and Mahaderan, 2000). A stochastic simulation framework for truck and shovel selection and sizing in open pit mines by S.R. Dindarloo*, M. Osanloo † , and S. Frimpong* Synopsis Material handling in open pit mining accounts for about 50% of production costs. The selection and deployment of efficient, safe, and economic loading and haulage systems is thus critical to the production process. The problems of truck and shovel selection and sizing include determination of the optimal number and capacities of haulage and loading units, as well as their allocation and operational strategies. Critical survey and analysis of the literature has shown that deterministic, stochastic, and experimental approaches to these problems result in considerably different outputs. This paper presents a comprehensive simulation framework for the problem of truck and shovel selection and sizing based on the random processes underlying the network-continuous-discrete event nature of the mining operation. The framework builds on previous research in this field and attempts to address limitations of available methodologies in the form of a comprehensive algorithm. To test the validity of the framework a large open pit mine was evaluated. The stochastic processes governing the uncertainties underlying the material loading and haulage input variables were defined and built into the stochastic model. Discrete event simulation was used to simulate the stochastic model. The proposed model resulted in several modifications to the case study. Keywords truck and shovel operation, stochastic simulation framework, equipment selection and sizing. * Department of Mining and Nuclear Engineering, Missouri University of Science & Technology, Rolla, MO. † Department of Mining and Metallurgical Engineering, Amirkabir University of Technology, Tehran, Iran. © The Southern African Institute of Mining and Metallurgy, 2015. ISSN 2225-6253. Paper received Jul. 2014; revised paper received Feb. 2015. 209 The Journal of The Southern African Institute of Mining and Metallurgy VOLUME 115 MARCH 2015 ▲
Transcript of A stochastic simulation framework for truck and shovel ... · demonstrated through the application...

IntroductionThere are three different mechanisms ofdiscrete, continuous, and hybrid materialtransportation in open mines, including (butnot limited to) (i) truck and shovel system(discrete), (ii) slurry piping (continuous), and(iii) in-pit crusher and conveyor belts (hybrid).Although each mechanism has its ownadvantages, the truck and shovel system is thedominant method of material loading andhandling in open pit mines, owing to its highproduction rate, excellent flexibility, relativelylow operating and capital costs, and goodmaintainability. General objectives of optimalequipment selection include (i) meeting thelong- and short-term requirements ofproduction rates, (ii) human and equipmentsafety, (iii) environmental protection, and (iv)economic operations (Figure 1).
The two most important decision factorsregarding selection of a truck and shovelsystem are the equipment geometry and size.
Geometry (equipment width, weight, turningradius, swing angle, etc.) is controlled mostlyby mine design and layout, as well as theoperational constraints. After selection of afavorable geometry based on the constraints,the next step is to select the equipmentmanufacturer. Once the geometry andmanufacturer are selected, the next step is todecide on the models (bucket size) andrequired numbers of each unit.
Because of the undeniable effect of aproper truck-shovel system selection andsizing plan on open pit mines economics,many researchers have tried to study this issueusing different techniques such as linearprogramming (Edwards, Malekzadeh, andYisa, 2001), analytical hierarchy process(Ayağ, 2007), nonlinear programming(Søgaard and Sørensen, 2004), geneticalgorithms (Aghajani, Osanloo, andAkbarpour, 2007; Marzouk and Moselhi,2003), mixed integer programming(Camarena, Gracia, and Cabrera Sixto, 2004),machine repair modelling (Krause andMusingwini, 2007), queuing theory(Komljenovic, Paraszczak, and Fytas, 2004),and conventional spreadsheet calculationsbased on experience, engineering judgment,and manufacturers’ catalogues (Burt et al.,2005). Due to the large number of parametersthat affect the system performance and thestochastic nature of the input variables,developing a deterministic mathematicaloptimization solution for the problem isextremely difficult, if not impossible (Haldarand Mahaderan, 2000).
A stochastic simulation framework for truckand shovel selection and sizing in open pitminesby S.R. Dindarloo*, M. Osanloo†, and S. Frimpong*
SynopsisMaterial handling in open pit mining accounts for about 50% of productioncosts. The selection and deployment of efficient, safe, and economicloading and haulage systems is thus critical to the production process. Theproblems of truck and shovel selection and sizing include determination ofthe optimal number and capacities of haulage and loading units, as well astheir allocation and operational strategies. Critical survey and analysis ofthe literature has shown that deterministic, stochastic, and experimentalapproaches to these problems result in considerably different outputs. Thispaper presents a comprehensive simulation framework for the problem oftruck and shovel selection and sizing based on the random processesunderlying the network-continuous-discrete event nature of the miningoperation. The framework builds on previous research in this field andattempts to address limitations of available methodologies in the form of acomprehensive algorithm. To test the validity of the framework a largeopen pit mine was evaluated. The stochastic processes governing theuncertainties underlying the material loading and haulage input variableswere defined and built into the stochastic model. Discrete event simulationwas used to simulate the stochastic model. The proposed model resulted inseveral modifications to the case study.
Keywordstruck and shovel operation, stochastic simulation framework, equipmentselection and sizing.
* Department of Mining and Nuclear Engineering,Missouri University of Science & Technology,Rolla, MO.
† Department of Mining and MetallurgicalEngineering, Amirkabir University of Technology,Tehran, Iran.
© The Southern African Institute of Mining andMetallurgy, 2015. ISSN 2225-6253. Paper receivedJul. 2014; revised paper received Feb. 2015.
209The Journal of The Southern African Institute of Mining and Metallurgy VOLUME 115 MARCH 2015 �

A stochastic simulation framework for truck and shovel selection and sizing in open pit mines
A truck and shovel operation is a set of discrete-eventactivities, i.e. loading, hauling, dumping, and returning,which all occur in a stochastic manner (Figure 2). Discrete-event system simulation (DES) is a modelling method forsuch time-discrete and probabilistic phenomena (Schriber,1992). Other abovementioned techniques have differentlimitations in addressing this problem comprehensively andaccurately (Schriber, 1991). These limitations includedeterministic pre-assumptions and/or not considering thereal-world system specifications through derivation andapplication of relevant time-frequency distributions for thedifferent operations involved. Most of these techniquestherefore do not lead to robust models (Burt et al., 2005).However, DES has been employed by different researchers inmining engineering through available software andlanguages such as GPSS, SIMAN-ARENA, and SLAM (Baffiand Ataeepur, 1996; Runciman, Vagenas, and Newson, 1996;Awuah-Offei, Temeng, and Al-Hassan, 2003; Ross et al.,2010; Sturgul, and Thurgood, 1993). Most of the studies todate have endeavoured to evaluate some what-if scenarios inorder to understand the possible effects of changing differentinput variables on the overall economics of current operatingmines. For instance, (Stout et al., 2013) used Arena tosimulate a truck and shovel operation. Very good backgroundreviews of the application of this technique in the miningindustry can be found in Sturgul, (1995, 1999) and Hollocks,(2006).
Previous studies (Burt et al., 2005) have shown thatdifferent approaches, including deterministic, stochastic, andexperimental methodologies, result in considerabledifferences in outputs. These techniques lead to differentsolutions regardless of the quality of the technique/softwareitself or the knowledge of the modelling team. Hence, the firststep is to develop a comprehensive simulation framework forthe problem of truck and shovel selection, sizing, anddispatching in open pit mines that obtains nearly the sameoptimal results for the same input variables, regardless of thetechnique employed (Burt, and Caccetta, 2014). In this study,a simulation technique was selected to solve the problem dueto: i) possibility of incorporating uncertainties in differentgoverning activities of the system, ii) extensive backgroundof application of the technique in previous research and realworld practices, iii) dynamic nature of the technique, whichmakes it applicable during the entire life of mine, and iv)relatively wide range of available software and languages.
This paper introduces a methodology and sensitivityanalysis procedure for mine loading and haulage systemselection and sizing. In addition, the capability of the DEStechnique in bulk material handling simulation isdemonstrated through the application of the GPSS/Hsimulation language. The proposed framework was validatedand tested in a large open pit mine. All steps in the proposedframework were followed attentively to ensure itseffectiveness. However, due to space limitation, only the mostimportant main components are discussed here, i.e. problemdefinition, data acquisition, statistical analysis, simulationlanguage (technique) selection, model construction, modelverification and validation, and sensitivity analysis. Moreinformation about the simulation history and GPSS/Hbackground is given in Schriber (1992), Hollocks (2006),Nance (1995), Pidd and Carvalho (2006), and Robinson,(2005). The paper is organized as follows:
� Proposed simulation frameworks for both new andexisting systems
� Introduction of the case study � Model building, verification, and validation � Flow chart for performing sensitivity analysis � Results, with a discussion of the optimal results� Concluding remarks.
Several important steps of simulation of the case studyare presented in more details in the Appendix.
Simulation frameworkThe lack of a comprehensive simulation framework in thisfield has resulted in considerably different solutions to theproblem of truck and shovel system selection and sizing.Major source of these confusing differences include, but arenot limited to:
� Different simulation approaches� Different data requirements (quantity, quality, and
statistical methodology)� Insufficient technical communication during all phases
of the project� Insufficient determination of the objectives, resources,
and constraints.
This study proposes a truck and shovel simulationframework for minimizing the errors due to erroneous orinaccurate assumptions and procedures, and provides a step-by-step simulation guideline. The algorithm attempts torender a framework for truck and shovel operationsimulation. In the construction of the simulation framework,different blocks (Figure 2) were obtained from most of the
�
210 MARCH 2015 VOLUME 115 The Journal of The Southern African Institute of Mining and Metallurgy
Figure 1—Essentials of equipment selection
Figure 2—Schematic of truck and shovel operation

available journal articles. The most important findings of theprevious studies were selected and incorporated to achieve anefficient simulation strategy.
The first step in developing this framework, with thegoals of completeness, comprehensiveness, and robustness,was to identify the major components of a general simulationmodelling practice, regardless of the area of application. Ageneral simulation framework is illustrated in Figure 3. Thisprimary platform was set to serve as the structure of theframework and consequently was customized through theintroduction of open pit mining specifications. These specifiedcharacteristics were derived from published articles in thefield of mining operations simulation and modelling and wereincorporated in the base structure. The base framework wascomposed of the following components:
� Problem definition, objectives, resources, andlimitations:
� Data acquisition and statistical processing� Model construction� Model modification, verification, and validation� Sensitivity analysis and decision-making strategies.
It should be noted that there are several pitfalls in ageneral simulation practice (Maria, 1997) as follows: unclearobjective, invalid model, simulation model too complex or toosimple, erroneous assumptions, undocumented assumptions,and using the wrong input probability distribution.
The above pitfalls were incorporated in the proposedsimulation framework for the truck and shovel selection andsizing problem.
The secondary mine-specific characteristics thatcontribute to mining operational performance include:
(1) Incorporation of the mining-environmental inducedconstraints
(2) Different traffic-dispatching scenarios(3) Different loading methods(4) Selection of hybrid or uniform loading/haulage fleets.
The framework is divided in two categories, for new andexisting systems (Figures 4 and 5 respectively). Since in anew mine there is no operational data available, thesimulation procedure needs extra considerations. Theseconsiderations are illustrated in the flow chart of Figure 4. Inaddition, a sensitivity analysis algorithm is presented later(Figure 12) that follows the simulation framework toevaluate different scenarios in mine truck and shovel systemselection and sizing.
The main advantage of this simulation framework incomparison with other research is its comprehensiveaddressing of the problem of truck and shovel selection. Allother available practices try to find solutions to specific partsof the problem, mainly in the form of what-if analysis. Forinstance, what would be the effect of adding one extra truckto the haulage fleet? Moreover, the framework is capable ofaddressing both a new and an existing open pit mineoperation. This framework can add to the strength ofsimulation techniques in solving the problem compared toother abovementioned methods, which address the problemonly partially.
Although this framework was validated in a large surfacemine in this study, for other projects some modificationsshould be incorporated accordingly. For instance, productionplanning strategies in a mine with restricted processing plantrequirements or ore grade limits dictate more frequent
A stochastic simulation framework for truck and shovel selection and sizing in open pit mines
211The Journal of The Southern African Institute of Mining and Metallurgy VOLUME 115 MARCH 2015 �
Figure 3—A general simulation flow chart (Banks, 2010)

relocations of working faces, compared with a mine withmore stable and predictable ore grade fluctuations. Thesedifferences introduce frequent changes in haulage distancesand, hence, to the simulation approach at hand. Anotherexample is the difference between a small surface mine withmore short-term concentrated production plans and a largemine with more strategic and long-term plans. These types ofspecifications require more or less consideration of someblocks of the framework than others, accordingly (Figure 5).
Case studyGolegohar iron ore mine is located in southern Iran, 50 kmfrom Sirjan, in the southwest of Kerman Province (latitude29°7′N and longitude 55°19′E, Figure 6). This iron complexincludes six known ore reserves and is one of the largestproducers and exporters of iron concentrate in the country. It has a measured and indicated reserve of over 1 100 Mt ofore (Golegohar Iron Ore Complex, 2006). In Golegohar, over 10 Mt of iron concentrate is produced annually, through
crushing, dry and wet grinding, and low-intensity magneticseparation (Figure 7).
To test the simulation framework, the operation of thecurrent haulage system at Golegohar was investigated andnecessary data collected. After statistical analysis of the rawdata and deriving probabilistic distributions for each data-set
A stochastic simulation framework for truck and shovel selection and sizing in open pit mines
�
212 MARCH 2015 VOLUME 115 The Journal of The Southern African Institute of Mining and Metallurgy
Figure 5a—The proposed simulation framework for existing mines;Phase I: Preparation and information
Figure 4—The proposed simulation framework for new mines
Figure 5b—The proposed simulation framework for existing mines;Phase II: Execution
Figure 5c—The proposed simulation framework for existing mines;Phase III: Evaluation and decision

A stochastic simulation framework for truck and shovel selection and sizing in open pit mines
The Journal of The Southern African Institute of Mining and Metallurgy VOLUME 115 MARCH 2015 213 �
Figure 6—Location of Golegohar iron ore mine
(Carlsberg, 2011), a DES model was coded in GPSS/H(student version). In the next step, the proposed model wasverified and then validated by comparing it with the realmine data by means of statistical tests (e.g. chi square)(Zimmermann, 2008). A series of sensitivity analyses wereperformed for the purpose of establishing the optimumnumber of cable shovels and dump trucks required to meetthe production targets with the maximum possible systemproductivity. The simulation model was run with differentcombinations of the truck and shovel system numbers in amatrix pattern in order to identify the most appropriatesystem. The major constraint was set to achieve the annual
production rate, and the main goal to accomplish the job witha minimum amount of equipment. Different scenarios weretested to find the highest equipment utilization and minimumidle and waiting time in queues. A dispatching system wasintroduced with the main objective of minimizing shovel idletime and the number of trucks in queues. The most importantdata acquired in the observation phase included mineproduction plans and layouts, current fleet geometry andparameters, and time data of the real system. Details of theapplied methodology are illustrated in Figure 5.
Observation of the current system
Direct observation of the loading and haulage operations over150 days, during different shifts and hours, resulted inrecognition of the following problems in the current system:
� Truck loading method was single-sided� On many occasions, only two out of the four cable
shovels were operating. The other two were not used,either because of frequent mechanical failures or lackof proper working faces
� Shovels idle times were too long (mostly over 6minutes). On some occasions, three or more truckswere arriving together (trucks queue)
� Almost always, there was a long queue before theprimary crusher. The average queue length was fourtrucks (in random observations) and the averagewaiting time for each truck was 11.5 minutes
� There was no haulage fleet dispatching system in themine
� The main bottleneck in the haulage fleet flow was atthe primary crusher.
Figure 7—Working area showing main ramps, roads and dumps(source: Google Earth, 2014)

Model constructionAfter obtaining and analysing all necessary data, the nextstep was to construct a simulation model by programming inGPSS/H (student version). GPSS/H (General PurposeSimulation System) is both a computer language and acomputer program. It was designed for studying systemsrepresented by a series of discrete events. GPSS/H is a low-level, nonprocedural language. GPSS/H was selected as thesimulation language as part of this study, for the followingreasons:
(i) It is multivendor, so it is continually being upgraded(ii) It is widely available (iii) It is written in machine language and, therefore, is
inherently very fast(iv) It can solve a wide variety of problems rapidly and
accurately(v) It has proved to be extremely versatile for modelling
mining operations. These include both surface andunderground operations, as well as material flowthrough a smelter, mill, and refinery. It is easilycoupled with PROOF for making animations(Sturgul, 2000).
A block diagram of the case study is illustrated in Figure 8.
It should be noted that, due to the application ofprobability distribution and random numbers in a queuesystem simulation (Figure 8), and for error reductionpurposes, the final model, which consisted of 115 GPSSblocks, was executed with different random data-sets.
Model animation and validationSome issues can be investigated easily in an animation thatwould be very hard to catch in the simulation model – likecollisions or subtle logic glitches. The ability to see a model inaction makes animation a great verification tool for the model
builder (Ståhl et al., 2011; Wolverine Software, 2013;University of Nevada, 2013). An animation model of the casestudy was executed by importing the GPSS/H model outputsto Proof Animation software. Observation of the animationmodel for different durations demonstrated that the proposedmodel logic had been achieved.
Model validation, as the most important phase of a DESexercise, was performed through comparison of the modeloutputs with the real system’s data by designing statisticaltests, e.g. chi-square and Kolmogorov-Smirnov at 5% signif-icance level (Ross, 2006; Zimmermann, 2008). For thispurpose, a new set of actual data, separate from the dataused in the model, was collected. Three samples of thecomparison results are illustrated in Figures 9–11, whichwere validated through chi-square method at the 5% signif-icance level.
Further processingA flow chart of the sensitivity analysis is presented in Figure 12. To evaluate the effectiveness of employing anappropriate traffic-dispatching strategy, the current modelwas modified to take this issue into account. The main goalof the dispatching algorithm was set to assign the incomingtrucks first to the idlest shovels. However, many other what-if type questions may be answered by this model withminimum cost, safety issues, and disturbance to the currentoperation routines e.g. the effect of operators’ skills, changesin road grades, the possibility of increasing the primarycrusher’s capacity, purchasing new trucks to replace someolder ones with low mechanical availabilities (Burt et al.,2011), changing the current truck sizes (Bozorgebrahimi,Hall, and Morin, 2005), employing a hybrid haulage fleet,different dispatching strategies (Alarie and Gamache, 2002),feasibility of changing the current system to a conveyor beltsystem as the depth of the mine increases (Mcnearny andNie, 2000).
A stochastic simulation framework for truck and shovel selection and sizing in open pit mines
�
214 MARCH 2015 VOLUME 115 The Journal of The Southern African Institute of Mining and Metallurgy
Figure 8—Block diagram of the case study operation flow

A stochastic simulation framework for truck and shovel selection and sizing in open pit mines
The Journal of The Southern African Institute of Mining and Metallurgy VOLUME 115 MARCH 2015 215 �
Discussion of the simulation resultsTo demonstrate the capabilities of simulation in what-ifanalysis, a sample of the many analyses conducted in thisstudy is discussed below:
Figure 13 illustrates the effect of the haulage fleet size onthe number of production cycles per shift when only twoshovels are operating. Increasing the number of dump trucksresults in an increase of production rate per shift up to anoptimum point. After that, because of the haulage fleetoversize and limited number of shovels (only two in thiscase), much time will be wasted in different truck queues atshovels. This results in no further increase in production.After this point the extra dump trucks in the system will be
Figure 9—Production comparison
Figure 10—Shovel utilization
Figure 11—Number of idle trucks (queue length)
Figure 12—Flow chart of the sensitivity analysis

put into queues, thus making no contribution to production(Sturgul, 1995). Thus, the maximum production rate withtwo shovels is achieved with 22 dump trucks. This rate is 9.5 M t/a, which does not meet the minimum productionrequirements of the mine. At least three shovels are needed.The effect of the number of shovels on production rate isdemonstrated in Figure 14. The simulation outputs show thatincreasing the number of shovels will result in moreproduction with an equal number of trucks. For this range oftruck numbers, operation with three and four shovels resultsin almost the same production rates. This is due to the factthat at least one of the shovels would be idle for most of a
shift. Obviously, operating four loaders is not justified. Atthis point, three cable shovels will be the best choice for themine’s production target.
The effect of the size of both the haulage and the loadingfleet on effective shovel working hours is illustrated in Figure 15.
Figure 16 shows the effect of application of a trafficdispatching system on the mine’s operation. Regardless ofthe number of trucks, a proper dispatching strategy increasesthe productivity of the system.
Summary of the optimal resultsTable I shows that the modifications suggested by thesimulation result in a 10% increase in production.Furthermore, using one less cable shovel contributes toincreasing the mine profitability by introducing loweroperational costs (assuming that the operational cost of onelarge shovel outweighs the associated costs of operating twoadditional trucks).
ConclusionsThe truck and shovel system is the dominant method ofmaterial loading and haulage in open pit mining. Properselection and sizing of the equipment has considerable effectson a mine’s productivity and economics. A critical survey andanalysis of the literature showed that deterministic,stochastic, and experimental methodologies for optimizingtruck and shovel systems result in considerably differentoutputs. Thus, designing a comprehensive modellingframework is of high importance in system selection andsizing for mining operations. In addressing this issue, astochastic simulation framework for truck and shovel systemselection and sizing, for both new and existing open pitmines, was proposed. As part of the study, a propersimulation technique (discrete-event system simulation) andlanguage (GPSS/H) were employed. Simulations werevalidated through real operations at a large open pit mine.The proposed framework is a useful guideline and should beapplied accordingly based on the specific characteristics of theparticular loading and haulage operation. Consideration of allthe effective parameters and their interactions with thesystem, which are elaborated in the proposed framework,should be the top priority of a mine simulation team.Application of the proposed methodology resulted in consid-erable improvements in loading and haulage operations at
A stochastic simulation framework for truck and shovel selection and sizing in open pit mines
�
216 MARCH 2015 VOLUME 115 The Journal of The Southern African Institute of Mining and Metallurgy
Figure 16—Regular vs. Dispatching (3-month plan)
Figure 13—Effect of number of trucks on production (per simulatedshift) for two cable shovels
Figure14—Effect of both the number of trucks and cable shovels on oreproduction (per simulated shift)
Figure 15—Effect of both the number of trucks and cable shovels onshovels working time % (per simulated shift)

A stochastic simulation framework for truck and shovel selection and sizing in open pit mines
The Journal of The Southern African Institute of Mining and Metallurgy VOLUME 115 MARCH 2015 217 �
a large open pit mine, with production rate increasing byabout 10%.
References
AGHAJANI, A., OSANLOO, M., and AKBARPOUR, M. 2007. Optimising the loadingsystem of Gol-e-Gohar iron ore mine of Iran by genetic algorithm.Australasian Institute of Mining and Metallurgy Publication Series.Melbourne. pp. 21–215.
ALARIE, S. and GAMACHE, M. 2002. Overview of solution strategies used in truckdispatching systems for open pit mines. International Journal of SurfaceMining, Reclamation and Environment, vol. 16, no. 1. pp. 59–76.
AWUAH-OFFEI, K., TEMENG, V.A., and AL-HASSAN, S. 2003. Predicting equipmentrequirements using SIMAN, a case study. Mining Technology, vol. 112.pp. A180–A184.
AYAĞ, Z.Z. 2007. A hybrid approach to machine-tool selection through AHPand simulation. International Journal of Production Research, vol. 45, no. 9. pp. 2029–2050.
BAFFI, E.Y. and ATAEEPUR, M. 1996. Simulation of a truck- shovel system usingArena. Proceeding of the 26th International Symposium on theApplication of Computers and Operations Research in the MineralIndustries (APCOM), Pennsylvania, USA. pp. 153–159.
BANKS, C.M. 2010. Introduction to modeling and simulation. Modeling andSimulation Fundamentals: Theoretical Underpinnings and PracticalDomains. Sokolowski, J.A. and Banks, C.M. (eds.). Wiley, Hoboken, NJ.pp. 1–24.
BOZORGEBRAHIMI, A., HALL, R.A., and MORIN, M.A. 2005. Equipment size effectson open pit mining performance. International Journal of Surface Mining,Reclamation and Environment, vol. 19, no. 1. pp. 41–56.
BURT, C., CACCETTA, L., HILL, S., and WELGAMA, P. 2005. Models for miningequipment selection. MODSIM05 - International Congress on Modellingand Simulation: Advances and Applications for Management and DecisionMaking, University of Melbourne, 12–15 December 2005. Zerger, A. andArgent, R.M. (eds.). pp. 1730–1736.
BURT, C., CACCETTA, L., WELGAMA, P., and FOUCHÉ, L. 2011. Equipment selectionwith heterogeneous fleets for multiple-period schedules. Journal of theOperational Research Society, vol. 62, no. 8. pp. 1498–1509.
BURT, C.N. and CACCETTA, L. 2014. Equipment selection for surface mining: areview. Interfaces, vol. 44, no. 2. pp. 143–162.
CAMARENA, E.A., GRACIA, C., and CABRERA SIXTO, J.M. 2004. A mixed integer
linear programming machinery selection model for multifarm systems.Biosystems Engineering, vol. 87, no. 2. pp. 145–154.
CARLBERG, C. 2011. Statistical analysis; Microsoft Excel 2010. Indianapolis,IN.
CARR, J.R. 2003. Simple random number generation. Computers andGeosciences, vol. 29, no. 10. pp. 1269–1275.
EDWARDS, D.J., MALEKZADEH, H., and YISA, S.B. 2001. A linear programmingdecision tool for selecting the optimum excavator. Structural Survey, vol. 19, no. 2. pp. 113–120.
GOLEGOHAR IRON ORE COMPLEX. 2006. Golegohar production reports.
HALDAR, A. and MAHADERAN, S. 2000. Probability, Reliability and StatisticalMethods in Engineering Design. John Wiley & Sons, New York. pp. 304.
HOLLOCKS, B.W. 2006. Forty years of discrete-event simulation: a personalreflection. Journal of the Operational Research Society, vol. 57, no. 12. pp.1383–1399.
KOMLJENOVIC, D., PARASZCZAK, J., and FYTAS, K. 2004. Optimization of shovel-truck systems using the queuing theory. CIM Bulletin, vol. 97. p. 76.
KRAUSE, A. and MUSINGWINI, C. 2007. Modelling open pit shovel-truck systemsusing the Machine Repair Model. Journal of the Southern African Instituteof Mining and Metallurgy, vol. 107. pp. 469–476.
MARIA, A. 1997. Introduction to modeling and simulation. Proceedings of theWinter Simulation Conference Proceedings, Atlanta, GA, 7–10 December1997. Andraótthir, A., Healy, K.J., Withers, D.H., and Nelson, B.L. (eds.).Association for Computing Machinery, New York. pp. 7–13.
MARZOUK, M. and MOSELHI, O. 2003. Constraint-based genetic algorithm forearthmoving fleet selection. Canadian Journal of Civil Engineering, vol. 30,no. 4. pp. 673–683.
MCNEARNY, R.L. and NIE, Z. 2000. Simulation of a conveyor belt network at anunderground coal mine. Mineral Resources Engineering, vol. 9, no. 3. pp. 343-–355.
NANCE, R.E. 1995. Simulation programming languages: an abridged history.Proceedings of the 1995 Winter Simulation Conference, Arlington, VA. pp. 1307–1313.
PIDD, M. and CARVALHO, A. 2006. Simulation software: not the same yesterday,today or forever. Journal of Simulation, vol. 1, no. 1. pp. 7–20.
ROBINSON, S. 2005. Discrete-event simulation: from the pioneers to the present,what next? Journal of the Operational Research Society, vol. 56, no. 6. pp. 619–629.
Table I
Comparison of results – current system vs. simulation recommended
Current system Recommendations
No. of trucks 18a 20b
No. of shovels 4 electric cable shovels (7.6 m3) 3 electric cable shovels (7.6 m3)Traffic dispatching strategy No YesLoading method Single DoubleOre production (kt/a) 9.130c (std. dev. = 143) 10.140d/ 72 (std. dev. = 143)Average target rate (t/a) 10 100 ± 200 10 100 ± 200Variance from the mine target (%) -9.6 % + 0.4 %
aHaulage fleet of 18 mechanically available dump trucks with nominal capacity of 105 t (actual 83-87 t)bHaulage fleet of 20 dump trucks with nominal capacity of 105 t (actual 83-87 t)cMean production rate in the past five years.dMean value of the normal frequency distribution obtained from 2000 iterations.

ROSS, I., CASTEN, T., MARSH, D., and PEPPIN, C. 2010. The role of simulation in
ground handling optimization at the Grasberg block cave mine. Hoist and
Haul 2010 - Proceedings of the International Conference on Hoisting and
Haulage, Las Vegas, 12–17 September 2010. Brokenshire, P. and
Andersen, S. (eds.). Society for Mining, Metallurgy & Exploration,
Littleton, CO. pp. 257–265.
ROSS, S.M. 2006. Statistical Modeling and Decision Science: Simulation. 4th
edn. Academic Press, Burlington, MA.
RUNCIMAN, N., VAGENAS, N., and NEWSON, G. 1996. Simulation modeling of
underground hard - rock mining operations using WITNESS. Proceedings
of the 26th International Symposium on the Application of Computers and
Operations Research in the Mineral Industries (APCOM), Pennsylvania,
USA. pp. 148–151.
SCHRIBER, T.J. 1991. An Introduction to Simulation using GPSS/H. John Wiley &
Sons, New York.
SCHRIBER, T.J. 1992. Perspectives on simulation using GPSS. Proceedings of the
24th Conference on Winter Simulation, Arlington, VA, 13–16 December
1992 . ACM Press. pp. 338–342.
SØGAARD, H.T. and SØRENSEN, C.G. 2004. A model for optimal selection of
machinery sizes within the farm machinery system. Biosystems
Engineering, vol. 89, no. 1. pp. 13–28.
STÅHL, I., HENRIKSEN. J., BORN, R., and HERPER, H. 2011. GPSS 50 years old, butstill young. Proceedings of the Winter Simulation Conference, Phoenix,AZ, 11–14 December 2011. Jain, S. Creasey, R.R., Himmelspach, J., White,K.P., and Fu, M. (eds). Institute of Electrical and Electronics Engineers,New York. pp. 3947–3957.
STOUT, C.E., CONRAD, P.W., TODD, C.S., ROSENTHAL, S., KNUDSENINT, HP. Simulationof a large multiple pit mining operation using GPSS/H. Journal of Miningand Mineral Engineering, 2013, vol. 4, no. 4. pp. 278–295.
STURGUL, J.R. 1992. Using exact statistical distributions for truck shovelsimulation studies. International Journal of Surface Mining andReclamation, vol. 6, no. 3. pp. 137–139.
STURGUL, J.R. 1995. Simulation and animation come of age in mining.Engineering and Mining Journal, vol. 6, no. 2. pp. 38–42.
STURGUL, J.R. 1999. Discrete mine systems simulation in the United States.International Journal of Surface Mining Reclamation and Environment,vol. 13. pp. 37–41.
STURGUL, J.R. 2000. Mine Design Examples Using Simulation. Society ofMining, Metallurgy and Exploration, Littleton, CO..
STURGUL, J.R. and THURGOOD, S.R. 1993. Simulation model for materialshandling system for surface coal mine. Bulk Solids Handling, vol. 13, no. 4. pp. 817–820.
UNIVERSITY OF NEVADA. 2013. Mine Systems Optimization and SimulationLaboratory. Mining and Metallurgical Engineering Department, Universityof Nevada, Reno. http://www.unr.edu/mining/research/mine-systems-optimization-and-simulation
WOLVERINE SOFTWARE. 2013. http://www.wolverinesoftware.com.
ZIMMERMANN, A. 2008. Stochastic Discrete Event Systems: Modeling,Evaluation, Applications. Springer.
Appendix A
The basic steps of the proposed simulation program aresummarized here to familiarize readers with the underlyingprocess. Readers might follow the procedure to simulate theirown mining operations. However, detailed application of theproposed simulation framework is recommended for a morecomprehensive practice.
Step 1All loading units should be monitored carefully duringdifferent operating conditions. Necessary loading cycle timesare measured during this phase. Table A.1 shows a sample ofdata collected in this case study.
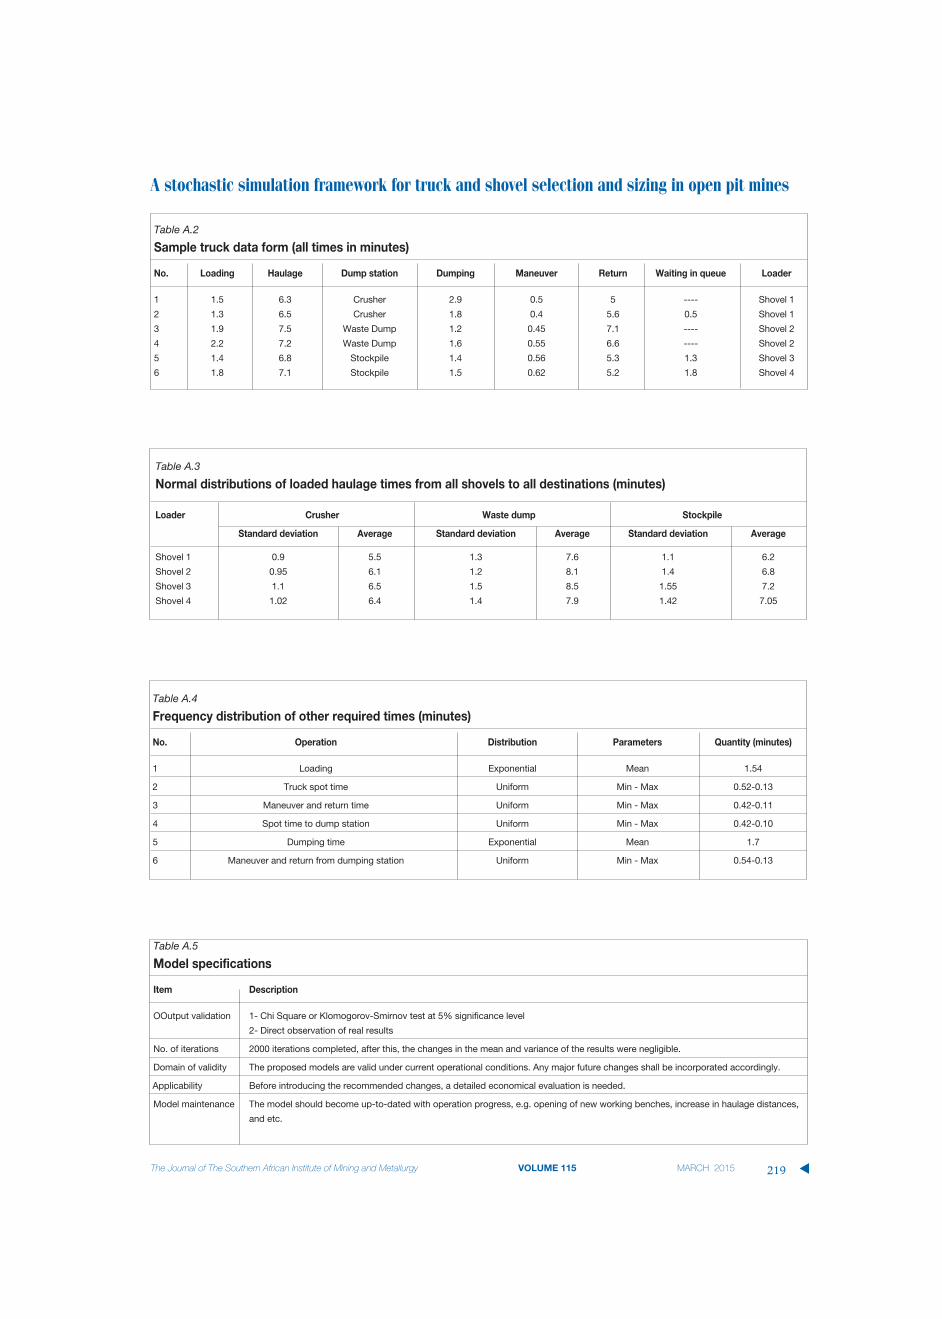
Step 2All haulage cycle times for all dump trucks should becollected. Loading and dumping stations, as well as, thenumber of idle trucks in queues, are required data in thisphase. (Table A.2).
Data statistical analysis
Step 3 The raw data obtained in the previous two phases should be analysed to derive statistical information. Probability distri-bution functions (PDFs) are required data for Monte Carlostochastic sampling (Burt et al., 2011) and discrete-eventsimulation by GPSS/H (Bozorgebrahimi, Hall, and Morin,2005) (Table A.3).
Step 4
All the PDFs in Table A.4 are needed along with Step 3, asthe minimum requirements of the simulation program.
Step 5
Finally, a simulation program should be coded. A blockdiagram of the program is illustrated in Figure 8. For a verygood source of GPSS/H programming see Sturgul (1995).
Step 6
Based on the simulation purposes, relevant sensitivityanalysis might be executed (see Figure 12).Some important specifications of the introduced model of thecase study are summarized in Table A.5. �
A stochastic simulation framework for truck and shovel selection and sizing in open pit mines
�
218 MARCH 2015 VOLUME 115 The Journal of The Southern African Institute of Mining and Metallurgy
Table A.1
Sample shovel data form (all times in minutes)
No. Loading Shovel Shovel Truck waiting Trucks in posing idle time time in queue queue
1 1.73 0.36 0 3.2 2
2 1.64 0.32 0 1.6 1
3 1.82 0.56 6.8 0 0
A stochastic simulation framework for truck and shovel selection and sizing in open pit mines
The Journal of The Southern African Institute of Mining and Metallurgy VOLUME 115 MARCH 2015 219 �
Table A.4
Frequency distribution of other required times (minutes)
No. Operation Distribution Parameters Quantity (minutes)
1 Loading Exponential Mean 1.54
2 Truck spot time Uniform Min - Max 0.52-0.13
3 Maneuver and return time Uniform Min - Max 0.42-0.11
4 Spot time to dump station Uniform Min - Max 0.42-0.10
5 Dumping time Exponential Mean 1.7
6 Maneuver and return from dumping station Uniform Min - Max 0.54-0.13
Table A.5
Model specifications
Item Description
OOutput validation 1- Chi Square or Klomogorov-Smirnov test at 5% significance level
2- Direct observation of real results
No. of iterations 2000 iterations completed, after this, the changes in the mean and variance of the results were negligible.
Domain of validity The proposed models are valid under current operational conditions. Any major future changes shall be incorporated accordingly.
Applicability Before introducing the recommended changes, a detailed economical evaluation is needed.
Model maintenance The model should become up-to-dated with operation progress, e.g. opening of new working benches, increase in haulage distances,
and etc.
Table A.2
Sample truck data form (all times in minutes)
No. Loading Haulage Dump station Dumping Maneuver Return Waiting in queue Loader
1 1.5 6.3 Crusher 2.9 0.5 5 ---- Shovel 1
2 1.3 6.5 Crusher 1.8 0.4 5.6 0.5 Shovel 1
3 1.9 7.5 Waste Dump 1.2 0.45 7.1 ---- Shovel 2
4 2.2 7.2 Waste Dump 1.6 0.55 6.6 ---- Shovel 2
5 1.4 6.8 Stockpile 1.4 0.56 5.3 1.3 Shovel 3
6 1.8 7.1 Stockpile 1.5 0.62 5.2 1.8 Shovel 4
Table A.3
Normal distributions of loaded haulage times from all shovels to all destinations (minutes)
Loader Crusher Waste dump Stockpile
Standard deviation Average Standard deviation Average Standard deviation Average
Shovel 1 0.9 5.5 1.3 7.6 1.1 6.2
Shovel 2 0.95 6.1 1.2 8.1 1.4 6.8
Shovel 3 1.1 6.5 1.5 8.5 1.55 7.2
Shovel 4 1.02 6.4 1.4 7.9 1.42 7.05