A statistical overview of the Welsh language (1st revision) List/A... · A statistical overview of...
137
i A statistical overview of the Welsh language Hywel M. Jones
Transcript of A statistical overview of the Welsh language (1st revision) List/A... · A statistical overview of...

i
A statistical overview of
the Welsh language
Hywel M. Jones

ii
Contents
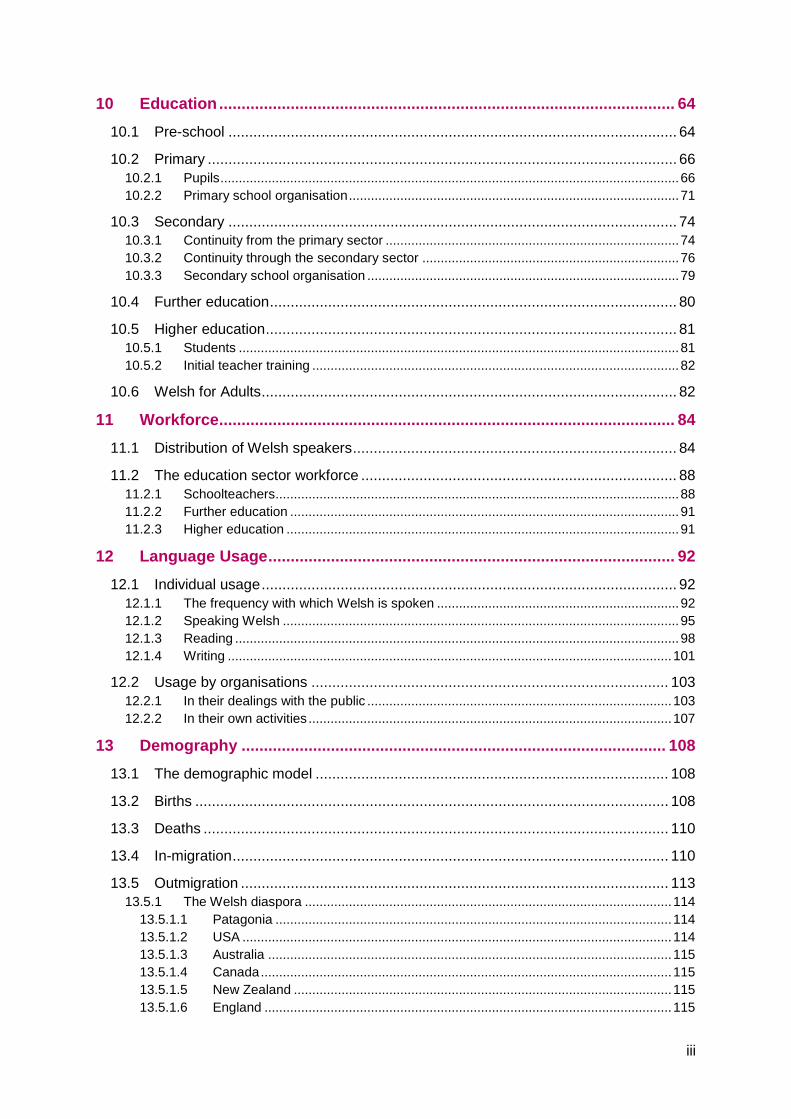
Foreword .................................................................................................................. ix
1 Summary ............................................................................................................ 1
2 Introduction ........................................................................................................ 2
3 Overview ............................................................................................................. 4
3.1 Number and percentage of Welsh speakers in the population ................................ 4
3.2 Geography .............................................................................................................. 5
3.3 Households and language transmission .................................................................. 6
3.4 Usage ..................................................................................................................... 8
4 The census ....................................................................................................... 10
4.1 The history of Welsh in the census ....................................................................... 10
4.2 ‘The Welsh’ in the 2001 Census ............................................................................ 10
4.3 Results from 1891 to 2001 .................................................................................... 10
4.4 The changes between 1991 and 2001 .................................................................. 134.4.1 By age group ................................................................................................................. 134.4.2 By geography ................................................................................................................ 15
5 Skills, according to the 2001 Census ............................................................. 235.1 Background ........................................................................................................... 23
5.2 By sex ................................................................................................................... 24
5.3 Ethnic groups ........................................................................................................ 24
5.4 Understanding ...................................................................................................... 26
5.5 Literacy, by local authority ..................................................................................... 27
5.6 Mapping literacy .................................................................................................... 39
5.7 Literacy, by industry .............................................................................................. 42
6 Skills: other evidence ...................................................................................... 446.1 Fluency of speech ................................................................................................. 44
6.2 Literacy ................................................................................................................. 49
6.3 Writing .................................................................................................................. 50
6.4 Reading ................................................................................................................ 52
7 Households ...................................................................................................... 54
8 Transmission/The language of the children .................................................. 59
9 Linguistic attrition (Losing the language) ..................................................... 63
iii
10 Education ...................................................................................................... 64
10.1 Pre-school ............................................................................................................ 64
10.2 Primary ................................................................................................................. 6610.2.1 Pupils ............................................................................................................................. 6610.2.2 Primary school organisation .......................................................................................... 71
10.3 Secondary ............................................................................................................ 7410.3.1 Continuity from the primary sector ................................................................................ 7410.3.2 Continuity through the secondary sector ...................................................................... 7610.3.3 Secondary school organisation ..................................................................................... 79
10.4 Further education .................................................................................................. 80
10.5 Higher education ................................................................................................... 8110.5.1 Students ........................................................................................................................ 8110.5.2 Initial teacher training .................................................................................................... 82
10.6 Welsh for Adults .................................................................................................... 82
11 Workforce ...................................................................................................... 8411.1 Distribution of Welsh speakers .............................................................................. 84
11.2 The education sector workforce ............................................................................ 8811.2.1 Schoolteachers .............................................................................................................. 8811.2.2 Further education .......................................................................................................... 9111.2.3 Higher education ........................................................................................................... 91
12 Language Usage ........................................................................................... 9212.1 Individual usage .................................................................................................... 92
12.1.1 The frequency with which Welsh is spoken .................................................................. 9212.1.2 Speaking Welsh ............................................................................................................ 9512.1.3 Reading ......................................................................................................................... 9812.1.4 Writing ......................................................................................................................... 101
12.2 Usage by organisations ...................................................................................... 10312.2.1 In their dealings with the public ................................................................................... 10312.2.2 In their own activities ................................................................................................... 107
13 Demography ............................................................................................... 10813.1 The demographic model ..................................................................................... 108
13.2 Births .................................................................................................................. 108
13.3 Deaths ................................................................................................................ 110
13.4 In-migration ......................................................................................................... 110
13.5 Outmigration ....................................................................................................... 11313.5.1 The Welsh diaspora .................................................................................................... 114
13.5.1.1 Patagonia ............................................................................................................ 11413.5.1.2 USA ..................................................................................................................... 11413.5.1.3 Australia .............................................................................................................. 11513.5.1.4 Canada ................................................................................................................ 11513.5.1.5 New Zealand ....................................................................................................... 11513.5.1.6 England ............................................................................................................... 115

iv
14 Looking to the future .................................................................................. 11614.1 The evidence of recent surveys .......................................................................... 116
14.2 Projections .......................................................................................................... 116
14.3 Summary ............................................................................................................ 119
15 Epilogue ...................................................................................................... 120
16 Bibliography ............................................................................................... 121
17 Appendix: Methodology for calculating projections ............................... 126
List of figures
Figure 1: % of the population able to speak Welsh, 1911–2001 .......................................... 11Figure 2: % of the population able to speak Welsh, 1911–2001, by age group ................... 12Figure 3: % of Welsh speakers by age group, 1911-2001: those under 25 .......................... 12Figure 4: % of Welsh speakers by age group, 1911-2001: those aged 25 and over ............ 13Figure 5: Comparing numbers of Welsh speakers in 1981, 1991 and 2001 by age group ... 14Figure 6: Change between 1991 and 2001: % of Welsh speakers by area (all aged 3 and over) ................................................................................................................................... 15Figure 7: The likelihood of one Welsh speaker meeting another at random (the index of isolation) and the proportion able to speak Welsh, 1991 and 2001, by age group ............... 19Figure 8: Wales: % able to understand/speak/read/write Welsh, by age, 2001 ................... 24Figure 9: Wales: % able to understand/speak/read/write Welsh, by sex and age, 2001 ...... 25Figure 10: % able to speak Welsh, by ethnic group, 2001 ................................................... 25Figure 11: Isle of Anglesey: % able to understand/speak/read/write Welsh, by age, 2001 .. 28Figure 12: Gwynedd: % able to understand/speak/read/write Welsh, by age, 2001 ............ 28Figure 13: Conwy: % able to understand/speak/read/write Welsh, by age, 2001 ................. 29Figure 14: Denbighshire: % able to understand/speak/read/write Welsh, by age, 2001 ....... 29Figure 15: Flintshire: % able to understand/speak/read/write Welsh, by age, 2001 ............. 30Figure 16: Wrexham: % able to understand/speak/read/write Welsh, by age, 2001 ............ 30Figure 17: Powys: % able to understand/speak/read/write Welsh, by age, 2001 ................. 31Figure 18: Ceredigion: % able to understand/speak/read/write Welsh, by age, 2001 .......... 31Figure 19: Pembrokeshire: % able to understand/speak/read/write Welsh, by age, 2001 .... 32Figure 20: Carmarthenshire: % able to understand/speak/read/write Welsh, by age, 2001 . 32Figure 21: Swansea: % able to understand/speak/read/write Welsh, by age, 2001 ............. 33Figure 22: Neath Port Talbot: % able to understand/speak/read/write Welsh, by age, 2001 33Figure 23: Bridgend: % able to understand/speak/read/write Welsh, by age, 2001 ............. 34Figure 24: Vale of Glamorgan: % able to understand/speak/read/write Welsh, by age, 2001
........................................................................................................................................... 34Figure 25: Rhondda Cynon Taf: % able to understand/speak/read/write Welsh, by age, 2001
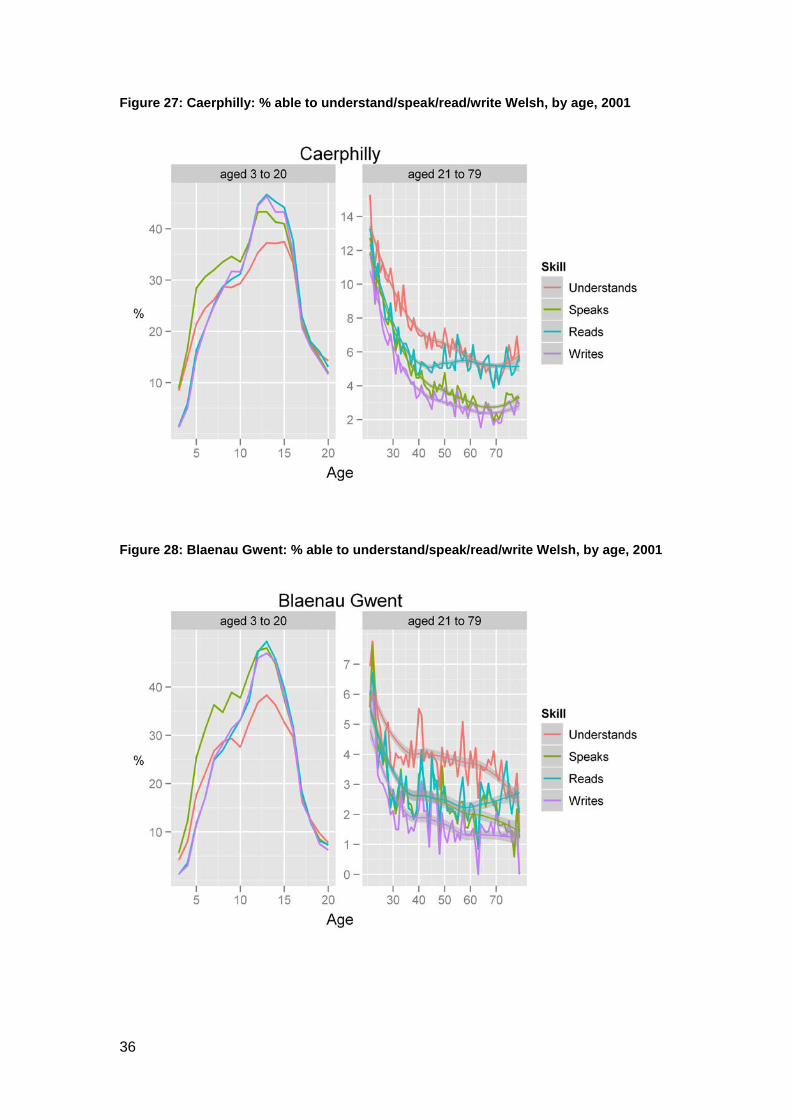
........................................................................................................................................... 35Figure 26: Merthyr Tydfil: % able to understand/speak/read/write Welsh, by age, 2001 ...... 35Figure 27: Caerphilly: % able to understand/speak/read/write Welsh, by age, 2001 ............ 36Figure 28: Blaenau Gwent: % able to understand/speak/read/write Welsh, by age, 2001 ... 36Figure 29: Torfaen: % able to understand/speak/read/write Welsh, by age, 2001 ............... 37Figure 30: Monmouthshire: % able to understand/speak/read/write Welsh, by age, 2001 ... 37

v
Figure 31: Newport: % able to understand/speak/read/write Welsh, by age, 2001 .............. 38Figure 32: Cardiff: % able to understand/speak/read/write Welsh, by age, 2001 ................. 38Figure 33: Literacy rate of Welsh speakers, by industry, 2001 ............................................ 43Figure 34: % of fluent speakers, by local authority, estimates for 2004–06 ......................... 45Figure 35: Cartograms: number able to speak Welsh and number able to speak it fluently, 2001 Census and 2004–06 estimates ................................................................................. 45Figure 36: % of Welsh speakers who are fluent, by sex and age group, estimates for 2004–06 ........................................................................................................................................ 47Figure 37: Writing ability in Welsh, by fluency: comparing the 2004–10 surveys ................. 51Figure 38: Level of Welsh literacy, by the ability to speak and write Welsh, 2004 and 2010 52Figure 39: Reading ability in Welsh, by fluency: comparing the 2004–10 surveys ............... 53Figure 40: Ability to read and write, Welsh and English, by ability to speak Welsh, 2010 .... 53Figure 41: Numbers of Mudiad Meithrin playgroups and Ti a Fi (parent and toddler) groups, 1970-2011 ........................................................................................................................... 65Figure 42: % assessed in Welsh at the end of KS1/2/3, and being taught Welsh first language, 1999–2011 ......................................................................................................... 66Figure 43: % of primary pupils by language/background, by year group, January 2010 ...... 67Figure 44: % of primary school pupils by language/background, 1986/87–2010/11 ............ 68Figure 45: Numbers of primary school pupils by language/background, 1986/87–2010/11 . 68Figure 46: Number of primary schools, 1975/76–2010/11, by the number of pupils fluent in Welsh .................................................................................................................................. 69Figure 47: % of primary schools, 1975/76–2010/11, by the number of pupils fluent in Welsh
........................................................................................................................................... 70Figure 48: Number of primary pupils, 1991/92–2010/11, by the class teaching medium ..... 70Figure 49: % of all primary pupils, 1991/92–2010/11, by class teaching medium ................ 71Figure 50: % of primary pupils in a mainly Welsh-medium class,1998/99–2010/11, by area 72Figure 51: Number of primary schools, 1993/94–2010/11, by language category ............... 73Figure 52: % of primary schools, 1993/94–2010/11, by language category ......................... 74Figure 53: % of pupils assessed in Welsh, by Key Stage, 1996–2011 and targets for 2015 and 2020 ............................................................................................................................. 75Figure 54: % of secondary pupils, years 7–11, by type of Welsh course, 1977/78–2010/11 76Figure 55: Number of pupils aged 15 who sat a GCSE Welsh examination, by type of examination, 1989–2011 ..................................................................................................... 77Figure 56: % of pupils aged 15, by type of Welsh GCSE, 1995/96–2009/10 ....................... 78Figure 57: Number of pupils who sat A Level Welsh, by subject, 1975–2011 ...................... 78Figure 58: Continuity from GCSE Welsh to the A level examination, 1991–2011, and targets for 2015 ............................................................................................................................... 79Figure 59: Number of secondary schools, 1989/90–2010/11, by language category ........... 80Figure 60: Welsh for Adults Examinations, number of candidates, 1996–2010 ................... 83Figure 61: Distribution of Welsh speakers by industry, by sex, 2001 Census ...................... 85Figure 62: % able to speak Welsh, by sex and industry, 2001 Census ................................ 85Figure 63: Distribution of Welsh speakers by occupation, by sex, 2001 Census ................. 86Figure 64: % able to speak Welsh, by sex and occupation, 2001 Census ........................... 87Figure 65: % of staff teaching in Welsh or bilingually, by further education establishment 2008/09 ............................................................................................................................... 91Figure 66: % of Welsh speakers who speak the language every day, according to the Language Use Surveys 2004–06 ........................................................................................ 93

vi
Figure 67: The relationship between the percentages who can speak Welsh, who are fluent, who speak Welsh every day, and who spoke Welsh in their most recent conversation, 2004–06 ........................................................................................................................................ 94Figure 68: Language of the most recent conversation by age group and fluency, 2004–06 96Figure 69: Number of language schemes approved and operational at the end of the year, by sector ........................................................................................................................... 104Figure 70: Proportion of Welsh-medium or bilingual services, by sector and town, 2005 ... 106Figure 71: % of registrations, by life event, 1993–2010 ..................................................... 109Figure 72: % of the population, by country of origin, 1951–2001 ....................................... 111Figure 73: Cross-border migration between Wales and the rest of the UK, 1975-2010 ..... 112Figure 74: % able to speak Welsh, by area, 2001–10, by source of statistics .................... 117Figure 75: Projections: number able to speak Welsh, 2001-33 .......................................... 118Figure 76: Projections: % able to speak Welsh, 2001-33 .................................................. 119 List of tables Table 1: % able to speak Welsh, 1991 a 2001, by local authority ........................................ 16Table 2: Change in the percentage able to speak Welsh, 1991 to 2001, by county (2003) and by age group. ............................................................................................................... 18Table 3: Distribution of Communities by the percentage of Welsh speakers, 1991 .............. 20Table 4: Distribution of Communities by the percentage of people able to speak Welsh, 2001
........................................................................................................................................... 20Table 5: Children at the end of Key Stage 1, 2 a 3: % fluent, comparison of the estimates for 2001 .................................................................................................................................... 48Table 6: 2001 Census: households, by local government authority area ............................. 57Table 7: 2001 Census: households with Welsh speakers, by local government authority area
........................................................................................................................................... 58Table 8: Children aged 3 and 4 able to speak Welsh living in families ................................. 60Table 9: Transmission rates, by type of family and age of child: Wales, Scotland, Northern Ireland and the Republic of Ireland ...................................................................................... 62Table 10: % of fluent speakers who would use Welsh, if the option were available, by situation, 2000 ..................................................................................................................... 98Table 11: % Of Welsh speakers writing in Welsh, by situation and by the ability to speak and write, 2000 ........................................................................................................................ 102Table 12: % always using Welsh, fluent speakers and good writers, 2000 ........................ 102Table 13: % of companies using the Welsh language, by item, 2007 ................................ 105Table 14: Welsh speakers aged 15: migration to England between 1971–81, 1981–91, 1991–01 ............................................................................................................................ 114Table 15: Projections: % and number able to speak Welsh, 2011, 2021, 2031 ................. 118 List of maps Map 1: The change in the percentage able to speak Welsh between the 1991 and 2001 Censuses, all aged 3 and over ............................................................................................ 17Map 2: % able to speak Welsh, 2001 .................................................................................. 21Map 3: Number able to speak Welsh, 2001 ......................................................................... 22Map 4: % who only understood spoken Welsh: all aged 3 and over, 2001 Census ............. 26Map 5: % of Welsh speakers aged 3 and over able to read and write Welsh ...................... 39Map 6: % of Welsh speakers aged 5 to 19 able to read and write Welsh ............................ 40

vii
Map 7: % of Welsh speakers aged 20 to 34 able to read and write Welsh .......................... 40Map 8: % of Welsh speakers aged 35 to 59 able to read and write Welsh .......................... 41Map 9: % of Welsh speakers aged 60 and over able to read and write Welsh .................... 41Map 10: % of Welsh speakers who are fluent, estimates for 2004–06 ................................. 46Map 11: Pupils at the end of Key Stage 3 (14 years of age), 2006–08, % able to speak Welsh fluently ..................................................................................................................... 48Map 12: Children aged 3 to 4 of couples where one adult speaks Welsh: % able to speak Welsh, 2001 ........................................................................................................................ 59Map 13: People born in Wales: % (aged 3 and over) able to speak Welsh, 2001 .............. 113

viii
ix
Foreword The Welsh Language Board has based the greater part of its activity over the last decade on evidence garnered from the results of the 2001 Census, analysed by our extremely able statistician, Hywel Jones. The Board also commissioned a good deal of further research to provide more information in areas where statistics were scarce and drew on other public data sources to obtain as full a picture as possible. The aim of all this was to ensure that the Board’s work concentrated on things that would make a difference to the future of the Welsh language. This volume draws together for the first time ever many of the statistics with which we have been concerned.
I doubt whether many other countries possess such a rich store of detailed information and data on the indigenous language. This means we are in a particularly favourable position when making plans to deal with the variety of complex linguistic situations which face the Welsh language. We now have an abundance of data in our possession; this enables us to get to grips with the challenges facing the language on the basis of facts. It is no longer possible to hide behind ignorance of the true situation of the Welsh language in its communities and in the homes of Wales.
In March 2012 the Welsh Language Board will cease to exist, and full responsibility for the Welsh language will pass to the Government. The Welsh Language Commissioner will also be there to guard the Welsh language and to protect the opportunities that are available to use it. This volume will be a record of the statistical situation at the beginning of a new era and will provide a benchmark that can be used to measure progress from now on. As can be seen when reading this volume, the Welsh language is still very much alive; we should take great pride in this and in the growth it is experiencing, particularly in the area of education. But this is no time to rest on our laurels — there is still an enormous challenge to be faced to secure a central place for the Welsh language in the life of the nation.
MEIRION PRYS JONES Chief Executive

x

1
1 Summary This volume looks at a wide range of statistics relating to the Welsh language. Several areas are examined in detail, but it is not a comprehensive document. A decision was made to concentrate on the number and percentage of Welsh speakers, their literacy skills, and the practical use they make of the language. The media are not touched on at all. The volume’s main concerns are the sustainability of the present situation and the outlook for the future.
These are some of the most important conclusions.
The percentage of people able to speak Welsh increased between 1991 and 2001, principally owing to the growth in the teaching of Welsh as a second language in schools over that period.
The number and percentage of first-language speakers among the young continue to increase as a result of the growth of Welsh-medium education.
Out-migration is having a substantial effect on the number of people in Wales able to speak Welsh.
In-migration is having a substantial effect on the percentage of people in Wales able to speak Welsh. At the time of the 2001 Census, 20% of the population had been born in England (Figure 72). We can expect the percentage to be higher by this time and still rising.
There appears to be a net out-migration of fluent Welsh-speakers from Wales. The figures suggest that the number of fluent speakers in Wales is decreasing every year.
The geographical distribution of Welsh speakers changed between 1991 and 2001. This meant that the likelihood of one Welsh speaker meeting another at random decreased over that period. Such a change has implications for language use and for the formation of households where Welsh is used.
Neither the results of recent surveys nor the calculated projections suggest that we shall see a substantial increase in the percentage of people who can speak Welsh in the near future.

2
2 Introduction This report aims to bring together in one document the various statistics on the Welsh language with which the Welsh Language Board has dealt over the years and, in doing so, to produce a statistical picture of the current situation of the language.
The results of the 2011 Census will be published shortly. Although the results of the 2001 Census are by now out of date, when they are compared with statistics from a number of other sources, trends become fairly clear. The 2011 Census will give a more detailed picture, particularly as regards the geography of the situation, but its results should not surprise us. The future can be seen in the present. With all the data already available, we can be fairly confident that we understand the general situation of the language today. That awareness should enable us to reach a balanced interpretation of the results of the 2011 Census once they are published.
The size of the Welsh-speaking population is determined by demography and associated factors, and by the education system. It is demographic changes that determine whether the population increases or decreases in size: how many people are born, how many die and how many move into or out of the country. The number of people who speak Welsh also varies according to the degree to which the language is transmitted from one generation to another in the home or as a result of the education system. We must also remember that an individual’s ability to speak the language is not fixed. An individual can forget the language to some extent, or improve their mastery of it, throughout life, not just at school. These are not demographic factors, but they are affected by associated factors like the geographical distribution of Welsh speakers.
It is these factors that are crucial to the sustainability of the language and it is upon them that this document is based.
The third chapter gives an overview, drawing attention to the possible implications of the statistics to be found in the rest of the document.
The fourth chapter concentrates on the results of the population census, the most familiar data source. This is the source used in this document to consider some of the main elements of the extended demographic model outlined above, including households and language transmission. In addition to the ability to speak Welsh, the census also details the skills of comprehension, reading and writing. We will look at the geographical distribution of people who can speak Welsh and at the distribution of reading and writing skills by the age of the population. We shall be paying particular attention in chapter 5 to skills as recorded by the 2001 Census and in chapter 6 to other evidence about skills.
Chapter 7 looks at the linguistic make-up of households in Wales and chapter 8 examines statistics about language transmission in the home.

3
Chapter 9 presents statistical evidence about people who lose the language.
When we talk about the transmission of the language in the home we shall be talking about ‘reproducing’ the Welsh language: one generation of Welsh speakers raising the next generation through the medium of Welsh. Education, whether formal or informal, is the only way to ‘produce’ Welsh speakers out of raw material, out of people—children in the main, but also adults—who have not learnt Welsh in the home. In chapter 10 we shall take a look at the available statistics from each sector in turn. This will include comparing them with the statistics of the census of population and attempting to show how these different sources can be reconciled.
Chapter 11 will focus mainly on the place of Welsh speakers within the workforce. The presence of Welsh speakers within the workforce can affect the provision of services through the medium of Welsh and opportunities for the use of Welsh as the language of the workplace.
Chapter 12 will look at the evidence on language usage. Chapter 13 will look specifically at demography before we look to the future in chapter 14.
I take personal responsibility for any errors. It is unavoidable that there will be some in a volume like this. I have tried to be objective throughout, but the facts to be presented have been my personal choice and can sometimes be interpreted in a different way. These choices and interpretations reflect my personal views, not the viewpoint of the Welsh Language Board.
HYWEL M. JONES, CStat, CSci
Statistician, Welsh Language Board

4
3 Overview This chapter seeks to summarise some of the key statistics. More details will be found in further chapters.
3.1 Number and percentage of Welsh speakers in the population
We know, more or less, how many people live in Wales. We also know that the population of Wales is increasing in size, mainly owing to in-migration since 2001/02, although the number of births has exceeded the number of deaths during the last five years as well. We know there is nowhere else in the world where the Welsh language is spoken by great numbers of people, so we can be certain that very few people who move into Wales will be able to speak the language before they arrive here.
Few adults who migrate into Wales succeed in learning Welsh. Of people aged 45 to 64 in Wales in 2001, only 5% of those born outside Wales could speak Welsh.1
The 2001 Census told us that 40.8% of Welsh children aged between 5 and 15 could speak Welsh. Clearly the 2001 Census statistics for young people reflect the growth in the teaching of Welsh as a second language following the Education Reform Act 1988. 13.8% were assessed in Welsh (first language) at the end of Key Stage 3 of the National Curriculum, at roughly 14 years of age, in 2001. Although the percentage is gradually increasing, even in 2011 fewer than one in every six pupils (16.3%) was assessed in Welsh (first language).
We do not know where they learnt to speak Welsh but it is fair to assume that the majority of them would have learnt it after coming to Wales, although some of them could be children of Welsh-speakers living outside the country.
We can be certain that the percentage able to speak Welsh would be a little lower still for those leaving school. Since people of college age, around their early twenties, are the largest group to migrate out of Wales (many of them never to return), the percentage of people in Wales of every age able to speak Welsh will not increase until the percentage of children able to speak Welsh is much higher than the percentage in the whole population. In 2001, 20.8% of all those aged 3 and over could speak Welsh. Although Welsh-medium education is still increasing in popularity, it is only since 2008 that the percentage of 7-year-olds assessed at the end of Key Stage 1 has exceeded that figure. It is estimated that around a third of those who spoke Welsh when aged 15, in 1991, had moved out of Wales by the time they were 25, in 2001. This suggests that the percentage of pupils who can speak Welsh would need to rise to nearer 30% before the percentage of Welsh speakers among the population of all ages stabilised at around 20%. It should be noted that the Welsh Government’s Welsh-medium Education Strategy
1 2001 Census, table T39. Note: all the 2001 Census tables referred to thus are available from NOMIS.

5
only aims to assess 25% of seven-year-olds in Welsh (first language) by 2015.
We know that around 5,000 children aged 3 could, according to their parents, speak Welsh in 2001 and that 30% of them lived in a household where only one of the parents could speak Welsh. 2,300 of the 3-year olds who could speak Welsh lived in households where everyone could speak Welsh and these accounted for 6.6% of all children aged 3. Children who had been 3 years old in 2001 would have reached the end of Key Stage 2 at school in 2009. At that time, 6,635 children were assessed in Welsh first language, 19.1% of all children of that age. Putting the figures together, we can estimate that for two-thirds of these children Welsh was not the main language of the household. This has implications as regards the use they can be expected to make of the language in the future.
Let us turn to the older generation. At the time of the 2001 Census, 17% of the population were aged 65 or over. 19.5% of these, 98 thousand people, could speak Welsh. It is anticipated that by 2023, there will be 729 thousand people aged 65 or over, 23% of the total population.2 We might expect that about 114 thousand (16%) of these will be Welsh-speaking.3
The percentages of children able to speak Welsh reported by the census reflected to some extent the percentages of children learning Welsh as a second language rather than the percentages of those with substantial ability. As a result, it is difficult to calculate projections for the numbers and percentages on the basis of the census and they can be misleading. However, as they will be of interest, some are provided in chapter
Once again, this has implications as regards the likely demand for Welsh-medium services.
14. As regards the well-being of the language in the future, it is the number and percentage of those with substantial ability in Welsh—people who would describe themselves as fluent speakers—that are more important.
3.2 Geography
Broadly, if the percentage of speakers in the population decreases, the percentage of couples where both can speak Welsh will decrease faster because it will be less likely that two people who can speak Welsh will meet each other. Although the percentage who can speak Welsh among our young people is increasing on a national basis, the picture varies from area to area. By 2001, there were lower percentages in many of the areas where the highest percentages had been found in 1991 while in areas where there had previously been only low percentages, they increased. As a result, on average across Wales, the likelihood of one
2 StatsWales 010879. Note: when referring to StatsWales, the number that follows refers to the number of the table from which the data is sourced. The Government’s 2008-base principal projections were used in the text. The 2010 base projections were published after this document was written (StatsWales 034803). There is comparatively little difference between the projections as regards the main trends. E.g. on the 2010 base, 716 thousand people in Wales will be aged 65 or over by 2023. 3 Welsh Language Board estimate.

6
Welsh speaker meeting another at random decreased.4 Of course that is not precisely how couples come together but—although it is not romantic—this simple mathematical model does reflect the basic process.5
At the time of the 2001 Census, a minority—41%—of all Welsh speakers lived in the four counties where the majority of the population was able to speak Welsh: Anglesey, Gwynedd, Ceredigion and Carmarthenshire. In the age groups 40–49, 50–59, 60–64 and 65–74, the majority (albeit a small one) of Welsh speakers lived in the four counties. Only a minority of the oldest speakers lived there—47% of the speakers were aged 75 of over—reflecting the wider geographical distribution of Welsh in the past.
So geography affects the formation of the households discussed in the previous section.
Of the children aged 3 to 4 who could speak Welsh, 41% lived in the four counties, and among the children aged 10–14, the percentage fell to 24% but, of course, that age group included many with a very limited ability in the language.6 56% of all fluent Welsh speakers, in every age group, lived in the four counties, according to the Language Use Surveys of 2004–06.7 From the 2011 Schools’ Census, we can calculate that 62% of the primary school pupils whose parents said that they spoke Welsh fluently at home lived in the four counties.8 However, of those assessed in Welsh (first language) in 2011 at the end of Key Stage 1, at roughly 7 years of age, only 45% were in primary schools in the four counties, a slightly lower figure than the 51% assessed at the end of Key Stage 2, aged 11.9
3.3 Households and language transmission
The small decrease as we go down through the age groups reflects the gradual growth of the Welsh medium schools in the rest of Wales. In 2011, more children aged 7 were assessed in Welsh first language in Rhondda Cynon Taf (523) and Cardiff (536) than in Anglesey (469) and Ceredigion (445).
In 2001, there were 1,209 thousand households in Wales. It has been estimated that 135 thousand of those households, 11.1%, were entirely Welsh-speaking in the sense that every member of the household was able to speak Welsh. There were 341 thousand households, 28.2%, where at least one member was able to speak Welsh.10
4 H. Jones (2007).
Probably that member (or members) was more often than not a child in the household and this reflects the high percentages of Welsh speakers of school age according to the 2001 Census.
5 José Luis Alvarez Enparantza, (‘Txillardegi’) (2001). 6 2001 Census, table CAS146. 7 Welsh Language Board (2008). 8 Wales Government (2011c), table 11.55 in the accompanying document on the Government’s web site. 9 StatsWales 10418 and 10419, http://www.statswales.wales.gov.uk/TableViewer/tableView.aspx?ReportId=10418 10 Welsh Language Board (2004) and the 2001 Census, commissioned table C0055. Note: the commissioned table is available from the Office for National Statistics.

7
When we concentrate on households with, in 2001, a couple with a dependent child aged between 0 and 4, we see that in 9 thousand (9.2%) of these both adults were able to speak Welsh.11
Every child learns a language at home and learning a language (or languages) means that the child has some skill in the language before beginning to leave home to receive an education. We say that the language is transmitted in the home; the language is reproduced. When learning a language in the home, the child experiences hearing and speaking the language as something completely normal. (The experience of the child who begins learning Welsh outside the family is rather different for the most part these days. Even if they are immersed in the Welsh language through attendance at a Welsh medium playgroup or Welsh medium school, in most places many of the child’s peers, their fellow-pupils, will come from backgrounds where Welsh is not normally spoken at home either. In their experience, speaking Welsh is not something normal.) In 2001, 46% of 3-year-olds who could speak Welsh lived in households where the adults could speak Welsh. Where both parents could speak Welsh, 79% of the 3-year-olds could also speak the language, meaning that 481 children had been brought up as non-Welsh speakers in families where both parents were able to speak Welsh. Of the three-year-olds in families where only one of the two parents could speak Welsh, only 33% of the children could speak Welsh (37% where the mother spoke Welsh, 29% where the father spoke Welsh). 2,424 children from these families had been brought up as non-Welsh speakers.
Independently of the census, the Welsh Language Use Surveys of 2004–06 showed that in the case of around 8% of all young couples (with a mean age under 36) both partners could speak Welsh and in fewer than 60% of those couples were both partners fluent. Yet another source, the annual census of primary schools, reveals that, according to headteachers in 2000/01, 6.3% of primary pupils were fluent in Welsh and spoke it at home. (Since the method of data collection was changed in January 2003, to depend on parental statements rather than statements by headteachers, this percentage has been higher, but the trend still seems to be on the decrease, falling from a level of around 8.3% between 2003 and 2006 to a level of around 7.6% between 2007 and 2011.)
12
We know that household size has been decreasing for decades. The Welsh Government projection is that the average size will have fallen from 2.36 people per household in 2001 to 2.23 by 2011.
These are substantial numbers.
13
11 2001 Census, table S144.
The main characteristic of the change is that a higher percentage of all households will be single-person households. In 2001, there were 354 thousand single-person households, 29.2% of the total. The projection for 2011 is 430 thousand, 32.2% of the total, and by 2023 there will be 543 thousand, 36% of the total. It is anticipated that, in that year, 385 thousand households will include children, a little over a quarter of the
12 2001 Census, commissioned table C0863. 13 Welsh Government (2010b).
8
total. In 2001, 10.9% of Welsh speakers, 63 thousand people, lived alone.14
3.4 Usage
If there are 543 thousand single-person households by 2023, there could be over 100 thousand Welsh speakers living alone. For these, the ‘language of the household’ will not mean they have an opportunity to speak the language at home. Their use of the language in the home will be passive: listening to the radio and watching television will probably be more important to them, particularly to older people, although it is not just among the elderly that the trend towards living alone will increase.
We know that the percentages for children assessed against the syllabus for first-language Welsh speakers—although for many of them Welsh is not their first language except in the sense that it is their first language of education—or the percentages for children receiving their education through the medium of Welsh, give some measure of ability in the language. Welsh-medium education is growing through the choice of parents who, in the main, are themselves unable to speak Welsh. English is the medium through which these parents communicate between themselves at home and thus the household’s main medium of communication will be English, even if there are some variations in usage with, for example, one of the parents speaking Welsh with the children. Naturally, on the whole, the children will have a better grasp of English than Welsh when they start school (even if the parents had ensured that anyone taking care of the children in their early years could speak Welsh, and that they attended a Welsh-medium parent and toddler group or nursery group). While they will come to be able to speak Welsh through immersion at a Welsh-medium school, on the whole, their first language will continue to be English. A child spends close to three quarters of their time outside school.15
We know from the Welsh Language Use Surveys of 2004–06 that the percentage of those between 16 and 29 who say they speak Welsh every day is lower than for any other age group. (The percentage of those younger than this who speak Welsh every day is higher, perhaps because they speak Welsh at school—at least with teachers?) In addition to age, the ability to speak Welsh fluently, living in an area where a comparatively high percentage are able to speak Welsh, and
In an area without a high percentage of Welsh speakers, and without a Welsh-speaking family, the child would have little opportunity to speak the language even were that allowed by the norms of their peers
14 Welsh Language Board (2004) and the 2001 Census, commissioned table C0055. 15 According to the UK 2000 Time Use Survey, a child between the ages of 8 and 15 would spend 229 min a day on average on their studies, 28% of their waking hours. 139 minutes would be spent watching television or DVD, 17% of waking hours, and 25 minutes playing computer games (remembering that this was before the advent of Facebook. etc.), and that activity would to a very large extent be through the medium of English. See Aldekoa and Gardner (2002) quoting Zalbide (Artola et al, 1991) talking about a similar situation in the Basque Country.

9
living in a household where everyone can speak Welsh, are other factors associated with speaking Welsh every day.16
Although the education system produces more and more fluent speakers, the trends are not encouraging as regards other positive factors. As shown above, the percentage of children brought up with Welsh as the language of the household is low, reflecting the increasing scarcity of households where the parents can speak Welsh, that scarcity being itself the result of the demography of the language. The anticipated growth in the number of single-person households is going to limit the number of people who will speak Welsh every day. Without someone else in the household, the influence of the world outside will be more important for them, as regards active, spoken use of the language (although we might perhaps think that the availability of Welsh language media within the home would be more important than previously in maintaining their passive use of the language).
We know that not everyone who can speak Welsh according to the census is able to speak it fluently. The fluency of children has already been discussed in section 3.3 above. According to the Language Use Surveys of 2004–06, 58% of all Welsh-speakers considered themselves fluent. (Only 47% of children between 3 and 15 who could speak Welsh were fluent.) The 2001 Census reported that there were 135 thousand entirely Welsh-speaking households with 258 thousand people (aged 3 and over) living in them. The Language Use Surveys gave a similar rough estimate, for the period 2004–06, of 278 thousand people in entirely Welsh-speaking households. It also showed that 28% of the individuals in those households, the equivalent of almost 78 thousand people, said they spoke English either all or most of the time. Of that 78 thousand, 25 thousand were fluent Welsh-speakers and 53 thousand were not.17
It is estimated that there are 184 thousand fluent Welsh speakers, in entirely Welsh-speaking households, who speak at least as much Welsh at home as they do English, and another 31 thousand who make similar use of the language but live in households where not everyone is able to speak Welsh.
18 With around 2.3 people in every household, these numbers would suggest that there are some 94 thousand households where Welsh is spoken at least as much as English by fluent Welsh speakers. In addition, there are 24 thousand Welsh speakers who are not fluent, but who speak at least as much Welsh as English at home (in entirely Welsh-speaking households and in mixed households); this could mean another 10 thousand households where Welsh is spoken at least as much as English.19
16 H. Jones (2008). 17 In May 2010, S4C estimated from its BARB panel —which samples 600 households —that there are 58,000 households, corresponding to over 100 thousand individuals, where everyone can speak Welsh with some degree of fluency, but where English is the language of the home. 18 Welsh Language Board (2008) 19 Ibid.

10
4 The census
4.1 The history of Welsh in the census
The census statistics are what ordinary people think about when we talk about statistics for the Welsh language, so we might as well start with the census and begin at the beginning.
The first census in Wales was held in 1801, but there was no question about the Welsh Language until the 1891 Census.20 Since then, at least one question has been included in every census.21
4.2 ‘The Welsh’ in the 2001 Census
Up until 1971, the questions were about speaking Welsh or English, but the 1971 Census included a question about reading and writing Welsh for those who said they spoke the language. 1981 was the last time Welsh speakers were asked whether they spoke English. In 2001, the form of the question was changed to an unambiguous one about ability. At the same time, respondents were also asked for the first time whether they could understand spoken Welsh.
The 2001 Census was the census of the burning issue of the ‘tick box’.22 That census asked about people’s ethnicity. The question included a category for ‘White’, with three subcategories: ‘British’, ‘Irish’ and ‘Any other White background’. Although there was no specific tick box for ‘Welsh’, following a highly-publicised campaign, 418 thousand people (14% of the population) added that they were ‘Welsh’.23 3,700 forms were returned with a sticker with an extra tick box, stuck over the ethnicity question.24 15.7% had supplied write-ins, most replying as ‘Welsh’, which had no predefined tick box.25
4.3 Results from 1891 to 2001
Although this topic was not directly related to the questions about the Welsh language, the associated campaign attracted publicity for the census. Events like this, as well as other events at the same time as the census, can influence the way people respond. Some people may answer the questions about Welsh differently from the way they would have responded if the topic had not come up, but it is impossible to know what effect this had on the results.
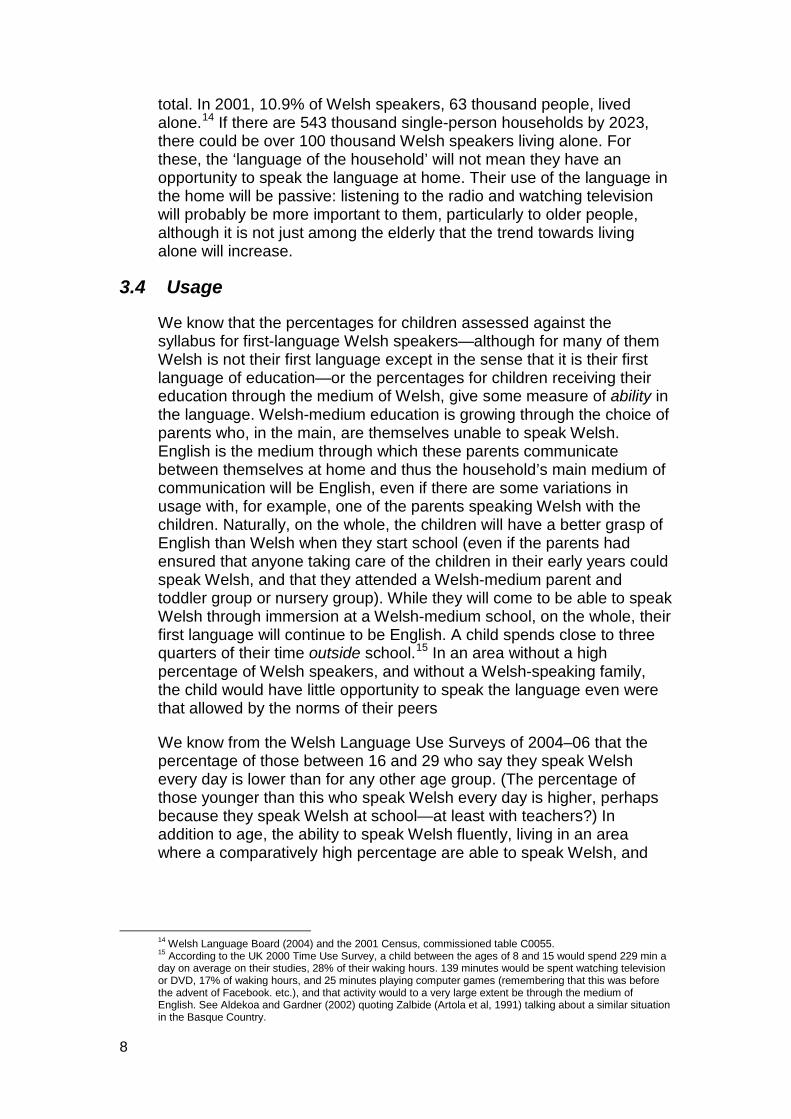
The trends from 1891 to 1971 can be described fairly simply: with a few exceptions, the percentage of Welsh speakers in every age group declined from one census to the next. The absolute number of speakers increased from 1891 to reach almost a million (977,366) in 1911.
20 G. Jenkins (1999). 21 Vision of Britain: language spoken in Wales and Monmouthshire, http://www.visionofbritain.org.uk/text/chap_page.jsp?t_id=Cen_Guide&c_id=13&cpub_id=0, accessed 17 November 2011. 22 G. Vidler (2001), p. 15–8. 23 Office for National Statistics [ONS] (2004b), p. 6. 24 Office for National Statistics (2004), p. 5. 25 Office for National Statistics (2005), p. 65.
11
Figure 1: % of the population able to speak Welsh, 1911–2001
The next two charts look at how the percentage changed in different specific age groups. Up to the 1971 census, the picture is still fairly simple. The percentage of Welsh speakers was at its highest among the oldest age group, and declined through the age groups, reaching its lowest among the youngest children, those aged 3 to 4. With the results of the 1971 Census we see a change in the pattern for the first time, when the percentage of Welsh speakers among children aged 10 to 14 exceeded the percentage in the age group immediately above it, people aged 15 to 24. By the 1981 Census the percentage among children aged 5 to 9 was also higher than the percentage for those aged 15 to 24.

12
Figure 2: % of the population able to speak Welsh, 1911–2001, by age group
Figure 3: % of Welsh speakers by age group, 1911-2001: those under 25
It is worth noting that this suggests the situation, as regards the ability to speak Welsh among children aged 10 to 14, changed during the 1970s, before many of the events considered milestones in the history of the

13
language, such as the setting up of S4C in 1982 and the passing of the Education Reform Act 1988. The Welsh-medium nursery schools movement, Mudiad Ysgolion Meithrin, was set up in 1971. 67 nursery groups were recorded in that year. 26,27
Figure 4: % of Welsh speakers by age group, 1911-2001: those aged 25 and over
Geographically, there were substantial percentages of Welsh speakers throughout most of the country in 1891, but, simplifying considerably, with each census the areas contracted towards the west. The geographical changes from 1961 to 2001 have been subject to considerable analysis, particularly in publications by Aitchison and Carter, and we shall not, therefore, go into detail about them.28
4.4 The changes between 1991 and 2001
4.4.1 By age group
For the first time ever, the 2001 Census showed that the percentage of people speaking Welsh had increased. Of the population aged 3 and over, 20.8% could speak Welsh in 2001, compared with 18.7% in 1991.29
26 The name was changed to Mudiad Meithrin, dropping the word for ‘schools’, in 2011.
The question about the language was changed between 1991 and 2001. In 1991, the question asked was, ‘Does the person speak, read or write Welsh?’, but in 2001 people were asked ‘Can you
27 Pwyllgor Datblygu Addysg Gymraeg (PDAG: Committee for the Development of Welsh-medium Education) (1993). 28 J. Aitchison, J. and H. Carter (1985, 1994, 2004). 29 OPCS (1994). 1991 percentage based on the resident population. On the basis of the population present at the time, i.e. the basis used for percentages shown for the previous censuses, the percentage was 18.5%.
14
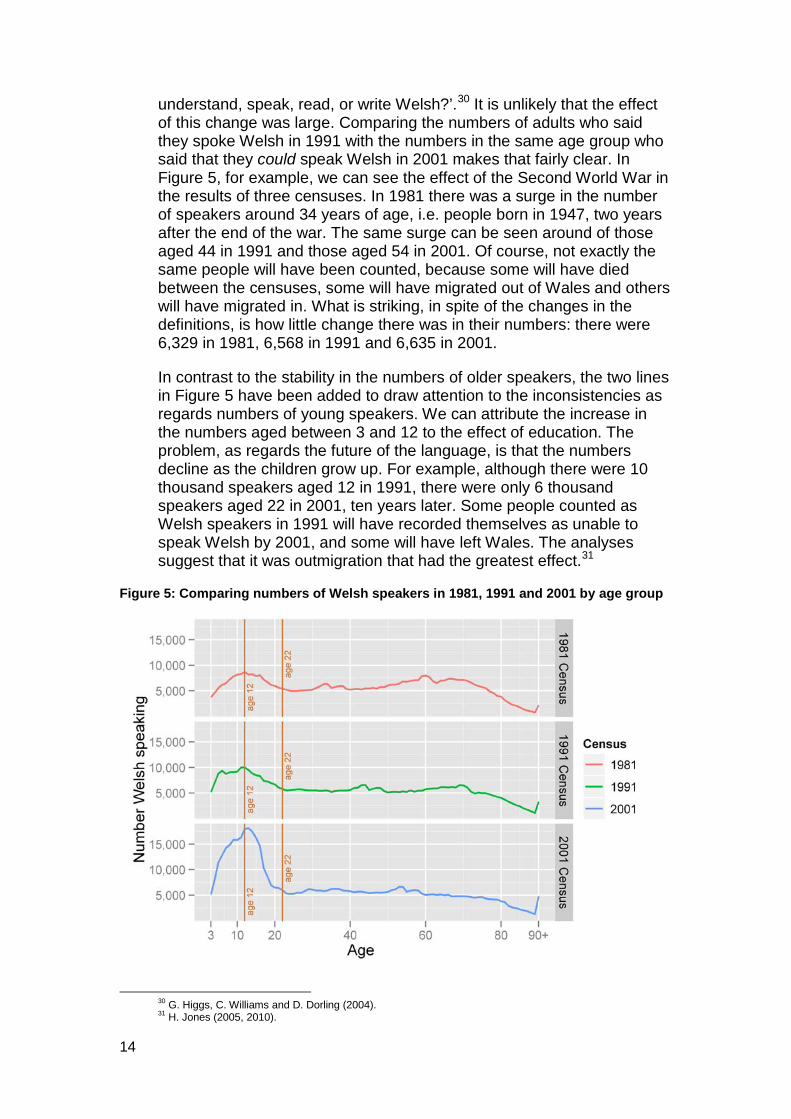
understand, speak, read, or write Welsh?’.30
Figure 5
It is unlikely that the effect of this change was large. Comparing the numbers of adults who said they spoke Welsh in 1991 with the numbers in the same age group who said that they could speak Welsh in 2001 makes that fairly clear. In
, for example, we can see the effect of the Second World War in the results of three censuses. In 1981 there was a surge in the number of speakers around 34 years of age, i.e. people born in 1947, two years after the end of the war. The same surge can be seen around of those aged 44 in 1991 and those aged 54 in 2001. Of course, not exactly the same people will have been counted, because some will have died between the censuses, some will have migrated out of Wales and others will have migrated in. What is striking, in spite of the changes in the definitions, is how little change there was in their numbers: there were 6,329 in 1981, 6,568 in 1991 and 6,635 in 2001.
In contrast to the stability in the numbers of older speakers, the two lines in Figure 5 have been added to draw attention to the inconsistencies as regards numbers of young speakers. We can attribute the increase in the numbers aged between 3 and 12 to the effect of education. The problem, as regards the future of the language, is that the numbers decline as the children grow up. For example, although there were 10 thousand speakers aged 12 in 1991, there were only 6 thousand speakers aged 22 in 2001, ten years later. Some people counted as Welsh speakers in 1991 will have recorded themselves as unable to speak Welsh by 2001, and some will have left Wales. The analyses suggest that it was outmigration that had the greatest effect.31
Figure 5: Comparing numbers of Welsh speakers in 1981, 1991 and 2001 by age group
30 G. Higgs, C. Williams and D. Dorling (2004). 31 H. Jones (2005, 2010).

15
4.4.2 By geography
Figure 6 shows how the percentage of those who could speak Welsh changed between 1991 and 2001 by county. There was a substantial increase in the south-east Wales authorities in particular, but the percentages declined in the four authorities with the highest percentages of Welsh speakers, Anglesey, Gwynedd, Ceredigion and Carmarthenshire.32
Table 1
In 2001 a minority—41% (239 thousand)—of all Welsh speakers were living in these four counties where the majority of the population spoke Welsh, compared with 48% (245 thousand) in 1991 ( ). The distribution of speakers varies according to age group (as discussed in section 3.2) and if, instead of considering speakers of all abilities, we consider only fluent speakers, we get a rather different picture. We shall return to this when we discuss fluency further on, in section 6.1.
Figure 6: Change between 1991 and 2001: % of Welsh speakers by area (all aged 3 and over)
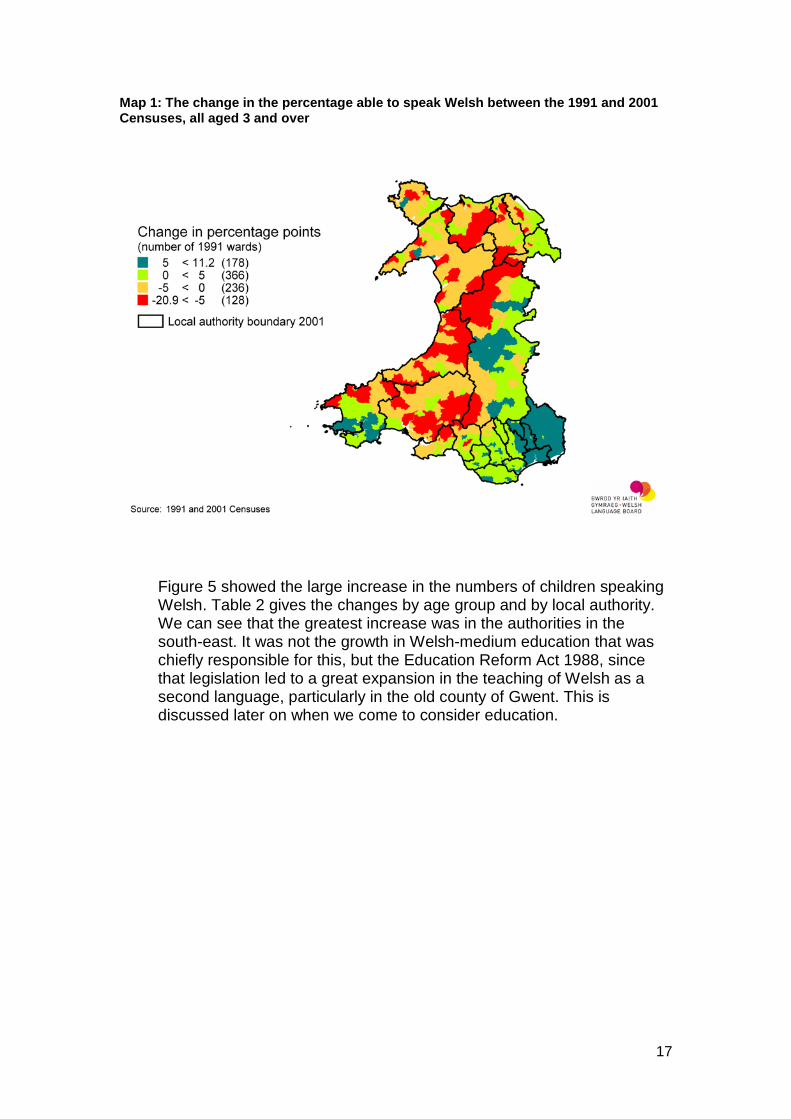
Map 1 shows how the percentage of those who spoke Welsh changed between 1991 and 2001 at the level of the electoral division (the official name in Wales for what used to be called a ward).
32 The way the census treated students changed between 1991 and 2001, and this could make the decline in Ceredigion appear greater than had there been no change.

16
Table 1: % able to speak Welsh, 1991 a 2001, by local authority
Welsh-speaking Able to speak Welsh33
1991 2001 Change
Local authority Number34 Percentage Number Percentage Number Percentage
points
Isle of Anglesey 41,246 62.0 38,893 60.1 -2,353 -1.9 Gwynedd 78,719 72.1 77,846 69.0 -873 -3.1 Conwy 31,448 30.6 31,298 29.4 -150 -1.2 Denbighshire 22,870 26.9 23,760 26.4 890 -0.5 Flintshire 18,403 13.5 20,599 14.4 2,196 0.9 Wrexham 16,360 13.8 18,105 14.6 1,745 0.8 Powys 23,770 20.7 25,814 21.1 2,044 0.4 Ceredigion 36,020 59.1 37,918 52.0 1,898 -7.1 Pembrokeshire 19,729 18.3 23,967 21.8 4,238 3.5 Carmarthenshire 89,206 54.8 84,196 50.3 -5,010 -4.5 Swansea 28,590 13.3 28,938 13.4 348 0.1 Neath Port Talbot 23,762 17.9 23,404 18.0 -358 0.1 Bridgend 10,282 8.3 13,397 10.8 3,115 2.5 Vale of Glamorgan 7,674 6.8 12,994 11.3 5,320 4.5 Rhondda Cynon Taff 20,035 9.0 27,946 12.5 7,911 3.5 Merthyr Tydfil 4,225 7.5 5,532 10.2 1,307 2.7 Caerphilly 9,733 6.0 18,237 11.2 8,504 5.2 Blaenau Gwent 1,539 2.2 6,417 9.5 4,878 7.3 Torfaen 2,119 2.4 9,780 11.1 7,661 8.7 Monmouthshire 1,666 2.2 7,688 9.3 6,022 7.1 Newport 2,877 2.3 13,135 10.0 10,258 7.7 Cardiff 18,071 6.6 32,504 11.0 14,433 4.4 Wales 508,098 18.7 582,368 20.8 74,270 2.1
33 SYG (2004a), p. 39. 34 NOMIS, 1991 Census, L67W
17
Map 1: The change in the percentage able to speak Welsh between the 1991 and 2001 Censuses, all aged 3 and over
Figure 5 showed the large increase in the numbers of children speaking Welsh. Table 2 gives the changes by age group and by local authority. We can see that the greatest increase was in the authorities in the south-east. It was not the growth in Welsh-medium education that was chiefly responsible for this, but the Education Reform Act 1988, since that legislation led to a great expansion in the teaching of Welsh as a second language, particularly in the old county of Gwent. This is discussed later on when we come to consider education.

18
Table 2: Change in the percentage able to speak Welsh, 1991 to 2001, by county (2003) and by age group.
Percentage points Age group
Local authority 3-4 5-15 16-24 25-39 40-64 65+ Isle of Anglesey 0.7 -2.4 6.7 1.1 -4.2 -3.2 Gwynedd -1.0 1.2 -11.9 2.2 -4.2 -4.2 Conwy 0.4 1.5 5.6 0.4 -4.6 -2.6 Denbighshire -2.6 5.3 3.3 -0.1 -3.7 -1.9 Flintshire 0.1 6.0 4.7 1.5 -1.1 -3.3 Wrexham 1.8 10.9 6.2 -0.1 -2.7 -3.5 Powys 0.6 11.8 8.1 -0.7 -3.5 -3.9 Ceredigion -3.3 2.4 -21.7 -3.4 -6.3 -6.1 Pembrokeshire 5.8 20.2 7.7 0.2 -1.2 -1.7 Carmarthenshire -2.7 5.2 -0.2 -5.0 -8.3 -7.7 Swansea 1.5 11.4 3.5 -0.5 -2.8 -5.8 Neath Port Talbot 1.6 13.3 4.5 0.0 -3.3 -7.0 Bridgend 2.2 12.5 7.2 2.0 0.0 -3.7 Rhondda Cynon Taff 4.0 13.7 10.1 3.1 0.5 -4.4 Merthyr Tydfil 1.9 12.3 8.6 2.3 0.3 -5.1 Caerphilly 3.9 20.8 9.6 2.8 1.0 -1.0 Blaenau Gwent 5.3 33.0 10.1 1.2 0.9 0.5 Torfaen 7.7 40.8 11.4 1.7 0.7 0.4 Monmouthshire 6.2 38.7 6.7 1.1 0.9 0.5 Newport 6.7 37.2 7.8 1.0 0.7 0.3 Vale of Glamorgan 3.6 17.6 7.3 2.2 1.0 0.4 Cardiff 4.6 15.2 4.7 3.4 1.3 0.2 Wales 2.6 14.9 5.1 1.0 -1.4 -3.1 Source: 1991 Census Table L67W; 2001 Census Table CAS146. Both from NOMIS.
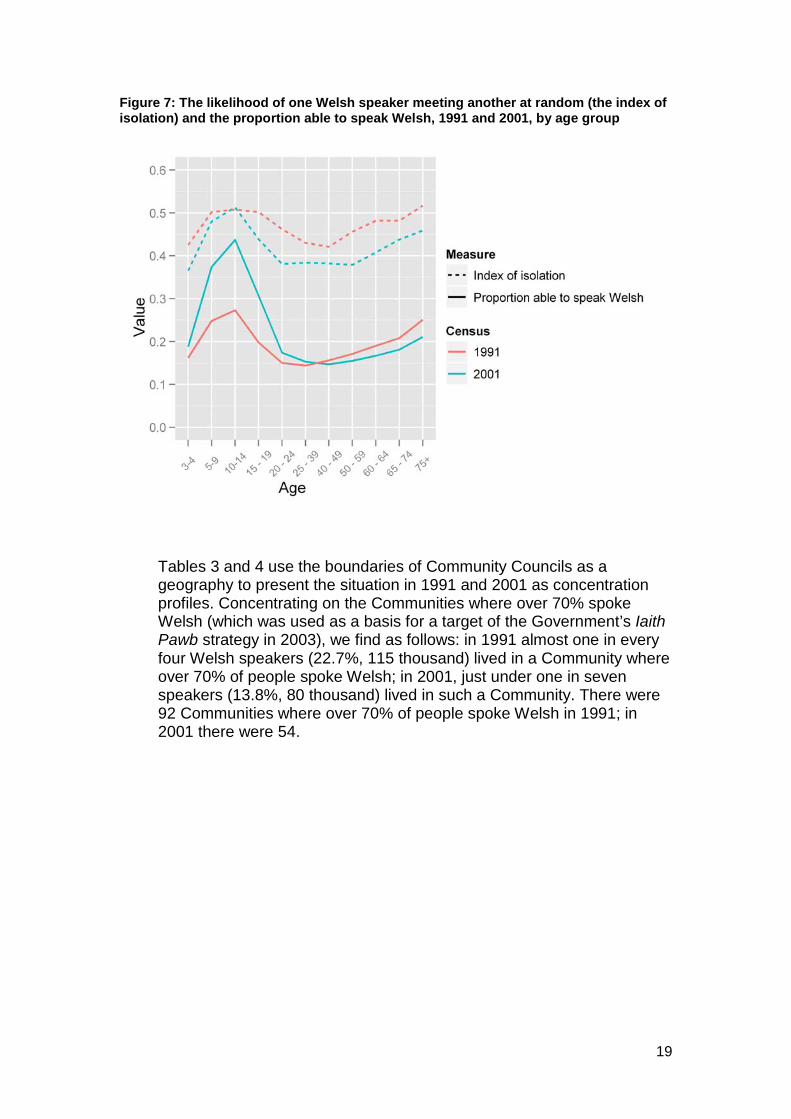
The result of these changes was that there were fewer communities where high percentages of people were able to speak Welsh, although there were also fewer communities where very low percentages were able to speak Welsh. Unfortunately, as regards the use of the language, areas where a high percentage of people are able to speak it are more important than areas with moderate or low percentages. The index of isolation (Figure 7) reflects the likelihood of one Welsh speaker meeting another at random.35 Between 1991 and 2001 the index (calculated on the basis of electoral wards/districts) decreased from 0.443 to 0.374.36
35 H. Jones (2007). 36 These indices have been calculated in Northern Ireland to compare Catholic and Protestant geographical districts. The index value for Catholics was 0.723 in 2001 and 1991. I. Shuttleworth, C. Lloyd, and D. Martin (2011).
19
Figure 7: The likelihood of one Welsh speaker meeting another at random (the index of isolation) and the proportion able to speak Welsh, 1991 and 2001, by age group
Tables 3 and 4 use the boundaries of Community Councils as a geography to present the situation in 1991 and 2001 as concentration profiles. Concentrating on the Communities where over 70% spoke Welsh (which was used as a basis for a target of the Government’s Iaith Pawb strategy in 2003), we find as follows: in 1991 almost one in every four Welsh speakers (22.7%, 115 thousand) lived in a Community where over 70% of people spoke Welsh; in 2001, just under one in seven speakers (13.8%, 80 thousand) lived in such a Community. There were 92 Communities where over 70% of people spoke Welsh in 1991; in 2001 there were 54.

20
Table 3: Distribution of Communities by the percentage of Welsh speakers, 199137
% Speaking Welsh (x,y] = more than x% and fewer than or equal to y%
Number of Communities
% of all Communities
Number of Welsh
speakers (thousands)
Welsh speakers as % of total
[0,10] 345 39.9 85 16.7 (10,20] 118 13.7 65 12.8 (20,30] 52 6.0 34 6.7 (30,40] 39 4.5 29 5.7 (40,50] 42 4.9 48 9.4 (50,60] 80 9.3 54 10.6 (60,70] 96 11.1 78 15.4 (70,80] 67 7.8 72 14.1 (80,90] 25 2.9 44 8.6 Total 864 100 508* 100 * The total is not the sum of the components because of rounding.
Table 4: Distribution of Communities by the percentage of people able to speak Welsh, 200138
% able to speak Welsh (x,y] = more than x% and fewer than or equal to y%
Number of Communities
% of all Communities
Number able to speak Welsh
(thousands)
Those able to speak Welsh as
% of total
[0,10] 139 16.1 53 9.1 (10,20] 328 37.9 187 32.2 (20,30] 59 6.8 39 6.7 (30,40] 47 5.4 43 7.5 (40,50] 55 6.4 45 7.7 (50,60] 96 11.1 66 11.3 (60,70] 87 10.1 68 11.8 (70,80] 40 4.6 51 8.8 (80,90] 14 1.6 29 5.0 Total 865 100 582* 100 * The total is not the sum of the components because of rounding.
37 1991 Census. Based on unrounded percentages. 38 2001 Census, table CAS146. Based on unrounded percentages.

21
Map 2: % able to speak Welsh, 2001
(The map comes from a poster provided by the Board for schools in 2010.)

22
Map 3: Number able to speak Welsh, 2001
(The map comes from a poster provided by the Board for schools in 2010.)

23
5 Skills, according to the 2001 Census
5.1 Background
The census asks about the ability to understand spoken Welsh, and to read and write Welsh, as well as the ability to speak it. As people only put a simple tick to indicate whether or not they could speak Welsh, ‘can speak’, as measured by the Census, encompasses a wide range of ability, as does understanding, reading and writing. We shall consider shortly evidence about the different levels of ability encompassed and then consider the use people make of these skills.
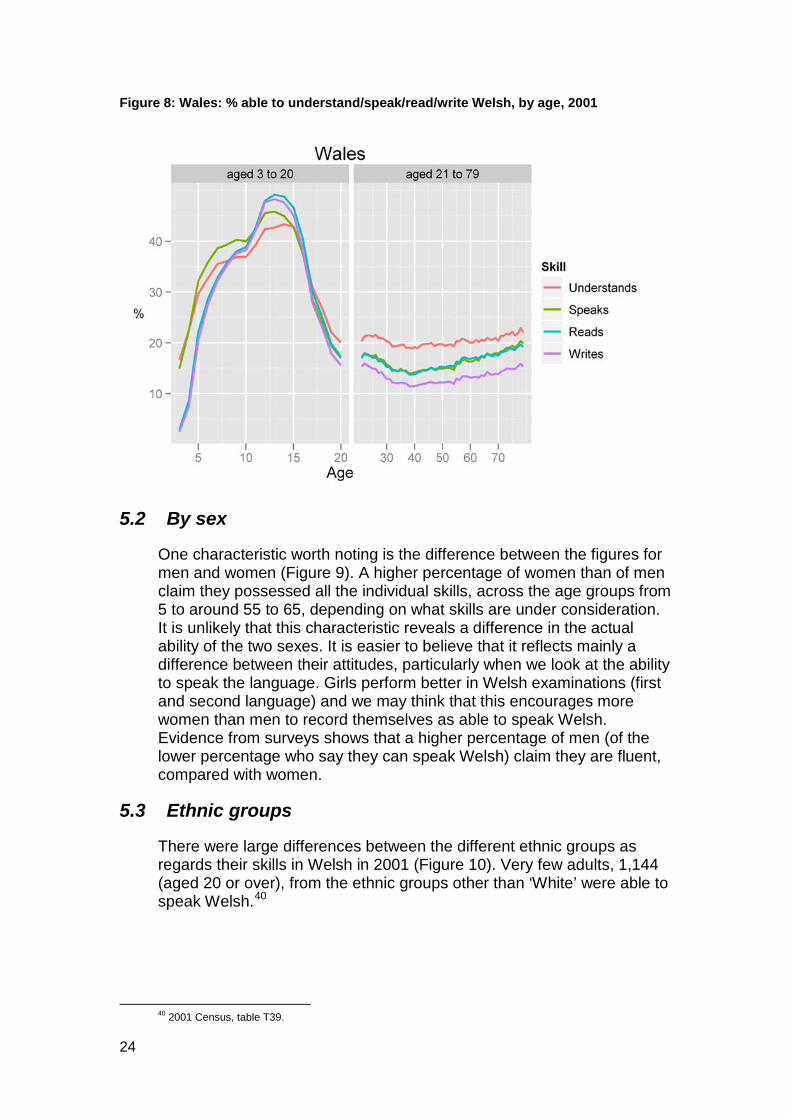
According to the 2001 Census, 661,526 people were able to understand spoken Welsh, 582,368 were able to speak Welsh, 567,152 were able to read the language and 495,519 to write it. There is a tendency to think that these skills form a hierarchy, with the ability to write Welsh as the highest, above reading, speaking and understanding in that order. The census results suggest that people do not see it as simply as that. Some people who can speak Welsh may have skipped the question about their ability to understand Welsh, assuming it not to be relevant to them. (From an analysis of the details of a sample of 3% of the total respondents to the 2001 Census, we find that almost 15%—which converts to give an estimated 90,000—of those who said they could speak Welsh also said they could not understand it.39
Figure 8
) In the case of adults, the percentage who can read Welsh is very similar to the percentage who can speak the language, but there is a clear gap between this and the percentage who can write it ( ).
The charts reveal a fall in the percentage possessing all the different skills between the ages of 55 and 54, that is to say between those born in 1946 or earlier and those born later on. We can assume that this is the effect of the Second World War: an increase in mixed-language marriages after the war, the effect of population movement, or a language shift resulting from service in the armed forces? (In 2001 there were 35,592 people aged 55 and 45,201 aged 54.)
39 2001 Census, ‘Sample of Anonymised Records’ (SARs) of individuals.
24
Figure 8: Wales: % able to understand/speak/read/write Welsh, by age, 2001
5.2 By sex
One characteristic worth noting is the difference between the figures for men and women (Figure 9). A higher percentage of women than of men claim they possessed all the individual skills, across the age groups from 5 to around 55 to 65, depending on what skills are under consideration. It is unlikely that this characteristic reveals a difference in the actual ability of the two sexes. It is easier to believe that it reflects mainly a difference between their attitudes, particularly when we look at the ability to speak the language. Girls perform better in Welsh examinations (first and second language) and we may think that this encourages more women than men to record themselves as able to speak Welsh. Evidence from surveys shows that a higher percentage of men (of the lower percentage who say they can speak Welsh) claim they are fluent, compared with women.
5.3 Ethnic groups
There were large differences between the different ethnic groups as regards their skills in Welsh in 2001 (Figure 10). Very few adults, 1,144 (aged 20 or over), from the ethnic groups other than ‘White’ were able to speak Welsh.40
40 2001 Census, table T39.

25
Figure 9: Wales: % able to understand/speak/read/write Welsh, by sex and age, 2001
Figure 10: % able to speak Welsh, by ethnic group, 2001
Source: 2001 Census, table T39

26
5.4 Understanding
661,526 people (23.6%) said they could understand Welsh and 138,416 (4.9%) said this was their only skill in the language.41
Figure 8
shows that the percentage of those able to understand spoken Welsh is higher than the percentage able to speak, read or write Welsh, both in general and certainly among those aged over 19. The pattern does not appear to be the same in the case of children of school age. Probably some children—or rather their parents—have noted that they can speak, read and write Welsh while being unable to understand the language. There is no evidence as to the reason for this. As this is most evident in the authorities where there was not a high percentage of people able to speak Welsh, we can speculate that the children are learning Welsh at school as a second language. Perhaps they somehow feel they should record that they can read Welsh—perhaps they can read a poem or hymn—and speak it—since they can pronounce words and respond to some questions—but are not comfortable claiming that this means they can understand spoken Welsh in general.
Map 4 shows the distribution of those who said they were able only to understand spoken Welsh, by electoral division. Strikingly, the highest percentages were found on the fringe of the traditionally Welsh-speaking areas.
Map 4: % who only understood spoken Welsh: all aged 3 and over, 2001 Census
41 2001 Census, table KS25.

27
5.5 Literacy, by local authority
Although, when we talk about literacy, we tend to think about the ability to read and write Welsh, it seems that the ability to write Welsh is much rarer than the ability to read it. At a national level, 20.8% could speak Welsh, 20.2% could read the language, and 17.7% could write it. 16.3% (457,946) possessed the three skills, 1.4% (38,384) could speak and read Welsh but not write it, and 2.8% (79,310) could speak Welsh but not read or write it. These situations varied considerably from authority to authority, and varied by age group within authorities.
The gap among children of secondary school age between the percentages for those able to understand Welsh and those able to speak it appears mainly in the authorities of the old county of Gwent and in the remainder of the south-east and in Flintshire (Figure 15). There is also a gap among the younger children, those aged under ten, in the old county of Gwent (Figure 28 to Figure 31). This all suggests that the effect of teaching Welsh as a second language at school—which, in 2001, was a fairly recent development for the majority of Gwent—was the cause of the gap.
The assumed effect of the Second World War, mentioned above (section 5.1), can be seen in Swansea (Figure 21), Neath Port Talbot (Figure 22), Carmarthenshire (Figure 20) and Ceredigion (Figure 19)—but not to the same extent in Anglesey (Figure 11) and the situation is reversed in Gwynedd, where the percentage able to speak Welsh among those aged 54 was higher than among those aged 55 (Figure 12).
It is also interesting to note that the gap between the percentage who understood Welsh and the other skills tended, in many authorities, to be narrower among those aged over 55. See for example, Bridgend (Figure 23) and Rhondda Cynon Taf (Figure 25) where this is striking, but also Merthyr Tydfil (Figure 26), Caerphilly (Figure 27), the Vale of Glamorgan (Figure 24) and others. Sometimes, in some of the authorities where the percentages are at their highest, the percentage of older people who could speak Welsh was again found to be higher than the percentage who understood it. See Gwynedd (Figure 12) for example. This is probably a reflection of a problem with the census question, with people thinking that, having ticked the box to show they could speak Welsh, there was no need for them to tick the box to show they understood it as well.
Where the percentages are based on small numbers, they can show considerable variance. To make trends clear in the following charts, the smoothed lines have been added to the original percentages.

28
Figure 11: Isle of Anglesey: % able to understand/speak/read/write Welsh, by age, 2001
Figure 12: Gwynedd: % able to understand/speak/read/write Welsh, by age, 2001

29
Figure 13: Conwy: % able to understand/speak/read/write Welsh, by age, 2001
Figure 14: Denbighshire: % able to understand/speak/read/write Welsh, by age, 2001

30
Figure 15: Flintshire: % able to understand/speak/read/write Welsh, by age, 2001
Figure 16: Wrexham: % able to understand/speak/read/write Welsh, by age, 2001

31
Figure 17: Powys: % able to understand/speak/read/write Welsh, by age, 2001
Figure 18: Ceredigion: % able to understand/speak/read/write Welsh, by age, 2001

32
Figure 19: Pembrokeshire: % able to understand/speak/read/write Welsh, by age, 2001
Figure 20: Carmarthenshire: % able to understand/speak/read/write Welsh, by age, 2001

33
Figure 21: Swansea: % able to understand/speak/read/write Welsh, by age, 2001
Figure 22: Neath Port Talbot: % able to understand/speak/read/write Welsh, by age, 2001

34
Figure 23: Bridgend: % able to understand/speak/read/write Welsh, by age, 2001
Figure 24: Vale of Glamorgan: % able to understand/speak/read/write Welsh, by age, 2001

35
Figure 25: Rhondda Cynon Taf: % able to understand/speak/read/write Welsh, by age, 2001
Figure 26: Merthyr Tydfil: % able to understand/speak/read/write Welsh, by age, 2001
36
Figure 27: Caerphilly: % able to understand/speak/read/write Welsh, by age, 2001
Figure 28: Blaenau Gwent: % able to understand/speak/read/write Welsh, by age, 2001

37
Figure 29: Torfaen: % able to understand/speak/read/write Welsh, by age, 2001
Figure 30: Monmouthshire: % able to understand/speak/read/write Welsh, by age, 2001

38
Figure 31: Newport: % able to understand/speak/read/write Welsh, by age, 2001
Figure 32: Cardiff: % able to understand/speak/read/write Welsh, by age, 2001

39
5.6 Mapping literacy
We shall look next, in the maps that follow, at a more detailed geographical level, that of electoral divisions, and at the percentage of Welsh speakers who were literate in Welsh, in the sense that they were able both to read and write the language. There are five maps, based on different age groups. In the first (Map 5), we look at the whole population of Welsh speakers aged 3 and over. The core of the old ‘Welsh Heartlands’ in Anglesey, Gwynedd, Ceredigion and Carmarthenshire have 85% or more Welsh speakers literate in the language. This core is surrounded by a fringe where between 75% and 85% are literate, and this area is bordered by another where there is an even lower percentage—between 65% and 75%. This area is a strip running from North Pembrokeshire through South Carmarthenshire before turning north through Swansea and Neath Port Talbot to western Powys. It corresponds roughly to the area where a high percentage of people said they only understood spoken Welsh (Map 4). To the south-east, are yet more areas where between 75% and 85% are literate.
Map 5: % of Welsh speakers aged 3 and over able to read and write Welsh
The age groups mapped are 5 to 19, 20 to 34, 35 to 59, and 60 and over. The area where high percentages of literacy are found is much more extensive when we consider the group aged 5 to 19 (Map 6). At least 75% are literate in the greater part of the country.

40
Map 6: % of Welsh speakers aged 5 to 19 able to read and write Welsh
Map 7: % of Welsh speakers aged 20 to 34 able to read and write Welsh

41
Map 8: % of Welsh speakers aged 35 to 59 able to read and write Welsh
Map 9: % of Welsh speakers aged 60 and over able to read and write Welsh

42
When we consider those aged 20 to 34 (Map 7) the situation is more patchy. In Carmarthenshire and Ceredigion, areas where between 75% and 85% are literate are much more numerous, while the literacy percentage for the greater part of Gwynedd and Anglesey is still 85%.
In the map for those aged 35 to 59 (Map 8), the area in Carmarthenshire where between 75% and 85% are literate stands out even more clearly. There are a number of areas in mid-Ceredigion where the percentage is higher than among the younger age groups. In the map for those aged 60 and over (Map 9) many areas appear to have a low percentage, where under 65% or even under 50% are literate, including the Swansea and Neath Valleys and the Rhondda Cynon Taf area.
5.7 Literacy, by industry
The lowest rate of literacy was found amongst workers in the transport and manufacturing industries: around 77% of people in those industries who could speak Welsh were also able to read it and write it. There was a higher rate in the agricultural industry (87%) and in education (86%).42
There is a link between qualification and industry, for example 65% of people working in the education industry had a Level 3 qualification or above; only 14% of those in the building industry had a Level 3 qualification or above.
43
Figure 33 The percentages of Welsh speakers who are
literate in Welsh reflect this relationship. , for example, shows that, in the majority of local authorities, the percentage of people in the education industry who are literate is higher than the percentages for literacy in the other industries shown. In a large number of authorities, it is the construction industry that has the lowest percentage of literate Welsh speakers.
42 2001 Census, table S140. 43 2001 Census, table S131.

43
Figure 33: Literacy rate of Welsh speakers, by industry, 2001
Only some of the main industries (with percentages between 50–100%) are shown.

44
6 Skills: other evidence What level of skill do people possess who say in the census that they can speak Welsh, or understand, read or write it? We must turn to other sources to seek the answer to this question. For the population as a whole, we can turn to the Language Use Surveys conducted by the Welsh Language Board in 2004–06. 7,700 people who said they were able to speak Welsh were interviewed in those surveys. Another survey had been held previously, in the wake of the 1991 Census; this was the 1992 Welsh Social Survey by the former Welsh Office. It interviewed almost 28 thousand people, including 6,200 who said that they spoke Welsh. Although the 2004–06 and 1992 surveys built, as it were, on information from the census, it would be incorrect to think that people had interpreted the questions of the 2001 Census in the same way as the 1991 questions had been interpreted—and the questions in 1991 would have been interpreted differently from those of 1981, and so on—even if there had been no change at all in the wording of the questions. People in one period see things differently from people in another period, even over an interval as short as a decade. In the same way, people in one area see things differently from people in another area. For example, we could expect that the amount of Welsh to be heard in the area would influence someone when considering whether he or she personally spoke Welsh.
6.1 Fluency of speech
According to the 1992 Welsh Social Survey, 61% (363 thousand) of those who spoke Welsh could speak the language fluently. According to the Welsh Language Use Surveys of 2004–06, 58% (317 thousand) of those who could speak Welsh considered themselves fluent. These figures suggest that the number of speakers who are confident enough to say that they are fluent has declined from 1992 to 2004–06, even if we admit that we do not know what criteria speakers used in 1992 and 2004–06 and that those criteria are likely to differ to at least some degree.
Remembering that a survey can provide no more than estimates to which some uncertainty pertains, Figure 34 shows the percentage of the speakers who were fluent in 2004–06 by authority. The length of the bar on both sides of each point gives a confidence interval of 95%, that is, it gives an idea of the reliability of the estimate. The real percentage could be as low as the left end of the bar, or as high as the right end. Where the sample was comparatively small, the line is comparatively long. Where there was a more substantial sample, the bar is shorter and there is less doubt about the point estimate.
There is an obvious correlation between the percentage in an area who say they are able to speak Welsh and the percentage of speakers who say they speak it fluently. See Figure 67.

45
Figure 34: % of fluent speakers, by local authority, estimates for 2004–06
Figure 35: Cartograms: number able to speak Welsh and number able to speak it fluently, 2001 Census and 2004–06 estimates

46
These estimates give another view on the distribution of Welsh speakers. On the basis of the Language Use Surveys of 2004–06, 56% of all fluent Welsh speakers, of all ages, lived in Anglesey, Gwynedd, Ceredigion and Carmarthenshire. The first cartogram in Figure 35 is based on the numbers of all speakers in all counties and the second is based on the number of fluent speakers.
Map 10 too is based on the results of the Language Use Surveys of 2004–06.44
Map 2
While a sample of 7,700 is a large one for a national survey, this still meant only small numbers were obtained for small areas. Statistical techniques were used to calculate the estimates shown. They seek to give a general picture and no particular weight should be given to the proportion shown in a specific area. Compared with , which shows the percentage who can speak Welsh, we can again see the relationship between the percentage able to speak Welsh and the percentage of fluent speakers.
It should be no surprise to find that the percentage of speakers who consider themselves fluent seems to vary according to age as well. Figure 36 suggests how it could also vary according to the sex of the speaker.
Map 10: % of Welsh speakers who are fluent, estimates for 2004–06
44 The geography used was that of middle layer super output areas.

47
Figure 36: % of Welsh speakers who are fluent, by sex and age group, estimates for 2004–06
Statistics for schools and the results of national curriculum assessments are other sources of evidence about children’s ability in the Welsh language. Table 5 shows that the percentages of 7 and 11 year-olds assessed in 2001 in Welsh (first language) are fairly close to the estimates of the percentage of fluent speakers based on the Census of Population and the Language Use Surveys. The estimate for those aged 14 seems rather high, although, since not every pupil who was studying Welsh first language at primary school continues to do so at secondary school, the percentage assessed at the end of Key Stage 3 could be an underestimate. (In 1996–99, 23% of the children assessed in Welsh at the end of Key Stage 2 were not assessed in the subject at the end of Key Stage 3.)45
45Analysis by Fischer Family Trust for ACCAC, used in the report by Llais y Lli (2005).

48
Table 5: Children at the end of Key Stage 1, 2 a 3: % fluent, comparison of the estimates for 2001
Age Estimate of the % of the
population speaking
Welsh fluently, 2001 Census46
% assessed in Welsh (first language) at the end of the Key Stage in
2001
% fluent, 2001, according to the schools’
census
% fluent and speaking
Welsh at home in 2001
according to the schools’
census
% being taught Welsh first language,
according to the schools’
census
7 (KS1) 15.7 19.0 16.6 6.4 Unavailable 11 (KS2) 20.3 17.5 16.5 6.3 Unavailable 14 (KS3) 21.0 13.8 Unavailable Unavailable 14.1
Map 11 shows estimates of the percentage of children aged 14 who could speak Welsh fluently in the period 2006–08, based on parents’ judgement of their children’s ability as reported in the annual schools’ census.47
Map 11: Pupils at the end of Key Stage 3 (14 years of age), 2006–08, % able to speak Welsh fluently
When comparing this with Map 10 it is worth looking in particular at Carmarthenshire, where, it appears there were numerous areas with a fairly low percentage of young Welsh speakers compared with the percentage of
46 Calculated simply by taking the percentages by age group, from the Language Use Surveys of 2004–06, of speakers who said they were fluent and assuming that the same percentages of speakers would have been fluent in the 2001 Census. 47 The geography used is that of lower layer super output areas.

49
speakers of all ages (although, as the two maps are based on different statistical geographies, one cannot be sure this is correct).
6.2 Literacy
In 2010, there was a National Survey of Adult Skills in Wales assessing, among other things, Welsh-medium literacy skills. The survey tried to use a methodology similar to that employed in the survey that preceded it, the survey for the Basic Skills Agency carried out during March–September 2004.48,49
In 2010, an assessment was carried out of people aged 16–65 who considered that they spoke Welsh either fluently or fairly well, but the survey in 2004 had also assessed people who said they could speak some Welsh. Of those who took part in the Welsh literacy assessment in 2010, 36% were at Entry Level or below (34% in 2004). 37% were at Level 2 or higher (45% in 2004).
50
In general, women’s Welsh-medium literacy skills were better than men’s. 43% of women possessed Welsh-medium literacy skills at Level 2 or above, compared with 31% of men.
There were technical differences between the surveys in 2010 and 2004 that should make us cautious when comparing the results of the two but, at least on the face of it, the Welsh-medium literacy skills of Welsh speakers had declined. This was also true of the Welsh-medium literacy skills of those who considered themselves fluent in Welsh. This differs from the report on English-medium literacy (with a different sample) since the percentage at Level 2 or above increased from 38% in 2004 to 59% in 2010. We should also be cautious when comparing the results for the two languages because of differences between the samples used. Despite that, there are reasons why we could say that these results were to be expected. Efforts have been made to improve English-medium literacy but, on top of that, the age profile of Welsh speakers is changing and a higher proportion of the speakers are young people. The proportion most comfortable in Welsh is lower among young fluent speakers than among older fluent speakers. Under the circumstances, a decrease in the levels of Welsh-medium literacy would not be unexpected.
The group whose Welsh-medium literacy skills were weakest were young people aged 16–19. It was in this age group that the highest percentage (46%) of those with skills at Entry Level or below was to be found. The proportion assessed at Level 2 or above was at its highest among people aged 35–44 (44%).
The English-medium literacy skills of Welsh speakers were better than the literacy skills of people who could not speak Welsh. Of those Welsh speakers who were fluent or could speak Welsh fairly well, 60% were at Level 2 or above, compared with 54% of people who could not speak Welsh, but this difference is unlikely to be statistically significant.
48 Welsh Government (2011h), the author’s analyses. 49 Beaufort Research (2004). 50 Welsh Government (2011h).

50
However, the reverse was true of people who used mainly Welsh at home (100 thousand people, aged 16–65, according to the 2010 Survey). Of these, 53% were at Level 2 or higher, compared with 59% of those who spoke mainly English at home.51 In 2004, of people who used mainly Welsh at home (estimated to be 120 thousand), 42% were at Level 2 or higher, compared with 38% of all others.52
Literacy, of course, includes the skills of reading and writing. We shall now look at these two skills individually.
None of these differences are likely to be statistically significant.
6.3 Writing
We can compare the results of the 2010 Survey of Adult Skills with the results of the previous survey for the Basic Skills Agency in March–September 2004 and the Language Use Surveys of 2004–06.53
The percentage of fluent speakers who felt they could write Welsh very well was lower in 2010 than in 2004 (63% compared with 70%), but a slightly higher percentage felt they could write Welsh fairly well (32% compared with 26%) (
The three surveys asked for respondents’ views about their skills, but the 2004 and 2010 surveys also gave them tasks in order to assess their literacy. The Language Use Surveys of 2004–06 used a different response scale to the others. We should also note that its results which are used below are on the basis of everyone aged 3 and over, although the 2004 Survey was based on people aged 16–64 and the 2010 Survey on people aged 16–65. The 2010 Survey was aimed at speakers who could speak Welsh fluently or fairly well, as opposed to the other two, which included everyone who said they could speak Welsh, no matter how little; for this reason, the only way we can make a reasonably fair comparison is by concentrating on those speakers who considered themselves to be fluent.
Figure 37).
51 Welsh Government (2011h), the author’s analyses. 52 J. Williams and R. Kinnaird (2004). 53 Beaufort Research (2004).

51
Figure 37: Writing ability in Welsh, by fluency: comparing the 2004–10 surveys
The literacy assessments showed that a lower percentage of fluent speakers were at Level 2 or higher in 2010 than in 2004 (45% compared with 61%) (Figure 38). The percentages at a higher level had decreased, according to both self-assessment and objective assessment. Thus, there is some internal consistency to the results of the 2004 Survey and the 2010 Survey. On the other hand, we should note how the levels of the percentages vary. In 2010, 63% of fluent speakers considered they could write very well. 45% of the fluent speakers were at Level 2 or higher. This suggests that there is a tendency for fluent speakers to think their writing abilities are better than their abilities actually are, when assessed objectively.54 All the same, there was substantial agreement between self-assessment and the objective assessment, though not as good in 2010 as in 2004. Of the respondents who considered they could write Welsh very well in 2010, 55% were at Level 2 or higher, 25% at Level 1 and 21% at Entry Level.55 The corresponding percentages in 2004 were 69%, 21% and 11%.56
54 Fluent speakers are not unique in this; it is common behaviour. See J. Kruger and D. Dunning (1999).
55 Welsh Government (2011h), the author’s analysis. Rounding off has meant that the figures do not total 100%. 56 Beaufort Research (2004, graph 3.12.4).

52
Figure 38: Level of Welsh literacy, by the ability to speak and write Welsh, 2004 and 2010
6.4 Reading
As with writing, fluent speakers assess their reading skills more highly than do speakers who consider that they speak Welsh only fairly well. In 2010, 74% of the fluent speakers said they were able to read Welsh very well, down from 80% in 2004, but still much higher than the percentage of fairly good speakers who said the same thing: 18% in 2010 (and 15% in 2004)(Figure 39).
Welsh speakers of all abilities consider that their Welsh reading skills (rather passive skills) are better than their Welsh writing skills (active skills). This is consistent with the results of the census where, as we have seen, higher percentages say they can read than those who say they can write. According to the 2010 Survey, 63% of the fluent speakers considered they could write Welsh very well, but 74% of them considered they could read Welsh very well. The percentages who considered they could write and read English very well were higher. 81% of the fluent Welsh speakers considered they could write English very well and 88% of them considered they could read English very well (Figure 40).57
57 Welsh Government (2011h), author’s analysis.
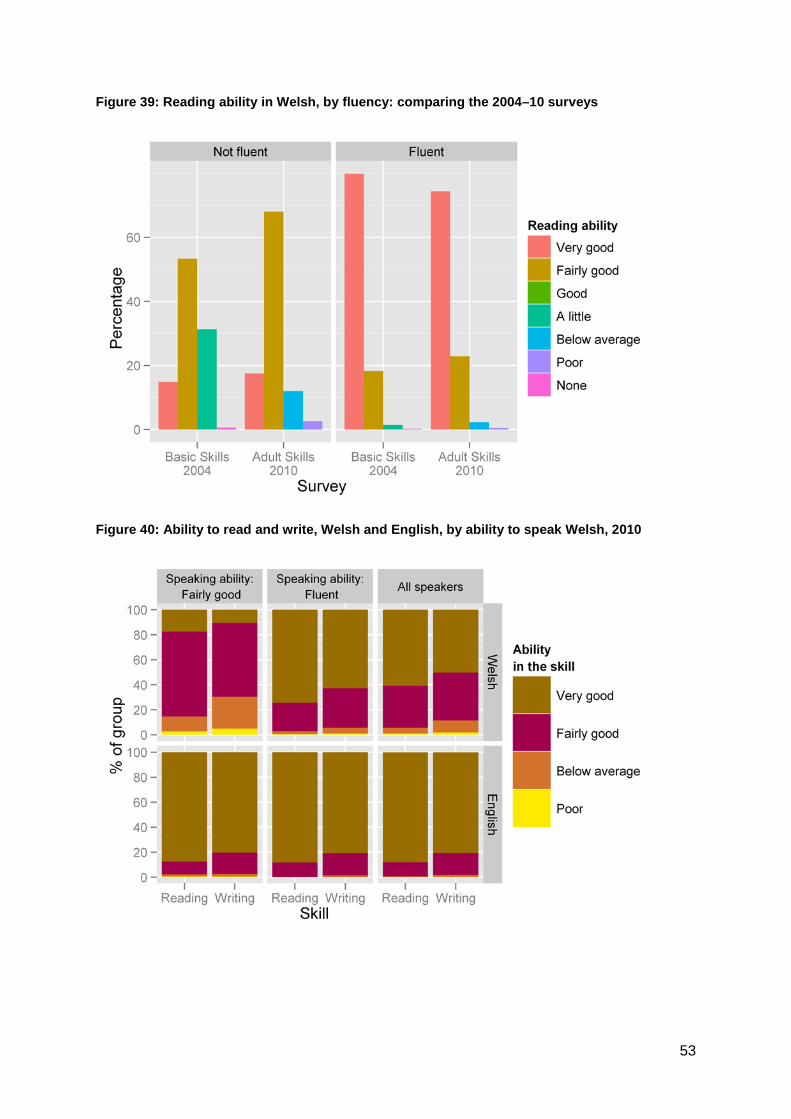
53
Figure 39: Reading ability in Welsh, by fluency: comparing the 2004–10 surveys
Figure 40: Ability to read and write, Welsh and English, by ability to speak Welsh, 2010

54
7 Households The word ‘Household’ is used here as a word with a technical definition. In the 2001 Census, household was defined to mean ‘one person living alone; or a group of people (not necessarily related) living at the same address with common housekeeping—sharing either a living room or sitting room or at least one meal a day’. We can see, therefore, that this is not the same thing as a family—specifically, one person living alone does not count as a family—but, all the same, in the majority of households where more than one person lives, there is only one family. The word ‘family’ also has a specific definition in the census, a narrow definition that includes what is called a nuclear family and also the one-parent family. The word ‘family’ is used here without adopting the census definition.
To people who live in a household where there is any sort of family, the household is an important social setting. Linguistically, the household is an important influence on its members as regards their language, establishing norms in the household that could also influence the individual outside it. Some in Wales used to argue that the future of the language would be assured if Welsh were spoken in the home, no matter how much of a place the language had outside it, at school, for example, or in the media or in the world of work. While the majority of Welsh speakers lived in households where everyone could speak Welsh, and at a period when this was true of the majority of households, perhaps there was some truth to the claim. It is true that the household was a kind of stronghold for the Welsh language in such a situation—but that is not the situation today.
In 2001, of the 575 thousand people who could speak Welsh and who lived in a household, 258 thousand (45%) lived in one where everyone could speak Welsh.58
33.6% of Welsh speakers (193 thousand) lived in a household where no one else could speak Welsh: a third of them (63 thousand) lived alone, but another two thirds (131 thousand) lived in households with others but where no one else could speak the language. Although this is a weakness—people who live in a household where no one else can speak Welsh are unable to speak the language at home—it also, strangely, reflects a strength. In the main, these are children who have learnt Welsh at school.
11.1% of households in Wales were entirely Welsh-speaking, in the sense that all members of the household could speak Welsh.
Almost 1 million people lived in households that included at least one person who could speak Welsh. Almost one person in every three, therefore, lived in a household where at least one person could speak Welsh. 28% of households in Wales included at least one person who could speak Welsh (a good deal higher than the 20.8% of individuals who could speak Welsh).
The proportion of entirely Welsh-speaking households is declining: of households including a Welsh speaker, only 40% in 2001 included only people
58 Others lived in communal institutions such as hospitals, university halls of residence and prisons.

55
able to speak Welsh, compared with 54% in 1991. It could appear from this that Welsh speakers are more and more isolated from other speakers. For example, in almost six households in every ten where at least one person could speak Welsh, there was only one Welsh speaker. This isolation had been less common ten years earlier: in 1991, the proportion was five in every ten. On the other hand, this increase in isolation is not unique to Welsh speakers: in 1991, 25% of households comprised of only one person, compared with 29% in 2001.59,60
The existence of households where everyone can speak Welsh is important because in such households the Welsh language is the main language of the household, and people whose main language at home is Welsh tend to make more use of the language than other speakers. Households with small children have a particular significance, because of the role of the home in the children’s acquisition of language.
In fact, if we look at the numbers of speakers rather than the number of households, we see that only 11% of Welsh speakers lived alone, compared with 15% of the non-Welsh-speaking population. We can probably once again attribute the difference to the fact that a higher proportion of the Welsh speakers are children, and that they live with at least one adult. All the same, in 2001, 130 thousand Welsh speakers—one in five—lived in households with other people, but where no one else could speak the language.
In 2001, of the households where there were two adults, there were 8.2% where both adults could speak Welsh. We can draw some encouragement from noticing that the proportion is a little higher in households where the youngest child was aged under 5: in 9.2% of these couple households, both adults spoke Welsh. (In 1991, where there was a dependent child of any age in a ‘couple household’, 11.2% were households where both adults could speak Welsh.61
Of the 539 thousand households in 2001 that included a couple—we shall call these ‘couple households’—115 thousand (21.3%) included at least one adult who could speak Welsh. There were 44 thousand couple households where both adults could speak Welsh, 8.2% of the couple households.
8.7% was the corresponding proportion in 2001.)
62
There were 96 thousand couple households with a dependent child, with the youngest dependent child aged between 0 and 4. In 23 thousand (23.7%) of those households, at least one adult could speak Welsh. In 9 thousand (9.2%) of these households both adults could speak Welsh.
63
There were also 29 thousand one-parent households with a dependent child, with the youngest dependent child aged between 0 and 4, and in 4 thousand (13.0%) of these the adult could speak Welsh.
64
To be exact: there were 12,642 households (couple or one-parent) where the youngest dependent child was aged between 0 and 4 that could have been
59 OPCS (1993, table 27) 60 2001 Census, table S051. 61 OPCS (1994, table 6). 62 2001 Census, table S144. 63 2001 Census, table S144. 64 2001 Census, table S144.

56
entirely Welsh-speaking households, 9.8% of all households with the youngest dependent child aged between 0 and 4.
Perhaps this low figure will surprise some people, since 20.8% of the population can speak Welsh. There is further evidence to support it. The Language Use Surveys of 2004–06 showed that of all young couples (with a mean age of under 36), both were able to speak Welsh in about 8% of cases.65
The Language Use Surveys of 2004–06 estimated that there are 184 thousand fluent Welsh speakers in entirely Welsh-speaking households who speak at least as much Welsh at home as they do English, and another 31 thousand fluent speakers who make similar use of the language but live in households where not everyone is able to speak Welsh. Expressing these as a percentage of the mid-year population (aged 3 and over) in 2005 (2,854 thousand), we find that 6.4% of the population speak Welsh as much as, or more than, they speak English in entirely Welsh-speaking households, rising to 9.8% when fluent speakers in every type of household are included.
Of these, in fewer than 60% of cases were both partners fluent. Thus, there were fewer than 5% of young couples where both partners were fluent.
Other surveys too have produced estimates of the percentages of people who use the Welsh language at home. ‘First Stage Evaluation of Iaith Pawb’ reported that ‘The 2005 ELWa Individuals Panel Surveys also explored whether Welsh or English was the main language used most often at home amongst a sample of 2009 people. The 2005 panel results showed that 7% used Welsh most often at home.’66 That survey concentrated on people aged 16 and over. The Millennium Cohort Study looked at the use of Welsh within families with children born in 2000. It reported that around 12% spoke at least some Welsh at home, but we should note that the size of the study sample was very small.67
65 Welsh Language Board (2008), t. 19.
66 Arad Consulting and Hywel Evans Cyf (2007). 67 K. Hansen and H. Joshi (2008).

57
Table 6: 2001 Census: households, by local government authority area
Households
Local authority
All households
(thousands)
Households with Welsh speakers
(thousands)
% of households with Welsh speakers
Entirely Welsh-
speaking households (thousands)
% of entirely Welsh-
speaking households
Isle of Anglesey 28 19 68.5 12 42.2 Gwynedd 49 37 75.1 26 52.6 Conwy 48 18 37.9 8 16.8 Denbighshire 40 14 35.3 6 14.8 Flintshire 61 13 22.1 3 4.5 Wrexham 53 12 22.9 3 6.4 Powys 54 15 28.7 6 10.3 Ceredigion 31 20 63.0 12 37.2 Pembrokeshire 48 14 29.6 5 10.6 Carmarthenshire 73 45 62.1 27 36.3 Swansea 94 20 21.2 6 6.8 Neath Port Talbot 58 15 26.0 6 10.0 Bridgend 53 9 17.0 2 3.5 Vale of Glamorgan 49 8 17.1 1 2.8 Rhondda Cynon Taff 95 18 19.4 4 3.7 Merthyr Tydfil 23 4 16.5 1 3.1 Caerphilly 69 12 17.3 1 2.1 Blaenau Gwent 30 4 14.6 - 1.2 Torfaen 38 6 17.3 - 1.3 Monmouthshire 35 5 14.5 - 1.4 Newport 57 9 15.3 1 1.2 Cardiff 124 21 17.0 5 4.1 Wales 1,209* 341 28.2 135 11.1 * The total is not the sum of the components because of rounding. Source: 2001 Census, commissioned table C0055.

58
Table 7: 2001 Census: households with Welsh speakers, by local government authority area
Households Speakers
Local authority
Households with Welsh speakers
(thousands)
Entirely Welsh-
speaking house- holds
(thousands)
% of house- holds
including Welsh
speakers that are entirely Welsh-
speaking
Welsh speakers living in a household
(thousands)
Welsh speakers
living in an entirely Welsh-
speaking household68
% of speakers living in
an entirely Welsh-
speaking household
(thousands)
Isle of Anglesey 19 12 61.6 39 25 66.0 Gwynedd 37 26 70.1 77 56 72.4 Conwy 18 8 44.2 31 15 48.9 Denbighshire 14 6 41.9 23 11 46.6 Flintshire 13 3 20.5 20 5 22.6 Wrexham 12 3 27.7 18 5 29.8 Powys 15 6 35.8 26 10 39.8 Ceredigion 20 12 59.1 37 23 62.3 Pembrokeshire 14 5 35.8 24 10 40.5 Carmarthenshire 45 27 58.4 83 52 62.6 Swansea 20 6 32.0 28 10 34.5 Neath Port Talbot 15 6 38.4 23 10 42.1 Bridgend 9 2 20.6 13 3 22.8 Vale of Glamorgan 8 1 16.3 13 2 19.0 Rhondda Cynon Taff 18 4 19.1
28 6 20.6
Merthyr Tydfil 4 1 18.9 6 1 20.4 Caerphilly 12 1 12.3 18 3 14.1 Blaenau Gwent 4 - 8.5 6 1 9.5 Torfaen 6 - 7.4 10 1 8.7 Monmouthshire 5 - 9.5 8 1 10.6 Newport 9 1 7.8 13 1 8.4 Cardiff 21 5 23.9 32 9 26.9 Wales 341 135 39.5 575 258 44.9 Source: 2001 Census, commissioned table C0055.
68 Assuming that everyone could speak Welsh in households where six or more people were able to speak Welsh.

59
8 Transmission/The language of the children Let us return to the results of the 2001 Census, this time to look at the numbers of children who can speak Welsh rather than the number of households.
In 2001, 7% of children aged 3 to 4 could speak Welsh and lived in households where Welsh might have been the main language since all the adults were able to speak Welsh as well. (This was probably a decrease in the percentage since 1991 when there were about 9%.69) The percentage would have been higher if every child living in such a household had been brought up by its parents to speak the language, that is, if the language had been transmitted in the home. There were 1,763 children aged 3 to 4 who could not speak Welsh in households where all the adults were able to do so. There were 4,261 other children aged 3 to 4 who could speak Welsh in families where one of the two parents could speak the language.70
Where the household contained a couple (either married or cohabiting) and both adults could speak Welsh, 82% of children aged 3 to 4 could speak Welsh. In the case of one-parent households, the percentage was 55%. In the case of households including a couple, one of whom could speak Welsh, 40% of the children could speak Welsh. Percentages of this sort are referred to as ‘transmission rates’.
Map 12: Children aged 3 to 4 of couples where one adult speaks Welsh: % able to speak Welsh, 2001
69 Welsh Language Board (2003). 70 2001 Census, table S143.
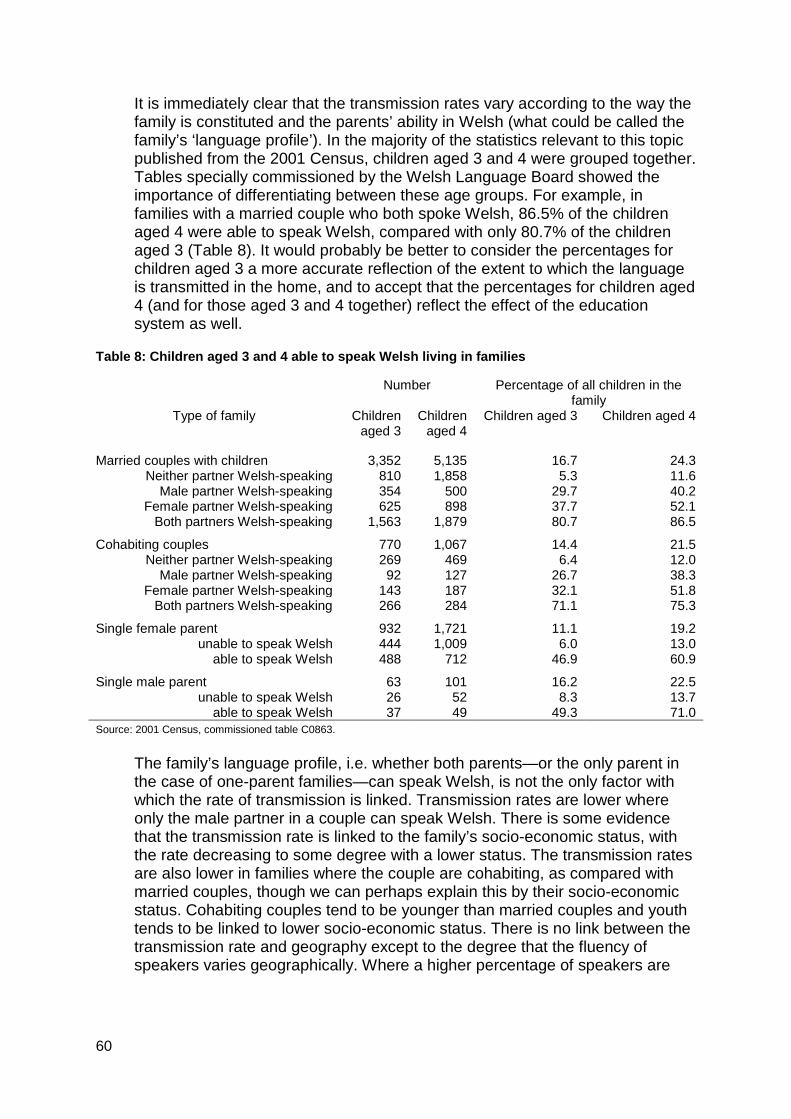
60
It is immediately clear that the transmission rates vary according to the way the family is constituted and the parents’ ability in Welsh (what could be called the family’s ‘language profile’). In the majority of the statistics relevant to this topic published from the 2001 Census, children aged 3 and 4 were grouped together. Tables specially commissioned by the Welsh Language Board showed the importance of differentiating between these age groups. For example, in families with a married couple who both spoke Welsh, 86.5% of the children aged 4 were able to speak Welsh, compared with only 80.7% of the children aged 3 (Table 8). It would probably be better to consider the percentages for children aged 3 a more accurate reflection of the extent to which the language is transmitted in the home, and to accept that the percentages for children aged 4 (and for those aged 3 and 4 together) reflect the effect of the education system as well.
Table 8: Children aged 3 and 4 able to speak Welsh living in families
Number Percentage of all children in the family
Type of family Children aged 3
Children aged 4
Children aged 3 Children aged 4
Married couples with children 3,352 5,135 16.7 24.3 Neither partner Welsh-speaking 810 1,858 5.3 11.6
Male partner Welsh-speaking 354 500 29.7 40.2 Female partner Welsh-speaking 625 898 37.7 52.1
Both partners Welsh-speaking 1,563 1,879 80.7 86.5 Cohabiting couples 770 1,067 14.4 21.5
Neither partner Welsh-speaking 269 469 6.4 12.0 Male partner Welsh-speaking 92 127 26.7 38.3
Female partner Welsh-speaking 143 187 32.1 51.8 Both partners Welsh-speaking 266 284 71.1 75.3
Single female parent 932 1,721 11.1 19.2 unable to speak Welsh 444 1,009 6.0 13.0
able to speak Welsh 488 712 46.9 60.9 Single male parent 63 101 16.2 22.5
unable to speak Welsh 26 52 8.3 13.7 able to speak Welsh 37 49 49.3 71.0
Source: 2001 Census, commissioned table C0863. The family’s language profile, i.e. whether both parents—or the only parent in the case of one-parent families—can speak Welsh, is not the only factor with which the rate of transmission is linked. Transmission rates are lower where only the male partner in a couple can speak Welsh. There is some evidence that the transmission rate is linked to the family’s socio-economic status, with the rate decreasing to some degree with a lower status. The transmission rates are also lower in families where the couple are cohabiting, as compared with married couples, though we can perhaps explain this by their socio-economic status. Cohabiting couples tend to be younger than married couples and youth tends to be linked to lower socio-economic status. There is no link between the transmission rate and geography except to the degree that the fluency of speakers varies geographically. Where a higher percentage of speakers are

61
fluent, the transmission rate tends to be higher as well.71 Map 12 See compared with Map 10.
The final point should be a warning that rates of transmission depend on how the census question is interpreted, that is to say, if people increasingly tend to say that they can speak Welsh, even though their grasp of the language is limited, this will affect the calculation of the transmission rates and we can expect them to decrease. Expanding the teaching of Welsh as a second language to adults could have the same effect, since there would be more households with mixed-language couples, or entirely Welsh-speaking households, in which, however, we could not expect the language of the family to change so easily to Welsh.
Table 9 compares transmission rates for Welsh in Wales with the transmission of some of the other Celtic languages in Britain and Ireland. The patterns in the different countries are similar. The transmission rate tends to be higher in couples where both adults can speak the language, for example, compared with couples where only one adult can speak it. The situation of the languages is very different and it may be that the question about the language is interpreted and answered in different ways in the different countries. All the same, considering the comparative strength of the Welsh language, probably few people will be surprised to see that the transmission rates for Welsh seem a good deal higher than the rates for the other languages.
Let us go back to considering the Welsh statistics again. Of the 34,249 children aged 3 who lived as part of a family, 2,291 (6.7%) could speak Welsh and lived in a family where everyone could speak Welsh. 1,214 other children who could speak Welsh, representing 23.7% of all the children aged 3 who could speak Welsh, lived in a family where only one of the two parents in the family could speak the language. 1,549 other children aged 3 could speak Welsh and lived in families where there was no Welsh-speaking parent: these constituted 30.3% of all children aged 3 who could speak Welsh.72,73
If all the children aged 3 in the families where both parents could speak Welsh had been brought up to be able to speak Welsh, they would constitute 10% of all children aged 3.
If all the children aged 3 with at least one parent able to speak Welsh had been brought up to be able to speak Welsh, they would constitute 20.6% of all children aged 3. Of the children assessed at the end of Key Stage1 in 2005, at about 7 years of age, 19.6% were assessed in Welsh (first language) (see Figure 53). In a way then, the education system has not made up for the loss.
The figure of 6.7% being brought up with the Welsh language in families where everyone can speak Welsh agrees well with the figure from the annual schools’ census for the percentage of primary school pupils who spoke Welsh at home in 2001/02: 6.2 % (see Figure 44). This is discussed further under Education.
71 H. Jones (2009). 72 In addition, 63 children aged 3 who could speak Welsh lived in families where both parents could speak Welsh but some other members of the family were unable to do so. 73 2001 Census, commissioned table C0863.

62
Table 9: Transmission rates, by type of family and age of child: Wales, Scotland, Northern Ireland and the Republic of Ireland
% of children of that age group in the family who can speak the
language
Type of family
Which of the parents can speak the language*
Age
3 4 3-4 5-15 16+
All couples Both adults Wales 79 85 82 94 88 Scotland 55 61 58 71 60 Northern Ireland 28 39 34 63 77 Republic of Ireland 16 32 24 90 84 Married couples Both adults Wales 81 87 84 94 89 Scotland 55 62 59 71 60 Northern Ireland 28 38 33 63 77 Republic of Ireland 16 32 24 90 84 Cohabiting couples Both adults Wales 71 75 73 91 84 Scotland 50 55 52 71 52 Northern Ireland 31 52 43 68 74 Republic of Ireland 17 37 26 85 80 All couples Only the female partner Wales 37 52 44 69 49 Scotland 22 21 21 27 11 Northern Ireland 5 7 6 30 40 Republic of Ireland 8 22 15 80 68 Only the male partner Wales 29 40 34 61 42 Scotland 8 11 10 19 10 Northern Ireland 5 5 5 28 34 Republic of Ireland 7 18 13 75 61 One-parent families Female parent Wales 47 61 54 79 71 Scotland 27 41 34 36 45 Northern Ireland 38 36 37 58 58 Republic of Ireland 15 32 24 80 70 Male parent Wales 49 71 60 79 71 Scotland 33 55 45 38 37 Northern Ireland 21 21 21 56 56 Republic of Ireland 13 25 19 73 67 * Welsh in Wales, Scottish Gaelic in Scotland, Irish in Northern Ireland and the Republic of Ireland. Source: 2001 Census: Wales, commissioned table C0863; Scotland C0862; Northern Ireland EXT20080116. Republic of Ireland: 2006 Census.

63
9 Linguistic attrition (Losing the language) An individual’s ability to speak a language is not something unchanging. They can learn a new language at any time of life. It is also an ability that can be lost, especially through lack of use. Individuals probably vary a great deal in this. Some people will remember a language perfectly although they have not made extensive use of it for years, while others lose active ability in the language, or even passive knowledge of it, after a very short time without some regular use. This type of loss is known as ‘linguistic attrition’.74
Between the 1971 Census and the 1981 Census, 12.8% of those who said in 1971 that they spoke Welsh were ‘lost’ in the sense that they said in 1981 that they did not speak Welsh. The corresponding percentage between 1981 and 1991 was 13.8% and between 1991 and 2001 it was 16.6%. Thus, according to this measure, attrition was more common in 2001.
As regards figures for Welsh, attrition is obvious when someone says at one period that they can speak the language and then, at some later period, says they cannot. This has been studied in connection with the census of population, using data from the Office for National Statistics Longitudinal Study. This study links together records across the censuses since 1971 for a sample of about 1% of the population.
75
Although there was attrition among Welsh speakers, the gains in 2001, i.e. the numbers saying they could speak Welsh among those who had not been able to speak Welsh ten years earlier, were more substantial in every age group studied, except for the oldest group who had been over 65 in 1991.
76,77
10.6 Some
of the gains will be the result of people learning Welsh (see section , Welsh for Adults).
Some surveys have included questions to ascertain how many people consider they have lost Welsh-language skills. For example a survey commissioned from NOP in 1995 by the Central Office of Information and the Welsh Language Board, ‘Public attitudes to the Welsh language’ reported that 26% could understand most or everything of what was said in Welsh in their area and that an additional 2% said that they used to understand most or everything when they were younger.78 The 1992 Welsh Social Survey found that 3% of those who had, as children, spoken more Welsh than English at home, could no longer speak any Welsh, although 85% remained fluent.79
74 See e.g. H. Seliger and R. Vago (ed.) (1991), and J. Phillips (2008).
75 H. Jones (2005). 76 Although everyone is asked the same question, not everyone will interpret it in the same way. The changes could reflect the fact that some groups employ different norms to interpret the questions. This is called ‘differential item functioning’. 77 H. Jones (2005). 78 NOP (1995). The fieldwork was undertaken in March of that year. It used a sample of 815 people aged 16 and over: of the 815 interviewed, 365 were non-Welsh-speaking, and 384 could speak ‘at least a few sentences’. 79 Welsh Office (1995), table 3.

64
10 Education More young speakers of Welsh have learnt the language through the education system than have learnt it at home. This section will describe the current situation within the education system. Statistics for teachers will be considered in the section on the economy, when we seek to assess the sustainability of the present system. Of course the output of the education system as regards pupils also forms an important input to the wider workforce.
10.1 Pre-school
The results of the census of population have shown that the percentage of children aged 3 to 4 who can speak Welsh is increasing, from 11.3% in 1971, to 13.3% in 1981, 16.2% in 1991 and 18.8% in 2001. Since there was no increase in the percentage of Welsh-speaking families over the same period, we must assume that this is the effect of education.
The Welsh-medium nursery schools movement, Mudiad Ysgolion Meithrin (MYM), was set up in 1971. Its adoption in 2011 of the new name, Mudiad Meithrin (literally the ‘nursery movement’, dropping the word for ‘schools’), reflects how the education system has changed since then. In 1971, MYM’s 67 groups offered sessional care, but the name ‘ysgol feithrin’ (nursery school) suggested that the aspiration to offer children an education, and teach Welsh to children unable to speak the language, was a core part of its aim. Figure 41 shows how the number of MYM playgroups increased, reaching a peak late in the nineties of the last century. There were 632 groups in 1996, but the number fell to 618 in 1997. In 1996, the Welsh Office, with a Conservative Government in power, proposed the introduction of a nursery voucher scheme.80
Although there has been no change in the compulsory school age of 5, the percentage of children under 5 attending school has increased over the last 30–40 years. Schoolchildren aged under 5 constituted 85% of the population aged 3 to 4 in January 2010, compared with 69.4% in 1990/91, a percentage that had hardly changed since 1985/86.
Although the Labour Government elected in May 1997 abolished the vouchers, the series of numbers of MYM groups probably reflects the effect of the intended change.
81 Until 1986, full day care scarcely existed.82 Since September 2004, every child aged 3 has been offered free part-time education.83
Recording the amount of provision as regards places is comparatively easy compared with the difficulty of recording the number of children who use the provision, since a child aged under 5 can be using more than one service in the
That education can be provided either within maintained schools or in funded places. The ‘pre-school’ sector includes not only places providing early years education, funded or otherwise, but also places providing care. In general, places providing care alone are not funded.
80 C. Gillie and G. Allen (1996). 81 StatsWales 007650. 82 Siân Wyn Siencyn and Sally Thomas, in S.W. Siencyn (2010). 83 Statement by Jane Davidson, 11 October 2004, http://wales.gov.uk/newsroom/educationandskills/2004/4024583/?skip=1&lang=en, accessed 1 December 2011.

65
same day, not to mention during longer periods. MYM reported 10,246 children attended their groups in 1992; in 2008–9 there were 12,031.84,85 We can compare these with the mid-year population estimates: in 1992 there were 37,828 children aged 2; in 2009 there were 34,023.86,87 By dividing the numbers in the groups by the 2-year-old population, we get percentages of 27.1% and 35.4% but, of course, it is not only 2-year-olds who attend the groups.88
We shall consider in the next section the changes in the numbers of children in Welsh-medium primary education, the next step in the education system. According to the movement’s figures, about 8,300 children transferred from their groups to a school during the school year 2008–09. About one in every eight went to an English-medium school or, in other words, 87%, some 7,200 children, transferred to a Welsh-medium school, Continuity in Welsh-medium education is a theme we shall address later on as well.
It might be more correct to divide by the population of children aged two and three, which would give percentages of 13.5% in 1992 and 17.8% in 2009. These are ‘back of an envelope’ sums, and much too rough-and-ready for us even to be able to form a judgement as to the direction of the trend.
Figure 41: Numbers of Mudiad Meithrin playgroups and Ti a Fi (parent and toddler) groups, 1970-2011
84 Figure 1992: Pwyllgor Datblygu Addysg Gymraeg (PDAG: Committee for the Development of Welsh-medium Education) (1993). 85 Figure 2009: provided to the Welsh Language Board by MYM. 86 StatsWales 003121. 87 StatsWales 025104. 88 Compare with ‘About 35 per cent of children aged 3 in Wales are in nursery places that immerse them in the Welsh language ...’ Siân Wyn Siencyn and Sally Thomas, in S.W. Siencyn (2010).

66
10.2 Primary
10.2.1 Pupils
In 2009/10, 7,090 pupils in year group 1 were being taught Welsh first language. We can see that this is close to the number estimated above as leaving Mudiad Meithrin playgroups to attend a Welsh-medium school. These children would go either into the school’s nursery classes or to the reception class and it would be a year or two before they reached the Year 1 class. Children who learn Welsh first language at school are almost all assessed in Welsh at the end of Key Stage 1 (end of Year 2), as shown in Figure 42. Comparing the percentages assessed in Welsh at the end of Key Stage 1 and the percentage assessed in Welsh at the end of Key Stage 2 gives a measure of how consistent the continuity of teaching medium is through the primary school years. The end of Year 6 is the end of Key Stage 2. Nationally, continuity through primary education is high. For example, at the end of Key Stage 2 in 2011, 19.6% were assessed, which compares with 20.3% assessed at the end of Key Stage 1 in 2007. Although the children at school will not have been exactly the same ones (mainly owing to migration), the number assessed in 2011 was 99% of the number assessed in 2007. We can consider this a sign that almost all the children who were learning Welsh first language in Year 2 had continued to learn Welsh first language up to the end of their time at primary school.
Figure 42: % assessed in Welsh at the end of KS1/2/3, and being taught Welsh first language, 1999–2011
In 2010, the 7,090 pupils represented 22% of Year Group 1. Although they were learning Welsh first language, it is scarcely likely that they were all fluent.

67
2,071 of all pupils in Year Group 1 (6.5%) could speak Welsh fluently, and spoke it at home, and 834 (2.6%) were fluent but did not speak it at home, giving a total of 2,905, or 9.1%.89
Figure 43: % of primary pupils by language/background, by year group, January 2010
These percentages tend to increase with the year group.
While it is possible to believe that the percentage who speak Welsh fluently but do not speak it at home would increase with the length of the children’s time in education, we cannot say the same thing for the percentage who speak Welsh fluently and speak it at home. In the same year (2010) among pupils aged 5 and over in Years 1–6, 7.6% could speak Welsh fluently, and spoke it at home, and 5.4% were fluent but did not speak it at home.90 Figure 44 shows a series of these percentages since 1987/88. The way the information was collected changed in January 2003 and it is this that accounts for the large changes we see between 2001/02 and 2002/03. Before 2002/03 this information was obtained from head teachers. From 2002/03 onwards, the main source was the parents.
The highest percentage of those able to speak Welsh, at least to some degree, was obtained in 2000/01, the year of the 2001 Census of Population: 48.9% of pupils aged 5 and over. We should compare this with the results of the 2001 Census of Population, which showed that 39.4% of children aged 6–11 could speak Welsh. The percentage of pupils aged 5 and over able to speak Welsh had fallen to 38.2% by January 2011.
89 January 2010 Schools’ Census: special extract by the Welsh Government. 90 Welsh Government (2010c), Table 7.6 in the accompanying document.

68
Figure 44: % of primary school pupils by language/background, 1986/87–2010/11
Figure 45: Numbers of primary school pupils by language/background, 1986/87–2010/11
The term ‘Welsh-medium education’ refers to the way the school is organised. Statistics for the development of the ‘Welsh-medium school’ are discussed in
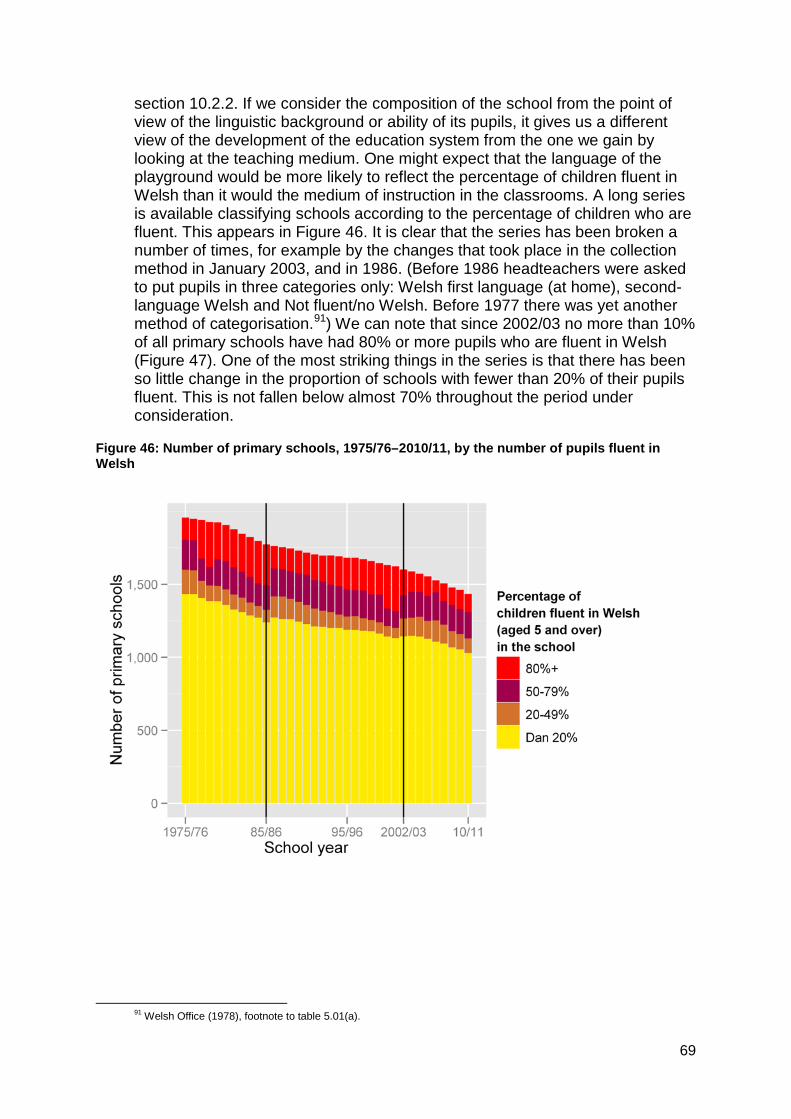
69
section 10.2.2. If we consider the composition of the school from the point of view of the linguistic background or ability of its pupils, it gives us a different view of the development of the education system from the one we gain by looking at the teaching medium. One might expect that the language of the playground would be more likely to reflect the percentage of children fluent in Welsh than it would the medium of instruction in the classrooms. A long series is available classifying schools according to the percentage of children who are fluent. This appears in Figure 46. It is clear that the series has been broken a number of times, for example by the changes that took place in the collection method in January 2003, and in 1986. (Before 1986 headteachers were asked to put pupils in three categories only: Welsh first language (at home), second-language Welsh and Not fluent/no Welsh. Before 1977 there was yet another method of categorisation.91
Figure 47
) We can note that since 2002/03 no more than 10% of all primary schools have had 80% or more pupils who are fluent in Welsh ( ). One of the most striking things in the series is that there has been so little change in the proportion of schools with fewer than 20% of their pupils fluent. This is not fallen below almost 70% throughout the period under consideration.
Figure 46: Number of primary schools, 1975/76–2010/11, by the number of pupils fluent in Welsh
91 Welsh Office (1978), footnote to table 5.01(a).

70
Figure 47: % of primary schools, 1975/76–2010/11, by the number of pupils fluent in Welsh
As discussed above, the way the information was collected changed in January 2003 and that is what accounts for the large changes we can see between 2001/02 and 2002/03.
Figure 48: Number of primary pupils, 1991/92–2010/11, by the class teaching medium

71
10.2.2 Primary school organisation
At primary school, children spend the majority of their time with their class teacher. The language of the class reflects the way the school is organised, for example, some schools are streamed by language and some classes are taught only or mainly through the medium of Welsh and others through the medium of English. Figure 48 shows how the numbers of children in the different types of class have varied over the last two decades. The effect of the Education Reform Act 1988 can be clearly seen with classes where Welsh was not being taught at all decreasing in numbers considerably throughout the nineties of the last century. The numbers for classes where Welsh was used to teach only part of the curriculum have also decreased considerably.
Figure 49 shows how the percentage of pupils in Welsh-medium classes has grown. In 1991/92, 16.0% of pupils were taught in such classes and the percentage increased to 21.4% in 2010/11.92
Figure 49: % of all primary pupils, 1991/92–2010/11, by class teaching medium
The growth in the percentage of ‘mainly Welsh-medium classes’ since 1998/99 can be seen in Figure 50. The percentage increased over most of the country: in 20 out of the 22 local authorities.
92 StatsWales 007478.

72
Figure 50: % of primary pupils in a mainly Welsh-medium class,1998/99–2010/11, by area
Although statistics are available for ‘Welsh-medium schools’, definitions are a problem. The term ‘designated Welsh-medium school’ has never had any legal meaning beyond the meaning bestowed on it by whichever education authority was employing it. The Education Reform Act 1988 (Section 3(7)) introduced the concept of the ‘Welsh-speaking school’, which was defined in terms of how many foundation subjects from the national curriculum (plus religious education) were taught mainly or partly (my italics) through the medium of Welsh, a definition which made more sense in the secondary sector than the primary. Up to 2007/08, for the publication of national statistics, schools were categorised according to their composition in terms of a combination of the language-medium of their classes and the proportion of their pupils who were in classes where Welsh was the main medium. In October 2007 the Welsh Government published an information document that introduced new definitions and these were used for the publication of statistics from January 2009.93
93 Welsh Government (2007).
According to the old categories, the percentage of schools where Welsh was

73
the main medium had increased from 27.1% of all primary schools in 1993/94 to 30.8% in 2008/09.94
Figure 51
In that year 29.6% of schools were defined as ‘Welsh Medium’ (with another 3.1%—46 schools—as dual stream schools). The number of schools by category (old and new) is charted in and the percentages in Figure 52.
Figure 51: Number of primary schools, 1993/94–2010/11, by language category
How can these percentages be reconciled with the fact that not many more than 20% of all pupils are in classes where Welsh is the main medium? To put it simply, many of the Welsh-medium schools are in rural areas, with comparatively small pupil-numbers. One of the characteristics of a ‘Welsh Medium’ school, according to the official definition, is that Welsh is the day-to-day language of the school and the language used to communicate with the pupils and in the administration of the school. From a socio-linguistic standpoint, it is argued that the growth in the number of such schools means that more situations are being created where the pupils are immersed in the sound of the language. It is hoped that in this way they will come to consider the use of Welsh for all purposes as something normal, whatever their linguistic background at home, and that they will come to use it habitually themselves outside school. We should note that these schools are also important as Welsh-medium workplaces. The workforce will be considered in section 11.2.1. We shall look next at the statistics for Welsh in secondary schools.
94 2008/09 figure from a special analysis by the Welsh Government.

74
Figure 52: % of primary schools, 1993/94–2010/11, by language category
10.3 Secondary
10.3.1 Continuity from the primary sector
The problems of categorising a school by medium, already mentioned in section 10.2.2, make it almost pointless to try to compare pupil numbers by the type of primary or secondary school. Thus we shall deal here with continuity of teaching medium, not continuity according to the type of school.
One rough measure of continuity from the primary sector can be found by comparing the numbers or percentages assessed in Welsh first language at the end of Key Stage (KS) 2 at primary school with the numbers being taught Welsh first language the following year, in their first year at secondary school. In 2010, 19.5% (6,558) were assessed at the end of KS2, and in 2010/11, 17.8% (5,897) children in their first year at secondary school were learning Welsh first language.95
We can also compare the percentage assessed at the end of KS2 with the percentage assessed at the end of KS3, three years later. See
Figure 53. At the end of KS3 in 2011, 16.3% were assessed in Welsh first language although 19.8% had been assessed at the end of KS2 in 2008. Although the two groups would not consist of precisely the same children, this suggests that the rate of continuity between the two periods is 82.3%.
The Government’s consultation document on a Welsh-medium Education Strategy, published in 2009, includes statistics on the rates of continuity
95 Welsh Government (2011c), tables 7.13 and 7.17 in the accompanying document and StatsWales 007484.

75
between KS2 in 2005 and 2008 by local authority, calculated by looking at the pupils assessed at Key Stage 2. Nationally, 84.7% of those pupils assessed in Welsh at the end of KS2 in 2005 moved on to be assessed in Welsh at the end of KS3 in 2008. In other words, around one in seven pupils who had been taught Welsh first language at primary school was not going on to study it at secondary school. Among the counties with the lowest levels of continuity (below 80% in each case) were Neath Port Talbot, Anglesey, Carmarthenshire, Conwy, Pembrokeshire and Ceredigion.96 Before that, a study commissioned by the Qualifications, Curriculum and Assessment Authority for Wales (ACCAC) of movements between the two key stages over four years, from 1996/99 to 1999/2002 had shown a continuity level of 78%.97
Figure 53: % of pupils assessed in Welsh, by Key Stage, 1996–2011 and targets for 2015 and 2020
While the continuity from the primary sector is not 100%, the percentage of pupils learning Welsh first language has been steadily increasing for decades. In 1980/81, 10.1% of pupils in maintained secondary schools were learning Welsh first language. By 2010/11 the percentage had risen to 16.7%.98
Figure 54 See
.
96 Welsh Government (2009), p. 111. 97 Llais y Lli (2005). 98 Wales Government (2011c), table 7.16 in the accompanying document.

76
Figure 54: % of secondary pupils, years 7–11, by type of Welsh course, 1977/78–2010/11
10.3.2 Continuity through the secondary sector
We can compare the percentages of pupils being taught Welsh first language by year group. On average, starting with the Year 7 group in 1996/97 up until the Year 7 group in 2006/07, the percentage learning Welsh first language decreases by 0.5 percentage points from Year 7 to Year 11.99 For example, 16.2% of Year 7 in 2006/07 were learning Welsh first language but by 2010/11 the percentage had fallen to 16.0% of Year 11, 5,491 pupils. In 2010/11, 5,291 children entered for the Welsh first language GCSE.100
The most striking feature of
That figure is the total of entries, including all pupils, whatever their age, although the majority would have been in Year 11.
Figure 54 is the increase in the percentage learning Welsh as a second language. The increase began in 1987/88 as schools foresaw that the advent of the Education Reform Act 1988 would make teaching Welsh as a second language compulsory. By 2000/01, 84.5% of pupils were learning Welsh as a second language. Although schools are obliged to teach Welsh as a second language, they are not required to enter the pupils for an examination. The gap between the numbers who learn Welsh as a second language at school and the number who sit the examination is much greater than the gap for Welsh first language pupils. In Year 11 in 2010/11, there were 28,516 pupils learning Welsh as a second language. 9,999 entered for the full GCSE course and 12,784 for the short course, a total of
99 Ibid, table 7.18 in the accompanying document. 100 WJEC(2011).

77
22,783.101 Figure 55 See . The previous year, 27.7% of pupils aged 15 did not sit any GCSE examination in Welsh (Figure 56).
Another aspect of continuity is continuity from GCSE to A level. The Welsh Government’s Welsh-medium Education Strategy includes a target for 7% of the students who sat GCSE Welsh first language to sit A level first language by 2015.102 Figure 58 The trends are shown in . As the possession of an A level in Welsh is likely to be the first step on the path to careers where a high proficiency in the language is essential—to teaching Welsh, for instance—in the long-term the numbers who succeed in gaining an A level in Welsh could be a critical factor for expanding Welsh-medium provision in a number of areas.
Figure 55: Number of pupils aged 15 who sat a GCSE Welsh examination, by type of examination, 1989–2011
101 Joint Council for Qualifications (2011), all ages, in Wales. 102 Welsh Government (2010d).

78
Figure 56: % of pupils aged 15, by type of Welsh GCSE, 1995/96–2009/10
Figure 57: Number of pupils who sat A Level Welsh, by subject, 1975–2011
We can see that around 900 people entered for A level Welsh in recent years (Figure 57). It is mainly from these people that university Welsh departments

79
will draw their students, and in the long-term it is on these that the initial teacher training courses will mainly draw as well.
Figure 58: Continuity from GCSE Welsh to the A level examination, 1991–2011, and targets for 2015
10.3.3 Secondary school organisation
Tracing the growth of Welsh-medium secondary education by looking at the growth of the ‘Welsh-medium schools’ is no more meaningful than in the case of primary schools. Figures are available from 1989/90 to 2008/09 for the number of ‘Welsh-medium schools’ according to the definition of the Education Reform Act 1988 (Section 3 (7)) already discussed when we looked at primary schools. The number of those Welsh secondary schools increased from 42 in 1989/90 to 55 in 2008/09. With the change in the categories from 2009/10, we see (Figure 59) in 2010/11 that there were only 32 ‘Welsh-medium’ schools but there were also 24 bilingual secondary schools (5 Category A, 10 Category B, 9 Category C) and 8 others that were predominantly English-medium ‘but with significant use of Welsh’.103
The growth in Welsh-medium secondary education is reflected more accurately when we look at the change in the percentage of children who are learning Welsh first language (
In 2010/11, 11.4% of all secondary school pupils were at ‘Welsh-medium’ schools and 9.3% at schools in categories A–C.
Figure 54). However, that series conveys nothing of the
103 Wales Government (2011c), tables 7.3 and 7.4 in the accompanying document. Category A: At least 80% of subjects (excluding English and Welsh) are taught only through the medium of Welsh to all pupils. One or two subjects are taught to some pupils in English or both languages. Category B: At least 80% of subjects (excluding English and Welsh) are taught through the medium of Welsh but are also taught through the medium of English. Category C: 50–79% of subjects (excluding Welsh and English) are taught through the medium of Welsh but are also taught through the medium of English.

80
extent to which subjects apart from Welsh are taught through the medium of the language. Unfortunately, comparatively few relevant statistics are published. Details are published of the number, by subject, of pupils who registered to sit GCSE through the medium of Welsh. In 2009/10, 11% of all entries of pupils aged 15 were for a Welsh-medium GCSE examination.104 In the same year, 16.3% of Year Group 11 pupils were learning Welsh first language, although 14.5% of pupils aged 15 sat GCSE in the subject that year.105,106 Of those who registered for GCSE Welsh first language, 79.5% registered for at least two other Level 1/2 qualifications through the medium of Welsh, and 59.7% registered for at least five.107
In 2008/09, in school sixth forms, 10.6% of learning activities for students aged 16–19 were through the medium of Welsh and 6.4% were bilingual.
108
Figure 59: Number of secondary schools, 1989/90–2010/11, by language category
10.4 Further education
There is a good deal of variation in further education provision, particularly on a geographical basis. Because of this, and also because of the geographical variation in the distribution of Welsh speakers, and the fact that not everyone goes on from secondary school to further education, we cannot look at continuity in the same way as we did when looking at school education. It is clear that the sector’s Welsh-medium provision is limited compared with the
104 Wales Government (2011d), table 2.6 in the accompanying document. All entries apart from those in English, English Literature, Welsh, Welsh as a Second Language, and Welsh Literature. 105 Welsh Government (2010c), table 11.61 in the accompanying document and StatsWales 007484. 106 Figures provided by Welsh Government. 107 Welsh Government (2011i), p. 20. 108 Ibid, p. 21.

81
secondary schools sector. In 2009/10, 4.2% of further education learning activities were bilingual and 0.5% (3,555) through the medium of Welsh.109
10.5 Higher education
(215 of the 3,555 Welsh-medium learning activities were work-based at further education institutions. There were another 190 Welsh-medium work-based learning activities with other training providers. There were a similar number (140) of Welsh-medium Community learning activities with local education authorities). Compared with the breadth of Welsh-medium teaching at school, these numbers and percentages are low.
10.5.1 Students
Although it is true, as in the case of further education, that not everyone moves on from the schools sector to higher education, ‘continuity’ is a more meaningful topic, since there is not the same variety in the nature and geographical distribution of the provision. One of the main characteristics of higher education is the outflow of students to study at universities in England which, obviously, is a major break in linguistic continuity for a substantial proportion of students. From 2000/01 until 2005/06, 34–35% of first-year undergraduate higher education students domiciled in Wales studying at a higher education institution in the United Kingdom were studying outside Wales. The proportion fell to 27% by 2009/10, when there were 5,780 students from Wales in their first year outside Wales, 98% of them in England.110 When it comes to the sustainability of the number of Welsh speakers, what is more important than the teaching medium at higher education level is what proportion of these young people will return to Wales to live after finishing their studies. The Higher Education Statistics Agency longitudinal survey of the destinations of those leaving higher education shows that 32.6% of students from Wales who graduated with a first degree in 2006/07 (wherever they studied) and who were employed in November 2010 were working (and we can take it that the majority were living) outside Wales.111
Let us go back to examine continuity in the same way it was dealt with in the case of schools, i.e. continuity of teaching medium. It is estimated that 39.8% of 19-year olds were in full-time higher education in 2010 and 1.9% in part-time education.
Assuming that at least the same proportion of the 5,640 from Wales who began their first degree in England in 2009/10 stay in England, and assuming that 15% of them can speak Welsh, this suggests that an annual net outflow of 300 Welsh speakers could result just from students going to study for their first degree in England.
112 In higher education institutions in Wales in 2009/10, 7.8% of the first-year students from Wales were receiving some part of their education through the medium of Welsh and a slightly lower percentage in the case of all students from Wales, 7.2%.113
109 Wales Government (2011g).
At the same time, it is estimated that around 15% (some 10,500) of students from Wales can speak Welsh fluently. Thus it seems as if half the fluent Welsh-speaking students are not receiving any of
110 StatsWales 002401. 111 Higher Education Statistics Agency (2011), table 12. http://www.hesa.ac.uk/dox/dlhe_longitudinal/0607/tables/LONGDLHE_0607_Table_12.xls. 112Wales Government (2011b) and StatsWales 000769. 113 Wales Government (2011a).

82
their education through the medium of Welsh. The number of students receiving some part of their education through the medium of Welsh in 2009/10 was 4,905, slightly lower than in 2008/09. A third of these were part-time students, a little over a thousand of them at Trinity College, Carmarthen. In terms of full-time student equivalents, 1,757 were receiving some of their education through the medium of Welsh (1.8% of all full-time student equivalents in higher education in Wales).114
352 of the 1,757 (20%) were studying Welsh through the medium of Welsh and 80 through the medium of English. 288 of the 352 were full-time students. That number would include postgraduate students. Comparing these numbers with the number who have been sitting A level Welsh, around 350 first language and 550 second language, puts them into context. This suggests that about one in every nine of those who sit A level Welsh might be continuing to study the subject at University.
10.5.2 Initial teacher training
The number of first-year students in Wales on initial teacher training (ITT) courses that would enable them to teach bilingually, or lead to a formal certificate in bilingual education, rose from 215 in 2007/08 to 230 in 2008/09 and to 250 in 2009/10, 12.9% of all first-year ITT students. The numbers who completed their courses in the same years were a little lower: 190 in 2007/08, 225 in 2008/09 and 230 in 2009/10 (12.4% of the total).
In 2007/08, 35 students were studying to teach Welsh in the secondary sector. The number rose to 65 in 2008/09 before falling to 50 in 2009/10.115
Taking a degree in Welsh and then becoming a Welsh teacher is a traditional career path. 75% of those who registered for their first year in 2009/10 were on postgraduate certificate of education (PGCE) courses. Considering the figures discussed above for students of Welsh, it seems that a high proportion of graduates in Welsh are still training to become teachers.
10.6 Welsh for Adults
Welsh for Adults refers to the system for teaching Welsh to adults apart from those who could be learning Welsh in full-time or part-time education. This system is operated in the main by six Welsh for Adults centres which, since 2007/08, have all but one been located in higher education institutions, although their activities are considered as further education activities.116
It has been estimated that there were 17,865 learners at the centres in 2009/10. In 2001, there were 1,482 thousand people aged 25-74 who were unable to speak Welsh; this gives a rough idea of the size of the possible target
A certain amount of provision for adults to learn Welsh, in terms of courses, is also available from the private and voluntary sectors, but statistics are not available for these.
114 Ibid, table A.4: 70 full-time students and 15 part-time students at the University of Wales, Newport, are not included 115 Welsh Government (2011e). 116 Coleg Gwent is a further education institution.

83
audience for teaching Welsh to adults and suggests that only a little over 1% of the non-Welsh-speaking population aged 24–74 study Welsh per year. A similar calculation was carried out in 1993, when 13,338 learners were recorded.117
Learners who follow the courses of the Welsh for Adults centres receive learning credits for their work, either from the WJEC or from Agored Cymru (formerly known as the Open College Network Wales). The Government does not publish any comprehensive statistics for them. In 2009/10, about 3,600 people achieved WJEC credits at Entry level, 1,400 people achieved WJEC credits at Foundation level and about 700 achieved WJEC credits at Intermediate level.
If we calculate the percentage on the same basis as the above we find it is a little under 1% of the non-Welsh-speaking population.
118
In 2010, 56 people sat the WJ EC Higher examination, that corresponds to at least level B2/C1 of the ALTE/ European Framework of Reference and, roughly, to an A level examination. (We should remember that around 550 people sit A level Welsh as a second language every year.) 230 people sat an Intermediate examination that corresponds roughly to GCSE.
Others will have received credits from Agored Cymru.
Figure 60: Welsh for Adults Examinations, number of candidates, 1996–2010
117 Further Education Funding Council for Wales (1994), table 3. The percentage was calculated on the basis of the number of people unable to speak Welsh aged 18 or over. 118 WJEC (2010), p. 62.

84
11 Workforce
11.1 Distribution of Welsh speakers
In which occupations do Welsh speakers work, at what level and in what industries? To some extent there are Welsh speakers in every industry and occupation, but the more interesting question is to what extent, i.e. do a larger proportion of them work in one industry, or one occupation than the proportion who cannot speak Welsh?
Since the geographical distribution of Welsh speakers throughout Wales is unequal, the distribution of Welsh speakers by industry and occupation reflects to some extent the opportunities available in the area in which they live. As the experience of men and women differs greatly, it is worth also considering the difference between the two sexes when we look at this topic. We shall begin by looking at the results of the 2001 Census and then look at more recent evidence, from the Annual Population Survey and the Language Use Surveys.
The 2001 Census detailed the industries and occupations of people aged 16–74 who were employed during the week before the census. At the time of the census, 17% of people of this age who were economically active were able to speak Welsh.119 Of these economically active people, 21.1% of the self-employed could speak Welsh, compared with 16.1% of employees and 13.9% of the unemployed.120 Of those who were economically inactive, 16.4% could speak Welsh.121
Figure 61
shows the distribution of Welsh speakers across the industries.122
Figure 62
The manufacturing industry was the largest employer of men who could speak Welsh, although it was in the agriculture industry that the highest percentage, 9%, was to be found ( ). The women were less widely distributed: 22% of women who could speak Welsh worked in health and social work and 19% in education.
119 Working or looking for work and available to work. 120 2001 Census, table T39. 121 Economically inactive: including retired people, students excluding those who were economically active, those looking after the home and people permanently sick or disabled. 122The classification of the industries is based on the ‘UK Standard Industrial Classification of Economic Activities 1992’ (SIC92).
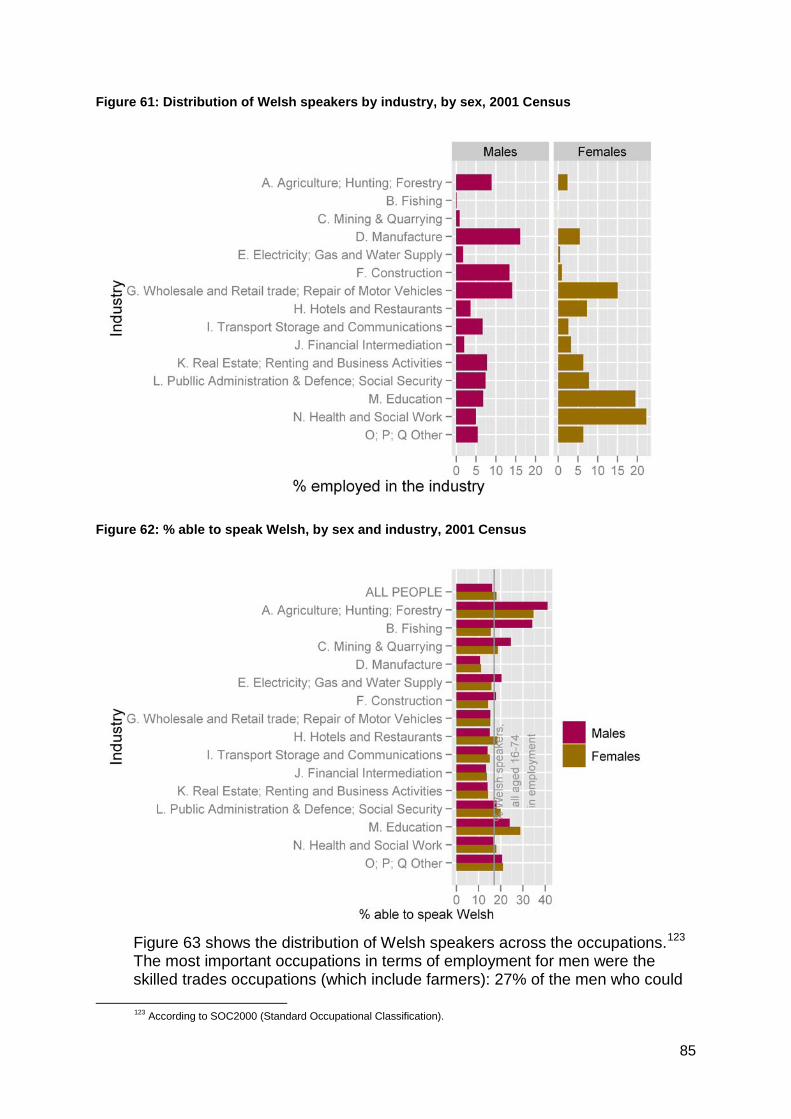
85
Figure 61: Distribution of Welsh speakers by industry, by sex, 2001 Census
Figure 62: % able to speak Welsh, by sex and industry, 2001 Census
Figure 63 shows the distribution of Welsh speakers across the occupations.123
123 According to SOC2000 (Standard Occupational Classification).
The most important occupations in terms of employment for men were the skilled trades occupations (which include farmers): 27% of the men who could

86
speak Welsh were in these occupations. Most important for women were the administrative and secretarial occupations: 19% of the women who could speak Welsh worked in these occupations.
Figure 63: Distribution of Welsh speakers by occupation, by sex, 2001 Census
A high proportion of the women who could speak Welsh were in professional occupations. As a result, of all women in these occupations, 29% could speak Welsh (compared with 18.1% able to speak Welsh out of all women aged 16–74 who were working). The percentage for men in a professional occupation was also higher than the percentage for men in the whole workforce: 19% compared with 16.1% (Figure 64). (Teaching posts have been included with the professional occupations.) Looking at the subgroup of professional workers in teaching and research, we see that 27.0% of the men and 34.5% of the women can speak Welsh. The subgroup for culture, media and sports occupations is another where high percentages of workers can speak Welsh: 20.6% among the men and 28.9% among the women.124 Digging deeper (using a sample of 3% of individuals), we see that the highest percentages occur in the small groups of the artistic and literary occupations, and those connected with the media: 28% in both cases for both sexes together.125
124 2001 Census, table S138. 125 2001 Census, SARs.

87
Figure 64: % able to speak Welsh, by sex and occupation, 2001 Census
The Annual Population Survey gives more recent data. In the calendar year 2010, 11.2% of Welsh speakers were managers and senior officials and 17.7% in the professional occupations: the corresponding percentages for those who could not speak Welsh were 13.7% and 11.5%. The Annual Population Survey, like its predecessor, the Labour Force Survey, has been producing a high estimate of the percentage of people who can speak Welsh in comparison with the census and other surveys.126 The Population Survey for 2010 estimated that 24.8% of the population could speak Welsh. Because of this, the estimates for the percentages who could speak Welsh by occupation could also be comparatively high. The Survey’s estimate for the percentage of managers and senior officials in work who could speak Welsh in 2010 was 19.9% (of those of working age, not of those aged 16-74 as in the 2001 Census), down from an estimate of 20.9% in 2001, while the percentage of those who could speak Welsh in the professional occupations fell to 31.8%, down from 34.9% in 2001.127
Other data sources are available for some occupations and these may give a different picture. GPs, for instance are in one of the professional occupations. According to the 2001 Census, 23.6% of people in the professional occupations could speak Welsh though there was a good deal of variation within the sub-categories. 17% of health professionals could speak Welsh compared with
126 L. Haselden (2004). 127 On the basis of figures provided by the Welsh Government.

88
31.8% of teaching and research professionals.128
On 30 September 2010, there were 286 GPs in Wales able to speak Welsh, out of 1,991 (an approximate figure: as the two figures are from different sources there are differences in the definitions).
In 2001, there were about 11,000 health professionals and about 1,900 of these could speak Welsh.
129,130
The Health Boards publish a directory that lists doctors, and among the details given are the languages the doctors speak.
Thus about 14% of all GPs could speak Welsh.
131
11.2 The education sector workforce
It was calculated from this source, at the end of December 2010, that 7% of all GPs spoke Welsh, far fewer than the percentage given above. It has been suggested that at least some of the difference is due to the unwillingness of some doctors to offer consultations through the medium of Welsh.
As the sustainability of the Welsh language depends heavily on the education sector, we shall now look at the statistics for the sector’s workforce.
11.2.1 Schoolteachers
The teaching profession has for years been a more important area of employment for Welsh speakers than for those who do not speak Welsh, and this continues to be true. The 2001 Census reported that 17,500 of the 53,000 ‘teaching professionals’, i.e. 33%, could speak Welsh, which compares with the 17% who can speak Welsh in the corresponding total population, that is, people aged 16–74 who were in employment the week before the census.132
While ‘teaching professionals’ form 4.5% of the total population, 8.6% of Welsh speakers were in this occupation.
133
The 2001 Census reported that, by industry, 96,384 people were working in education, and of those 26,405 (27%) could speak Welsh.
134 (To put these in context, according to education statistics, in January 2001 there were 28,786 qualified teachers in schools, a figure that decreased a little, to 28,417, in January 2011.135 38,770 teachers were registered with the General Teaching Council for Wales on 1 March 2011.136) 29.2% of people aged 20–44 worked in education and could speak Welsh, while 25.6% was the percentage among people aged 45–64.137
128 2001 Census, table S138.
This is perhaps a little unexpected. We must remember too that the education industry includes more than just the schools sector.
129 StatsWales 17552. 130 StatsWales 17551. 131 http://www.wales.nhs.uk/ourservices/directory 132 2001 Census, commissioned table M340. To be exact, these are numbers for people aged 16–74 in work the week before the Census. 133 2001 Census, commissioned table M340. 134 2001 Census, table S140. 135 StatsWales 007551. 136 General Teaching Council for Wales (2011). 137 2001 Census, table T39.

89
The expansion of Welsh-medium education will require qualified teachers to teach through the medium of the language. They will need to come either from within the present workforce (whether in work, or on the Teaching Council’s register and available for work) or from outside it, through the training of new teachers. With this in mind we shall look at the present situation.
According to the statistics of the General Teaching Council for Wales, 32.0% (12,396) of the teachers on their register in March 2011 ‘spoke Welsh’.138 (As 9.4% of the teachers gave no information as to their ability, the actual percentage could be as high as 35.3%.) There were similar percentages (32.5%) for newly qualified teachers and those who had met the Induction standard (35.9%), which suggests that the percentage of Welsh speakers within the profession is fairly stable and still high. The percentages who consider themselves qualified to teach through the medium of Welsh are lower: 25.2% of newly qualified teachers in 2011 and 27.9% of those who had met the Induction standard.139
Of all the teachers on the Teaching Council register in March 2011, 10,213, that is 26.3% of all teachers, said they were able to teach through the medium of Welsh and no information was available for 3,753 (9.7%). Of the registered teachers, 13,263 said they worked in the secondary sector. In January 2011, there were 12,935 teachers in secondary schools.
(We should remember that 22% of primary pupils are in classes where Welsh is either used as the main medium or used some of the time.)
140 Of these, a total of 1,056 taught Welsh (400 first language and 656 second language only), and another 1,848 taught other subjects through the medium of Welsh.141 (The total of those teaching Welsh corresponds remarkably with the Teaching Council figures, which showed that 1,055 people were teaching Welsh although only 835 had been trained in ‘Welsh Studies’ and only 875 of them said they were able to teach Welsh through the medium of Welsh.142,143) Another 570 teachers were considered qualified to teach Welsh (not, it should be noted, to teach through the medium of Welsh) but were not doing so.144 Thus a total of 3,474 teachers in secondary schools were either teaching Welsh, or qualified to do so, or teaching through the medium of the language, and these constituted 27% of all secondary school teachers. (This is very similar to the percentage given at the beginning of the paragraph, although that refers to all teachers not just secondary teachers.) Leaving out those who could teach Welsh but were not doing so and those who were teaching only second-language Welsh would leave us with 2,248 teaching first language Welsh, or teaching through the medium of Welsh, i.e. 17% of the total. (We should compare this with the 16.7% of pupils in years 7–10 who, in 2010/11, were learning Welsh first language.145
138 General Teaching Council for Wales (2011): The Council’s guidelines on the registration application form for teachers say teachers should answer that they speak Welsh if they consider themselves fluent or fairly fluent in the language. In the main, only two-thirds of those who say they can speak Welsh say they are fluent.
) Unfortunately, this leaves us with no other estimate of how many secondary teachers could teach subjects (apart from Welsh) through the
139 Ibid. 140 Welsh Government (2011c), table 5.4 in the accompanying document. 141 Ibid, table 7.19 in the accompanying document. 142 General Teaching Council for Wales (2011, table 1.11). 143 Ibid, (2011, table 1.10). 144 Wales Government (2011c), table 7.19 in the accompanying document. 145 Ibid, table 7.16 in the accompanying document.

90
medium of the language, but the Teaching Council register throws a certain amount of light on this. Counting each individual subject that the teacher is qualified to teach through the medium of Welsh, gives us 4,297, including 875 qualified to teach Welsh through the medium of Welsh. Since a teacher can teach more than one subject, this number includes some teachers counted twice or several times. On the basis of the pattern recorded for all the secondary teachers on the register, we can estimate that the number of teachers qualified to teach subjects through the medium Welsh is about 20% less, perhaps nearer to 3,400. (1,743 subject teachers, perhaps 1,400 individual teachers, did not record whether they were able to teach through the medium of Welsh.146) The 3,400 would include around 700 teachers qualified to teach Welsh, which suggests that around 2,700 consider themselves qualified to teach other subjects through the medium of Welsh.147
The development of the teaching of Welsh as a subject and of Welsh-medium education is going to depend on the workforce This is a justification for the inclusion of so much detail in this section. The correspondence between the percentage of pupils learning Welsh first language and the percentage of teachers teaching the subject is a close one. In the previous paragraph we drew attention to the fact that 16.7% of secondary pupils are being taught Welsh first language (
Let us remember that the schools have reported that 1,848 people are teaching other subjects apart from Welsh through the medium of Welsh. This suggests that there are about 800 teachers in schools who might be qualified to teach subjects through the medium of Welsh but are not currently doing so. Schools may have included at least some of these, perhaps incorrectly, in the 570 teachers they recorded as qualified to teach Welsh. 800 represents a little over 6% of all secondary school teachers in schools in January 2011. If we add these to the 17% who were able to teach Welsh first language or who were teaching other subjects through the medium of Welsh, it would give a potential for 23% of all teachers already in post to contribute to Welsh-medium education, slightly fewer than the 26.3% of all teachers in all sectors who said on the Teaching Council register that they were able to teach through the medium of Welsh.
Figure 54) and 17% of teachers are either teaching Welsh first language or teaching other subjects through the medium of Welsh. This correspondence suggests that percentage will need to be increased from 17% of the workforce if the Government’s target of having 23% assessed in Welsh first language at the end of Key Stage 3 in 2020 (Figure 53) is to be achieved.148
Teacher training has been discussed under
10.5.2. Modelling of the workforce has been noted as an action point in the Government’s Welsh-medium Education Strategy.149
146 Analysis of figures provided by the Teaching Council on 6 September 2011.
Developing a model will make clear the connections between the flow of pupils from the schools to the colleges and the current workforce. It should be possible to judge the sustainability of the present situation and see the implications for the further growth of Welsh-medium education.
147 Table 1.12, a Summary of the General Teaching Council for Wales Annual Statistics, 2011, shows 733 people teaching Welsh as a core subject in the secondary sector. 148 Welsh Government (2010d), p. 23. 149 Ibid, p. 39.

91
11.2.2 Further education
According to the records of individual staff, 630 (9%) of staff at further education institutions were teaching in Welsh or bilingually in 2008/09.150 65% of these staff were in establishments in North Wales.151 Figure 65 shows the variation in percentage by establishment.
Figure 65: % of staff teaching in Welsh or bilingually, by further education establishment 2008/09
11.2.3 Higher education
An obvious progression for some students in higher education is to seek a post in that sector. The number of staff in higher education institutions in Wales who are able to teach through the medium of Welsh has increased by 32% between 2005/06 and 2009/10, to 705. The numbers who actually do teach through the medium of Welsh have not risen so quickly: there has been an increase of only 10% since 2005/06, to 460. In terms of full-time staff equivalents, there was no increase at all: there were 315 in 2005/06 and 300 in 2009/10 (4.6% of the total of 6,550 full-time staff equivalents).152
150 An audit carried out in 2007 produced a similar percentage: Lifelong Learning UK (2007). 151 Welsh Government (2011f), table 7. 152 Welsh Government (2011a), table D.1.

92
12 Language Usage We should differentiate between the use individuals make of the language, and the use made of it by organisations of all sorts. Firstly, we shall consider the evidence on use by individuals.
12.1 Individual usage
So far, we have been looking mainly at the evidence about the distribution of Welsh-language skills, whether geographically or across different age groups. Of the different skills, we have focused particularly on the ability to speak Welsh. If people spoke only one language, there would be no need to differentiate in our analysis between their linguistic ability and their use of the language: they would only be able to use one language. But when an individual can speak more than one language, we have to differentiate. The use an individual makes of a particular language depends on a variety of factors that all influence which language they will use at any particular time.
We shall consider evidence about the use of spoken Welsh, and about reading and writing. We shall not touch at all on the use of Welsh in watching or listening to the media.
12.1.1 The frequency with which Welsh is spoken
We have already referred to the Language Use Surveys of 2004–06. These included a question modelled on one first used in the Republic of Ireland’s 1996 Population Census. The question in the surveys asked people who said they could speak Welsh whether they spoke it every day, every week, less frequently, or never. From 2007 onwards, the same question has been asked in the Annual Population Survey by the Office for National Statistics.
In 2004–06, 63% of people who could speak Welsh said they spoke it every day, and another 17% said they spoke it every week. Numerically, it was estimated that 342 thousand people spoke Welsh every day. 87% of fluent speakers (which was estimated to mean 276 thousand) said they spoke Welsh every day, compared with 29% of those who were not fluent. Figure 66 shows how, according to the Language Use Surveys, the percentage of people who spoke Welsh every day varied by local authority in 2004–06. As in Figure 34, there is a bar around each point, denoting a 95% confidence interval around the point estimate. The real percentage could be as low as the left end of the bar, or as high as the right end. Where the sample was comparatively small, the line is comparatively long. Where there was a more substantial sample, the bar is shorter and there is less doubt about the point estimate.

93
Figure 66: % of Welsh speakers who speak the language every day, according to the Language Use Surveys 2004–06
Figure 67 seeks to highlight, at local authority level, the nature of some relationships between the percentages who can speak Welsh, the percentages in the population who are fluent, the percentages of Welsh speakers who speak Welsh every day, and the percentages of speakers who spoke Welsh in their most recent conversation outside the family. For example, it appears that the percentage of Welsh speakers whose most recent conversation was in Welsh increases linearly as the percentage of those who speak Welsh every day increases—although the percentage of Welsh-medium conversations is lower in general than the percentage of people speaking Welsh every day. On the other hand, when we look at the relationship between the percentage of Welsh speakers who speak Welsh every day and the percentage of the population who speak Welsh fluently—or who are able to speak Welsh—there appears to be a curvilinear relationship. As the percentage of fluent Welsh speakers in the population rises, the percentage of speakers who speak Welsh every day rises faster. Although we should not, on the whole, interpret the existence of a correlation to mean that a causal relationship exists between them, in this case there is reason to believe that such a causal relationship does exist. As ‘speaking Welsh every day’ requires respondents to consider whether they have at least one conversation in Welsh, we would expect that the percentage of speakers to give a positive reply would increase quickly as the percentage of fluent speakers increased gradually.

94
Figure 67: The relationship between the percentages who can speak Welsh, who are fluent, who speak Welsh every day, and who spoke Welsh in their most recent conversation, 2004–06
The attempt to model the likelihood that an individual would speak Welsh every day has shown us that speaking Welsh fluently, the percentage of Welsh speakers in the area where they live, and living in a household where everyone is able to speak Welsh, are all factors that—not unexpectedly—are linked to an increase in the likelihood that an individual will speak Welsh every day. Being aged between 16 and 29 is linked to a reduction in the likelihood of speaking Welsh daily, compared with being between 11 and 15, and being over 65 is also linked to a reduction.153
This is taking us into the field of mathematics. ‘Txillardegi’, the Basque mathematician, has developed a model to estimate how many conversations one might expect to be conducted in a particular language in an area where
153 H. Jones (2008).
95
some speakers are bilingual and others monolingual.154
12.1.2 Speaking Welsh
As well as the percentage who speak the language, two other factors are used, one factor to reflect the extent to which the bilingual population in the area have intermixed with the monolingual population—for example, to what extent they live in different areas or are in different age groups or different networks—and the other to reflect people’s ‘linguistic loyalty’, that is to say, to what extent speakers of the language choose to use that language amongst themselves when they have the opportunity to do so.
Language use surveys tend to include questions about which language the respondent uses in different situations. They try to discover to what extent people are prepared to use Welsh in different kinds of situations, presumably to test the hypothesis that people will be less likely to choose Welsh in situations where the norm, that is, the expected usage of the society in general, is to use English because of its supposedly higher status.155 The problem is that there are many situations in which people do not have the option of using Welsh unless there is another Welsh-speaker with whom to speak it.156
Not every situation is relevant to everyone and its relevance often varies according to the lifestage of the person interviewed (as well as according to historical period). Keeping all these considerations in mind, what evidence is available about individuals’ language use?
And even if there is a Welsh speaker available, unless the consumer knows this, then once again they will not make a deliberate choice to use, or not to use, Welsh.
We have already drawn attention to the importance of fluency, in the context of the question about the frequency with which the language is spoken. When the Language Use Surveys of 2004–06 asked about the language of the most recent conversation Welsh speakers had had outside the family (an attempt to focus the respondents’ minds on a real situation, rather than the more hypothetical ‘how often…’), it was found that the language of the conversation for 58% of the Welsh speakers had been English, but when they were divided up according to fluency, it was clear that Welsh had been the language of the most recent conversation for 59% of the fluent speakers compared with 9% of those who were not fluent.
Language use—measured as ‘speaking Welsh every day’ or ‘the language of the most recent conversation outside the family’—appears at its lowest among young people aged 16–29 (children speak Welsh at school even if they do not speak it amongst themselves) but even then it is fairly high among fluent speakers. 70% of fluent speakers aged 16–29 spoke Welsh every day and almost half the most recent conversations of fluent speakers in the 16–29 age group were in Welsh. This varied, of course, according to their geographical location.
154 Alvarez Enparantza (2001). 155 Based on the concepts of domains and situations, concepts that have had a good deal of influence in sociolinguistics. See e.g. J. Fishman (1972). 156 P. Nelde, M. Strubell and G. Williams (1996).

96
In asking the question that talks about ‘outside the family’, the suggestion is that the family is a significant domain as regards language use. There is no way of telling whether the extent to which the language is used within a family, as measured by statistics, reflects the individual’s choice or a norm rather than the linguistic composition of the family. However, it is probably true for very many people that a high proportion of their conversations every day are with the family. This in itself is sufficient justification for paying particular attention to the family in surveys. However, it is only in the case of those individuals interviewed who say that they themselves speak Welsh fluently, and who live in a household where everyone can speak Welsh fluently, that the question about the language of the household can throw light on speakers’ loyalty to the language within the household. (Notice that we are not necessarily talking about the language of the family, when we talk about the household, although the household often contains a considerable part of what the individual considers a nuclear family.) According to the Language Use Surveys of 2004–06, when everyone within the household could speak Welsh (though not necessarily fluently) and when the individual interviewed was fluent, 77% of the individuals who were fluent spoke Welsh at home all, or at least the majority, of the time. It is estimated that almost 50,000 fluent speakers who live in households where everyone can speak Welsh, speak at least as much English as Welsh at home
Figure 68: Language of the most recent conversation by age group and fluency, 2004–06
When people were asked about language use in other social situations, for example when talking to friends, neighbours, carrying out day-to-day activities, their answers tended to reflect the ‘social distance’ between people in their

97
social networks.157
In dealings with organisations or with officials, the availability of other Welsh speakers is not so evident as it is with people who are close in the social networks, and the labour market is a more important influence. Often, people on the lowest levels of an organisation have been drawn from the surrounding area and their linguistic ability reflects the presence of the language at that stratum of local society (and their language of choice reflects the norms of that stratum). In their own work, people know their colleagues better than strangers from other organisations and are more likely to be aware of their language of choice. The 1992 Welsh Social Survey is a rare example of a survey seeking to take the availability of Welsh speakers out of the equation before asking people what their language of choice would be in some situations.
As people know their friends fairly well, they know their ability in Welsh and their language of choice. The language of the neighbours tends to reflect the linguistic nature of the local area, and everyday situations take people into a wider area and involve dealing with people about whose ability in Welsh, and language of choice, they know little.
158 Although between 46%–48% fluent speakers had said they would ‘usually’ speak Welsh in their dealings with ‘The local health service’, ‘The local council offices’, ‘The local shops’, ‘The local Post Office/bank/building society’, the range rose to 63–64% when they were asked what language they would use if they knew that Welsh speakers were available. The narrowness of the range suggests that there was little unwillingness to use Welsh in situations that varied a good deal according to their formality and where the gap in status between the user and the administration also varied considerably in theory. Results were obtained that suggested the same thing in 2000, when a question was asked beginning ‘If you had the choice, would you use Welsh in…?’ and listing various situations.159 Table 10 shows the percentages of fluent speakers who would use Welsh every time. Apart from the situation of ‘enquiring about your bill…’ and ‘taking part in leisure activities…’, they are all within the range of 76–80%. Only 71% would use Welsh every time when ‘enquiring about a bill…’, but an even lower percentage, 70%, said they would do so ‘when taking part in leisure activities…’. We can imagine reasons that could explain these results but nothing can be proved.
In a similar way, the Language Use Surveys of 2004–06 used two sets of questions to ask about the language that respondents would use to discuss work: they were asked, firstly, how many people (supervisors, line managers, colleagues, the people they supervised, clients) were able to speak Welsh, and secondly, what language they would usually use with them. According to whether or not the majority of people could speak Welsh, the language used varied, across the different age groups of the respondents. If only some of the people (supervisors and so on) could speak Welsh, between 16–19% would
157 This was not just in the Language Use Surveys of 2004–06. See e.g. The Welsh Office (1995); NOP (1995); Beaufort (2000); C. Williams and J. Evas (1997). 158 There are many examples where this was not done and where results were obtained that suggested that Welsh speakers were unwilling to speak Welsh when dealing with organisations or official institutions. E.g. according to NOP (1995), p. 23, (which used a sample of 815 people aged 16+. Of the 815 interviewed, 365 were non-Welsh-speaking, and 384 could say at least the odd sentence): “... when contacting public services – very interestingly, among the fluent speakers, fewer than half (41%) always use Welsh. When contacting privatised utilities, Welsh is used less frequently … Even among fluent speakers, only 34% always use Welsh.’ 159 Beaufort Research (2000). Sample of 1,191 people aged 16+, 416 of them non-Welsh-speaking. 511 able to speak Welsh at least fairly well.

98
usually use mainly Welsh. The range rose to 78–82% if the majority could speak Welsh. Thus the differences between the percentages for the different classes of work colleagues were small ones. Once again then, there is no evidence that people are more inclined to use Welsh with people of a lower status than with those of a higher status, if the factor of ability in the language is removed from the equation.
Table 10: % of fluent speakers who would use Welsh, if the option were available, by situation, 2000
Situation
% of fluent speakers who would use Welsh, if the option were available
The local shops 80 At the post office counter 80 The supermarket 78 At the surgery or the local hospital 78 At the bank or the building society 77 Ordering a drink in a pub or cafe 76 Ordering a meal in a restaurant 76 Contacting the local council (over the phone or face to face) 76 Enquiring about your gas, electricity or phone bill 71 Taking part in leisure/ sporting/cultural activities 70
Surveys themselves provide a measure of the willingness of speakers to use Welsh when they record the language of the interview. The record will not reflect the willingness of speakers to speak Welsh except in those cases when a real choice was available, that is when the interviewer personally could speak Welsh (and was willing to do so). According to the 2000 Beaufort Survey, 44% of the Welsh speakers were interviewed in Welsh, and a mixture of Welsh and English was used for another 11% of the Welsh speakers. In the 2004 Beaufort Survey for the Basic Skills Agency, 66% of the Welsh speakers were interviewed in Welsh and another 25% in a mixture of Welsh and English. It is a very different situation when not every interviewer is able to speak Welsh. For example, in the 1992 Welsh Social Survey, only 1.5% of the interviews in all the households surveyed, including those where there was no Welsh speaker, were in Welsh. Moving on 16 years, 1% responded in Welsh in the Welsh Outdoor Recreation Survey 2008.160
NHS Direct Wales is a service of the National Health Service that is supposed to offer a phone service in the caller’s chosen language. Of all the calls offered, 3% at the most are in Welsh.
161
12.1.3 Reading
The previous section concentrated on speaking Welsh. We shall now look at the evidence for the use of the other skills, i.e. reading and writing. We shall go
160 Countryside Council for Wales and Forestry Commission Wales(2008). 161 StatsWales 2521.

99
through the main results from some of these sources before trying to summarise them.
In the 1992 Welsh Social Survey, there was little variation between the percentages of people who read Welsh-language magazines at least occasionally and those who read papurau bro (Welsh-language community newspapers) with the same frequency, 41.3% compared with 42%, but it was more common to read community newspapers regularly than to read magazines regularly, 15.8% compared with 20.9%. Reading books was more common: 21.5% read a book regularly and 33.5% read a book occasionally
In the 1995 NOP Survey, people who were able to read some Welsh were asked how often they did so. 28% said they read Welsh either every day or almost every day, and 50% said they read Welsh occasionally. As might be expected there was a tendency for the percentages to be higher when the question was restricted to fluent speakers.162 This survey also asked how easy it was for the respondents to read signs, newspaper articles, a letter from a friend, official forms to be completed, or a novel. A small majority—55%—said they would find it very easy to read signs, and that was the highest percentage. It was official forms that the lowest percentage—26%—found very easy to read, and that the highest percentage, once again 26%, found very difficult.163
S4C, the Arts Council for Wales, BBC Wales and the Welsh Language Board jointly commissioned a survey of Welsh-speakers in 2005.
164
32% of respondents had read book in Welsh in the previous month compared with 69% who had read a book in English. 46% had read Welsh magazines or newspapers in the previous month compared with 89% who had read English ones. 13% had used a Welsh website in the previous month compared with 47% who had used an English website.
It asked questions about use of the media and attendance at events, both in Welsh and in English.
Of the fluent speakers, slightly higher percentages had carried out these activities in Welsh and slightly lower percentages had done so in English. 38% of the fluent speakers had read a Welsh book in the previous month compared with 64% who had read an English book. 60% had read Welsh magazines or newspapers in the previous month compared with 91% who had read English ones. 18% had used a Welsh website in the previous month compared with 44% who had used an English website.
The Welsh Books Council commissioned questions as part of the Welsh Speakers Omnibus Surveys by Beaufort Research from March 2003 to April 2006 and the results were analysed in 2007.165
162 NOP (1995), results table 50.
One of the questions asked was ‘About how often these days do you finish reading a book in the Welsh language?’. 40% of the fluent speakers said they finished a book at least once a year.
163 Ibid, p. 31. 164 Beaufort Research (2006). This used a sample of 861 of whom 60% were fluent. 165 Woods, A (2007).

100
The book trade had changed considerably by 2003–06 compared with the situation in 1992 and 1995, when the surveys mentioned above were carried out. Sales of popular books in supermarkets had increased enormously since 1995, when the Net Book Agreement came to an end.166
In 1992, 55% of Welsh speakers read a book in Welsh at least occasionally. According to the Books Council surveys of 2003–06, 41% said they finished reading a book in Welsh at least occasionally. The comparison may quite possibly not be a fair one but, if it were, it would suggest that reading a Welsh book could have become less usual over the period in question.
As different questions were asked in 1992 and 2003–06, it is difficult to draw comparisons but may be worth the attempt.
167
The Adult Skills Survey of 2010 included questions about the reading habits of Welsh speakers.
The internet had grown enormously even by 2006, but its further growth, and the development of e-books since then, means that the previous statistics are now of historical interest only.
168
There is very little reading material available in Welsh compared with English. One survey asked how many books respondents had at home. Of those able to reply, 83% of Welsh speakers had 25 or more books in English. 45% of the fluent Welsh speakers had 25 or more books in Welsh, compared with 21% of the speakers were not fluent.
No distinction was made between reading books, magazines and newspapers. 80% of Welsh speakers read some of these in English every day or most days: 15% said they read some in Welsh equally often. There was almost no difference between the fluent Welsh speakers and other Welsh speakers as regards the English material. As we might expect, there was a difference as regards the Welsh-language material. 17% of the fluent speakers read Welsh-language books, magazines and newspapers every day or most days, compared with 7% of the Welsh speakers who were not fluent.
Welsh speakers were also asked how confident they were when reading different types of materials in Welsh: letters or e-mails from the family; things at work; and forms. 68% were very confident when reading letters or e-mails in Welsh from the family, 55% were very confident when reading Welsh at work and 54% were very confident when reading Welsh-language forms. In every case the percentages for fluent speakers were higher than the percentages for speakers who were not fluent There was also a strong correlation in every case between the confidence respondents felt when reading different types of material and their self-assessment of their ability to read Welsh.
All this is just one sort of evidence: responses to opinion surveys. How do the results compare with other types of data?
166 http://www.thebookseller.com/news/supermarkets-show-most-dramatic-rise-bookselling-1989.html, accessed 1 December 2011. 167The questions in 2003–06, which made respondents consider how many books they had finished reading, constituted a more tangible survey than the question in 1992, which made it easier for respondents to offer a more acceptable answer rather than admit that in fact they almost never read a book in Welsh. 168 Welsh Government (2011h). Author’s analysis.

101
In 2010–11 the target circulation for the papurau bro grant-aided by the Language Board was almost 52 thousand. Supposing every copy is read by 2.5 people, we could estimate that 130 thousand people read one of the community newspapers. Expressing that number as a percentage of all Welsh speakers gives us 22%, and perhaps 41%, of the fluent speakers. These figures are high but in the same ball park, as it were, as the percentages obtained in the surveys we have considered. We cannot say the same thing for the percentages for those who read magazines.
In 2008 the Welsh Language Board commissioned a review of the situation of the Press in Wales. This review said ‘Because of the small size of the potential readership, Welsh-language periodical publications are inevitably few in number. Some (including Barddas, Taliesin, and a range of children’s titles) succeed through appealing to a narrow niche market.’169 It includes some estimates of sales of some publications: of these, the highest sales figures are for Y Cymro (3,000), Golwg (3,000) and Barn (c.880). The review mentions Y Wawr, the magazine of Merched y Wawr (a Welsh-medium women’s organisation, similar to the Women’s Institute), but no circulation figures are given beyond the fact that it is sent to all members.170
Perhaps the important thing about reading Welsh is the effect it has on the confidence of the individual? This leads to a consideration of the use of the language in writing. If Welsh speakers are not accustomed to read widely in Welsh, can we expect them to choose it as a language in which to write?
It is difficult to see how figures at this level can be reconciled with the figures in the surveys. One possible explanation is that the majority of the survey respondents have been unable to answer questions about reading Welsh-language magazines in a meaningful way, because they are not in fact even aware that many exist.
12.1.4 Writing
In the Beaufort Survey of 2000, ‘The State of the Welsh Language’, all respondents who spoke at least some Welsh were asked how often they used the language to complete particular documents.171
Table 11
The passage of time means that the replies about e-mailing will not be relevant these days, but there is not so much room for uncertainty as to a change in the situation as regards writing notes or greeting cards to the family or friends in Welsh. summarises the replies.
169 T. Bianchi (2008). 170 6,487 in 2010. 171 Beaufort Research (2000).

102
Table 11: % Of Welsh speakers writing in Welsh, by situation and by the ability to speak and write, 2000
% writing Welsh
Total speaking at least some Welsh Total (sometimes or more often)
Situation Always Often Sometimes Fluent
speakers Writes Welsh very/fairly well
Notes / Greeting cards 24 20 29 73 87 82 E-mails 3 3 6 12 17 13 Official forms 16 7 11 34 46 42 Official letters 14 7 9 30 44 37
The percentages who said that they wrote in Welsh at least occasionally when completing official forms or writing official letters to organisations like local authorities or utility companies may be thought rather low. Fewer than half of the fluent speakers said they would at least occasionally use Welsh in these cases. On the other hand, considering how infrequently one would in fact, even in 2000, have to complete an official form or write an official letter, it is asking a good deal of the respondent to expect a meaningful reply.
The percentages who said they always used Welsh were, of course, even lower (Table 12). For example only about a third of the fluent speakers or those who could write Welsh well said they always used Welsh when writing greeting cards. All the same, around one in five said that they always used Welsh when completing official forms or for official letters. Considering we are talking about all occasions, the percentages are improbably high. They are probably a better reflection of the desire of the respondents to show their support for the Welsh language than of their actual use of Welsh.
Table 12: % always using Welsh, fluent speakers and good writers, 2000
% always using Welsh for:
Situation Fluent speakers Those who could write Welsh
well
Notes / Greeting cards 36 30 E-mails 4 3 Official forms 24 20 Official letters 21 18
The Language Use Surveys of 2004–06 asked whether Welsh speakers aged over 16 and in work wrote in Welsh at work. 25% of the fluent speakers regularly wrote something in Welsh at work, and another 29% occasionally wrote in Welsh: 41% never wrote anything in Welsh. We may think these percentages are also suspiciously high, but when we break them down further we can see credible patterns. For example, 24% of Welsh speakers working in the public sector regularly wrote in Welsh at work, compared with 10% in the private sector.

103
Respondents were also asked what language they used in administrative work. 30% of the fluent speakers said they used mainly Welsh. Of these fluent speakers, 58% regularly wrote Welsh at work.
In the Welsh Speakers Omnibus Survey of 2005 the Welsh Language Board commissioned a set of questions about speakers’ use of Welsh-language services and what, if anything, prevented their making more use of them.172
In the 2010 Adult Skills Survey, respondents were asked about writing habits. They were also asked how often they wrote text messages, wrote online (e.g. Facebook), wrote on paper, or completed forms in writing, online or on paper. 66% of Welsh speakers sent a text message from a mobile phone in English every day or most days: 31% sent one in Welsh. Welsh speakers used English more often for the other tasks as well. 60% of them wrote online in English, for example, on Facebook or to send an e-mail, every day or most days: 25% wrote in Welsh. 64% of them wrote on paper in English every day or most days: 29% wrote in Welsh. Not so many completed a form online or on paper so often, but 27% did this in English, compared with 6% in Welsh, every day or most days.
One question asked what, if anything, prevented people from using Welsh when dealing with public bodies in writing. 27% of all Welsh speakers, and 42% of fluent speakers, said nothing prevented them. We can interpret this to mean that they always dealt with a public body in Welsh when, or if, this involves writing. 23% of the fluent speakers said they always used English when dealing with public officials. Which percentages are most credible is a matter of opinion.
173
In every case fluent Welsh speakers wrote in Welsh more often than those who were not fluent. For example, 40% of the fluent speakers sent text messages in Welsh every day or most days, compared with 6% of those who were not fluent, and 8% of the fluent speakers completed forms online or on paper in Welsh every day or most days compared with less than 1% of those who were not fluent.
As this document pays so much attention to the census, it is not inappropriate to record here some facts for comparison with the above percentages. In the 2001 Census, 41,800 forms were returned from Welsh-speaking households, 3.5% of all forms returned from households in Wales.174
12.2 Usage by organisations
12.2.1 In their dealings with the public
Organisations can use the language in two ways: firstly in their dealings with the public, and secondly internally. The Welsh Language Act 1993 placed a responsibility upon the Welsh Language Board for approving the Welsh Language Schemes of public bodies in accordance with the principle that the Welsh and English languages should be treated on an equal basis in relation to the provision of public services. As well as approving schemes prepared under
172 Beaufort Research (April 2005). 173 Welsh Government (2011h). Author’s analysis. 174 Office for National Statistics (2005).

104
the legislation, the Board worked with a number of other bodies that voluntarily undertook to prepare schemes. Figure 69 shows how the number of schemes approved has increased in the last decade.
Figure 69: Number of language schemes approved and operational at the end of the year, by sector
The existence of a language scheme is an indication that an organisation has decided on measures for the provision of services in Welsh, and the schemes would not have been approved had they not made a reasonable attempt under the circumstances to treat the two languages equally. We can reasonably take it that the increase in the number of schemes is certain to reflect to some extent the increase in the provision for people to make use of the Welsh language. All the same, it is impossible to say how many services were available bilingually before schemes began, nor, for that matter, how many are available now. Even if some form of measurement had been created at the outset, an organisation’s services change naturally with the passing of time and a ‘before and after’ comparison would be full of complexities.
One snapshot of the situation in part of the private sector (which was not obliged to prepare language schemes under the 1993 Act) was taken in 2007, when the Welsh Language Board commissioned Beaufort Research to include a number of questions in their Cwmnibws survey of small and medium sized enterprises (Table 13).
They were also asked about their practice when replying to correspondence. Of the 21% who had received correspondence from customers in Welsh, 57% said they would always reply in Welsh, 2% usually did and 10% did sometimes.
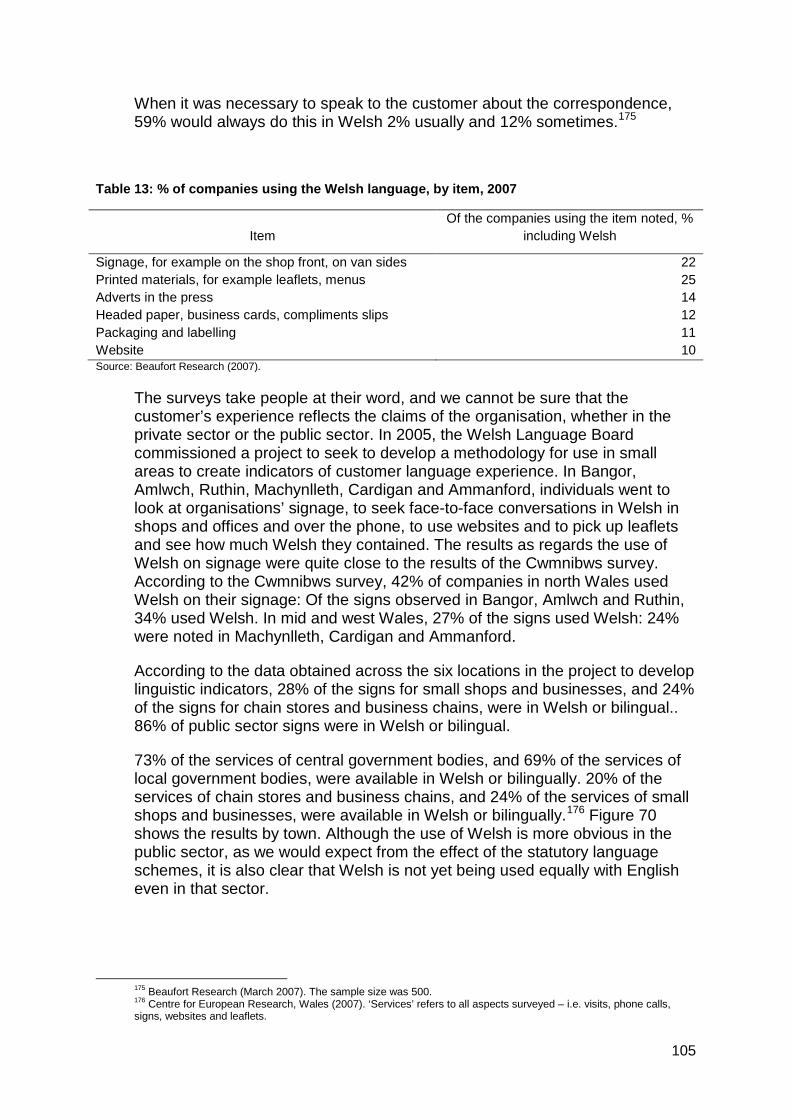
105
When it was necessary to speak to the customer about the correspondence, 59% would always do this in Welsh 2% usually and 12% sometimes.175
Table 13: % of companies using the Welsh language, by item, 2007
Item Of the companies using the item noted, %
including Welsh
Signage, for example on the shop front, on van sides 22 Printed materials, for example leaflets, menus 25 Adverts in the press 14 Headed paper, business cards, compliments slips 12 Packaging and labelling 11 Website 10 Source: Beaufort Research (2007).
The surveys take people at their word, and we cannot be sure that the customer’s experience reflects the claims of the organisation, whether in the private sector or the public sector. In 2005, the Welsh Language Board commissioned a project to seek to develop a methodology for use in small areas to create indicators of customer language experience. In Bangor, Amlwch, Ruthin, Machynlleth, Cardigan and Ammanford, individuals went to look at organisations’ signage, to seek face-to-face conversations in Welsh in shops and offices and over the phone, to use websites and to pick up leaflets and see how much Welsh they contained. The results as regards the use of Welsh on signage were quite close to the results of the Cwmnibws survey. According to the Cwmnibws survey, 42% of companies in north Wales used Welsh on their signage: Of the signs observed in Bangor, Amlwch and Ruthin, 34% used Welsh. In mid and west Wales, 27% of the signs used Welsh: 24% were noted in Machynlleth, Cardigan and Ammanford.
According to the data obtained across the six locations in the project to develop linguistic indicators, 28% of the signs for small shops and businesses, and 24% of the signs for chain stores and business chains, were in Welsh or bilingual.. 86% of public sector signs were in Welsh or bilingual.
73% of the services of central government bodies, and 69% of the services of local government bodies, were available in Welsh or bilingually. 20% of the services of chain stores and business chains, and 24% of the services of small shops and businesses, were available in Welsh or bilingually.176 Figure 70 shows the results by town. Although the use of Welsh is more obvious in the public sector, as we would expect from the effect of the statutory language schemes, it is also clear that Welsh is not yet being used equally with English even in that sector.
175 Beaufort Research (March 2007). The sample size was 500. 176 Centre for European Research, Wales (2007). ‘Services’ refers to all aspects surveyed – i.e. visits, phone calls, signs, websites and leaflets.

106
Figure 70: Proportion of Welsh-medium or bilingual services, by sector and town, 2005
When the researchers visited organisations, they were greeted in Welsh or bilingually at the outset 42% of the time by the public sector and 15% of the time by the private sector. When the researchers went on to speak in Welsh, they received a Welsh or bilingual response 66% of the time from the public sector and 36% of the time from the private sector.
When the researchers telephoned, they were greeted in Welsh or bilingually at the outset 65% of the time by the public sector and 13% of the time by the private sector. When the researchers went on to speak in Welsh, they received a Welsh or bilingual response 67% of the time from the public sector and 37% of the time from the private sector.
In general, voluntary sector performance lay between that of the public sector and the private sector.
Researchers experienced little discourtesy on their visits: they recorded 6% of responses as discourteous and there was no difference in this between the sectors. There was more discourtesy in response to phone calls. When the researchers spoke Welsh on the phone, they judged that 14% of the responses—all in English or bilingual—were discourteous.
Welsh was almost entirely absent from private sector websites.

107
12.2.2 In their own activities
As well as dealing with the public, the majority of organisations, whether in the public or the private sector, also use the language internally, for oral or written discussions, between workers, and in dealing with other business organisations, for example, in trading between themselves. Few private organisations use Welsh for their public images: 4% of the companies included in the Cwmnibws survey in March 2007 used only Welsh in their public image, that is, in their logo, and 12% used Welsh and English.177
We have already discussed the number of workers who say that Welsh is used as the language of internal administration: 30% of the fluent speakers in the Welsh Language Use Surveys of 2004–06 said Welsh was the main language used. This includes workers from every sector. All the same, it is difficult to reconcile that figure with another result from a Cwmnibws survey, namely that, of the 66% of companies using Microsoft Office or Windows XP (the latest Windows system at the time), only 3% used the available Welsh-language interface. Of the 4% who used OpenOffice (19 of the 504 companies), 10% (2 companies) used the Welsh-language interface. Of course, the Cwmnibws survey was interviewing private companies and the situation could have been different in the public sector.
The situation was very different in the case of organisations in the public sector as a result of the introduction of language schemes.
177Beaufort Research (March 2007).

108
13 Demography
13.1 The demographic model
The charts in section 4.4.1, on the 2001 Census, give a snapshot of the situation as it was in that year. They do not necessarily fully reveal the trends although they do show the details by age group. The age-specific effects are intermixed with the generation-specific effects. An effect specific to a generation, rather than an age-group, for example, was the effect of the First World War, reflected when we look at the number of Welsh speakers aged 63 to 67—born during the war—in the 1981 Census (Figure 5). In this section, we turn to consider the demographic factors that influence the trends.
In population studies, only three elements need be considered: births, migration and deaths. When considering a population that speaks a particular language, we still have to consider those factors but must, in addition, consider how many people become able to speak the language—by transmission within the family, or through education—and how many lose their ability in it. The big question we should like answered is, how sustainable is the language. In other words, what is the likely result of the demographic and other social trends affecting the number and percentage of people who speak Welsh, and the use they make of it?
Although the government produces population projections, it has never produced projections for the numbers (and percentages) of those who will be able to speak Welsh. We shall discuss an attempt to produce such projections in section 14.2, but in this section we shall devote our attention to the demographic factors, extending them to include other factors relevant to the language as noted above.
13.2 Births
2002 was a low point as regards the number of births. The number has risen every year since 2002, except for 2009, to 35,952 in 2010.178 We do not know whether the birth-rate for Welsh-speaking women is different from the birth-rate for the majority of non-Welsh-speaking women of the same ethnicity, but there is no reason to think it would be. In 2010, 10.4% of births were to mothers born outside the United Kingdom, twice the level at the beginning of the decade.179
According to the 2001 Census, of the couple households with a dependent child, and where the dependent child was aged between birth and 4, both adults could speak Welsh in 9.2% of households.
Very few of the children of these mothers can be expected to be brought up as Welsh speakers.
180
178 Wales Government (2010a).
We also know that of all children aged 3 to 4, 5.4% could speak Welsh and lived in a couple household with two adults able to speak Welsh, and another 1.6% could speak Welsh and lived in a one-parent household where the adult could speak Welsh: thus a total
179 Office for National Statistics (2010). 180 2001 Census, table S144.

109
of 7.0% could speak Welsh and lived in a household where the Welsh language could be the main medium of communication.181
Owing to the changes in the geographical distribution of Welsh speakers and their linguistic background, we can be fairly certain that the number of households where Welsh is spoken as the main language is decreasing. This will mean that we can expect the percentage of children who learn to speak Welsh at home to continue to decline. On the other hand, we have seen how the percentage of children who receive their education through the medium of Welsh has been increasing. In 2011, 5,862 were assessed in Welsh first language at the end of Key Stage 3, aged 14.
From another source, the schools’ census, we know that, at the end of the 1970s and the beginning of the 1980s, around 8% of primary pupils had been described as fluent Welsh speakers who spoke Welsh at home, and that the percentage had fallen steadily to around 6.3% at the time of the 2001 Census.
It is worth mentioning here another series that could appear relevant to this discussion, the series that is available recording how many of the births registered in Wales were registered bilingually.
Figure 71: % of registrations, by life event, 1993–2010
We see that around 8–9% of births have been registered bilingually since the beginning of the century, and that this is a good deal higher than it was in the 1990s.182
181 2001 Census, table S143.
The increase probably results from the introduction of a new computer system that has made bilingual registration easier. It could also
182 Data provided by the Office for National Statistics, July 2011.

110
reflect a change in attitude and the fact that people are more willing to use bilingual services than they used to be.
13.3 Deaths
The task of estimating how many Welsh speakers died in a year is somewhat easier than estimating how many people born in a year can be expected to be brought up at home as Welsh speakers. With the age profile of those who die, it would be reasonable to take it that the same percentage of them could speak Welsh as the percentage of the population who could speak Welsh. Even more approximately, knowing only the total deaths, and taking it that the appropriate percentage to use is the percentage of the oldest portion of the population (i.e. 19.5% of those aged 65 or over, since even in 2007, 82.5% of those who died were aged 65 or over), we can estimate that annual deaths at present are likely to include slightly fewer than 6,000 Welsh speakers.183
Demographers call the difference between the number of births and the number of deaths the ‘natural change’ in the population. We noted in the previous section that about 6,000 pupils aged 14 are being assessed in Welsh first language these days, so we can see from the above that we estimate there is little ‘natural change’ in the number of fluent Welsh speakers at present.
It is the net effect of migration—in-migration and outmigration—that is the other deciding factor in the increase or decrease of the population.
13.4 In-migration
In-migration can be divided into two elements—in-migration from the rest of the UK and in-migration from abroad. In fact, statistical information is limited in the case of both elements. As in-migration to the UK from overseas is a politically sensitive subject, a good deal of attention has been paid recently to means of measuring its magnitude, and steps have either already been taken or are in hand to improve the reliability of statistics about it. All the same, attention has chiefly been on improving statistics at the level of the UK in its entirety, and the statistics for in-migration to Wales from overseas are not very reliable nor likely to be as good as those at the level of the whole of the UK.
As regards numbers, a far more substantial number of in-migrants to Wales come from the rest of the UK. Compared with the attention paid to improving the standard of statistics for in-migration from overseas, this element has received little attention. There are two main statistical sources: the census of population and the National Health Service.
Every ten years the census gives an estimate of the number of people living in Wales by their country of origin. The results since 1951 are shown in Figure 72.
183 Office for National Statistics (2007).

111
Figure 72: % of the population, by country of origin, 1951–2001
Source: Censuses, April 1951–April 2001, Office for National Statistics.
The trend is clear: the percentage of the population born outside Wales is increasing. In 2001, 25% of the Wales’s population had been born outside the country. 21% had been born in England, Scotland or Northern Ireland.184 (Of those born in Wales, 24.7% could speak Welsh. Of those born outside Wales, 9.0% could speak Welsh.185
Although annual in-migration has declined since its recent peak in 2002, on average over 55 thousand people migrated into Wales from the rest of the United Kingdom annually throughout the last decade (as a comparison: the population of Merthyr Tydfil is about 56 thousand). This is the gross in-migration. People have been moving out every year as well, but since fewer have been moving out every year (see
)
Figure 73) than have been moving in, there has been positive net in-migration every year.
184 2001 Census, table KS05. 185 2001 Census, table T39.
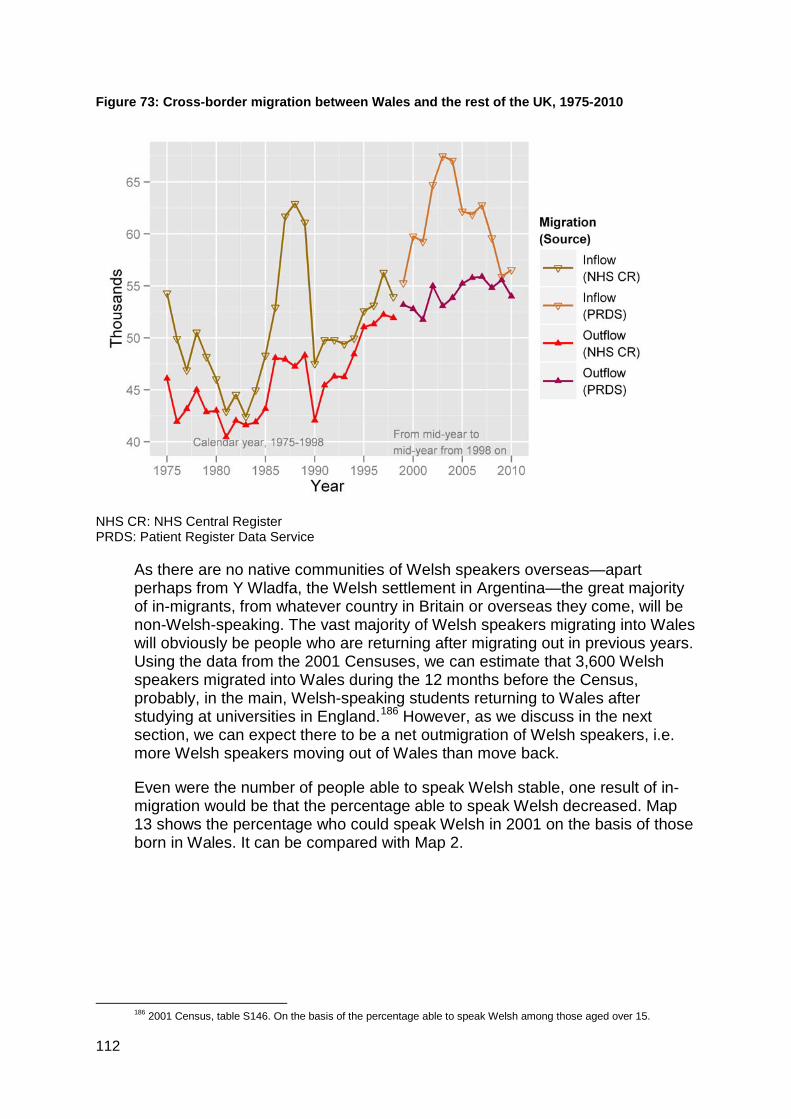
112
Figure 73: Cross-border migration between Wales and the rest of the UK, 1975-2010
NHS CR: NHS Central Register PRDS: Patient Register Data Service
As there are no native communities of Welsh speakers overseas—apart perhaps from Y Wladfa, the Welsh settlement in Argentina—the great majority of in-migrants, from whatever country in Britain or overseas they come, will be non-Welsh-speaking. The vast majority of Welsh speakers migrating into Wales will obviously be people who are returning after migrating out in previous years. Using the data from the 2001 Censuses, we can estimate that 3,600 Welsh speakers migrated into Wales during the 12 months before the Census, probably, in the main, Welsh-speaking students returning to Wales after studying at universities in England.186
Even were the number of people able to speak Welsh stable, one result of in-migration would be that the percentage able to speak Welsh decreased.
However, as we discuss in the next section, we can expect there to be a net outmigration of Welsh speakers, i.e. more Welsh speakers moving out of Wales than move back.
Map 13 shows the percentage who could speak Welsh in 2001 on the basis of those born in Wales. It can be compared with Map 2.
186 2001 Census, table S146. On the basis of the percentage able to speak Welsh among those aged over 15.

113
Map 13: People born in Wales: % (aged 3 and over) able to speak Welsh, 2001
13.5 Outmigration
It is more difficult to estimate the number of Welsh speakers who migrate out of the country. In the 12 months before the 2001 Census some 5,200 Welsh speakers, perhaps, had migrated out of Wales.187
An analysis of the Office for National Statistics Longitudinal Survey provided some support for that figure’s being approximately correct. It showed that 19.4% of children aged between 3 and 14 in 1971 had moved and were living in England by 2001. It gave a similar figure for children of the same age in 1981: 20.7% of them were living in England by 2001.
Using the estimate for in-migrants given in the previous paragraph, that would suggest that a little over 30% migrate out of Wales and do not return.
188
Table 14
An analysis of children aged 15 provides more evidence that out-migration is on the increase (
).
187Based on the numbers moving to England in the year before the 2001 Census (2001 Census, table S008) and the percentage who could speak Welsh, by age, but for age groups under 16 using the percentage who are fluent, according to the January 2003 Schools’ Census. 188 H. Jones (2010), p. 127.

114
Table 14: Welsh speakers aged 15: migration to England between 1971–81, 1981–91, 1991–01
Welsh speakers aged 15
in the sample % of Welsh speakers aged 15 migrating from Wales
to England
Point estimate Confidence interval 95%
1971-81 66 7.6 3.3-16.5 1981-91 72 18.1 10.9-28.5 1991–01 83 37.3 27.7-48.1 Source: Office for National Statistics Longitudinal Study, author’s analysis.
There is some evidence, from the same source, that the rates of outmigration of the Welsh-speaking and non-Welsh-speaking populations are different.189
Whatever the size of the net outmigration, the significant thing as regards the sustainability of the Welsh language among the population of Wales is that there is net outmigration. This means that if the present numbers of speakers are to be sustained, more Welsh speakers must be reproduced (through language transmission between the generations) or produced (through education) annually than die, just to maintain the balance.
13.5.1 The Welsh diaspora
The result of outmigration is the Cymry ar wasgar (Welsh exiles), that is, there is a population of Welsh people living in other countries and some of them, of course, are able to speak Welsh. Comparatively few countries include a question about languages in their censuses, and if the question is not asked, we must depend on estimates. That is the case for England. In the case of Canada, Australia, New Zealand and the United States—some of the most important countries as regards outmigration from Wales—some evidence is available from their censuses. With the exception of those in England, only small numbers of Welsh speakers live in the other countries and they are insufficient to be considered as populations that could have a substantial effect on the demography of Wales were they, or their descendants, ever to return to Wales. All the same, it is worth noting some of the facts that are available.
13.5.1.1 Patagonia
No census data are available from the Argentine and thus there is no firm estimate of how many people speak Welsh in Y Wladfa in Patagonia. The estimate of 25,000, quoted in Ethnologue, is improbably high.190 Another estimate was that there were around 5,000 Welsh speakers there in the second decade of the twentieth century.191
13.5.1.2 USA
2,655 people (aged 5 or over) spoke Welsh at home in the United States of America according to the country’s 2000 Census.192
189 Jones (2010).
190 http://www.ethnologue.com/show_language.asp?code=cym 191 P. W. Birt (2005). 192 U.S. Census Bureau (2000).

115
13.5.1.3 Australia
The 2001 Australian Census included a question about the language spoken at home. 1,060 people said they spoke Welsh at home (565 men, 495 women) which meant that more people were speaking Welsh at home than spoke a number of indigenous Australian languages.
13.5.1.4 Canada
According to the Canadian Census of 2006, Welsh was the mother-tongue of 1,645 people, but only 90 regularly spoke Welsh at home and, of those, 65 also spoke English regularly at home.193
‘194 2,160 people were capable of holding a
conversation in Welsh.195
13.5.1.5 New Zealand
840 people could speak Welsh in New Zealand in 1996, 1,158 in 2001, and 1,077 in 2006, according to the country’s censuses for those years.196
13.5.1.6 England
In 1996, 9,963 people said they were of Welsh ethnic origin, but by 2001 the figure was only 3,414—but on a different basis.
The number of people who speak Welsh in England is of interest since that has to be where the majority of the Welsh-speaking exiles are to be found. There has been a good deal of speculation about their numbers.
A reasonable estimate is that in 2001, 110 thousand people resident in England were able to speak Welsh. Such a number—along with another thousand in Scotland and Northern Ireland—would mean that a total of more than 690 thousand people in the UK were able to speak Welsh and that 17% of them lived outside Wales, elsewhere in the UK. BARB surveys for S4C for the two years ending June 2006 produced an estimate of 158 thousand Welsh speakers (aged 4 and over) living outside Wales, with 153 thousand of them in England.
A more reliable estimate is likely to be available soon, since a new question about language was asked in England in the 2011 Census.
193 Statistics Canada (2006a). 194 Statistics Canada (2006b). 195 Statistics Canada (2006c). 196 Statistics New Zealand (2006).

116
14 Looking to the future After a careful examination of detailed analyses of the historical and contemporary situations, what of the future? Let us examine other evidence as to how the situation has changed since 2001 before trying to imagine what the 2011 Census, and those that follow it, if any there be, could reveal.
14.1 The evidence of recent surveys
There are two series of surveys with substantial sample sizes to which we can turn. We have already referred to the Annual Population Survey/the Labour Force Survey. The sample in Wales has been a large one, almost 50 thousand in 2001/02 though somewhat smaller in later years. The other survey is the Living in Wales Survey carried out for the Welsh Government for 5 years from 2004 to 2008.197
Figure 74 The sample size was about 12,000 addresses per year.
compares the results of these two surveys with the result of the 2001 Census in each local authority and in the whole of Wales (the final chart in the figure). Two things stand out. Firstly, that the percentage provided by the Population Survey for people who could speak Welsh in 2001 is higher in every authority than the result of the census. The Office for National Statistics looked into the problem in 2003 but reached no definite conclusion, only that they were a number of methodological differences that could have caused the difference.198 Secondly, neither survey shows an obvious upward trend over the whole period from 2001 to 2010. According to the Annual Population Survey, 29.1% could speak Welsh in 2001 and 24.8% in 2010.199
In the light of the earlier discussion about demography, it should be clear that there is little reason to suppose that the number of people in Wales who can speak Welsh fluently will have increased between 2001 and 2011. However, the census question asks about the ability to speak Welsh—as do the two surveys under consideration here—without mentioning fluency. Both surveys have consistently estimated that the percentage of speakers is higher than the 20.8% produced by the 2001 Census. The result of the 2011 Census may possibly be higher than 20.8% as well, but if so this will probably reflect a change of attitude or a change in the discourse, influenced by the effect of teaching Welsh as a second language in schools.
The mean for the Living in Wales Survey estimates for the percentage able to speak Welsh between 2004–2008 was 21.2%.
14.2 Projections
We shall consider next how the number and percentage of those who speak Welsh (as reported by the census) could have changed since 2001 and how they could change in the future. There are several ways of calculating projections.200
An outline of the method used here is given the appendix.
197 Welsh Government (2004–08). 198 L. Haselden (2004). 199 StatsWales 005502. 200 J. Wyburn and J. Hayward (2008, 2009), Kandler et al. (2010), D. Sankoff (2008).

117
Figure 74: % able to speak Welsh, by area, 2001–10, by source of statistics
APS: Annual Population Survey LiW: Living in Wales Survey Cen: 2001 Census
Table 15 shows the results. Figure 75 and Figure 76 chart these but also show the projections calculated using the different assumptions for the rate of transmission. These give some idea of how sensitive the projections are to the assumptions. Their main value is, perhaps, to show how things could improve if the transmission from generation to generation were to improve. We should not depend on them in any way. They are the product of a set of assumptions based on the patterns of the past, and the patterns of the past are not very likely to be repeated.

118
Table 15: Projections: % and number able to speak Welsh, 2011, 2021, 2031
Year
2001 2011 2021 2031
Total aged 3 and over: % able to speak Welsh 20.8 20.0 20.0 20.3 Number able to speak Welsh 582,000 583,000 617,000 654,000 Children aged 3: % able to speak Welsh 14.9 15.4 16.2 16.3
According to these projections, the number of Welsh speakers in Wales in 2011 is almost unchanged since 2001. The percentage who can speak Welsh could be a little lower than in 2001. This document should have provided sufficient background for these results to come as no surprise. After 2011, the projections suggest that the number of speakers could increase more substantially by 2021. All the same, because of in-migration, they do not show an increase in the percentage of people who can speak Welsh over the same period.
Figure 75: Projections: number able to speak Welsh, 2001-33

119
Figure 76: Projections: % able to speak Welsh, 2001-33
14.3 Summary
Neither the results of recent surveys nor the calculated projections suggest that we shall see a substantial increase in the percentage of people who can speak Welsh in the near future. The demographic factors have been discussed at length in previous sections, as has education. The size of the flow of people migrating in and out of Wales may change comparatively suddenly and this may affect the nature of the population considerably. However, other factors—natural change due to births and deaths, and education—tend to change comparatively slowly. As a result, the number and percentage of people who can speak Welsh changes comparatively slowly at a national level.
Although this document has presented some details at a local authority level, it has scarcely touched on smaller areas. Except in the field of children’s education, little up-to-date statistical evidence is available for small areas. Analyses of the results of the 1991 and 2001 Censuses in this document have quantified changes in the geographical distribution of Welsh speakers over that period. That work can be built on when the results of the 2011 Census are published. Even without any mathematical modelling, considering the demographic trends, we can be fairly sure that the areas where over 70% are able to speak Welsh will have shrunk once again. It is also likely that fewer Welsh speakers will live in areas where a high percentage of people speak Welsh. On the other hand, some areas will have a higher percentage of the population, particularly of young people, able to speak Welsh than for decades.

120
15 Epilogue The statistics in this volume have portrayed a complex situation. Some developments, mainly in education, promise well for the future as regards the number and percentage of Welsh speakers in Wales, but there are adverse trends as well.
Although this volume has presented a great many statistics, a number of aspects of the use of Welsh have not been discussed. Nothing has been included as regards most media, for example, or the arts. Although a certain amount of attention has been paid to the workplace, we have in fact scarcely touched on it nor mentioned the activities of the voluntary sector or the world of sport. Instead, priority has been accorded to the factors most directly connected to the sustainability of Welsh-speaking society. The other areas are, however, important, since they form the wider infrastructure of the language. They provide—or, in some cases, could provide, through the development of Welsh-medium activities—opportunities for people to use the language. Ensuring an increase in the opportunities available is one of the challenges for the future. The statistics presented have highlighted some continuing weaknesses as regards individuals’ skills in Welsh, and it is by practice that skills improve. Without opportunities to use the language in the world outside home or school, an increase in the number of people able to speak Welsh will not be reflected in the extent to which the language is used.

121
16 Bibliography Aitchison, J. and Carter, H. (1985). The Welsh Language: An Interpretative Atlas: 1961-1981,
Cardiff, University of Wales Press. — (1994). A Geography of the Welsh Language 1961–1991, Cardiff, University of Wales
Press. — (2000). Language, economy and society: the changing fortunes of the Welsh language in
the twentieth century, Cardiff, University of Wales Press. — (2004). Spreading the Word: The Welsh language 2001, Talybont, Y Lolfa. Aldekoa, J. and Gardner N. (2002). ‘Turning Knowledge of Basque into Use: Normalisation
Plans for Schools’, International Journal of Bilingual Education and Bilingualism, 5, 6, 339–54.
Alvarez Enparantza, José Luis (“Txillardegi”), (2001). Hacia una Socio-Lingüística Matemática, Sortzen, Euskal Soziolinguistika Institua Sortzen.
Arad Consulting and Hywel Evans Cyf (2007). First stage evaluation of Iaith Pawb, Cardiff, Welsh Government, http://wales.gov.uk/depc/research/firstiaithpawb/e.pdf, accessed 13 December 2011.
BARB. www.barb.co.uk. Beaufort Research (2000). State of the Welsh language, Cardiff, Welsh Language Board — (2004). Assessing proficiency in reading and writing Welsh: written report on findings. Basic
Skills Agency, http://www.arsyllfadysgu.com/uploads/publications/581.pdf, accessed 13 December 2011.
— (April 2005). Welsh speakers Omnibus Survey , Welsh Language Board. — (2006). Living lives through the medium of Welsh study: summary report, S4C, Welsh
Language Board and the Arts Council for Wales, http://www.s4c.co.uk/abouts4c/corporate/pdf/e_WelshLivesSummaryReport.pdf, accessed 13 December 2011.
— (March 2007). Omnibus survey of Welsh businesses (Cwmnibus), Welsh Language Board. Bianchi, T. (2008). A review of the Welsh language print media, Cardiff, Welsh Language
Board. Birt, P. W. (2005). ‘The Welsh Language in Chubut Province, Argentina’ in D. Ó Néill (ed.),
Rebuilding the Celtic Languages, Tal-y-bont, Y Lolfa. Centre for European Research, Wales (2007). Indicators of language use: final report, Cardiff,
Welsh Language Board. Countryside Council for Wales and Forestry Commission Wales (2008). Welsh Outdoor
Recreation Survey, http://www.ccgc.gov.uk/enjoying-the-country/idoc.ashx?docid=ffddf0de-21e3-43b4-aab9-0bc846e3658d&version=-1, accessed 13 December 2011.
Fishman, J. (1972). ‘The sociology of language: an interdisciplinary social science approach to language’ in Society, Newbury House Publishers.
— (1991). Reversing Language Shift: Theoretical and Empirical Foundations of Assistance to Threatened Languages, Clevedon, England, Multilingual Matters.
Further Education Funding Council for Wales (1994). Report of the Welsh for Adults Joint Review Group, Cardiff, Welsh Funding Councils.
General Teaching Council for Wales (2011). Annual Statistics Digest, Cardiff, General Teaching Council for Wales, http://www.gtcw.org.uk/gtcw/images/stories/downloads/Annual%20Statistics%20Digest/Annual_Stats_11_E.pdf, accessed 13 December 2011.

122
Gillie, C. and Allen, G. (1996). Nursery Education and Grant-Maintained Schools Bill [Bill 41 of 1995/96] Research Paper 96/8, House of Commons Library, http://www.parliament.uk/briefing-papers/RP96-8.pdf, accessed 22 November 2011.
Hansen, K. and Joshi, H. (Ed) (2008). Millennium Cohort Study Third Survey: A User’s Guide to Initial Findings, Centre for Longitudinal Studies, Institute of Education, University of London, http://www.cls.ioe.ac.uk/core/documents/download.asp?id=1083&log_stat=1, accessed 22 November 2011.
Haselden, L. (2004). Differences in estimates of Welsh language skills, Office for National Statistics, http://www.ons.gov.uk/ons/guide-method/census/census-2001/data-and-products/data-and-product-catalogue/reports/report-on-the-welsh-language/differences-in-estimates-of-welsh-language-skills.pdf, accessed 12 January 2012.
Higgs, G., Williams, C. and Dorling, D., (2004). ‘Use of the Census of Population to discern trends in the Welsh language: An aggregate analysis’, Area , 36, 187–201.
Higher Education Statistics Agency (2011). Longitudinal Survey of 2006/07 Leavers. Jenkins, G. (1999). ‘A gafodd Cymru chwareu teg?’, in Cyfrifiad 1891 a’r iaith Gymraeg, Y llyfr
yng Nghymru=Welsh Book Studies, 2, 1-21. Joint Council for Qualifications (JCQ) (2011). GCSE, Applied GCSE and Entry Level
Certificate Results, Summer 2011, http://www.jcq.org.uk/attachments/published/1589/GCSE%20RESULTS.pdf, accessed 1 December 2011.
Jones, H. (2005). ‘Ability to speak Welsh in the Censuses of Population: a longitudinal analysis’, Population Trends Winter 2005, No. 122, 83-86, Office for National Statistics, Palgrave MacMillan, http://www.ons.gov.uk/ons/rel/population-trends-rd/population-trends/no--122--winter-2005/population-trends.pdf, accessed 23 December 2011.
—(2007). ‘Goblygiadau newidiadau ym mhroffil oedran siaradwyr Cymraeg a’u dosbarthiad gofodol’, Gwerddon I: 2 October, 10-37, www.gwerddon.org
— (2008). ‘The changing social context of Welsh: a review of statistical trends’, International Journal of Bilingual Education and Bilingualism, 11, 5 (September), 541-57.
— (2009). ‘The intergenerational transmission of the Welsh language: an analysis of the 2001 Census results for Wales’, a paper presented to the 2009 annual conference of the British Society for Population Studies, Cardiff, Welsh Language Board.
— (2010). ‘Welsh speakers: the relationship between their age profile and out-migration’, in D. Morris (ed.), Welsh in the 21st century, Cardiff, University of Wales Press.
Kandler, A., Unger, R. and Steele, J. (2010). ‘Language shift, bilingualism and the future of Britain’s Celtic languages’, Phil. Trans. R. Soc. B (2010), 365, 3855–64.
Kruger, J. and Dunning, D. (1999). ‘Unskilled and Unaware of It: How Difficulties in Recognizing One’s Own Incompetence Lead to Inflated Self-Assessments’, Journal of Personality and Social Psychology, 77, 6, 1121–34.
Lifelong Learning UK (2007). Welsh Language Skills Audit: The Welsh Language and bilingual skills of staff in further education, higher education, adult community learning and work based learning sectors in Wales, Cardiff, Lifelong Learning UK.
Llais y Lli (2005). A report to the Education and Lifelong Learning Committee of the National Assembly for Wales: ELL2 13-05 Paper 1, Annex C: The movement of pupils between Welsh and second-language Welsh, Cardiff, National Assembly for Wales,
http://www.assemblywales.org/N0000000000000000000000000038286.pdf, accessed 14 December 2011.
Nelde, P., Strubell, M. and Williams, G. (1996). Euromosaic: The production and reproduction of the minority language groups of the European Union, Brussels, European Commission.
123
NOMIS. www.nomisweb.co.uk. NOP (1995). Public attitudes to the Welsh language, The Central Office of Information and
Welsh Language Board. Office for National Statistics (2004). Census 2001 Review and Evaluation, General Report on
the 2001 Census in Wales, http://www.ons.gov.uk/ons/guide-method/census/census-2001/design-and-conduct/review-and-evaluation/evaluation-reports/a-report-on-the-2001-census-in-wales/general-report-on-the-2001-census-in-wales---english.pdf, accessed 12 January 2012.
— (2004a). Census 2001 Report on the Welsh language, London, TSO. — (2004b). Focus on Wales. Office for National Statistics. — (2005). Census 2001 Quality report for England and Wales,
http://www.ons.gov.uk/ons/guide-method/census/census-2001/design-and-conduct/review-and-evaluation/evaluation-reports/quality-report/census-2001-quality-report.pdf, accessed 17 November 2011.
— (2007). Mortality Statistics: Deaths registered in England and Wales by area of usual residence - Deaths: numbers by age and sex, 2007, http://www.ons.gov.uk/ons/rel/vsob1/deaths-registered-area-usual-residence/2007/table-1---deaths--numbers-by-age-and-sex--2007-.xls, accessed 1 December 2011.
— (2010). Birth summary tables, England and Wales, 2010, http://www.ons.gov.uk/ons/rel/vsob1/parents--country-of-birth--england-and-wales/2010/parents--country-of-birth--england-and-wales---parents--birthplace.xls, accessed 1 December 2011.
OPCS (1993). 1991 Census Cyfrifiad 1991 Report for Wales (Part 1) Adroddiad Cymru (Rhan 1), London, HMSO.
— (1994). 1991 Census Cyfrifiad 1991 Welsh Language/Cymraeg Wales/Cymru, London, HMSO.
Phillips, J. (2008). ‘Effaith newidiadau diweddar ar hynodrwydd ieithyddol y Gymraeg’, Gwerddon 2: 3 May, 10-37. www.gwerddon.org.
Pwyllgor Datblygu Addysg Gymraeg (1993). Welsh and the Early Years. Cardiff, Pwyllgor Datblygu Addysg Gymraeg.
R Development Core Team (2011). R: A language and environment for statistical computing., Vienna, Austria, R Foundation for Statistical Computing, www.R-project.org.
Sankoff, D. (2008). ‘How to predict the evolution of a bilingual community’, in Meyerhoff, M. and Nagy, N.(eds.), Social Lives in Language – Sociolinguistics and Multilingual Speech Communities Celebrating the Work of Gillian Sankoff, University of Edinburgh/University of Toronto.
Seliger, H. and Vago, R. (gol.) (1991). First language attrition, Cambridge, Cambridge University Press.
Shuttleworth, I., Lloyd, C. and Martin, D. (2011). ‘Exploring the implications of changing census geographies for the measurement of residential segregation: the example of Northern Ireland 1991-2001’, J. R. Statist. Soc.A, 174, Part 1, pp. 1-16.
Siencyn, S.W. (ed.) (2010) Y Cyfnod Sylfaen: Athroniaeth, Ymchwil ac Ymarfer, Carmarthen: University of Wales: Trinity Saint David Publications.
Statistics Canada (2006a). 2006 Census of Canada: Topic-based tabulations. Detailed Mother Tongue www.statcan.gc.ca.
— (2006b). Detailed Language Spoken Most Often at Home, http://www12.statcan.gc.ca/census-recensement/2006/dp-pd/tbt/Rp-eng.cfm?LANG=E&APATH=3&DETAIL=0&DIM=0&FL=A&FREE=0&GC=0&GID=0&GK=0&

124
GRP=1&PID=94817&PRID=0&PTYPE=88971,97154&S=0&SHOWALL=0&SUB=702&Temporal=2006&THEME=70&VID=0&VNAMEE=&VNAMEF=
— (2006c). Various Languages Spoken, , accessed 1 December 2011.
http://www12.statcan.gc.ca/census-recensement/2006/dp-pd/tbt/Rp-eng.cfm?LANG=E&APATH=3&DETAIL=0&DIM=0&FL=A&FREE=0&GC=0&GID=0&GK=0&GRP=1&PID=89189&PRID=0&PTYPE=88971,97154&S=0&SHOWALL=0&SUB=705&Temporal=2006&THEME=70&VID=0&VNAMEE=&VNAMEF=, accessed 1 December 2011.
Statistics New Zealand (2006). 2006 Census Data. QuickStats about Culture and Identity. Table 16, http://www.stats.govt.nz/~/media/Statistics/Census/2006-reports/quickstats-subject/Culture-Identity/quickstats-about-culture-and-identity-tables.xls, accessed 1 December 2011.
StatsWales. www.statswales.wales.gov.uk. Thomas, R. (2010). Gwasaniaithau, Consumers and the Welsh language, Cardiff, Consumer
Focus Wales. U.S. Census Bureau (2000). Census 2000 Special Tabulation 224. Detailed Language
Spoken at Home for Population 5 Years and Over, http://www.census.gov/hhes/socdemo/language/about/STP224.xls, accessed 1 December 2011.
Vidler, G. (2001). The 2001 Census of Population, Research Paper 01/21, House of Commons Library, http://www.parliament.uk/briefing-papers/RP01-21.pdf, accessed 4 January 2012.
Vision of Britain. http://www.visionofbritain.org.uk/. Welsh Government (2003). Iaith Pawb: a national action plan for a bilingual Wales, Cardiff,
Welsh Government. — (2004-2008). Living in Wales Survey, Cardiff, Welsh Government. — (2007). Defining schools according to Welsh medium provision. Information. Information
document No: 023/2007, Cardiff, Welsh Government. — (2009). Welsh-medium education strategy: consultation. Consultation document No:
067/2009, Cardiff, Welsh Government. — (2010a), Wales’s population: a demographic overview 2010, Cardiff, Welsh Government. — (2010b). Household projections for Wales (2008-based), Summary Report, Cardiff, Welsh
Government. — (2010c). SDR 98/2010 Schools Census 2010: Final results, Cardiff, Welsh Government. — (2010d). Welsh-medium education strategy: information. Information document No:
083/2010, Cardiff, Welsh Government. — (2011a). SB 68/2011(R): Welsh in higher education institutions, 2009/10 – Revised, Cardiff,
Welsh Government. — (2011b). SDR 125/2011 Participation of young people in education and the labour market
(year end 2009 and 2010 (provisional)), Cardiff, Welsh Government. — (2011c). SDR 153/2011 Schools Census 2011: Final results December, Cardiff, Welsh
Government, http://wales.gov.uk/topics/statistics/headlines/schools2011/110906/?lang=en, accessed 1 December 2011.
— (2011d). SDR 84/2011 Schools in Wales: Examination performance, 2010, Cardiff, Welsh Government.
— (2011e). SB 21/2011(R) ITT in Wales 2009/10 – Revised, Cardiff, Welsh Government. — (2011f). SDR 130/2010 Staff at Further Education Institutions, 2008/09, Cardiff, Welsh
Government.

125
— (2011g). SDR 171/2011 Further Education, Work-based Learning and Community Learning Statistics 2009/10, Cardiff, Welsh Government.
— (2011h). SDR 119/2011 National Survey of Adult Skills in Wales, 2010, Cardiff, Welsh Government.
— (2011i). Welsh-medium education strategy: Annual report 2010–11, Cardiff, Welsh Government.
Welsh Language Board (2003). Transmission of the language within the family: a statistical analysis, Cardiff, Welsh Language Board.
— (2004). 2001 Census: Linguistic composition of Wales’s households, Cardiff, Welsh Language Board.
— (2008). The Welsh Language Use Surveys of 2006-2008, Cardiff, Welsh Language Board. — (2009). Transmission of the language: analysis of the situation in Wales, Scotland and
Ireland, Cardiff, Welsh Language Board. Welsh Office (1978). Statistics of Education in Wales, No.3, 1978, Cardiff, Welsh Office. — (1995). 1992 Welsh Social Survey Report on the Welsh language, Cardiff, Welsh Office. Wickham, H. (2009). ggplot2: Elegant Graphics for Data Analysis, New York, Springer. Williams, C. and Evas, J. (1997). The Community Research Project, Cardiff, Welsh Language
Board. Williams, J. and Kinnaird, R. (2004). The National Survey of Adult Basic Skills in Wales, British
Market Research Bureau, http://www.arsyllfadysgu.com/uploads/publications/1943.pdf, accessed 13 December 2011.
WJEC (2010). Welsh for Adults Examinations Bulletin, Cardiff, WJEC. — (2011). Provisional results summer 2011: GCSE (full course), Cardiff, WJEC,
http://www.cbac.co.uk/uploads/publications/13929.pdf, accessed 13 December 2011. Woods, A. (2007). Buying and reading Welsh-language books. Analysis of market research for
the Welsh Books Council, http://www.cllc.org.uk/1364.file.dld, accessed 13 December 2011. Wyburn, J. and Hayward, J. (2008). ‘The future of bilingualism: an application of the Baggs
and Freedman model’, J. Math. Soc. 32, 267–284. (doi:10.1080/00222500802352634). — (2009). ‘OR and language planning: modeling the interaction between unilingual and
bilingual populations’, J. Operat. Res. Soc. 60, 626–36. (doi:10. 1057/palgrave.jors.2602600).

126
17 Appendix: Methodology for calculating projections We can use government population projections as a starting point. The projections are produced for specific age groups. What we have to do is project the percentage who will able to speak Welsh, by age group. Broadly, we can take the percentage able to speak Welsh in a particular age group, for example, 30 years of age, in one year as a projection of the percentage who will be able to speak Welsh in the next age group, at 31, the following year, or at 32 the year after that, and so on. To obtain a projection of the number of people who will be able to speak Welsh, we take the percentage and multiply it by the projection of the population.
To begin with, we take the percentages able to speak Welsh at the time of the 2001 Census, by age.
We take the population, by age group, each year from 2001 to 2008 (mid year estimates), and projections of the population from 2009 up to 2033.201,202
There are three complications:
How to estimate the percentage aged 2 who speak Welsh each year;
How to estimate the percentage among children aged 3 and over; and
How to decide from what age, if at all, it is reasonable to expect that the percentage will not change substantially from year to year.
Three-year-olds are the youngest age group for which the 2001 Census published the percentage able to speak Welsh. We have to decide what percentage will be able to speak Welsh at the age of 3 the following year. To do this, we estimate the percentage for those aged 2 in 2001: the percentage of children aged 3 who could speak Welsh and who lived in an entirely Welsh household, as regards the adults living there. But we have to estimate the percentage of children aged 2 every year. To do this, feedback is built into the model. The percentage of children aged 2 depends on the percentage able to speak Welsh among the generation who are bringing up children and the rate of language transmission by that group. The appropriate generation is assumed to be people aged between 20 and 49.
To estimate the percentage of those aged 3 the following year, we take an estimate of the 2-year-olds and adjust it to reflect the change between the ages of 2 and 3 in 2001, i.e. we take it that education between one year and the next will have the same effect as it had in 2001. According to the 2001 Census, the percentage who could speak Welsh increased from one age group to the next until it reached almost 45.9% for those aged 14, but the ratio between the percentage for one age group and the next decreased, again almost without exception, from the age of 3 to the age of 18.
201 Produced by the ONS and published on 13 May 2010, from StatsWales table 016889. 202 Produced by the ONS, based on the estimates for 2008. The 2010 base projections were published after this work had been carried out.

127
While the increase from one age group to the next up to the age of 14 could be attributed to the effect of education, there are probably two main reasons for the decrease from one age group to the next from the age of 14 to the age of 21: the decrease in the percentage of school pupils learning Welsh as a second language up to the age of 16-19, and outmigration and in-migration from the age of 18 onwards.
According to the Office for National Statistics population projections, we shall see a substantial net in-migration from the ages of 17 to 20, and a substantial outmigration from the ages 20 to 24. The percentage of those able to speak Welsh will probably be much higher among those who migrate out of Wales than among those who migrate in, particularly among those aged 17 to 20. Assuming the percentage will change from ages 14 to 21 in a similar way to that seen in 2001, the pattern of migration will presumably be similar from 2002 onwards. Assuming that from the age of 21 onwards the percentage of those able to speak Welsh will not change, the effect of migration is ignored.
These are the other assumptions. As regards transmission, it is assumed that for 2001, 6.97% of children aged 2 could speak Welsh on the basis that 6.97% of all children aged 3 could speak Welsh and lived in homes where both parents or the only parent could speak Welsh. In the other years, it is assumed that transmission is by adults aged 20 to 49. On average, 15.5% of those aged 20 to 49 could speak Welsh in 2001.
These figures give a ratio of 0.449 that can be taken as the rate of transmission each year. As the percentages who can speak Welsh in the age groups 20 to 49 increase, the percentage who can speak Welsh among those aged 2 will thus also increase.
Secondly, to show the sensitivity of the projections to the assumption about the rate of transmission, two other rates are employed: these are 0.25 and 0.9, one representing a scenario where the number of children aged 2 who can speak Welsh is a lower percentage of the number aged 20 to 49, and the other a scenario where it is higher.
In the case of education, the assumption is to take the pattern of change in 2001 from one age group to the next between 3 and 21 as something that will not vary.203,204
203 Odds ratios.
204 These two assumptions are based on those employed by Sankoff, apart from the fact that the age range 3 to 21 used is wider than the range that he uses, and imitates not only patterns of school education but also the net effect of migration in 2001. It is only here, in these projections, that the effect of in-migration and outmigration is included. This is the same as assuming, as regards those aged over 21, that there will be no in-migration or outmigration after that age. The projections for the numbers have been calculated by taking the relevant percentage from the Government’s population projection (base 2008) (StatsWales 010879). These projections include the effect of in-migration and outmigration. For the purposes of calculating the projection of the population, only the net effect is important, but that is not the case when seeking to calculate a projection of the population able to speak Welsh. It is unlikely the percentage of Welsh speakers among those migrating into Wales will be the same as among those migrating out of the country. (In the main, the percentage will be lower.) If, e.g. 20% of those aged 22 are able to speak Welsh, the net effect of migration is likely to mean that fewer than 20% will be able to speak Welsh among those aged 23 the following year. The projections of the percentages ignore this. In this example, they assume that the percentage able to speak Welsh for those aged 23 is still 20%.