A standardized methodology for the techno-economic ... · 6 111 production routes using commercial...
43
1 A standardized methodology for the techno-economic evaluation of 1 alternative fuels – A case study 2 Friedemann G. Albrecht, Daniel H. König, Nadine Baucks, Ralph-Uwe Dietrich 3 German Aerospace Center, Institute of Engineering Thermodynamics, Pfaffenwaldring 38-40, 70569 4 Stuttgart, Germany 5 Corresponding Author 6 German Aerospace Center 7 Institute of Engineering Thermodynamics 8 Friedemann G. Albrecht 9 Pfaffenwaldring 38-40 10 70569 Stuttgart 11 Germany 12 Phone: 0049 711 6862-232 13 Email: [email protected] 14 15 KEYWORDS: Biomass-to-Liquid, Power-to-Liquid, Renewable Energy Storage, Fischer-Tropsch 16 Synthesis, Techno-Economic Assessment, Alternative Fuels 17 18
Transcript of A standardized methodology for the techno-economic ... · 6 111 production routes using commercial...

1
A standardized methodology for the techno-economic evaluation of 1
alternative fuels – A case study 2
Friedemann G. Albrecht, Daniel H. König, Nadine Baucks, Ralph-Uwe Dietrich 3
German Aerospace Center, Institute of Engineering Thermodynamics, Pfaffenwaldring 38-40, 70569 4
Stuttgart, Germany 5
Corresponding Author 6
German Aerospace Center 7
Institute of Engineering Thermodynamics 8
Friedemann G. Albrecht 9
Pfaffenwaldring 38-40 10
70569 Stuttgart 11
Germany 12
Phone: 0049 711 6862-232 13
Email: [email protected] 14
15
KEYWORDS: Biomass-to-Liquid, Power-to-Liquid, Renewable Energy Storage, Fischer-Tropsch 16
Synthesis, Techno-Economic Assessment, Alternative Fuels 17
18

2
ABSTRACT 19
Greenhouse gas emissions in the transport sector can significantly be reduced by replacing fossil based 20
fuels with green alternatives. Various alternative fuel concepts have been developed differing in used 21
sustainable feedstock, synthesis technology and final fuel characteristics. Whether these fuels can 22
succeed in the market will depend on the fuel net production costs, the expected cost reduction 23
potentials and the political intention to mitigate climate change. Results of previous studies for the 24
techno-economic assessment of alternative fuels are difficult to compare due to significant differences in 25
the applied methodology, level of detail and key assumptions in terms of economic factors and market 26
prices. In this work, a standardized methodology for techno-economic analysis of fuel production 27
processes is presented and exemplarily applied on sustainable fuels from Fischer-Tropsch (FT) 28
synthesis. The methodology was adapted from a best practice approach from chemical industry and 29
consists of three main steps: A) literature survey on feasible production designs, B) flowsheet simulation 30
and C) techno-economic assessment with the in-house software tool TEPET (Techno-Economic Process 31
Evaluation Tool). It is shown that the standardized approach enables qualitative and quantitative 32
statements regarding the technical and economic feasibility of fuel synthesis concepts including the 33
identification of the appropriate fuel production concept due to predefined framework conditions. 34
Results from the case study on green FT fuels reveal that Biomass-to-Liquid (BtL) concepts have lowest 35
production costs at high electricity costs, whereas the Power-to-Liquid (PtL) and Power and Biomass-to-36
Liquid (PBtL) concepts are superior at low electricity prices. Fuel production costs in the range of 1.2 37
and 2.8 €2014/l were estimated. 38
39

3
1. Introduction 40
In 2012, 95 % of the energy consumed in European transport was supplied by crude oil products [1]. 41
Greenhouse gas (GHG) emissions from transportation account for about 25 % of total European GHG 42
emissions [2]. In order to keep global warming below 2 °C, the European Union has set binding targets 43
for cutting GHG intensity of fuels by 6 % compared to 2010 [3] and to increase the share of renewable 44
energies in the transport sector to 10 % until 2020 [4] with special requirements regarding indirect land 45
use change [5]. While electric vehicles may become a viable option to reach these goals in private car 46
traffic, aviation and heavy duty transportation will continue to rely on liquid fuels due to the required 47
high volumetric energy density and the high investment costs for changing today’s engine technology 48
and infrastructure [6]. It is therefore expected that a large amount of alternative “drop-in” fuels are 49
required to significantly decrease the carbon footprint in these transportation sectors. Most alternative 50
fuels available on the market today are so-called 1st generation fuels, which predominantly are made 51
from energy crops raising the issue of competition for farmland and low technical expansion potential in 52
Europe. Hence, future fuels have to preferably be made from renewable electricity, residues and waste 53
wood to decrease the effect of indirect land use change. 54
Multiple 2nd
generation production paths for alternative liquid fuels have been developed in the recent 55
years such as Fischer-Tropsch fuels, Dimethylether (DME) based fuels such as Methanol-to-Gasoline 56
(MtG) or alcohols (ethanol, butanol), to mention only a few examples. Though, the “optimal” alternative 57
future fuel remains to be identified. One the one hand, requirements regarding main fuel characteristics 58
and total fuel demand varies considerably among the specific application areas (road transport, aviation, 59
astronautics etc.). On the other hand, political framework conditions such as support schemes and tax 60
advantages significantly affect the development of the fuel market and therewith also predefine the 61
feasibility of alternative fuels. In order to evaluate and compare the prospects of emerging alternative 62
fuel concepts, the German Aerospace Center (DLR) has launched the strategic project “Future Fuels”. 63
One main focus is on economic performance parameters such as capital investment cost and fuel 64
production costs, which are considered to be one of the major factors for the market success of 65
alternative fuels. 66

4
A large number of techno-economic studies on a wide range of different alternative and synthetic fuels 67
already exist, which typically apply a methodology adapted from the power or chemical industry. Worth 68
mentioning are the fundamental works on process economics of Peters et al. [7], Ulrich et al. [8], Smith 69
et al. [9] and Turton et al. [10]. Despite the similar economic approach applied in cost calculation studies 70
on alternative fuels, a common concern is the comparability of results. This issue was addressed by 71
Haarlemmer et al. [11] using the example of biofuels production via Fischer-Tropsch synthesis from 72
biomass (Biomass-to-Liquid, BtL), coal (Coal-to-Liquid, CtL) and gas (Gas-to-Liquid, GtL). The 73
authors showed by comparing more than 20 recently published techno-economic studies that a 74
reasonable comparison is impossible not only due to different methodologies used, but also because of 75
unequal source data (cost data, ratio factors and economic assumptions such as plant lifetime, interest 76
rate and inflation). Another problem is the lack of calculation details in most studies making it difficult 77
to understand the underlying assumptions of the cost calculation [12]. Hence, economic results can 78
hardly be normalized in terms of e. g. plant scale, depreciation method and economic assumptions such 79
as raw material market prices and equipment costs. 80
A more consistent approach is to compare various synthetic fuel production option by applying a kind of 81
superstructure-based methodology as proposed in the studies by Cheali [13] and Maravelias et al. [14] 82
[15]. The drawback of superstructure studies is that process steps typically are very simplified in order 83
to obtain a mathematical correlation which can be used in commercial or new developed mathematical 84
optimization algorithms. Great simplifications bear the risk that process limitations due to 85
thermodynamic phenomena such as catalyst coking or the effect of recycle streams on reaction kinetics 86
are neglected or underestimated. 87
Since no standardized methodology for comparing alternative fuels exists at present, a reliable and 88
unbiased comparison schema for alternative fuels was developed in the course of the Future Fuel 89
project. This paper presents first results in terms of a transparent methodology for the estimation of fuel 90
net production costs (NPC), which was implemented in the in-house tool TEPET (Techno-Economic 91
Process Evaluation Tool). The methodology is characterized by a high of level detail including 92
experimental investigations of key process steps. Starting from a detailed description of the 93

5
methodology for the techno-economic evaluation in chapter 2, the TEPET tool is applied in a case study 94
on a comparison of key economic measures of three different Fischer-Tropsch fuel synthesis routes 95
based on various feedstocks (Chapter 3). The case study includes a detailed literature survey on possible 96
process pathways, descriptions of the implemented process models and basic information about the 97
applied heat integration. Finally, a comparison of results with previous techno-economic studies of 98
Fischer-Tropsch fuels is made and a brief discussion of uncertainties regarding the applied methodology 99
is given. 100
2. Methodology of techno-economic evaluation 101
Figure 1 shows a block diagram providing a rough overview of the developed methodology for the 102
standardized techno-economic evaluation of alternative fuels. 103
104
Figure 1: DLR methodology for Techno-Economic Evaluation 105
The DLR approach consists of six major steps, whereby the first three are discussed in this work. 106
Initially, an extensive literature survey on the fuel production path to be investigated is carried out. The 107
focus is on available technologies and process concepts as well as on economic data for key process 108
equipment. In addition, technical and economic data from associated research and industrial partners is 109
used. As a second step, a detailed process simulation is implemented for the most promising fuel 110

6
production routes using commercial Aspen Plus® software. Implemented process simulations are 111
characterized by a high level of detail enabling a reasonable investigation of the interaction of crucial 112
production steps in terms of operation conditions (temperature, pressure etc.), energetic efficiency and 113
optimal process design. The process simulations are heat integrated to minimize utility costs by 114
designing an optimized heat exchanger network based on results from pinch-point analysis. In the third 115
step, the thermally optimized simulations are directly connected to TEPET by using the Aspen add-on 116
Aspen Simulation WorkbookTM
. Because of this interlinking, NPC calculation is automatically updated 117
when process simulation parameters and settings are changed. Furthermore, sensitivity analyses of key 118
process parameters can be easily conducted by controlling the process simulation with TEPET. The 119
methodology used for cost calculations was adapted from a best-practice approach from the chemical 120
industry [7] [9] [16], since fuel production on a large scale can be considered to be very similar to 121
common petro-chemical processes. Though, the methodology was improved and extended by the 122
authors in terms of additional economic measures such as experience curve effects. Key economic 123
parameters calculated are total and equipment specific capital expenditures (CAPEX), operational 124
expenditures (OPEX) as well as fuel net production costs (NPC). Additionally, the effect of economy of 125
scale is examined and the most sensible input parameters are identified. The findings of the techno-126
economic evaluation are used to modify the simulation process design in order to minimize NPC, which 127
can be seen as a first iteration loop within the procedure. Subsequent, crucial process steps having a 128
large impact on NPC are identified (step 4) and in the following investigated (step 5) in terms of small-129
scale experiments in order to verify technical feasibility of chosen operation conditions. If model 130
assumptions cannot be verified by experimental work, the process design or process parameters are 131
modified resulting in a second iteration loop. The present work deals exclusively with the first three 132
steps with focus on the first iteration loop (step 2 & 3). Steps four to six will be discussed in a 133
subsequent study. 134
2.1 Process simulation 135
The main purpose of setting up process simulations is the in-depth investigation of interdependences of 136
key production steps within the fuel production route with regard to process parameters (T, p, etc.) and 137

7
economic cost saving potentials. Process models of this work employ all equipment required to 138
reproduce changes of chemical composition and thermodynamic state of the main process streams. This 139
includes all reactors, burners, heat exchangers, pumps and compressors, flashes and valves. Other 140
auxiliary equipment characterized by no significant potential for heat and material integration are simply 141
modeled as black box with specific electricity and heat demands. Though, electricity generation as well 142
as steam production from waste heat and off gases is modeled as well. Process models are heat 143
integrated by applying the pinch analysis method [17] [18] and appropriate heat exchanger networks are 144
designed in order to minimize external heating and cooling demand. 145
2.2 Cost estimation methodology 146
A simplified summary of the cost estimation methodology used in TEPET for estimating NPC is 147
illustrated in 148
Figure 2. 149
150
Figure 2: Simplified scheme of cost estimation methodology in TEPET 151
Process simulation results
Process design
Product Yield/year
Net Production Cost (NPC) [€/l]
OPEXRaw materials
Utilities
Maintenance & labor
…
CAPEXEquipment costs
Piping & installation
Service facilities
…Meets AACE class 3-4
Accuracy: +/- 30 %

8
The methodology for estimating CAPEX, OPEX and NPC is presented in the following subsections. The 152
accuracy of cost estimation is expected to be +/- 30 % according to class three and four of the 153
classification system of AACE (Association for the Advancement of Cost Engineering) [19]. 154
Capital investment costs (CAPEX) 155
Fixed capital investment (FCI) costs consist of equipment costs (EC) and further capital requirements in 156
the construction phase. EC for all installed units are calculated in TEPET according to Equation (1), 157
which was reproduced from Peters et al. [7] and further developed by the authors taking into account 158
experience curve effects based on the work of the National Energy Technology Laboratory [20] and 159
Smith et al. [21]. 160
𝐸𝐶𝑖 = 𝑓𝑖(𝑆𝑖,1; 𝑆𝑖,2; … ; 𝑆𝑖,𝑘) ∗ (𝐶𝐸𝑃𝐶𝐼
𝐶𝐸𝑃𝐶𝐼𝑟𝑒𝑓) ∗ 𝐹𝑝𝑟𝑒,𝑖 ∗ 𝐹𝑚𝑎𝑡,𝑖 ∗ (1 − 𝐿𝑖
𝑙𝑜𝑔2(𝑛)) , 𝑖, 𝑘 𝜖 ℕ (1)
𝑓𝑖(𝑆𝑖,1; 𝑆𝑖,2; … ; 𝑆𝑖,𝑘)𝑒𝑥𝑎𝑚𝑝𝑙𝑒,(𝑘=1) = 𝑓𝑖(𝑆𝑖) = 𝐸𝐶𝑟𝑒𝑓,𝑖 ∗ (
𝑆𝑖𝑆𝑟𝑒𝑓,𝑖
)
𝑑𝑖
(2)
𝑓𝑖 describes an equipment specific cost function which assigns equipment costs to every item i in the 161
process simulation. Depending on the type of equipment and the source of the reference data, several 162
input variables 𝑆𝑖,𝑘 (volume, throughput, temperature, etc.) are taken into account. The required capacity 163
is distributed over a number of parallel units with same size, if the single unit capacity is restricted. An 164
example of cost function for estimating equipment costs frequently used in scientific literature with only 165
one input variable (k=1) is given in Equation (2). 166
𝐸𝐶𝑟𝑒𝑓,𝑖 and 𝑆𝑟𝑒𝑓,𝑖 describe equipment costs and a characteristic capacity, respectively, of a reference 167
unit i, whereas 𝑆𝑖 is the actual equipment size extracted from the process simulation via Aspen 168
Simulation WorkbookTM
. Economy of scale is considered by the equipment specific scale factor 𝑑𝑖. A 169
database consisting of cost functions for main chemical process equipment as well as for fuel synthesis 170
equipment was implemented and included in TEPET based on available data from scientific reference 171
literature (see Table 5). In order to account for inflation and temporal cost variations of equipment, the 172
Chemical Engineering Plant Cost Index (CEPCI) is used to update old data with respect to the chosen 173
9
reference year. Since the CEPCI is published on an U.S. dollar basis, reference equipment costs given in 174
Euro (€) are first converted to US$ using the specific exchange rate of the reference year before the 175
CEPCI is applied. Additional expenses on equipment due to high operation pressure or material 176
requirements are considered by the additional multipliers Fpre and Fmat, respectively. Optionally, 177
learning and experience curve effects can be accounted for by considering the term (1 − 𝐿𝑖𝑙𝑜𝑔2(𝑛)) 178
(see Equation (1)) based on an equipment specific experience rate L and the total number of 179
manufactured equipment units n. Experience curve effects have to be handled carefully, since it is 180
difficult to forecast the development of equipment costs of novel technologies. An example techno-181
economic evaluation on biodiesel reformers including experience curve effects is given in [23]. Fixed 182
capital costs (FCI) were calculated according to Equation (3) by multiplying equipment costs by pre-183
defined ratio factors Feco,i,j, which are summarized in Table 1 along with typical values for fluid 184
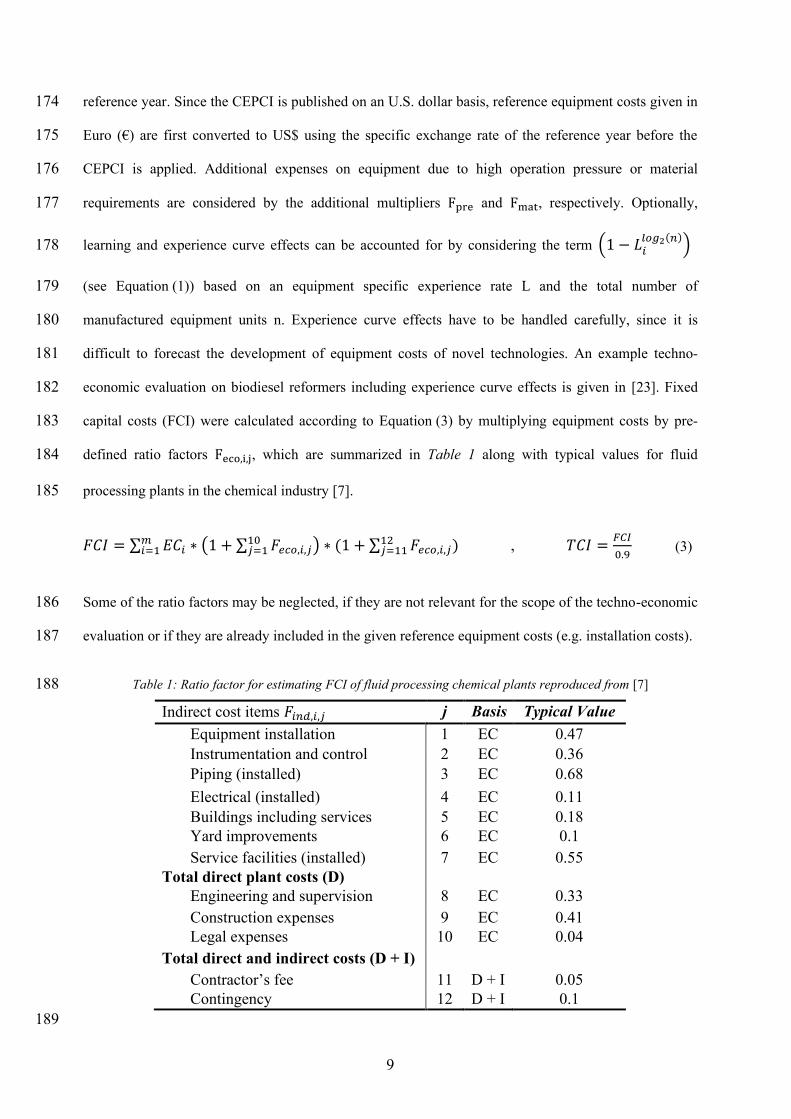
processing plants in the chemical industry [7]. 185
𝐹𝐶𝐼 = ∑ 𝐸𝐶𝑖 ∗ (1 + ∑ 𝐹𝑒𝑐𝑜,𝑖,𝑗10𝑗=1 )𝑚
𝑖=1 ∗ (1 + ∑ 𝐹𝑒𝑐𝑜,𝑖,𝑗12𝑗=11 ) , 𝑇𝐶𝐼 =
𝐹𝐶𝐼
0.9 (3)
Some of the ratio factors may be neglected, if they are not relevant for the scope of the techno-economic 186
evaluation or if they are already included in the given reference equipment costs (e.g. installation costs). 187
Table 1: Ratio factor for estimating FCI of fluid processing chemical plants reproduced from [7] 188
Indirect cost items 𝐹𝑖𝑛𝑑,𝑖,𝑗 j Basis Typical Value
Equipment installation 1 EC 0.47
Instrumentation and control 2 EC 0.36
Piping (installed) 3 EC 0.68
Electrical (installed) 4 EC 0.11
Buildings including services 5 EC 0.18
Yard improvements 6 EC 0.1
Service facilities (installed) 7 EC 0.55
Total direct plant costs (D)
Engineering and supervision 8 EC 0.33
Construction expenses 9 EC 0.41
Legal expenses 10 EC 0.04
Total direct and indirect costs (D + I)
Contractor’s fee 11 D + I 0.05
Contingency 12 D + I 0.1
189

10
Total capital investment (TCI) is estimated by predicting that 10 % of TCI is required as working 190
capital. 191
In order to calculate equivalent annual capital costs (ACC), both the FCI and the required working 192
capital have to be considered (Equation (4)). The first term in the brackets arises from applying the 193
annuity method on the FCI assuming that the value of the plant is zero at the end of plant life. Since 194
working capital does not depreciate in value, only the interest rate (IR) has to be paid on the working 195
capital resulting in the second term in Equation (4). 196
𝐴𝐶𝐶 = 𝐹𝐶𝐼 ∗ (𝐼𝑅 ∗ (1 + 𝐼𝑅)𝑦
(1 + 𝐼𝑅)𝑦 − 1+𝐼𝑅 ∗ 𝑦
9) (4)
Operational expenditures (OPEX) 197
Operational expenditures can be broken down in costs for raw materials and utilities (referred to as 198
“direct OPEX”) and other operational costs including for example maintenance, labor, insurances and 199
taxes (referred to as “indirect OPEX”). Direct OPEX are calculated based on results from the process 200
simulations and average annual market prices in the base year as shown in Equation (5). If only older 201
market prices are available, a commodity price index (CPI) is used to update price data. Commonly used 202
commodity price indices are the Rogers International Commodity Index® [24] and the World Bank 203
Commodity Price Data (The Pink Sheet) [25]. Both indices are further divided into sub-indices, which 204
reflect different commodity segments allowing a more accurate update of market prices. Revenues from 205
selling by-products, heat and electricity are accounted for in the same way. 206
∑𝑂𝑃𝐸𝑋𝑑𝑖𝑟 (€/$
𝑦𝑒𝑎𝑟) = ∑ ��𝑅&𝐵_𝑖 ∗ 𝑐𝑅&𝐵_𝑖
𝑚𝑖=1 ∗ (
𝐶𝑃𝐼𝑖
𝐶𝑃𝐼𝑟𝑒𝑓,𝑖) + ∑ 𝐸𝑝𝑜𝑤𝑒𝑟𝑗 ∗ 𝑐𝑝𝑜𝑤𝑒𝑟𝑗
𝑛𝑗=1 +
∑ 𝑊ℎ𝑒𝑎𝑡𝑘 ∗ 𝑐ℎ𝑒𝑎𝑡𝑘𝑝𝑘=1
(5)
Since power and heat streams crossing the system boundaries can be subject to different market prices 207
(e.g. stock market price versus granted feed-in remuneration for electricity according to the German 208
Renewable Energy Act [26]), each energy stream is accounted for separately. It shall be noted that 209

11
market prices cRM_BP_i, cpower_j and cheat_k for exported raw materials, by-products, power and heat, 210
respectively, have by definition a negative sign. 211
Indirect OPEX include all additional expenses originating from plant operation such as maintenance, 212
labor and administration. Since exact costs are difficult to predict, typical estimates are used based on 213
historical data form the chemical process industry [7], which are summarized in Table 2. It shall be 214
noted that indirect OPEX is by definition directly linked to CAPEX. Annual costs for operating labor 215
(OL) are calculated based on average specific labor costs (clabor) in the German industry [27]. Man-hours 216
(hlabor) are predicted as a function of plant capacity and the number of principle processing steps 217
according to the work of Peters et al. [7] (functions used are given in the supplementary information 218
chapter B). 219
Table 2: Ratio factors for estimating indirect OPEX of fluid processing chemical plants reproduced from [7] 220
Investment item j Basis Typical Value
Operating supervision 1 OL 0.15
Maintenance labor 2 FCI 0.01-0.03
Maintenance material 3 FCI 0.01-0.03
Operating supplies 4 Ma 0.15
Laboratory charges 5 OL 0.2
Insurance and taxes 6 FCI 0.02
Plant overhead costs [PO] 7 TLCb 0.6
Administrative costs 8 PO 0.25
Distribution and selling costs 9 NPC 0.06
Research and development costs 10 NPC 0.04 aM = Maintenance labor & maintenance material 221 bTLC = total labor costs consisting of operating labor, operating supervision and maintenance labor 222
223
Net production costs (NPC) 224
The net production costs (NPC) were calculated according to Equation (6). 225
𝑁𝑃𝐶 (€
𝑙) =
𝐴𝐶𝐶 + ∑𝑂𝑃𝐸𝑋𝑖𝑛𝑑 +∑𝑂𝑃𝐸𝑋𝑑𝑖𝑟 + ℎ𝑙𝑎𝑏𝑜𝑟 ∗ 𝑐𝑙𝑎𝑏𝑜𝑟
��𝑓𝑢𝑒𝑙 ∗ 𝜌𝑓𝑢𝑒𝑙−1 ∗
𝜔𝑓𝑢𝑒𝑙𝜔𝑟𝑒𝑓𝑒𝑟𝑒𝑛𝑐𝑒
(6)

12
The indirect OPEX are calculated based on data from Table 2. All levelized cost flows are normalized 226
with the annual fuel output ��𝑓𝑢𝑒𝑙 and fuel density 𝜌𝑓𝑢𝑒𝑙. In order to compare calculated NPC with fossil 227
reference fuels, the ratio of the energy density (ω in Equation (6)) is considered. 228
229
3. Case study – Techno-economic evaluation of sustainable Fischer-Tropsch fuels 230
The methodology presented in chapter 2 was applied on fuel production concepts based on Fischer-231
Tropsch (FT) synthesis, one option to produce alternative fuels from a large variety of feedstocks. 232
Fischer-Tropsch fuel production is a state-of-the-art process, which has been applied since 1925 [28], 233
though, initially with coal as feedstock. A large number of studies are available on the techno-economic 234
assessment of different sustainable FT routes using biomass as feedstock (Biomass-to-Liquid - BtL), 235
hydrogen and carbon dioxide as feedstock (Power-to-Liquid - PtL) and a combination of the PtL and 236
BtL concept (Power and Biomass-to-Liquid – PBtL). Various BtL concept designs with focus on 237
different gasification technologies based on low-temperature, cobalt-catalyzed FT-synthesis have been 238
analyzed in a superstructure approach by the groups of Tijmensen/Hamelinck/Faaij/van Vliet et al. 239
(Utrecht University) [29] [30] [31] and Haarlemmer/Peduzzi/Seiler et al. (CEA) [12] [11]. In the same 240
manner, Hannula and Kurkela et al. (VTT) investigated different process designs of fluidized bed 241
biomass gasifiers in combination with liquid transportation fuels by FT-synthesis and methanol-to-242
gasoline (MtG) [32] [33]. Kerdoncuff/Trippe et al. (KIT) published studies on the technical and 243
economic performance of the so-called bioliq® BtL process, in which biomass is pre-processed in 244
decentralized pyrolysis units and liquid fuels are produced in a large centralized plant by entrained flow-245
gasification and the FT or MtG synthesis [34] [35]. Worth mentioning are also the works of the groups 246
of Swanson/Becker/Braun et al. (NREL) [36] [37] [38] and Larson/Kreutz/Baliban/Floudas et al. 247
(Princeton University) [39] [40] [41], who published comprehensive economic studies on BtL and CtL 248
concepts with simultaneous electricity production and district heat supply. 249
On the contrary, only a few studies exist on the performance of PtL and PBtL concepts. Becker et al. 250
designed a PtL FT-process, where the syngas for cobalt-catalyzed low temperature Fischer-Tropsch 251
(LTFT) synthesis is supplied by high-temperature co-electrolysis of CO2 and H2O in a solid oxide 252

13
electrolyzer cell (SOEC) [38]. A similar approach was chosen by König et al, though, proton exchange 253
membrane (PEM) electrolysis is applied for H2 production and CO2 is activated and converted to CO in 254
a high-temperature reversible water-gas shift reactor [42] [22]. PBtL concepts typically stem from basic 255
BtL concepts, where hydrogen is added prior to the FT-synthesis in order to make redundant the water-256
gas shift reaction (e. g. Seiler et al. [43]) or a reverse water-gas shift reactor is used to realize a very high 257
carbon conversion by activating CO2, as published by Baliban et al. [41]. 258
Net production costs (NPC) of the mentioned studies vary in a wide range between 0.57 and 4.7 €/lGE 259
(liter gasoline equivalent) depending on the applied methodology, assumed raw material and equipment 260
costs, scale of plant, learning curve effects and other factors. To the author’s knowledge, no detailed 261
scientific study exists so far on a comparison of BtL, PtL and PBtL FT-concepts among each other in 262
terms of strengths and weaknesses as well as key economic parameters. In this work, the focus is both 263
on the technical and energetic performance (efficiencies, carbon conversion etc.) and on CAPEX, OPEX 264
and NPC. Furthermore, effects of economy of scale on NPC were investigated and an extensive 265
sensitivity analysis was carried out with TEPET in order to identify the most significant cost-drivers of 266
the three concepts. 267
3.1 Concept description and literature survey 268
Figure 3 shows the system boundaries and a simplified block flow diagram of three concepts marked as 269
PtL, BtL and PBtL. A distinction is made between chosen process options (blue color), interesting 270
alternative process options not considered (ochre color) and required process options outside the system 271
boundary (grey color). In order to decrease complexity of the illustration, the block flow diagram is 272
divided into a syngas supply and fuel synthesis system. 273
Regarding syngas supply, a carbon and a hydrogen source is required for liquid fuel production. In the 274
BtL concept, syngas is supplied solely by thermochemical conversion of biomass. Depending on the 275
nature and humidity of the biomass feedstock as well as the selected gasification technology, several 276
pre-treatment steps such as drying, grinding, pyrolysis or torrefaction are required [44]. The two last 277
mentioned processes aim to remove residual moisture from the biomass, to increase the energy density 278

14
and to ensure a better feedstock handling by producing a pumpable slurry (pyrolysis) or increasing 279
grindability (terrefaction). Currently, fixed-bed, fluidized bed and entrained flow gasifier are mainly 280
used for biomass gasification, though, only the two last mentioned offer the potential for scaled up in the 281
50 – 1,000 MWth range [45] [46] [47] [48]. 282
283
Figure 3: Block flow diagram and system boundary of BtL, PtL and PBtL concepts 284
In this study, entrained flow gasification was selected due to the better scale-up potential, the higher 285
technology readiness level and the lower methane and tar concentration in the raw gas due to the high 286
15
operation temperature of above 1100 °C. Entrained flow gasification requires an elaborate biomass pre-287
treatment, since a pumpable feedstock is required for the feed-in at elevated pressures (> 20 bar). Hence, 288
fast pyrolysis was selected as appropriate pre-treatment process in which biomass is mixed with hot sand 289
at a temperature of around 550 °C [35] [49] [50]. The solid and liquid product fraction is mixed to the 290
so-called slurry and utilized in the gasifier by partial oxidation of the feed using either air or oxygen as 291
oxidizer. Raw gas from gasification is rapidly cooled down by water quenching, whereby most particles 292
and impurities including most water-soluble pollutants such as hydrogen chloride and ammonia are 293
already removed [12]. Remaining char, dust particles and impurities such as H2S are separated and 294
removed from the wet syngas in an arrangement of cyclones, guard beds and filters. Another prospective 295
technology to reduce exergetic losses may be hot gas cleaning by for example high-temperature gas 296
filtration using ceramic filter media [51]. However, hot gas cleaning is not a proven technology and not 297
commercially available [30] and additional research efforts are required to achieve a high cleaning 298
effectiveness. 299
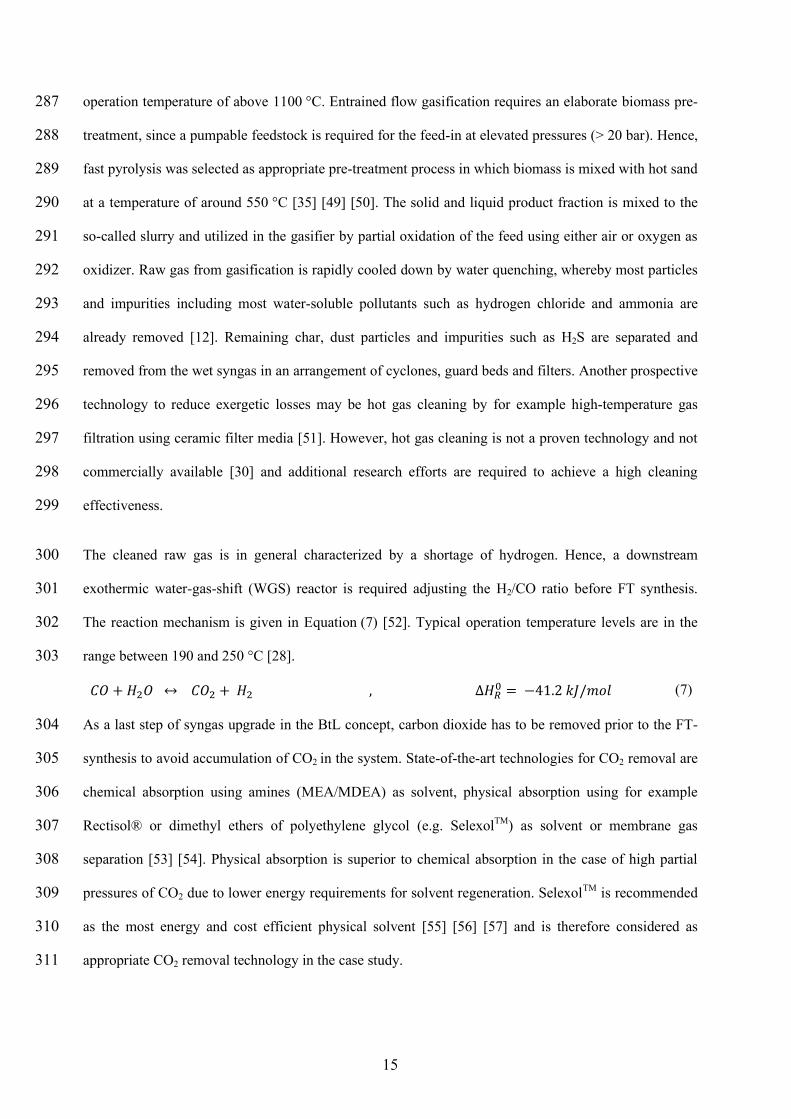
The cleaned raw gas is in general characterized by a shortage of hydrogen. Hence, a downstream 300
exothermic water-gas-shift (WGS) reactor is required adjusting the H2/CO ratio before FT synthesis. 301
The reaction mechanism is given in Equation (7) [52]. Typical operation temperature levels are in the 302
range between 190 and 250 °C [28]. 303
𝐶𝑂 + 𝐻2𝑂 ↔ 𝐶𝑂2 + 𝐻2 , ∆𝐻𝑅0 = −41.2 𝑘𝐽/𝑚𝑜𝑙 (7)
As a last step of syngas upgrade in the BtL concept, carbon dioxide has to be removed prior to the FT-304
synthesis to avoid accumulation of CO2 in the system. State-of-the-art technologies for CO2 removal are 305
chemical absorption using amines (MEA/MDEA) as solvent, physical absorption using for example 306
Rectisol® or dimethyl ethers of polyethylene glycol (e.g. SelexolTM
) as solvent or membrane gas 307
separation [53] [54]. Physical absorption is superior to chemical absorption in the case of high partial 308
pressures of CO2 due to lower energy requirements for solvent regeneration. SelexolTM
is recommended 309
as the most energy and cost efficient physical solvent [55] [56] [57] and is therefore considered as 310
appropriate CO2 removal technology in the case study. 311

16
Syngas in the PtL route is composed of hydrogen from water electrolysis and CO2 originating either 312
from industrial processes or air. The appropriate separation process depends on the CO2 concentration in 313
the feed stream. Adsorption, absorption or membrane technologies may be the most economic feasible 314
option. CO2 supply is not further discussed in this work, but will be a major topic in subsequent studies. 315
Common electrolysis technologies are alkaline electrolysis, PEM electrolysis and high-temperature 316
electrolysis with SOEC. The TRL level decreases significantly in that order [58]. This work focuses on 317
PEM electrolysis, because of the superior dynamic operation behavior offering the potential to connect 318
the device directly to fluctuating power sources. Carbon dioxide has to be activated and converted to CO 319
by the reverse water-gas-shift (rWGS) reaction at elevated operation temperature (>750°C) ensuring an 320
appropriate CO yield [52]. The rWGS reaction itself follows the reverse mechanism as shown in 321
Equation (7). An interesting prospective for syngas production is SOEC co-electrolysis as proposed by 322
Becker et al. [38] making redundant the rWGS reaction. Though, SOEC co-electrolysis is still at an 323
early development stage and additional research is required in order to reach market maturity. 324
The syngas supply in the PBtL concept is a combination of the BtL and PtL route. Raw gas from 325
biomass gasification is enriched with hydrogen before the rWGS reactor. No external carbon dioxide 326
and oxygen source is needed. Table 3 summarizes the main characteristics of the investigated concepts. 327
Table 3: Main characteristics of the three investigated concepts 328
Concept Carbon
source
Hydrogen
Source Syngas supply
Syngas
upgrade
Carbon
recycling
Power-to-Liquid (PtL) CO2 H2O CO2 separation
and electrolysis
rWGS Yes
Biomass & Power-to-Liquid
(PBtL)
Biomass H2O gasification and
electrolysis
rWGS Yes
Biomass-to-Liquid (BtL) Biomass Biomass/(H2O) gasification WGS No
The fuel production section is the same for all concepts and comprises a Fischer-Tropsch (FT) reactor 329
and a product separation and upgrading section. A reaction mechanism of the underlying polymerization 330
reaction in FT-synthesis is given in Equation (13) [41]. 331
𝑛 ∙ 𝐶𝑂 + 2𝑛 ∙ 𝐻2 → (−𝐶𝐻2 −)𝑛 + 𝑛 ∙ 𝐻2𝑂 , 𝑛 𝜖 ℕ , Δ𝐻𝑅0 = −𝑛 ∗ 152 𝑘𝐽 𝑚𝑜𝑙⁄ (8)

17
According to Equation (8), FT-synthesis requires a H2/CO ratio of above 2 in the feed stream. The FT-332
product, so-called syncrude, consists of a large variety of different species such as alkanes, alkenes, 333
alcohols, carbonyls and carboxylic acids. A good estimate of the syncrude carbon number distribution is 334
given by the Anderson-Schulz-Flory (ASF) distribution as shown in Equation (9) [28]. 335
𝑥𝑛 = (1 − 𝛼) ∙ 𝛼(𝑛−1)
(9)
The molar fraction 𝑥𝑛 of each product with carbon number n is related to the chain growth probability α, 336
which is a statistical measure predicting whether chain propagation or termination occurs. The chain 337
growth probability α depends on the reactor design, the operation conditions and the used catalyst. A 338
distinction is made between low temperature FT-synthesis (LTFT) with iron or cobalt based catalysts 339
and high temperature FT-synthesis (HTFT) based on primarily iron catalysts with typical temperature 340
conditions of 200 - 240 °C and 300 - 350 °C, respectively [28] [59] [60] [61]. HTFT is typically applied 341
for gas, olefins and gasoline production, whereas product distribution of LTFT has its maximum in the 342
kerosene, diesel or wax fraction. Three main reactor designs namely fixed bed, fluidized bed (circulating 343
and stationary) and slurry reactor are available. Strengths and weaknesses of FT designs are elaborately 344
discussed in the work of de Klerk [28]. Since it was aimed to maximize the liquid fuel output, LTFT in a 345
fixed bed reactor using a cobalt based catalysts was investigated in this work. In order to comply with 346
common fuel standards, further fuel treatments such as hydrocracking, catalytic reforming, 347
isomerization and alkylation are applied [28] [62] [63]. Beside product separation, only hydrocracking is 348
investigated in this work to convert the wax fraction into products with lower carbon number. 349
A light and a heavy gas fraction are obtained from product separation, which is referred to as recycle 350
and tail gas, respectively (see Figure 8 in SI). The recycle contains most of the unreacted educts, CO2 351
and methane, and is reused in the FT-synthesis (internal recycle) and rWGS (external recycle), 352
respectively [42, 28]. Thus, a higher carbon conversion along with a larger fuel output can be realized. 353
Since temperature of WGS is not sufficient high to reactivate methane and CO2, the BtL concept does 354
not have an external recycle. Tail gas is burned to cover the heat demand of the rWGS (PBtL and PtL) 355
or to produce electricity (BtL). As oxygen is available for free from electrolysis, oxy-fuel technology is 356

18
used in the PBtL and PtL concept. Off-gas from the oxy-fuel burner is recycled into the rWGS reactor, 357
which further increases total carbon conversion. 358
3.2 Process simulation model 359
Flowsheet models of each concept were implemented in Aspen Plus® software based on the Peng-360
Robinson equation of state with Boston-Mathias alpha function [24] [25], which is recommended for 361
hydrocarbon processing applications such as gas processing, refining and petrochemical processes [64]. 362
The plant capacities were initially estimated based on a predicted available specific biomass potential for 363
Germany. A biomass feed-in of 98.3 MWth was assumed for one BtL and PBtL plant (derivation can be 364
found in chapter C of the supplementary information). Two PtL models (so-called small/large) were 365
scaled such that a comparable fuel output was achieved corresponding to the BtL and PBtL model, 366
respectively. It was predicted that each X-to-liquid plant is three weeks offline per year due to 367
maintenance work resulting in a full load capacity factor of 𝑐𝑓𝑝𝑙𝑎𝑛𝑡 ≈ 0.943 or 8260 annual full load 368
hours. Heat losses in piping and most equipment were neglected. Pressure drops in every section were 369
roughly accounted for and modeled with an arrangement of valves and compressors. Subsequent, the 370
modelling approach and assumptions for main process steps are discussed in detail. Simplified process 371
flowsheets of the implemented models containing information on temperatures, pressures and mass 372
flows are supplied in the supplementary information chapter D. 373
PEM electrolysis 374
The PEM electrolysis unit was simply modeled by a splitter with a conversion factor (with regard to 375
water) of 67 % and operation conditions of 25 bar and 60 °C, respectively [65]. An energy demand of 376
4.3 kWh/Nm3 (H2) was used for electrolysis corresponding to an electrical efficiency (Power to LHVH2) 377
of approximately 70 % [58]. It was assumed that pure oxygen can be separated from the anode, which is 378
than available for the use of oxy-fuel technology. 379
380
381

19
Pyrolysis and gasification section 382
Biomass was modeled as non-conventional compound with the molecular formula C6H9O4 383
corresponding to lignocellulose in accordance with the work of Dahmen et al. [66]. Requisite pre-drying 384
and grinding of biomass was neither modeled nor considered in the economic calculations. Fast 385
pyrolysis was modeled based on a given yield distribution (yield reactor in Aspen Plus) for reaction 386
conditions of 1 bar and 500 °C. Biomass is assumed to decompose according to the mechanism shown in 387
Equation (10) (adapted from [66]). 388
𝐶6𝐻9𝑂4 + 0.69 𝐻2𝑂 + 7𝑔 𝐴𝑠ℎ⏟ 𝑤𝑒𝑡 𝑏𝑖𝑜𝑚𝑎𝑠𝑠
→ 𝐶5𝐻5.4𝑂1.1 + 7𝑔 𝐴𝑠ℎ + 2.11 𝐻2𝑂⏟ 𝑆𝑙𝑢𝑟𝑟𝑦
+ 0.35 𝐶𝑂 + 0.07 𝐻2 + 0.53 𝐶𝑂2 + 0.12 𝐶𝐻4 + 0.07 𝐻2𝑂⏟ 𝑃𝑦𝑟𝑜𝑙𝑦𝑠𝑖𝑠 𝑔𝑎𝑠
(10)
The slurry is separated from the pyrolysis gas in a flash arrangement. Heat for the endothermic pyrolysis 389
reaction is supplied by a burner running on a mixture of pyrolysis gas and air (BtL) or oxygen (PBtL), 390
which is modeled as a conversion reactor with known stoichiometry operating at 550 °C. The 391
gasification part was modeled with a series of reactors. Because of the high operating temperature in the 392
reactor, it is assumed that the produced syngas is in chemical equilibrium and that no tar is formed [67]. 393
The nonconventional slurry component is converted into conventional gases in a yield reactor. Final 394
syngas composition is calculated in a Gibbs reactor assuming total equilibrium at a pressure and 395
temperature level of 30 bar and 1,200 °C, respectively. Heat demand for the endothermic reaction is 396
covered by partial oxidation with pure oxygen. Syngas leaving the reaction chamber is quenched with 397
water at 15 °C, resulting in a syngas temperature of 180 °C. The subsequent gas cleaning devices 398
consisting of a cyclone (particle separation) and a number of guard beds (including ZnO beds for 399
removal of Sulphur compounds) were not modelled but considered in the economic calculations. 400
WGS and rWGS reactor 401
Both WGS and rWGS reactor were modeled using a Gibbs reactor, as thermodynamic equilibrium is 402
assumed [28] [68] [52]. WGS operation temperature was set to 230 °C to use the same water cooling 403
cycle as for the FT-synthesis based on a water jacket operating at 25 bar (evaporation temperature ≈ 224 404
20
°C). rWGS temperature was fixed to 900 °C due to the favorable conversion rate of CO2 at this 405
temperature level [52]. Heat demand is covered by an oxy-fuel burner running on tail gases from 406
product separation. Oxygen is delivered by the PEM electrolysis. The CO2 rich off-gas from the oxy-fuel 407
process is recycled in the rWGS reactor. Additional steam is added before the WGS reactor to avoid 408
catalyst coking [69]. The amount of steam injected prior the WGS and rWGS reactor was estimated 409
based on the thermodynamic carbon formation limits presented by Rostrup-Nielsen et al. [70] as a 410
function of the H/C and O/C ratios in the feed. Since hydrogen is not available in the BtL concept, a 411
small share of the hydrogen rich gas from the WGS reactor is send to a Pressure Swing Adsorption 412
(PSA) unit in order to provide hydrogen for the hydrocracker. CO2 is removed by a SelexolTM
unit 413
assuming a separation efficiency of 90 % [71] [53]. A component separator simulates the Selexol unit. 414
Power requirements were estimated using a specific electricity demand of 74 kJ/kgCO2,removed [30]. 415
FT reactor 416
A stoichiometric reactor simulates the Fischer-Tropsch synthesis. Only alkanes were considered as 417
product, which is a reasonable assumption as paraffinic compounds are the major products in low-418
temperature FT-synthesis (LTFT) with cobalt catalysts [72] [73]. Product mole fractions were calculated 419
according to Equation (9) based on α = 0.85, which corresponds to a typical chain growth probability of 420
LTFT with cobalt catalyst [42]. Though, the methane yield was adjusted to wn=1 = 0.12, as it was shown 421
based on the used experimental data that methane production was not well reflected by the ASF 422
distribution [74] [75]. Alkanes from CH4 to C30H62 as well as C32H66 and C34H70 were considered as 423
products. Operation temperature and pressure were set to 230 °C and 25 bar, respectively, and a per-pass 424
CO conversion of 40 % was assumed [28]. In order to avoid uncontrollable temperature peaks within 425
fix-bed FT reactors, the share of reactants (H2, CO) in the feed gas was limited to 50 % [42] by adjusting 426
the flow of the internal recycle. Cooling is provided by producing steam in a water jacket operating at 25 427
bar (evaporation temperature ≈ 224 °C). 428
Product separation and upgrading 429
Product recovery is modelled by a number of five serial flashes. In a first step, FT-Syncrude is cooled 430
down to 160 °C. Condensed waxen long hydrocarbons are further processed in a hydrocracker in order 431

21
to increase the kerosene and diesel yield. The hydrocracker operating at 350 °C and 60 bar is modeled as 432
a yield reactor with a defined product distribution adapted from [76]. The gaseous product stream is 433
further cooled in the following flashes with operating temperatures of 100 °C, 45 °C, 0 °C -30 °C, 434
respectively. Cooling of the last two flashes is provided by refrigeration systems working at evaporation 435
temperatures of -15 °C and -45 °C, respectively. Power demand of both refrigeration systems were 436
estimated based on a realistic COP estimation adapted from [16] (See chapter A in the supplementary 437
information). Gaseous components leaving the last flash consist of unreacted reactants (H2, CO), light 438
hydrocarbons (mainly CH4) as well as CO2 and are reused in the internal and external recycle. Though, 439
around 2 % of the recycle stream is sent to the burner in order to avoid accumulation of trace 440
components such as N2. The liquid product fraction is expanded to ambient pressure and tail gas is 441
collected and sent to the rWGS burner (PBtL and PtL concept) and gas turbine (BtL concept), 442
respectively. A total pressure drop of ∆p = 3 bar in the FT and separation section was assumed. 443
Heat integration 444
Heat integration was carried out by applying the pinch analysis method [18]. Required heating and 445
cooling streams were identified and composite curves were created. Based on the composite curves, heat 446
exchanger networks were designed to minimize external cooling and heating demand. A minimum pinch 447
point temperature of 15 °C, 30 °C and 40 °C was defined for heat exchanger with liquid/liquid, 448
liquid/gas and solely gaseous streams, respectively [17]. Excess waste heat including sensible heat of hot 449
gases and remaining fuel gas is than used to produce electricity (gas turbine in BtL concept, steam 450
turbine in PBtL and PtL concepts) as well as steam at different pressure levels (25 bar and 4 bar) and 451
district heat (100°C, 16 bar). Cooling in the temperature interval 30 °C to 90 °C is realized by using 452
river water at 15 °C. Electricity produced in the BtL concept is used to cover the internal demand. 453
Excess electricity is fed into the local power grid. A summary of assumptions used for the gas and steam 454
turbine process is given in chapter A of the supplementary information. 455
Definition of efficiencies 456
The performance of the three concepts was evaluated in terms of the X-to-Liquid and overall plant 457
efficiency as well as the carbon conversion rate, which are defined in Table 4. The X-to-Liquid 458

22
efficiency, determining the conversion efficiency from raw materials/utilities to fuel, comprises of the 459
energy content of the liquid FT-product (LHV) divided by all energy flows entering the system. In 460
contrast, the overall system efficiency also considers the by-products electricity (only in the BtL 461
concept) and useful heat (steam and district heat), which is reasonable in the case that a large heat 462
market exists in the vicinity of the plant (heat case). The carbon conversion defines which share of 463
carbon atoms entering the system with biomass and the CO2 feed ends up in the liquid fuel product. It is 464
an important measure to evaluate the maximum fuel yield from a given biomass or carbon dioxide 465
potential. 466
Table 4: Definition of process performance parameters 467
Name Formula
X-to-Liquid efficiency 𝜂𝑋𝑡𝐿 =��𝑃𝑅 ∙ 𝐿𝐻𝑉𝑃𝑅
��𝐵𝐼𝑂𝑀𝐴𝑆𝑆 ∙ 𝐿𝐻𝑉𝐵𝑖𝑜𝑚𝑎𝑠𝑠 + 𝑃𝑒𝑙𝑒𝑐 (11)
Overall plant efficiency 𝜂𝑃𝑙𝑎𝑛𝑡 =��𝑃𝑅 ∙ 𝐿𝐻𝑉𝑃𝑅 + 𝑃𝑒𝑙𝑒𝑐,𝑜𝑢𝑡 +∑ ��ℎ𝑒𝑎𝑡��𝐵𝐼𝑂𝑀𝐴𝑆𝑆 ∙ 𝐿𝐻𝑉𝐵𝑖𝑜𝑚𝑎𝑠𝑠 + 𝑃𝑒𝑙𝑒𝑐
(12)
Carbon conversion 𝜂𝐶 =��𝐶,𝑃𝑅
��𝐶,𝐵𝑖𝑜𝑚𝑎𝑠𝑠 + ��𝐶,𝐶𝑂2,𝑓𝑒𝑒𝑑 (13)
3.3 Assumptions for techno-economic evaluation 468
The techno-economic evaluation was conducted for the base year 2014 with all monetary flows given in 469
€2014. It was assumed that the plant operation time is 30 years and that all plants run 8260 full-load hours 470
per year. Data used for estimating equipment costs according to Equations (1) & (2) are summarized in 471
Table 5. Old cost data were updated to €2014. Cost data of standard equipment such as pumps, 472
compressors and heat exchangers are typically subject to uncertainties in the range between +/- 30 %, 473
whereas equipment costs of new or process specific technologies such as biomass gasifiers, electrolyzers 474
and FT-reactor are characterized by much larger level of uncertainty due to lack of sufficient reference 475
data. It shall be noted that some of the given equipment cost functions are simplified in order to make 476
the data comparable to reference values from scientific literature (see footnotes in Table 5). Total capital 477
expenditures were subsequent estimated by applying the ratio factors stated in Table 1. 478
479

23
Table 5: Used equipment costs data from TEPET database 1 Equipment costs in million €2014 480
ECref1 Sref Unit d Ref.
Burner 1.97 20 MW (heat duty) 0.83 [7]
Compressora 0.49 413 kW (power consumption) 0.68 [7]
Cyclone 0.05 1 m3/s (total gas flow) 0.7 [39]
EF-gasifier 103.65 78 t/h (slurry input) 0.7 [34]
Electrolyzerb 0.64 1 MW (installed capacity) 1 [77]
Evaporatora,c
0.93 1000 m2 (surface area) 0.54 [7]
Fast pyrolysis 5.98 14.3 t/h (biomass input) 0.7 [34]
Gas/liquid separatora,d
0.09 10 m (unit length) 0.79 [7]
FT reactor 17.62 208 m3 (reactor volume) 1 [31]
Gas-Turbine cycle 8.47 25 MW (power output) 0.7 [30]
Guard beds 0.02 8 m3/s (gas flow) 1 [34]
Heat exchangera,e
0.26 1000 m2 (surface area) 1 [7]
Hydrocracker 7.79 1.13 kg/s (feed mass flow) 0.7 [39] [38]
PSA 5.89 0.294 kmol/s (purge gas flow) 0.74 [39]
Pumpa,f
0.1 10 m3/s (liquid flow) 0.36 [7]
Refrigeration systema,g
1.06 500 kW (power consumption) 0.68 [7]
rWGS reactor 2.4 2556 t/day (total mass flow) 0.65 [39] [38]
Selexol unit 59.5 9909 kmol/h (CO2 in feed) 0.7 [30]
Steam turbinea 0.34 10.5 MW (power output) 0.44 [7]
WGS reactor 2.78 150 kg/s (total gas feed) 0.67 [78] a Equipment costs include additional material costs (material adjustment factor for stainless steel) 481 b Costs for Instrumentation and control, piping & electrical systems, buildings, services facilities and engineering and 482 construction expenses are already included in the given equipment costs 483 c Cost function with two input parameters (area, pressure). The stated cost function is based on a vertical tube evaporator 484 suitable for pressure level up to 10 bar 485 d Cost data for storage vessels were used. The cost function has three input parameters (vessel length, vessel diameter, 486 pressure). The stated cost function is an example based on a horizontal storage vessel with a diameter of 2 m at pressure levels 487 up to 10 bar 488 e Equipment costs for a flat plate heat exchanger. Data for tube & shell heat exchanger available in the TEPET database 489 f Cost function with two input parameters (flow rate, pressure). The stated cost function characterizes a centrifugal pump 490 suitable for pressure level up to 10 bar 491 g Cost function with two input parameters (capacity, evaporator temperature). The given example describes a refrigeration 492 system with an evaporation temperature of -29 °C 493 494 Applied market prices for raw materials and utilities are summarized in Table 6. Market prices were 495
already updated to 2014 by applying the World Bank Commodity Price Data (The Pink Sheet). 496
Additional indirect and direct OPEX were calculated based on the ratio factors 1-8 given in Table 2 for 497
fluid processing chemical plants according to [7]. Though, distribution and selling costs as well as 498
expenses for research and development were neglected, since the pure fuel production costs shall be 499
investigated. 500
Expenses for maintenance labor and material were predicted to be both 2 % of FCI. Required hours of 501
labor were estimated based on the total product output of the modelled plants and the number of key 502
process steps according to the work of Peters et al. [7] (see chapter B of the supplementary information). 503

24
Specific labor costs of clabor = 37 €/h were assumed corresponding to typical working costs in the 504
German petrol industry [88]. 505
Table 6: Applied market prices for raw materials, utilities and by-products 506
Raw material / utility / byproduct Market price (2014) Unit Ref.
Biomass (wet)a 97.4 €/t [79]
Clean water 2 €/m3 [65]
Cooling waterb 0.00125 €/m
3 [80]
CO2 37.75 €/t [81]
District heat (revenue) 0.04 kWh [82]
Electricity (from grid)c 105 €/MWh [83]
Electricity (to grid, revenue)d 58.5 – 136.6 €/MWh [84]
Low pressure steam (4 bar)e 25.7 €/t [85]
Medium pressure steam (25 bar)e 26.3 €/t [85]
Oxygenf 23.7 €/t [71]
Selexolg 4.4 €/kg [86]
Waste waterh 2.5 €/m
3 [87]
a Residual moisture = 10 wt% 507 b Cost for cooling water extraction from the Elbe river 508 c Electricity prices for industrial consumers in Germany with annual consumption in the range of >70,000 MWh. Recoverable 509 taxes and levies were not included. 510 d The revenue for exporting electricity in the BtL-concept is calculated based on the guaranteed feed-in tariffs according to the 511 German Renewable Energy Law. The feed-in tariffs for biomass based electricity are defined as follows: first 150 kW→ 512 13.66 €cent/kWh, up to 500 kW → 11.78 €cent/kWh, up to 5 MW → 10.55 €cent/kWh, up to 20 MW → 5.85 €cent/kWh. 513 e Revenue for selling steam was calculated by multiplying the energy needed to heat up water from 40°C to 150°C (low 514 pressure steam) and 225 °C (medium pressure steam) with the average natural gas price for large industrial customers in 515 Germany 2014 of 8.42 €/GJ [85]. Specific capital costs were assumed with 1 % for low pressure steam and 2 % for medium 516 pressure units. 517 f Oxygen from cryogenic methods based on the year 2013. The price was converted to € and updated to 2014 by using the non-518 energy index of the World Bank Commodity Price Data (The Pink Sheet). 519 g Selexol solvent cost from 2009. The price was converted to € and updated to 2014 by using the non-energy index of the World 520 Bank Commodity Price Data (The Pink Sheet). 521 h Waste water costs in Germany are typical in the range between 1.5 and 2 €. Slightly higher costs were assumed due to the 522 existence of hydrocarbons in the waste water and the therefore necessary pretreatment. 523 524
3.4 Model results 525
Stream tables of Aspen Plus simulations are available in chapter D of the SI. Main material and energy 526
flows as well as system efficiencies for the four investigated X-to-Liquid concepts are summarized in 527
Table 7. Streams consumed in the process have by definition a negative sign. Three characteristic 528
efficiencies namely X-to-Liquid, overall system (including byproducts steam and electricity) and carbon 529
conversion were calculated. Details on efficiency definitions are given in Table 4. 530
About 2.93 t/h and 11 t/h of liquid fuel are produced from 19.8 tdry/h biomass in the BtL and PBtL 531
concept, respectively. Thus, fuel output of BtL concepts was almost quadruplicated by adding hydrogen 532

25
to the synthesis. The FT-product has a density of 0.7 kg/l and lower heating value of 44 MJ/kg (30.8 533
MJ/l). A similar high X-to-Liquid efficiency was estimated for the PBtL and PtL concept, whereas the 534
BtL concept is characterized by a significant lower efficiency. Low temperature in the WGS reactor 535
inhibits methane and ethane conversion into syngas. As a consequence, large quantities of valuable tail 536
gas remain unused reducing the BtL XtL-efficiency. The reverse WGS in the PBtL and PtL design runs 537
at sufficient high temperatures to reform the tail gas completely. 538
Table 7: Energy flows and performance characteristics of the investigated X-to-Liquid concepts 539
Material flows [kt/a] BtL PBtL PtL (Small/Large)
Biomass -181.7 -181.7 -
CO2 - - -74.8 / -282.5
Clean water
-709.9 -900 -252.6 / -953.9
Cooling water -10,548 -59,713 -12,417 / -46,876
Waste water 780.9 883.4 131.1 / 496.6
Oxygen -76.1 100.4 83.7 / 316.3
Liquid fuel 24.2 91.3 24.2 / 91.2
Energy flows [MW]
Electricity 12.4 -164.6 -70.7 / -267.1
Biomass -98.3 -98.3 0
Steam 25 bar 18.1 20.7 9 / 33.7
Steam 4 bar 1.8 0 0
District heating 13.2 15 2.5 / 9.5
Fuel output 35.7 135.1 35.8/ 134.9
Efficiencies
X-to-Liquid 36.3 % 51.4 % 50.6 %
Overall plant 82.6 % 65.0 % 66.8 %
Carbon conversion 24.9 % 97.7 % 98 %
540 Results of heat integration are exemplarily shown for the BtL concept in terms of the composite curves 541
(Figure 4) and the final composite curves taking into account steam and heat exports as well as heat 542
exchange with the environment ( 543
Figure 5). It shall be noted that tail gas and remaining pyrolysis gas are utilized in a gas turbine cycle. 544
The hot turbine exhaust gas is than included in the heat integration. Composite curves for the PBtL and 545
BtL concepts are available in chapter A of the supplementary information. 546

26
547
Figure 4: Composite curves of the BtL model 548
The BtL process is very exothermic with significant isothermal heat integration potentials at 230 °C 549
(WGS and FT-Reactor) and ≈ 80 °C (condensation of off-gases from the gas turbine cycle). The pinch 550
point is located at 320 °C at the end of the cold composite curve. Hence, only external cooling is 551
required. Heat integration reveals a significant potential for the production of steam at 25 bar and 4 bar 552
as well as district heat. A very efficient heat exchanger design was found and implemented as shown in 553
the final composite curve ( 554
Figure 5) resulting in an overall plant efficiency of close to 83 %. Results of the heat integration of the 555
PBtL and PtL model in terms of produced steam and district heat are given in Table 7. 556
557
Figure 5: Balanced composite curves after heat integration 558
-100
0
100
200
300
400
500
600
0 10 20 30 40 50 60
Tem
pe
ratu
re [
°C]
Heat duty [MW]
Hot composite curve Cold composite curve
Reactor cooling(WGS, FT)
Condensation (exhaust gases from gas turbine)
External cooling demand ( ≈ 43 MW)
-100
0
100
200
300
400
500
600
0 10 20 30 40 50 60
Tem
pe
ratu
re [
°C]
Heat duty [MW]
Hot compisite curve Cold composite curve
Steam 25 bar
Steam 4 bar
District heatingCooling water
Refrigeration
composite curve

27
The overall plant efficiency of the BtL system is superior compared to the other concepts. This is due to 559
the fact that tail gas and other by-products are already utilized in the burner to cover the high 560
temperature heat demand of the endothermic rWGS reaction in the PBtL and PtL concept, thus reducing 561
the amount of produced steam and district heat. Furthermore, waste heat from PEM electrolysis arises at 562
a temperature below 90 °C offering a negligible heat integration potential. 563
Carbon is almost completely converted in the PBtL and PtL concepts due to the recycling of CO2 rich 564
off-gases from the oxy-fuel burner. Minor carbon amounts are lost due to a small required purge stream. 565
In the BtL plant, CO2 has to be removed before FT-synthesis in the SelexolTM
unit. Furthermore, off 566
gases from the gas turbine cannot be further used. Thus, only one quarter of the carbon intricately stored 567
in biomass is converted to precious biofuels. 568
3.5 Economic results from TEPET 569
3.5.1 Fuel net production costs (NPC) 570
TEPET allows the automated calculation of total CAPEX and OPEX directly from process simulation 571
results according to the previous presented methodology. A detailed summary of equipment costs and 572
operational expenditures is provided in chapter E in the supplementary information. Total fuel net 573
production costs for the four investigates X-to-liquid cases are summarized in Table 8 broken down in 574
CAPEX, direct and indirect OPEX. Thereby, a distinction is made between a standard case assuming 575
that no district heat and steam can be sold and a heat case assuming that all heat can be exported. 576
Table 8: Fuel net production costs of investigated X-to-Liquid concepts 577
X-to-Liquid concept BtL PtL PBtL PtL
Plant capacity [t/h] 2.9 2.9 11 11
CAPEX [€/lGE]a 0.95 0.46 0.48 0.43
Direct OPEX [€/lGE] 0.45 1.90 1.29 1.90
Indirect OPEX [€/lGE] 0.94 0.49 0.47 0.41
NPC [€/lGE] 2.34 2.85 2.24 2.74
NPC (heat case) [€/lGE] 2.05 2.75 2.15 2.64 a GE = Gasoline equivalent based on a typical energy density of gasoline of 32 MJ/l. Thus, one liter of FT-product has the same 578 energy content as 0.96 l of standard gasoline. 579 580

28
Figure 6 shows a detailed breakdown of NPC for the case without heat market. NPC rises from the PBtL 581
to the BtL plant and further to the large and small scale PtL plant, as shown in Figure 6. The poor 582
performance of the PtL plants is primarily due to the high expenses for raw materials and utilities (direct 583
OPEX), which accounts for approximately 67 % of total fuel costs. Purchase costs for electricity are by 584
far the largest cost factor both in the PBtL and PtL concept. Lower electricity demand in the PBtL plant 585
due to utilization of high energy syngas from biomass gasification explains the lower specific direct 586
OPEX. Expenses on other raw materials such as CO2 and biomass seem to be negligible. 587
588 Figure 6: Fuel net production costs broken down by mayor cost factors 589
Although CAPEX of the PEM electrolysis unit accounts for more than 60 % of total CAPEX costs in the 590
PtL cases, the total share on the fuel production costs is less than 8 %. The same applies for the PBtL 591
plant, where electrolyzer and gasifier together make up 60 % of CAPEX. On the contrary, the BtL plant 592
is characterized by a different cost structure, where direct OPEX accounts for only 20 % and CAPEX for 593
around 37 % of the fuel price. Capital costs for the gasifier are the second largest cost factor behind 594
biomass costs accounting for approximately 18 % of the total fuel production costs. Taking into account 595
revenues from heat sale (heat case), NPC was slightly reduced by 9-10 €ct/l and 29 €ct/l in the PBtL/PtL 596
and BtL concepts, respectively. This indicates that a local heat market offers a low cost reduction 597
potential below 4 % for PBtL and PtL plants, whereas heat sales significantly reduce NPC in the BtL 598
case. 599
29
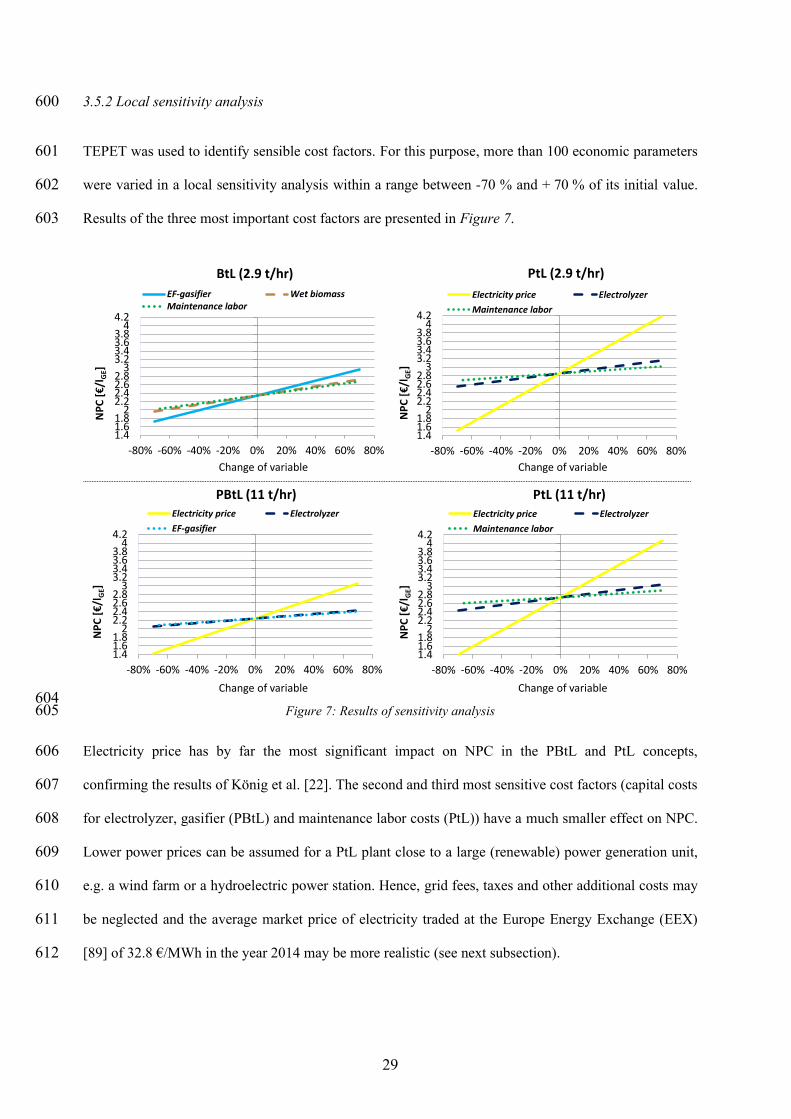
3.5.2 Local sensitivity analysis 600
TEPET was used to identify sensible cost factors. For this purpose, more than 100 economic parameters 601
were varied in a local sensitivity analysis within a range between -70 % and + 70 % of its initial value. 602
Results of the three most important cost factors are presented in Figure 7. 603
604 Figure 7: Results of sensitivity analysis 605
Electricity price has by far the most significant impact on NPC in the PBtL and PtL concepts, 606
confirming the results of König et al. [22]. The second and third most sensitive cost factors (capital costs 607
for electrolyzer, gasifier (PBtL) and maintenance labor costs (PtL)) have a much smaller effect on NPC. 608
Lower power prices can be assumed for a PtL plant close to a large (renewable) power generation unit, 609
e.g. a wind farm or a hydroelectric power station. Hence, grid fees, taxes and other additional costs may 610
be neglected and the average market price of electricity traded at the Europe Energy Exchange (EEX) 611
[89] of 32.8 €/MWh in the year 2014 may be more realistic (see next subsection). 612
1.41.61.8
22.22.42.62.8
33.23.43.63.8
44.2
-80% -60% -40% -20% 0% 20% 40% 60% 80%
NP
C [€
/lG
E]
Electricity price Electrolyzer
Maintenance labor
1.41.61.8
22.22.42.62.8
33.23.43.63.8
44.2
-80% -60% -40% -20% 0% 20% 40% 60% 80%
NP
C [€
/lG
E]
EF-gasifier Wet biomassMaintenance labor
BtL (2.9 t/hr) PtL (2.9 t/hr)
PBtL (11 t/hr) PtL (11 t/hr)
1.41.61.8
22.22.42.62.8
33.23.43.63.8
44.2
-80% -60% -40% -20% 0% 20% 40% 60% 80%
NP
C [€
/lG
E]
Electricity price Electrolyzer
Maintenance labor
1.41.61.8
22.22.42.62.8
33.23.43.63.8
44.2
-80% -60% -40% -20% 0% 20% 40% 60% 80%
NP
C [€
/lG
E]
Electricity price Electrolyzer
EF-gasifier
Change of variable Change of variable
Change of variable Change of variable
30
Capital costs for the gasifier are the most sensible BtL cost factor, followed by the biomass price and 613
maintenance labor costs. A 70 % reduction of gasifier purchased costs results in 26 % lower fuel 614
production costs of 1.72 €/lGE. This highlights the continuous gasifier research need. 615
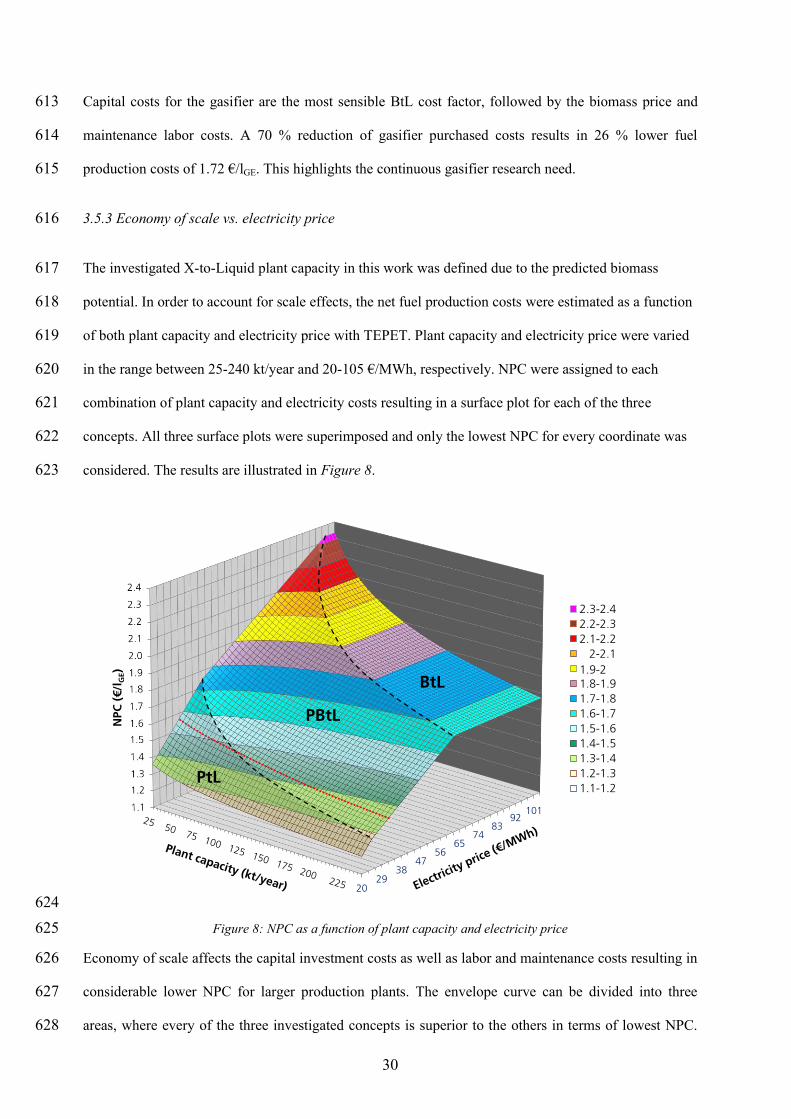
3.5.3 Economy of scale vs. electricity price 616
The investigated X-to-Liquid plant capacity in this work was defined due to the predicted biomass 617
potential. In order to account for scale effects, the net fuel production costs were estimated as a function 618
of both plant capacity and electricity price with TEPET. Plant capacity and electricity price were varied 619
in the range between 25-240 kt/year and 20-105 €/MWh, respectively. NPC were assigned to each 620
combination of plant capacity and electricity costs resulting in a surface plot for each of the three 621
concepts. All three surface plots were superimposed and only the lowest NPC for every coordinate was 622
considered. The results are illustrated in Figure 8. 623
624
Figure 8: NPC as a function of plant capacity and electricity price 625
Economy of scale affects the capital investment costs as well as labor and maintenance costs resulting in 626
considerable lower NPC for larger production plants. The envelope curve can be divided into three 627
areas, where every of the three investigated concepts is superior to the others in terms of lowest NPC. 628
2029
3847
5665
7483
921011
1.1
1.2
1.3
1.4
1.5
1.6
1.7
1.8
1.9
2
2.1
2.2
2.3
NPC
(€/l
GE)
2.2-2.3
2.1-2.2
2-2.1
1.9-2
1.8-1.9
1.7-1.8
1.6-1.7
1.5-1.6
1.4-1.5
1.3-1.4
1.2-1.3
1.1-1.2
1-1.1
PBtL
BtL
PtL
2.3-2.4
2.2-2.3
2.1-2.2
2-2.1
1.9-2 1.8-1.9
1.7-1.8
1.6-1.7
1.5-1.6
1.4-1.5
1.3-1.4
1.2-1.3
1.1-1.2

31
NPC of BtL plants is not dependent on electricity prices, since no external electricity source is needed. 629
Thus, the BtL concept is favorable at high electricity prices independent of the plant scale. However, 630
one shall keep in mind that plant capacity is strictly limited by the biomass availability. With decreasing 631
power costs, the higher system efficiency along with increased carbon conversion results in lowest 632
production costs in the PBtL concept. The PtL concept is superior at power costs below approximately 633
38 €/MW and biomass cost at 97.4 €/twet reaching fuel production costs below 1.40 €/lGE for large PtL 634
plants. The slope of the envelope curve with regards to the power costs is steepest for the PtL concept. 635
Figure 8 indicates the most economic feasible concept due to any given electricity price at fixed biomass 636
cost. At an electricity price of 32.8 €/MWh (EEX Phelix marked as dotted red line in Figure 8), the PtL 637
concept is favorable for small scale plants with an annual fuel output up to 70 kt/year, whereas PBtL 638
plants are more profitable for plants with larger fuel output. 639
3.5.4 Comparison with scientific literature 640
Results of previous techno-economic studies on BtL Fischer-Tropsch concepts have already been 641
compared in detail by Haarlemmer et al. [12]. Relevant studies had been normalized, as far as possible, 642
to a plant capacity of 400 MWth (LHV biomass) and cost data was updated to €2011. CAPEX between 643
300 and 1100 M€ and fuel production costs in the range of 0.80-1.65 €2011/l were reported for the 2σ 644
interval (95.8 % of all studies), though, the authors expected realistic results to be closer to the upper 645
limit. When scaling results of this study in the same way, CAPEX of 990 and 995 M€2014 along with 646
NPC of 1.75 and 1.40 €2014/l were estimated for the base case and heat case, respectively. It shall be 647
noted that the currency basis is still €2014 and that NPC will be slightly lower in a €2011 calculation. In 648
general, results are within the typical range, though, closer to the upper limit of the ranges given for 649
CAPEX and NPC. 650
Only a few studies have so far been published on PtL and PBtL Fischer-Tropsch concepts. Becker et al. 651
[38] reported NPC between 0.83 and 2.83 €2009/lGE for a SOEC PtL plant (Electricity input 54.4 MW) 652
based on various electricity prices (range: 0-105 €2009/kWh), capacity factors (range: 40-90 %) and CO 653
conversion rates in the FT reactor (range: 70-90 %). Applying the particular assumptions used in this 654

32
work results in NPC of approximately 2.56 €2014/lGE. This is in good agreement with the results presented 655
in the case study. The slightly lower NPC arises first of all due to lower assumed specific electrolyzer 656
costs of around 300 €2014/kWinstalled_capacity. König et al. [22] reported NPC of 3.39 €2014/lGE for a 1.5 657
GWelectrical PEM PTL plant running on green electricity (140 €/MWh). When recalculating NPC with a 658
power price of 105€/MWh, NPC is reduced to 2.77 €2014/lGE, which is in line with our results. 659
Baliban et al. [41] published a techno-economic study on a 780 t/day PBtL FT plant assuming different 660
electricity prices in the range between 25-70 €/MWh. No fuel net production costs were reported, but it 661
was stated that economic feasibility is reached at a break even crude oil price between 100 and 150 662
$2010/bbl. However, a reasonable value for NPC cannot be derived from the given information. 663
Seiler et al. [43] estimated NPC of 0.95 €2010/l for a PBtL FT plant with a capacity of 1.43 GWth (LHV 664
biomass ≈ 300 tdry/h) and electricity costs of 45 €/MWh. The amount of hydrogen added prior to the 665
FT-synthesis as well as capital costs of the gasifier and electrolyzer are not included in the paper. 666
Recalculating NPC considering the same capacity and electricity price results in NPC of 1.29 €2014/l for 667
this study. The reasons for the discrepancy cannot be given due to a lack of information on the cost 668
calculation methodology in the reference paper. 669
3.6 Summary of results 670
An X-to-Liquid efficiency of 36.3 %, 51.4 % and 50.6 % was estimated for the BtL, PBtL and PtL plant, 671
respectively. Predicting an unlimited heat market, overall system efficiency up to 82 % can be obtained. 672
Though, selling steam and district heat result in only slightly lower fuel costs. Carbon conversion rates 673
close to 98 % were achieved in the PBtL and PtL plant by using oxy-fuel technology and recycling tail 674
gas and exhaust gases in the rWGS reactor. With a biomass supply of 181.6 kt/a, about 24 kt/a and 91 675
kt/a of renewable fuel can be produced with the BtL and PBtL concept, respectively. Hence, fuel output 676
was increased by a factor of 3.75 in the PBtL plant. Assuming an electricity price of 105 €/MWh, fuel 677
net production costs from 2.24 €/l to 2.81 €/l were calculated, whereby the PBtL concept is 678
characterized by the lowest NPC. All fuel production costs are significant higher compared to fossil 679
reference fuels. High direct OPEX diminish the economy of scale effect on NPC of PBtL and PtL plants 680

33
with fuel outputs larger than 20 kt/a. On the contrary, CAPEX and indirect OPEX make up 80 % of 681
NPC in the BtL concept. Thus, up-scaling of a BtL plant is attractive from an economic point of view, 682
although plant capacity is typically limited by the local biomass availability. 683
3.7 Discussion 684
With the exception of the electrolyzer and the rWGS reactor, all X-to-Liquid concepts are based on 685
standard available technologies. Though, the applied cost data is subject to uncertainty due to a lack of 686
pilot plants and experience with green FT-plants. Furthermore, capital costs of novel technologies are 687
hard to predict, since experience curve effects are often unknown. The same applies for ratio factors 688
adapted from best practice estimates from the chemical industry, which are used in the case study to 689
estimate indirect costs such as maintenance and installation costs as a fraction of fixed capital 690
investment. This bears the risk to overestimate indirect costs, since capital costs of novel technologies 691
are significantly higher compared to standard equipment used in state-of-the-art chemical processes. 692
More research is required to estimate realistic cost factors for novel fuel production processes. 693
The implemented flowsheet models of the BtL, PBtL and PtL concepts comprise of all key process steps 694
required for the production of green FT-fuels. However, some auxiliary systems such as the refrigeration 695
systems or the CO2 capture unit were handled as a black box or even neglected such as biomass pre-696
drying. It shall be noted that a further optimization potential for heat integration exists when including 697
these devices in the flowsheet models, especially, since results from the case study show that all 698
concepts are characterized by a great surplus of heat. Further optimization potentials regarding auxiliary 699
systems as well as promising process alternatives (e.g. hot gas cleaning, hot-temperature electrolysis 700
SOEC) will be investigated at a later stage in terms of an exergoeconomic optimization in order to 701
identify the most economic feasible process designs. 702
4 Conclusion 703
The presented standardized methodology for the techno-economic analysis with the software-tool 704
TEPET enables the assessment of different alternative fuel production concepts based on similar 705
technical and economic assumptions and boundary conditions. Results can be used to identify 706

34
weaknesses and strengths of each concept. Furthermore, economic cost saving potential can be 707
quantified. As a consequence, the methodology allows process optimization from an economic point of 708
view. The results can be used within political and commercial decision making processes to identify 709
appropriate technical solutions for given boundary conditions. 710
Results from the case study indicate that electricity price is the largest cost driver and most sensible cost 711
factor in both the PBtL and PtL FT concept. Significant lower electricity prices neglecting grid fees, 712
taxes and other transmission costs results in lower and more competitive NPC below 1.40 €/lGE. Capital 713
costs for the biomass gasifier are the most sensible cost factor in the BtL concept. The results from 714
techno-economic evaluation can be used to identify the most cost efficient plant concept for a given 715
plant capacity and electricity price. Calculated fuel net production costs correspond with results of 716
previous published techno-economic studies on BtL, PtL and PBtL concepts. 717
718
719
720
721
722
723
724

35
ACKNOWLEDGMENT 725
Financial support from the Helmholtz Association is gratefully acknowledged. This work is part 726
of the program “Storage and Cross-Linked Infrastructures” and the DLR project “Future Fuels”. 727
ABBREVIATIONS 728
729
ACC Annualized capital cost 730
ASF Anderson-Schulz-Flory distribution 731
BtL Biomass-to-Liquid 732
CAPEX Capital expenditures 733
CEA Commissariat à l’énergie atomique et aux énergies alternatives 734
CEPCI Chemical Engineering Plant Cost Index 735
CPI Commodity price index 736
CtL Coal-to-Liquid 737
DME Dimethyl Ether 738
EC Equipment costs 739
EEX European Energy Exchange 740
FCI Fixed capital investment 741
FT Fischer-Tropsch 742
GE Gasoline equivalent 743
GHG Greenhouse gas 744
GtL Gas-to-Liquid 745
HEFA Hydro-processed esters and fatty acids 746
HTFT High-temperature Fischer-Tropsch 747
IR Interest rate (%) 748
KIT Karlsruhe Institute of Technology 749
LTFT Low-temperature Fischer-Tropsch 750
LHV Lower heating value 751
MtG Methanol-to-Gasoline 752
NPC Net production costs 753
NREL National Renewable Energy Laboratory 754
OL Operating labor 755
OPEX Operational expenditures 756
PBtL Power and Biomass-to-Liquid 757
PEM Proton exchange membrane 758
PO Plant overhead costs 759
PSA Pressure swing adsorption 760
PtL Power-to-Liquid 761
rWGS Reverse water gas shift 762
SI Supplementary information 763
SOEC Solid oxide electrolyzer cell 764
TCI Total capital investment 765
TEE Techno-economic evaluation 766
VTT Technical Research Centre of Finland 767
768
769
770
771
772

36
GREEK LETTERS & VARIABLES 773
774
α Chain growth probability 775
𝜌 Density (kg/m3) 776
ω Energy density (MJ/l) 777
𝛾BM Biomass yield (t/(km2 year)) 778
𝜂𝐶 Carbon conversion 779
𝜂𝑃𝑙𝑎𝑛𝑡 Overall plant efficiency 780
𝜂𝑋𝑡𝐿 X-to-Liquid efficiency 781
782
c Cost of raw materials, utilities, power, heat 783
cfplant Capacity factor of X-to-Liquid plant 784
clabor Labor costs (€/h) 785
di Digression factor of unit i 786
Epower Power consumption/production (MWh) 787
fi Equipment cost function of unit i 788
Feco Ratio factors for estimating FCI 789
Fmat Multiplier for material related equipment costs 790
Fpre Multiplier for pressure related equipment costs 791
hlabor Total working hours 792
∆𝐻𝑅0 Standard enthalpy of reaction (kJ mol⁄ ) 793
i,k,m,o Control variables 794
Li Learning rate of unit i 795
m Mass flow (t h⁄ ) 796
n Number of produced units 797
p Pressure (bar) 798
P Power (MW) 799
r Radius (km) 800
Si,k kth
input variable of cost function of unit i 801
T Temperature (°C) 802
W Heat export (MWh) 803
w Mass fraction 804
x Molar fraction 805
y plant operation time (years) 806

37
REFERENCES 807
808
[1] European Union, EU transport in figures - statistical pocketbook 2015, Luxembourg:
publication office of the European Union, 2015.
[2] International Energy Agency, "CO2 emissions from fuel combustion," IEA Publications,
Paris, 2014.
[3] The European Parliament and the Council of the European Union, "Directive 2009/30/EC
of the European Parliament and of the Council," Official Journal of the European Union,
pp. 88-113, 2009.
[4] The European Parliament and the Council of the European Union, "Directive 2009/28/EC
of the European Parliament and of the Council," Official Journal of the European Union,
pp. 16-62, 2009.
[5] The European Parliament and the Council of the European Union, "Directive (EU)
2015/1513 of the European Parliament and of the Council of 9 September 2015," Official
Journal of the European Union, pp. 1-29, 2015.
[6] J. Hileman and R. W. Stratton, "Alternative jet fuel feasibility," Transport Policy, pp. 52-
62, 34 (2014).
[7] M. Peters, K. Timmerhaus and R. West, Plant design and economics for chemical
engineers, New York, United States: McGraw-Hill, 2004, ISBN 007-124044-6.
[8] G. Ulrich and P. Vasudevan, Chemical Engineering Process Design and Economics: A
Practical Guide - 2nd edition, CRC Press Inc, 2004, ISBN 978-0970876829.
[9] R. Smith, Chemical process design and integration, Chichester: John Wiley & Sons, Ltd,
2005, ISBN 0-471-48680-9.
[10] R. Turton, R. Bailie, W. Whiting, J. Shaeiwitz and D. Bhattacharyya, Analysis, Synthesis
and Design of Chemical Processes - 4th edition, Prentice Hall, 2012, ISBN 978-0-1326-
1812-0.
[11] G. Haarlemmer, G. Boissonnet, E. Peduzzi and P.-A. Setier, "Investment and production
costs of synthetic fuels - A literature survey," Energy, no. 66, pp. 667-676, 2014.
[12] G. Haarlemmer, G. Boissonnet, J. Imbach, P.-A. Setier and E. Peduzzi, "Second generation
BtL type biofuels – a production cost analysis," Energy & Environmental Science, no. 5,
pp. 8445-8456, 2012.
[13] P. Cheali, "Synthesis and design of optimal biorefinery - PhD thesis," Technical University
of Denmark (DTU), Copenhagen, 2015.
[14] W. Wu, C. Henao and C. Maravelias, "A superstructure representation, generation, and
modeling framework for chemicalprocess synthesis," AIChE J., no. 62, pp. 3199-3214,
2016.
38
[15] L. Kong, S. Sen, C. Henao, J. Dumesic and C. Maravelias, "A superstructure-based
framework for simultaneous process synthesis, heat integration, and utility plant design,"
Computers and Chemical Engineering, no. 91, pp. 68-84, 2016.
[16] S. Towler and R. Sinnott, Chemical engineering design, Burlington: Elsevier Inc., 2008.
ISBN:978-0-7506-8423-1.
[17] A. Bejan, G. Tsatsaronis and M. Moran, Thermal design & optimization, Toronto: John
Wiley & Sons, 1996, ISBN 978-0-471-58467-4.
[18] I. C. Kemp, Pinch analysis and process integration, second edition, Elsevier Ltd., 2007,
ISBN 978-0-7506-8260-2 .
[19] Association of the Advancement of Cost Engineering, "Cost estimate classification system
- as applied in engineering, procurement, and construction for the process industries,"
AACE International, Morgantown, 2011.
[20] U.S. Department of Energy; National Energy Technology Laboratory, "Technology
learning curve (FOAK to NOAK)," 2013.
[21] R. D. Stewart, R. M. Wyskida and J. D. Johannes, Cost estimators reference manual,
second edition, John Wileyand Sons, 1995, ISBN 978-0-4713-0510-1.
[22] D. H. König, M. Freiberg, R.-U. Dietrich and A. Wörner, "Techno-economic study of the
storage of fluctuating renewable energy in liquid hydrocarbons," Fuel, pp. 289-297, 2015.
[23] S. Martin, F. G. Albrecht, P. v. d. Veer, D. Lieftink and R.-U. Dietrich, "Evaluation of on-
site hydrogen generation via steam reforming of biodiesel: Process optimization and heat
integration," International Journal of Hydrogen Energy, vol. 41, pp. 6640-6652, 2016.
[24] Beeland Management Company, "Rogers International Commodity Index®," 2015.
[Online]. Available: http://www.rogersrawmaterials.com/home.asp. [Accessed 11 03
2016].
[25] The World Bank, "World Bank Commodity Price Data (The Pink Sheet)," 2016.
[26] Deutscher Bundestag, "Gesetz zur grundlegenden Reform des Erneuerbare-Energien-
Gesetzes und zur Änderung weiterer Bestimmungen des Energiewirtschaftsrechts,"
Bundesanzeiger Verlagsgesellschaft mbH, Köln, 2014 (in German).
[27] Federal Statistical Office of Germany, Statistisches Jahrbuch 2014 - 14 - Verdienste und
Arbeitskosten, Wiesbaden: Statistisches Bundesamt, 2014; ISBN: 978-3-8246-1037-2.
[28] A. d. Klerk, Fischer-Tropsch refining, Weinheim, Germany: Wiley-VCH Verlag & Co.
KGaA, 2011, ISBN 978-3523-2605-1.
[29] M. Tijmensen, A. Faaij, C. Hamelinck and M. v. Hardeveld, "Exploration of the
possibilities for production of Fischer Tropsch liquids and power via biomass
gasi%cation," Biomass & Bioenergy, no. 23, pp. 129-152, 2002.
[30] C. N. Hamelinck, Outlook for advanced biofuels, Utrecht: Utrecht University Repository,

39
2004.
[31] O. van Vliet, A. Faaij and W. Turkenburg, "Fischer-Tropsch diesel production in a well-to-
wheel perspective: A carbon, energy flow and cost analysis," Energy Conversion
Management, vol. 50, pp. 855-876, 2009.
[32] I. Hannula and E. Kurkela, Liquid transportation fuels via large-scale fluidized-bed
gasification of lignocellulosic biomass, Espoo: VTT Technical Research Centre of Finland,
2013.
[33] I. Hannula, "Co-production of synthetic fuels and district heat from biomass residues,
carbon dioxide and electricity: Performance and cost analysis," Biomass and Bioenergy,
no. 74, pp. 26-46, 2015.
[34] P. Kerdoncuff, Modellierung und Bewertung von Prozessketten zur Herstellung von
Biokraftstoffen der zweiten Generation - Ph.D. thesis, Karlsruhe: Universitätsverlag
Karlsruhe, 2008 (in German).
[35] F. Trippe, "Techno-Ökonomische Bewertung Alternativer Verfahrenskonfigurationen zur
Herstellung von Biomass-to-Liquid (BtL) Kraftstoffen und Chemikalien, Dissertation,"
KIT Scientific Publishing, Karlsruhe, 2013 (in German).
[36] R. Swanson, A. Platon, J. Satrio and R. Brown, "Techno-economic analysis of biomass-to-
liquids production based on gasification," Fuel, no. 89, pp. 11-19, 2010.
[37] National Renewable Energy Laboratory (NREL), "Techno-economic analysis of biofuels
production on gasification," Golden, 2010.
[38] W. Becker, R. Braun, M. Penev and M. Melaina, "Production of Fischer-Tropsch liquid
fuels from high temperature solid oxide co-electrolysis units," Energy, pp. 99-115, 2012.
DOI:10.106/j.energy.2012.08.047.
[39] E. D. Larson, H. Jin and F. E. Celik, "Gasification-based fuels and electricity production
from biomass, without and with carbon capture and storage," Princeton University,
Princeton, 2005.
[40] T. Kreutz, R. Williams, S. Consonni and P. Chiesa, "Co-production of hydrogen,
electricity andCO2 from coal with commercially ready technology. Part B: Economic
analysis," International Journal of Hydrogen Energy, no. 30, pp. 769-784, 2005.
[41] R. Baliban, J. Elia and C. Floudas, "Toward novel hybrid biomass, coal, and natural gas
processes for statisfying current transportation fuel demands: 1: Process alternatives,
gasification modeling, process simulation and economic analysis," Ind. Eng. Chem. Res.,
no. 49, pp. 7343-7370, 2010. DOI: 10.1021/ie100063y.
[42] D. König, N. Baucks, G. Kraaij and A. Wörner, "Entwicklung und Bewertung eines
Verfahrenskonzeptes zur Herstellung flüssiger Kohlenwasserstoffe unter Nutzung von
CO2," Chemie Ingenieur Technik, no. 86, p. 1351, 2014. DOI:10.1002/cite.201450066.
[43] J.-M. Seiler, C. Hohwiller, J. Imbach and J.-F. Luciani, "Technical and economical
evaluation of enhanced biomass to liquid fuel processes," Energy, no. 35, pp. 3587-3592,

40
2010.
[44] E. Peduzzi, "Biomass To Liquids: Thermo-Economic Analysis and Multi-Objective
Optimisation - Ph.D. thesis," École Polytechnique Fédérale de Lausanne, Suisse, 2015.
[45] S. Heidenreich and P. U. Foscolo, "New conepts in biomass gasification," Progress in
Energy and Combustion Science, no. 46, pp. 72-95, 2015.
[46] A. Molino, S. Chianese and D. Musmarra, "Biomass gasification technology: The state of
the art overview," Journal of Energy Chemistry, no. 25, pp. 10-25, 2016.
[47] E. G. Pereira, J. N. d. Silva, J. L. d. Oliveira and C. S. Machado, "Sustainable energy: A
review of gasification technologies," Renewable and Sustainable Energy Reviews, no. 16,
pp. 4753-4762, 2012.
[48] M. Parel, X. Zhang and A. Kumar, "Techno-economic and life cycle assesment on
lignocellulosic biomass thermochemical conversion technologies: A review," Renewable
and Sustainable Energy Reviews, no. 53, pp. 1486-1499, 2016.
[49] National Renewable Energy Laboratory (NREL), "Techno-economic analysis of biomass
fast pyrolysis to transportation fuels," NREL, Golden, 2010.
[50] F. Trippe, M. Fröhling, F. Schultmann, R. Stahl and E. Henrich, "Techno-economic
analysis of fast pyrolysis as a process step within Biomass-to-Liquid fuel production,"
Waste Biomass Valor, pp. 415-430, 2010.
[51] P. Simell, I. Hannula, S. Tuomi, M. Nieminen, e. Kurkela, I. Hiltunen, N. Kaisola and J.
Kihlman, "Clean syngas from biomass - process development and concept assessment,"
Biomass Conv. Bioref., no. 4, pp. 357-370, 2014.
[52] R. Unde, "Kinetics and reaction engineering aspects of syngas production by the
heterogeneously catalysed reverse water-gas shift reaction," Universität Bayreuth,
Bayreuth, 2012, Dissertation.
[53] C. Chen, "A technical and economic assessment of CO2 capture technology for IGCC
power plants," Carnegie Mellon University, Pittsburgh, 2005.
[54] C. Hamelinck and A. Faaij, "Future prospects for production of methanol and hydrogen
from biomass," Utrecht University, ISBN 90-73958-84-9, 2001.
[55] J. Garrido, "Novel, low energy, pre-combustion carbon capture feasibility study - Ph.D.
thesis," University of Cambridge, 2012.
[56] A. Padurean, C. Cormos and P. Agachi, "Pre-combustion carbon dioxide capture by gas–
liquid absorption for Integrated Gasification Combined Cycle power plants," International
Journal of Greenhouse Gas Control, no. 7, pp. 1-11, 2012.
[57] National Renewable Energy Laboratory (NREL), "Survey and Down-Selection of Acid
Gas Removal Systems for the Thermochemical Conversion of Biomass to Ethanol with a
Detailed Analysis of an MDEA System," San Francisco, United States, 2009.

41
[58] T. Smolinka, M. Günther and J. Garche, "Stand und Entwicklungspotenzial der
Wasserelektrolyse zur Herstellung von Wasserstoff aus regenerativen Energien (in
German)," NOW GmbH, Freiburg im Breisgau, 2011.
[59] M. E. Dry, "The Fischer–Tropsch process: 1950–2000," Catalysis Today, no. 71, pp. 227-
241, 2002.
[60] J. Speight, Gasification of unconventional feedstocks, Elsevier Reference Monographs,
2014.
[61] H. Schulz, "Short history and present trends of Fischer-Tropsch synthesis," Applied
Catalysis A: General, vol. 186, pp. 3-12, 1999.
[62] C. S. Hsu and P. R. Robinson, Practical advances in petroleum processing, Springer, 2006,
ISBN 978-0-387-25789-1.
[63] D. Leckel and M. Liwanga-Ehumbu, "Diesel-selective hydrocracking of an iron-based
Fischer-Tropsch wax fraction (c15-C45) using a MoO3-modified noble metal catalyst,"
Energy & Fuel, vol. 20, pp. 2330-2336, 2006.
[64] Aspen Technology Inc., "Aspen Physical Property System - Physical Property Models,"
Burlington, United States, 2013.
[65] German Aerospace Center (DLR), Fraunhofer ISE, Ludwik Bölkow Systemtechnik, KBB
Underground Technologies, "Studie über die Planung einer Demonstrationsanlage zur
Wasserstoff-Kraftstoffgewinnung durch Elektrolyse mit Zwischenspeicherung in
Salzkavernen unter Druck, Abschlussbericht Projekt Plan-DelyKaD (in German),"
Stuttgart, 2014.
[66] N. Dahmen, E. Henrich, E. Dinjus and F. Weirich, "The bioliq bioslurry gasification
process for the production of biosynfuels, organic chemicals, and energy," Energy,
Sustainability and Society, vol. 2, pp. Article 3, 1-44, 2012.
[67] K. Qin, "Entrianed flow gasification of biomass, Ph. D. thesis," Technical University of
Denmark (DTU), Kgs. Lyngby, 2012.
[68] A. Jess, P. Kaiser, C. Kern and C. O. R. Unde, "Considerations concerning the energy
demand and energy mix for global welfare and stable ecosystems," Chemie Ingenieur
Technik, pp. 1777-1791, 2011, 83, doi: 10.1002/cite.201100066.
[69] C. A. Callaghan, "Kinetics and catalysis of the Water-Gas-Shift Reaction: a microkinetic
and graph theoretic approach," Worcester Polytechnic Institute, 2006.
[70] J. R. Rostrup-Nielsen and J. Sehested, "Hydrogen and synthesis gas by steam- and CO2
reforming," Advances in catalysis, vol. 47, pp. 65-139, 2002.
[71] National Energy Technology Laboratory (NREL), "Advanced carbon dioxide capture
R&D program, appendix B: carbon dioxide capture technology sheets - oxygen
production," 2013.
[72] Y. Yao, X. Liu and D. G. D. Hildebrandt, "Fischer-Tropsch synthesis using H2/CO/CO2
syngas mixtures: A comparison of paraffin to olefin ratios for iron and cobald based
42
catalysts," Applied Catalysis A: General, pp. 58-68, 2012; DOI:
10.1016/j.apcata.2012.04.041 .
[73] C. Hamelinck, A. Faaij, H. d. Uil and H. Boerrigter, "Production of FT transportation fuels
from biomass; technical options, process analysis and optimisation, and development
potential," Energy, pp. 1743-1771, September 2004; doi:10.1016/j.energy.2004.01.002.
[74] P. Kaiser and A. Jess, "Modeling of multitubular reactors for iron- and cobalt-catalyzed
Fischer–Tropsch syntheses for application in a Power-to-Liquid process," Energy
Technology, no. 5, pp. 486-497, 2014.
[75] P. Kaiser, F. Pöhlmann and A. Jess, "Intrinsic and effective kinetics of cobalt-catalyzed
Fischer-Tropsch synthesis in view of a Power-to-Liquid process based on renewable
energy," Chemical Engineering & Technology, pp. 964-972, 5 2014; DOI:
10.1002/ceat.201300815.
[76] Y. Liu, K. Murata, K. Okabe, M. Inaba, I. Takahara, T. Hanaoka and K. Sakanishi,
"Selective hydrocracking of Fischer-Tropsch waxes to high-quality diesel fuel over Pt-
promoted polyoxocation-pillared montmorillonites," Top Catal, pp. 597-608, 2009; doi:
10.1007/s11244-009-9239-8.
[77] G. Saur, "Wind-to-hydrogen project: electrolyzer capital cost study," National Renewable
Energy Laboratory, Golden, 2008.
[78] O. Onel, A. Niziolek, J. Elia, R. Baliban and C. Floudas, "Biomass and natural gas to
liquid transportation fuels and olefins (BGTL+C2_C4): Process synthesis and global
optimization," Ind. Eng. Chem. Res., vol. 54, pp. 359-385, 2015. DOI:10.1021/ie503979b.
[79] C.A.R.M.E.N e.V., "Preisentwicklung bei Holzhackschnitzel - der Energieholz-Index,"
http://www.carmen-ev.de/infothek/preisindizes/hackschnitzel, 2015 (in German).
[80] Hamburger Bürgerschaft, "Umweltgebührenordnung (UmwGebO) - Zehnte Verordnung
zur Änderung der Umweltgebührenordnung," Hamburg, 2016 (in German).
[81] S. D. Phillips, J. Tarud, M. Biddy and A. Dutta, "Gasoline from wood via integrated
gasification, synthesis, and Methanol-to-Gasoline," National Renewable Energy
Laboratory (NREL), Golden, 2011.
[82] AGFW, "Heizkostenvergleich nach VDI 2067," AGFW-Projektgesellschaft, Frankfurt am
Main, 2015 (in German).
[83] Eurostat, "Electricity prices for industrial consumers - bi-annual data (from 2007
onwards)," http://ec.europa.eu/eurostat/data/database, 2016.
[84] Federal Council of Germany, "Gesetz zur grundlegenden Reform des Erneuerbare-
Energien-Gesetzes und zur Änderung weiterer Bestimmungen des Energiewirtschaftsrechts
- Drucksachen18/1304,18/1573," Bundesanzeiger Verlagsgesellschaft mbH, Köln, 2014
(in German).
[85] Eurostat, "Gas prices for industrial consumers - bi-annual data (from 2007 onwards)
(nrg_pc_203)," 2016.

43
[86] C. Chen and E. S. Rubin, "CO2 control technology effects on IGCC plant performance and
cost," Energy Policy, vol. 37, p. 915–924, 2009.
[87] Fraunhofer-Institut für System- und Innovationsfor-schung (ISI), "Technische Trends der
industriellen Wassernutzung," Karlsruhe, 2008 (in German).
[88] Statistisches Bundesamt, "Verdienste und Arbeitskosten - Reallohnindex und
Nominallohnindex," Wiesbaden, 2015 (in German).
[89] European Energy Exchange (EEX), "Market Data - Phelix Power Futures," 2016. [Online].
Available: https://www.eex.com.
[90] F. Trippe, M. Fröhling, F. Schultmann, R. Stahl, E. Henrich and A. Dalai, "Comprehensive
techno-economic assesment of dimethyl ether (DME) synthesis and Fischer-Tropsch
synthesis as alternative process steps within biomass-to-liquid production," Fuel
Processing Technology, pp. 577-586, 2013.
[91] Deutsches Biomasseforschungszentrum gGmbH (DBFZ), "Biomass potentials and
competition for biomass utilisation," Federal Ministry for Transport, Building and Urban
Development (BMVBS), Leipzig, 2013.
[92] Energy research Centre of the Netherlands (ECN), "Phyllis 2 - Database for biomass and
waste," [Online]. Available: https://www.ecn.nl/phyllis2/. [Accessed 2015].
[93] Fachagentur Nachwachsende Rohsatoffe e.V. (FNR), "Bioenergy in Germany: facts and
figures," Gülzow, 2012.
[94] Deutsches Biomasseforschungszentrum (DBFZ), "Basisinformationen für eine nachhaltige
Nutzung von landwirtschaftlichen Reststoffen zur Bioenergiebereitstellung, DBFZ Report
Nr. 13," Leipzig, 2012 (in German).
809
810
Reference [91-94] refers to citations in the supplementary information. 811
812