A speleothem record of Younger Dryas cooling, Klamath ... Paper A speleothem record of Younger Dryas...
8
Short Paper A speleothem record of Younger Dryas cooling, Klamath Mountains, Oregon, USA David A. Vacco a, * , Peter U. Clark b , Alan C. Mix c , Hai Cheng d , R. Lawrence Edwards d a Department of Geosciences, Pennsylvania State University, State College, PA 16802, USA b Department of Geosciences, Oregon State University, Corvallis, OR 97331, USA c College of Oceanic and Atmospheric Sciences, Oregon State University, Corvallis, OR 97331, USA d Department of Geology and Geophysics, University of Minnesota, Minneapolis, MN 55455, USA Received 9 November 2004 Available online 20 July 2005 Abstract A well-dated d 18 O record in a stalagmite from a cave in the Klamath Mountains, Oregon, with a sampling interval of 50 yr, indicates that the climate of this region cooled essentially synchronously with Younger Dryas climate change elsewhere in the Northern Hemisphere. The d 18 O record also indicates significant century-scale temperature variability during the early Holocene. The d 13 C record suggests increasing biomass over the cave through the last deglaciation, with century-scale variability but with little detectable response of vegetation to Younger Dryas cooling. D 2005 University of Washington. All rights reserved. Keywords: Stalagmite; Younger Dryas; Klamath Mountains Introduction Climate records spanning the last deglaciation reveal several large and abrupt climate changes that may have been hemispheric or perhaps global in extent (Clark et al., 2002; Voelker et al., 2002). The mechanisms responsible for these events remain uncertain, but understanding their full spatial extent will provide insight into their origin, which represents an important objective because of the possible recurrence of analogous events in the future (Alley et al., 2003). One strategy toward constraining potential mechanisms of abrupt climate change is to develop well-dated climate records with the temporal precision necessary to establish the regional amplitude and phasing of changes in the various components of the climate system. Many terrestrial records are of too low resolution, however, to identify abrupt climate changes. Moreover, the chronology of most climate records of the last deglaciation is based on radiocarbon, thus preventing firm correlations among records because of uncertainties in local reservoir ages and corrections for changing 14 C production rate as they propagate through the carbon cycle. Speleothems circumvent many of these issues by providing high-resolution climate records with chronologies anchored by precise U-Th ages. Here, we develop a precisely dated isotope record (d 18 O, d 13 C) of the last deglaciation from a stalagmite recovered from the Klamath Mountains, southwestern Oregon (Fig. 1). Since the climate of the region is strongly influenced by the Pacific Ocean, this record is significant in providing one of the few precisely dated terrestrial records of Northeast Pacific climate variability during the last deglaciation. Setting The Oregon Caves National Monument (OCNM) is located 65 km inland of the Pacific coast of Oregon 0033-5894/$ - see front matter D 2005 University of Washington. All rights reserved. doi:10.1016/j.yqres.2005.06.008 * Corresponding author. E-mail address: [email protected] (D.A. Vacco). Quaternary Research 64 (2005) 249 – 256 www.elsevier.com/locate/yqres
Transcript of A speleothem record of Younger Dryas cooling, Klamath ... Paper A speleothem record of Younger Dryas...
www.elsevier.com/locate/yqres
Quaternary Research 6
Short Paper
A speleothem record of Younger Dryas cooling,
Klamath Mountains, Oregon, USA
David A. Vaccoa,*, Peter U. Clarkb, Alan C. Mixc, Hai Chengd, R. Lawrence Edwardsd
aDepartment of Geosciences, Pennsylvania State University, State College, PA 16802, USAbDepartment of Geosciences, Oregon State University, Corvallis, OR 97331, USA
cCollege of Oceanic and Atmospheric Sciences, Oregon State University, Corvallis, OR 97331, USAdDepartment of Geology and Geophysics, University of Minnesota, Minneapolis, MN 55455, USA
Received 9 November 2004
Available online 20 July 2005
Abstract
Awell-dated d18O record in a stalagmite from a cave in the Klamath Mountains, Oregon, with a sampling interval of 50 yr, indicates that
the climate of this region cooled essentially synchronously with Younger Dryas climate change elsewhere in the Northern Hemisphere. The
d18O record also indicates significant century-scale temperature variability during the early Holocene. The d13C record suggests increasing
biomass over the cave through the last deglaciation, with century-scale variability but with little detectable response of vegetation to Younger
Dryas cooling.
D 2005 University of Washington. All rights reserved.
Keywords: Stalagmite; Younger Dryas; Klamath Mountains
Introduction
Climate records spanning the last deglaciation reveal
several large and abrupt climate changes that may have been
hemispheric or perhaps global in extent (Clark et al., 2002;
Voelker et al., 2002). The mechanisms responsible for these
events remain uncertain, but understanding their full spatial
extent will provide insight into their origin, which represents
an important objective because of the possible recurrence of
analogous events in the future (Alley et al., 2003).
One strategy toward constraining potential mechanisms
of abrupt climate change is to develop well-dated climate
records with the temporal precision necessary to establish
the regional amplitude and phasing of changes in the various
components of the climate system. Many terrestrial records
are of too low resolution, however, to identify abrupt
climate changes. Moreover, the chronology of most climate
0033-5894/$ - see front matter D 2005 University of Washington. All rights rese
doi:10.1016/j.yqres.2005.06.008
* Corresponding author.
E-mail address: [email protected] (D.A. Vacco).
records of the last deglaciation is based on radiocarbon, thus
preventing firm correlations among records because of
uncertainties in local reservoir ages and corrections for
changing 14C production rate as they propagate through the
carbon cycle.
Speleothems circumvent many of these issues by
providing high-resolution climate records with chronologies
anchored by precise U-Th ages. Here, we develop a
precisely dated isotope record (d18O, d13C) of the last
deglaciation from a stalagmite recovered from the Klamath
Mountains, southwestern Oregon (Fig. 1). Since the climate
of the region is strongly influenced by the Pacific Ocean,
this record is significant in providing one of the few
precisely dated terrestrial records of Northeast Pacific
climate variability during the last deglaciation.
Setting
The Oregon Caves National Monument (OCNM) is
located 65 km inland of the Pacific coast of Oregon
4 (2005) 249 – 256
rved.
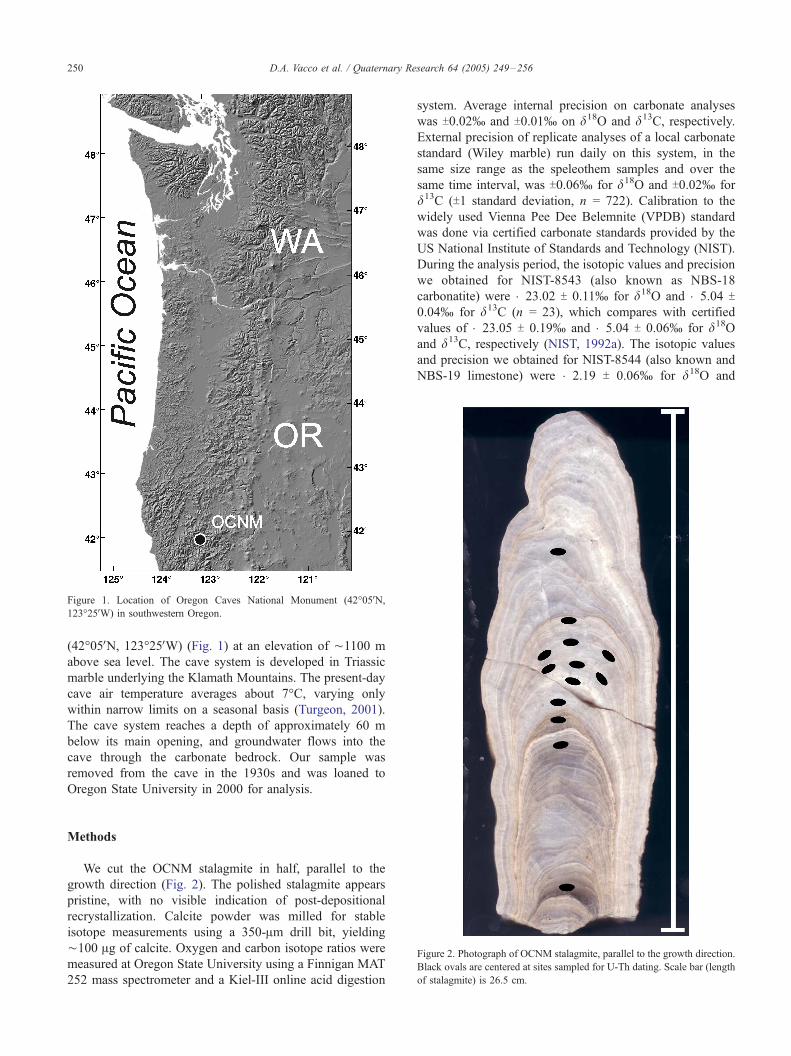
Figure 1. Location of Oregon Caves National Monument (42-05VN,123-25VW) in southwestern Oregon.
D.A. Vacco et al. / Quaternary Research 64 (2005) 249–256250
(42-05VN, 123-25VW) (Fig. 1) at an elevation of ¨1100 m
above sea level. The cave system is developed in Triassic
marble underlying the Klamath Mountains. The present-day
cave air temperature averages about 7-C, varying only
within narrow limits on a seasonal basis (Turgeon, 2001).
The cave system reaches a depth of approximately 60 m
below its main opening, and groundwater flows into the
cave through the carbonate bedrock. Our sample was
removed from the cave in the 1930s and was loaned to
Oregon State University in 2000 for analysis.
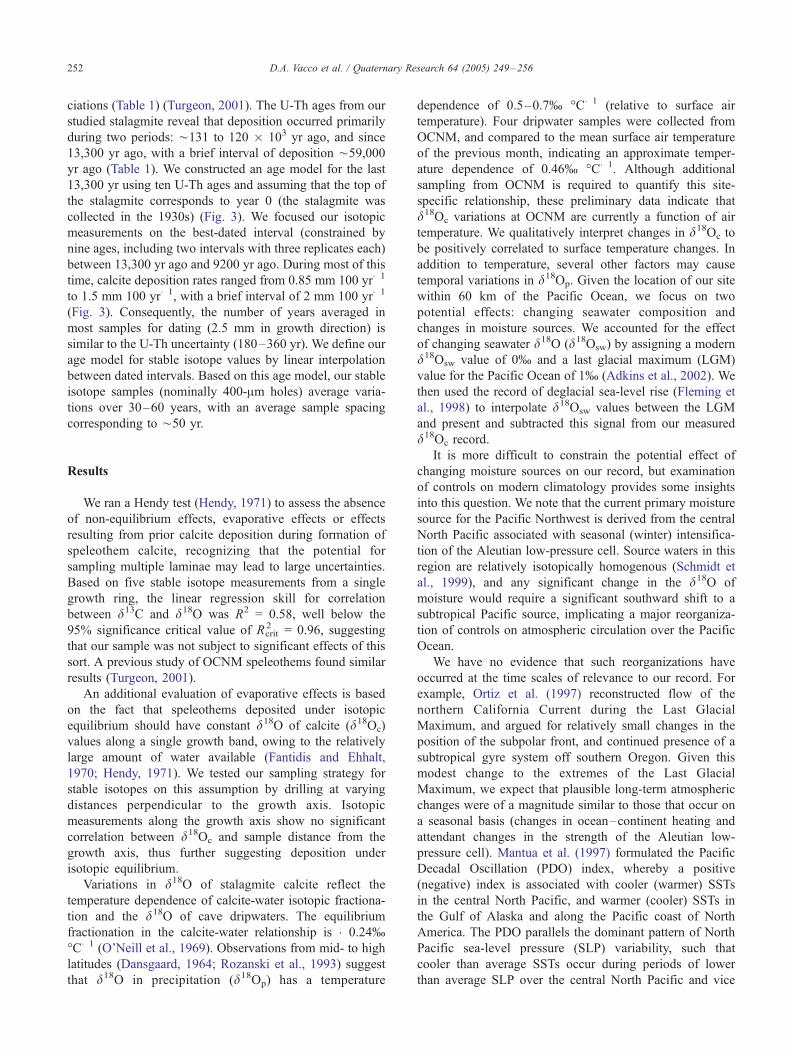
Figure 2. Photograph of OCNM stalagmite, parallel to the growth direction.
Black ovals are centered at sites sampled for U-Th dating. Scale bar (length
of stalagmite) is 26.5 cm.
Methods
We cut the OCNM stalagmite in half, parallel to the
growth direction (Fig. 2). The polished stalagmite appears
pristine, with no visible indication of post-depositional
recrystallization. Calcite powder was milled for stable
isotope measurements using a 350-Am drill bit, yielding
¨100 Ag of calcite. Oxygen and carbon isotope ratios were
measured at Oregon State University using a Finnigan MAT
252 mass spectrometer and a Kiel-III online acid digestion
system. Average internal precision on carbonate analyses
was T0.02� and T0.01� on d18O and d13C, respectively.
External precision of replicate analyses of a local carbonate
standard (Wiley marble) run daily on this system, in the
same size range as the speleothem samples and over the
same time interval, was T0.06� for d18O and T0.02� for
d13C (T1 standard deviation, n = 722). Calibration to the
widely used Vienna Pee Dee Belemnite (VPDB) standard
was done via certified carbonate standards provided by the
US National Institute of Standards and Technology (NIST).
During the analysis period, the isotopic values and precision
we obtained for NIST-8543 (also known as NBS-18
carbonatite) were �23.02 T 0.11� for d18O and �5.04 T0.04� for d13C (n = 23), which compares with certified
values of �23.05 T 0.19� and �5.04 T 0.06� for d18Oand d13C, respectively (NIST, 1992a). The isotopic values
and precision we obtained for NIST-8544 (also known and
NBS-19 limestone) were �2.19 T 0.06� for d18O and

Table 1230Th dating results on OCNM stalagmite
Sample
number
Sample
depth (mm)
(from base)
238U
(ppb)
232Th
(ppt)
d234U*
(measured)
230Th/238U
(activity)
230Th age (years)
(uncorrected)
230Th age (years)
(corrected)
d234U initial**
(corrected)
A4 196 115.0 T 0.2 154 T 20 89.1 T 3.3 0.0584 T 0.0015 6010 T 160 5914 T 160 90.6 T 3.3
A7 158 134.2 T 0.2 630 T 13 102.5 T 2.1 0.0965 T 0.0011 9980 T 130 9650 T 140 105.3 T 2.1
A9 147 126.9 T 0.3 475 T 12 111.9 T 3.7 0.1062 T 0.0015 10,950 T 170 10,680 T 170 115.3 T 3.8
A12 147 127.6 T 0.1 878 T 12 110.4 T 1.8 0.1096 T 0.0010 11,330 T 110 10,840 T 150 113.8 T 1.8
A13 147 126.1 T 0.1 1832 T 13 105.4 T 1.8 0.1146 T 0.0010 11,930 T 120 10,880 T 250 108.7 T 1.8
A8 134 159.2 T 0.3 2308 T 13 129.4 T 2.1 0.1224 T 0.0011 12,500 T 120 11,480 T 240 133.7 T 2.1
A10 134 164.8 T 0.2 2590 T 12 122.0 T 1.5 0.1251 T 0.0010 12,880 T 110 11,770 T 260 126.1 T 1.6
A11 134 151.1 T 0.2 2450 T 17 99.0 T 2.0 0.1237 T 0.0013 13,020 T 150 11,840 T 290 102.4 T 2.1
A6 129 103.1 T 0.2 1317 T 12 134.0 T 3.0 0.1262 T 0.0014 12,850 T 160 11,960 T 240 138.6 T 3.2
A3 119 170.9 T 0.3 433 T 20 107.6 T 2.5 0.1271 T 0.0016 13,280 T 170 13,100 T 180 111.7 T 2.6
A5 107 95.3 T 0.1 2904 T 16 109.4 T 3.0 0.4778 T 0.0031 60,860 T 570 58,700 T 720 129.1 T 3.5
A2 96 208.8 T 0.3 190 T 20 89.4 T 2.5 0.7381 T 0.0041 120,750 T 1330 120,690 T 1330 125.7 T 3.6
A1 23 81.0 T 0.2 255 T 20 130.7 T 6.9 0.8060 T 0.0062 131,230 T 2600 131,020 T 2600 189 T 10
k230 = 9.1577 � 10�6 y�1, k234 = 2.8263 � 10�6 y�1, k238 = 1.55125 � 10�10 y�1. *d234U = ([234U/238U]activity � 1) � 1000. **d234Uinitial was calculated
based on 230Th age (T), i.e., d234Uinitial = d234Umeasured � ek234xT. Corrected 230Th ages assume the initial 230Th/232Th atomic ratio of 12.0 T 2.5 � 10�6 based
on three-point isochron (A9, A12 and A13), without U corrections. The error is 2j error. Samples A8, A10 and A11 are from the same stalagmite growth layer,
as are samples A9, A12 and A13.
Figure 3. Age model for section of OCNM stalagmite <13,100 yr old,
based on ten U-Th ages and assumption that top of stalagmite corresponds
to year 0. Age model is constructed by linear interpolation between U-Th
ages. For those two intervals where three U-Th ages were obtained, the
age model is fitted to the error-weighted mean of the three ages from each
interval.
D.A. Vacco et al. / Quaternary Research 64 (2005) 249–256 251
+1.94 T 0.02� for d13C (n = 25), which compares with
certified values of �2.20� and +1.95� for d18O and d13C,respectively (no precision estimate; NIST, 1992). As an
additional check on isotopic calibration, we continue to run
the traditional standard NBS-20 (Solenhofen limestone),
although it is no longer accepted by NIST as a certified
standard due to heterogeneity. For this unofficial standard
we measured isotopic values and precision of �4.13 T0.06� for d18O and �1.05 T 0.02� for d13C (n = 19),
which compares well with the traditional values of �4.14�and �1.06� that are commonly used in the literature.
Oxygen isotope analyses of cave dripwaters used stand-
ard H2O/CO2 equilibration methods (Epstein and Mayeda,
1953), using a Finnigan/MAT 251 mass spectrometer at
Oregon State University equipped with an automated
equilibrator of local design. The isotopic composition of
waters is reported relative to VSMOW based on analyses of
the standards NIST-8535 (VSMOW), NIST-8536 (GISP,
�24.85�) and 8537 (SLAP, �55.5�) (NIST, 1992b). The
reproducibility of local reference waters is routinely
T0.04� on this system.
Approximately 200 mg of calcite powder was milled
for U-Th dating using a 2-mm drill bit. Milling troughs
were ¨2.5 mm wide in the growth direction, 2 mm deep
and 20–25 mm long following visible growth bands
(roughly perpendicular to stalagmite growth direction).
We obtained thirteen U-Th ages on powdered calcite
using sector inductively coupled mass spectrometry at
the University of Minnesota (Table 1). Methods are
modifications of those presented in Edwards et al. (1987)
and are described in Cheng et al. (2000) and Shen et al.
(2002). Based on three coeval samples (A9, A12 and
A13) (Table 1), we used the isochron technique (see
Dorale et al., 2004) to calculate the initial 230Th/232Th,
which was 12.0 T 2.5 ppm. For samples of about
Younger Dryas age, the error in age, including the T2.5
ppm error in initial thorium isotopic composition and the
analytical error, is about T200 years. Most of this error
comes from the uncertainty in our knowledge of initial
thorium isotopic composition. Replicate analyses show
excellent reproducibility, and the U-Th ages are in
stratigraphic order (Table 1), indicating that the234U/230Th isotopic system has remained closed since
calcite deposition.
Age model
Dating of speleothems from OCNM indicates that growth
phases occurred primarily during terminations and intergla-
D.A. Vacco et al. / Quaternary Research 64 (2005) 249–256252
ciations (Table 1) (Turgeon, 2001). The U-Th ages from our
studied stalagmite reveal that deposition occurred primarily
during two periods: ¨131 to 120 � 103 yr ago, and since
13,300 yr ago, with a brief interval of deposition ¨59,000
yr ago (Table 1). We constructed an age model for the last
13,300 yr using ten U-Th ages and assuming that the top of
the stalagmite corresponds to year 0 (the stalagmite was
collected in the 1930s) (Fig. 3). We focused our isotopic
measurements on the best-dated interval (constrained by
nine ages, including two intervals with three replicates each)
between 13,300 yr ago and 9200 yr ago. During most of this
time, calcite deposition rates ranged from 0.85 mm 100 yr�1
to 1.5 mm 100 yr�1, with a brief interval of 2 mm 100 yr�1
(Fig. 3). Consequently, the number of years averaged in
most samples for dating (2.5 mm in growth direction) is
similar to the U-Th uncertainty (180–360 yr). We define our
age model for stable isotope values by linear interpolation
between dated intervals. Based on this age model, our stable
isotope samples (nominally 400-Am holes) average varia-
tions over 30–60 years, with an average sample spacing
corresponding to ¨50 yr.
Results
We ran a Hendy test (Hendy, 1971) to assess the absence
of non-equilibrium effects, evaporative effects or effects
resulting from prior calcite deposition during formation of
speleothem calcite, recognizing that the potential for
sampling multiple laminae may lead to large uncertainties.
Based on five stable isotope measurements from a single
growth ring, the linear regression skill for correlation
between d13C and d18O was R2 = 0.58, well below the
95% significance critical value of Rcrit2 = 0.96, suggesting
that our sample was not subject to significant effects of this
sort. A previous study of OCNM speleothems found similar
results (Turgeon, 2001).
An additional evaluation of evaporative effects is based
on the fact that speleothems deposited under isotopic
equilibrium should have constant d18O of calcite (d18Oc)
values along a single growth band, owing to the relatively
large amount of water available (Fantidis and Ehhalt,
1970; Hendy, 1971). We tested our sampling strategy for
stable isotopes on this assumption by drilling at varying
distances perpendicular to the growth axis. Isotopic
measurements along the growth axis show no significant
correlation between d18Oc and sample distance from the
growth axis, thus further suggesting deposition under
isotopic equilibrium.
Variations in d18O of stalagmite calcite reflect the
temperature dependence of calcite-water isotopic fractiona-
tion and the d18O of cave dripwaters. The equilibrium
fractionation in the calcite-water relationship is �0.24�-C�1 (O’Neill et al., 1969). Observations from mid- to high
latitudes (Dansgaard, 1964; Rozanski et al., 1993) suggest
that d18O in precipitation (d18Op) has a temperature
dependence of 0.5–0.7� -C�1 (relative to surface air
temperature). Four dripwater samples were collected from
OCNM, and compared to the mean surface air temperature
of the previous month, indicating an approximate temper-
ature dependence of 0.46� -C�1. Although additional
sampling from OCNM is required to quantify this site-
specific relationship, these preliminary data indicate that
d18Oc variations at OCNM are currently a function of air
temperature. We qualitatively interpret changes in d18Oc to
be positively correlated to surface temperature changes. In
addition to temperature, several other factors may cause
temporal variations in d18Op. Given the location of our site
within 60 km of the Pacific Ocean, we focus on two
potential effects: changing seawater composition and
changes in moisture sources. We accounted for the effect
of changing seawater d18O (d18Osw) by assigning a modern
d18Osw value of 0� and a last glacial maximum (LGM)
value for the Pacific Ocean of 1� (Adkins et al., 2002). We
then used the record of deglacial sea-level rise (Fleming et
al., 1998) to interpolate d18Osw values between the LGM
and present and subtracted this signal from our measured
d18Oc record.
It is more difficult to constrain the potential effect of
changing moisture sources on our record, but examination
of controls on modern climatology provides some insights
into this question. We note that the current primary moisture
source for the Pacific Northwest is derived from the central
North Pacific associated with seasonal (winter) intensifica-
tion of the Aleutian low-pressure cell. Source waters in this
region are relatively isotopically homogenous (Schmidt et
al., 1999), and any significant change in the d18O of
moisture would require a significant southward shift to a
subtropical Pacific source, implicating a major reorganiza-
tion of controls on atmospheric circulation over the Pacific
Ocean.
We have no evidence that such reorganizations have
occurred at the time scales of relevance to our record. For
example, Ortiz et al. (1997) reconstructed flow of the
northern California Current during the Last Glacial
Maximum, and argued for relatively small changes in the
position of the subpolar front, and continued presence of a
subtropical gyre system off southern Oregon. Given this
modest change to the extremes of the Last Glacial
Maximum, we expect that plausible long-term atmospheric
changes were of a magnitude similar to those that occur on
a seasonal basis (changes in ocean–continent heating and
attendant changes in the strength of the Aleutian low-
pressure cell). Mantua et al. (1997) formulated the Pacific
Decadal Oscillation (PDO) index, whereby a positive
(negative) index is associated with cooler (warmer) SSTs
in the central North Pacific, and warmer (cooler) SSTs in
the Gulf of Alaska and along the Pacific coast of North
America. The PDO parallels the dominant pattern of North
Pacific sea-level pressure (SLP) variability, such that
cooler than average SSTs occur during periods of lower
than average SLP over the central North Pacific and vice

Figure 4. (a) Greenland GISP2 d18O record (Grootes et al., 1993; Stuiver
and Grootes, 2000). (b) d18O record from Hulu Cave, China (Wang et al.,
2001). (c) d18O record from OCNM. (d) d13C record from OCNM. U-Th
age control is indicated by black squares (with 2j error bars) at the bottom.
The U-Th ages at 10,790 + 100 yr and 11,680 + 150 yr are the error-
weighted mean ages of three coeval samples (Table 1).
D.A. Vacco et al. / Quaternary Research 64 (2005) 249–256 253
versa. Although coupled ocean–atmosphere general circu-
lation models (GCMs) are of relatively coarse resolution,
available simulations of millennial-scale changes that may
have affected the Pacific Ocean based on such models
suggest that the largest response was in sea-surface
temperatures over the North Pacific, which was associated
with intensification but not a major shift in the position of
the westerlies near 50-N (Mikolajewicz et al., 1997).
Atmospheric GCM simulations suggest that the primary
response to orbital-scale changes and other large-scale
boundary conditions that occurred during the last deglaci-
ation involved a strengthening of the Aleutian low-pressure
cell with only minor shifts in the storm tracks in our region
(Bartlein et al., 1998).
The d13C value in a speleothem reflects some combina-
tion of the d13C of the overlying soil zone, the d13C of the
underlying bedrock and the processes involved in calcite
precipitation (Hendy, 1971). With continuous equilibration
between the soil water and an unlimited soil CO2 reservoir,
the d13C value of the dissolved inorganic carbon (DIC) is
determined by the d13C value of soil CO2, which in turn
depends on the ratio of C3 plants (d13C ¨ �26�) to C4
plants (d13C ¨ �13�) living in the soil, and on the ratio of
atmospheric CO2 (d13C = �7�) to biogenic CO2 in the soil
system (Cerling, 1984; Cerling et al., 1989; Genty et al.,
2003). Dissolution of carbonate rock below the soil
increases the d13C of DIC when the percolating water
becomes isolated from the soil CO2 reservoir. Further
increases in d13C values may occur by CO2 degassing of
percolating waters and resulting calcite mineralization in the
aquifer above the cave, rapid degassing of dripwaters in the
cave, evaporation and kinetic fractionation (Baker et al.,
1997).
Discussion
The last interglacial growth phase dated within the
speleothem dated here agrees within error with a wet
monsoon interval recorded in a speleothem record from
Dongge Cave, China (Yuan et al., 2004). The growth phase
dated in subsample A5 (58.7 T 0.7 � 103 yr) correlates with
a wet monsoon interval in Hulu Cave, China, (Wang et al.,
2001) and with interstadial 17 from the GISP2 ice core,
Greenland.
The next major growth phase began ¨13,300 yr ago and
continued to the present (Fig. 3). Following the removal of
secular changes in d18Osw, OCNM d18O values range from
�9.0 to �10.6� between 13,300 and 9200 yr ago (Fig. 4c).
For comparison, an actively forming stalactite in OCNM has
a d18O value of �8.7� (Turgeon, 2001). The most
pronounced signal is a change to lower (more negative)
d18O values that, within dating uncertainties, is synchronous
with the onset of the Younger Dryas (YD) interval as
defined by precisely dated, high-resolution isotope records
from the GISP2 ice core (Fig. 4a) (Stuiver and Grootes,
2000) and a stalagmite from Hulu Cave, China (Fig. 4b)
(Wang et al., 2001; Yuan et al., 2004). Specifically, OCNM
d18O values begin a gradual decrease at 12,840 T 200 yr
ago, in excellent agreement with the timing of the onset of
the YD at GISP2 (12,880 T 260 yr ago) and Hulu Cave
(12,823 T 60 yr ago). Unlike the abrupt onset of the YD in
the GISP2 record, however, our record is more similar to
that from Hulu Cave in showing a gradual change in d18O
values, culminating with the most extreme values at
¨12,300 yr ago at OCNM and ¨12,400 yr ago at Hulu
Cave. Subsequently, both stalagmite records suggest an
oscillation in d18O during the YD. Finally, the OCNM
record registers an abrupt increase in d18O values at
11,700 T 260 yr ago (uncertainty based on U-Th dates)
that is synchronous with the abrupt termination of the YD
in GISP2 (11,640 T 250 yr ago) and in Hulu Cave
(11,550 T 100 yr ago) (Fig. 4).
The YD interval in OCNM d18O corresponds to a change
of 0.75�. Insofar as the dominant control on d18Oc in our
OCNM stalagmite is atmospheric temperature, a 0.75�
change corresponds to cooling over the cave during the
YD interval. This cooling is in qualitative agreement with
D.A. Vacco et al. / Quaternary Research 64 (2005) 249–256254
the >3-C YD cooling of sea-surface temperatures (SSTs)
recorded in marine core ODP-1019 120 km due west of
OCNM based on foraminifera (Mix et al., 1999) and an
organic alkenone index (Barron et al., 2003). SST records
to the north (Kienast and McKay, 2001) and south (Mortyn
et al., 1996) of the Oregon margin confirm that cooling of
the northeast Pacific was widespread during the YD.
From the termination of YD cooling until 9200 yr ago
(the end of our record), d18O values range from �10.2 and
�9.1�, averaging �9.8� (Fig. 4c). A 5-cm stalagmite
from OCNM that grew between 4000 and 2000 yr ago has
d18O values ranging from �10 to �11� (Turgeon, 2001),
suggesting warmer average temperatures over OCNM
during the early versus the late Holocene. A similar contrast
between early and late Holocene SSTs occurred off the
Oregon coast (Mix et al., 1999; Barron et al., 2003).
Additionally, there is significant centennial-scale varia-
bility within our early Holocene d18O record that indicates
significant temperature changes (Fig. 4c). In particular, we
note a warming event at 11,000 yr ago that is comparable in
d18O amplitude to temperature change estimated for the
YD. As a preliminary analysis of the centennial variability
for our record, we used a ten-point running mean smoother
to remove millennial-scale variability and evaluated the
residuals of that smoothing in terms of the strength of
centennial-scale modes. Autocorrelation analysis yielded
95% significance correlations over the lags 140–250 yr.
Spectral analysis of the record showed a narrow-band signal
having a period of 190 yr. Because of the brevity of our
record (4000 yr) relative to such bicentennial-scale varia-
bility, potential errors associated with detrending of millen-
nial-scale variations, possible changes in accumulation rate
and coarse sampling intervals, these time series analyses are
susceptible to sampling bias and should be considered
preliminary.
Our OCNM d13C record shows a relatively steady
progression from values > �2� 13,300 yr ago to early
Holocene values that average �7�, with a limited
expression of a YD signal (Fig. 4d). A pollen record from
Bolan Lake, Oregon, 10 km southwest of OCNM, indicates
that C3 plants have dominated the vegetation type in this
region over the last 14,000 yr (Briles, 2003), suggesting that
the trend towards lighter d13C values in our record cannot
be attributed to a transition from C4 to C3 plants. Because
d13C values < �6� are expected for a carbonate system
dominated by C3 plants (Baker et al., 1997), we interpret the
trend of decreasing d13C values to record an increasing
contribution from soil respiration rates relative to contribu-
tions from atmospheric CO2 and carbonate bedrock (+1.7�
at OCNM; Turgeon, 2001). The Bolan Lake pollen record,
for example, suggests that conifer forests migrated upslope
after 14,500 yr ago, replacing sparse subalpine parkland
vegetation near upper treeline (Briles, 2003). A forest
composition similar to present only became established
after 13,000 yr ago. The subsequent decrease in OCNM
d13C values may thus reflect some combination of an
increase in biomass, an increase in moisture to enhance
decay of organic matter and the relatively long time for
buildup of organic matter in soils. The late Holocene
(4000–2000 yr ago) OCNM d13C record (Turgeon, 2001)
has similar average values (�7 to �8�) as our early
Holocene d13C record, suggesting that the modern soil CO2
reservoir was established by ¨11,000 yr ago (Fig. 3).
Century-scale variations in d13C of 1–2� occur
throughout the early Holocene, although there is no
apparent correlation with the d18O record (Fig. 4). Such
short-term variations may reflect variations in soil moisture
and attendant rates of organic matter decay.
Conclusions
Proxy records indicate that YD cooling in the North
Atlantic region was induced by a reduction in the Atlantic
meridional overturning (AMO) and attendant heat transport
(Hughen et al., 2000; McManus et al., 2004). Simulations
with coupled atmosphere–ocean general circulation mod-
els suggest that zonal transmission of Atlantic thermal
anomalies through the atmospheric circulation causes
cooling over the entire extratropics of the Northern
Hemisphere (Manabe and Stouffer, 1988; Mikolajewicz
et al., 1997; Velinga and Wood, 2002). The synchroneity
of the YD signal in three widely separated areas of the
Northern Hemisphere (GISP2, Hulu Cave, OCNM) (Fig.
4) supports this mechanism. In particular, relatively high
d18O values from Hulu Cave record weakening of the East
Asian summer monsoon in response to cooling over
Siberia (Wang et al., 2001), whereas the relatively low
OCNM d18O values record cooling of the North Pacific
associated with enhanced cold-air advection from Siberia,
although decreased upwelling along the North American
margin may have moderated this response (Mikolajewicz
et al., 1997; Mix et al., 1999).
We note that the magnitude of northeast Pacific cooling
indicated by SST reconstructions (Barron et al., 2003) is
substantially larger than temperature changes simulated by
these models. In part, this disagreement may reflect the
modern boundary conditions used in the models, whereas
the remnant Northern Hemisphere ice sheets and lower
atmospheric greenhouse gas concentrations during the YD
contributed to additional cooling. Feedbacks not well
represented in the models, such as changing oceanic heat
transport driven by the balance of surface and subsurface
ocean flows, or regional expansion of snow cover in
unresolved mountainous terrain, may also have contributed
to a larger response.
Acknowledgments
We thank John Dodge for providing the speleothem to
Oregon State University for study and John Roth of the

D.A. Vacco et al. / Quaternary Research 64 (2005) 249–256 255
Oregon Caves National Monument for his support. Com-
ments from two anonymous reviewers significantly im-
proved the paper.
References
Adkins, J.F., McIntyre, K., Schrag, D.P., 2002. The salinity, temperature,
and d18O of the glacial deep ocean. Science 298, 1769–1773.
Alley, R.B., Marotzke, J., Nordhaus, W.D., Overpeck, J.T., Peteet, D.M.,
Pielke Jr., R.A., Pierrehumbert, R.T., Rhines, P.B., Stocker, T.F.,
Talley, L.D., Wallace, J.M., 2003. Abrupt climate change. Science
299, 2005–2010.
Baker, A., Ito, E., Smart, P.L., McEwan, R.G., 1997. Elevated and variable
values of 13C in speleothems in a British cave system. Chemical
Geology 136, 263–270.
Barron, J.A., Heusser, L., Herbert, T., Lyle, M., 2003. High-resolution
climatic evolution of coastal northern California during the past 16,000
years. Paleoceanography 18, 1020.
Bartlein, P.J., Anderson, K.H., Anderson, P.M., Edwards, M.E., Mock, C.J.,
Thompson, R.S., Webb, R.S., Webb III, T., Whitlock, C., 1998.
Paleoclimate simulations for North America over the past 21,000 years:
features of the simulated climate and comparisons with paleoenviron-
mental data. Quaternary Science Reviews 17, 549–585.
Briles, C.E., 2003. Postglacial vegetation and fire history near Bolan Lake
in the Northern Siskiyou Mountains of Oregon. Master’s Thesis.
Department of Geography, University of Oregon. 148 pp.
Cerling, T.E., 1984. The stable isotopic composition of modern soil
carbonate and its relationship to climate. Earth and Planetary Science
Letters 71, 229–240.
Cerling, T.E., Quade, J., Wang, Y., Bowman, J.R., 1989. Carbon isotopes in
soils and palaeosols as ecology and palaeoecology indicators. Nature
341, 138–139.
Cheng, H., Edwards, R.L., Hoff, J., Gallup, C.D., Richards, D.A.,
Asmerom, Y., 2000. The half-lives of uranium-234 and thorium-230.
Chemical Geology 169, 17–33.
Clark, P.U., Pisias, N.G., Stocker, T.F., Weaver, A.J., 2002. The role of
the thermohaline circulation in abrupt climate change. Nature 415,
863–869.
Dansgaard, W., 1964. Stable isotopes in precipitation. Tellus 16, 436–468.
Dorale, J.A., Edwards, R.L., Alexander, E.C., Shen, C.-C., Richards, D.A.,
Cheng, H., 2004. Uranium-series dating of speleothems: current
techniques, limits, and applications. In: Sasowski, I.D., Mylroie, J.
(Eds.), Studies of Cave Sediments. Kluwer Academic/Plenum, New
York.
Edwards, R.L., Chen, J.H., Wasserburg, G.J., 1987. U-238, U-234,
Th-230, Th-232 systematics and the precise measurement of time
over the past 500,000 years. Earth and Planetary Science Letters 81,
175–192.
Epstein, S., Mayeda, T.K., 1953. Variations of the 18O/16O ratio in natural
waters. Geochimica et Cosmochimica Acta 4, 213.
Fantidis, J., Ehhalt, D.H., 1970. Variations of the carbon and oxygen
isotopic composition in stalagmites and stalactites: evidence of non-
equilibrium isotopic fractionation. Earth and Planetary Science Letters
10, 136–144.
Fleming, K., Johnston, P., Zwartz, D., Yokoyama, Y., Lambeck, K.,
Chappell, J., 1998. Refining the eustatic sea-level curve since the last
glacial maximum using far- and intermediate-field sites. Earth and
Planetary Science Letters 163, 327–342.
Genty, D., Blamart, D., Ouahdi, R., Gilmour, M., Baker, A., Jouzel, J.,
Van-Exter, S., 2003. Precise dating of Dansgaard–Oeschger climate
oscillations in western Europe from stalagmite data. Nature 421,
833–837.
Grootes, P.M., Stuiver, M., White, J.W.C., Johnsen, S.J., Jouzel, J., 1993.
Comparison of oxygen isotope records from the GISP2 and GRIP
Greenland ice cores. Nature 366, 552–554.
Hendy, C.H., 1971. The isotopic geochemistry of speleothems-I. The
calculation of the effects of different modes of formation on the
isotopic composition of speleothems and their applicability as
palaeoclimatic indicators. Geochimica et Cosmochimica Acta 35,
801–824.
Hughen, K.A., Southon, J.R., Lehman, S.J., Overpeck, J.T., 2000.
Synchronous radiocarbon and climate shifts during the last deglaciation.
Science 290, 1951–1954.
Kienast, S., McKay, J.L., 2001. Sea surface temperatures in the subarctic
northeast Pacific reflect millennial-scale climate oscillations during the
last 16 kyrs. Geophysical Research Letters 28, 1563–1566.
Manabe, S., Stouffer, R.J., 1988. Two stable equilibria of a coupled ocean–
atmosphere model. Journal of Climate 1, 841–866.
Mantua, N.J., Hare, S.R., Zhang, Y., Wallace, J.M., Francis, R.C., 1997. A
pacific interdecadal climate oscillation with impacts on salmon
production. Bulletin of the American Meteorological Society 78,
1069–1079.
McManus, J.F., Francois, R., Gherardi, J.-M., Keigwin, L.D., Brown-
Leger, S., 2004. Collapse and rapid resumption of Atlantic meri-
dional circulation linked to deglacial climate changes. Nature 428,
834–837.
Mikolajewicz, U., Crowley, T.J., Schiller, A., Voss, R., 1997. Modelling
teleconnections between the North Atlantic and North Pacific during the
Younger Dryas. Nature 387, 384–387.
Mix, A.C., Lund, D.C., Pisias, N.G., Boden, P., Bornmalm, L., Lyle,
M., Pike, J., 1999. Rapid climate oscillations in the Northeast
Pacific during the last deglaciation reflect northern and southern
hemisphere sources. In: Clark, P.U., Webb, R.S., Keigwin, L.D.
(Eds.), Mechanisms of Global Climate Change at Millennial Time
Scales; Geophysical Monograph 112. American Geophysical Union,
pp. 127–148.
Mortyn, P.G., Thunell, R.C., Anderson, D.M., Stott, L.D., Le, J., 1996.
Sea surface temperature changes in the southern California border-
lands during the last glacial-interglacial cycle. Paleoceanography 11,
415–430.
NIST, 1992a. National Institute of Standards and Technology Report of
Investigation, Reference Materials 8543–8546. National Institute of
Standards and Technology, United States Department of Commerce,
Gaithersburg, Maryland, 2 pp.
NIST, 1992b. National Institute of Standards and Technology Report Of
Investigation, Reference Materials 8535–8537. National Institute of
Standards and Technology, United States Department of Commerce,
Gaithersburg, Maryland, 2 pp.
O’Neill, J.R., Clayton, R.N., Mayeda, T.K., 1969. Oxygen isotope
fractionation in divalent metal carbonates. Journal of Chemical Physics
51, 5547–5558.
Ortiz, J.D., Mix, A.C., Hostetler, S., Kashgarian, M., 1997. The California
current of the last glacial maximum: reconstruction at 42oN based on
multiple proxies. Paleoceanography 12, 191–206.
Rozanski, R., Araguas-Araguas, L., Gonfiantini, R., 1993. Isotopic patterns
in modern global precipitation. In: Swart, P., McKenzie, J.A., Lohman,
K.C. (Eds.), Continental Indicators of Climate: American Geophysical
Union Monograph, vol. 78, pp. 1–36.
Schmidt, G.A., Bigg, G.R., Rohling, E.R., 1999. Global seawater oxygen-
18 database. http://www.giss.nasa.gov/data/o18data/.
Shen, C.-C., Edwards, R.L., Cheng, H., Dorale, J.A., Thomas, R.B., Moran,
S.B., Weinstein, S., Edmonds, H.N., 2002. Uranium and thorium
isotopic and concentration measurements by magnetic sector induc-
tively coupled plasma mass spectrometry. Chemical Geology 185,
165–178.
Stuiver, M., Grootes, P.M., 2000. GISP2 oxygen isotope ratios. Quaternary
Research 53, 277–284.
Turgeon, S.C., 2001. Petrography and discontinuities, growth rates and
stable isotopes of speleothems as indicators of paleoclimates from
Oregon Caves National Monument, southwestern Oregon, USA.
PhD dissertation. Department of Geography, Carlerton University.
213 pp.

D.A. Vacco et al. / Quaternary Research 64 (2005) 249–256256
Velinga, M., Wood, R.A., 2002. Global climatic impacts of a
collapse of the Atlantic thermohaline circulation. Climatic Change
54, 251–267.
Voelker, A.H.L., et al., 2002. Global distribution of centennial-scale records
for marine isotope stage (MIS) 3: a database. Quaternary Science
Reviews 21, 1185–1214.
Wang, Y.J., Cheng, H., Edwards, R.L., An, Z.S., Wu, J.Y., Shen,
C.C., Dorale, J.A., 2001. A high-resolution absolute-dated late
Pleistocene monsoon record from Hulu Cave, China. Science 294,
2345–2348.
Yuan, D.X., Cheng, H., Edwards, R.L., Dykoski, C., Kelly, M.J., Zhang,
M.L., Qing, J.M., Lin, Y.S., Wang, Y.G., Dorale, J.A., An, Z.S., Cai,
Y.J., 2004. Timing, duration, and transitions of the Last Interglacial
Asian Monsoon. Science 304, 575–578.