
A sound strategy for growth - Byron Energy Ltd€¦ · Byron, were 17.4 Mmbbl of oil and 150.1 Bcf...
102
ANNUAL REPORT 2019 A sound strategy for growth
Transcript of A sound strategy for growth - Byron Energy Ltd€¦ · Byron, were 17.4 Mmbbl of oil and 150.1 Bcf...

ANNUAL REPORT 2019
A sound strategy for growth

Byron Energy Limited Annual Report 2019D
Contents
Byron Energy Limited Annual Report 2019
Chairman’s Letter 2
Message from the CEO 4
Review of Operations 8
Directors’ Report 32
Auditor’s Independent Declaration 57
Consolidated Statement of Profit or Loss 58 and Other Comprehensive Income
Consolidated Statement of Financial Position 59
Consolidated Statement of Changes In Equity 60
Consolidated Statement of Cash Flows 61
Notes to the Financial Statements 62
Directors’ Declaration 91
Independent Auditor’s Report 92
ASX Additional Information 96
Corporate Directory 98
Byron Energy Limited Annual Report 2019 1
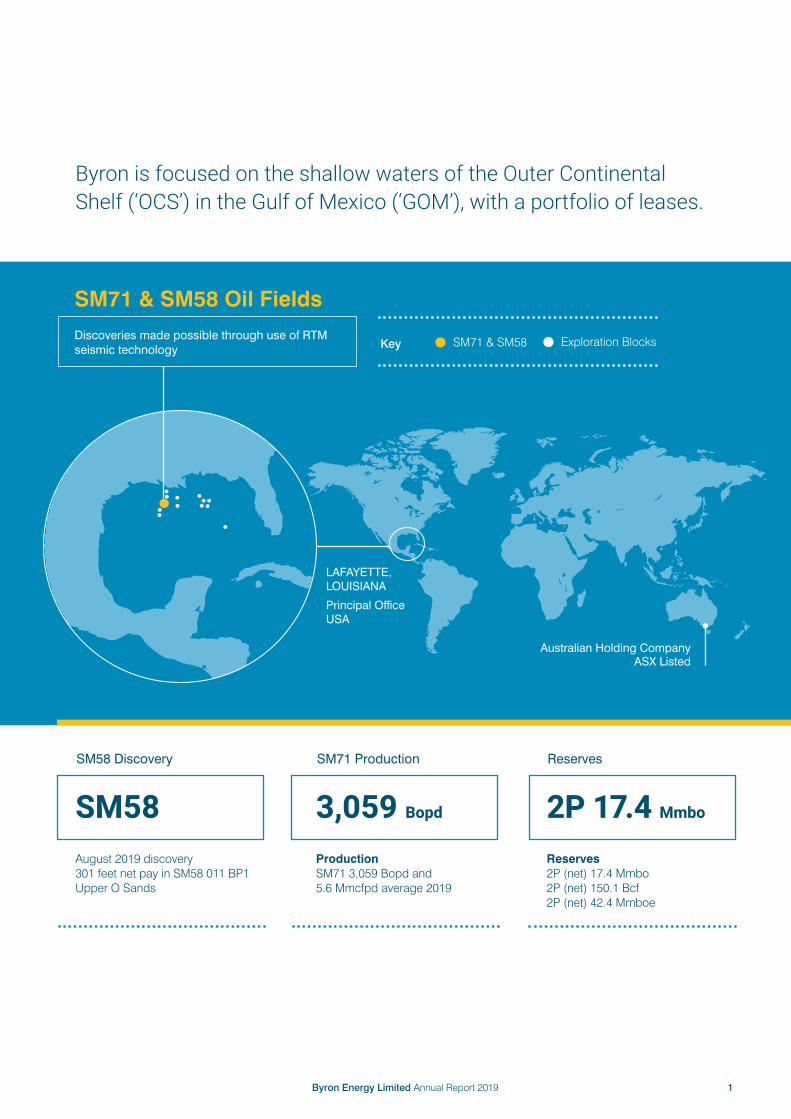
Byron is focused on the shallow waters of the Outer Continental Shelf (‘OCS’) in the Gulf of Mexico (‘GOM’), with a portfolio of leases.
LAFAYETTE, LOUISIANA
Principal Office USA
Australian Holding Company ASX Listed
SM58 Discovery SM71 Production Reserves
SM58 3,059 Bopd 2P 17.4 Mmbo
August 2019 discovery 301 feet net pay in SM58 011 BP1 Upper O Sands
ProductionSM71 3,059 Bopd and 5.6 Mmcfpd average 2019
Reserves2P (net) 17.4 Mmbo2P (net) 150.1 Bcf2P (net) 42.4 Mmboe
Gulf of Mexico
SM71 & SM58 Oil Fields
Discoveries made possible through use of RTM seismic technology Key Exploration BlocksSM71 & SM58

Byron Energy Limited Annual Report 20192
Chairman’s Letter
Overall our reserves and resources position as at 30 June 2019 is very strong. Remaining 2P reserves as of 30 June 2019, net to Byron, were 17.4 Mmbbl of oil and 150.1 Bcf of gas, an increase of 118% for oil and 17% for gas over the 2018 year.
Dear Shareholder,
In 2018/19 we enjoyed the first full year of production at SM71 where we produced approximately 1.1 million barrels of oil (gross) and 2.0 billion cubic feet of gas (gross). Byron’s share of production for the year ended 30 June 2019 was 0.45 million barrels of oil and 0.8 billion cubic feet of gas, generating US$31.0 million in net revenue and US$28.2 million in net cash flow.
The SM71 facility has produced over 1.5 million barrels of oil and 2.3 billion cubic feet of gas (gross) since initial production began on 23 March 2018. Importantly, the primary D5 reservoir, which accounts for most of the production, has yet to produce any formation water.
Overall our reserves and resources position as at 30 June 2019 is very strong. Remaining 2P reserves as of 30 June 2019, net to Byron, were 17.4 Mmbbl of oil and 150.1 Bcf of gas, an increase of 118% for oil and 17% for gas over the 2018 year. Our 100% owned SM58 lease, where we encountered 301 feet of net hydrocarbon pay, was the main contributor to the jump in our 2P reserves.
In early August 2019 Byron spudded the SM58 011 well to test the Cutthroat Prospect which is very similar in trapping style to the D 5 reservoir productive in the SM71 F1 and F3 wells drilled by Byron in 2016/17. Porosity logging confirmed a substantial hydrocarbon column with electric logs indicating 302 feet gross pay (271 feet net TVT pay) in the primary target Upper O Sand.
Mud Gas Isotope analysis shows a liquids rich gas with high quality oil. The Upper O Sand exhibits extremely good reservoir characteristics and a high production rate completion is expected. The subsequent SM58 O11 BP1 well, drilled after mechanical difficulties were encountered with the original hole, has a true vertical thickness net pay of 301 feet compared to 271 feet of net pay in the original hole. On the strength of this exceptional result Byron has commenced construction work on its recently acquired production platform.
Byron set a 5½ inch production liner across the Upper O Sand for its future completion and drilled deeper to evaluate the Lower O sand interval. Mud log data indicated a total hydrocarbon bearing thickness with good oil shows in the Lower O section of between 180 and 250 feet. Poor hole conditions prevented the running of wireline logs and the well was then temporarily suspended to await the installation of the production platform in 2020.
At SM71 the 2P reserves were 4.4 Mmbbl of oil and 3.1 Bcf of gas, compared to 5.9 Mmbbl of oil and 4.2 bcf of gas. After accounting for actual 2019 production, the Proved Expected Ultimate Recovery has increased by 18% to 3.1 MMBOE from 2.6 MMBOE in 2018.
During the 2019 year we took decisive steps to increase and upgrade our portfolio of drillable prospects, starting with the acquisition of a 100% Working Interest and operatorship in the SM58 lease above 13,639 ft. true vertical depth, and a 53.0% non-operated interest in SM58 E1 production well, reserves,
Net Revenue 2019
US$31.3m SM71 and SM58 E#1
3P Reserves
25.1 Mmbbl199.2 bcf
Prospective Resources
31.6 Mmbbl 551.1 Bcf (before SM58 update)

Byron Energy Limited Annual Report 2019 3
and associated SM69 E platform and flowlines. We also entered into an agreement with the SM69 leasehold interest owners for the drilling of a SM69 E2 well off the recently acquired E platform. Additionally, we acquired the SM60 block at the March 2019 Lease sale.
The rationale for the acquisition of the SM58 lease was confirmed by our first well the SM58 011 discovery. This lease also provides access to significant additional exploration and development opportunities. SM58 is located immediately between Byron’s SM57, SM59 and SM60 leases which when combined provide Byron with contiguous exploration acreage across the northern half of the SM73 salt dome field.
The RTM and VIP proprietary seismic reprocessing undertaken with Western Geophysical which detailed the potential of our SM58 Cutthroat Prospect also resulted in a downgrade of the VR232 and VR251 blocks’ prospectivity. Consequently, we disposed of our interests in these blocks as well as our interest in the small EI18 block.
The low risk nature of the drilling opportunities identified on SM58 prompted a review of Byron’s drilling timeline with the SM58 well being brought forward ahead of the EI77 and EI63 wells.
In addition to substantially adding to our inventory of drillable prospects, we were also active drilling wise. Unfortunately, the Weiss Adler et al #1 well on the Bivouac Peak leases, and SM74
D14 on the SM74 leases were unsuccessful. While both of these prospects were potentially rewarding they were considered to be at the more geologically risky end of our risk/reward spectrum, and were consequently farmed out to various companies to reduce our financial exposure.
Our successful drilling at SM58, with SM58 011 well, has generated another exciting development opportunity for Byron in 2020, to significantly increase our production and revenue.
Finally, I want to thank our management team, employees and contractors for their continued hard work and dedication, as well as our non-executive directors for their guidance and support. With producing assets at SM71, an exciting discovery at SM58 and an inventory of first-rate drillable prospects, we believe that Byron is well positioned to create substantial additional shareholder value. We are very enthusiastic and excited about the opportunities in front of us.
Doug BattersbyChairman
SM58 platform jacket on transport barge heading to construction yard in Louisiana

Byron Energy Limited Annual Report 20194
Message from the CEO
Dear Fellow Shareholder, There’s no doubt that we live in an increasingly complex and demanding world, and for corporations, this translates into ever more regulations, compliance issues, and a general requirement to be more in tune with society’s views of what constitutes good corporate governance and citizenship. Perhaps, for this reason, some corporations have many goals that are not necessarily consistent with the best interests of their shareholders and which can often result in costly distractions. Some companies seek to influence society, while others are primarily managed for the benefit of a few employees or shareholders. The management at Byron takes its corporate responsibilities, particularly as an operator in the Gulf of Mexico, very seriously and always meets or exceeds all environmental and operational government regulations. By way of example, the Company recently received a rare commendation letter from the Bureau of Ocean Energy Management praising the performance of the SM71 field operations group upon the conclusion of their annual safety and compliance inspection. Beyond this, Byron’s principal objective is to provide its shareholders with the best return possible on the capital that we have all invested. This year I thought it would be appropriate and timely to discuss our management’s principal goals and strategies employed to help achieve this core objective.
One of the most critical and often hardest decisions management is required to make, is to correctly assess the risk versus reward equation on every prospect that we generate before drilling. This assessment is an essential part of the decision making process at Byron as it is both the project operator and originator of all of its prospects.
At Bivouac Peak, for example, the Company assessed the geological risk as a one in three chance of success and farmed out over two-thirds of the cost of this well. With the SM74 D14 well, we assessed that there was a drilling risk associated with the play, along with a reasonably high level of geological risk due to the prospect’s depth and location in a high-pressure section. With this in mind, Byron sought a farmin partner to take on 40% of the cost of the well in return for a 30% Working Interest (WI). In hindsight, I’m comfortable with the level of exposure that Byron
retained in each of these wells. While we always plan and hope for a successful outcome, drilling successful oil and gas wells is never a certainty, and risk management is a critical part of the business.
At SM58, we took a different approach and decided to retain a 100% WI in the block. Initially, we evaluated SM58 using our 2013 Reverse Time Migration (RTM) seismic data, which indicated that several high-quality undrilled opportunities remained in the lease. Unfortunately, SM58 was owned by another company which rejected Byron’s multiple offers to farmin to the block. Nearly a year after our initial approach, Byron had the necessary funds to make a US$4.25 million dollar cash offer, which was subsequently accepted earlier this year, emphasising the value of patience in this industry.
At the time of the cash offer, SM58 had less than 200,000 barrels of proved producing reserves, and our offer was attractive enough to convince the previous owner to part with the block. Our latest 2018 RTM seismic data re-confirmed our original 2013 interpretation as well as indicating the presence of additional low risk, high reward opportunities on the block. This more recent interpretation gave Byron the added confidence to retain a 100% WI in the lease and drill the successful and very important SM58 011 well. The decision to maintain a 100% in this project has proved transformational for the Company and will be the foundation for Byron’s continued growth into the future. The significance of this decision is further underscored by the booking of 14 million barrels of oil and over 40 billion cubic feet of gas (‘BCF’) 2P reserves with a Net Present Worth (NPW @ 10% pre-tax) of over A$500 million, at today’s exchange rate, on the SM58 lease. Work is currently underway to refurbish and ultimately install the G platform, which was purchased earlier this year in anticipation of a successful result in the SM58 011 well. The Company estimates the total cost of this work, including pipeline installation, at US$24.5 million, which it currently intends to finance through an appropriate debt facility.
All of these decisions are directly related to the goal that we at Byron have set for ourselves. Some companies focus on short term goals often associated with production rates and overall volumes. However, Byron concentrates primarily on the cost of production, as in the long term, that is the surest way to profitability. You only have to look at the plight of the shale oil companies to understand the folly of focusing on volume alone.
At Byron, we focus solely on the shallow water shelf of the Gulf of Mexico, with its extensive and readily accessible infrastructure, very low operating costs, and premium-priced oil.

Byron Energy Limited Annual Report 2019 5
2019 2020 2021 2022
Jul
Aug
Sep
Oct
No
v
Dec
Jan
Feb
Mar
Ap
r
May
Jun
Jul
Aug
Sep
Oct
No
v
Dec
Jan
Feb
Mar
Ap
r
May
Jun
Jul
Aug
Sep
Oct
No
v
Dec
Jan
Feb
Mar
SM58 #1
Mudline Suspended
SM71 F4
SM71 F5
SM58 Set GPlatform
Drill G2 & G3
SM69 E2
SM58 Drill G4
SM58 Drill G5
SM58 Drill G6
SM58 Drill G7
SM58 Drill G8
Byron Projected Activity Time-Line*
* This schedule and timeframe may be subject to change due to operational requirements and external influences such as drilling rig availability, weather conditions and relevant regulatory approvals. The projected activity time-line is subject to change without notice and the Company assumes no responsibility or obligation to update publicly the projected activity.
First Production(assuming successful drilling)
First Cash Flow(assuming successful drilling)
Option for accelerated timing
SM58 G platform under construction
Option for accelerated timing

Byron Energy Limited Annual Report 20196
Message from the CEO continued
Oil versus gas content is also a key consideration for Byron. The standard industry ‘Barrels of Oil Equivalent’ (BOE) measurement is 6 BCF of gas is the energy equivalent of 1 million barrels of oil. However, in the current economic environment in the Gulf of Mexico, it takes at least 20 BCF of gas to be revenue equivalent to 1 million barrels of oil, making BOE a measurement which can often be misleading to investors. In the current oil and gas price environment, Byron is primarily focused on projects with high oil content. The Company will only consider gas projects if the assessed potential gas opportunity exceeds 50 BCF and is producible from a maximum of two or three wells. At Byron, we focus solely on the shallow water shelf of the Gulf of Mexico, with its extensive and readily accessible infrastructure, very low operating costs, and premium-priced oil. We also focus on reserves that have a low finding, development, and production (FD&P) cost, which is the crucial component in determining profitability. At SM71, our FD&P cost to date is a very low US$14/barrel. We expect the FD&P cost at SM58 will be even lower, primarily due to its more substantial reserves. Balancing debt, speed of development, and the need to raise equity capital from the market is often senior management’s greatest challenge, particularly in the early growth stages of a small Exploration and Production (E&P) company like Byron. This balance is critical to maximise shareholder return.
The senior management at Byron has a long and proven track record of striking the necessary balance between debt and equity, with the goal always being to benefit the shareholder. Byron management is very focused on share price, not just because we are personally large shareholders, but also because our core management philosophy, has always been to maximise shareholder return.
Having witnessed the damage caused to other small E&P companies by excessive debt, it is not hard to conclude that sometimes it’s better to reduce activity to preserve capital,
minimise debt and forgo excessive, dilutive capital raises from the share market. Having said this, management still considers taking on an appropriate and conservative level of debt at the right time as a useful tool in accelerating growth while minimising shareholder dilution. The Company is currently pursuing several potentially significant debt-related facilities to augment its cash flow and to provide the necessary funds to develop the SM58 field and allow Byron to execute its ambitious drilling program.
Keeping the above principles in mind, we can now clearly state our Company’s ultimate goal, which is to maximise shareholder returns in the minimum amount of time. This goal is measured by one number, and that is simply our share price. Byron is a results-driven company, and based on the timeline shown, within 18 months, the Company should be producing somewhere between 7,000 and 10,000 barrels of oil per day, net to Byron, after installing the SM58 facility and having drilled and completed at least five development wells. This production, combined with our substantial prospect inventory, which has over 25 high-quality undrilled prospects remaining on our 100% owned acreage, should drive Byron’s share price higher well into the future. While the market will ultimately determine the share price of our Company, I would be personally disappointed if the share price was not well over one dollar within 18 months. This share price is an ambitious goal but one by which our shareholders can measure management performance, in the near to medium term. In closing, I wish to thank all of our loyal shareholders for your patience and the support you have given the Company over the last few years. You can rest assured that the management at Byron will continue to work diligently to make decisions which it considers to be in the best interest of all shareholders, to deliver on this ambitious goal.
Maynard SmithCEO

Byron Energy Limited Annual Report 2019 7
SM58 platform jacket on transport barge heading to construction yard in Louisiana

Byron Energy Limited Annual Report 20198
Review of Operations
As of 30 June 2019, Byron is the operator and 100% Working Interest (‘WI’) holder in 5 blocks around the SM73 field, comprising SM57/58/59/60/70 and Byron is the operator of SM71 and SM74, where it has less than a 100% WI. Byron also had a 53% WI (44.17% Net Revenue Interest (‘NRI’) in the Ankor operated, SM58 E1 well production, reserves, and associated SM69 E platform and Flowlines. In addition, Byron has entered into Farmin agreement to earn a 100% WI and to operate future exploration activities of the north-east portion of SM69.
Introduction2019 was a year of achievement for Byron with large increases in oil production, revenue and reserves.
Byron Energy Gulf of Mexico Lease Map and Asset Description
Annual oil production
UP by 220% to 453,527 bbls
EBITDAX
UP by 378% to US$23.8m
Revenue
UP by 229% to US$31.3m
2P Oil Reserves
UP by 118% to 17.4 MMbo

Byron Energy Limited Annual Report 2019 9
The SM73 field encompasses nine OCS lease blocks (81 square miles) which overlie a large piercement salt dome. The salt dome is responsible for providing the trapping mechanism for production in all portions of the SM73 field. The SM73 field is productive from discrete hydrocarbon-bearing sandstone reservoirs which are primarily trapped in three-way structural closures bound either by salt or stratigraphic thinning, on their updip edge. These reservoirs are Pleistocene to Pliocene age sands ranging in depth from 5,000 feet to 8,800 feet Total Vertical Depth (‘TVD’). The majority of the field production has come from depths less than 7,500 feet in high-quality sandstone reservoirs.
In 2018/19, Byron undertook high effort seismic reprocessing of approximately 172 square miles (445 square kilometres) or 22 OCS lease blocks of high-quality, modern seismic data the Company previously licensed from WesternGeco, a Schlumberger company. The goals of the project were to improve the resolution and subsurface imaging of Byron’s existing licensed 3D seismic data in the South Marsh Island area where Byron holds a number of leases. For further details on the South Marsh Island WesternGeco RTM Seismic Reprocessing Project, see below.
South Marsh Island 71 – on productionByron owns a 50% WI and a 40.625% NRI in the South Marsh Island 71 (‘SM71’) block in the SM73 field. Byron is the designated operator of SM71 with Otto Energy Limited group (‘Otto’) holding an equivalent WI and NRI. Water depth in the area is approximately 137 feet.
First production from SM71 commenced on 23 March 2018 from the SM71 F platform constructed and installed by Byron.
The F1 and F3 wells were completed in the primary D5 Sand reservoir and the F2 well was completed in the B65 Sand, and subsequently completed in the B55 Sand, a secondary exploration target.
Early in July 2019, the SM71 facility surpassed the 1.5 million barrels of oil (gross) production milestone. The D5 reservoir has yet to produce any formation water. Reservoir performance matches previous assumptions from downhole pressure analysis and the D5 reservoir is showing significant aquifer support. The facility has also produced over 2.3 billion cubic feet of gas which, on a revenue basis, is approximately equivalent to an additional 123,000 barrels of oil.
Byron Energy GOM South Marsh Island Leases and RTM Data Coverage Area

Byron Energy Limited Annual Report 201910
Review of Operations continued
The following SM71 project metrics underscore why the Gulf of Mexico is an attractive basin in which to explore, develop and produce hydrocarbons:
• The US$52 million SM71 project payback period, based on net cash flow was achieved in less than 12 months, as reported to the ASX on 15 January 2019; except for pipeline related downtime, the facility has experienced less than 1% downtime since commencement of production and there have been no recordable accidents or environmental incidents.
• Lease Operating Expense (‘LOE’), inclusive of all insurance, has averaged approximately US$4.30 per barrel of oil for the year ended 30 June 2019.
• Byron’s full cycle (i.e., life of property) net 2P Find and Develop Cost for SM71 is calculated at approximately US$7.90/BOE.
• For the year ended 30 June 2019, Byron has realised an average oil price of approximately US$62 per barrel after adjustments for oil quality, transportation, shrinkage and other miscellaneous costs making SM71 an exceptionally profitable project. The high-quality oil produced at SM71 commands a Louisiana Light Sweet (‘LLS’) crude pricing premium that has averaged approximately US$5.60 per barrel over WTI pricing during the same time period.
• Over the same period, Byron has realised an average gas price after transportation deductions of approximately US$2.79 per mmbtu.
SM71 production statisticsProduction for the year ended 30 June 2019 is shown in the table below.
SM71 production (sales)
Year ended 30 June
2019
Year ended 30 June
2018
Gross production Oil (bbls) 1,116,375 348,581Gas (mmbtu) 2,213,706 300,430
Byron share of gross production (50% WI)Oil (bbls) 558,188 174,291Gas (mmbtu) 1,106,853 150,215
Net production (Byron share 40.625% after royalty)Oil (bbls) 453,527 141,611Gas (mmbtu) 899,318 122,050
Sales revenue US$ Million US$ MillionNet sales revenue (Byron share 40.625% after royalty, transportation and other applicable adjustments) $31.0 $9.5
South Marsh Island 71 (SM71) Project Summary and Update
Joint Venture Partners Byron Energy Otto Energy
Operator Byron Energy Inc.Water Depth 40 meters (131’)Previous SM71 Production 3.9 mmbo + 10 bcfAcquired OCS Sale 222 June 2012 Byron Interest 50% WI, 40.625% NRIByron #1 (F1) discovery well April 2016, 132 TVT NFO F platform Installation Completed October 2017
Byron F2 and F3F2 November 2017, 205 TVT NFOF3 January 2018 , 175 TVT NFO
Initial Production (Three Wells) F1, F2 and F3F1 first prod. March 2018F2 and F3 first prod. April 2018
Total Gross Project Oil and Gas Produced from March 2018 to 30 June 2019
1.5 Mmbo + 2.3 Bcf
Net 2P Remaining Reserves 4.4 Mmbo and 3.1 Bcf
SM71Reserve Summary
Gross ReservesRemaining 7/1/19
Net ReservesRemaining 7/1/19
MBO MMCF MBO MMCF MBOE1P Proved 5,125 3,897 2,082 1,583 2,346Probable 5,605 3,626 2,277 1,473 2,5232P 10,730 7,522 4,359 3,056 4,869Possible 2,693 1,868 1,094 759 1,2213P 13,423 9,391 5,453 3,815 6,090Prospective 3,665 49,570 1,489 20,138 4,845

Byron Energy Limited Annual Report 2019 11
As at 30 June 2019, the SM71 wells were producing at a gross combined daily rate of approximately 3,200 barrels of oil and 5.0 million cubic feet of gas. There was no water production. The month of June 2019 was the highest month of production since August 2018. During June 2019, production averaged 3,250 barrels of oil and 5.4 million cubic feet of gas per day.
For the year ended 30 June 2019, Byron’s share of net revenue after royalties, price differentials and deductions for transportation, oil shrinkage and other applicable adjustments, was approximately US$31.0 million compared to US$9.5 million for the year ended 30 June 2018. For the year ended 30 June 2019, net oil revenue was US$28.2 million compared to US$9.2 million for the comparable period in 2018. Net gas
revenue was US$2.85 million for the year ended 30 June 2019, compared to US$0.3 million for the year ended 30 June 2018.
The increase in net revenue in 2019 was due to higher production volumes with a full year’s production in 2019 compared to approximately three months of production in 2018.
Lease operating expenses, which include base lease operating expenses, insurance, workovers, if any, and facilities maintenance, increased by US$1.75 million, or 170.0%, to US$2.65 million in 2019 compared to US$0.9 million in 2018, reflecting higher production. On a BOE basis, lease operating expenses decreased to US$4.30 per BOE during 2019 compared to US$4.90 per BOE during 2018.

Byron Energy Limited Annual Report 201912
Review of Operations continued
SM71 developmentThe next phase of the SM71 development involves the drilling of SM71 F4 and SM71 F5 wells, to extend the D5 Sand reservoir, expected to commence in the March 2020 quarter.
Byron’s interpretation of the reprocessed seismic data, received earlier this year, under the South Marsh Island Project Seismic Reprocessing project from WesternGeco, a Schlumberger subsidiary, resulted in the identification of two areas in the D5 Sand reservoir which will not be drained efficiently by the currently producing SM71 F1 and SM71 F3 wells. To effectively drain these two areas, two additional wells will be needed to fully develop the D5 Sand reservoir at SM71.
The first of these wells, the SM71 F4, will test a D5 Sand reservoir anomaly that is outboard of the main D5 field. The second well, the SM71 F5, will test an area that will be poorly drained, if at all, by the F3. Both of these wells are included the Collarini 30 June 2019 report.
After the SM71 F4 and SM71 F5 wells are completed, assuming success, Byron expects the D5 reservoir at SM71 will be fully developed except for an attic well required in three or four years’ time.
At the end of June 2019, proved reserves were 2.35 million barrels of oil equivalent (‘MMboe’), net to Byron, 4% lower than 2018, replacing 82% of production. After accounting for actual 2019 production, the proved Expected Ultimate Recovery (‘EUR’) has increased by 18% to 3.1 MMboe from 2.6 MMboe in 2018.
SM71 D5 Sand with F4 and F5 Development Wells
SM71 F4 and F5 Wells US$MM
F4 drill and complete 10.8F5 drill and complete 11.2Total (Gross 100%) 23.0
SM71 F4 and F5 ‘D5 Sand’Gross 3P Reserves and Resources MMBO BCF
F4 – Sausage Prospect (Gross Resources)
1.3 0.75
F5 – Silo Prospect (Gross 3P Reserves)
3.4 2.01

Byron Energy Limited Annual Report 2019 13
South Marsh Island 58 – under developmentDuring the March 2019 quarter, Byron closed the acquisition of South Marsh Island Block 58 (‘SM58’) and associated SM69 assets, for US$4.25 million with an effective date of 1 January 2019.
Byron’s SM58 acquisition comprises:
• 100% WI (83.33% % NRI) in the SM58 Lease to a depth of 13,639 ft TVD; and 50% WI (41.67% NRI) below 13,639 ft. TVD with a third party currently holding the remaining 50% WI under an existing Joint Exploration Agreement;
• 53% WI (44.17% NRI) in the SM58 E1 well current production, reserves, and associated SM69 E platform and flowlines;
• 53% WI (44.17% NRI) in the reserves and prospective resources; and
• Operating Rights to all depths on SM58, excluding the E1 wellbore which is operated by the SM69 operator off the jointly owned SM69 E platform.
SM58 is located immediately between Byron’s SM57 and SM59 leases, which when combined provide Byron with contiguous exploration acreage across the northern half of the SM73 field.
In addition to the producing E1 well, Byron has to date, identified seven additional well locations on SM58 in the shallow section above 13,639 ft. subsea. All seven of these prospects can be tested without drilling through geo-pressure, which greatly reduces most of the drilling risk and cost overruns associated with drilling in the GOM. Four of the seven locations will test development prospects in reservoirs which have been productive in down dip locations which reduces the geologic risk and greatly enhances the likelihood of success. All seven wells can be drilled from a common surface location.
The other three locations, identified by Byron, will test exploration prospects which Byron considers to be low to moderate risk.
The low-risk nature of the drilling opportunities identified on SM58 has prompted a review of Byron’s previously announced drilling timeline to the market with SM58 now being brought forward ahead of the EI77 and EI63 wells.
Subsequent to the end of the financial year, Byron spudded the South Marsh Island 58 011 (‘SM58 011’) well on its Cutthroat Prospect.
South Marsh Island 58 (SM58) Project Summary and Update
Owner Byron Energy
Operator Byron Energy Inc.Water Depth 37 meters (121’)Previous SM58 Production 35.8 mmbo + 265 bcfAcquired Jan 1st 2019 from Fieldwood Energy (incl. SM58 E1/69 Platform)
US$ 4,250,000
Byron Interest 100% WI, 83.33% NRIByron #1 (G1) discovery well September 2019, 301’ TVT Hydrocarbon PayPlatform and Pipelines Cost US$24.5 million approxG Platform Installation Completed and Installed Target September 2020Byron G2,3,4,5,6,7 and 8 drilling program March qtr 2021Net 2P Remaining Reserves 10,305 mbo + 33,498 mmcf

Byron Energy Limited Annual Report 201914
Review of Operations continued
Electric log calculations from the SM58 011 original hole, as reported on 29 August 2019, indicated 302 feet gross (271 feet net) of True Vertical Thickness (‘TVT’) net pay. The logs confirmed a thick, clean, high-quality Upper O Sand with average porosity above 30%. As reported on 16 September 2019, the SM58 011 BP01 bypass well, only 60 feet from and structurally flat to the original hole, encountered a net pay interval that was 30 feet thicker than the Upper O Sand in the original SM58 011 well as determined from the resistivity and gamma ray LWD tools. The Byron SM58 011 BP1 well has 301 feet of TVT net pay. The SM58 011 wells have logged the thickest O Sand hydrocarbon column within the entire SM73 field in which over 350 wells have been drilled.
The Cutthroat Prospect lies up-dip to the Shell SM58 9ST1 well that logged over 500 feet of high-quality, wet O Sands in 1988. The Cutthroat Prospect is very similar in trapping style to the productive SM71 F1 and F3 wells drilled by the Company in 2016. The combination of lateral faulting and up-dip pinch out of sands controlled by the SM73 salt dome is common to nearly all the production from the SM73 field. Additionally, the prospect demonstrates seismic attributes consistent with hydrocarbons in the field.
SM58 O Sand with BYE #11 BP1 Discovery

Byron Energy Limited Annual Report 2019 15
SM58 planned developmentCollarini has assigned 2P undeveloped reserves (net to Byron) of 10.3 Mmbbl and 33.5 Bcf to SM58. Collarini has also assigned 3.9 Mmbbl and 5.1 Bcf (net to Byron) in possible reserves in SM58. Most of the 2P reserves are accounted by the Cutthroat and Steelhead prospects.
Byron plans to develop the SM58 project over the next 12–15 months. Initial engineering studies on structural modifications to the jacket and decks have been completed in order to fast track construction of the recently acquired platform. Byron purchased a production platform consisting of two decks, a jacket and production equipment from a private company for a total price of US$1.0 million. Significant time savings of six to nine months and cost savings in the order of US$4– 6 million are expected through the purchase of this facility.
Work has begun to remove existing production equipment from the platform for refurbishment. The facility is being redesigned to accommodate up to 8,000 barrels of oil per day, 80 million cubic feet of gas per day and 8,000 barrels of water per day. Pipeline design and route surveying is also underway. Following completion of construction and installation of the SM58 G platform, Byron will also need to construct and install a
4” (1,000 ft) oil pipeline to the tie in point in the Crimson oil transportation pipeline and 8” gas pipeline (7.5 miles) to tie in point in the Kinetica gas pipeline. Once the SM58 G platform has been installed, Byron plans to drill two more wells on SM58. Assuming success, the three wells, including the SM58 011 discovery well, would be completed for production, with initial production expected in the March quarter of 2021.
SM58 Facility and Pipeline Plan
SM58 Development ‘G Platform’ Complete and Installed September 2020 US$MM
Platform – (Engineering, Structural Modifications and Refurbishment)
14.7
Platform installation 3.2Pipelines 6.6Total 24.5

Byron Energy Limited Annual Report 201916
Review of Operations continued
SM58 production statistics (SM58 E1)SM58 production for the year ended 30 June 2019 is shown in the table below.
SM58 production (sales)
Six months ended
30 June 2019
Year ended
30 June 2018
Gross production Oil (bbls) 19,693 -Gas (mmbtu) 10,756 -
Byron share of gross production (53% WI)Oil (bbls) 10,497 -Gas (mmbtu) 5,736 -
Net production (Byron share 44.17% after royalty)Oil (bbls) 8,693 -Gas (mmbtu) 4,751 -
Sales revenue US$ Million US$ MillionNet sales revenue (Byron share 44.17% after royalty January–June) 0.5 -
Production from the SM58 E1 wellbore flows from the SM69 E platform to the SM69 B platform where separation and processing occurs. The SM69 E platform is a recently constructed (2013) two slot structure with one well slot utilised, one available, and offers expansion potential of an additional third slot.
In the June quarter 2019, the SM58 E1 well gross daily production was increased to 210 bopd (111 bopd net to Byron). After joint discussions with the operator, ANKOR Energy LLC, optimisations were made to the gas lift system in early June which resulted in a gross increase from 60 bopd to 210 bopd.
Byron holds a non-operated 53% WI (44.167% NRI) in the SM69 E platform, the SM58 E1 wellbore, and the E platform to B platform pipelines located within SM69. ANKOR Energy LLC is the operator of the SM69 E platform.
Exploration leases – salt dome leases South Marsh Island WesternGeco RTM Seismic Reprocessing ProjectIn April 2018, Byron executed an agreement with WesternGeco, a Schlumberger subsidiary, to add additional licensed 3D seismic data to its in-house data inventory and to perform new, high-effort seismic data processing over the SM71 project area in the Gulf of Mexico.
SM58 Collarini 3P Gross Reserves and Resources by ProspectSM58 Collarini Gross 1P Reserves MMBO BCF
Cutthroat/Steelhead O sand (Upper) 0.70 14.06
Rainbow Trout 1.89 1.86Tiger Trout 1.03 1.11Brown Trout 0.85 0.66Dolly Vardon 0.00 0.00Green Back 0.42 10.98E1 and E1St (Attic) 1.48 2.24Total 1P 6.37 30.91
SM58 Collarini Gross 2P Reserves MMBO BCF
Cutthroat/Steelhead O Sand (Upper) 6.05 20.90
Rainbow Trout 2.50 2.50Tiger Trout 1.41 3.40Brown Trout 1.12 1.53Dolly Vardon 0.84 0.89Green Back 0.42 10.98E1 and E1St(Attic) 1.54 2.30Total 2P 13.88 42.5
SM58 Collarini Gross 3P Reserves MMBO BCF
Cutthroat/Steelhead O Sand (Upper) 10.30 26.34
Rainbow Trout 2.50 2.50Tiger Trout 1.41 3.40Brown Trout 1.61 2.15Dolly Vardon 0.84 0.89Green Back 0.42 10.98E1 and E1St (Attic) 1.54 2.30Total 3P 18.62 48.56
SM58 Gross Prospective Resource MMBO BCFCutthroat/Steelhead O Sand (Lower) 9.69 12.25North Cutthroat O Sand (Lower) 3.15 4.52Dolly Vardon 0.62 18.57Total Prospective Resource 13.46 35.34

Byron Energy Limited Annual Report 2019 17
SM58 Initial Upper O Sand Development Wells G2, G3 and G4
As announced on 3 May 2018, Byron undertook high-effort seismic reprocessing of approximately 172 square miles (445 square kilometres) or 22 Outer Continental Shelf lease blocks of high-quality, modern seismic data the Company previously licensed from WesternGeco, a Schlumberger company. The goals of the project were to improve the resolution and subsurface imaging of Byron’s existing licensed 3D seismic data in the South Marsh Island area where Byron currently holds eight leases.
There were four key issues addressed during the project: (i) improve signal to noise ratios by using new pre-processing techniques; (ii) verify that the wavelet phase of the data is zero phase in order to accurately tie existing well control; (iii) perform new Reverse Time Migrating (‘RTM’) and Kirchhoff Prestack Depth Migration (‘KDM’) at higher frequencies to improve data resolution; and (iv) to generate seismic inversion volumes to allow a deeper investigation of seismic amplitude responses and predict lithology. Other processing products created include Vector Image Partition processing and Common Depth Point gathers for both the Reverse Time Migration and KDM data volumes allowing for Amplitude Verses Offset analysis to further evaluate seismic responses across known hydrocarbon accumulations and allow comparisons of responses of prospects.
This work was carried out by a team of 11 experienced professionals at WesternGeco, a recognised leader in seismic processing and was completed in late March of 2019. At the end of March, all final data products have been delivered and interpretation work has been ongoing. Byron personnel worked closely with the WesternGeco team and provided insight on the geologic setting of the project area and ensured that all geophysical concerns were addressed.
The result is a data set with greatly improved signal to noise ratios, higher frequency content and a consistent wavelet phase across all portions of the project. Additionally, the ability to create seismic volumes using Vector Imaging Partitioning (‘VIP’) data has increased Byron’s ability to more accurately map the subsurface in complex areas of the project. While interpretation work is ongoing, Byron has already seen the benefits of this processing work in the generation of several new prospect opportunities on its existing leasehold acreage, especially SM58, where multiple prospects have been generated and well planning was completed for a well, SM58 011, to test an undrilled O Sand prospect. SM58 011 spudded in early August 2019.
SM58 Initial Development WellsOctober 2020 – January 2021 US$MM
G2 drill and complete 11.2G3 drill and complete 11.2G4 drill and complete 11.2Total 33.6
SM58 ‘Upper O Sand’Gross 3P Reserves MMBO BCF
Cutthroat/Steelhead (3P Reserves) 10.3 26.3Brown Trout (3P Reserves) 1.6 2.2Total 11.9 28.5

Byron Energy Limited Annual Report 201918
Review of Operations continued
South Marsh Island 57 and 59Byron currently holds a 100% WI and an 81.25% NRI (royalty rate of 18.75%) in SM57/59, acquired at the Gulf of Mexico OCS Lease Sale 247 held on 22 March 2018 in New Orleans, Louisiana.
Theses leases are in close proximity to Byron’s SM71 producing platform and increase Byron’s footprint in the South Marsh Island 73 field. Water depth in the area is approximately 125 feet.
The SM57/59 blocks, as part of the larger SM71 project area, are focus areas of the WesternGeco RTM Seismic Reprocessing Project which Byron undertook with Schlumberger’s subsidiary WesternGeco, as outlined above, to help evaluate potential future exploration drill sites.
South Marsh Island 70Byron has a 100% WI and 87.5% NRI (royalty rate of 12.5%) South Marsh Island 70 (‘SM 70’), acquired at the Gulf of Mexico OCS Lease Sale 250 held on Wednesday 21 March 2018 in New Orleans, Louisiana.
Byron has identified several higher risk exploratory leads on SM70. These leads are being evaluated following completion in late 2018 of Byron’s WesternGeco RTM Seismic Reprocessing Project, as outlined above.
South Marsh Island 69In April 2019, Byron executed a non-binding letter of intent with the South Marsh Island Block 69 (‘SM69’) leasehold interest owners for the drilling of a SM69 E2 well off the recently acquired SM69 E platform (see above).
SM69 B65 Sand with E2 Exploration Well
SM69 E2 Exploration WellFebruary 2021 US$MM
E2 – Drill and complete 10.8Total (Gross 100%) 10.8
SM69 E2 Gross 3P Resources MMBO BCFJ Sand (FB B) 290 198Brown Trout (3P Reserves) 1.6 2.2B65 Sand (FB B) 751 632L2 Sand (FB B) 632 211M6 Sand (FB B) 235 859N2 Sand (FB B) 211 409Total 2,905 2,540
BYRON/ANKOR SM69
E Platform

Byron Energy Limited Annual Report 2019 19
The SM69 E2 is one of several newly recognised lower risk opportunities in the SM58/69 area identified on Byron’s proprietary 2019 RTM/VIP data set.
The SM69 E2 wellbore is expected to be drilled to a measured depth of approximately 8,750 feet (8,120 feet True Vertical Depth) in six stacked amplitude supported sands in fault block ‘B’ on SM69. This fault block is interpreted to be an up-dip pool potentially fault separated from analogous production in the immediately adjacent fault block ‘A’ on SM58. Fault block A has to date produced a combined gross total of approximately 3.4 Mmbo + 4.3 Bcfg from multiple wellbores completed in zones equivalent to these six target sands. The primary target of the E2 well, the B65 (K4) Sand, has to date produced approximately 13 Mmbo in the SM73. Subsequent to 30 June 2019, Byron and the SM69 leaseholders finalised documentation of a formal Joint Exploration Agreement relating to the E2 well and the north-east 1/4 of the north-east 1/4 of SM69 lease block and related Production Handling Agreement.
The drilling of a SM69 E2 well under a Joint Exploration Agreement would build on the recent SM69 E platform acquisition by Byron and if successful will add to the E platform area asset value. The SM69 E2 opportunity provides a near term, low-risk drilling location in addition to those prospective resource opportunities previously identified on SM58. The drilling of the E2 well off the existing E platform provides a short timeline to first production (two to four months) in a success case.
As part of the recently announced SM58 transaction, Byron now holds a 53% WI (44.167% NRI) in the SM69 E platform, the SM58 E1 wellbore, and the SM69 E to SM69 B flowlines located on adjacent SM69; all part of the greater SM73 field. Under the Farmin agreement Byron has the right to earn 100% WI (83.33% NRI) in the E2 and related reservoirs in the NE1/4NE1/4 SM69 less, and subject to, a 3% NRI Overriding Royalty Interest (‘ORRI’) Before Project Payout (‘BPPO’), retained by the SM69 leasehold interest owners, which is then convertible at their election upon Project Payout to either a 6% ORRI or a 30% WI After Project Payout (‘APPO’)(i.e., the recovery by Byron of all E2 Project Costs, including but not limited to the E2 drilling, completion, construction, pipeline and facility modification, all leasehold burdens, and Lease Operating Costs attributable to the E2, until E2 Project Payout achieved). Byron shall operate the drilling and development of the E2 well with anticipated production operations provided by the SM69 operator, ANKOR E&P Holdings Corporation.
Production from the existing SM58 E1 wellbore flows from the SM69 E platform to the SM69 B platform where separation and processing occurs. The SM69 E platform is a recently constructed (2013) two slot structure with one well slot utilised, one slot available for the E2, and offers expansion potential of an additional third slot.
The securing of this SM69 letter agreement provides a basis for additional drilling off the SM69 E platform and potential production growth in a success case. Subsequent to the end of the financial year, Byron together with the SM69 operator and leaseholders finalised a Joint Exploration Agreement.
South Marsh Island 60Byron Energy Inc, a wholly owned subsidiary of the Company, was the apparent high bidder on the South Marsh Island 60 lease (‘SM60’), the only bid placed by the Company at the Gulf of Mexico, OCS Lease Sale 252 held in New Orleans, Louisiana on Wednesday, 20 March 2019. The lease was subsequently awarded to Byron by the Bureau of Ocean management (‘BOEM’).
Byron bid approximately US$188,000 as a bonus bid. Byron has a 100% working interest and an 87.50% Net Revenue Interest in the block.
From 1978 through 2006, nine wells completed for production on SM60 produced a combined total of 385 billion cubic feet of gas and 787,000 barrels of oil.
SM60 lies within the area of Byron’s WesternGeco RTM reprocessing project which was used to evaluate the prospect potential on the block.
SM60 added significantly to our prospect inventory and increased our footprint to the SM73 salt dome, in the shallow waters of the GOM.
South Marsh Island 74 The SM74 D14 well spudded on 15 May 2019, planning to drill to a depth of 16,464 feet MD (14,741 feet TVD).
As at 30 June 2019, the SM74 D14 well was drilling ahead at a depth of 13,780 feet Measured Depth (12,872 feet True Vertical Depth) planning to drill to a depth of 16,747 feet Measured Depth (14,726 feet True Vertical Depth). The well targeted three amplitude supported target sands prospective for oil and gas.
After encountering drilling difficulties, requiring a bypass well, SM74 D14 BP1 well was ultimately drilled to a depth of 14,933 feet MD/13,591TVD having drilled through the 13,000 Sand and also the 13,500 Sand which was the primary objective. Through the use of real-time gamma and resistivity logging tools, the well bore was deemed uncommercial and was plugged and abandoned. Because the first two primary objectives were wet and due to difficult hole conditions, it was decided not to drill deeper.

Byron Energy Limited Annual Report 201920
Review of Operations continued
Byron farmed-out a 30% working interest share of the SM74 prospect to Metgasco Limited (‘Metgasco’) on industry standard terms whereby Metgasco would earn its interest by paying 40% of the US$11.4 million initial well dry hole costs and Byron will pay the remaining 60%. On 18 July 2019 Byron announced that agreement had been reached with Metgasco to limit Metgasco’s financial exposure to the SM74 project. Byron capped Metgasco’s additional costs for the drilling of SM74 D14 well at A$1.75 million (in addition to US$4.5 million previously contributed by Metgasco). Byron’s share of SM74 D14 well cost incurred for the year ended 30 June 2019, were written off in the Company’s 30 June 2019 financial statements.
Vermilion 232 and 251VR232
Byron acquired a 100% WI and 87.5% NRI (royalty rate of 12.5%) in Vermillion 232 (‘VR232’) at the Gulf of Mexico OCS Lease Sale 250 held on 21 March 2018 in New Orleans, Louisiana.
As reported in the Company’s ASX release dated 9 May 2019, the new seismic processing has shown that the three prospective lead areas previously mapped on the block are not supported by the new data. With the new data processing the previously documented VR232 lead areas do not exhibit the same characteristics as known hydrocarbon accumulations in the same stratigraphic intervals, a key component in Byron’s prospect evaluation methods. When ranked against Byron’s other prospects in the area, VR232 does not make the Company’s list of drillable prospects.
In 2018, Otto elected under the Participation Agreement to participate in the acquisition of the VR232 lease which was burdened with both a carry on lease acquisition costs and a carry on any future initial test well on VR232. Based on Byron’s recent geological and geophysical assessment, the Company recommended to Otto that the VR232 lease be relinquished prior to the next annual lease rental due on or before 31 July 2019 or that Otto could elect to take full assignment of the lease. Otto elected to take the full 100% working and Net Revenue Interest and will maintain the VR232 lease. The necessary assignments and other documents to complete the transfer to Otto executed and submitted the BOEM for approval in June 2019.
VR251
Byron acquired 100% WI and 87.5% NRI in Vermilion 251 (‘VR251’) at the Gulf of Mexico OCS Lease Sale 250 held on Wednesday 21 March 2018 in New Orleans, Louisiana.
Byron had identified several higher risk exploratory leads on both VR251.
The VR251 lease was evaluated with the WesternGeco RTM Seismic Reprocessing Project, outlined above, and found that the initial prospect ideas on the block were also not supported. Consequently, Byron relinquished VR251 in July 2019.
Eugene Island blocks 62, 63, 76 and 77Byron acquired Eugene Island blocks 62, 63, 76 and 77 (‘EI77’), at Gulf of Mexico OCS Lease Sale 250 held on 21 March 2018 in New Orleans, Louisiana. Water depth in the area is approximately 20 feet.
Byron currently holds a 100% WI and an 87.5% NRI in EI77, reflecting the recently reduced Federal Government Royalty of 12.5% versus pre-2017 rate of 18.75%.
The EI77 blocks was designated as the Eugene Island 77 field in the 1960s and have produced 362 billion cubic feet of gas and 6.5 million barrels of oil from sands trapped by the Eugene Island 77 salt dome. Initial production from the field began in 1957. There is no production on these blocks currently.
In 2014, Byron engaged WesternGeco (a Schlumberger group company) to undertake a proprietary RTM of its 3D seismic data over the entire four block EI77 field. As a result of this work, Byron identified several exploration and development opportunities. In 2017 and 2018, Byron undertook a detailed year-long reservoir analysis which resulted in the identification of several low-risk development opportunities which are updip from productive reservoirs. On the basis of this work, in combination with the RTM, Byron significantly upgraded the reserve potential of EI77.
In the September quarter 2018, Byron began a reprocessing effort similar that undertaken on the SM71 project area with WesternGeco over all four Eugene Island blocks leased by the Company. The objectives of this work were to improve seismic imaging in some geologically complex portions of the project. The scope of work is focused on refining the sediment and salt velocity model. The final products will include new RTM migrations, Kirchhoff migrations and inversion products. VIP imaging will also be viable as post of the work scope and should prove to be extremely helpful in mapping the sediment – salt interface and delineating prospects. Final deliverables were received in the June quarter 2019.
Discussion with several drilling contractors for drilling of EI77 commenced during the December 2018 quarter but were paused, with SM58 wells now being brought forward ahead of the EI77 field wells.

Byron Energy Limited Annual Report 2019 21
EI77 field project map
EI76 Southern Fault Blocks West, A, B and C
Existing Central Oil and Gas Processing Facility at EI63
Unmanned Satellite Facility
Existing Oil Pipeline
Existing Gas PipelineUnprocessed Production Pipeline

Byron Energy Limited Annual Report 201922
Review of Operations continued
Main Pass 293, 305 and 306 Byron currently holds a 100% WI and an 87.50% NRI in Main Pass 293, 305 and 306 (‘MP306’) acquired at the Gulf of Mexico, OCS Lease Sale 251 held in New Orleans, Louisiana on 15 August 2018.
The three leases comprise the MP306 field as formerly designated by the BOEM. The MP306 field was discovered in 1969 and lies in approximately 200 feet of water. Total produced hydrocarbons from the field are 96 million barrels of oil and 107 bcf of gas from 172 of the 249 total wells drilled. The field ceased production in late 2009 and the last well drilled on any of these blocks was in 2004. The production was from a number of sands ranging from a depth of 4,000 to 9,000 feet.
The produced hydrocarbons on these leases were trapped in Pliocene sands truncated by a structurally complex salt dome. The structural complexity of the salt dome combined with the stratigraphic variation of the trapping sands and possible deeper stratigraphic targets makes this salt dome an ideal candidate for RTM seismic imaging, similar to Byron’s operated SM71 salt dome project.
No material activity was undertaken on Main Pass 306 during the year ended 30 June 2019.
Exploration – non salt dome leasesBivouac Peak leasesThe Bivouac Peak Prospect Area is located in the highly productive transitional zone comprising the northern-most shallow waters of the Louisiana State Waters, and onshore coastal Louisiana.
Byron is the operator of the Bivouac Peak Prospect area, through its wholly owned subsidiary Byron Energy Inc.
In October 2018, the Weiss-Adler, et. al. No. 1 well (‘Weiss-Adler #1’) was drilled to a depth of 17,766 feet MD and evaluated utilising quad combo wireline logging tools, tied to seismic using a synthetic generated from such data, and deemed uncommercial and was plugged and abandoned (‘P&A’). The P&A operations were completed on 22 October 2018 and the Parker 77B rig released.
The data collected from the Weiss-Adler #1 well was used to further evaluate the prospectivity of the surrounding area and to gain a greater understanding of the adjacent Bivouac Peak Deep Prospect. This evaluation work was completed in the March 2019 quarter. The Bivouac Peak state leases were relinquished during the December 2018 quarter and the private leases were to be relinquished in the September 2019 quarter.
Byron Energy Inc, has a 43% WI and a 32.035% NRI in the Bivouac Peak leases. The remaining interests are held by Otto Energy Limited group (‘Otto’)(WI 40.00%/NRI 29.80%), Metgasco Limited (‘Metgasco’)(WI 10.00%/NRI 7.45%) and NOLA Oil and Gas Ventures LLC (‘NOLA’)(WI 7.00%/NRI 5.215%).
Otto and Metgasco earned their respective interests in the Bivouac Peak leases, through disproportionate carry of dry hole costs in the Weiss-Adler #1, together with reimbursement of past costs.
Eugene Island 18 Byron had a 100% working interest in Eugene Island Block 18 (‘EI18’), a non-salt dome project in 10 feet of water, approximately 50 miles south of Morgan City, Louisiana. Byron acquired the EI18 lease at Central Gulf of Mexico OCS Lease Sale 235 held on 18 March 2015 in New Orleans, Louisiana.
As reported in the March 2019 ASX quarterly report, Byron relinquished the block in May 2019.
Grand Isle 95 Grand Isle Block 95 (‘GI95’) is located in US Federal waters, approximately 100 miles south-east of New Orleans, Louisiana, at a water depth of approximately 201 feet. The Company has a 100% operated WI and an 87.5% NRI, reflecting the recently reduced Federal Government Royalty of 12.5% versus pre-2017 rate of 18.75%. Water depth in the area is approximately 197 feet.Byron acquired the GI95 lease at Central Gulf of Mexico OCS Lease Sale 249 held on 16 August 2017 in New Orleans, Louisiana. GI95 was previously owned by Byron and relinquished in August 2016. The Company took the opportunity to bid for the lease, at a modest cost and no work commitments, over a large gas resource. No material activity was undertaken on GI95 during the year ended 30 June 2019.

Byron Energy Limited Annual Report 2019 23
PropertiesAs at 30 June 2019, Byron’s portfolio of properties, all in the shallow waters of the Gulf of Mexico, and coastal marshlands of Louisiana, USA comprised:
Properties OperatorInterest
WI/NRI (%)*Lease
expiry dateLease
area (Km2)South Marsh IslandBlock 71 Byron 50.00/40.625 Production 12.16Block 57 Byron 100.00/81.25 June 2022 21.98Block 59 Byron 100.00/81.25 June 2022 20.23Block 60 Byron 100.00/87.50 June 2024 20.23Block 58 (excluding E1 well) Byron 100.00/83.33**
Block 58 (E1 well in S ½ of SE ¼ of SE ¼ and associated production infrastructure in NE ¼ of NE ¼ of SM69) Ankor 53.00/44.17 Production 20.23
Block 69 (north-east quarter of the north-east quarter) Byron 100.00/77.33–80.33 Production 1.3Block 74*** Byron 100.00/81.25 June 2022 20.23Block 70 Byron 100.00/87.50 June 2023 22.13
Eugene IslandBlock 62 Byron 100.00/87.50 June 2023 20.23Block 63 Byron 100.00/87.50 June 2023 20.23Block 76 Byron 100.00/87.50 June 2023 20.23Block 77 Byron 100.00/87.50 June 2023 20.23
Main PassBlock 293 Byron 100.00/87.50 October 2023 18.46Block 305 Byron 100.00/87.50 October 2023 20.23Block 306 Byron 100.00/87.50 October 2023 20.23
Grand IsleBlock 95 Byron 100.00/87.50 September 2022 18.37Transition Zone (Coastal Marshlands, Louisiana)Bivouac Peak Private Landowner Leases Byron 43.00/32.0325 September 2019 9.7
* Working Interest (‘WI’) and Net Revenue Interest (‘NRI’).
** 100.00% WI to a depth of 13,639 ft TVD and 50% WI below 13,639 ft TVD.
*** Metgasco Limited (‘Metgasco’) paid 40% (US$4.5 million, of the initially estimated drilling costs of SM74 D14 to earn a 30% WI in SM74. On 18 July 2019 Byron announced that agreement had been reached with Metgasco to limit Metgasco’s financial exposure to the SM74 project. Byron capped Metgasco’s additional costs for the drilling of SM74 D14 well at A$1.75 million (in addition to US$4.5 million contributed by Metgasco in the March quarter 2019).
Reserves and resourcesThe Company’s reserves and resources estimate as at 30 June 2019 was released to the ASX on 19 September 2019 and is summarised below:
• 1P oil reserves increased by 4.5 MMbbl to 7.5 MMbbl, an increase of 148%
• 2P oil reserves increased by 9.4 MMbbl to 17.4 MMbbl, an increase of 118%
• 3P oil reserves increased by 12.5 MMbbl to 25.1 MMbbl, an increase of 100%
• 2P gas reserves increased by 21.8 Bcf to 150 Bcf, an increase of 17%
• Significant impact of the US$4.25mm SM58 acquisition and drilling of the SM58 011 well as 2P oil reserves increased by 10.8 MMbbl to 11.0 MMbbl and gas increased by 34.4 Bcf to 34.5 Bcf
The independent reserves and resources estimates were prepared by Collarini Associates (‘Collarini’), based in Houston, Texas, USA.

Byron Energy Limited Annual Report 201924
Review of Operations continued
The combined reserves and resources, net to Byron, are as follows:
SM58
EI77
SM71
SM58 E1/69
GI 95
SM58
EI77
SM71
SM58 E1/69
GI 95
SM58
EI77
SM71
SM58 E1/69
GI 95
Total 1P Reserve 16,673 Mboe
Total 2P Reserve 42,390 Mboe
Total 3P Reserve 58,284 Mboe
Byron net 1P Reserve by Project Mboe and % of total
Byron net 2P Reserve by Project Mboe and % of total
Byron net 3P Reserve by Project Mboe and % of total
5,46132.75%
2,34614.07%
8174.90%
8,04948.28%
13,20531.15%
4,86811.48%
7,58217.89%
15,88837.48%
8472.00%
18,94832.51%
11,74020.14%
20,66135.45%
6,08910.45%
8471.45%
Byron Energy Limited – reserves and resources (net to Byron)Gulf of Mexico, Offshore Louisiana, USA
Remaining as at 30 June 2019 (net to Byron)Oil
MbblGas
MMcfOil
% changeGas
% change
Reserves (developed and undeveloped)
Proved (1P) 7,501 55,032 147.6% 13.9%
Probable reserves 9,873 95,065 99.9% 18.9%
Proved and probable (2P) 17,374 150,097 118.1% 17.0%
Possible reserves 7,707 49,122 68.5% 9.2%
Proved, probable and possible (3P) 25,081 199,219 100.0% 15.0%
Total prospective resources best estimate (unrisked)* 31,575 551,114 -11.7% -6.9%
* On 17 October Byron released to the ASX an updated prospective resource for SM58 increasing SM58 prospective resources from 518 Mbbl and 15,471 MMcf to 11,216 Mbbl and 29,448 MMcf.
Reserves – The aggregate 1P may be a very conservative estimate and the aggregate 3P may be a very optimistic estimate due to the portfolio effects of arithmetic summation.
Conversion to BOE – Using a ratio of 6,000 cubic feet of natural gas to one barrel of oil – 6:1 conversion ratio is based on an energy equivalency conversion method and does not represent value equivalency.
Prospective resource – The estimated quantities of petroleum that may potentially be recovered by the application of a future development project(s) relate to undiscovered accumulations. These estimates have both an associated risk of discovery and a risk of development. Further exploration appraisal and evaluation is required to determine the existence of a significant quantity of potentially moveable hydrocarbon.

Byron Energy Limited Annual Report 2019 25
The following table shows a spilt of Byron’s remaining reserves, as at 30 June 2019, into developed and undeveloped categories by project and by product. All of the projects in this table are located in the shallow water in the Gulf of Mexico, offshore Louisiana, USA.
Byron Energy Limited – remaining reserves net to Byron
Developed Undeveloped Total
30 June 2019Oil
MbblGas
MMcf Oil
MbblGas
MMcf Boe
Mboe (6:1)
SM71 Proved (1P) 1,423 1,192 659 391 2,346 Probable reserves 838 461 1,439 1,011 2,522 Proved and probable (2P) 2,261 1,653 2,098 1,402 4,868 Possible reserves - - 1,094 759 1,221 Proved, probable and possible (3P) 2,261 1,653 3,192 2,161 6,089
SM58 (100% WI)Proved (1P) - - 4,068 23,888 8,049 Probable reserves - - 6,237 9,610 7,839 Proved and probable (2P) - - 10,305 33,498 15,888 Possible reserves - - 3,931 5,052 4,773 Proved, probable and possible (3P) - - 14,236 38,550 20,661
SM58 E1Proved (1P) 184 142 468 849 817 Probable reserves 26 23 - - 30 Proved and probable (2P) 210 165 468 849 847 Possible reserves - - - - - Proved, probable and possible (3P) 210 165 468 849 847
EI77Proved (1P) - - 699 28,571 5,461 Probable reserves - - 1,188 39,338 7,744 Proved and probable (2P) - - 1,887 67,909 13,205 Possible reserves - - 2,625 18,704 5,742 Proved, probable and possible (3P) - - 4,512 86,613 18,948
GI95Proved (1P) - - - - - Probable reserves - - 145 44,621 7,582 Proved and probable (2P) - - 145 44,621 7,582 Possible reserves - - 57 24,607 4,158 Proved, probable and possible (3P) - - 202 69,228 11,740
TotalProved (1P) 1,607 1,334 5,894 53,699 16,673 Probable reserves 864 484 9,009 94,580 25,717 Proved and probable (2P) 2,471 1,818 14,903 148,279 42,390 Possible reserves - - 7,707 49,122 15,894 Proved, probable and possible (3P) 2,471 1,818 22,610 197,401 58,284

Byron Energy Limited Annual Report 201926
Review of Operations continued
The following table reconciles the movement in Byron’s reserves between 30 June 2018 and 30 June 2019.
Byron Energy Limited reserves (net to Byron)Gulf of Mexico, offshore Louisiana, USA
Oil (Mbbl) Gas (MMcf)
Reserves reconciliationRemaining
30/6/18Production
2019
Additions and
revisions2019
Remaining30/6/19
Remaining30/6/18
Production2019
Additions and
revisions2019
Remaining30/6/19
SM71
Proved (1P) 2,226 -453 309 2,082 1,372 -834 1,045 1,583
Probable reserves 3,669 0 -1,392 2,277 2,833 0 -1,360 1,473
Proved and probable (2P) 5,895 -453 -1,083 4,359 4,205 -834 -315 3,056
Possible reserves 1,889 0 -795 1,094 1,612 0 -853 759
Proved, probable and possible (3P) 7,784 -453 -1,878 5,453 5,817 -834 -1,168 3,815
SM58
Proved (1P) 0 0 4,068 4,068 0 0 23,888 23,888
Probable reserves 0 0 6,237 6,237 0 0 9,610 9,610
Proved and probable (2P) 0 0 10,305 10,305 0 0 33,498 33,498
Possible reserves 0 0 3,931 3,931 0 0 5,052 5,052
Proved, Probable and possible (3P) 0 0 14,236 14,236 0 0 38,550 38,550
SM58 E1
Proved (1P) 0 -9 661 652 0 -5 995 990
Probable reserves 0 0 26 26 0 0 23 23
Proved and probable (2P) 0 -9 687 678 0 -5 1,018 1,013
Possible reserves 0 0 0 0 0 0 0 0
Proved, probable and possible (3P) 0 -9 687 678 0 -5 1,018 1,013

Byron Energy Limited Annual Report 2019 27
Oil (Mbbl) Gas (MMcf)
Reserves reconciliation (continued)
Remaining30/6/18
Production2019
Additions and
revisions2019
Remaining30/6/19
Remaining30/6/18
Production2019
Additions and
revisions2019
Remaining30/6/19
EI77
Proved (1P) 785 0 -86 699 36,624 0 -8,053 28,571
Probable reserves 1,101 0 87 1,188 31,295 0 8,043 39,338
Proved and probable (2P) 1,886 0 1 1,887 67,919 0 -10 67,909
Possible reserves 2,626 0 -1 2,625 18,706 0 -2 18,704
Proved, probable and possible (3P) 4,512 0 0 4,512 86,625 0 -12 86,613
GI95
Proved (1P) 18 0 -18 0 10,321 0 -10,321 0
Probable reserves 168 0 -23 145 45,840 0 -1,219 44,621
Proved and probable (2P) 186 0 -41 145 56,161 0 -11,540 44,621
Possible reserves 58 0 -1 57 24,650 0 -43 24,607
Proved, probable and possible (3P) 244 0 -42 202 80,811 0 -11,583 69,228
Grand total
Proved (1P) 3,029 -462 4,934 7,501 48,317 -839 7,554 55,032
Probable reserves 4,938 0 4,935 9,873 79,968 0 15,097 95,065
Proved and probable (2P) 7,967 -462 9,869 17,374 128,285 -839 22,651 150,097
Possible reserves 4,573 0 3,134 7,707 44,968 0 4,154 49,122
Proved, probable and possible (3P) 12,540 -462 13,003 25,081 173,253 -839 26,805 199,219

Byron Energy Limited Annual Report 201928
Review of Operations continued
Material changes to reserves SM71
(a) Proved and probable reserves
The change in proved and probable reserves is due to:
(i) increase in D5 Sand Proved EUR reserves due to the high rate, water free production from the D5 reservoir;
(ii) actual production of 453,000 barrels of oil and 834 million cubic feet of gas for the year ended 30 June 2019;
(iii) higher gas-to oil ratio (‘GOR’) observed in F1 production which effectively increases the calculated gas in place and in turn decreases oil in place resulting in a negative revision to D5 estimated ultimate recoveries and therefore remaining reserves; and
(iv) removal of 68% of the B65 probable reserves as a result of Byron’s internal remapping of the undeveloped B65 reservoir with recently reprocessed 2019 seismic indicating a smaller area of prospectivity than previously mapped.
(b) Possible reserves
The reduction in possible reserves at SM71 is mainly due to removal of most of the possible reserves previously attributed to the B65 Sand as explained above.
SM58 (100% WI)
(a) Proved, probable and possible reserves
The inclusion of maiden proved and probable reserves following:
• the acquisition of the SM58 block as described earlier in this report;
• Byron’s interpretation of the reprocessed seismic data, received earlier this year, under the South Marsh Island Project Seismic Reprocessing Project from WesternGeco, a Schlumberger subsidiary; and
• the Byron SM58 011 well intersecting 301 feet net pay and providing seismic calibration.
SM58 E1 (53.00% WI)
(a) Proved and probable reserves
The additions in proved and probable reserves is due to inclusion of SM58 E1 reserves following the acquisition of SM58 E1 and related assets (as outlined earlier in this report).
GI95
(a) Proved, probable and possible reserves
Lower reserves due to economic cut-offs associated with lower gas price assumptions compared to 2018.
Byron Energy Limited prospective resources (net to Byron)
Gulf of Mexico, offshore Louisiana, USA
Best estimate unrisked 30 June 2019
OilMbbl
GasMMcf
Mboe (6:1)
SM71 1,489 20,138 4,845SMI57 Block 1,531 75,243 14,072SMI58 Block* 518 15,471 3,097SMI58/SM69 E2 2,260 1,976 2,589SMI59 Block 17,356 164,431 44,761EI77 8,087 229,467 46,332GI95 334 44,388 7,732Total prospective resources (2019) 31,575 551,114 123,428Total prospective resources (2018) 35,770 592,212 134,472
* On 17 October Byron released to the ASX an updated prospective resource for SM58 increasing SM58 prospective resources from 518 Mbbl and 15,471 MMcf to 11,216 Mbbl and 29,448 MMcf.
Prospective an Resource as at 30 June 2019The following table shows Byron’s prospective resources as at 30 June 2019 compared to 30 June 2018.

Byron Energy Limited Annual Report 2019 29
Material changes to prospective resources• Removal of Bivouac Peak prospective resources following
the drilling and unsuccessful outcome of the Weiss Adler et al No. 1 well.
• Removal of SM74 prospective resources following the drilling and unsuccessful outcome of the SM74 D14 well.
• Addition of SM 58 and SM58/69 E2 prospective resources.
• Addition of two recently identified D5 Sand exploration prospects which can be tested from the SM71 F platform.

Byron Energy Limited Annual Report 201930
Review of Operations continued
Notes to reserves and resources statementReserves and resources governance
Byron’s reserves estimates are compiled annually. Byron engages Collarini and Associates, a qualified external petroleum engineering consultant, to conduct an independent assessment of the Company’s reserves. Collarini and Associates is an independent petroleum engineering consulting firm that has been providing petroleum consulting services in the USA for more than 15 years. Collarini and Associates does not have any financial interest or own any shares in the Company. The fees paid to Collarini and Associates are not contingent on the reserves outcome of the reserves report.
Competent persons statement
The information in this report that relates to oil and gas reserves and resources was compiled by technical employees of independent consultants Collarini and Associates, under the supervision of Mr Mitch Reece BSc PE. Mr Reece is the President of Collarini and Associates and is a registered professional engineer in the State of Texas and a member of the Society of Petroleum Evaluation Engineers (SPEE), Society of Petroleum Engineers (SPE), and American Petroleum Institute (API). The reserves and resources included in this report have been prepared using definitions and guidelines consistent with the 2007 Society of Petroleum Engineers (SPE)/World Petroleum Council (WPC)/American Association of Petroleum Geologists (AAPG)/Society of Petroleum Evaluation Engineers (SPEE) Petroleum Resources Management System (PRMS). The reserves and resources information reported in this statement are based on, and fairly represents, information and supporting documentation prepared by, or under the supervision of, Mr Reece. Mr Reece is qualified in accordance with the requirements of ASX Listing Rule 5.41 and consents to the inclusion of the information in this report of the matters based on this information in the form and context in which it appears.
Reserves cautionary statement
Oil and gas reserves estimates are expressions of judgment based on knowledge, experience and industry practice. Estimates that were valid when originally calculated may alter significantly when new information or techniques become available. Additionally, by their very nature, reserve and resource estimates are imprecise and depend to some extent on interpretations, which may prove to be inaccurate. As further information becomes available through additional drilling and analysis, the estimates are likely to change. The may result in alterations to development and production plans which may, in turn, adversely impact the Company’s operations. Reserves estimates and estimates of future net revenues are, by nature, forward looking statements and subject to the same risks as other forward looking statements.
Prospective resources cautionary statement
The estimated quantities of petroleum that may potentially be recovered by the application of a future development project(s) relate to undiscovered accumulations. These estimates have both an associated risk of discovery and a risk of development. Further exploration appraisal and evaluation is required to determine the existence of a significant quantity of potentially moveable hydrocarbons. Forward-looking statements
This document may contain forward-looking information. Forward-looking information is generally identifiable by the terminology used, such as ‘expect’, ‘believe’, ‘estimate’, ‘should’, ‘anticipate’ and ‘potential’ or other similar wording. Forward-looking information in this document includes, but is not limited to, references to: well drilling programs and drilling plans, estimates of potentially recoverable resources, and information on future
production and project start-ups. By their very nature, the forward-looking statements contained in this document require Byron and its management to make assumptions that may not materialise or that may not be accurate. Although Byron believes its expectations reflected in these statements are reasonable, such statements involve risks and uncertainties, and no assurance can be given that actual results will be consistent with these forward-looking statements.
Pricing assumptions
Oil prices used in this report represent consensus base prices (July 2, 2019 Blomberg Street Consensus), starting on 1 July 2019, of US$61.36 per barrel, with a final price of US$62.20 per barrel on January 1, 2023, and held constant thereafter. Gas prices used in this report represent a Henry Hub base, starting on 1 July, 2019, of $US2.84 per MMBtu, rising to a price of US$3.11 per MMBtu in October 2019 then declining to final price of US$2.90 per MMbtu on 1 January 2021, and held constant thereafter. These prices were adjusted to account for transportation cost, basis difference, and oil gravity resulting in lower realised prices.
ASX Reserves and resources reporting notes
(i) The reserves and prospective resources information in this document is effective as at 30 June, 2019 (Listing Rule (LR) 5.25.1).
(ii) The reserves and prospective resources information in this document has been estimated and is classified in accordance with SPE-PRMS (Society of Petroleum Engineers Petroleum Resources Management System)(LR 5.25.2).
(iii) The reserves and prospective resources information in this document is reported according to the Company’s economic interest in each of the reserves and prospective resource net of royalties (LR 5.25.5).
(iv) The reserves and prospective resources information in this document has been estimated and prepared using the deterministic method (LR 5.25.6).
(v) The reserves and prospective resources information in this document has been estimated using a 6:1 BOE conversion ratio for gas to oil; 6:1 conversion ratio is based on an energy equivalency conversion method and does not represent value equivalency (LR 5.25.7).
(vi) The reserves and prospective resources information in this document has been estimated on the basis that products are sold on the spot market with delivery at the sales point on the production facilities (LR 5.26.5).
(vii) The method of aggregation used in calculating estimated reserves was the arithmetic summation by category of reserves. As a result of the arithmetic aggregation of the field totals, the aggregate 1P may be a very conservative estimate and the aggregate 3P may be a very optimistic estimate due to the portfolio effects of arithmetic summation (LR 5.26.7 and 5.26.8).
(viii) Prospective resources are reported on a best estimate basis (LR 5.28.1).
(ix) For prospective resources, the estimated quantities of petroleum that may potentially be recovered by the application of a future development project(s) relate to undiscovered accumulations. These estimates have both an associated risk of discovery and a risk of development. Further exploration appraisal and evaluation is required to determine the existence of a significant quantity of potentially moveable hydrocarbons (LR 5.28.2).
(x) All of Byron’s reserves and prospective resources are located in the shallow waters of the Gulf of Mexico, offshore Louisiana.

31Byron Energy Limited Annual Report 2019
Financial ReportFor the year ended 30 June 2019

Byron Energy Limited Annual Report 201932
Directors’ Report
Your directors submit herewith their report together with the Financial Report of Byron Energy Limited (‘the consolidated entity’ or ‘Group’), being Byron Energy Limited (‘Byron’ or the ‘Company’) and its subsidiaries for the financial year ended 30 June 2019.
DirectorsThe names and details of the Company’s directors in office during the financial year and until the date of this report are as follows:
Douglas G Battersby
Maynard V Smith
Prent H Kallenberger
Charles J Sands
Paul A Young
William R Sack
All directors have held office for the whole year unless otherwise stated.
Names, qualifications, experience and special responsibilitiesDouglas G Battersby Non-Executive Chairman
Appointed 18 March 2013
Doug is a petroleum geologist with over 40 years’ technical and managerial experience in the Australian and international oil and gas industry.
Doug co-founded two ASX listed companies (Eastern Star Gas Limited, which was taken over by Santos Limited in November 2011, and SAPEX Limited, which was taken over by Linc Energy Limited in October 2008), and two private oil and gas exploration/development companies, Darcy Energy Limited, which was sold to I B Daiwa Corporation in 2005, and Byron Energy (Australia) Pty Ltd where he was Executive Chairman until May 2013 when Byron Energy (Australia) Pty Ltd merged with Trojan Equity Limited to create Byron Energy Limited. Between 1990 and 1999 Doug was Technical Director at Petsec Energy Limited, an ASX listed operator in the shallow waters of the Gulf of Mexico with production reaching 100 MMcf per day of gas and 9,000 barrels of oil per day in 1997.
Doug holds a Master of Science degree in Petroleum Geology and Geochemistry from Melbourne University.
Other current directorships of listed companies
None.
Former directorships of listed companies in last three years
None.
Maynard V SmithExecutive Director and Chief Executive Officer
Appointed 18 March 2013
Maynard is a geophysicist with over 30 years’ technical and managerial experience in the oil and gas industry with a particular focus on the Gulf of Mexico.
Maynard co-founded Darcy Energy Limited, sold to I B Daiwa Corporation in 2005, and Byron Energy (Australia) Pty Ltd where he has been Chief Executive until May 2013 when Byron Energy (Australia) Pty Ltd merged with Trojan Equity Limited to create Byron Energy Limited. Prior to that, Maynard was Chief Operating Officer with Petsec Energy Limited (1989-2000). In the late 1970s and early 1980s Maynard held senior exploration positions with Tenneco Oil Company, based in Bakersfield, California.
Maynard holds a Bachelor of Science degree in Geophysics from California State University at San Diego.
Other current directorships of listed companies
None.
Former directorships of listed companies in last three years
None.

Byron Energy Limited Annual Report 2019 33
Prent H KallenbergerExecutive Director and Chief Operating Officer
Appointed 18 March 2013
Prent is a geoscientist with over 30 years’ experience in the oil and gas industry with extensive exploration and development experience in the Gulf of Mexico, having generated prospects which have led to the drilling of over 125 wells in the Gulf of Mexico and California. He was Vice President of Exploration with Byron Energy (Australia) Pty Ltd until May 2013 when Byron Energy (Australia) Pty Ltd merged with Trojan Equity Limited to create Byron Energy Limited.
Between 2000 and 2006, Prent was Vice President of Exploration with Petsec Energy Inc, where he was responsible for a team of seven people and generated projects leading to the drilling of 10 successful wells in 12 attempts in the shallow waters of the Gulf of Mexico. These wells produced 32 Bcf and 1.5 MMBbls of oil. Between 1992 and 1998 Prent was Geophysical Manager with Petsec Energy Inc, a wholly owned subsidiary of Petsec Energy Limited. He holds a Bachelor of Science degree in Geology from Boise State University and Master of Science degree in Geophysics from Colorado School of Mines.
Other current directorships of listed companies
None.
Former directorships of listed companies in last three years
None.
Charles J SandsNon-Executive Director
Appointed 18 March 2013
Charles was a Non-Executive Director of Byron Energy (Australia) Pty Ltd until May 2013 when Byron Energy (Australia) Pty Ltd merged with Trojan Equity Limited to create Byron Energy Limited. Charles was also a director of Darcy Energy Limited.
Charles has over 30 years’ of broad based business and management experience in the USA and is President of A. Santini Storage Company of New Jersey Inc, enabling him to advise on the general business operating environment and practices in the USA. He holds a Bachelor of Science degree from Monmouth University.
Charles is currently a member of the Audit and Risk Management Committee.
Other current directorships of listed companies
None.
Former directorships of listed companies in last three years
None.
Paul A Young Non-Executive Director
Appointed 18 March 2013
Paul is a Managing Director of Henslow Corporate and country head for Oaklins, a global mid-market corporate advisory firm. He has been in merchant banking for more than 30 years. He has extensive experience in the provision of corporate advice to a wide range of Australian and international listed and unlisted companies including restructurings, capital raisings, initial public offerings and mergers and acquisitions.
Paul is an Honours Graduate in Economics (University of Cambridge) and has an Advanced Diploma in Corporate Finance. He is a Fellow of the Institute of Chartered Accountants in England and Wales and a Fellow of the Australian Institute of Company Directors.Paul is currently Chairman of the Audit and Risk Management Committee.
Other current directorships of listed companies
• Ambition Group Limited.
• Left Field Printing Group Limited (‘Left Field’), a Hong Kong listed company. Paul was previously a director of ASX listed Opus Group Limited which entered into a scheme of arrangement with Left Field.
Former directorships of listed companies in last three years
None.

Byron Energy Limited Annual Report 201934
Directors’ Report continued
William R Sack Executive Director
Appointed 3 October 2014
Bill is an explorationist with 28 years’ experience in the Gulf of Mexico region in both technical and executive roles. He was appointed to the Board of Directors on 3 October 2014.
Bill’s qualifications comprise BSc. Earth Sci./Physics, MSc. Geology and an MBA. He was co-founder/Managing Partner of Aurora Exploration, LLC (‘Aurora’) a private entity focused on generating and drilling Gulf of Mexico exploration opportunities that has drilled more than 80 wells with a success rate in excess of 80%, and under his leadership has created substantial growth and monetised investments via multiple corporate level asset sales.
Other current directorships of listed companies
None.
Former directorships of listed companies in last three years
None.
Summary of shares and options on issue At 30 June 2019, the Company had 695,373,417 ordinary shares and 60,600,000 options on issue. Details of the options are as follows:
Issuing entityNumber of shares
under option Class of shares Exercise price Expiry date
Byron Energy Limited 9,500,000 Ordinary A$0.25 31 December 2019
Byron Energy Limited 10,000,000 Ordinary A$0.25 21 July 2019
Byron Energy Limited 28,350,000 Ordinary A$0.12 31 December 2021
Byron Energy Limited 2,000,000 Ordinary A$0.16 31 December 2021
Byron Energy Limited 9,500,000 Ordinary A$0.40 31 December 2021
Byron Energy Limited 1,250,000 Ordinary A$0.40 31 December 2021
60,600,000
During the year ended 30 June 2019, the Company issued 10,386,383 fully paid ordinary shares and 10,750,000 share options as detailed below:
(a) on 25 September 2018, Metgasco Limited (ASX: MEL) elected to convert A$1,000,000 of convertible notes to equity at a share price of A$26.55 cents per share, resulting in the issue of 3,766,479 ordinary shares;
(b) on 5 October 2018, the Company issued 1,950,000 shares on conversion of 1,950,000 share options, at an exercise price of A$0.25, raising a total of A$487,500;
(c) on 29 November 2018, 9,500,000 share options were issued to executive directors, staff and consultants, exercisable at A$0.40 per security any time before 31 December 2021;
(d) on 23 January 2019, 1,250,000 share options were issued to staff and consultants, exercisable at A$0.40 per security exercisable any time before 31 December 2021; and
(e) on 5 February 2019, Metgasco Limited (ASX: MEL) elected to convert A$1,000,000 of convertible notes to equity at a share price of A$21.41 cents per share, resulting in the issue of 4,669,904 ordinary shares.
No ordinary shares or share options were issued, nor were any share options exercised subsequent to 30 June 2019 through to the date of this report.

Byron Energy Limited Annual Report 2019 35
Shareholdings and optionholdings of directors and other key management personnelThe interests of each director and other key management personnel, directly and indirectly, in the shares and options of Byron Energy Limited at the date of this report are as follows:
Director/key management personnel Ordinary sharesOptions over
ordinary shares Exercise price Option expiry date
D G Battersby 48,123,203 - - -
M V Smith 32,313,583 2,500,000 A$0.25 31 December 2019
M V Smith - 6,300,000 A$0.12 31 December 2021
M V Smith - 2,100,000 A$0.40 31 December 2021
P H Kallenberger 1,732,223 2,500,000 A$0.25 31 December 2019
P H Kallenberger - 6,300,000 A$0.12 31 December 2021
P H Kallenberger - 2,100,000 A$0.40 31 December 2021
C J Sands 19,765,997 - - -
P A Young 18,805,631 - - -
W R Sack 3,600,000 2,500,000 A$0.25 31 December 2019
W R Sack - 6,300,000 A$0.12 31 December 2021
W R Sack - 2,100,000 A$0.40 31 December 2021
N Filipovic 634,788 1,000,000 A$0.25 31 December 2019
N Filipovic - 3,780,000 A$0.12 31 December 2021
N Filipovic - 1,000,000 A$0.40 31 December 2021
Summary of shares and options on issueDuring the financial year, 7,300,000 share options were granted to directors or key management personnel of the Company after shareholder approval:
Director/key management personnelNumber of
options granted Issuing entityNumber of ordinary
shares under option
M V Smith 2,100,000 Byron Energy Limited 2,100,000
P H Kallenberger 2,100,000 Byron Energy Limited 2,100,000
W R Sack 2,100,000 Byron Energy Limited 2,100,000
N Filipovic 1,000,000 Byron Energy Limited 1,000,000
No shares were issued or granted to directors or key management personnel during the financial year.
Company Secretary Nick FilipovicAppointed 18 March 2013
Nick is a qualified accountant with over 35 years’ experience in the financial services and natural resources industries, including oil and gas, where he has held a range of senior financial and commercial management positions. He was the Chief Financial Officer and Company Secretary of Byron Energy (Australia) Pty Ltd until May 2013 when Byron Energy (Australia) Pty Ltd merged with Trojan Equity Limited to create Byron Energy Limited.
Principal activitiesThe principal activities of the consolidated entity during the financial year were oil and gas exploration, development and production in the shallow waters in the Gulf of Mexico (‘GOM’), USA.
Consolidated resultsThe profit for the consolidated entity after income tax was US$5,718,988 (2018: US$1,298,968).

Byron Energy Limited Annual Report 201936
Directors’ Report continued
Review of operationsFinancial reviewThe Group recorded a net profit of US$5,718,988 for the year ended 30 June 2019, compared to a net profit of US$1,298,968 for the year ended 30 June 2018. The increase is primarily due to a full year of oil and gas production from the Byron operated South Marsh Island (‘SM71’) lease in 2019, compared to a three-month production period in the 30 June 2018 financial year, partly offset by higher cost of sales and increased impairment charges.
For the year ended 30 June 2019, Byron’s share of net revenue, after transport costs and royalties was US$31,324,061, compared to US$9,544,507 in 2018. The increase in net revenue was primarily due to higher production with the SM71 project being on production for the full 12 months during the 2019 year compared to only three months of production in 2018.
Cost of sales were US$7,261,616 for the year ended 30 June 2019 compared to US$1,807,414 for the comparable period in 2018. The increase was due to higher cash lease operating expenses and increased amortisation charges reflecting higher production.
For the year ended 30 June 2019, impairment charges were US$12,915,955 compared US$1,746,863 in 2018 due to write-off of unsuccessful exploration drilling expenses in relation to the Weiss-Adler, et. al. No. 1 well, on the Bivouac Peak leases and SM74 D14 well, on the SM74 lease, and relinquishment of VR232, VR251 and EI18 leases during the year.
At 30 June 2019, the consolidated entity had total assets of US$53,493,510 (2018: US$40,236,652) and total liabilities of US$16,781,752 (2018: US$11,730,029) resulting in net assets of US$36,711,758 (2018: US$28,506,623), reflecting an increase of US$8,205,135. The increase was mainly due to the higher cash balances, generated by the SM71 field, and higher exploration and evaluation assets and oil and gas properties, partly offset by higher trade and other payables.
At 30 June 2019, the consolidated entity held cash and cash equivalents of US$11,160,570 (2018: US$2,256,958) of which US$4,377,250 (2018: US$0) was restricted and escrowed solely for the drilling of the SM74 D14 well. During the financial year, the consolidated entity repaid in full the secured convertible note to Metgasco Limited (‘Metgasco’) and has loans from directors and two shareholders of US$4,174,030 (2018: $1,384,332) as at 30 June 2019.
Corporate reviewCash equity raisingsThere were no placements or other equity raisings during the financial year other than the issue of 1,950,000 shares on conversion of 1,950,000 share options, at an exercise price of A$0.25, raising a total of A$487,500.
Issue of new share optionsAt the Company’s AGM in November 2018, shareholders approved the issue of the 9,500,000 share options to executive directors, staff and consultants, exercisable at A$0.40 per security exercisable at any time before 31 December 2021. The options were allotted on 29 November 2018.
On 23 January 2019, the Company allotted 1,250,000 share options to staff and consultants, exercisable at A$0.40 per security exercisable any time before 31 December 2021.
Issued capitalAs at 30 June 2019, Byron’s issued capital comprised:
Securities Total issued Quoted Unquoted
Shares (ASX:BYE) 695,373,417 695,373,417 Nil
Options 60,600,000 Nil 60,600,000
Convertible notes
Balance at 30 June 2018Total redeemed during year ended 30 June 2019 Balance 30 June 2019
5,000,000 @ A$1 5,000,000 @ A$1 Nil
8,000,000 @ A$1.00 secured convertible notes (unquoted), were originally issued to Metgasco Limited in January 2017.

Byron Energy Limited Annual Report 2019 37
The 30 June 2018 balance of A$5.0 million was extinguished during the financial year due to the redemption of A$3.0 million of notes for cash and conversion of A$2.0 million convertible notes for fully paid ordinary shares as follows:
(a) converted A$1,000,000 of convertible notes to equity at a share price of A$26.55 cents per share, resulting in the issue of 3,766,479 shares; and
(b) converted A$1,000,000 of convertible notes to equity at a share price of A$21.41 cents per share, resulting in the issue of 4,669,904 shares.
Borrowings During the March 2019 quarter, Byron established a short-term loan facility for US$2.0 million and A$3.1 million, equivalent to approximately US$4.2 million including US$3.2 million sourced from four of the Company’s directors (for additional details refer to the Related party transactions note). The loan was fully drawn down during the March 2019 quarter and is unsecured, repayable by 30 November 2019 and bears interest, from time of drawdown, at a rate of 10% per annum payable on loan repayment date.
Review of operationsProducing oil and gas properties South Marsh Island 71
Byron owns a 50% Working Interest (‘WI’) and a 40.625% Net Revenue Interest (‘NRI’) in the South Marsh Island (‘SM71’) block in the South Marsh Island Block 73 (‘SM73’) field. Byron is the designated operator of SM71 with Otto Energy Limited (‘Otto’) (ASX: OEL) holding an equivalent WI and NRI. Water depth in the area is approximately 137 feet. The SM73 field encompasses nine Outer Continental Shelf (‘OCS’) lease blocks (81 square miles) which overlie a large piercement salt dome. The salt dome is responsible for providing the trapping mechanism for production in all portions of the SM73 field.
First production from SM71 commenced on 23 March 2018 from the SM71 F platform constructed and installed by Byron.
As announced to the ASX on 15 January 2019, full project payout was achieved in less than 12 months. With the exception of pipeline and storm-related downtime, the SM71 facility has experienced less than 1% downtime since commencement of production and there have been no recordable accidents or environmental incidents.
Early in July 2019, the SM71 facility surpassed the 1.5 million barrels of oil (gross) production milestone, largely from the D5 reservoir. The D5 reservoir has yet to produce any water. Reservoir performance matches previous assumptions from downhole pressure analysis and the D5 reservoir is showing significant aquifer support. The facility has also produced over 2.3 billion cubic feet of gas which, on a revenue basis, is approximately equivalent to an additional 123,000 barrels of oil.
For the year ended 30 June 2019, Byron’s share of production (net of royalties) was 453,527 barrels of oil and 899,318 mmbtu of natural gas compared to 141,611 barrels of oil and 122,050 mmbtu of natural gas for the year ended 30 June 2018.
On 30 June 2019, the SM71 wells were producing at a gross combined daily rate of approximately 3,200 barrels of oil and 5.0 million cubic feet of gas. There was no water production. The month of June 2019 was the highest month of production since August 2018. During June, production averaged 3,250 barrels of oil and 4.4 million cubic feet of gas per day.
For the year ended 30 June 2019, Byron’s share of net revenue after royalties, price differentials and deductions for transportation, oil shrinkage and other applicable adjustments, was approximately US$31.0 million compared to US$9.5 million for the year ended 30 June 2018. Net oil revenue was US$28.2 million for the year ended 30 June 2019 compared to US$9.2 million for the same comparable period in 2018. Net gas revenue was US$2.85 million for the year ended 30 June 2019, compared to US$ 0.3 million for the year ended 30 June 2018.
The increase in oil revenue was attributable to a 220.3% increase in sales volumes, marginally offset by a 4.3% decrease in the average realised oil price, of US$62.14 per barrel in 2019 compared to US$64.91 per barrel in 2018. The increase in natural gas revenue was attributable to a 636.9% increase in sales volumes accompanied by a 27.3% increase in the average realised natural gas sales price of US$2.79 per mmbtu in 2019 from US$2.19 per mmbtu in 2018.
Based on the high quality of Louisiana Light Sweet crude (‘LLS’) produced at SM71, Byron receives a premium based on LLS verses West Texas Intermediate (‘WTI’) price differentials. During the year, Byron realised an average oil price after uplift for LLS price differentials and deductions for transportation, oil shrinkage and other applicable adjustments of US$62.14 per bbl and US$68.97 per bbl before transportation costs.
Byron also realised an average gas price after transportation deductions, Natural Gas Liquids (‘NGL’) uplift and processing deductions for NGL processing of approximately US$2.79 per mmbtu during the year and US$3.17 per mmbtu before transportation costs.
Lease operating expenses, which include base lease operating expenses, insurance, workovers, and facilities maintenance, increased by US$1.75 million, or 170.0%, to US$2.65 million in 2019 compared to US$0.9 million in 2018, reflecting higher production. On a barrel of oil equivalent (‘BOE’) basis, lease operating expenses decreased to US$4.30 per BOE during 2019 compared to US$4.92 per BOE during 2018.

Byron Energy Limited Annual Report 201938
Directors’ Report continued
South Marsh Island 58
During the March 2019 quarter, Byron completed the acquisition of South Marsh Island Block 58 (‘SM58’) and associated SM69 assets, for US$4.25 million with an effective date of 1 January 2019.
Key details of Byron’s SM58 acquisition includes:
• 100% WI (83.33% NRI) in the SM58 Lease to a depth of 13,639 ft total vertical depth; and 50% WI (41.67% NRI) below 13,639 ft total vertical depth with a third party currently holding the remaining 50% WI under an existing Joint Exploration Agreement;
• 53.00% WI (44.166667% NRI) in the SM58 E1 well including current production, reserves, as well as the SM69 E platform and Flowlines;
• Proved Developed Producing Reserves;
• Proved Developed Behind Pipe Reserves; and
• Operating Rights to all depths on SM58, excluding the E1 wellbore which is operated by the SM69 operator off the jointly owned SM69 E platform.
SM58 is located between Byron’s SM57 and SM59 leases, which when combined provide Byron with contiguous exploration acreage across the northern half of the SM73 field.
In addition to the producing E1 well, Byron has to date, identified seven additional well locations on SM58 in the shallow section above 13,639 ft subsea.
From the date of completion 1 March 2019 to 30 June 2019, Byron’s share of production from the SM58 E1 well (net of royalties) was 5,907 barrels of oil and 2,209 mmbtu of natural gas.
Production from the SM58 E1 wellbore flows from the SM69 E platform to the SM69 B platform where separation and processing occurs. The SM69 E platform is a recently constructed (2013) two slot structure with one well slot utilised, one available, and offers expansion potential of an additional third slot.
In the June quarter 2019, the SM58 E1 well gross daily production was increased to 210 bopd (111 bopd net to Byron). After joint discussions with the operator, ANKOR Energy LLC, optimisations were made to the gas lift system in early June which resulted in a gross increase from 60 bopd to 210 bopd.
Exploration leases – salt dome leases South Marsh Island WesternGeco RTM Seismic Reprocessing ProjectIn April 2018, Byron executed an agreement with WesternGeco, a Schlumberger subsidiary, to add additional licensed 3D seismic data to its in-house data inventory and to perform new, high effort seismic data processing over the SM71 project area in the Gulf of Mexico.
Byron undertook high effort seismic reprocessing of approximately 172 square miles (445 square kilometres) or 22 Outer Continental Shelf lease blocks of high-quality, modern seismic data the Company previously licensed from WesternGeco. The goals of the project were to improve the resolution and subsurface imaging of Byron’s existing licensed 3D seismic data in the South Marsh Island area where Byron currently holds six leases.
There were four key issues addressed during the project: (i) improve signal to noise ratios by using new pre-processing techniques; (ii) verify that the wavelet phase of the data is zero phase in order to accurately tie existing well control; (iii) perform new Reverse Time Migrating (‘RTM’) and Kirchhoff Prestack Depth Migration at higher frequencies to improve data resolution; and (iv) to generate seismic inversion volumes to allow a deeper investigation of seismic amplitude responses and predict lithology.
The result was a data set with greatly improved signal to noise ratios, higher frequency content and a consistent wavelet phase across all portions of the project. Additionally, the ability to create seismic volumes using Vector Imaging Partitioning (‘VIP’) data has increased Byron’s ability to more accurately map the subsurface in complex areas of the project. While interpretation work is ongoing, Byron has already seen the benefits of this processing work in the generation of several new prospect opportunities on its existing leasehold acreage, especially SM58, where multiple prospects were generated and well planning completed for spudding of SM58 011 well, during the September quarter of 2019, to test an undrilled O Sand prospect.
South Marsh Island 74 The Byron operated SM74 D14 well, the first test well on the South Marsh Island 74 (‘SM74’) block, spudded on 15 May 2019, targeting three amplitude supported target sands prospective for oil and gas.
As at 30 June 2019, the SM74 D14 well was drilling ahead at a depth of 13,780 feet measured depth (12,872 feet true vertical depth) planning to drill to a depth of 16,747 feet measured depth (14,726 feet True Vertical Depth).

Byron Energy Limited Annual Report 2019 39
Post 30 June 2019, Byron announced that the well would be plugged and abandoned. Because the first two primary objectives were wet and due to difficult hole conditions, it was decided not to drill deeper but to plug and abandon the hole.
The rig was released in July 2019, after the well was plugged and abandoned.
Byron farmed-out a 30% Working Interest share of the SM74 prospect to Metgasco Limited (‘Metgasco’) on industry standard terms whereby Metgasco was to earn their interest by paying 40% of the US$11.4 million initial well dry hole costs and Byron will pay the remaining 60%. On 18 July 2019, Byron announced that agreement had been reached with Metgasco to limit Metgasco’s financial exposure to the SM74 project whereby Byron has capped Metgasco’s share of additional costs for the drilling of SM74 D14 well at A$1.75 million (in addition to US$4.5 million previously contributed by Metgasco during the June 2019 quarter).
South Marsh Island 57 and 59Byron currently holds a 100% WI and an 81.25% NRI (royalty rate of 18.75%) in South Marsh Island 57 and 59 (‘SM 57/59’), acquired at the Gulf of Mexico OCS Lease Sale 247 held on 22 March 2018 in New Orleans, Louisiana.
Theses leases are in close proximity to Byron’s SM71 producing platform and increased Byron’s footprint in the South Marsh Island 73 field. Water depth in the area is approximately 125 feet.
The SM57/59 blocks, as part of the larger SM71 project area, are focus areas of the WesternGeco RTM Seismic Reprocessing Project which Byron undertook with Schlumberger’s subsidiary WesternGeco, as outlined above, to help evaluate potential future exploration drill sites.
South Marsh Island 70Byron has a 100% WI and 87.5% NRI (royalty rate of 12.5%) in South Marsh Island 70 (‘SM70’), acquired at the Gulf of Mexico OCS Lease Sale 250 held on Wednesday 21 March 2018 in New Orleans, Louisiana.
Byron has identified several higher-risk exploratory leads on SM70. These leads are being evaluated following completion in late 2018 of Byron’s WesternGeco RTM Seismic Reprocessing Project, as outlined above.
South Marsh Island 69In April 2019, Byron executed a non-binding Letter of Intent (‘LOI’) with the leasehold interest owners of South Marsh Island Block 69 (‘SM69’) for the drilling of a SM69 E2 well off the recently acquired SM69 E platform.
The SM69 E2 wellbore is expected to be drilled to a measured depth of approximately 8,750 feet (8,120 feet True Vertical Depth). The primary target of the E2 well, the B65 (K4) Sand, has to date produced approximately 13 Mmbo in the SM73. As of 30 June 2019, Byron and the SM69 leaseholders were working to finalise documentation of a formal Joint Exploration Agreement relating to the E2 well and the north-east 1/4 of the north-east 1/4 of SM69 lease block and related Production Handling Agreement.
Under the LOI Byron has the right to earn 100% WI (83.33% NRI) in the E2 well and related reservoirs in the NE1/4NE1/4 SM69 less, and subject to, a 3% NRI Overriding Royalty Interest (‘ORRI’) before project payout, retained by the SM69 Leasehold interest owners, which is then convertible at their election upon project payout to either a 6% ORRI or a 30% WI after project payout. Byron shall operate the drilling and development of the E2 well with anticipated production operations provided by the SM69 operator, ANKOR E&P Holdings Corporation.
Production from the existing SM58 E1 wellbore flows from the SM69 E platform to the SM69 B platform where separation and processing occurs. The SM69 E platform is a recently constructed (2013) two slot structure with one well slot utilised, one slot available for the E2, and offers expansion potential of an additional third slot.
South Marsh Island 60Byron Energy was the apparent high bidder on the South Marsh Island 60 lease (‘SM60’), the only bid placed by the Company at the Gulf of Mexico, OCS Lease Sale 252 held in New Orleans, Louisiana on Wednesday, 20 March 2019. The lease was subsequently awarded to Byron by the Bureau of Ocean Management (‘BOEM’).
Byron bid approximately US$188,000 as a bonus and has a 100% WI and an 87.50% NRI.
From 1978 through 2006, nine wells completed for production on SM60 produced a combined total of 385 billion cubic feet of gas and 787,000 barrels of oil.
SM60 lies within the area of Byron’s WesternGeco RTM Seismic Reprocessing Project, as outlined above, which was used to evaluate the prospect potential on the block.

Byron Energy Limited Annual Report 201940
Directors’ Report continued
Production platform purchaseIn May 2019, Byron purchased a production platform consisting of two decks, a jacket and production equipment from a private company for a total price of US$1.0 million.
Significant time savings of six to nine months and cost savings in the order of US$4 million to US$6 million are expected to be realised through the purchase of this facility. Overall, the requisite modifications to the platform are moderate because the bulk of engineering design work is already done, and engineering costs and design time will also be substantially lower.
In May 2019, the platform was offloaded at Acadian Contractors in Abbeville, Louisiana where it will undergo modifications and build out to Byron specifications. The jacket will require modifications to accommodate the 130 to 135-foot water depth in the South Marsh Island area where Byron owns 100% interest in six Outer Continental Shelf lease block and a partial interest in one other lease block. Additional well slots can also be added to bring the total available well slots from six to nine.
The Company plans to use this structure on SM58, following the recently announced successful outcome of the SM58 011 exploration well.
Vermilion 232 and 251The VR232 and VR251 leases were evaluated with the WesternGeco RTM Seismic Reprocessing Project, outlined above, and found that the initial prospect ideas on the blocks were not supported. Consequently, Byron relinquished VR251 in July 2019 and assigned its 50% WI and operatorship in VR232 to Otto Energy Limited group.
Eugene Island blocks 62, 63, 76 and 77Byron acquired Eugene Island blocks 62, 63, 76 and 77 (‘EI77’), at Gulf of Mexico OCS Lease Sale 250 held on 21 March 2018 in New Orleans, Louisiana. Water depth in the area is approximately 20 feet.
Byron currently holds a 100% WI and an 87.5% NRI in EI77, reflecting the recently reduced Federal Government Royalty of 12.5% versus pre-2017 rate of 18.75%.
The EI77 blocks were designated as the Eugene Island 77 field in the 1960s and have produced 362 billion cubic feet of gas and 6.5 million barrels of oil from sands trapped by the Eugene Island 77 salt dome. Initial production from the field began in 1957. There is no production on these blocks currently.
The EI77 leases were previously held by the Company before being relinquished in January 2018.
In the September quarter 2018, Byron began a reprocessing effort similar to that undertaken on the SM71 Project Area with WesternGeco over all four Eugene Island blocks leased by the Company. The objectives of this work were to improve seismic imaging in some geologically complex portions of the project. The scope of work is focused on refining the sediment and salt velocity model. The final products will include new RTM migrations, Kirchhoff migrations and inversion products. VIP imaging will also be viable as post of the work scope and should prove to be extremely helpful in mapping the sediment – salt interface and delineating prospects. Final deliverables were received in the June quarter 2019.
Discussion with several drilling contractors for drilling of EI77 commenced during the December 2018 quarter but were paused, with SM58 wells being brought forward ahead of the EI77 field wells.
Main Pass 293, 305 and 306 Byron currently holds a 100% WI and an 87.50% NRI in Main Pass 293, 305 and 306 (‘MP306’) acquired at the Gulf of Mexico, OCS Lease Sale 251 held in New Orleans, Louisiana on 15 August 2018.
The three leases comprise the MP306 field as formerly designated by the BOEM. The MP306 field was discovered in 1969 and lies in approximately 200 feet of water. Total produced hydrocarbons from the field are 96 million barrels of oil and 107 bcf of gas from 172 of the 249 total wells drilled. The field ceased production in late 2009 and the last well drilled on any of these blocks was in 2004. The production was from a number of sands ranging from a depth of 4,000 to 9,000 feet.
The produced hydrocarbons on these leases were trapped in Pliocene sands truncated by a structurally complex salt dome. The structural complexity of the salt dome combined with the stratigraphic variation of the trapping sands and possible deeper stratigraphic targets makes this salt dome an ideal candidate for RTM seismic imaging, similar to Byron’s operated SM71 salt dome project.
No material activity was undertaken on Main Pass 306 during the year ended 30 June 2019.

Byron Energy Limited Annual Report 2019 41
Exploration – non salt dome leasesBivouac Peak leasesThe Bivouac Peak Prospect Area is located in the highly productive transitional zone comprising the northern-most shallow waters of the Louisiana State Waters, and onshore coastal Louisiana.
Byron is the operator of the Bivouac Peak Prospect area, through its wholly owned subsidiary Byron Energy Inc.
In October 2018, the Weiss-Adler, et. al. No. 1 well (‘Weiss-Adler #1’) was drilled to a depth of 17,766 feet measured depth and evaluated utilising quad combo wireline logging tools, tied to seismic using a synthetic generated from such data, and based on this was deemed uncommercial and was plugged and abandoned (‘P&A’). The P&A operations were completed on 22 October 2018 and the Parker 77B rig released.
The data collected from the Weiss-Adler #1 well has been subsequently used to further evaluate the prospectivity of the surrounding area and to gain a greater understanding of the adjacent Bivouac Peak Deep Prospect. This evaluation work was completed in the March 2019 quarter. The Bivouac Peak state leases were relinquished during the December 2018 quarter and the private leases are expected to be relinquished in the September 2019 quarter.
Byron Energy Inc, has a 43.00% WI and a 32.035% NRI in the Bivouac Peak leases. The remaining interests are held by Otto Energy Limited group (‘Otto’)(WI 43.00%/NRI 32.035%), Metgasco Limited (‘Metgasco’)(WI 10.00%/NRI 7.45%) and NOLA Oil and Gas Ventures LLC (‘NOLA’)(WI 7.00%/NRI 5.215%).
Otto and Metgasco earned their respective interests in the Bivouac Peak leases, through disproportionate carry of dry hole costs in the Weiss-Adler #1, together with reimbursement of past costs.
Eugene Island 18 Byron had a 100% Working Interest in Eugene Island Block 18 (‘EI18’), a non-salt dome project in 10 feet of water, approximately 50 miles south of Morgan City, Louisiana. Byron acquired the EI18 lease at Central Gulf of Mexico OCS Lease Sale 235 held on 18 March 2015 in New Orleans, Louisiana.
As reported in the March 2019 ASX quarterly report, the block was relinquished in May 2019.
Grand Isle 95 Grand Isle Block 95 (‘GI95’) is located in US Federal waters, approximately 100 miles southeast of New Orleans, Louisiana, at a water depth of approximately 201 feet. The Company has a 100% operated WI and an 87.5% NRI, reflecting the recently reduced Federal Government Royalty of 12.5% versus pre-2017 rate of 18.75%. Water depth in the area is approximately 197 feet.
Byron acquired the GI95 lease at Central Gulf of Mexico OCS Lease Sale 249 held on 16 August 2017 in New Orleans, Louisiana. GI95 was previously owned by Byron and relinquished in August 2016. The Company took the opportunity to bid for the lease, at a modest cost and no work commitments, over a large gas resource. No material activity was undertaken on GI95 during the year ended 30 June 2019.

Byron Energy Limited Annual Report 201942
Directors’ Report continued
PropertiesAs at 30 June 2019, Byron’s portfolio of properties in the shallow waters of the Gulf of Mexico and coastal marshlands of Louisiana, USA comprised:
Properties OperatorInterest WI/
NRI (%)*Lease expiry
dateLease area
(Km2)
South Marsh Island
Block 71 Byron 50.00/40.625 Production 12.16
Block 57 Byron 100.00/81.25 June 2022 21.98
Block 59 Byron 100.00/81.25 June 2022 20.23
Block 60 Byron 100.00/87.50 June 2024 20.23
Block 58 (excluding E1 well) Byron 100.00/83.33** Production 20.23
Block 58 (E1 well in S ½ of SE ¼ of SE ¼ and associated production infrastructure in NE ¼ of NE ¼ of SM69) Ankor 53.00/44.166667
Block 74*** Byron 100.00/81.25 June 2022 20.23
Block 70 Byron 100.00/87.50 June 2023 22.13
Eugene Island
Block 62 Byron 100.00/87.50 June 2023 20.23
Block 63 Byron 100.00/87.50 June 2023 20.23
Block 76 Byron 100.00/87.50 June 2023 20.23
Block 77 Byron 100.00/87.50 June 2023 20.23
Main Pass
Block 293 Byron 100.00/87.50 October 2023 18.46
Block 305 Byron 100.00/87.50 October 2023 20.23
Block 306 Byron 100.00/87.50 October 2023 20.23
Grand Isle
Block 95 Byron 100.00/87.50 September 2022 18.37
Transition Zone (Coastal Marshlands, Louisiana)
Bivouac Peak Private Landowner Leases Byron 43.00/32.0325 September 2019 9.70
* Working Interest (‘WI’) and Net Revenue Interest (‘NRI’).
** 100.00% WI to a depth of 13,639 ft TVD and 50% WI below 13,639 ft TVD.
*** Metgasco Limited (‘Metgasco’) agreed to earn a 30% WI in SM74 by paying a disproportionate share of the drilling costs of the SM74 D14 well. Metgasco paid 40% (US$4.5 million) of the initially estimated drilling costs of SM74 D14. On 18 July 2019, Byron announced that agreement had been reached with Metgasco to limit Metgasco’s financial exposure to the SM74 D14 well whereby Byron capped Metgasco’s additional costs for the drilling of SM74 D14 well at A$1.75 million (in addition to US$4.5 million already contributed by Metgasco). As a result, Metgasco is entitled to a 30% WI (24.375% NRI) in SM74.
Review of strategy, principal risks and uncertainties facing the CompanyStrategySince inception, Byron has focused on the shallow waters of the OCS in the GOM. The directors believe that the shallow waters of the GOM offer significant advantages to Byron, as the GOM:
• is a prolific producer of oil and gas;
• has significant proved and unproved reserves of low cost oil and gas as well as significant potential for further hydrocarbon discoveries;
• has extensive, established and accessible oil and gas exploration, development and production infrastructure;
• offers a short development cycle and rapid payback;
• has modern 3D seismic coverage, suitable for improved imaging, over fields and prospects, available for purchase from third party providers;

Byron Energy Limited Annual Report 2019 43
• advanced seismic processing techniques have allowed the industry to better distinguish hydrocarbon traps and identify previously unknown prospects;
• has a well-established and stable administration with one landowner for the shallow waters, BOEM; and
• the GOM shallow waters have regular lease sales conducted by BOEM with 5,000 acre blocks available, generally to the highest bidder, to lease for five years at US$7 per acre per annum.
Byron is well positioned to exploit the competitive advantages of the GOM as the Company has:
• an experienced team of oil and gas exploration, development and production personnel with a successful track record in the GOM, with significant experience utilising advanced seismic image processing techniques, including reverse time migration, in Byron’s area of focus;
• a producing and cash generating asset, SM71;
• an inventory of relatively low-risk, ready to drill prospects, including several prospects with significant oil potential; and
• the capacity to grow its asset portfolio in the shallow waters and transition zone of the GOM.
Byron’s strategy in the GOM comprises three key elements:
• to identify highly prospective oil and gas plays, aided by leading edge seismic technology such as RTM, which is particularly effective in the shallow waters of the GOM;
• to secure the leases, usually on a 100% or majority Working Interest basis primarily through the annual Federal Government lease sale process in the GOM; and
• Byron will either drill test the play as operator holding a 100% Working Interest or seek to farm out up to 50% of its WI to a non-operator or another operator with a proven track record of drilling and producing wells in the GOM, retaining a 40–50% WI in the block.
Principal risks and uncertaintiesThe key areas of risk, uncertainty and material issues facing the Company in executing its strategy and delivering on its targets are described below.
Risks relating to the Company’s industry, business and financial conditionThere are a number of risks which may impact on the operating and financial performance of the Company and therefore, on the value of its shares. Some of these risks can be mitigated by the Company’s systems and internal controls, but many are outside of the control of the Company and the Board. There can be no guarantee that the Company will achieve its stated objectives or that any forward-looking statements will eventuate.
In addition to risks and uncertainties in the ordinary course of business that are common to all businesses, important factors that are specific to the Company and the oil and gas industry could materially impact the Company’s future performance and results of operations. Below is a list of known material risk factors that should be reviewed when considering buying or selling Byron’s shares. These are not all the risks the Company faces and other factors currently considered immaterial or unknown may impact future operations.
Oil and natural gas price risk The Company’s revenues, profitability and future growth depend significantly on crude oil and natural gas prices. Oil and natural gas prices are volatile and low prices could have a material adverse impact on cash flow and on Byron’s business. Among the factors that can cause these fluctuations are: (i) changes in global supply and demand for oil and natural gas; (ii) the ability of the members of the Organization of Petroleum Exporting Countries to agree to and maintain oil price and production controls; (iii) the price and volume of imports into the USA of foreign oil and natural gas; (iv) political and economic conditions, including embargoes, in oil-producing countries or affecting other oil-producing activity; (v) the level of global oil and gas exploration and production activity; (vi) weather conditions; (vii) technological advances affecting energy consumption, (viii) USA domestic and foreign governmental regulations and taxes; (ix) proximity and capacity of oil and gas pipelines and other transportation facilities; (x) the price and availability of competitors’ supplies of oil and gas in captive market areas; (xi) the introduction, price and availability of alternative forms of fuel to replace or compete with oil and natural gas; (xii) import and export regulations for LNG and/or refined products derived from oil and gas production from the USA, (xiii) speculation in the price of commodities in the commodity futures market; (xiv) the availability of drilling rigs and completion equipment; and (xv) the overall economic environment.

Byron Energy Limited Annual Report 201944
Directors’ Report continued
Financing riskByron’s business plan, which includes participation in seismic data purchases, lease acquisitions and the drilling of exploration and development prospects, has required and is expected to continue to require capital expenditures. Byron may require additional financing to fund its planned growth. This additional financing may be in the form of equity, debt or a combination thereof. Byron may also obtain capital by farming out part of its Working Interest in one or more of its oil and gas properties. Byron’s ability to raise additional capital will depend on the results of its operations and the status of various capital and industry markets at the time it seeks such capital. Accordingly, additional financing may not be available on acceptable terms, if at all. In the event additional capital resources are unavailable, Byron may be required to curtail its exploration and development activities. It is difficult to quantify the amount of financing Byron may need to fund its planned growth in the longer term. The amount of funding Byron may need in the future depends on various factors, including but not limited to: (i) the Company’s financial condition; and (ii) the success or otherwise of its exploration and development program. Further, the availability of such funding may depend on various factors, including but not limited to, the liquidity of the Company’s shares at the time the Company seeks to raise funds and the prevailing and forecast market price of oil and natural gas. If Byron raises additional funds through the issue of equity securities, this may dilute the holdings of existing shareholders. If Byron obtains additional capital by farming out part of its Working Interest in one or more of its oil and gas properties, the Company’s share of reserves, future production and therefore oil and/or and gas revenues, if any, from those properties will be reduced.
Third party pipelines and operators riskByron may from time to time, depend on third party platforms and pipelines that provide processing and delivery options from its facilities. As these platforms and pipelines are not owned or operated by Byron, their continued operation is not within Byron’s control. Revenues in the future may be adversely affected if Byron’s ability to process and transport oil or natural gas through those platforms and pipelines is impaired. If any of these platform operators ceases to operate their processing equipment, Byron may be required to shut in the associated wells, construct additional facilities or assume additional liability to re-establish production.
Oil and gas reserves estimation risk There are numerous uncertainties in estimating crude oil and natural gas reserves and their value, including many factors that are beyond the control of the Company. It requires interpretations of available technical data and various assumptions, including assumptions relating to economic factors. Any significant inaccuracies in these interpretations or assumptions could materially affect the estimated quantities of reserves. In order to prepare these estimates, Byron’s independent third party petroleum engineers must project production rates and timing of development expenditures as well as analyse available geological, geophysical, production and engineering data, and the extent, quality and reliability of this data can vary. The process also requires economic assumptions relating to matters such as natural gas and oil prices, drilling and operating expenses, capital expenditures, taxes and availability of funds. Actual future production, natural gas and oil prices, revenues, taxes, development expenditures, operating expenses and quantities of recoverable natural gas and oil reserves most likely will vary from our estimates. Any significant variance could materially affect the estimated quantities and pre-tax net present value of reserves. In addition, estimates of proved reserves may be adjusted to reflect production history, results of exploration and development, prevailing natural gas and oil prices and other factors, many of which are beyond the Company’s control and may prove to be incorrect over time. As a result, estimates may require substantial upward or downward revisions if subsequent drilling, testing and production reveal different results. Furthermore, some of the producing wells included in the Company’s reserve report have produced for a relatively short period of time. Accordingly, some of the Company’s reserve estimates are not based on a multi-year production decline curve and are calculated using a reservoir simulation model together with volumetric analysis. Any downward adjustment could indicate lower future production and thus adversely affect the Company’s financial condition, future prospects and market value.
Oil and gas reserves depletion riskByron’s future oil and natural gas production depends on its success in finding or acquiring new reserves. If Byron fails to replace reserves, its level of production and cash flows will be adversely impacted. Production from oil and natural gas properties decline as reserves are depleted, with the rate of decline depending on reservoir characteristics. Byron’s total proved reserves will decline as reserves are produced unless it can conduct other successful exploration and development activities or acquire properties containing proved reserves, or both.
Further, all of Byron’s proved reserves are proved developed producing or behind pipe. Accordingly, Byron does not have significant opportunities to increase production from its existing proved reserves. Byron’s ability to make the necessary capital investment to maintain or expand its asset base of oil and natural gas reserves would be impaired to the extent cash flow from operations is reduced and external sources of capital become limited or unavailable. Byron may not be successful in exploring for, developing or acquiring additional reserves. If Byron is not successful, its future production and revenues will be adversely affected.

Byron Energy Limited Annual Report 2019 45
Oil and gas drilling risk Drilling for crude oil, natural gas and natural gas liquids are high-risk activities with many uncertainties that could adversely affect the Company’s business, financial condition or results of operations.
The drilling and operating activities are subject to many risks, including the risk that we will not discover commercially productive reservoirs. Drilling for crude oil, natural gas and natural gas liquids can be unprofitable, not only from dry holes, but from productive wells that do not produce sufficient revenues to return a profit. In addition, Byron’s drilling and producing operations may be curtailed, delayed or cancelled as a result of other factors, including, unusual or unexpected geological formations and miscalculations; pressures; fires; explosions and blowouts; pipe or cement failures; environmental hazards; such as natural gas leaks; oil spills; pipeline and tank ruptures; encountering naturally occurring radioactive materials and unauthorised discharges of toxic gases, brine, well stimulation and completion fluids, or other pollutants into the surface and subsurface environment; loss of drilling fluid circulation; title problems; facility or equipment malfunctions; unexpected operational events; shortages of skilled personnel; shortages or delivery delays of equipment and services; compliance with environmental and other regulatory requirements; natural disasters; and adverse weather conditions.
Any of these risks can cause substantial losses, including personal injury or loss of life; severe damage to or destruction of property, natural resources and equipment; pollution; environmental contamination; clean-up responsibilities; loss of wells; repairs to resume operations; and regulatory fines or penalties.
Operating riskThe oil and natural gas business, including production activities, involves a variety of operating risks, including: blowouts, fires and explosions; surface cratering; uncontrollable flows of underground natural gas, oil or formation water; natural disasters; pipe and cement failures; casing collapses; stuck drilling and service tools; reservoir compaction; abnormal pressure formation; environmental hazards such as natural gas leaks, oil spills, pipeline and tank ruptures or unauthorised discharges of brine, toxic gases or well fluids; capacity constraints, equipment malfunctions and other problems at third party operated platforms, pipelines and gas processing plants over which Byron has no control; repeated shut-ins of Byron’s well bores could significantly damage the Company’s well bores; and required workovers of existing wells that may not be successful.
If any of the above events occur, Byron could incur substantial losses as a result of injury or loss of life; reservoir damage; severe damage to and destruction of property or equipment; pollution and other environmental and natural resources damage; restoration, decommissioning or clean-up responsibilities; regulatory investigations and penalties; suspension of our operations; or repairs necessary to resume operations
Offshore operations are subject to a variety of operating risks peculiar to the marine environment, such as capsizing and collisions. In addition, offshore operations, and in some instances operations along the Gulf Coast, are subject to damage or loss from hurricanes or other adverse weather conditions. These conditions can cause substantial damage to facilities and interrupt production. As a result, the Company could incur substantial liabilities that could reduce the funds available for exploration, development or leasehold acquisitions, or result in loss of properties.
If Byron was to experience any of these problems, it could affect well bores, platforms, gathering systems and processing facilities, any one of which could adversely affect its ability to conduct operations. In accordance with customary industry practices, Byron maintains insurance against some, but not all, of these risks. Losses could occur for uninsurable or uninsured risks or in amounts in excess of existing insurance coverage. The Company may not be able to maintain adequate insurance in the future at rates we consider reasonable, and particular types of coverage may not be available. An event that is not fully covered by insurance could have a material adverse effect on the Company’s financial position and results of operations.
Execution risk (drilling and operating programs)Shortages or increases in the cost of drilling rigs, equipment, supplies or personnel could delay or adversely affect Byron’s operations which could have a material adverse effect on its business, financial condition and results. Where Byron is the operator it assumes additional responsibilities and risks. As the designated operator, Byron, under the BOEM regulations, will be required to post bonds for exploration and development activities as well as for production activities and future decommissioning obligations. There is the risk that the Company may not be able to obtain sufficient bonding and may have to collateralise obligations with cash. If the Company was unable to provide such bonds, it would not be able to proceed with its operating plans. In addition, as the designated operator Byron will have to demonstrate the required oil spill financial responsibility (‘OSFR’) under the Oil Pollution Act of 1990. The OSFR is based on worst case oil-spill discharge volume. Byron expects to demonstrate OSFR requirement through the purchase of OSFR insurance coverage, a method of demonstrating OSFR acceptable to the BOEM. If the Company was unable to demonstrate OSFR as required by the BOEM, it would not be able to proceed with its operating plans.

Byron Energy Limited Annual Report 201946
Directors’ Report continued
Geographic concentration riskThe geographic concentration of Byron’s properties in the shallow waters in the GOM means that some or all of the properties could be affected by the same event should the Gulf of Mexico experience severe weather, delays or decreases in production, changes in the status of pipelines, delays in the availability of transport and changes in the regulatory environment.
Because all of the Company’s properties could experience the same condition at the same time, these conditions could have a relatively greater impact on results of operations than they might have on other operators who have properties over a wider geographic area.
Climate change riskClimate change continues to attract considerable public, governmental and scientific attention. As a result, various proposals have been made and could continue to be made at the international, national, regional and state levels of government to monitor and limit emissions of greenhouse gases (‘GHG’). Consequently, legislation and regulatory programs to reduce emissions of greenhouse gases could have an adverse effect on the Company’s business, financial condition and results of operations.
While the United States of America Congress has not taken any legislative action to reduce emissions of GHGs, many states have established GHG cap and trade programs. Most of these cap and trade programs work by requiring major sources of emissions, such as electric power plants, or major producers of fuels, such as refineries and gas processing plants, to acquire and surrender emission allowances. The number of allowances available for purchase is reduced each year in an effort to achieve the overall GHG emission reduction goal.
Additionally, the USA is one of almost 200 nations that, in December 2015, agreed to the Paris Agreement, an international climate change agreement in Paris, France that calls for countries to set their own GHG emissions targets and be transparent about the measures each country uses to achieve its GHG emissions targets. The Paris Agreement entered into force on 4 November 2016. However, in August 2017, the US State Department officially informed the United Nations of the intent of the USA to withdraw from the Paris Agreement. The Paris Agreement provides for a four-year exit process beginning when it took effect in November 2016, which would result in an effective exit date of November 2020. The USA’s adherence to the exit process is uncertain and/or the terms on which the USA may re-enter the Paris Agreement or a separately negotiated agreement are unclear at this time.
The Company’s oil and gas asset carrying values may be affected by any resulting adverse impacts to reserve estimates and the Company’s inability to produce such reserves may also negatively impact its financial condition and results.
The growth of alternative energy supply options, such as renewables and nuclear, could also present a change to the energy mix that may reduce the value of oil and gas assets.
The physical effects of climate change on the Company’s assets may include changes in rainfall patterns, water shortages, rising sea levels, increased storm intensities and higher temperatures. These effects could have an adverse effect on the Company’s business, financial condition and results of operations.
Competition riskCompetition in the oil and natural gas industry is intense which may make it more difficult for Byron to acquire further properties, market oil and gas and secure trained personnel. There is also competition for capital available for investment, particularly since alternative forms of energy have become more prominent. Most competitors possess and employ financial, technical and personnel resources substantially greater than those available to Byron. As a result, increased costs of capital could have an adverse effect on Byron’s business.
Environmental riskThe natural gas and oil business involves a variety of operating risks, including but not limited to: (i) blowouts, fires and explosions; (ii) surface cratering; (iii) uncontrollable flows of underground natural gas, oil or formation water and natural disasters. If any of the above events occur, Byron could incur losses as a result of injury or loss of life, reservoir damage, damage to and destruction of property or equipment, pollution and other environmental damage, clean-up responsibilities and regulatory investigations and penalties.
The operation of our future oil and gas properties will be subject to numerous federal, state and local laws and regulations governing the discharge of materials into the environment or otherwise relating to environmental protection.
Failure to comply with these laws and regulations may result in the assessment of administrative, civil and criminal fines and penalties and the imposition of injunctive relief. Accidental releases or spills may occur in the course of the operations of our properties, and we cannot assure you that we will not incur significant costs and liabilities as a result of such releases or spills, including any third party claims for damage to property, natural resources or persons.

Byron Energy Limited Annual Report 2019 47
Among the environmental laws and regulations that could have a material impact on the oil and natural gas exploration and production industry and the Company’s business are the following: Waste Discharges, Air Emissions and Climate Change, Oil Pollution Act, National Environmental Policy Act, Worker Safety, Safe Drinking Water Act, Offshore Drilling, Hazardous Substances and Wastes and Protected and Endangered Species.
Oil and gas transport and processing riskAll of Byron’s oil and natural gas is transported through gathering systems, pipelines and processing plants. Transportation capacity on gathering system pipelines and platforms is occasionally limited and at times unavailable due to repairs or improvements being made to these facilities or due to capacity being utilised by other natural gas or oil shippers that may have priority transportation agreements. If the gathering systems, processing plants, platforms or Byron’s transportation capacity is materially restricted or is unavailable in the future, the Company’s ability to market its oil and/or natural gas could be impaired and cash flow from the affected properties could be reduced, which could have a material adverse effect on its financial condition and results of operations. Further, repeated shut-ins of Byron’s wells could result in damage to its well bores that would impair its ability to produce from these wells and could result in additional wells being required to produce existing reserves.
Exchange rate riskThe functional currency of Byron is Australian dollars and the functional currency of its United States based subsidiaries is United States dollars. Byron has historically presented its financial statements in United States dollars, as the United States dollar is viewed as the best measure of performance for Byron because oil and gas, the dominant sources of revenue, are priced in United States dollars and its oil and gas operations are located in the United States with costs incurred in United States dollars.
As all Byron’s operating assets are in the USA, the Company’s presentation currency, the currency in which it reports its financial results, will be United States dollars. Accordingly, an Australian dollar investment in the Company is exposed to fluctuations between the Australian dollar and the United States dollar exchange rate. In particular, as most of the Company’s capital and operating expenses will be in United States dollars any appreciation/depreciation in the Australian dollar against the United States dollar will effectively decrease/increase the quantum of those costs for shareholders. In addition, the Company’s revenue is derived from United States dollar oil and gas sales. Any appreciation/depreciation of the Australian dollar against the United States dollar will effectively reduce/increase the value of that revenue for shareholders.
Adverse exchange rate variations between the Australian dollar and the United States dollar may impact upon cash balances held in Australian dollars. Since most of Byron’s operations are conducted in United States dollars, Byron generally maintains a substantial portion of its cash balances in United States dollar accounts. From time to time the Company may have substantial cash deposits in Australian dollar accounts. Until these funds are converted into United States dollars, the United States dollar value of the deposits will change as the exchange rate between the two currencies fluctuates.
Key management riskTo a large extent, the Company depends on the services of its senior management. The loss of the services of any of the senior management team, could have a negative impact on the Company’s operations. Byron does not maintain or plan to obtain for the benefit of the Company any insurance against the loss of any of these individuals.
Regulatory riskByron’s oil and gas operations in the Gulf of Mexico, USA are subject to regulation at the US Federal, State and local level and some of the laws, rules and regulations that govern operations carry substantial penalties for non-compliance. Rules and regulations affecting the oil and gas industry are under constant review for amendment or expansion. In addition to possible increased costs, the imposition of increased regulatory based procedures may result in delays in being able to initiate or complete drilling programmes.
The Company does not currently have in place any foreign exchange hedging arrangements. However, foreign exchange hedging strategies will be reviewed by the Company from time to time, implementation of any strategy will depend, inter alia, upon the foreign exchange hedging options available to the Company from time to time, the cash cost of entering into hedging transactions and the Company’s capacity to pay for such costs.

Byron Energy Limited Annual Report 201948
Directors’ Report continued
Other risksThere are a number of other risks which may impact on the operating and financial performance of the Company, including but not limited to:
Seismic risk
3D seismic data and visualisation techniques only assist geoscientists and geologists in identifying subsurface structures and hydrocarbon indicators. They do not allow the interpreter to know if hydrocarbons are present or producible economically.
Lease termination risk
The failure to timely effect all lease related payments could cause the leases to be terminated by the BOEM.
Profitability and impairment write-downs risk
Byron may incur non cash impairment charges in the future, which could have a material adverse effect on its results of operations or the periods in which such charges are taken.
Working Interest partners’ risk
If partners are not able to fund their share of costs, it could result in the delay or cancellation of future projects, resulting in a reduction of Byron’s reserves and production, which could have a materially adverse effect on its financial condition and results of operations.
Bonding risk
As an operator, Byron is required to post surety bonds of US$200,000 per lease for exploration and US$500,000 per lease for developmental activities as part of its general bonding requirements, as well as the posting of additional supplemental bonds to cover, among other things, decommissioning obligations. A failure by an operator to post required supplemental bonding or other financial assurances required by the BOEM could result in the BOEM assessing monetary penalties or requiring any operations on an operator’s federal lease to be suspended or cancelled or otherwise subject an operator to monetary penalties. Any one or more such actions imposed on us could materially adversely affect Byron’s financial condition and results of operations.
Asset retirement obligations (AROs) risk
Byron is required to record a liability for the present value of AROs to plug and abandon inactive, non-producing wells, to remove inactive or damaged platforms, facilities and equipment and to restore land and seabed when production finishes. Estimating future costs is uncertain because most obligations are many years in the future, regulatory requirements will change and technologies are evolving which may make it more expensive to meet these obligations.
Insurance risk
In accordance with industry practice, Byron maintains insurance against some, but not all, of the operating risks to which its business is exposed. Byron will not be insured against all potential risks and liabilities. Future insurance coverage for the oil and gas industry could increase in cost and may include higher deductibles or retentions. In addition, some forms of insurance may become unavailable in the future or unavailable on terms that are economically acceptable.
Cyber-security risk
The oil and gas industry is increasingly dependent on digital technologies to conduct certain exploration, development, production, processing and distribution activities. The industry faces various security threats, including cyber-security threats. Cyber-security attacks in particular are increasing. Although to date Byron has not experienced any material losses related to cyber-security attacks, it may suffer such losses in the future. If any of these events were to materialise, they could lead to losses of intellectual property and other sensitive information essential to the Company’s business and could have a material adverse effect on its business prospects, reputation and financial position.
Share market investment risk
The Company’s shares are quoted on the ASX, where their price may rise or fall. The shares carry no guarantee in respect of profitability, dividends or return of capital, or the price at which they may trade on the ASX. The value of the shares will be subject to the market and hence a range of factors outside of the control of the Company and the directors and officers of the Company. Returns from an investment in the shares may also depend on general share market conditions, as well as the performance of the Company.
Historically, the stock market has experienced significant price and volume fluctuations. Stock market volatility and volatility in commodity prices has had a significant impact on the market price of securities issued by many companies, including companies in the oil and gas industry. The changes frequently appear to occur without regard to the operating performance of the affected companies. Hence, the price of the Company’s shares could fluctuate based upon factors that have little or nothing to do with Byron, and these fluctuations could materially reduce its share price.

Byron Energy Limited Annual Report 2019 49
The Company’s Board of Directors presently intends to retain all of our earnings for the expansion of the business; therefore, there are no plans to pay regular dividends. Any payment of future dividends will be at the discretion of the Board of Directors and will depend on, among other things, earnings, financial condition, capital requirements, level of indebtedness, and other considerations that the Board of Directors deems relevant.
Future sales or the availability for sale of substantial amounts of the Company’s shares in the public market could adversely affect the prevailing market price of Byron’s shares and could impair its ability to raise capital through future issues of equity securities.
Significant events after the balance dateThere has been no matter or circumstance since 30 June 2019 which has significantly affected or may significantly affect the operations of the consolidated entity, the results of those operations or the state of affairs of the consolidated entity in subsequent financial years other than those described below:
• on 5 July 2019, Byron announced to the ASX that, the Byron operated SM74 D14 well was to be plugged and abandoned;
• on 17 July 2019, Byron announced to the ASX that following the passage of Hurricane Barry the Company’s operations in the Gulf of Mexico had returned to normal without any storm damage;
• on 18 July 2019, Byron announced to the ASX that Metgasco Limited had exercised 10,000,000 unlisted options, over unissued shares, in the Company at A$0.25 each;
• on 7 August 2019, Byron announced to the ASX that the Enterprise 263 jack-up drilling rig commenced drilling operations on the Byron operated SM58 011 well, the Company’s first test well on its recently acquired South Marsh Island 58 block;
• on 22 August 2019, Byron announced to the ASX that it’s permitting two wells on SM71; one to extend the limits of the D5 reservoir and a second to more efficiently drain the remaining D5 reserves at SM71;
• in its releases of 26 August 2019, 29 August 2019 and 16 September 2019, Byron announced that the SM58 011 well had encountered a substantial hydrocarbon column with a true vertical thickness net pay of 301 feet; due to mechanical difficulties, Byron decided to set the 7 5/8” casing at a depth of 7,940 feet measured depth, and then undertake a cleanout run to 10,811 feet measured depth with smaller 4” diameter drill pipe and run 5 ½” casing across the Upper O Sand pay interval to protect it; the 5 ½” casing will still allow a 2 7/8” tubing completion across the pay zone;
• on 19 September 2019, the Company released its annual reserves and resources report as of 30 June 2019, as independently assessed by Collarini Associates; and
• on 26 September 2019, Byron announced that: (i) it had reached agreement with five of the six its existing lenders, (including four Directors), for the repayment date on existing loans of US$2.0 million and A$2.1 million, to extend the repayment date of the loan facility from 30 November 2019 to 31 March 2021, with interest rate and other terms remaining unchanged, while the remaining lender for A$1.0 million, is yet to decide on the extension; and (ii) it had established a new short-term loan facility for US$2.0 million and A$1.45 million, sourced from four of the Company’s directors and two shareholders. This loan facility is unsecured, repayable by 31 December 2019 and will bear interest, from time of drawdown, at a rate of 10% per annum payable on loan repayment date.
Future developmentsIt is expected that the consolidated entity will continue its oil and gas exploration, development and production activities in the shallow waters of the Gulf of Mexico, USA.
Further information regarding likely developments are not included in this report. As the Company is listed on the Australian Securities Exchange (‘ASX’), it is subject to the continuous disclosure requirements of the ASX Listing Rules which require immediate disclosure to the market of information that is likely to have a material effect on the price or value of Byron Energy Limited’s securities.
DividendsNo dividends in respect of the current financial year have been paid, declared or recommended for payment (2018: nil).
Environmental regulationThe consolidated entity’s operations are not regulated by any significant environmental regulation under a law of the Commonwealth or of any state or territory of Australia. The consolidated entity’s oil and gas exploration activities are subject to significant environmental regulation under United States of America Federal and State legislation.
The Directors are not aware of any breach of environmental compliance requirements relating to the consolidated entity’s activities during the year.
Non-audit servicesDeloitte Touche Tohmatsu did not provide non-audit services to the Company during the financial year.

Byron Energy Limited Annual Report 201950
Directors’ Report continued
Auditor independence declaration A copy of the auditor’s independence declaration under s.307C of the Corporation Act 2001 in relation to the audit of the full year is included in this report.
Indemnification and insurance of officers and auditorsDuring the financial year the Company paid an insurance premium in respect of Directors’ and Officers’ liability for the current directors and officers including the Company Secretary. Under the terms of the policy the premium amount, coverage and other terms of the policy have been agreed to be confidential and not to be disclosed.
The Company has not otherwise, during or since the financial year, except to the extent permitted by law, indemnified or agreed to indemnify an officer or auditor of the Company or of any related body corporate against a liability incurred as such an officer or auditor.
Significant changes in the state of affairsDuring the financial year, there were no significant changes in the state of affairs of the consolidated entity, other than those set out in the Review of Operations.
Directors’ meetingsThe charter for the Audit and Risk Management Committee was adopted on 12 July 2007 and most recently amended on 25 June 2014. The current members of the committee consist of Paul Young (Chairman) and Charles Sands.
During the year there was four Board meetings and three Audit and Risk Management Committee meetings held. The numbers of meetings attended by each director were as follows:
Board of DirectorsAudit and Risk
Management Committee
DirectorsEntitled
to attend AttendedEntitled
to attend Attended
Douglas G Battersby 4 4 - -
Maynard V Smith 4 4 - -
Prent H Kallenberger 4 4 - -
Charles J Sands 4 3 3 3
Paul A Young 4 4 3 3
William R Sack 4 4 - -
Remuneration Report – Audited This Remuneration Report, which forms part of the Directors’ Report, sets out information about the remuneration of the Group’s directors and other key management personnel for the financial year ended 30 June 2019. The prescribed details for each person covered by this report are detailed below.
Details of directors and other key management personnelDirectors and other key management personnel of the Company during and since the end of the financial year are as follows:
Directors
Douglas G Battersby
Maynard V Smith
Prent H Kallenberger
Charles J Sands
Paul A Young
William R Sack
Key management personnel
Nick Filipovic – Chief Financial Officer and Company Secretary

Byron Energy Limited Annual Report 2019 51
The Remuneration Report is set out below under the following main headings:
A. Principles and agreements; and
B. Remuneration of directors and other key management personnel
A. Principles and agreementsRemuneration levels are set to attract and retain appropriately qualified and experienced directors and executives. The Board is responsible for remuneration policies and practices. The Board may seek independent advice on remuneration policies and practices, including compensation packages and terms of employment.
The directors’ and key management personnel remuneration levels are not directly dependent upon the Company or consolidated entity’s performance or any other performance conditions.
Directors’ remuneration is inclusive of committee fees.
Additional information
The Corporations Act requires disclosure of the Company’s remuneration policy to contain a discussion of the Company’s earnings and performance and the effect of the Company’s performance on shareholder wealth in the reporting period and the four previous financial years. The table below provides a five year financial summary.
30 June 2015US$
30 June 2016US$
30 June 2017US$
30 June 2018US$
30 June 2019US$
Revenue (net of royalties) - - - 9,544,507 31,324,061
Net profit (loss) before tax (4,238,855) (30,944,243) (5,357,583) 1,298,968 5,718,988
Net profit (loss) after tax (4,238,855) (30,944,243) (5,357,583) 1,298,968 5,718,988
Share price at start of year A$0.70 A$0.23 A$0.15 A$0.095 A$0.335
Share price at end of year A$0.23 A$0.15 A$0.095 A$0.355 A$0.29
Basic earnings per share (US$0.029) (US$0.147) (US$0.02) US$0.0022 US$0.0083
Diluted earnings per share (US$0.029) (US$0.147) (US$0.02) US$0.0022 US$0.0080
(i) Non-Executive Directors
The ASX Listing Rules provide that the aggregate remuneration of Non-Executive Directors shall be determined from time to time by a general meeting of shareholders. The latest determination was at the extraordinary general meeting held on 22 April 2013 when shareholders approved an aggregate remuneration of A$300,000 per annum.
The amount of aggregate remuneration sought to be approved by shareholders and the fee structure is reviewed annually.
The Chairman, Douglas Battersby, is paid an annual Non-Executive Director’s fee of A$80,000, paid pro-rata on a quarterly basis, as well as reimbursement of costs relating incurred by him in his performance of his duties as a director.
Non-Executive Directors, Charles Sands and Paul Young, are paid an annual Non-Executive Director’s fee of A$40,000 each, paid pro-rata on a quarterly basis, as well as reimbursement of costs incurred by them relating to their performance as directors.
There are no termination or retirement benefits for Non-Executive Directors (other than statutory superannuation where applicable).

Byron Energy Limited Annual Report 201952
Directors’ Report continued
Remuneration Report – Audited continued
(ii) Executive directors and key management personnel
Remuneration levels of Executive Directors and key management personnel are set to attract and retain appropriately qualified and experienced directors and executives. This involves assessing the appropriateness of the nature and amount of remuneration on a periodic basis by reference to market conditions, length of service and particular experience of the individual concerned.
Remuneration packages may include a mix of fixed and variable remuneration, short and long-term performance-based incentives. The remuneration packages are reviewed annually by the Board as required.
Remuneration and other terms of employment of the Chief Executive Officer (Maynard Smith), Executive Director and Chief Operating Officer (Prent Kallenberger), Executive Director (William Sack) and the CFO/Company Secretary (Nick Filipovic) are detailed below.
Fixed remuneration for executive directors and key management personnelMaynard Smith
The Company entered into a new service agreement with Maynard Smith via a company of which Mr Smith is a director on 15 September 2017. Mr Smith’s contract is for a period of three years, at an initial annual rate of A$160,000 plus reasonable and justifiable business expenses, with an automatic extension for a further one year unless the parties elect to terminate the contract at the end of three years. The contract is further terminable by either party ‘for cause’ immediately on notice and otherwise ‘without cause’ on 90 days’ notice. On 26 June 2018 the Company announced that the annual service fee payable in respect of Mr Smith’s services was increased from A$160,0000 to A$550,000 (excluding GST) per annum, effective 1 July 2018. All other terms and conditions of the service agreement remained unchanged.
In addition, Mr Smith will be eligible to participate in the Company’s short and long-term incentive scheme as determined by the Board from time to time.
Prent Kallenberger
The Company entered into an employment agreement with Prent Kallenberger for three years commencing on 15 September 2017 with an automatic extension for a further one year unless the parties elect to terminate the contract at the end of three years. The contract is further terminable by the Company ‘for cause’ immediately on notice and otherwise ‘without cause’ on 90 days’ notice. Under the agreement, Mr Kallenberger’s remuneration is US$350,000 per annum in fixed remuneration plus medical insurance. In addition, Mr Kallenberger will be eligible to participate in the Company’s short and long-term incentive scheme as determined by the Board from time to time.
William Sack
The Company entered into an employment agreement with William Sack for three years commencing on 15 September 2017 with an automatic extension for a further one year unless the parties elect to terminate the contract at the end of three years. The contract is further terminable by the Company ‘for cause’ immediately on notice and otherwise ‘without cause’ on 90 days’ notice. Under the agreement Mr Sack’s remuneration is US$350,000 plus medical insurance and reasonable and justifiable business expenses. In addition, Mr Sack will be eligible to participate in the Company’s short and long-term incentive scheme as determined by the Board from time to time.
Nick Filipovic
The Company has a letter agreement with Nick Filipovic. Under Mr Filipovic’s letter of engagement, he is entitled to a gross salary of A$300,000 per annum plus superannuation at the statutory rate. Byron may terminate Mr Filipovic’s employment at any time by giving 90 days’ notice or in case of serious misconduct employment may be terminated without notice. Should Mr Filipovic resign from Byron he will need to give 90 days’ notice.
B. Remuneration of directors and key management personnelOptions
The executive directors were each granted 2,100,000 share options, following shareholder approval at the AGM held on 22 November 2018, at an exercise price of the share options of A$0.40 cents which was a premium of 82% over the share price at the date of approval. The Board considers the number of share options granted to the executive directors is commensurate with their value to the Company and the potential for them to increase shareholder value. In addition, 1,000,000 share options were granted to the CFO and Company Secretary, in recognition of his contribution to the Company, which the Board considers to be commensurate with his value to the Company and the potential for him to increase shareholder value. During the year, Bill Sack, an executive director of the Company exercised 1,700,000 share options @ A$0.25 cents per share during the financial year. There are no Employee Share Option plans in place.

Byron Energy Limited Annual Report 2019 53
At the end of the financial year, the following share-based payment arrangements were in existence:
Grantee Number Grant date Vesting date Expiry date Exercise priceFair value at
grant date
M Smith 2,500,000 24 Nov 2016 24 Nov 2016 31 Dec 2019 A$0.25 A$0.0489
M Smith 6,300,000 18 Sept 2017 18 Sept 2017 31 Dec 2021 A$0.12 A$0.0555
M Smith 2,100,000 22 Nov 2018 22 Nov 2018 31 Dec 2021 A$0.40 A$0.0837
P Kallenberger 2,500,000 24 Nov 2016 24 Nov 2016 31 Dec 2019 A$0.25 A$0.0489
P Kallenberger 6,300,000 18 Sept 2017 18 Sept 2017 31 Dec 2021 A$0.12 A$0.0555
P Kallenberger 2,100,000 22 Nov 2018 22 Nov 2018 31 Dec 2021 A$0.40 A$0.0837
W Sack 2,500,000 24 Nov 2016 24 Nov 2016 31 Dec 2019 A$0.25 A$0.0489
W Sack 6,300,000 18 Sept 2017 18 Sept 2017 31 Dec 2021 A$0.12 A$0.0555
W Sack 2,100,000 22 Nov 2018 22 Nov 2018 31 Dec 2021 A$0.40 A$0.0837
N Filipovic 1,000,000 24 Nov 2016 24 Nov 2016 31 Dec 2019 A$0.25 A$0.0489
N Filipovic 3,780,000 18 Sept 2017 18 Sept 2017 31 Dec 2021 A$0.12 A$0.0555
N Filipovic 1,000,000 22 Nov 2018 22 Nov 2018 31 Dec 2021 A$0.40 A$0.0837
These options are transferrable and not quoted. They may be exercised at any time after vesting date.
The following table summarises the value of the options granted during the year. Other than the value of options granted in the table below, there were no other directors and other key management personnel options granted during the year.
Grantees Value of options granted in US$*
Mr M V Smith 125,793
Mr P Kallenberger 125,793
Mr W R Sack 125,793
Mr N Filipovic 59,901
* The value of the options granted to a director as part of their remuneration is calculated as at the grant date in accordance with AASB 2 using a binomial pricing model.
Other transactions with key management personnel of the GroupLoans repaid
During the previous financial year, the Company entered into unsecured loan agreements, bearing interest at 10% per annum, with three of the Company’s directors, for a total drawdown of US$1,000,000 and A$520,000. The loans were outstanding on 30 June 2018 and were repaid in October 2018. The individual directors’ transactions and balances for these loans are detailed below:
• Veruse Pty Ltd, a company controlled by Mr Douglas Battersby was repaid A$520,000 and interest of A$20,942;
• Geogeny Pty Ltd, a company controlled by Mr Maynard Smith was repaid US$500,000 and interest of US$21,918; and
• Charles Sands was repaid US$500,000 and interest of US$19,849 (net of withholding taxes).
Loans drawn down
In March 2019, the Company entered into unsecured loan agreements, bearing interest at 10% per annum, with four of the Company’s directors, for a total drawdown of US$2,000,000 and A$1,750,000. The loans were outstanding on 30 June 2019, and are due for repayment in November 2019. The individual directors’ transactions and balances for these loans are detailed below:
• Veruse Pty Ltd, a company controlled by Mr Douglas Battersby, has provided an unsecured loan of A$1,400,000 to the Company and interest charges of A$35,671 have been accrued as at 30 June 2019;
• Clapsy Pty Ltd, a company controlled by Mr Paul Young, has provided an unsecured loan of A$175,000 to the Company and interest charges of A$4,555 have been accrued as at 30 June 2019;
• Poal Pty Ltd, a company controlled by Mr Paul Young, has provided an unsecured loan of A$175,000 to the Company and interest charges of A$4,555 have been accrued as at 30 June 2019;
• Geogeny Pty Ltd, a company controlled by Mr Maynard Smith, has provided an unsecured loan of US$1,000,000 to the Company and interest charges of US$25,479 have been accrued as at 30 June 2019; and
• Charles Sands has provided an unsecured loan of US$1,000,000 to the Company and interest charges of US$23,178 (net of withholding taxes) have been accrued as at 30 June 2019.

Byron Energy Limited Annual Report 201954
Directors’ Report continued
Remuneration Report – Audited continued
Additional information – key management personnel equity and share option holdings The interests of each director and other key management personnel (directly and indirectly), in the shares and options of Byron Energy Limited are as follows:
Ordinary shares
Director/key management personnel
Balance on 1 July 2018
Number
Granted as compensation
Number
Received on exercise
of optionsNumber
Purchased on the ASX
Number
Balance on 30 June 2019
Number
D G Battersby 48,123,203 - - - 48,123,203
M V Smith 32,313,583 - - - 32,313,583
P H Kallenberger 1,732,223 - - - 1,732,223
C J Sands 19,765,997 - - - 19,765,997
P A Young 18,655,631 - - - 18,655,631
W R Sack 1,900,000 - 1,700,000 - 3,600,000
N Filipovic 584,788 - - 50,000 634,788
During the financial year, no shares were granted to directors or other key management personnel of the Company.
Bill Sack, an executive director of the Company exercised 1,700,000 share options @ A$0.25 cents per share during the financial year.
Share options over ordinary shares
Director/key management personnel
Balance on 1 July 2018
Number
Granted as compensation
Number
Exercise of options
Number
Expired optionsNumber
Balance on 30 June 2019
Number
M V Smith 8,800,000 2,100,000 - - 10,900,000
P H Kallenberger 8,800,000 2,100,000 - - 10,900,000
W R Sack 10,500,000 2,100,000 (1,700,000) - 10,900,000
N Filipovic 4,780,000 1,000,000 - - 5,780,000
During the financial year, Messers Smith, Kallenberger and Sack were each granted 2,100,000 share options and Nick Filipovic was granted 1,000,000 share options. All share options granted were approved at the Company’s AGM.
BonusesBonuses of US$1,087,366 were granted to executive directors and the key management personnel during the financial year ended 30 June 2019 (2018: nil).
At the discretion of the Board, the Non-Executive Directors resolved to grant bonuses having regard to (a) the salaries forgone by Messrs Kallenberger, Sack and Filipovic and the service fees forgone by Mr Smith, (b) the fact that Mr Smith’s service fees have been below market rates ever since the Company listed on the ASX in May 2013, and (c) the successful efforts by the senior executive team to raise the necessary equity funds and to develop and bring SM71 to production.

Byron Energy Limited Annual Report 2019 55
Short-term employee benefits
Post- employment
benefitsShare-based
payments
2019
Salaries and fees
US$
Short- term cash incentive
US$
Other benefits
US$
Service agreements
US$
Super-annuation
US$
100% vested share
optionsUS$
TotalUS$
Directors
D G Battersby - - - 57,248 - - 57,248
M S Smith - 357,800 - 393,580 - 125,793 877,173
P H Kallenberger 350,000 275,333 27,350 - - 125,793 778,476
C J Sands 28,624 - - - - - 28,624
P A Young 28,624 - - - 2,719 - 31,343
W R Sack 350,000 275,333 29,798 - - 125,793 780,924
Key management personnel
N Filipovic 214,680 178,900 - - 20,395 59,901 473,876
971,928 1,087,366 57,148 450,828 23,114 437,280 3,027,664
Short-term employee benefits
Post- employment
benefitsShare-based
payments
2018
Salaries and fees
US$
Short- term cash incentive
US$
Other benefits
US$
Service agreements
US$
Super-annuation
US$
100% vested share
optionsUS$
TotalUS$
Directors
D G Battersby - - - 62,024 - - 62,024
M S Smith - - - 124,048 - 270,921 394,969
P H Kallenberger 321,000 - 27,786 - - 270,921 619,707
C J Sands 31,012 - - - - - 31,012
P A Young 31,012 - - - 2,946 - 33,958
W R Sack 321,000 - 24,400 - - 270,921 616,321
Key management personnel
N Filipovic 213,208 - - - 20,255 162,552 396,015
917,232 - 52,186 186,072 23,201 975,315 2,154,006
End of Remuneration Report.

Byron Energy Limited Annual Report 201956
Directors’ Report continued
This Directors’ Report is signed in accordance with a resolution of directors made pursuant to s.298(2) of the Corporations Act 2001.
On behalf of the directors
D G Battersby Chairman
26 September 2019

Byron Energy Limited Annual Report 2019 57
Auditor’s Independence Declaration
Deloitte refers to one or more of Deloitte Touche Tohmatsu Limited, a UK private company limited by guarantee, and its network of member firms, each of which is a legally separate and independent entity. Please see www.deloitte.com/au/about for a detailed description of the legal structure of Deloitte Touche Tohmatsu Limited and its member firms. Liability limited by a scheme approved under Professional Standards Legislation. Member of Deloitte Asia Pacific Limited and the Deloitte Network
Deloitte Touche Tohmatsu ABN 74 490 121 060 550 Bourke Street Melbourne VIC 3000 GPO Box 78 Melbourne VIC 3001 Australia DX 111 Tel: +61 (0) 3 9671 7000 Fax: +61 (0) 3 9671 7001 www.deloitte.com.au
26 September 2019 The Board of Directors Byron Energy Limited Level 4, 480 Collins Street MELBOURNE VIC 3000
Dear Board Members
Byron Energy Limited In accordance with section 307C of the Corporations Act 2001, I am pleased to provide the following declaration of independence to the directors of Byron Energy Limited. As lead audit partner for the audit of the financial statements of Byron Energy Limited for the financial year ended 30 June 2019, I declare that to the best of my knowledge and belief, there have been no contraventions of: (i) the auditor independence requirements of the Corporations Act 2001 in relation to the audit;
and
(ii) any applicable code of professional conduct in relation to the audit. Yours sincerely DELOITTE TOUCHE TOHMATSU Craig Bryan Partner Chartered Accountants

Byron Energy Limited Annual Report 201958
Consolidated Statement of Profit or Loss and Other Comprehensive Income For the Financial Year Ended 30 June 2019
Consolidated
Note2019US$
2018US$
Continuing operations
Revenues from sale of oil and gas 38,572,362 11,743,399
Royalty expense (7,248,301) (2,198,892)
Cost of sales 2 (7,261,616) (1,807,414)
Gross profit 24,062,445 7,737,093
Fair value adjustment on embedded derivative element of convertible note 397,215 -
Recoupment of operator overheads 200,499 251,084
Corporate and administration costs (2,874,346) (1,671,486)
Impairment expense and dry hole expense 8(a) (12,915,955) (1,746,863)
Share-based payments (670,141) (1,441,662)
Depreciation/amortisation of property, plant and equipment (96,598) (20,710)
Other expenses (1,925,845) (751,881)
Financial income 3 48,420 15,425
Financial expense 3 (506,706) (1,072,032)
Profit before tax 5,718,988 1,298,968
Income tax expense 4 - -
Profit for the year from continuing operations 5,718,988 1,298,968
Other comprehensive income, net of income tax
Items that may subsequently be reclassified to profit and loss
Exchange differences on translating the parent entity group 21,187 135,435
Total comprehensive profit for the year 5,740,175 1,434,403
Earnings per share
Basic (cents per share) 5 0.83 0.22
Diluted (cents per share) 5 0.80 0.22
The accompanying notes form part of these financial statements.

Byron Energy Limited Annual Report 2019 59
Consolidated
Note2019US$
2018US$
Assets
Current assets
Cash and cash equivalents 18(b) 6,783,320 2,256,958
Trade and other receivables 6 5,068,725 6,208,427
Restricted cash and cash equivalents 1(g) 4,377,250 -
Other 7 1,633,986 855,215
Total current assets 17,863,281 9,320,600
Non-current assets
Exploration and evaluation assets 8(a) 6,587,670 3,937,828
Oil and gas properties 8(b) 27,192,032 26,174,962
Other 7 1,488,177 732,062
Property, plant and equipment 9 50,162 39,118
Other intangible assets 10 312,188 32,082
Total non-current assets 35,630,229 30,916,052
Total assets 53,493,510 40,236,652
Liabilities
Current liabilities
Trade and other payables 11 8,925,339 3,927,270
Provisions 12 124,361 131,112
Borrowings 13 5,747,990 5,780,281
Total current liabilities 14,797,690 9,838,663
Non-current liabilities
Provisions 12 1,984,062 1,184,180
Borrowings 13 - 707,186
Total non-current liabilities 1,984,062 1,891,366
Total liabilities 16,781,752 11,730,029
Net assets 36,711,758 28,506,623
Equity
Issued capital 14 101,091,750 99,296,931
Foreign currency translation reserve 15 (131,466) (152,653)
Share option reserve 15 5,364,398 4,694,257
Accumulated losses (69,612,924) (75,331,912)
Total equity 36,711,758 28,506,623
The accompanying notes form part of these financial statements.
Consolidated Statement of Financial PositionAt 30 June 2019

Byron Energy Limited Annual Report 201960
Consolidated Statement of Changes in EquityFor the Financial Year Ended 30 June 2019
Consolidated entity
Ordinary share capital
US$
Share option reserve
US$
Foreign currency
translation reserve
US$
Accumulated losses
US$TotalUS$
Balance at 1 July 2017 77,993,786 3,252,595 (288,088) (76,630,880) 4,327,413
Profit for the year - - - 1,298,968 1,298,968
Exchange differences arising on translation of the parent entity - - 135,435 - 135,435
Total comprehensive profit for the year - - 135,435 1,298,968 1,434,403
The issue of 378,970,262 shares under a placement at A$0.07 per share 20,771,360 - - - 20,771,360
The issue of 28,569,610 shares under a SPP at A$0.07 per share 1,565,900 - - - 1,565,900
Recognition of share-based payments - 1,441,662 - - 1,441,662
Equity raising costs (1,034,115) - - - (1,034,115)
Balance at 30 June 2018 99,296,931 4,694,257 (152,653) (75,331,912) 28,506,623
Balance at 1 July 2018 99,296,931 4,694,257 (152,653) (75,331,912) 28,506,623
Profit for the year - - - 5,718,988 5,718,988
Exchange differences arising on translation of the parent entity - - 21,187 - 21,187
Total comprehensive profit for the year - - 21,187 5,718,988 5,740,175
The issue of 3,766,479 shares at A$0.2655 per share upon conversion of A$1,000,000 convertible notes 724,400 - - - 724,400
The exercise of 1,950,000 share options at A$0.25 per share 344,419 - - - 344,419
The issue of 4,669,904 shares at A$0.2141 per share upon conversion of A$1,000,000 convertible notes 726,000 - - - 726,000
Recognition of share-based payments - 670,141 - - 670,141
Balance at 30 June 2019 101,091,750 5,364,398 (131,466) (69,612,924) 36,711,758
The accompanying notes form part of these financial statements.

Byron Energy Limited Annual Report 2019 61
Consolidated
Note2019US$
2018US$
Cash flows from operating activities
Receipts from customers 39,368,406 7,746,143
Payments to suppliers and employees (15,823,182) (4,326,903)
Interest paid (321,899) (803,503)
Interest received 10,333 8,717
Net cash flows from operating activities 18(a) 23,233,658 2,624,454
Cash flows from investing activities
Payments for development of oil and gas properties (5,118,734) (20,769,582)
Payments for exploration and evaluation assets (14,132,274) (3,278,167)
Payments for intangible assets (software) (366,488) -
Payments for property, plant and equipment (21,087) (53,600)
Net cash flows used in investing activities (19,638,583) (24,101,349)
Cash flows from financing activities
Proceeds from issues of ordinary shares - 22,337,260
Proceeds from exercise of share options 344,419 -
Payment of equity raising costs - (1,034,115)
Redemption of convertible notes (2,181,800) (2,342,900)
Repayment of borrowings (1,373,776) -
Proceeds from borrowings 4,195,110 1,390,676
Net cash flows from financing activities 983,953 20,350,921
Net increase (decrease) in cash and cash equivalents held 4,579,028 (1,125,974)
Cash and cash equivalents at the beginning of the year 2,256,958 3,395,501
Effect of exchange rate changes on the balance of cash held in foreign currencies (52,666) (12,569)
Cash and cash equivalents at the end of the year 18(b) 6,783,320 2,256,958
The accompanying notes form part of these financial statements.
Consolidated Statement of Cash FlowsFor the Financial Year Ended 30 June 2019

Byron Energy Limited Annual Report 201962
Notes to the Financial StatementsFor the Financial Year Ended 30 June 2019
1. Summary of significant accounting policies
2. Profit for the year
3. Financial income and expenses
4. Income tax
5. Earnings per share
6. Trade and other receivables
7. Other assets
8. (a). Exploration and evaluation assets (b). Oil and gas properties (c). Acquisition of oil and gas assets
9. Property, plant and equipment
10. Other intangible assets
11. Trade and other payables
12. Provisions
13. Borrowings
14. Issued capital
15. Reserves
16. Franking credits
17. Expenditure commitments
18. Cash flow reconciliation
19. Controlled entities
20. Foreign currency translation
21. Contingent liabilities
22. Share-based payments
23. Employee benefits and superannuation commitments
24. Auditors’ remuneration
25. Key management personnel compensation
26. Related party transactions
27. Financial instruments
28. Segment information
29. Parent entity information
30. Operating lease arrangements
31. Interests in joint operations
32. Subsequent events

Byron Energy Limited Annual Report 2019 63
1. Summary of significant accounting policies Statement of complianceThese financial statements are general purpose financial statements which have been prepared in accordance with the Corporations Act 2001, Accounting Standards and Interpretations, and comply with other requirements of the law.
The financial statements comprise the consolidated financial statements of the Group. For the purposes of preparing the consolidated financial statements, the Company is a for-profit entity.
Accounting Standards include Australian Accounting Standards. Compliance with Australian Accounting Standards ensures that the financial statements and notes of the Company and Group comply with International Financial Reporting Standards (‘IFRS’).
The financial statements were authorised for issue by the directors on 26 September 2019.
The following significant policies have been adopted in the preparation and presentation of the financial statements:
Basis of preparationThe Financial Report has been prepared on the basis of historical cost. Historical cost is based on the fair values of the consideration given in exchange for goods and services. Fair value is the price that would be received to sell an asset or paid to transfer a liability in an orderly transaction between market participants at the measurement date, regardless of whether that price is directly observable or estimated using another valuation technique. All amounts are presented in United States of America dollars, unless otherwise noted.
Critical accounting judgements and key sources of estimation uncertaintyThe preparation of the consolidated financial statements requires management to make judgements, estimates and assumptions that affect the application of accounting policies and the reported amounts of assets, liabilities, income and expense. Actual results may differ from these estimates.
The estimates and underlying assumptions are reviewed on an ongoing basis. Revisions to accounting estimates are recognised in the period in which the estimate is revised and in any future periods effected.
In particular, information about significant areas of estimation uncertainty and critical judgements in applying accounting policies that have the most significant effect on the amount recognised in the financial statements are described in Notes 1(c) Oil and gas properties (amortisation based upon estimates of proved and probable reserves), 1(d) Impairment and 1(n) Provisions (site restoration). Adoption of new and revised Accounting StandardsThe Group has adopted all of the new and revised Standards and Interpretations issued by the Australian Accounting Standards Board (the ‘AASB’) that are relevant to their operations and effective for the current year.
New and revised Standards and amendments thereof and Interpretations effective for the current year that are relevant to the Group include:
Standard/InterpretationAASB 9 Financial Instruments and related amending Standards
AASB 2016-5 Amendments to Australian Accounting Standards – Classification and Measurement of Share-based Payment Transactions
AASB 9 Financial Instruments and related amending Standards
In the current year, the Group has applied AASB 9 Financial Instruments (as amended) and the related consequential amendments to other Accounting Standards that are effective for an annual period that begins on or after 1 January 2018.
AASB 9 introduced new requirements for:
• the classification and measurement of financial assets and financial liabilities; and
• impairment of financial assets.
The Group has the following financial instruments:
• trade and other receivables;
• trade and other payables; and
• borrowings.
There was no change to the classification of any financial instruments and they continue to be classified at amortised cost.

Byron Energy Limited Annual Report 201964
Notes to the Financial Statements continuedFor the Financial Year Ended 30 June 2019
1. Summary of significant accounting policies continued
Classification and measurement of financial assets
The date of initial application (i.e. the date on which the Group has assessed its existing financial assets and financial liabilities in terms of the requirements of AASB 9) is 1 July 2018. Accordingly, the Group has applied the requirements of AASB 9 to instruments that continue to be recognised as at 1 July 2018 and has not applied the requirements to instruments that have already been derecognised as at 1 July 2018. Given the assets recognised, no irrecoverable elections were required to be made.
Impairment of financial assets
In relation to the impairment of financial assets, AASB 9 requires an expected credit loss model as opposed to an incurred credit loss model under IAS 39. The expected credit loss model requires the Group to account for expected credit losses and changes in those expected credit losses at each reporting date to reflect changes in credit risk since initial recognition of the financial assets. In other words, it is no longer necessary for a credit event to have occurred before credit losses are recognised.
The Group’s financial assets do not have a significant financing component. Therefore the entity has adopted the simplified approach for measuring expected credit losses at an amount equal to lifetime expected loss allowance for its financial assets.
None of the reclassifications or assessment of impairment of financial assets have had a material impact on the Group’s financial position, profit or loss, other comprehensive income or total comprehensive income in either year.
Standards and Interpretations in issue not yet adoptedAt the date of authorisation of the financial statements, the Standards and Interpretations relevant to the Group that were in issue but not yet effective are listed below.
Standard/Interpretation
Effective for annual reporting periods beginning on or after
Expected to be initially applied in the financial year ending
AASB 16 Leases 1 January 2019 30 June 2020
AASB 16 Leases is effective for years commencing on or after 1 July 2019. AASB 16 eliminates the classification of leases as either operating leases or finance leases for lessees as required by AASB 117 Leases and instead, introduces a single lessee accounting model. Applying that model, a lessee is required to recognise:
On initial application of AASB 16, for all leases (except as noted below), the entity will:
(a) recognise right-of-use assets and lease liabilities in the statement of financial position, initially measured at the present value of the future lease payments;
(b) recognise depreciation of right-of-use assets and interest on lease liabilities in the statement of profit or loss; and
(c) reparate the total amount of cash paid into a principal portion (presented within financing activities) and interest (presented within operating activities) in the cash flow statement.
Exploration and evaluation leases are specifically excluded from AASB 16.
Under AASB 16, the Group will recognise a right-of-use asset and a corresponding lease liability in relation to the non-cancellable operating leases of office premises and the compressor on the SM71 F platform. Upon adoption, a right-of-use asset will be recognised at an amount equal to the corresponding lease liability. The Group currently expects the lease agreements, which were signed prior to 1 July 2019, to result in a right-of-use asset and lease liability of US$1,116,209 for the office premises and US$64,860 for the SM71 compressor, prior to any discounting.
Standards and Interpretations issued not yet effective – IASB and IFRIC InterpretationsAt the date of authorisation of the financial statements, the following IASB Standards and IFRIC Interpretations (for which Australian equivalent Standards and Interpretations have not yet been issued) were in issue but not yet effective:
Standard/Interpretation
Effective for annual reporting periods beginning on or after
Expected to be initially applied in the financial year ending
Amendments to References to the Conceptual Framework in IFRS Standards 1 January 2020 30 June 2021

Byron Energy Limited Annual Report 2019 65
The following significant accounting policies have been adopted in the preparation and presentation of the Financial Report:
(a) Basis of consolidationSubsidiaries
The consolidated financial statements incorporate the financial statements of the Company and entities controlled by the Company (referred to as ‘the consolidated entity’ or ‘the Group’ in these financial statements). Control is achieved where the Company:
• has power over the investee;
• is exposed, or has rights, to variable returns from its involvement with the investee; and
• has the ability to use its power to affect its returns.
The Company reassesses whether or not it controls an investee if facts and circumstances indicate that there are changes to one or more of the three elements of control listed above.
The results of subsidiaries acquired or disposed of during the year are included in the consolidated income statement from the effective date of acquisition or up to the effective date of disposal, as appropriate. Where necessary, adjustments are made to the financial statements of subsidiaries to bring their accounting policies into line with those used by other members of the consolidated entity.
Joint operating arrangements
Joint operating arrangements are those legal entities over whose activities the consolidated entity has joint control, established by contractual agreement. The interest of the consolidated entity in unincorporated joint operating arrangements are brought to account by recognising in its financial statements, its respective share of the assets it controls, the liabilities and the expenses it incurs and its share of income that it earns from the sale of goods or services by the joint operating arrangements.
Transactions eliminated on consolidation
All intra-group transactions, balances, income and expenses are eliminated in full on consolidation.
(b) Exploration and evaluation expenditureExploration and evaluation costs, including the costs of acquiring leases, are intangible assets capitalised as exploration and evaluation assets on an area of interest basis. Costs incurred before the consolidated entity has obtained the legal rights to explore an area are recognised in the income statement.
Exploration and evaluation assets are only recognised if the rights of the area of interest are current and either: (i) the expenditures are expected to be recouped through successful development and exploitation of the area of interest; or alternatively, by its sale; or (ii) activities in the area of interest have not, at the reporting date, reached a stage which permits a reasonable assessment of the existence or otherwise of economically recoverable reserves, and active and significant operations in, or in relation to, the area of interest are continuing.
Exploration and evaluation assets are initially measured at cost and include acquisition of rights to explore, lease rental payments, seismic and other expenditure to provide legal tenure of the area of interest. When an area of interest is abandoned or the directors decide that it is not commercial, any capitalised costs in respect of that area are written off in the financial period the decision is made.
Exploration and evaluation assets are assessed for impairment if: (i) sufficient data exists to determine technical feasibility and commercial viability; and (ii) facts and circumstances suggest that the carrying amount exceeds the recoverable amount.
Farm-in and farm-outs:
In the case of farm-outs, the Group does not record any expenditure made by the farminee on its account. It also does not recognise any gain or loss on its exploration and evaluation farm-out arrangements, but redesignates any costs previously capitalised in relation to the whole interest as relating to the partial interest retained. Any cash consideration received directly from the farminee is credited against costs previously capitalised in relation to the whole interest with any excess accounted for as a gain on disposal.
In the case of farm-ins, Byron accounts for its expenditures under a farm-in arrangement in the same way as directly incurred exploration and evaluation expenditure.
For the purposes of impairment testing, exploration and evaluation assets are allocated to cash-generating units to which the exploration activity relates. The cash-generating unit shall not be larger than the area of interest.
Once the technical feasibility and commercial viability of the extraction of oil and gas reserves relating to a prospect are demonstrable and development is proceeding, exploration and evaluation assets attributable to that prospect are first tested for impairment and then reclassified assets as to oil and gas properties.
All other exploration and evaluation costs are expensed as incurred.

Byron Energy Limited Annual Report 201966
Notes to the Financial Statements continuedFor the Financial Year Ended 30 June 2019
1. Summary of significant accounting policies continued
(c) Oil and gas properties The cost of oil and gas producing assets include acquisition and capitalised development costs that are directly attributable to the accessing and production of the proved and probable oil and gas reserves.
In addition, costs include:
(i) the initial estimate at the time of installation or acquisition and during the period of use, when relevant of the costs of dismantling and removing the items and restoring the site on which they are located; and
(ii) changes in the measurement of existing liabilities recognised for these costs resulting from changes in the timing or outflow of resources required to settle the obligation or from changes in the discount rate.
Amortisation
When an oil and gas asset commences commercial production, all acquisition and/or costs carried forward will be amortised on a units of production of basis over the remaining proved and probable recoverable reserves (‘2P’). The remaining 2P reserves are measured by external independent petroleum engineers.
Changes in factors that affect amortisation calculations do not give rise to prior financial period adjustments and are dealt with on a prospective basis.
(d) ImpairmentThe carrying amounts of the Company’s and the consolidated entity’s non-financial assets, except exploration and evaluation expenditure, are reviewed each balance date or when there is an indication of an impairment loss, to determine whether they are in excess of their recoverable amount. An impairment loss is recognised whenever the carrying amount of an asset or its cash-generating unit exceeds its recoverable amount.
Calculation of the recoverable amount
The recoverable amount of an asset is the greater of its fair value less cost to sell and value in use. In assessing the value in use, the estimated future cash flows are discounted to their present value using a post-tax discount rate that reflects current market assessments of the time value of money and the risks specific to the asset for which the estimates of future cash flows have not been adjusted. If the recoverable amount of an asset (or cash-generating unit) is estimated to be less than its carrying amount, the carrying amount of the asset (cash-generating unit) is reduced to its recoverable amount. An impairment loss is recognised immediately in profit or loss. Refer to Note 8 for further details.
Reversals of impairment
Impairment losses are reversed when there has been a change in the estimates used to determine recoverable amounts.
An impairment loss is reversed only to the extent that the asset’s carrying value does not exceed the carrying amount that would have been determined, net of depreciation or amortisation, if no impairment loss had been recognised.
(e) Leased assetsLeases are classified as finance leases whenever the terms of the lease transfer substantially all the risks and benefits of ownership to the lessee. All other leases are classified as operating leases. Operating lease payments are recognised as an expense on a straight-line basis over the lease term.
(f) Foreign currencyFunctional and presentation currency
Items included in the financial statements of each of the consolidated entity’s subsidiaries are measured using the currency of the primary economic environment in which the subsidiaries operate (‘the functional currency’). The functional currency of the Company is Australian dollars (A$) and the functional currency of the Company’s overseas subsidiaries is United States dollars (US$).
The financial statements are presented in United States dollars. The consolidated entity believes the US dollar is the best measure of performance for the Group because oil and gas, the consolidated entity’s dominant sources of revenue are priced in US$ and the consolidated entity’s main operations are based in the USA with costs incurred in US$.

Byron Energy Limited Annual Report 2019 67
Prior to consolidation, the results and financial position of each entity within the consolidated entity are translated from the functional currency into the consolidated entity’s presentation currency as follows:
• asset and liabilities of the non US$ denominated balance sheet are translated at the closing rate at the date of that balance sheet;
• income and expenses for the non US$ denominated income statement is translated at average exchange rates (unless this is not a reasonable approximation of the cumulative effect of the rates prevailing on the transaction dates, in which case the income and expenses are translated at the dates of the transactions);
• components of equity are translated at the historical rates; and
• all resulting exchange differences are recognised as a separate component of equity.
Foreign currency transactions and balances
Non-monetary asset and liabilities that are measured in terms of historical cost in a foreign currency are translated using the exchange rate at the date of the transaction.
Foreign exchange gains and losses arising from a monetary item receivable from or payable to a foreign operation, the settlement of which is neither nor likely in the foreseeable future, are considered to form part of the net investment in a foreign operation and are recognised directly in equity in the foreign currency translation reserve.
Interest bearing loans and borrowings repayable in fixed currency denominations
Interest bearing loans and borrowings are initially measured at fair value, net of transaction costs. As some of the loans from shareholders are legally repayable in non-functional or non United States currency denominations, any unrealised foreign currency exchange gains and losses emanating from the recognition of the amounts required to settle these future obligations are recognised in the profit and loss.
(g)(i) Cash and cash equivalentsCash comprises cash on hand and deposits held at call with financial institutions. Cash equivalents are short-term, highly liquid investments that are readily convertible to known amounts of cash, which are subject to an insignificant risk of changes in value.
(ii) Restricted cash and cash equivalents
A restricted cash deposit held at call with a financial institution for the purpose of first meeting escrow and legal requirements for the drilling of the SM74 D14 well and second, then paying costs of drilling the well.
(h) Share-based paymentsEquity settled share based payments with directors, employees and others providing similar services are measured at the fair value of the equity instrument at the grant date. Fair value is measured by use of an appropriate model. A share-based payment expense is recognised in profit and loss with a corresponding increase in equity at grant date where the share-based payment arrangements vest immediately.
(i) Revenue recognitionOil and gas revenue
Revenue associated with the sale of crude oil, natural gas, condensate and natural gas liquids (‘NGLs’) owned by the Company is recognised when title is transferred from the Company to its customers under short-term contracts (less than 12 months). Revenue is measured at the fair value of the consideration received or receivable. Revenue from the sale of crude oil, natural gas, condensate and NGLs is recognised when all of the following conditions have been satisfied:
• Byron has transferred control of the goods to the buyer and revenue is recognised at that time;
• Byron retains no continuing managerial involvement to the degree usually associated with ownership or effective control over the goods sold;
• the amount of revenue can be measured reliably;
• it is probable that the economic benefits associated with the transaction will flow to Byron; and
• the costs incurred or to be incurred in respect of the transaction can be measured reliably.
The Company recognises oil, natural gas and NGL revenues based on its share of the quantities of production, solely owned or under joint ownership, sold to purchasers under short-term contracts at market prices.
Interest revenue
Interest revenue is accrued on a time basis, by reference to the principal outstanding and at the effective interest rate applicable, which is the rate that exactly discounts estimated future cash receipts through the expected life of the financial asset to that asset’s net carrying amount.

Byron Energy Limited Annual Report 201968
Notes to the Financial Statements continuedFor the Financial Year Ended 30 June 2019
1. Summary of significant accounting policies continued
(j) Income taxIncome tax expense comprises current and deferred tax. Income tax expense is recognised in the profit or loss except to the extent that it relates to items recognised directly in equity, in which case it is recognised in equity.
Current tax is the expected tax payable on the taxable income for the year, using tax rates enacted or substantially enacted at the balance sheet date, and any adjustment to tax payable in respect of previous years.
Deferred tax is recognised using the balance sheet method, providing for temporary differences between the carrying amounts of assets and liabilities for financial reporting purposes and the amounts used for taxation purposes. Deferred tax is not recognised for the following temporary differences: the initial recognition of goodwill, the initial recognition of assets or liabilities in a transaction that is not a business combination and that affect neither accounting nor taxable profit/loss, and differences relating to investments in subsidiaries to the extent that they will not reverse in the foreseeable future. Deferred tax is measured at the tax rates that are expected to be applied to the temporary differences when they reverse, based on the laws that have been enacted or substantively enacted by the balance sheet date.
A deferred tax asset is recognised only to the extent that it is probable that future taxable profits will be available against which the asset can be utilised. Deferred tax assets are reviewed at each balance sheet date and are reduced to the extent that it is no longer probable that the related tax benefit will be realised.
(k) Financial assetsFinancial assets and financial liabilities are recognised when the Company becomes a party to the contractual provisions of the instrument.
Financial assets and financial liabilities are initially measured at fair value. Transaction costs that are directly attributable to the acquisition or issue of financial assets and financial liabilities (other than financial assets and financial liabilities at fair value through profit or loss) are added to or deducted from the fair value of the financial assets or financial liabilities, as appropriate, on initial recognition. Transaction costs directly attributable to the acquisition of financial assets or financial liabilities at fair value through profit or loss are recognised immediately in profit or loss.
Financial assets
Financial assets are measured subsequently in their entirety at either amortised cost or fair value, depending on the classification of the financial assets
Classification of financial assets
Debt instruments that meet the following conditions are measured subsequently at amortised cost:
• the financial asset is held within a business model whose objective is to hold financial assets in order to collect contractual cash flows; and
• the contractual terms of the financial asset give rise on specified dates to cash flows that are solely payments of principal and interest on the principal amount outstanding.
Debt instruments that meet the following conditions are measured subsequently at fair value through other comprehensive income (‘FVTOCI’):
• the financial asset is held within a business model whose objective is achieved by both collecting contractual cash flows and selling the financial assets; and
• the contractual terms of the financial asset give rise on specified dates to cash flows that are solely payments of principal and interest on the principal amount outstanding.
By default, all other financial assets are measured subsequently at fair value through profit or loss (‘FVTPL’).
Despite the foregoing, the Company may make the following irrevocable election/designation at initial recognition of a financial asset:
• the Company may irrevocably elect to present subsequent changes in fair value of an equity investment in other comprehensive income if certain criteria are met; and
• the Company may irrevocably designate a debt investment that meets the amortised cost or FVTOCI criteria as measured at FVTPL if doing so eliminates or significantly reduces an accounting mismatch.

Byron Energy Limited Annual Report 2019 69
Initial measurement of financial assets
Financial assets are classified according to their business model and the characteristics of their contractual cash flows. Except for those trade receivables that do not contain a significant financing component and are measured at the transaction price in accordance with AASB 15, all financial assets are initially measured at fair value adjusted for transaction costs.
Subsequent measurement of financial assets
For the purpose of subsequent measurement, financial assets, other than those designated and effective as hedging instruments, are classified into the following four categories:
• Financial assets at amortised cost
• Debt instruments at fair value through other comprehensive income (‘FVTOCI’)
• Equity instruments at FVTOCI
• Financial assets at FVTPL
(i) Amortised cost and effective interest method
The effective interest method is a method of calculating the amortised cost of a debt instrument and of allocating interest income over the relevant period.
(ii) Debt instruments at fair value through other comprehensive income (‘Debt FVTOCI’)
Debt FVTOCI initially measured at fair value plus transaction costs. Subsequently, changes in the carrying amount of these as a result of foreign exchange gains and losses, impairment gains or losses, and interest income calculated using the effective interest method are recognised in profit or loss.
(iii) Equity instruments at fair value through other comprehensive income (‘Equity FVTOCI’)
Investments in equity instruments at FVTOCI are initially measured at fair value plus transaction costs. Subsequently, they are measured at fair value with gains and losses arising from changes in fair value recognised in other comprehensive income and accumulated in the investments revaluation reserve. The cumulative gain or loss is not to be reclassified to profit or loss on disposal of the equity investments, instead, it is transferred to retained earnings.
(iv) Financial assets at fair value through profit or loss (‘FVTPL’)
Financial assets at FVTPL are measured at fair value at the end of each reporting period, with any fair value gains or losses recognised in profit or loss to the extent they are not part of a designated hedging relationship. The net gain or loss recognised in profit or loss includes any dividend or interest earned on the financial asset and is included in the ‘Net gain/(loss) arising on financial assets measured at FVTPL’ line.
Impairment of financial assets
The Company recognises a loss allowance for expected credit losses on investments in debt instruments that are measured at amortised cost or at FVTOCI, lease receivables, trade receivables and contract assets, as well as on financial guarantee contracts. The amount of expected credit losses is updated at each reporting date to reflect changes in credit risk since initial recognition of the respective financial instrument.
Trade and other receivables and contract assets
The Company makes use of a simplified approach in accounting for trade and other receivables as well as contract assets and records the loss allowance at the amount equal to the expected lifetime credit losses. In using this practical expedient, the Company uses its historical experience, external indicators and forward-looking information to calculate the expected credit losses using a provision matrix.
(l) Employee benefitsA liability is recognised for benefits accruing to employees in respect of wages and salaries, annual leave and long service leave when it is probable that settlement will be required and they are capable of being measured reliably.
Liabilities recognised in respect of employee benefits expected to be settled within 12 months, are measured at their nominal values using the remuneration rate expected to apply at the time of settlement.
Liabilities recognised in respect of employee benefits which are not expected to be settled within 12 months are measured as the present value of the estimated future cash outflows to be made by the consolidated entity in respect of services provided by employees up to reporting date.
Defined contribution plans
Contributions to defined contribution superannuation plans are expensed when employees have rendered service entitling them to the contributions.

Byron Energy Limited Annual Report 201970
Notes to the Financial Statements continuedFor the Financial Year Ended 30 June 2019
1. Summary of significant accounting policies continued
(m) Property, plant and equipment (including software)Buildings held for use in the production or supply of goods or services, or for administrative purposes, are carried in the statement of financial position at cost, less any subsequent accumulated depreciation and subsequent accumulated impairment losses.
Plant and equipment are stated at cost less accumulated depreciation and impairment. Construction in progress is stated at cost. Cost includes expenditure that is directly attributable to the acquisition or construction of the item. In the event that settlement of all or part of the purchase consideration is deferred, cost is determined by discounting the amounts payable in the future to their present value as at the date of acquisition.
Depreciation is provided on property, plant and equipment, including freehold buildings but excluding land. Depreciation is calculated on a straight-line basis so as to write off the net cost or other revalued amount of each asset over its expected useful life to its estimated residual value. The estimated useful lives, residual values and depreciation method are reviewed at the end of each annual reporting period, with the effect of any changes recognised on a prospective basis.
The gain or loss arising on disposal or retirement of an item of property, plant and equipment is determined as the difference between the sales proceeds and the carrying amount of the asset and is recognised in profit or loss.
The following useful lives are used in the calculation of depreciation:
Buildings 40 years
Plant and equipment 4 to 10 years
Intangible assets – software 3 years
(n) ProvisionsProvisions are recognised when the consolidated entity has a present obligation (legal or constructive) as a result of a past event, it is probable that the consolidated entity will be required to settle the obligation, and a reliable estimate can be made of the amount of the obligation.
The amount recognised as a provision is the best estimate of the consideration required to settle the present obligation at reporting date, taking into account the risks and uncertainties surrounding the obligation. Where a provision is measured using the cash flows estimated to settle the present obligation, its carrying amount is the present value of those cash flows.
When some or all of the economic benefits required to settle a provision are expected to be recovered from a third party, the receivable is recognised as an asset if it is virtually certain that reimbursement will be received and the amount of the receivable can be measured reliably.
Site restoration and rehabilitation of oil and gas properties
Provisions made for environmental rehabilitation are recognised where there is a present obligation as a result of exploration, development or production activities having been undertaken and it is probable that an outflow of economic benefits will be required to settle the obligation, and the amount of the provision can be measured reliably. The estimated future obligations include the cost of removing the facilities, abandoning the well(s) and restoring the affected areas. The provision for future restoration is the best estimate of the present value of the expenditure required to settle the obligation at the reporting date, based on current legal requirements and technology. Future restoration costs are reviewed annually; and any changes are reflected in the present value of the restoration provision at the end of the reporting period. The amount of the provision for future restoration costs relating to exploration and producing activities is capitalised as a cost of these activities. The provisions are determined by discounting the expected future cash flows at a pre-tax rate that reflects the time value of money. The unwinding of discounting on the provision is recognised as a finance cost rather than being capitalised into the cost of the related asset.

Byron Energy Limited Annual Report 2019 71
(o) Financial liabilitiesFinancial liabilities
Financial liabilities, including borrowings and trade and other payables, are initially measured at fair value, net of transaction costs. All financial liabilities are subsequently measured at amortised cost using the effective interest method, with interest expense recognised on an effective yield basis.
The effective interest method is a method of calculating the amortised cost of a financial liability and of allocating interest expense over the relevant period. The effective interest rate is the rate that exactly discounts estimated future cash payments through the expected life of the financial liability, or (where appropriate) a shorter period, to the net carrying amount on initial recognition.
Borrowing, finance and interest costs
Borrowing, finance and interest costs comprise interest payable on borrowings calculated using the effective interest rate method, loans transactions costs, lease finance charges, amortisation of discounts or premiums related to the borrowings and the unwinding of discounts on the rehabilitation provisions.
Derecognition of financial liabilities
The Group derecognises financial liabilities when, and only when, the Group’s obligations are discharged, cancelled or they expire. The difference between the carrying amount of the financial liability derecognised and the consideration paid and payable is recognised in profit or loss.
(p) Issued capitalIssued and paid up capital is recognised at the fair value of the consideration received by the Company.
Transaction costs on the issue of equity instruments
Transaction costs arising on the issue of equity instruments are recognised directly in equity as a reduction of the proceeds of the equity instrument to which the costs relate. Transaction costs are costs that are incurred directly in connection with the issue of those equity instruments and which would not have been incurred had those instruments not been issued.
(q) ReservesForeign currency translation reserve
Foreign currency exchange differences relating to the translation of Australian dollars, being the functional currency of the parent entity group into the presentational currency of US dollars for the consolidated entity are brought to account by entries made directly to the foreign currency translation reserve.
Share option reserve
The share option reserve arises on the grant of share options to directors, staff, consultants and other service providers to the Group. Amounts are transferred out of the reserve and into issued capital when the options are exercised. Further information about share-based payments is made in Note 1(h).
(r) Goods and services tax Revenues, expenses and assets are recognised net of the amount of goods and services tax (‘GST’), except:
(i) where the amount of GST incurred is not recoverable from the taxation authority, it is recognised as part of the cost of acquisition of an asset or as part of an item of expense; or
(ii) for receivables and payables which are recognised inclusive of GST.
The net amount of GST recoverable from, or payable to, the taxation authority is included as part of receivables or payables.
Cash flows are included in the cash flow statement on a gross basis. The GST component of cash flows arising from investing and financing activities which is recoverable from, or payable to, the taxation authority is classified as operating cash flows.

Byron Energy Limited Annual Report 201972
Notes to the Financial Statements continuedFor the Financial Year Ended 30 June 2019
2. Profit for the year
Consolidated
2019US$
2018US$
Profit for the year has been arrived at after charging the following items of expense:
Cost of sales
Lease operating costs 2,625,889 943,506
Amortisation of oil and gas properties 4,635,727 863,908
7,261,616 1,807,414
Professional and consulting costs 1,447,051 505,616
Insurance 97,230 74,572
Office lease rental expense 232,239 139,217
Employee benefits expense
Salaries and wages 1,959,226 1,175,479
Share-based payments (share options issued to executives, staff and consultants) 452,251 981,096
Defined contribution superannuation expense 28,765 29,026
2,440,242 2,185,601
3. Financial income and expenses
Financial income
Interest income 10,333 8,717
Foreign exchange gain on A$ denominated loans 38,087 6,708
48,420 15,425
Financial expense
Interest expense 327,460 1,046,926
Unwinding of discount on rehabilitation of oil and gas properties 34,235 -
Interest expense paid or accrued on loans from related parties 145,011 25,106
506,706 1,072,032

Byron Energy Limited Annual Report 2019 73
4. Income tax
Consolidated
2019US$
2018US$
Income tax recognised in profit and loss - -
The income tax expense for the year can be reconciled to the accounting profit as follows:
Profit before tax from continuing operations 5,718,988 1,298,968
Income tax expense calculated at 27.5% (2018: 27.5%) 1,572,722 357,216
Effect of expenses that are not deductible in determining taxable profit 96,428 472,398
Effect of different tax rates of subsidiaries operating in other jurisdictions (168,274) 53,558
Effect of unused tax losses and tax offsets not recognised as deferred tax assets (1,500,876) (883,172)
Income tax expense/(benefit) on continuing operations - -
Deferred tax assets not recognised
Deferred tax assets not recognised comprises temporary differences and tax losses attributable to:
Australian tax losses 2,851,532 2,570,669
USA tax losses 15,012,898 27,948,337
Temporary differences (5,234,519) (6,113,146)
Total deferred tax assets not recognised 12,629,911 24,405,860
The potential deferred tax asset will only be recognised if:
(i) the consolidated entity derives future assessable income of a nature and amount sufficient to enable the benefits to be realised, in the jurisdiction in which the losses were incurred;
(ii) the consolidated entity continues to comply with conditions for tax deductibility imposed by law; and
(iii) no changes in tax legislation adversely affect the ability of the consolidated entity to realise the tax benefits.
Byron Energy Limited and its 100% owned Australian subsidiary, Byron Energy (Australia) Pty Ltd formed a tax consolidated group effective from 1 July 2013.
5. Earnings per shareThe following reflects the profit and share data used in calculating basic and diluted earnings per share:
Net profit for the year 5,718,988 1,298,968
Basic profit per share 0.0083 0.0022
Diluted profit per share 0.0080 0.0022
Weighted average number of ordinary shares 691,142,698 585,536,025
Shares deemed to be issued for no consideration in respect of share options 20,459,212 10,657,622
Weighted average number of ordinary shares used in the calculation of diluted earnings per share 711,601,910 596,193,647
Anti-dilutive options on issue not used in the dilutive earnings per share calculation 32,200,000 21,450,000
Options outstanding There is partial dilution of shares due to some options issued or outstanding as the potential ordinary shares are anti-dilutive in accordance with AASB 133, paragraph 41 and are therefore not included in the calculation of diluted earnings per share.

Byron Energy Limited Annual Report 201974
Notes to the Financial Statements continuedFor the Financial Year Ended 30 June 2019
6. Trade and other receivables
Consolidated
2019US$
2018US$
Oil and gas sales receivables 3,201,223 3,997,256
Joint operating arrangements receivables 1,848,434 2,196,263
GST receivable 19,068 14,908
5,068,725 6,208,427
Sales and other debtors are non-interest bearing and are settled within 30 days. Consequently, the amounts referred to in this note are less than 30 days to collection.
7. Other assets
Current
Prepayments 1,034,386 848,770
Security deposits 599,600 6,445
1,633,986 855,215
Non-current
Security deposits 1,488,177 732,062
1,488,177 732,062
8. (a) Exploration and evaluation assets
Costs carried forward in respect of areas in the exploration and/or evaluation phase at cost: 6,587,670 3,937,828
Reconciliation of movements:
Carrying amount at the beginning of the financial year 3,937,828 2,421,473
Additions at cost 14,956,165 3,263,218
Acquisition of an exploration property – see Note 8(c) 609,632 -
Impairment expense (12,915,955) (1,746,863)
Carrying amount at the end of the financial year 6,587,670 3,937,828
Ultimate recovery of deferred exploration and evaluation costs is dependent upon success in exploration and evaluation or the full or partial sale (including farm-out) of the exploration interests.
For the year ended 30 June 2019, impairment charges were US$12,915,955 covering (i) write-off of unsuccessful exploration drilling expenses in relation to the Weiss-Adler, et. al. No. 1 well, on the Bivouac Peak block; (ii) SM74 D14 well dry hole, on the SM74 block; (iii) relinquishment of VR232, VR251 blocks following the results of the WesternGeco RTM Seismic Reprocessing Project which found that the initial prospect ideas on the blocks were not supported; and (iv) relinquishment of the EI18 block following reassessment of prospectivity.

Byron Energy Limited Annual Report 2019 75
8. (b) Oil and gas properties
Consolidated
2019US$
2018US$
Costs carried forward in respect of areas in the oil and gas properties at cost: 27,192,032 26,174,962
Reconciliation of movements:
Carrying amount at the beginning of the financial year 26,174,962 5,896,622
Additions at cost 1,320,212 20,846,775
Additions for site restoration 203,152 295,473
Acquisition of producing properties – see Note 8(c) 4,129,433 -
Amortisation of oil and gas properties included in cost of sales (4,635,727) (863,908)
Carrying amount at the end of the financial year 27,192,032 26,174,962
Recoverable amount The estimated recoverable amount of all cash-generating units in the development or production phase is determined by discounting the estimated future cash flows to their present value using a post-tax discount rate that reflects current market assessments of the time value of money and the risks specific to the assets. The consolidated entity utilises future cash flows as estimated by independent petroleum engineers for this assessment. The key assumptions used include: (i) estimated future production based on proved and probable reserves (2P reserves); (ii) hydrocarbon prices that the consolidated entity estimates to be reasonable, taking into account historical prices, current prices, and prices used in making its exploration and development decisions; and (iii) future operating and development costs as estimated by the Company and reviewed for reasonableness by the independent petroleum engineers. The estimated recoverable amount of Byron’s oil and gas properties is sensitive to a change in estimated recoverable reserves, oil and gas prices, discount rates and cost estimates.
At year end, the Company’s oil and gas properties were assessed for impairment indicators in accordance with AASB 136. Following this assessment, no impairment was required or recognised on the oil and gas properties during the 30 June 2019 financial year.
8. (c) Acquisition of oil and gas assetsOn 6 March 2019, Byron closed the purchase from Fieldwood Energy LLC, of a 53.00% non-operated Working Interest/44.166667% Net Revenue Interest in the SM58 Apache #E1 well and E platform located on SM69; plus a 100% Working Interest in the SM58 block to specified drilling depths, including operatorship of the block.
The gross purchase price was US$4.25 million which was adjusted for certain closing items with an effective date of 1 January 2019. Cash flows generated by the acquired interest between the effective date and the closing date reduced the net purchase price to US$4.18 million. Byron determined that the assets acquired did not meet the definition of a business combination and the transaction was therefore accounted for as an asset acquisition.
Asset acquisition components:
US$
Fair value of assets acquired
Oil and gas properties acquired 4,129,433
Exploration and evaluation assets acquired 609,632
Total assets acquired 4,739,065
Fair value of liabilities assets acquired
Site restoration obligations of a producing property (559,965)
Cash consideration paid 4,179,100

Byron Energy Limited Annual Report 201976
Notes to the Financial Statements continuedFor the Financial Year Ended 30 June 2019
9. Property, plant and equipment
Consolidated
2019US$
2018US$
Buildings at cost 10,245 10,797
Accumulated depreciation (3,343) (3,254)
6,902 7,543
Reconciliation of movements:
Carry amount at the beginning of the financial year 7,543 8,131
Depreciation for year (261) (283)
Foreign currency translation movements (380) (305)
Carrying amount at the end of the financial year 6,902 7,543
Plant and equipment at cost 135,920 117,208
Accumulated depreciation (92,660) (85,633)
43,260 31,575
Reconciliation of movements:
Carry amount at the beginning of the financial year 31,575 28,790
Additions at cost 21,087 12,600
Depreciation for year (9,296) (9,730)
Foreign currency translation movements (106) (85)
Carrying amount at the end of the financial year 43,260 31,575
Total property, plant and equipment 50,162 39,118
10. Other intangible assetsCapitalised software costs at cost 468,432 102,594
Accumulated amortisation (156,244) (70,512)
312,188 32,082
Reconciliation of movements:
Carry amount at the beginning of the financial year 32,082 1,778
Additions at cost 366,488 41,000
Amortisation for year (87,041) (10,696)
Foreign currency translation movements 659 -
Carrying amount at the end of the financial year 312,188 32,082

Byron Energy Limited Annual Report 2019 77
11. Trade and other payables
Consolidated
2019US$
2018US$
Current
Trade payables 8,217,459 3,131,736
Oil and gas royalties payable 590,212 747,833
Accrued interest on loans from related parties 104,963 23,248
Other payables 12,705 24,453
8,925,339 3,927,270
Terms and conditions relating to the above financial instruments:
(i) trade creditors are non-interest bearing and are usually settled on 30 day terms; and
(ii) some of the other payables are non-interest bearing and have an average term of 30 days.
12. Provisions
Current
Accumulated employee entitlements 124,361 131,112
124,361 131,112
Non-current
Accumulated employee entitlements 64,246 61,716
Site restoration SM71 and SM58 1,919,816 1,122,464
1,984,062 1,184,180
Site restoration provisions
Reconciliation of movements:
Carrying amount at the beginning of the financial year 1,122,464 826,721
Site restoration work undertaken on SM6 - (740,860)
Net additions to site restoration 203,152 -
Additions to site restoration upon acquisition of a producing property 559,965 -
Unwinding of discount on site restoration 34,235 1,036,603
Carrying amount at the end of the financial year 1,919,816 1,122,464
Provisions are recognised for the Group’s restoration obligations at SM71, the SM58 E1 well and SM69 E platform. The estimation of future costs associated with the abandonment and restoration requires the use of estimated costs in future periods that, in some cases, will not be incurred until a number of years into the future. Such cost estimates could be subject to revisions in subsequent years due to regulatory requirements, technological advances and other factors that are difficult to predict. Likewise the appropriate future discount rates used in the calculation are subject to change according to the risks inherent in the liability. The measurement and recognition criteria relating to restoration obligations is described in Note 1(n).

Byron Energy Limited Annual Report 201978
Notes to the Financial Statements continuedFor the Financial Year Ended 30 June 2019
13. Borrowings
Consolidated
2019US$
2018US$
Current unsecured
Loans* 4,174,030 1,384,332
Insurance premium financing (interest bearing)** 1,573,960 1,029,289
Current secured
Convertible note – debt liability - 2,956,400
Convertible note – derivative liability - 410,260
Total current borrowings 5,747,990 5,780,281
Non-current secured
Convertible note – debt liability - 707,186
Total non-current borrowings - 707,186
* During the March 2019 quarter, Byron established a short-term loan facility for US$2.0 million and A$3.1 million, equivalent to approximately US$4.2 million, with US$3.2 million sourced from four of the Company’s directors (for additional details refer to the Related Party Transactions note). The loan facility, fully drawn during the March 2019 quarter, is unsecured, repayable by 30 November 2019 and will bear interest, from time of drawdown, at a rate of 10% per annum payable on loan repayment date.
** The insurance premium financing bears an average 5.16% fixed interest rate, refer Note 27(c).
14. Issued capital
(a) Issued and paid up capital 101,091,750 99,296,931
Changes to the then Corporations Law abolished the authorised capital and par value concept in relation to share capital from 1 July 1998. Therefore, the Company does not have a limited amount of authorised capital and issued shares do not have a par value.
(b) Movement
2019 2018
Number US$ Number US$
Fully paid ordinary shares
Balance at beginning of the financial year 684,987,034 99,296,931 277,447,162 77,993,786
Shares issued
The issue of 3,766,479 shares at A$0.2655 per share upon conversion of A$1,000,000 convertible notes 3,766,479 724,400
The exercise of 1,950,000 share options at A$0.25 per share 1,950,000 344,419
The issue of 4,669,904 shares at A$0.2141 per share upon conversion of A$1,000,000 convertible notes 4,669,904 726,000
The issue of 378,970,262 shares under a placement at A$0.07 per share 378,970,262 20,771,360
The issue of 28,569,610 shares under a SPP at A$0.07 per share 28,569,610 1,565,900
Equity raising costs - - - (1,034,115)
Balance at end of financial year 695,373,417 101,091,750 684,987,034 99,296,931

Byron Energy Limited Annual Report 2019 79
(c) Terms and conditions of contributed equityOrdinary shares
Ordinary shares have the right to receive dividends as declared and in the event of winding up of the Company, to participate in the proceeds from the sale of all surplus assets in proportion to the number of and amounts paid up on shares held. Ordinary shares entitle their holder to one vote, either in person or by proxy, at a meeting of the Company.
The issued capital of the Company comprises 695,373,417 ordinary shares (2018: 684,987,034). All of the shares are quoted on the ASX.
(d) Share optionsOptions over ordinary shares
At the end of the financial year, there were 60,600,000 (2018: 51,800,000) unissued ordinary shares in respect of which the following options were outstanding:
Expiry date Number Securities Exercise price
31 December 2019 9,500,000 Unlisted options A$0.25
21 July 2019 10,000,000 Unlisted options A$0.25
31 December 2021 28,350,000 Unlisted options A$0.12
31 December 2021 2,000,000 Unlisted options A$0.16
31 December 2021 9,500,000 Unlisted options A$0.40
31 December 2021 1,250,000 Unlisted options A$0.40
Total 60,600,000
During the financial year, 10,750,000 share options were issued with an exercise amount of A$0.40 in two tranches with an expiry date on 31 December 2021. Also during the financial year, 1,950,000 share options with an expiry date of 30 September 2018 and an exercise price of A$0.25 were converted into ordinary fully paid shares. No share options expired during the financial year.
15. Reserves
Consolidated
2019US$
2018US$
Foreign currency translation reserve
Balance at beginning of financial year (152,653) (288,088)
Currency translation movements for the year 21,187 135,435
Balance at end of financial year (131,466) (152,653)
The reserve arises out of the translation of A$, being the functional currency of the parent entity group into the consolidated entity presentation currency of US$.
Share option reserve
Balance at beginning of financial year 4,694,257 3,252,595
9,500,000 options issued to directors, staff and consultants as approved by shareholders 569,062 -
1,250,000 options issued to staff and consultants 101,079 -
28,350,000 options issued to directors, staff and consultants as approved by shareholders and 2,000,000 options issued to a staff member - 1,441,662
Balance at end of financial year 5,364,398 4,694,257
The reserve arises on the grant of share options to directors, key management personnel, consultants and other third parties as equity-based payments.

Byron Energy Limited Annual Report 201980
Notes to the Financial Statements continuedFor the Financial Year Ended 30 June 2019
16. Franking creditsThere are no franking credits available for distribution (2018: nil).
17. Expenditure commitmentsThe Group has expenditure commitments at the end of the financial year for non-cancellable operating lease office rental payments. These obligations are not provided for in the financial statements.
(a) Commitments for office lease rental payments
Consolidated
2019US$
2018US$
Not longer than 1 year 273,143 108,930
Between 1 and 5 years 843,066 22,377
1,116,209 131,307
(b) Exploration lease expenditure commitmentsThe Group has no exploration lease commitments at the end of the financial year as the leasing arrangements of the Gulf of Mexico blocks do not require firm work program commitments.
(c) Well expenditure commitmentsThe Group has a financial commitment as at balance date for the SM74 D14 well and SM58 011 well expenditures.
Commitments for well drilling expenditures
Not longer than 1 year 9,122,216 -
Refer to Note 30 for details of operating lease arrangements.
18. Cash flow reconciliation(a) Reconciliation of profit from ordinary activities after tax to net cash flows from operations
Profit for the year 5,718,988 1,298,968
Non cash flows in operating result:
Amortisation oil and gas properties 4,635,727 863,908
Depreciation and amortisation of property, plant and equipment 96,598 20,710
Impairment expense 12,915,955 1,746,863
Equity settled share-based payments 670,141 1,441,662
Net foreign exchange (gain)/loss on A$ loans (38,087) (6,708)
Unwinding of discount on rehabilitation of oil and gas properties 34,235 -
Fair value adjustment on embedded derivative element of convertible note (397,215) -
Foreign exchange differences arising on translation of the parent entity group 23,295 253,519
23,659,637 5,618,922
Movements in working capital
(Increase)/decrease in assets:
Trade and other receivables 791,110 (4,000,043)
Other assets (1,568,950) (340,046)
Increase/(decrease) in liabilities:
Trade and other payables 346,219 1,277,358
Provisions 5,642 68,263
Net cash from operating activities 23,233,658 2,624,454

Byron Energy Limited Annual Report 2019 81
(b) Reconciliation of cash
Consolidated
2019US$
2018US$
Cash and cash equivalents comprise:
Cash and bank balances 6,783,320 2,256,958
(c) Financing facilityThe Group had finance facilities at balance date consisting of loans from directors and shareholders that are fully drawn and an insurance premium financing facility.
(d) Non-cash financing and investing activitiesThere were no non-cash financing or investing activities during the financial year.
19. Controlled entitiesThe following entities are controlled by Byron Energy Limited and they have been consolidated into the financial statements for the consolidated entity:
NameCountry of
domicileClass of
share
Percentage beneficially
owned
Byron Energy (Australia) Pty Ltd Australia Ordinary 100%
Byron Energy Inc USA Ordinary 100%
Byron Energy LLC USA Ordinary 100%
20. Foreign currency translationThe exchange rate utilised in the translation of the parent entity group Australia dollar figures to United States of America dollars are as follow:
2019 2018
Spot rate at 30 June 0.7013 0.7391
Average rate for year 0.7156 0.7753
21. Contingent liabilitiesThe directors are of the opinion that the recognition of a provision is not required in respect of the following matters, as it is not probable that a future sacrifice of economic benefits will be required or the amount is not capable of reliable measurement.
(a) Byron Energy Limited has guaranteed the performance of Byron Energy Inc, a wholly owned subsidiary, under the Participation Agreement dated 1 December 2015 between Byron Energy Inc and Otto Energy (Louisiana) LLC.
(b) Supplemental bonding requirements by the BOEM
The BOEM requires that lessees demonstrate financial strength and reliability according to its regulations or provide acceptable financial assurances to satisfy lease obligations, including decommissioning activities on the OCS. As of the date of this report, the Company is in compliance with its financial assurance obligations to the BOEM and has no outstanding BOEM orders related to assurance obligations. Byron and other offshore Gulf of Mexico producers may in the ordinary course receive future demands for financial assurances from the BOEM as the BOEM continues to re-evaluate its requirements for financial assurances.
(c) Surety bond issuers’ collateral requirements
The issuers of surety bonds in some cases have requested and received additional collateral related to surety bonds for exploration and development drilling and plugging and abandonment activities. Byron may be required to post collateral at any time pursuant to the terms of its agreement with sureties under its existing bonds, if they so demand at their discretion. As at 30 June 2019, Byron had collateral bond holdings of US$2,474,600, of which US$2,074,600 was cash collateralised.
(d) Other claims
Claims or contingencies may arise related to matters occurring prior to Byron’s acquisition of properties or related to matters occurring subsequent to Byron’s sale of properties. In certain cases, Byron has indemnified the sellers of properties it has acquired, and in other cases, it has indemnified the buyers of properties sold.

Byron Energy Limited Annual Report 201982
Notes to the Financial Statements continuedFor the Financial Year Ended 30 June 2019
21. Contingent liabilities continued
From time to time the Company may be involved in litigation arising out of the normal course of business. The Company is not involved in any ligation, the outcome of which would have a material effect on its consolidated financial position, results of operations or liquidity.
In addition, the Company and its oil and gas joint interest owners are subject to periodic audits of the joint interest accounts for leases which Byron operate and/or participate. As a result of these joint interest audits, amounts payable or receivable by the Company for costs incurred or revenue distributed by the operator or by the Company on a lease may be adjusted, resulting in adjustments to Byron’s net costs or revenues and the related cash flows. When they occur, these adjustments are recorded in the current period, which generally is one or more years after the related cost or revenue was incurred or recognised by the joint account. Byron does not believe any such adjustments will be material.
22. Share-based paymentsMovements in share-based payments options
Consolidated
2019US$
2018US$
The aggregate share-based payments paid as remuneration for the financial year are set out below:
Details of share-based payments
Fair value of options granted to directors, staff and consultants 670,141 1,441,662
Expense arising from share-based payments paid as remuneration 670,141 1,441,662
1,950,000 share options were exercised during the financial year. There are no Employee Share Option plans in place.
2019 Number
2019 Exercise price
2018 Number
2018 Exercise price
Balance at beginning of year 41,800,000 13,150,000
Granted during the year 9,500,000 A$0.40c 28,350,000 A$0.12c
Granted during the year 1,250,000 A$0.40c 2,000,000 A$0.16c
Expired during the year - (1,700,000)
Exercised during the year (1,950,000) -
Balance at end of year 50,600,000 41,800,000
Exercisable at end of year 9,500,000 A$0.25c 9,500,000 A$0.25c
Exercisable at end of year 28,350,000 A$0.12c 28,350,000 A$0.12c
Exercisable at end of year 2,000,000 A$0.16c 2,000,000 A$0.16c
Exercisable at end of year 10,750,000 A$0.40c 1,950,000 A$0.25c
Weighted average remaining contractual lifeThe 9,500,000 share options of A$0.25 have an expiry of 184 days (2018: 549 days) remaining. All three tranches of 28,350,000, 2,000,000 and 10,750,000 share options have an expiry of 915 days (2018: 1,280 days) remaining.

Byron Energy Limited Annual Report 2019 83
Director and key management personnel equity share optionsShare-based payment options held at the end of the reporting year were as follows:
Grantee Number Grant date Vesting date Expiry date Exercise priceFair value at
grant date
M Smith 2,500,000 24 Nov 2016 24 Nov 2016 31 Dec 2019 A$0.25 A$0.0489
M Smith 6,300,000 18 Sept 2017 18 Sept 2017 31 Dec 2021 A$0.12 A$0.0555
M Smith 2,100,000 22 Nov 2018 22 Nov 2018 31 Dec 2021 A$0.40 A$0.0837
P Kallenberger 2,500,000 24 Nov 2016 24 Nov 2016 31 Dec 2019 A$0.25 A$0.0489
P Kallenberger 6,300,000 18 Sept 2017 18 Sept 2017 31 Dec 2021 A$0.12 A$0.0555
P Kallenberger 2,100,000 22 Nov 2018 22 Nov 2018 31 Dec 2021 A$0.40 A$0.0837
W Sack 2,500,000 24 Nov 2016 24 Nov 2016 31 Dec 2019 A$0.25 A$0.0489
W Sack 2,100,000 22 Nov 2018 22 Nov 2018 31 Dec 2021 A$0.40 A$0.0837
W Sack 6,300,000 18 Sept 2017 18 Sept 2017 31 Dec 2021 A$0.12 A$0.0555
N Filipovic 1,000,000 24 Nov 2016 24 Nov 2016 31 Dec 2019 A$0.25 A$0.0489
N Filipovic 3,780,000 18 Sept 2017 18 Sept 2017 31 Dec 2021 A$0.12 A$0.0555
N Filipovic 1,000,000 22 Nov 2018 22 Nov 2018 31 Dec 2021 A$0.40 A$0.0837
Calculation of the fair value of equity share options issued The total fair value of all share options granted and issued during the financial year was US$670,141. Options were priced using the Binominal Option Pricing model and calculated by an independent external consultant entity.
Inputs into the model
9,500,000 share options granted to directors, staff and consultants
on 22 November 2018
1,250,000 share options were issued to a staff member
on 23 January 2019
Closing share price prior to valuation A$0.22 A$0.28
Exercise price A$0.40 A$0.40
Expected volatility 78.6% 75.45%
Option life 3.1 years 2.9 years
Risk-free interest rate 2.168% 1.80%
23. Employee benefits and superannuation commitmentsThe consolidated entity contributes in accordance with the Australian Government superannuation guarantee legislation.
24. Auditors’ remuneration
Consolidated
2019US$
2018US$
Amounts received or due and receivable by Deloitte Touche Tohmatsu:
Audit or review of the financial statements of the Group 56,518 51,271
56,518 51,271
The auditors did not receive any other benefits.

Byron Energy Limited Annual Report 201984
Notes to the Financial Statements continuedFor the Financial Year Ended 30 June 2019
25. Key management personnel compensationTotal aggregate remuneration of directors and key management personnel.
Short-term employee benefits
Post- employment
benefitsShare-based
payments
Salaries and fees
US$
Short-term cash incentive
US$Other benefits
US$
Service agreements
US$
Super-annuation
US$
Share options
US$TotalUS$
Year 2019 971,928 1,087,366 57,148 450,828 23,114 437,280 3,027,664
Year 2018 917,232 - 52,186 186,072 23,201 975,315 2,154,006
More detailed information on remuneration and retirement benefits of directors is disclosed in the Remuneration Report.
26. Related party transactionsThe following related party transactions were entered into during the financial year ended 30 June 2019:
(a) Following approval by shareholders at the Company’s Annual General Meeting on 22 November 2018, the following directors and key management personnel were issued with share options in Byron Energy Limited, exercisable at an exercise price of A$0.40 per share on or after issue at any time on or before 31 December 2021:
• Mr Maynard Smith a director of the Company, and/or his associates, were issued with 2,100,000 share options;
• Mr Prent Kallenberger a director of the Company, and/or his associates, were issued with 2,100,000 share options;
• Mr William (Bill) Sack a director of the Company, and/or his associates, were issued with 2,100,000 share options; and
• Mr Nick Filipovic the Company Secretary and CFO, and/or his associates, were issued with 1,000,000 share options.
(b) In April/May 2018, the Company entered into unsecured loan agreements, bearing interest at 10% per annum, with three of the Company’s directors, for a total drawdown of US$1,000,000 and A$520,000. The loans were repaid in October 2018 with applicable interest. The individual directors’ loan repayments and interest paid was:
• Veruse Pty Ltd a company controlled by Mr Douglas Battersby, was repaid A$520,000 and interest of A$20,942;
• Geogeny Pty Ltd a company controlled by Mr Maynard Smith, was repaid US$500,000 and interest of US$21,918; and
• Charles Sands was repaid US$500,000 and interest of US$19,849 (net of withholding taxes).
(c) In March 2019, the Company entered into unsecured loan agreements, bearing interest at 10% per annum, with four of the Company’s directors, for a total drawdown of US$2,000,000 and A$1,750,000. The loans were outstanding on 30 June 2019 and due for repayment in November 2019. The individual directors’ transactions and balances for these loans were:
• Veruse Pty Ltd, a company controlled by Mr Douglas Battersby, provided an unsecured loan of A$1,400,000 to the Company and interest charges of A$35,671 have been accrued as at 30 June 2019;
• Clapsy Pty Ltd, a company controlled by Mr Paul Young, provided an unsecured loan of A$175,000 to the Company and interest charges of A$4,555 have been accrued as at 30 June 2019;
• Poal Pty Ltd, a company controlled by Mr Paul Young, provided an unsecured loan of A$175,000 to the Company and interest charges of A$4,555 have been accrued as at 30 June 2019;
• Geogeny Pty Ltd, a company controlled by Mr Maynard Smith, provided an unsecured loan of US$1,000,000 to the Company and interest charges of US$25,479 have been accrued as at 30 June 2019; and
• Charles Sands provided an unsecured loan of US$1,000,000 to the Company and interest charges of US$23,178 (net of withholding taxes) have been accrued as at 30 June 2019.

Byron Energy Limited Annual Report 2019 85
27. Financial instruments The consolidated entity’s financial instruments consist mainly of cash and cash equivalents, trade and other receivables, security deposits, trade and other payables and secured borrowings. The main risks the consolidated entity is exposed to through its financial instruments are interest rate risk, foreign currency risk, liquidity risk and credit risk.
This note presents information about the consolidated entity’s exposure to each of the above risks and processes for measuring and managing the risks and the management of capital.
Consolidated
Categories of financial instruments2019US$
2018US$
Financial assets at fair value
Cash and cash equivalents 6,783,320 2,256,958
Trade and other receivables 5,068,725 6,208,427
Restricted cash and cash equivalents 4,377,250 -
Bonds and security deposits 2,087,777 738,507
18,317,072 9,203,892
Financial liabilities at fair value
Trade and other payables 8,925,340 3,927,270
Insurance premium financing 1,573,960 1,029,289
Loans from related parties 4,174,030 1,384,332
Convertible note liabilities - 3,663,586
14,673,330 10,004,477
(a) Capital risk managementThe Group manages its capital to ensure that entities in the Group will be able to continue as a going concern while maximising the return to shareholders. The Group’s capital structure consists of: (i) equity comprising issued capital, reserves and accumulated losses; and (ii) as required, unsecured borrowings from related parties and shareholders.
During the 2019 financial year, no dividends were paid (2018: nil).
Neither the Company nor any of its subsidiaries are subject to externally imposed capital requirements.
(b) Credit risk exposureCredit risk refers to the risk that a counterparty will default on its contractual obligations resulting in financial loss to the Group. The Group has adopted a policy of only dealing with creditworthy counterparties as a means of mitigating the risk of financial loss from defaults.
The Group has a material credit exposure to the party that purchases its oil production from the SM71 and SM58 leases. There are no risk mitigation strategies in place, however the purchasing company is a large global energy corporation, so the risk of financial default is considered low. Apart from this credit risk exposure, the Group does not have any significant credit risk exposure to any single counterparty or any group of counterparties having similar characteristics. The credit risk on liquid funds is limited as the counterparties are banks with high credit ratings assigned by international credit rating agencies.
The carrying amount of financial assets recorded in the financial statements, net of any allowances for losses, represent the Group’s maximum exposure to credit risk.

Byron Energy Limited Annual Report 201986
Notes to the Financial Statements continuedFor the Financial Year Ended 30 June 2019
27. Financial instruments continued
(c) Liquidity risk managementThe Group manages liquidity risk by maintaining adequate cash reserves and if required, standby credit facilities to meet commitments when they fall due. Management continuously monitors cash forecasts to manage liquidity risk.
Liquidity, credit and interest risk tables
The following table details the Group’s remaining contractual maturity for its non-derivate financial assets.
Consolidated financial assets
Weighted average effective
interest rate%
Less than 1 month
US$
1 month to 3 months
US$
3 months to 12 months
US$1–5 years
US$
2019
Non-interest bearing - 4,420,646 1,098,079 155,715 1,482,062
Variable interest rate instruments 0.30% 10,660,570 500,000 - -
2018
Non-interest bearing - 6,193,520 14,907 6,445 732,062
Variable interest rate instruments 0.14% 2,256,958 - - -
The table below details the Group’s remaining contractual maturities for its non-derivative financial liabilities. The following are future contractual cash payments of financial liabilities, including estimated interest payments
Consolidated financial liabilities
Weighted average effective
interest rate%
Less than 1 month
US$
1 month to 3 months
US$
3 months to 12 months
US$1–5 years
US$
2019
Non-interest bearing - 8,820,376 - 104,964 -
Fixed interest rate instruments 5.16% 207,352 414,704 951,904 -
Related party liabilities 10.00% - - 4,174,030 -
2018
Non-interest bearing - 3,904,022 - 23,248 -
Fixed interest rate instruments 4.39% 154,160 308,321 566,808 -
Related party liabilities 10.00% - - 1,384,332 -
Convertible note liabilities 20.90% 739,100 - 2,217,300 707,186
(d) Fair valuesThe directors consider that the carrying amounts of financial assets and financial liabilities recorded at cost less any accumulated impairments in the financial statements approximates their fair values.
The fair values of financial assets and financial liabilities are determined as follows:
(i) holdings in unlisted shares are measured at cost less any impairments. The directors consider that no other measure could be used reliably; and
(ii) other financial assets and financial liabilities are determined in accordance with generally accepted pricing models.

Byron Energy Limited Annual Report 2019 87
(e) Interest rate risk managementThe Group’s exposure to the risk of changes in market interest rates relates primarily to the Group’s cash and cash equivalents with a floating interest rate. The Group is not currently engaged in any hedging or derivative transactions to manage interest rate risk. This risk is managed through the use of cash flow forecasts supplemented by sensitivity analysis.
As at 30 June 2019, the Group had no loans outstanding with a variable interest rate as the insurance premium funding and director/shareholder loans, all have applicable fixed interest rates. As such, the fixed interest rate loans have an interest risk if variable and/or new loan interest rates are below the fixed loan interest rates.
Interest rate sensitivity analysis
A sensitivity analysis have been determined based on the exposure to interest rates at reporting date with the stipulated change taking place at the beginning of the financial year and held constant throughout the reporting period.
At reporting date, if interest rates had been 50 basis points higher or lower and all other variables were held constant, the Group’s net profit would increase by US$22,601 (2018: US$14,131) for an increase of 50 basis points, conversely a decrease of 50 basis points would result in a decrease of US$22,601 (2018: US$14,131) to the net profit. This is mainly due to the Group’s exposure to variable interest rates on cash and cash equivalents.
(f) Foreign currency risk managementThe Group incurs costs in USA dollars and Australian dollars.
The Group holds the majority of liquid funds in USA dollars.
Fluctuations in the Australian dollar/USA dollar exchange rate can impact the performance of the consolidated entity. The consolidated entity is not currently engaged in any hedging or derivative transactions to manage foreign currency risk. As cash inflows and cash outflows are predominately denominated in USA dollars, with the exception of Australian dollar denominated equity funding, surplus funds are primarily held in USA dollars.
The carrying amounts of the Group’s foreign currency denominated monetary assets and monetary liabilities at the end of the reporting period are as follows.
Monetary assets Monetary liabilities
Consolidated2019
$2018
$2019
$2018
$
USA currency denominated 16,120,188 8,885,111 12,337,112 5,842,432
Australian currency denominated 3,132,589 431,311 3,331,268 5,631,234
The following table details the Group’s sensitivity to a 10% increase and decrease in the US$ against the A$.
A positive number below indicates an increase in profit or equity where the US dollar strengthens 10% against the relevant currency. For a 10% weakening of the US dollar against the relevant currency, there would be a comparable negative impact on the profit or equity. The impact is mainly due to the Australian group of holding companies incurring and settling expenses and outgoings in Australian dollars.
Australian dollar impact on profit/loss
Consolidated 2019US$
2018US$
Profit or equity 32,230 92,138

Byron Energy Limited Annual Report 201988
Notes to the Financial Statements continuedFor the Financial Year Ended 30 June 2019
28. Segment informationManagement has determined based on the reports reviewed by the executive management group (the chief operating decision makers) and used to make strategic decisions, that the Group operates within one business segment of oil and gas exploration, development and production; and one geographical segment, the shallow waters of the Gulf of Mexico, United States of America.
The geographical locations of the Group’s non-current assets are United States of America US$35,514,110 (2018: US$30,905,960) and Australia US$116,119 (2018: US$10,092).
29. Parent entity information
Financial position2019US$
2018US$
Assets
Current assets 2,115,172 311,361
Non-current assets 90,588,876 94,521,359
Total assets 92,704,048 94,832,720
Liabilities
Current liabilities 4,319,019 4,814,420
Non-current liabilities - 707,185
Total liabilities 4,319,019 5,521,605
Net assets 88,385,029 89,311,115
Equity
Issued capital 100,428,006 98,633,188
Accumulated losses (8,501,348) (7,373,036)
Reserves (3,541,629) (1,949,037)
Total equity 88,385,029 89,311,115
Financial performance
Loss for the year (1,128,312) (2,983,815)
Other comprehensive income (2,262,733) (2,150,158)
Total comprehensive loss for the financial year (3,391,045) (5,133,973)
Expenditure commitmentsThe parent entity has no expenditure commitments at the end of the 2019 financial year (2018: nil).
Guarantees There were no guarantees entered into during the year by the parent entity in relation to the debts of its subsidiaries.
Contingent liabilitiesThe parent entity had no contingent liabilities at 30 June 2019 (2018: nil).

Byron Energy Limited Annual Report 2019 89
30. Operating lease arrangementsOperating lease arrangements relate to the lease of a compressor on the SM71 F platform. The term is for a minimum 36 months with a 30-day notice period option to discontinue the arrangement beyond the three-year period. These obligations are not provided for in the financial statements and the Group doesn’t have a purchase option.
2019US$
2018US$
(a) Payments recognised as an expenseNet Byron minimum lease payments recognised as an expense 54,206 25,665
(b) Minimum net future lease paymentsNot longer than 1 year 55,562 54,206
Between 1 and 5 years 9,298 64,860
64,860 119,066
Refer to Note 17 for other ongoing expenditure commitments.
31. Interests in joint operationsAs at 30 June 2019, Byron Energy Inc, a wholly owned subsidiary of the Company was a party, to the following joint operations:
• SM71 Offshore Operating Agreement with Otto Energy (Louisiana) LLC covering all of Block 71, South Marsh Island Area, to explore, develop, produce and operate the lease. Byron Energy Inc is the designated operator of SM71 and owns a 50% Working Interest (‘WI’) and a 40.625% Net Revenue Interest (‘NRI’) in the block, with Otto Energy (Louisiana) LLC holding an equivalent WI and NRI in the block. Byron is the operator;
• Both Otto Energy (Gulf One) LLC, Metgasco Limited and NOLA Oil and Gas Ventures LLC exercised options to earn a 40%, 10% and 7% WI, respectively, in Byron’s Bivouac Peak project. Post earn in Byron’s WI and NRI reduced to 43% and 32.035% respectively. Byron is the operator;
• Vermilion 232 (‘VR232’) Offshore Operating Agreement with Otto Energy (Louisiana) LLC covering all of theVR232 Block, to explore, develop, produce and operate the lease. Byron Energy Inc is the designated operator of and owns a 50% WI and a 43.75% NRI in the block, with Otto Energy (Louisiana) LLC holding an equivalent WI and NRI in the block;
• Metgasco Limited exercised its option to earn a 30% WI and 24.375% NRI in South Marsh Island, block 74 (‘SM74’) by agreeing to pay a disproportionate share of drilling costs of the SM74 D14 well. Upon completion of the earn-in, Byron’s WI and NRI will be reduced to 70% and 56.875% respectively. Byron is the operator; and
• On 6 March 2019, Byron purchased from Fieldwood Energy LLC, a 53.00% non-operated Working Interest/44.166667% NRI in the SM58 Apache #E1 well and E platform located on SM69. Ankor E&P Holdings Corporation is the operator and holds a 47.00% Working Interest in the well and platform.

Byron Energy Limited Annual Report 201990
Notes to the Financial Statements continuedFor the Financial Year Ended 30 June 2019
32. Subsequent eventsSubsequent to the end of the financial year the following has occurred:
• on 5 July 2019, Byron announced to the ASX that, the Byron operated SM74 D14 well was to be plugged and abandoned;
• on 17 July 2019, Byron announced to the ASX that following the passage of Hurricane Barry the Company’s operations in the Gulf of Mexico had returned to normal without any storm damage;
• on 18 July 2019, Byron announced to the ASX that Metgasco Limited had exercised 10,000,000 unlisted options, over unissued shares, in the Company at A$0.25 each;
• on 7 August 2019, Byron announced to the ASX that the Enterprise 263 jack-up drilling rig commenced drilling operations on the Byron operated SM58 011 well, the Company’s first test well on its recently acquired South Marsh Island 58 block;
• on 22 August 2019, Byron announced to the ASX that it’s permitting two wells on SM71; one to extend the limits of the D5 reservoir and a second to more efficiently drain the remaining D5 reserves at SM71;
• in its releases of 26 and 29 August and 16 September 2019, Byron announced that the SM58 011 well encountered a substantial hydrocarbon column with a true vertical thickness net pay of 301 feet; due to mechanical difficulties, Byron decided to set the 7 5/8” casing at a depth of 7,940 feet measured depth, and then undertake a cleanout run to 10,811 feet measured depth with smaller 4” diameter drill pipe and run 5 ½” casing across the Upper O Sand pay interval to protect it; the 5 ½” casing will still allow a 2 7/8” tubing completion across the pay zone;
• on 19 September 2019, the Company released its annual reserves and resources report as of 30 June 2019, as independently assessed by Collarini Associates; and
• on 26 September 2019, Byron announced that (i) it had reached agreement with five of the six its existing lenders, (including four directors), for the repayment date on existing loans of US$2.0 million and A$2.1 million, to extend the repayment date of the loan facility from 30 November 2019 to 31 March 2021, with interest rate and other terms remaining unchanged, while the remaining lender for A$1.0 million, is yet to decide on the extension; and (ii) it had established a new short-term loan facility for US$2.0 million and A$1.45 million, sourced from four of the Company’s directors and two shareholders. This loan facility is unsecured, repayable by 31 December 2019 and will bear interest, from time of drawdown, at a rate of 10% per annum payable on loan repayment date.
Except for the above, there have not been any other matters or circumstances occurring subsequent to the end of the financial year that have significantly affected, or may significantly affect the operations of the Group, the results of those operations, or the state of affairs of the company in future financial period.

Byron Energy Limited Annual Report 2019 91
Directors’ Declaration
The directors of Byron Energy Limited declare that in the opinion of the directors:
(a) there are reasonable grounds to believe that the Company will be able to pay its debts as and when they become due and payable;
(b) the attached financial statements are in compliance with International Financial Reporting Standards as stated in Note 1 to the financial statements;
(c) the attached financial statements and notes thereto are in accordance with the Corporations Act 2001, including compliance with Accounting Standards and giving a true and fair view of the financial position and performance of the consolidated entity; and
(d) the directors have been given the declarations required by section 295A of the Corporations Act 2001.
Signed in accordance with a resolution of the directors of Byron Energy Limited made pursuant to section 295(5) of the Corporations Act 2001.
On behalf of the directors
D G BattersbyChairman
26 September 2019

Byron Energy Limited Annual Report 201992
Independent Auditor’s Report
Liability limited by a scheme approved under Professional Standards Legislation. Member of Deloitte Asia Pacific Limited and the Deloitte Network
Deloitte Touche Tohmatsu ABN 74 490 121 060 550 Bourke Street Melbourne VIC 3000 GPO Box 78 Melbourne VIC 3001 Australia DX: 111 Tel: +61 (0) 3 9671 7000 Fax: +61 (0) 9671 7001 www.deloitte.com.au
Independent Auditor’s Report to the members of Byron Energy Limited
Report on the Audit of the Financial Report
Opinion We have audited the consolidated financial report of Byron Energy Limited (the “Company”) and its subsidiaries (the “Group”) which comprises the consolidated statement of financial position as at 30 June 2019, the consolidated statement of profit or loss and other comprehensive income, the consolidated statement of changes in equity and the consolidated statement of cash flows for the year then ended, and notes to the financial statements, including a summary of significant accounting policies, and the directors’ declaration. In our opinion the accompanying financial report of the Group, is in accordance with the Corporations Act 2001, including:
(i) giving a true and fair view of the Group’s financial position as at 30 June 2019 and of its financial performance for the year then ended; and
(ii) complying with Australian Accounting Standards and the Corporations Regulations 2001.
Basis for Opinion We conducted our audit in accordance with Australian Auditing Standards. Our responsibilities under those standards are further described in the Auditor’s Responsibilities for the Audit of the Financial Report section of our report. We are independent of the Group in accordance with the auditor independence requirements of the Corporations Act 2001 and the ethical requirements of the Accounting Professional and Ethical Standards Board’s APES 110 Code of Ethics for Professional Accountants (the Code) that are relevant to our audit of the financial report in Australia. We have also fulfilled our other ethical responsibilities in accordance with the Code. We confirm that the independence declaration required by the Corporations Act 2001, which has been given to the directors of the Company, would be on the same terms if given to the directors as at the time of this auditor’s report. We believe that the audit evidence we have obtained is sufficient and appropriate to provide a basis for our opinion. Key Audit Matters Key audit matters are those matters that, in our professional judgement, were of most significance in our audit of the financial report of the current period. These matters were addressed in the context of our audit of the financial report as a whole, and in forming our opinion thereon, and we do not provide a separate opinion on these matters.

Byron Energy Limited Annual Report 2019 93
Key Audit Matters How the scope of our audit responded to the Key
Audit Matters
Amortisation of Oil and Gas properties
As at 30 June 2019 the Group amortised $USD 4.5 million of oil and gas properties as disclosed in Note 8(b). When an oil and gas asset commences commercial production, all acquisition and/or costs carried forward will be amortised on a units of production of basis over the remaining proved and probable recoverable reserves The remaining reserves are measured by external independent petroleum engineers.
The measurement of this amortisation is subject to certain assumptions including:
The level of future proved and probable recoverable reserves; and
The future capital expenditure required to access the reserves.
Our audit procedures included, but were not limited
to:
• obtaining and assessing management’s external specialist report used to estimate the level of proven and probable oil and gas reserves and future development capital expenditure;
• assessing the objectivity, expertise and experience of management’s external specialist to support the assumptions used,
• testing the metered production usage in the current year to independent third party reports; and
• recalculating the mathematical accuracy of the amortisation recognised.
We also assessed the appropriateness of the disclosures in Note 8 to the financial statements.
Other Information The directors are responsible for other information disclosed. The other information comprises the information included in the Group’s annual report for the year ended 30 June 2019, but does not include the financial report and our auditor’s report thereon. Our opinion on the financial report does not cover the other information and we do not express any form of assurance conclusion thereon. In connection with our audit of the financial report, our responsibility is to read the other information and, in doing so, consider whether the other information is materially inconsistent with the financial report or our knowledge obtained in the audit or otherwise appears to be materially misstated. If, based on the work we have performed, we conclude that there is a material misstatement of this other information; we are required to report that fact. We have nothing to report in this regard. Responsibilities of the Directors for the Financial Report The directors of the Company are responsible for the preparation of the financial report that gives a true and fair view in accordance with Australian Accounting Standards and the Corporations Act 2001 and for such internal control as the directors determine is necessary to enable the preparation of the financial report that gives a true and fair view and is free from material misstatement, whether due to fraud or error. In preparing the financial report, the directors are responsible for assessing the Group’s ability to continue as a going concern, disclosing, as applicable, matters related to going concern and using the going concern basis of accounting unless the directors either intend to liquidate the Group or to cease operations, or have no realistic alternative but to do so.

Byron Energy Limited Annual Report 201994
Independent Auditor’s Report continued
Auditor’s Responsibilities for the Audit of the Financial Report Our objectives are to obtain reasonable assurance about whether the financial report as a whole is free from material misstatement, whether due to fraud or error, and to issue an auditor’s report that includes our opinion. Reasonable assurance is a high level of assurance, but is not a guarantee that an audit conducted in accordance with the Australian Auditing Standards will always detect a material misstatement when it exists. Misstatements can arise from fraud or error and are considered material if, individually or in the aggregate, they could reasonably be expected to influence the economic decisions of users taken on the basis of this financial report. As part of an audit in accordance with the Australian Auditing Standards, we exercise professional judgement and maintain professional scepticism throughout the audit. We also:
Identify and assess the risks of material misstatement of the financial report, whether due to fraud or error, design and perform audit procedures responsive to those risks, and obtain audit evidence that is sufficient and appropriate to provide a basis for our opinion. The risk of not detecting a material misstatement resulting from fraud is higher than for one resulting from error, as fraud may involve collusion, forgery, intentional omissions, misrepresentations, or the override of internal control.
Obtain an understanding of internal control relevant to the audit in order to design audit
procedures that are appropriate in the circumstances, but not for the purpose of expressing an opinion on the effectiveness of the Group’s internal control.
Evaluate the appropriateness of accounting policies used and the reasonableness of accounting
estimates and related disclosures made by the directors. Conclude on the appropriateness of the director’s use of the going concern basis of accounting
and, based on the audit evidence obtained, whether a material uncertainty exists related to events or conditions that may cast significant doubt on the Group’s ability to continue as a going concern. If we conclude that a material uncertainty exists, we are required to draw attention in our auditor’s report to the related disclosures in the financial report or, if such disclosures are inadequate, to modify our opinion. Our conclusions are based on the audit evidence obtained up to the date of our auditor’s report. However, future events or conditions may cause the Group to cease to continue as a going concern.
Evaluate the overall presentation, structure and content of the financial report, including the
disclosures, and whether the financial report represents the underlying transactions and events in a manner that achieves fair presentation.
Obtain sufficient appropriate audit evidence regarding the financial information of the entities
or business activities within the Group to express an opinion on the financial report. We are responsible for the direction, supervision and performance of the Group audit. We remain solely responsible for our audit opinion.
We communicate with the directors regarding, among other matters, the planned scope and timing of the audit and significant audit findings, including any significant deficiencies in internal control that we identify during our audit. We also provide the directors with a statement that we have complied with relevant ethical requirements regarding independence, and to communicate with them all relationships and other matters that may reasonably be thought to bear on our independence, and where applicable, related safeguards. From the matters communicated with directors, we determine those matters that were of most significance in the audit of the financial report of the current period and are therefore the key audit matters. We describe these matters in our auditor’s report unless law or regulation precludes public disclosure about the matter or when, in extremely rare circumstances, we determine that a matter should not be communicated in our report because the adverse consequences of doing so would reasonably be expected to outweigh the public interest benefits of such communication.

Byron Energy Limited Annual Report 2019 95
Report on the Remuneration Report Opinion on the Remuneration Report We have audited the Remuneration Report included in pages 50 to 55 of the Directors’ Report for the year ended 30 June 2019. In our opinion, the Remuneration Report of Byron Energy Limited, for the year ended 30 June 2019, complies with section 300A of the Corporations Act 2001. Responsibilities The directors of the Company are responsible for the preparation and presentation of the Remuneration Report in accordance with section 300A of the Corporations Act 2001. Our responsibility is to express an opinion on the Remuneration Report, based on our audit conducted in accordance with Australian Auditing Standards. DELOITTE TOUCHE TOHMATSU Craig Bryan Partner Chartered Accountants Melbourne, 26 September 2019

Byron Energy Limited Annual Report 201996
ASX Additional Information
Additional information required by the Australian Securities Exchange Ltd Listing Rules and not disclosed elsewhere in this report is as follows. The information is current as at 24 September 2019.
Distribution of equity securitiesAs at 24 September 2019 the Company had a total of 705,373,417 ordinary shares on issue and 50,600,000 options on issue comprising:
Quoted ordinary shares705,373,417 fully paid ordinary shares are held by 2,815 shareholders. All issued ordinary shares carry one vote per share without restriction. Every member at a meeting of shareholders shall have one vote and up on a poll each share shall have one vote.
Unquoted options on issue50,600,000 options are held by 31 option-holders. 9,500,000 options are exercisable on or before 31 December 2019 at an exercise price of A$0.25 cents each, 28,350,000 options are exercisable on or before 31 December 2021 at an exercise price of A$0.12 cents each, 2,000,000 options are exercisable on or before 31 December 2021 at an exercise price of A$0.16 cents each and 10,750,000 options are exercisable on or before 31 December 2021 at an exercise price of A$0.40 cents each.
There are no voting rights attached to these options.
Escrowed securitiesAs at 24 September 2019 there are no escrowed securities.
The number of shareholders, by size of holding and the total number of quoted shares on issue:
Size of holding No. of holders No. of shares
1 – 1,000 140 34,223
1,001 – 5,000 719 2,024,952
5,001 – 10,000 362 2,937,451
10,001 – 100,000 985 38,334,505
100,001 and over 609 662,042,286
Total holders 2,815 705,373,417
The number of security investors holding less than a marketable parcel of securities is 101 with a combined total of 5,615 securities.
The number of option-holders, by size of holding and the total number of unquoted options on issue:
Size of holdingNo. of
holders
Exercise price A$0.25 expiry
31/12/2019No. of
holders
Exercise price A$0.12 expiry
31/12/2021No. of
holders
Exercise price A$0.16 expiry
31/12/2021No. of
holders
Exercise price A$0.40 expiry
31/12/2021
1 – 1,000 0 0
1,001 – 5,000 0 0
5,001 – 10,000 0 0
10,001 – 100,000 2 200,000
100,001 and over 7 9,300,000 11 28,350,000 1 2,000,000 10 10,750,000
Total 9 9,500,000 11 28,350,000 1 2,000,000 10 10,750,000
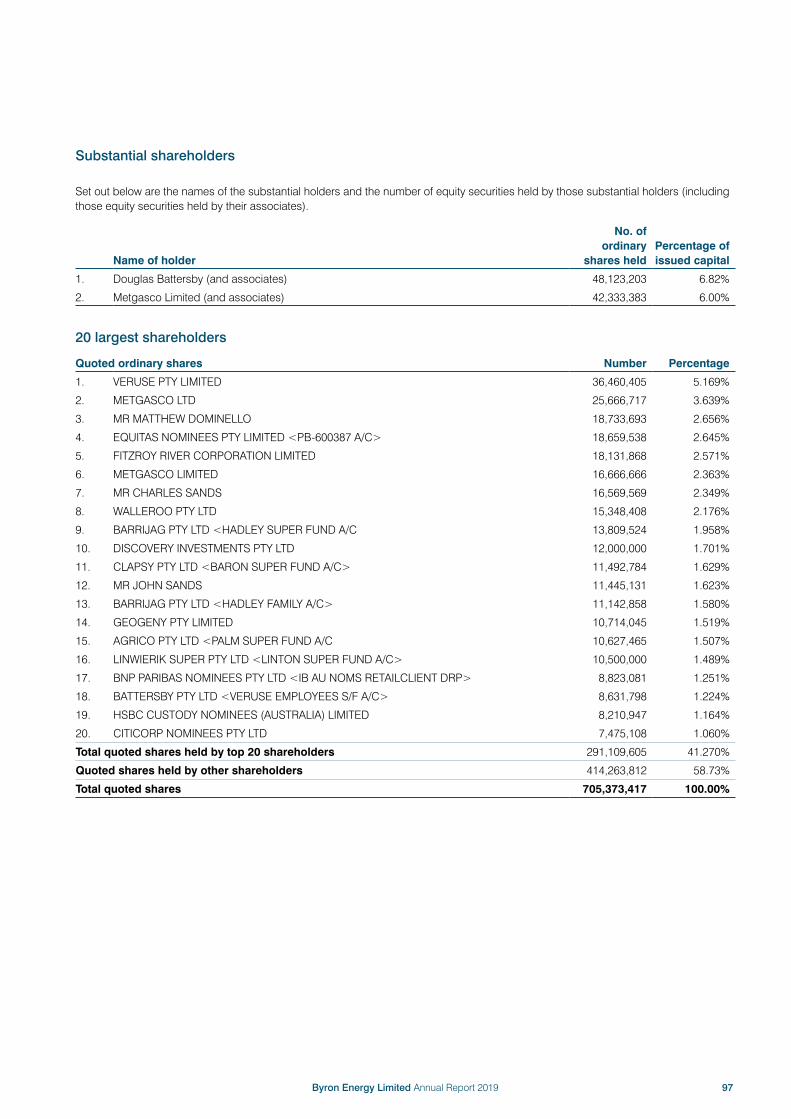
Byron Energy Limited Annual Report 2019 97
Substantial shareholders
Set out below are the names of the substantial holders and the number of equity securities held by those substantial holders (including those equity securities held by their associates).
Name of holder
No. of ordinary
shares heldPercentage of issued capital
1. Douglas Battersby (and associates) 48,123,203 6.82%
2. Metgasco Limited (and associates) 42,333,383 6.00%
20 largest shareholders
Quoted ordinary shares Number Percentage
1. VERUSE PTY LIMITED 36,460,405 5.169%
2. METGASCO LTD 25,666,717 3.639%
3. MR MATTHEW DOMINELLO 18,733,693 2.656%
4. EQUITAS NOMINEES PTY LIMITED <PB-600387 A/C> 18,659,538 2.645%
5. FITZROY RIVER CORPORATION LIMITED 18,131,868 2.571%
6. METGASCO LIMITED 16,666,666 2.363%
7. MR CHARLES SANDS 16,569,569 2.349%
8. WALLEROO PTY LTD 15,348,408 2.176%
9. BARRIJAG PTY LTD <HADLEY SUPER FUND A/C 13,809,524 1.958%
10. DISCOVERY INVESTMENTS PTY LTD 12,000,000 1.701%
11. CLAPSY PTY LTD <BARON SUPER FUND A/C> 11,492,784 1.629%
12. MR JOHN SANDS 11,445,131 1.623%
13. BARRIJAG PTY LTD <HADLEY FAMILY A/C> 11,142,858 1.580%
14. GEOGENY PTY LIMITED 10,714,045 1.519%
15. AGRICO PTY LTD <PALM SUPER FUND A/C 10,627,465 1.507%
16. LINWIERIK SUPER PTY LTD <LINTON SUPER FUND A/C> 10,500,000 1.489%
17. BNP PARIBAS NOMINEES PTY LTD <IB AU NOMS RETAILCLIENT DRP> 8,823,081 1.251%
18. BATTERSBY PTY LTD <VERUSE EMPLOYEES S/F A/C> 8,631,798 1.224%
19. HSBC CUSTODY NOMINEES (AUSTRALIA) LIMITED 8,210,947 1.164%
20. CITICORP NOMINEES PTY LTD 7,475,108 1.060%
Total quoted shares held by top 20 shareholders 291,109,605 41.270%
Quoted shares held by other shareholders 414,263,812 58.73%
Total quoted shares 705,373,417 100.00%

Byron Energy Limited Annual Report 201998
Corporate Directory
DirectorsDoug Battersby (Non-Executive Chairman)Maynard Smith (Executive Director and CEO)Prent Kallenberger (Executive Director)William Sack (Executive Director)Charles Sands (Non-Executive)Paul Young (Non-Executive) Chief Executive OfficerMaynard Smith
Chief Financial Officer and Company SecretaryNick Filipovic
Registered and principal Australian officeLevel 4480 Collins StreetMELBOURNE VIC 3000
Principal office (USA)Suite 100425 Settlers Trace BoulevardLAFAYETTE LA 70508
Websitewww.byronenergy.com.au
Legal adviserPiper AldermanLevel 23Governor Macquarie Tower1 Farrer PlaceSYDNEY NSW 2000
AuditorsDeloitte Touche Tohmatsu550 Bourke StreetMELBOURNE VIC 3000
Home stock exchangeASX Limited20 Bridge StreetSYDNEY NSW 2000ASX Code: BYE
Share registryBoardroom Pty LimitedGrosvenor PlaceLevel 12225 George StreetSYDNEY NSW 2000Tel: 1300 737 760Fax: 1300 653 459


![Tema 1...NBoi: volumen de petr´oleo inicial a condiciones de yacimiento [MMbbl] NBo: volumen de petr´oleo actual a condiciones de yacimiento [MMbbl] La expansi´on del petr´oleo](https://static.fdocuments.net/doc/165x107/60b931a8d274f36c62134059/tema-1-nboi-volumen-de-petroleo-inicial-a-condiciones-de-yacimiento-mmbbl.jpg)