A SOFTWARE TOOL DEVELOPED FOR THE CLASSIFICATION OF REMOTE SENSING SPECTRAL REFLECTANCE DATA...
22
A SOFTWARE TOOL DEVELOPED FOR THE CLASSIFICATION OF REMOTE SENSING SPECTRAL REFLECTANCE DATA Abdullah Faruque School of Computing & Software Engineering Southern Polytechnic State University, Marietta, GA 30060 Raj Bahadur Department of Natural Sciences & Environmental Health Mississippi Valley State University, Itta Bena, MS 38941 Gregory A. Carter Gulf Coast Research Laboratory Ocean Springs, MS 39566
-
Upload
leon-cadle -
Category
Documents
-
view
222 -
download
3
Transcript of A SOFTWARE TOOL DEVELOPED FOR THE CLASSIFICATION OF REMOTE SENSING SPECTRAL REFLECTANCE DATA...

A SOFTWARE TOOL DEVELOPED FOR THE CLASSIFICATION OF REMOTE SENSING SPECTRAL REFLECTANCE DATA
Abdullah FaruqueSchool of Computing & Software Engineering
Southern Polytechnic State University, Marietta, GA 30060
Raj BahadurDepartment of Natural Sciences & Environmental Health
Mississippi Valley State University, Itta Bena, MS 38941
Gregory A. CarterGulf Coast Research Laboratory
Ocean Springs, MS 39566

Abstract
This paper describes the development and implementation of LIP (Leaf Identification Program), a pattern recognition software tool intended to classify remote sensing spectral reflectance data of stressed soybean leaves by using neural network and other statistical pattern recognition techniques. The development of this software tool takes advantage of the high performance computational and visualization routines of the MATLAB programming environment. LIP provides an integrated environment for various data analysis, data visualization and pattern recognition techniques to analyze remote sensing spectral reflectance data. Data analysis component of LIP includes: principal component analysis, fisher and variance weight calculations and feature selection. Data visualization tool permits visual assessment of the spectral reflectance data patterns and their relationships. Several classification methods have been implemented in LIP using both neural network and statistical pattern recognition techniques. Neural network methods include the back propagation neural network (BPN) and radial basis function (RBF) neural network. Statistical pattern recognition component of LIP includes linear discriminant analysis (LDA), quadratic discriminant analysis (QDA), regularized discriminant analysis (RDA), soft independent modeling of class analogy (SIMCA) and discriminant analysis with shrunken covariance (DASCO). The objective of this study funded by National Aeronautics Space Administration (NASA) at Stennis Space Center was to record and classify the spectral reflectance differences of leaf stress caused by drought, fungal disease, and lead contamination of the soil. LIP software tool has been used successfully to classify the different classes of stressed leaves from their spectral signature.

Introduction Neural Networks and pattern recognition methods constitute
a powerful tool for the classification of remote sensing spectral reflectance data.
We have investigated the potential of Neural Networks as a preferred pattern recognition method for classifying spectral reflectance data of stressed(drought stressed, fungal infected, lead contaminated – as shown in figure 1 and figure 2) soybean leaves.
This method can be used to monitor more precisely the signs of damaging stress on economic crops.
Software based on neural networks and statistical pattern recognition analysis of reflectance data has been developed and evaluated.
The software package: Leaf Identification Program (LIP) is written in MATLAB and employs the graphical user interface features to simplify its use.

Lead & Drought Stress Reflectance
0
10
20
30
40
50
603
06
38
0
45
9
53
9
61
7
69
4
76
9
84
2
91
5
98
7
10
59
Wavelength(nm)
Re
fle
cta
nc
e %
control
drought
lead & EDTA
Figure 1
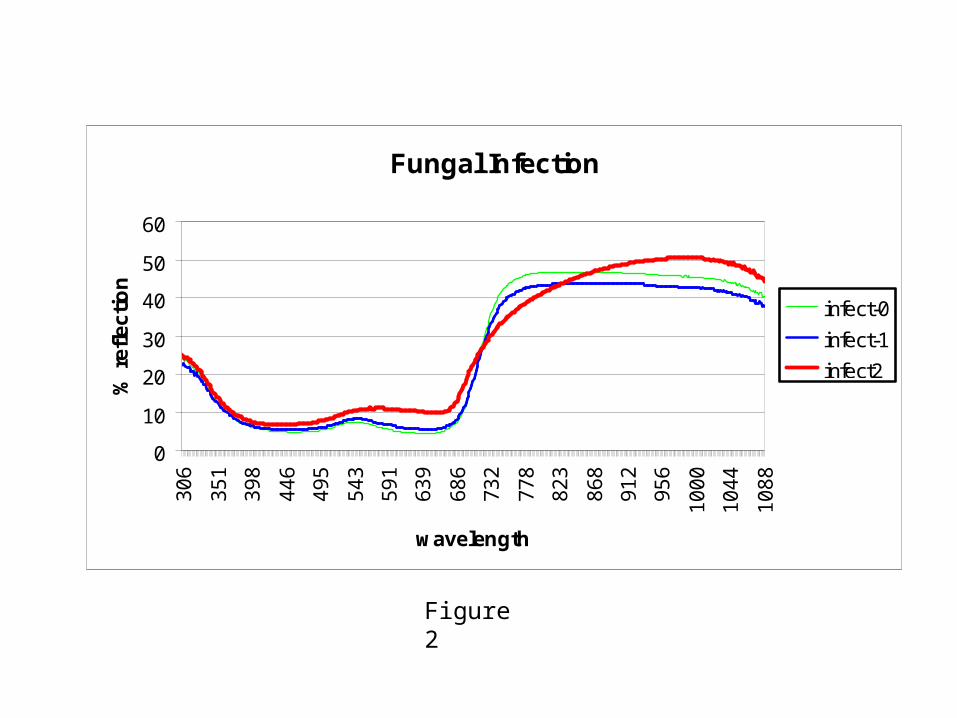
Fungal Infection
0
10
20
30
40
50
60
30
6
35
1
39
8
44
6
49
5
54
3
59
1
63
9
68
6
73
2
77
8
82
3
86
8
91
2
95
6
10
00
10
44
10
88
wavelength
% r
efl
ec
tio
n
infect-0
infect-1
infect2
Figure 2

Leaf Identification Program (LIP)
LIP is a graphical user interface based program written in MATLAB Figure 3 shows the top level interface of LIP
Supported platforms: Sun SPARCstation MS-Windows
Software requirements: MATLAB (version 4.2 or higher) MATLAB Neural Networks Toolbox (version 2.0)

Figure 3: Graphical user interface of LIP

Main features of LIP
Data input/output Data analysis
Feature selection Principal components analysis
Classification Training (Neural Networks and other statistical methods) Prediction using the trained network or model
Graphical display of data

Data input/output
LIP can input: Plain ASCII formatted data generated by GER1500
Spectroradiometer. This format will allow virtually any other kinds of data generated from a different source to be used with LIP.
LIP can output: Training results to a text file Prediction results to a text file Trained network or model to a file. This will allow users
to make a library of trained networks or models to be used later on prediction data sets.
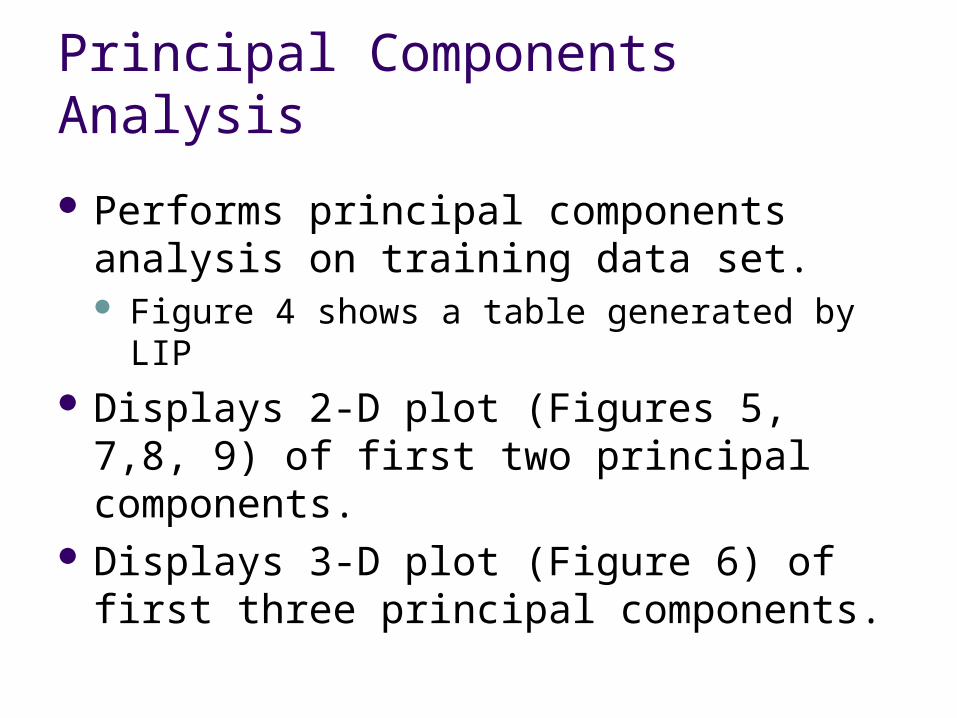
Principal Components Analysis
Performs principal components analysis on training data set. Figure 4 shows a table generated by LIP
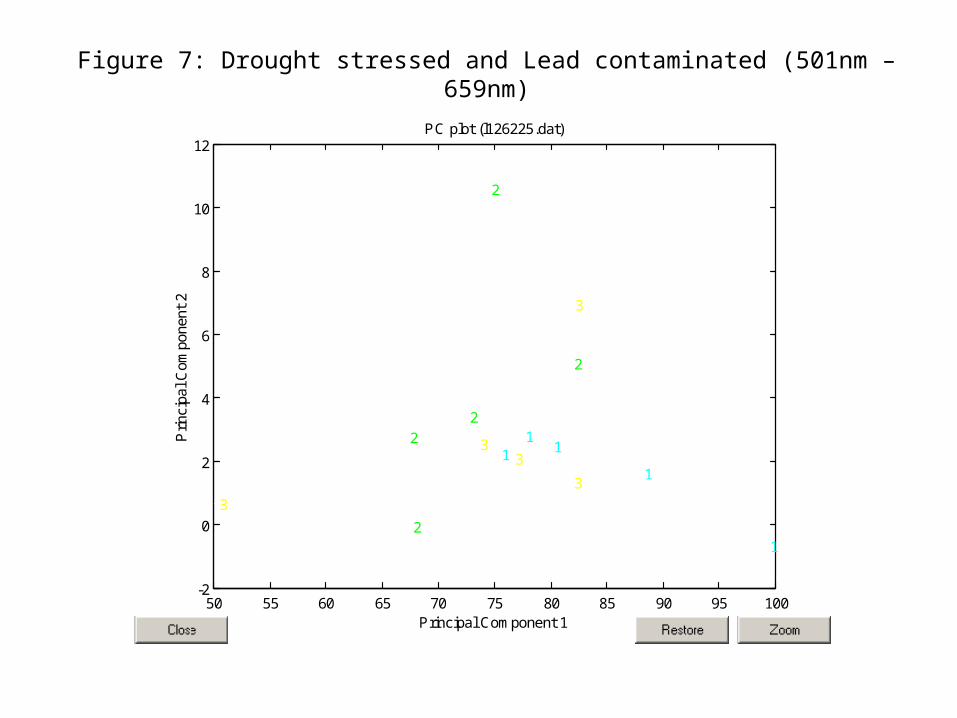
Displays 2-D plot (Figures 5, 7,8, 9) of first two principal components.
Displays 3-D plot (Figure 6) of first three principal components.

Figure 4: Principal Components Table

Figure 5: 2-D PC plot of Fungal infected leaves

Figure 6: 3-D PC plot of Fungal infected leaves
50 55 60 65 70 75 80 85 90 95 100-2
0
2
4
6
8
10
12
1 11
1
1
2
2
2
2
2
3
3
3
3
3
Principal Component 1
Prin
cipa
l Com
pone
nt 2
PC plot (l126225.dat)
Figure 7: Drought stressed and Lead contaminated (501nm – 659nm)

350 400 450 500 550 600 650 700-50
-45
-40
-35
-30
-25
-20
-15
-10
1
11
1
1
2
2
2
2
2
3
3
3
3
3
Principal Component 1
Prin
cipa
l Com
pone
nt 2
PC plot (l226425.dat)
Figure 8: Drought stressed and Lead contaminated (660nm – 1089nm)

450 500 550 600 650 700 750 800 850-80
-70
-60
-50
-40
-30
-20
1
11
1
1
2
2
222
3
3
3
3
3
Principal Component 1
Prin
cipa
l Com
pone
nt 2
PC plot (lfull.dat)
Figure 9: Drought stressed and Lead contaminated (305nm – 1089nm)

Classification methods implemented
BPN (Backpropagation Networks) KNN (k-Nearest Neighbor) LDA (Linear Discriminant Analysis) QDA (Quadratic Discriminant Analysis) RDA (Regularized Discriminant Analysis) SIMCA (Soft Independent Modeling of Class
Analogy) DASCO (Discriminant Analysis with Shrunken
Co-variances)

Results and discussion Different methods of training are performed on different
classes of Fungal infected, drought stressed and lead contaminated reflectance data acquired through GER1500 Spectroradiometer for 512 spectral bands (from 305nm to 1089 nm).
1st training data set consists of 15 data vectors, representing: 5 good leaves , 5 slightly infected leaves and 5 severely infected leaves.
2nd Training data set consists of 15 data vectors, representing: 5 good leaves, 5 drought stressed leaves and 5 lead contaminated leaves.
Each data vector contained 512 descriptors(reflectance values).
Classification error rates (Figures 10, 11, 12) were calculated using Cross-validated methods.
BPN with 100 hidden nodes performed very well compared to other statistical methods.

Fungal infected leaves (100 descriptors)
0 20 40 60 80 100
LDA
QDA
SIMCA
DASCO
BPN(10)
BPN(20)
BPN(100)
KNN
Cla
ss
ific
ati
on
me
tho
ds
% Classification error rate
Figure 10: Classification error rate for Fungal infected leaves

Fungal infected leaves (512 descriptors)
0 10 20 30 40 50 60
BPN(5)
BPN(10)
BPN(20)
BPN(30)
BPN(50)
BPN(100)
KNN
Cla
ss
ific
ati
on
me
tho
ds
% Classification error rate
Figure 11: Classification error rate for Fungal infected leaves

Drought stressed and Lead contaminated (512 descriptors)
0 10 20 30 40 50 60
BPN(5)
BPN(10)
BPN(20)
BPN(30)
BPN(50)
BPN(100)
KNN
Cla
ss
ific
ati
on
me
tho
ds
% Classification error rate
Figure 12: Classification error rate for Drought stressed and Lead contaminated leaves

Conclusion
LIP can be a viable and useful pattern recognition tool for classification of reflectance data.
User can analyze a particular data set with different methods (neural networks and statistical techniques) in an integrated environment of LIP, before making a decision on the classification scheme suitable for that data set.
We are investigating reflectance data related with other kinds of stress on leaves.