A Socio-economic Analysis of the Role of Indigenous ...
139
A SOCIO-ECONOMIC ANALYSIS OF THE ROLE OF INDIGENOUS KNOWLEDGE AND EXTERNAL INTERVENTIONS IN PASTORALISTS’ LIVELIHOOD RESILIENCE IN WEST POKOT COUNTY, KENYA BY DEBORAH NAMAYI MURICHO A56/83704/2015 A Thesis Submitted in Partial Fulfillment of the Award of the Degree of Master of Science in Agricultural and Applied Economics Department of Agriculture Economics Faculty of Agriculture University of Nairobi October, 2018
Transcript of A Socio-economic Analysis of the Role of Indigenous ...

A SOCIO-ECONOMIC ANALYSIS OF THE ROLE OF INDIGENOUS KNOWLEDGE
AND EXTERNAL INTERVENTIONS IN PASTORALISTS’ LIVELIHOOD
RESILIENCE IN WEST POKOT COUNTY, KENYA
BY
DEBORAH NAMAYI MURICHO
A56/83704/2015
A Thesis Submitted in Partial Fulfillment of the Award of the Degree of Master of Science
in Agricultural and Applied Economics
Department of Agriculture Economics
Faculty of Agriculture
University of Nairobi
October, 2018

i
Declaration
This thesis is my original work and has not been presented for the award of a degree in any other
institution.
Deborah Namayi Muricho
Reg. No. A56/83704/2015
Signature……………………………………..Date…………………………………
Approval
This thesis has been submitted with our approval as supervisors.
Dr. David Jakinda Otieno
Department of Agricultural Economics, University of Nairobi, Kenya
Signature………………………………………….Date…………………………………
Prof. Willis Oluoch-Kosura
Department of Agricultural Economics, University of Nairobi, Kenya
Signature………………………………………….Date………………………………
Prof. Magnus Jirstrom
Department of Human Geography, Lund University, Sweden
Signature………………………………………….Date………………………………

ii
The following papers have been written from this thesis.
Journal Paper
Muricho, D.N, Otieno D.J and Olucoh-Kosura W. (2018) “The Role of Pastoralists’ Indigenous
Knowledge and Practices in Reducing Household Food Insecurity in West Pokot, Kenya.’’ Journal paper
published in the Journal of Development and Agricultural Economics (JDAE)
https://doi.org/10.5897/JDAE2017.0871
Conference Papers
Muricho, D.N., Otieno, D.J., Oluoch-Kosura, W. and Jistrom, M. (2018). Strengthening
Participation in Markets: an opportunity to Build Pastoralists’ Resilience in West Pokot
County, Kenya. An oral paper accepted for presentation at the 5th Adaptation Futures
Conference in Capetown, South Africa, 17th – 22th June 2018.
Muricho, D.N., Otieno, D.J., Oluoch-Kosura, W. and Jistrom, M. (2018). Factors building
pastoralists resilience to shocks: Evidence from West Pokot County, Kenya. A poster paper
accepted for presentation at the 30th International Conference of Agricultural Economists
(ICAE) in Vancouver, Canada, 28th July – 02nd August 2018.
Muricho, D.N., Otieno, D.J., Oluoch-Kosura, W. and Jirstrom, M. (2018). The role of pastoralists’
tenure security in sustainable land management: Evidence from West Pokot, Kenya. Conference
paper presented at the 19th Annual World Bank Conference on Land and Poverty in Washington
D.C., USA from 19th to 23rd March 2018.
Muricho, D.N., Otieno, D.J. and Oluoch-Kosura, W. (2017). “Enhancing pastoralists’ resilience to
climate change induced shocks; the role of indigenous knowledge in West Pokot, Kenya.’ Poster
presented during the 6th National Science Week of the Kenya National Commission for Science,
Technology and Innovation, NACOSTI ON 22nd -26th May 2017.
Muricho, D.N., Otieno, D.J. and Oluoch-Kosura, W. (2017). “Building pastoralists’ resilience:
Strengthening participation in markets and local governance institutions in West Pokot,
Kenya.”Conference Paper presented at the 18th Annual World Bank Conference on Land and Poverty
in Washington D.C on 20th – 24th March 2017. Available at
https://www.conftool.com/landandpoverty2017/index.php?page=browseSessions&print=yes&cols=6&d
oprint=yes&form_session=391&mode=table&presentations=show

iii
Acknowledgement
I give thanks to Jehovah God, for granting me the gift of life and good health to be able to
complete this study. I appreciate my advisors Dr. David Jakinda Otieno, Prof. Willis Oluoch-
Kosura and Prof. Magnus Jirstrom for their guidance, readiness to help, timely feedback, and
moral support. My gratitude also goes to the Government of Kenya and the Africa Economic
Research Consortium (AERC) for awarding me a scholarship to pursue a master’s degree in
Agricultural and Applied Economics at the University of Nairobi and the Land, Livestock and
Livelihood (Triple L) project (www.triplel.se) for partially funding the research work.
I am grateful for the perseverance and support of the data collection team comprising Peter
Waboya, Mary Kavuu and Naomi Juma. I also acknowledge the respondents and field guides in
West Pokot for their cooperation and hospitality during data collection. Finally, I wish to thank
fellow colleagues and lecturers from the University of Nairobi and at the shared facility at
University of Pretoria for their invaluable input towards this research thesis and their moral
support. May God bless you all abundantly.

iv
Dedication
I dedicate this thesis to mum Cellestyne Naliaka, nephew Russell, my grandparents Francis
Simiyu and Rose Nasike for your unwavering love, support and care that molded me into the
person I am today. I cannot thank you enough.

v
Table of Contents
Declaration ....................................................................................................................................... i
Acknowledgement ......................................................................................................................... iii
Dedication ...................................................................................................................................... iv
Table of Contents ............................................................................................................................ v
LIST OF TABLES ....................................................................................................................... viii
LIST OF FIGURES ....................................................................................................................... ix
LIST OF APPENDICES ................................................................................................................. x
ABSTRACT ................................................................................................................................... xi
LIST OF ABBREVIATIONS ....................................................................................................... xii
CHAPTER ONE ............................................................................................................................. 1
1.1 Introduction ........................................................................................................................... 1
1.1.1 Livestock in the context of pastoralists’ livelihoods ...................................................... 1
1.1.2 Trends in the Resilience of Pastoral Livelihoods ........................................................... 4
1.2 Statement of the Research Problem ...................................................................................... 6
1.3 Objectives of the study .......................................................................................................... 8
1.4 Research Hypotheses............................................................................................................. 8
1.5 Justification ........................................................................................................................... 9
1.6 Organization of the thesis .................................................................................................... 10
CHAPTER TWO .......................................................................................................................... 11
2.0 LITERATURE REVIEW ....................................................................................................... 11
2.1 Overview of Pastoral Livelihoods and Emerging Trends ................................................... 11
2.2 Emerging Trends in Livestock Marketing .......................................................................... 12
2.3 The Resilience Concept ....................................................................................................... 13
2.4 A Review of Previous Studies on Indigenous Knowledge, External Interventions and
Resilience .................................................................................................................................. 15

vi
2.5 Conceptual Framework ....................................................................................................... 18
2.6 Theoretical Framework ....................................................................................................... 20
2.7 Study Area ........................................................................................................................... 21
CHAPTER THREE ...................................................................................................................... 26
Characterization of Pastoralists’ Livelihoods, Shocks and Coping Strategies ............................. 26
3.1 Introduction ......................................................................................................................... 27
3.2 Objectives and Methodology .............................................................................................. 28
3.3 Characterization of households by demographic and socio-economic attributes ............... 31
3.2 Pastoralists’ Exposure to Shocks and Coping Strategies .................................................... 34
CHAPTER FOUR ......................................................................................................................... 39
4.0 Pastoralists’ Indigenous Knowledge and Uptake of External Interventions and their Role in
Helping Households Manage Shocks ........................................................................................... 39
4.1 Introduction ......................................................................................................................... 40
4.2 Objective and Methodology ................................................................................................ 41
4.3 Indigenous knowledge and practices among the pastoralists’ community ......................... 42
4.4 Conclusions and Policy Implications .................................................................................. 53
CHAPTER FIVE .......................................................................................................................... 55
5.1 Introduction ......................................................................................................................... 55
5.2 Objective and Methodology ................................................................................................ 57
5.3 Measurement of Household Resilience to Shocks .......................................................... 57
5.3.1 DFID/TANGO Resilience Conceptual Framework ..................................................... 58
5.3.2 Tufts Livelihoods Change Over Time (LCOT) Model ................................................ 58
5.3.3 OXFAM and ACCRA .................................................................................................. 58
5.3.4 FAO Resilience Index Measurement and Analysis (RIMA) Conceptual Framework . 59
5.4 Factors that Enhance Household Resilience to shocks ....................................................... 66

vii
5.4.1 Household Demographic Characteristics ..................................................................... 69
5.4.2 Effect of Proximity to Basic Services on Resilience .................................................... 71
5.4.3 Institutional Factors Affecting Household Resilience .................................................. 72
5.4.3 Effect of Indigenous Knowledge, Innovations and Practices on Resilience ................ 75
5.4.4 Effect of External Interventions on Resilience ............................................................. 76
5.5 Conclusion and Policy Implications .................................................................................... 78
CHAPTER SIX ............................................................................................................................. 80
6.0 SUMMARY, CONCLUSION AND IMPLICATIONS TO POLICY ................................... 80
6.1 Summary ............................................................................................................................. 80
6.2 Conclusion and Implications to Policy ............................................................................... 81
6.3 Contribution to Knowledge ................................................................................................. 83
6.4 Suggestions for Further Research ....................................................................................... 84
6.0 References ............................................................................................................................... 85
Appendices .................................................................................................................................... 93

viii
LIST OF TABLES
Table 1: Livestock population and percentage off-take in Kenya ................................................................ 2
Table 2: A Historical perspective of pastoral livelihoods changes from 1980 to 2016 .............................. 29
Table 3: Sample Respondents’ Characteristics ........................................................................................... 31
Table 4: Indigenous Knowledge and Practices ........................................................................................... 43
Table 5: Pastoralists’ Uptake of Intervensionist Programmes ................................................................... 50
Table 6: Factor Loadings of Variables used in PCA................................................................................... 61
Table 7: Ordered Probit Results on Determinants of Household Resilience .............................................. 69

ix
LIST OF FIGURES
Figure 1: Vegetation condition index for West Pokot County ...................................................................... 3
Figure 2: Rainfall amount in West Pokot County as at April 2017 .............................................................. 4
Figure 3: A Framework for Understanding Pastoralists’ Resilience in West Pokot ................................... 19
Figure 4: Illustration of the Study Sites ...................................................................................................... 22
Figure 5: Respondents’ Livelihood Activities ............................................................................................ 33
Figure 6: Effects of Shocks on Households ................................................................................................ 35
Figure 7: Coping Mechanisms for Shocks .................................................................................................. 36
Figure 8: Household Resilience Categories ................................................................................................ 65
Figure 9: Challenges in Various Market Channels ..................................................................................... 72

x
LIST OF APPENDICES
Appendix 1: Questionnaire for Focus Group Discussion ........................................................................... 93
Appendix 2: Key Informant Interviews ........................................................................................................ 1
Appendix 3: Household Interview Questionnaire ......................................................................................... 3

xi
ABSTRACT
Pastoralists face many shocks, which increase their vulnerability to food insecurity and poverty.
In West Pokot county of Kenya, such shocks include prolonged seasons of drought that leads to
acute shortage of forage resulting to fluctuations in milk and meat production and ultimately loss
of livestock. The surging population growth forces human encroachment into shared grazing
grounds leading to diminishing pasture availability. To counter these effects, pastoralists have
been known to use their own indigenous knowledge which for a long time has enabled them to
thrive in the harsh environment. Also, in recent years the county government of West Pokot
together with other development partners has put in place interventionist programmes aimed at
building pastoralists’ livelihood resilience. However, the extent to which these efforts contribute
to resilience has not been comprehensively documented. This study assessed the effect of
pastoralists’ own indigenous knowledge and the external interventions on household resilience to
shocks. Primary survey data was collected through a combination of methods comprising a focus
group discussion, key informant interviews and a household survey on 191 households. The
Principal Component Analysis (PCA) method was used to compute household resilience index to
shocks. An ordered probit regression model with 3 resilience categories was used to analyze the
effect of indigenous knowledge and external interventions on household resilience. Results
showed that most respondents derived over 75% of their food and income needs from livestock.
Drought and livestock diseases were the most prevalent shocks. The average resilience index was
0.41. Regression results showed that indigenous practices such as ethno-veterinary practices and
grazing on postharvest crop residues as well as external intervention programmes such as
enclosing land, bee keeping, stocking improved breeds and institutional support in form of credit
and extension services had a positive and significant effect on building household resilience to
shocks. These results suggest the need to incorporate the indigenous practices in the external
interventions together with more institutional support to help pastoralists overcome shocks.
Key words: Pastoralists, Shocks, Indigenous Knowledge, External interventions, Livelihood
Resilience.

xii
LIST OF ABBREVIATIONS
ALRMP Arid Lands Resource Management Project
ASAL Arid and Semi Arid Land
CAADP Comprehensive African Agriculture Development Programme
CABESI Camels Bees Silk
CCDP Combined County Development Plan
CIDP County Integrated Development Plan
CTA Technical Centre for Agricultural and Rural Cooperation
DFID Department for International Development (UK)
FAO Food and Agriculture Organization of the United Nations
FGD Focus Group Discussion
FMD Foot and Mouth Disease
GDP Gross Domestic Product
IK Indigenous Knowledge
IFAD International Fund for Agricultural Development
IIR International Institute for Rural Reconstruction
IPCC Inter-governmental Panel on Climate Change
KALRO Kenya Agricultural and Livestock Research Organization
KIPPRA Kenya Institute for Public Policy Research and Analysis
KNBS Kenya National Bureau of Statistics
KVDA Kerio Valley Development Authority
MT Metric Tonne
NDMA National Drought Management Authority
NGO Non-Government Organization
ODI Overseas Development Institute
PCA Principal Component Analysis
SID Society for International Development
SHOATS Sheep and Goats
TLU Tropical Livestock Unit
WISP World Initiative for Sustainable Pastoralism

1
CHAPTER ONE
1.1 Introduction
1.1.1 Livestock in the context of pastoralists’ livelihoods
Livestock production supports the sustenance of many people’s livelihoods in Africa in diverse
ways. The livestock enterprises serve as means to an end for people who depend on the livestock
for food and non-food uses such as draught power, source of fertilizer, medium of exchange and
store of wealth (Steinfeld, 2010). Livestock also play important social and cultural purposes in
Africa such as means of dowry payment, tokens of appreciation during celebrations and as a
measure of prestige. Further, a considerable share of livestock owners prefer holding their assets
in form of livestock rather than in monetary form that require a formal banking system, which is
not usually accessible especially for remote farmers (World Initiative for Sustainable
Pastoralism, (WISP, 2010).
In Kenya, the livestock sector accounts for over 40% of the total agricultural gross domestic
product (GDP). Estimates by the Kenya Institute for Public Policy Research and Analysis
(KIPPRA, 2015) also show that the sector employs at least 50% of total agricultural labor in
pasture cultivation, herding, manufacture of commercial feeds and other inputs, processing and
marketing of livestock products.
Domestic livestock production contributes over 70% of the local requirements for meat, milk,
dairy products and other livestock products (Aklilu, 2008). The 2009 census by the Kenya
National Bureau of Statistics (KNBS) shows that cattle, sheep and goats are the most important
source of red meat in Kenya and accounts for over 70% of the total ruminant take-off (Table 1).

2
Table 1: Livestock population and percentage off-take in Kenya
ASAL Highlands Total % off take
Indigenous cattle 12,155,974 N/A N/A
17,467,774
6 -14
N/A Exotic cattle N/A 5,311,800
Sheep 14,954,925 2,174,681 17,129,606 4-10
Goats 25,250,865 2,489,288 27,740,153 4-10
Camels 2,968,670 2441 2,971,111 1-3
Source: KNBS (2009).
More than half of the total livestock population in Kenya is found in the arid and semi arid lands
(ASALs) and are reared by over 80% of the ASAL inhabitants who derive over 90% of their
livelihoods from livestock. Such households who depend almost entirely on livestock are
considered to be pastoralists (WISP, 2010).
Pastoralism, as a livelihood means enables the people who practice it to meet their food and
income needs from livestock (WISP, 2010). It is widely recognized that besides being a cultural
way of life, pastoralism is an adaptive mechanism to harsh ecological systems that can hardly
support rain-fed crop farming (Barrow et al., 2007). Pastoralism in Kenya is mainly practiced by
the communities living in the ASALs such as West Pokot where it employs over 90% of the
population both directly and indirectly. Pastoralism generates about Kshs 2 billion (about
USD$20 million) annually for the people of West Pokot (Combined County Development Plan,
CCDP 2013). Livestock for a long time has been used by the people of West Pokot culturally as
a means to pay bride price, fines, gifts and ceremonial food in cultural feasts.
Pastoralism throughout the world faces multiple challenges such as loss of grazing grounds due
to encroachment by human beings and climate change related shocks (Little and McPeak, 2014).
The Intergovernmental Panel on Climate Change (IPCC, 2014) predicted greater impacts of
climate changes such as global warming in Africa than anywhere in the world. Pastoralists,
especially those in the ASALs, are among the worst hit by vagaries of climate change (Thornton

3
et al., 2008). As a result, disasters such as droughts and conflicts have been on the rise especially
in the Horn of Africa and humanitarian aid is needed in such instances to avert the crisis (Little
and McPeak, 2014). Vegetation condition index (VCI) is one of the indicators monitored to
measure climatic changes such as an impending drought. Figure 1 below shows the VCI statistics
for West Pokot County over the last 17 years. A vegetation deficit occurs as a result of rain
cessation, resulting in a moderate drought situation that may result in a severe drought if the
trend persists. Recent reports and news bulletins from the National Droughts Management
Authority (NDMA) showed that the vegetation deficit got worse from late 2016 in the area and
by April 2017, the VCI index was below 15 implying drought for pastoralists.
Figure 1: Vegetation condition index for West Pokot County
Source: NDMA (2018).
Figure 2 below shows a sharp decline in rainfall amounts received from January to March 2017
with the actual normalized difference vegetation index being below the usual average. This

4
resulted to deterioration and death of livestock, reduced milk production and consumption and
food insecurity in many households (NDMA, 2017).
Figure 2: Rainfall amount in West Pokot County as at April 2017
Source: NDMA (2017).
1.1.2 Trends in the Resilience of Pastoral Livelihoods
Pastoralists have employed a number of mechanisms that enable them thrive well in the ASALs
that can hardly support other forms of livelihood. One of the emerging adaptation strategies is
organized seasonal transhumant movements in search of pasture and water in open access
resources. Transhumant movement enables pastoralists to escape droughts and disease-infested
areas (Flintan, 2012 and Turner et al., 2014). Pastoralists mainly stock indigenous breeds of
livestock that can move long distances and do well with little water and pasture (WISP, 2010 and
Little and McPeak, 2014).

5
Pastoralists are custodians of indigenous knowledge, which enables them to make a living in the
harsh environment (Emery, 2000). Studies have shown that pastoralists’ indigenous knowledge
manifests itself in practices such as diversifying herds by stocking both grazing and browsing
species, group herding to minimize risk of cattle rustling, naming of animals for identification
and to control inbreeding, setting up of traditional institutions that control access to and use of
communal pastures and use of traditional tree species that have curative benefits for livestock
(Dinucci and Fre 2003; WISP 2010; Selemani et al 2012; Little and McPeak, 2014).
However, there are various challenges including recurrent droughts that undermine pastoralists’
livelihood resilience. During extremely dry spells, large herds of livestock (cattle, camels, goats
and sheep) are often lost due to acute shortage of pasture and water. This increases pastoralists’
vulnerability and perpetually traps them in poverty (Carter et al., 2015 and FAO, 2012). Another
emerging challenge is the loss of key pastoral resources of natural pastures as population
pressure pushes people to encroach into grazing lands for settlement and institutional changes
such as land fragmentation for urbanization and commercial farming, occasioned by imbalance
in the allocation of property rights (Cotula, 2007).
Another concern in the pastoralists’ domain is political marginalization (Markakis, 2004).
Because they are found far away from cities and towns and their niche has often been
characterized by low economic activities, there has largely been low investment in infrastructure
and most pastoral areas record low indices of access to basic services such as health and
education (Little and McPeak, 2014). As a result of spatial marginalization, pastoralists seldom
feature as a priority stakeholder group in the planning horizon of the political class and policy
makers.

6
Building resilience, that is the ability to cope with shocks while maintaining stability in asset
endowment, has considerable potential for sustainable development. Coping strategies are
important in the recovery process after a shock as they may either help a household escape the
poverty trap or fall even deeper into destitution and misery. Thus, pastoralists need to be
supported in order to realize the sense of inclusivity in development and poverty reduction.
The FAO (2012) observes that one sustainable approach to building pastoralists’ resilience is by
livelihood diversification, which may take the form of agro- pastoralism and herd diversification.
Antle (2009) noted that a household with diversified livelihood activities has a better capacity to
cope with shocks. Also, supporting and incorporating pastoralists’ indigenous knowledge into
livelihood strategies and intervention measures can contribute to local empowerment and
sustainable development (Dinucci and Fre, 2003; Alan 2000). In the Kenya national livestock
policy (Republic of Kenya, 2008), the government together with other stakeholders pledged to
support pastoralism and agro-pastoralism while encouraging diversification of the pastoral
economy to hedge pastoralists’ livelihoods against vulnerability to droughts, floods and conflicts.
This is through irrigation to make more land arable, breeding programmes to improve the
livestock quality, free primary education and better access to basic services such as health, water
and sanitation. The extent to which these interventions contribute to people’s livelihood
resilience needs to be understood so as to guide investments in similar initiatives.
1.2 Statement of the Research Problem
West Pokot County in Kenya has been facing recurrent and prolonged droughts. During such
spells, acute pasture and water shortages lead to deterioration of livestock conditions and thus
cause a vicious cycle of seasonal fluctuations in milk and meat production. The early warning
bulletin by the National droughts management authority (NDMA, 2016) showed that by
December 2016, the county had a record VCI of 22.87 against the recommended index of at least

7
35, indicating a moderate vegetation deficit. The arid regions had a much lower index of 13.62,
indicating a severe vegetation deficit. This trend worsened and by March 2017, the county had a
record low VCI of 15.57. This had negative implications on the pastoral community. An
undisclosed number of livestock deaths were reported. Drought comes with the challenge of
water unavailability and households have to travel an average of 4 kilometers to get water
(NDMA, 2017).
Additionally, population growth, resource competition and institutional changes such as defined
property rights on land ownership have significantly reduced land accessibility for grazing.
Former grazing areas have been fragmented and allocated for cultivation and settlement. This
hampers transhumant movement, which is crucial for survival and thus causing pressure on the
pastoral system (CIDP, 2013). These changes render the pastoral farmers vulnerable to food
insecurity and make it hard for them to break from the viscous cycle of poverty.
The promulgation of the new constitution in Kenya in 2010 gave rise to devolved governments
where the primary focus is to decentralize resource allocation to priority development matters at
the local community level rather than holding the resources at the national level (CIDP, 2013;
Orina-Nyamwamu, 2010). In West Pokot, investment of resources has been prioritized to
transform the pastoral production system from cultural and subsistence focus to more market-
oriented enterprises. In this regard, West Pokot County priority areas include improving the
breeding stock, pasture production, utilization and conservation, livestock vaccination, value
addition of milk, livestock disease eradication, construction of coolers and milk processing
plants, establishment of pastoral training centers, market infrastructure development and an
export abattoir at Nasukuta in Chepareria (CIDP, 2013). International organizations such as the
Food and Agriculture Organization of the United Nations (FAO) and non-government

8
organizations (NGO’s) such as Kerio Valley Development Authority (KVDA) and Action Aid
have partnered with the county government to provide interventions aimed at building resilience.
These include fruit growing, bee keeping and camel rearing. However, the extent to which
pastoralists have taken up these opportunities and the effect on their resilience has not been
documented.
Incorporating indigenous knowledge in external interventions has the potential of producing
desirable results in improving households’ resilience to shocks. However, indigenous knowledge
and practices of the people of West Pokot and their effect on building resilience has not been
empirically documented. This study therefore sought to analyze the role of indigenous
knowledge and external interventions in building pastoralists’ resilience to drought and related
shocks.
1.3 Objectives of the study
The purpose of this study was to assess the contribution of indigenous knowledge and external
interventions through the county government and other stakeholders in building pastoralists’
resilience to drought and other related shocks in West Pokot County. The specific objectives of
the study were to:
• Characterize pastoralists’ livelihood strategies, shocks experienced and coping
approaches
• Assess the pastoralists’ indigenous knowledge and uptake of external interventions
• Analyze effects of indigenous knowledge and external interventions on household
resilience to shocks
1.4 Research Hypotheses
The following hypotheses were tested:

9
There is no significant difference in livelihood strategies, shocks and coping approaches
among different households
External interventions and indigenous practices do not have any significant effect on
household resilience to shocks
1.5 Justification
The first, second and thirteenth sustainable development goals of the United Nations
Development Programme (UNDP) are geared towards eliminating poverty and hunger and
building resilience towards climate change. People in drought prone areas are vulnerable and
thus unable to meet basic needs for safe lives on earth. There is therefore a critical need for
resilience policies that support climate change adaptation and stabilize livelihoods.
Understanding resilience indices and determinants in West Pokot is seen as a useful contribution
towards achieving the above development goals.
The 2014 Malabo declaration on African agriculture and CAADP emphasize African
governments’ commitment to accelerating agricultural growth and transformation for shared
prosperity and improved livelihoods. The sixth goal in the declaration is to enhance resilience in
livelihoods and production systems to climate variability and other shocks. This study provides
insights for different stakeholders to understand the challenges faced by pastoralists, their own
efforts to overcome them and the necessary support they need. This will help in the formulation
of more sustainable policies that will enhance pastoralists’ resilience and lead to the attainment
of this goal.
There is a general cultural change in many pastoralist societies. These changes include
population growth, urbanization, livelihood diversification, global economic integration and
cultural changes. As hypothesized in the evolutionary theory of land rights (Cotula, 2007), these

10
changes act as push factors to individualization and commercialization of land rights and the
erosion of customary institutions. As a result, pastoralism is becoming more sedentary and even
incorporating other livelihood options such as farming. This is a major change in production
systems and there is still a knowledge gap in management especially for the livestock-based
agro-pastoral systems. By comparing resilience indices across households, vulnerable
households can learn from more resilient households on their management practices that make
them cope better with shocks. This knowledge is useful to the people of West Pokot during this
livelihood transition process (Verdoot et al., 2010).
1.6 Organization of the thesis
This thesis is organized in six chapters. The research issue and objectives of the study have been
explained in Chapter one. Chapter two provides a review of the relevant literature, while the
methods, results and key conclusions are discussed in Chapters three, four and five, which are
presented in paper format focusing on each specific objective. The final Chapter (six)
summarizes the main findings, policy implications and offers some suggestions for further
research.

11
CHAPTER TWO
2.0 LITERATURE REVIEW
2.1 Overview of Pastoral Livelihoods and Emerging Trends
Pastoralism depends on the use of natural forage; mainly pastures and shrubs. Availability of
grazing land dictates the herd movements. Pastoralism could either be nomadic with random
movements with the herd or transhumance where there are seasonal movements following
predetermined routes. Herd diversity is an important feature of traditional pastoral systems where
pastoralists keep different types of herds that do well under different climatic conditions. This
production system accounts for over 70% of total livestock production in Africa (WISP, 2010).
There are major transformations going on in the pastoral systems in Africa. Pastoral communities
that were initially nomadic now have less transhumance movements and are likely to own
homesteads. This is due to high population density, leading to loss of key pastoral resources of
natural pastures as people encroach into grazing lands for settlement and institutional changes
such as clearly defined property rights, individualization of land tenure and the acquisition of
formal education, which erodes local customs and practices (Cotula, 2007).
Thornton et al. (2008) noted that this transition from nomadic to agropastoralism will continue
even in the years to come and could be viewed as a challenge or opportunity in different
pastoralists’ domains. The extent of sedentarization varies in different contexts and
environments. In West Pokot too, there is a livelihood transition and a more settled agro-
pastoralism system is becoming more prevalent than nomadic pastoralism (Nyberg et al., 2015).
Previous studies in West Pokot have shown an increasing trend in sedentarization especially in
the semi-arid regions of the county where pastoralism is incorporated with other livelihood
activities such as trade and crop farming (Geutjes and Knutsson 2014; Gronvall 2015).

12
This transition presents challenges such as restriction of livestock mobility that is important to
pastoralists’ livestock survival (Flintan, 2012), erodes traditional livelihoods, cultures and values.
On the other hand, new opportunities emerge, for instance increased demand for livestock
products as a result of population growth and urbanization and thus need for external
interventions to strengthen local knowledge in managing livestock, coping with shocks and
seizing emerging opportunities within the new sedentary frontier.
2.2 Emerging Trends in Livestock Marketing
The demand for livestock products for consumption rises with purchasing power. The effect of
increased income on consumption is greatest among lower and middle-income populations
(Aklilu, 2008). With increased market integration as well as emergence of new marketing
channels in Sub Saharan Africa (SSA), demand for livestock and its products, especially meat is
expected to rise from the current average of 5 tonnes to at least 13 tonnes by the year 2025
(Delgado, 2003 and Shibia et al., 2016). Bett et al. (2012) noted an increase in per capita meat
consumption in Kenya, with beef being the most preferred meat and projected an annual per
capita consumption of 40kg by the year 2050. The rising demand is supposed to induce
competitiveness of livestock producers and production systems in order to meet the market
supply requirements (Delgado, 2003).
It is estimated that on average, Kenyans have an annual per capita consumption of 15kg of red
meat, making the annual consumption to be approximately 600,000 metric tones (MT). The
mean is higher in major towns of Nairobi, Mombasa and Kisumu, accounting for over 17% of
the total consumption (Shibia et al., 2016). Nairobi County has the highest per capita annual
consumption of over 20 kg of red meat and has a population of over 3 million, making it an
important domestic market for meat. Approximately 27,839 cattle, 71,555 sheep and goats, and 685

13
camels are needed to meet this demand. Animals supplied to Nairobi come from the ASALs, West Pokot
being one of the biggest suppliers. However, because of a shortfall in supply, about 30% of the livestock
is imported from Ethiopia, Somalia, Tanzania and Uganda (Farmer and Mbwika, 2012). The existing
high demand of livestock is an opportunity to the supplying counties to market more quantity and thus
earn more as long as they meet the quality requirements.
The domestic market can be categorized into low, medium and high end market. The low-end
market comprises the highest share of the meat market. The middle segment of the market
butcheries are found in the medium-income residential areas and are mainly patronized by the
medium-income group while the high-end market is characterized by high-quality meat from
well-finished animals mainly from ranches and by choice-cuts that are priced differently. High-
income consumers are more likely to buy value added beef such as choice-cuts and beef sausages
than middle-and low-income consumers, and are more likely to purchase meat from high-end
markets such as supermarkets and high-end butcheries (Farmer and Mbwika, 2012).
2.3 The Resilience Concept
According to Walker et al. (2004), resilience is the ability of a system to withstand shocks and
reorganize while undergoing change so as to still return to its original function and stabilize.
Walker and Salt (2006) further noted that in as much as changes occur, they are easily ignored or
resisted and this increases vulnerability and even makes people to forego emerging opportunities.
As a result, options become limited. However, a resilient system is able to organize itself in a
way that makes it adapt and capitalize on the opportunities arising from emerging changes
(Carpenter et al., 2001).
Carter et al. (2012) and Ellis (2000) noted that a vulnerable household has a few buffers against
contingencies and in case of disasters such as drought, crop failure, famine, sickness or social

14
shocks, the household becomes worse off. This situation coupled with poverty, powerlessness,
physical weakness and isolation (‘clusters of disadvantage’) further interlock and cause a
deprivation trap or viscous cycle of poverty. For them to come out of this deprivation trap, the
process that leads them to deprivation needs to be slowed down, halted and turned to a resilient
pathway.
Adaptability on the other hand is the capacity to fit in changed circumstances influenced by
learning, combining experiences, knowledge and adjusting accordingly, while maintaining
stability (Berkes et al., 2003; Walker et al., 2004). This ability enhances livelihood opportunities
and builds assets and capabilities for the current and future generations, thus creating sustainable
livelihoods. This enables households to cope with shocks in their domains and may lead them to
explore innovative ways of overcoming the challenges experienced.
Agricultural adaptation is crucial as it enables farmers counter the effects of shocks in a system
(Antle, 2009). In livestock production, previous studies suggest that adaptive strategies such as
stocking improved breeds, enclosing grazing land, growing and conserving fodder crops help to
improve livestock productivity in the wake of shocks. Butt (2010) noted that fencing or
enclosing land for grazing reduced distance walked by livestock. By having livestock feed
available, households with enclosures record low transhumant movement and increases time
available for grazing since they only graze within the enclosed systems (Geutjes and Knutsson,
2014). Reduced movement enables livestock to gain marketable weight fast and increase milk
productivity as less energy is spent in walking.
WISP (2010) found out that pastoralists can cope with droughts by use of emergency fodder,
pasture enclosures, destocking weak livestock and herd diversification as well as keeping locally

15
adapted breeds. Turner et al. (2014) and FAO (2012) noted that transhumant movements enable
pastoralists to effectively respond to changing pasture availability patterns. Transhumant
movement enables pastoralists to avoid shocks since livestock is moved before the onset of
droughts or outbreak of diseases (Flintan, 2012). Local knowledge guides these migratory
patterns. The same view is shared by Nori and Davies (2007) who conclude that besides being a
means of livelihood, pastoralism is an adaptive mechanism to the ASALs.
Indigenous knowledge (IK) is the knowhow possessed by local people that enables them to make
decisions and live in a given environment (Gorjestani, 2004). This knowledge meets the needs of
the local people and is very creative and often static. Pastoralists utilize IK in livestock
production and ethno-veterinary. Practical application of IK can be in form of seasonal
migration, herd diversification, traditional methods of pasture conservation and treatment of
livestock diseases (Dinucci and Fre, 2003). Supporting pastoralists’ IK and making it part of
development projects intended to build resilience can enhance their participation and thus make
development projects more sustainable (Selemani et al. 2012; Alan, 2012).
2.4 A Review of Previous Studies on Indigenous Knowledge, External Interventions and
Resilience
Various studies have documented IK and practices in the various contexts. Dinucci and Fre
(2003) describe the indigenous practices such as herd naming, identification and ethno-veterinary
practices among the Beni Amer pastoralists’ community in Eritrea. Selemani et al. (2013)
describe indigenous institutions in managing ngitili, communally-owned grazing land such as
collective maintenance of the land and penalty on those violating the rules of access. Abate
(2016) describe how indigenous knowledge guide seasonal transhumant movement, leading to
effective management of Ethiopian rangelands. The current study contributes to this body of
knowledge by assessing the effect of these practices on household resilience.

16
Previous studies have shown that proper farming practices enable farmers adapt to climate-
related risks. Farmers come up with these practices themselves or adopt them through supporting
external interventions. Mulwa et al. (2015) assessed the effects of early planting, growing
drought-, disease- and pest-tolerant varieties, water and soil conservation and crop diversification
in mitigating climate-related risks in Malawi. The study found that the farm characteristics such
as soil fertility, access to credit and dissemination of climate-related information motivate
farmers to adopt several adaptation practices. Other authors (Huang et al., 2015 and Maguza-
Tembo et al., 2016) also noted that proper farm practices help in mitigating climate-related
shocks.
Robinson (2009) found that the Gabra pastoralist community in Kenya adapt to shocks such as
drought by stocking resilient animal breeds, seasonal mobility, herd diversification and storing
some pastures for use in dry season. However, he noted that there were new challenges such as
human population growth and global climate change that were posing a vulnerability threat and
at that moment the community was dependent on food aid. Other studies (Alinovi et al., 2010;
Opiyo et al., 2014 and Ngigi et al., 2015) similarly show that many pastoral livelihoods are less
resilient to shocks compared to other livelihoods. There is an urgent need to take steps that
would rebuild their resilience.
Efforts made to build resilience bolster households’ ability to absorb, adapt and recover from the
negative impacts of shocks such as natural disasters, conflicts and economic instability. This
helps in protecting livelihoods and supports economic and social development. Resilience
building stabilizes livelihoods and reduces humanitarian emergency response to recurrent shocks
that often affect millions of vulnerable households (Pain and Levine, 2012).

17
Several studies have attempted to measure resilience. Keil et al. (2008) used a reduction in
expenditure for basic necessities as a proxy for resilience after the El Nino Southern Oscillation
(ENSO) drought in Indonesia. Using Principal Component Analysis (PCA), underlying variables
that aggregate consumption were computed. Resilient households had smaller variation in
consumption indices before and after the drought than vulnerable households. Alinovi et al.
(2008) and (2010) used PCA with assets, income, access to food, adaptive capacity and access to
basic services as components for analysis to asses resilience to food insecurity in Palestine and
Kenya respectively. These components are outlined in the FAO resilience measurement
framework (FAO RIMA–II, 2016). Each component had sub-components - for assets, tropical
livestock units (TLUs) and land owned were measured, for income and food access, income and
expenditures, expenditure on food and diet diversity were considered. Access to health,
education, water, electricity and security were analyzed and income diversity, level of education,
dependency ratio and other coping strategies were considered for adaptive capacity. Households
with more income and assets were more connected and had better access to food and basic
services and in turn had a higher resilience index than the counterpart households. In Alinovi et
al. (2010), the study population was categorized into livelihood groups. It was noted that
pastoralists had the lowest resilience index.
Other studies have adopted the approach of Alinovi et al. (2010) to measure resilience using
other indicators and stratifying the study population into livelihood groups for comparison. Ciani
and Romano (2013) applied this approach to measure the resilience of rural households affected
by Hurricane Mitch in Nicaragua in 1999. Mulat and Negussie (2010) studied Ethiopian
households’ resilience to food insecurity. The study used the PCA method to estimate household

18
resilience scores, with the key variables being grain held in stock, in-kind precautionary savings,
investment in child education and participation in mutual aid association. It was reported that
Ethiopia’s sustainable resilience to food insecurity was positively and significantly correlated
with land under cultivation, ownership of oxen, milking cows and transport animals, use of
improved technologies and membership in traditional saving groups.
The present study contributes to the literature by assessing how pastoralists’ IK and the external
intervention programmes contribute to their resilience.
2.5 Conceptual Framework
As shown in Figure 3, this study is underpinned by the sustainable livelihood framework (DFID,
1999). Pastoralists’ vulnerability is evidenced from the shocks they experience such as droughts
and livestock diseases (FAO, 2012). These shocks result in losses in form of livestock death and
quality deterioration. The structures and processes are embodied in the formal and informal
institutions that enable or inhibit the resilience of individuals, households and communities.
Being custodians of indigenous knowledge, pastoralists manage to cope with these shocks in
ways such as seasonal migration, herd splitting and livestock feed supplementation. However,
external interventions are required to boost pastoralists’ own coping mechanisms. These include
investments by the county government and other NGO’s towards the pastoralist sector in fodder
production and conservation, improving breeding stock, promoting establishment of enclosures,
camel rearing, bee keeping and growing fruits. This study considered the role of intervening
structures and processes brought about by pastoralists own IK and external interventions in
building pastoralists resilience.

19
Figure 3: A Framework for Understanding Pastoralists’ Resilience in West Pokot
Source: Adapted from DFID Sustainable Livelihood Framework (1999) .
Vulnerability context
Shocks, effects and coping strategies in
pastoralist’s domain
Intervening structures and processes
-Indigenous knowledge and external
interventions
Resilient outcomes
-Increased income and asset base
-Improved access to services
-Better adaptive capacity to shocks
-Better physical and economic connectivity
Factors building pastoralists resilience
Demographic factors - age, gender, off farm income, years of
schooling of household head
Institution factors – access to credit, access to extension,
support from social safety nets, participation in governance
institutions
Proximity to basic services- distance to water, health care
and market
Indigenous knowledge and practices – pasture conservation,
planting drought tolerant varieties, post harvest use of fields
External interventions – Enclosing grazing land, bee
keeping, camel rearing, vaccination

20
Pastoralists’ adaptation through own IK and external interventions has the potential of
transforming their production from subsistence to more market-oriented system, raise income
and welfare (WISP, 2010). Pastoralists’ own IK and external interventions brought about by the
devolved county government together with other partners are the intervening structures.
Resilience is measured by proxy variables such as income, assets and access to basic services,
physical and economic connectivity and adaptive capacity (FAO – RIMA, 2016). These
outcomes are used to compute the resilience index of each household.
After constructing the resilience index, the effects of demographic factors, institutional factors,
household proximity to basic services, indigenous practices and the external intervention
practices on the resilience index were estimated.
2.6 Theoretical Framework
This study is based on the theory of induced innovation which was first hypothesized by Hicks
(1932). He proposed that a change in prices of factors of production is sufficient to spur an
innovation of any kind meant to economize the use of the factor that becomes expensive. More
improvements and modifications have since been made to the theory. Hayami and Ruttan (1985)
hypothesized that innovations and development of new technologies are spurred (induced) by a
change in resource endowments so that the technology helps in substituting a relatively abundant
factor of production for a relatively scarce one. The fundamental insight of this theory is that
investment in innovation in agriculture is a function of change that enters into the farm’s
production function. Worthwhile to note, is that innovations in agriculture do not evolve with
respect to climatic conditions alone; non-climatic factors, such as economic and political
environment, have significant implications for innovation and adaptation to new agricultural
practices.

21
On the agriculture-climate change nexus, Rodima-Taylor et al. (2012) noted that farmer
innovations that are needed to respond to potential threats of climate are a function of change.
Such changes include heat stress to both crops and livestock, which alter normal crops and
livestock development. These changes therefore trigger institutional innovation to reinforce
adaptation through research and development. Farmers will also seek new knowledge to
overcome these new changes in their domains. Rodima-Taylor et al. (2012) noted that climate
change motivates farmers to innovate and to eventually adapt to a new frontier.
Carter (2009) criticized the theory of induced innovation by arguing that changes in resource
prices alone are not sufficient to spur innovation. Factors such as risk and the inelastic nature of
supply of agricultural factors of production hinder innovations meant to respond to resource
scarcity and needs. Chhetri (2011) concurred that public action can indeed spur induced
innovation through research funding and diffusion of agriculture technology. Following the
induced innovation theory, the present study sought to asses if shocks in West Pokot county have
motivated pastoralists to seek new coping strategies such as use of own IK and external
interventions.
2.7 Study Area
The study was conducted in Chepareria, Kongelai and Kacheliba livelihood zones in West Pokot
County, Kenya. It covers an area of 9,169.4 km2. According to Kenya’s 2009 census, the county
has an estimated population of 512,690 persons. Rainfall varies from 400mm to 1,500mm per
annum while temperatures range from 10 °C to 30 °C. Communities in West Pokot County
practice agro-pastoralism, combining mixed farming with nomadic pastoralism. Over 90% of the
population relies on pastoralism for food and income.

22
West Pokot residents have relatively high levels of under-development; the county indices on
poverty, illiteracy and other welfare indicators are worse than the national’s average and the
recommended levels. For example, food poverty is nearly 70%, illiteracy is 60% and infant
mortality is almost 13% against the national average of 50%, 40% and 5%, respectively. At least
60% of the population in West Pokot County can’t meet their annual food requirements and thus
efforts are needed to halt and reverse this trend (CIDP, 2013).
Chepareria has a semi-arid climate and thus supports agro-pastoralism, while Kongelai and
Kacheliba have arid climate and thus the major livelihood activity is nomadic pastoralism
(Figure 4). Livestock plays an important role in Pokot households. Over 90% of the population
in West Pokot County depends on livestock directly and/or indirectly to meet their needs
including provision of food and income needs, besides their cultural importance such as payment
of bride price and gifts (CIDP, 2013).
Figure 4: Illustration of the Study Sites
Source: CIDP (2013).

23
2.8 Sampling and Data Collection
Data was collected on shocks, coping mechanisms, indigenous knowledge and external
interventions using a combination of methods namely; a focus group discussion (FGD) key
informant consultations and individual household survey on 191 households. The data collection
was done from December 2016 to February 2017. Participants of the FGD were pastoralists with
over 20 years experience who provided information on the changes and challenges the
community has been undergoing. Youth pastoralists (7) and an officer from the county extension
department were also included in the FGD. Semi-structured checklists and questionnaire were
used to conduct the FGD, key informant interviews and individual household survey. Of the 22
participants in the FGD, 6 were women.
Household survey data was collected from 191 respondents. Two stage sampling procedure was
employed. In the first stage, sampling was purposively done to capture the arid and semi-arid
locations for a livelihood comparison between the two areas within West Pokot, Kenya. In the
second stage, the villages and households within the locations were randomly selected. A total of
19 sublocations were studied across the locations. These were Asilong, Chepareria, Chepkopegh,
Kacheliba, Kipkomo, Kitelakapel, Kolopot, Kongelai, Korrelach, Lateg, Nakuyen, Orolwo,
Pertum, Riwo, SLA, Suam and Ywalateke. The sample size was calculated as follows:
………………………………………………………………………………………………………………………………………………………………(1)

24
Where n is the sample size being determined, p is the proportion of the population in the
determined study areas that would be available to participate in the interview, Z is the confidence
interval and E is the margin of error.
Since p is unkown (especially in the study sites where most households’ decision makers had
moved with their livestock to other areas during the time of the study), p value is set at 0.50 as
this would give an optimum sample size, with Z being 1.96 and E 0.07 (Anderson et al.,2007).
This gives an optimum sample size of 196 as follows:
…………………………………………………………….……………………………………………………………………………………………….(2)
The sample size of 196 is closer to that used in related previous studies such as Selemani et al.
(2012), Ghorbani et al. (2013), Ngigi et al. (2015) and Abate (2016).
Due to time and financial resource constraints, the survey fell short of 5 respondents and only
191 households were interviewed. Data on households’ demographic characteristics, indigenous
knowledge and practices and external interventionist practices were captured. The household
survey was conducted through face-to-face interviews. This is a better method compared to
telephone or email because it allows for clarification of matters by both the interviewer and the
respondent and thus provides the chance to obtain more accurate data (Bateman et al., 2002). The
interviews were conducted with the help of 3 well-trained enumerators and field guides who
assisted with the translation of the local language. Household heads, their spouses or household
25
members over 18 years old who had lived in the household for at least 1 year and were familiar
with the daily household activities were interviewed.
In the subsequent chapters (3, 4 and 5), the data is analyzed and presented in research paper
format corresponding with the specific objectives of the study. Data was analysed using SPSS
version 20, STATA version 14 and Microsoft Excel softwares.

26
CHAPTER THREE
Characterization of Pastoralists’ Livelihoods, Shocks and Coping Strategies
Abstract
At least 1/3 of the earth’s surface is under drylands. Over 80% of Kenya’s land surface is
categorized as Arid and Semi-Arid Lands, (ASALs), where the main economic activity is
livestock keeping through pastoralism. In Kenya, pastoralism account for over 70% of total
livestock production. However, the ASALs are very vulnerable to climate shocks especially
droughts. Climate change is a major concern for the livestock subsector particularly from ASALs
areas that are greatly impacted by climatic events. The objective of this paper was to characterize
the pastoralists’ livelihoods, the shocks experienced and the coping strategies employed to
overcome the effects of these shocks. Data from FGD, Key Informant Interviews and 191
households was qualitatively analysed. The socio demographic characteristics showed that most
households had low income levels and low indices of human capital development through formal
education. Droughts, livestock diseases and market shocks were the main shocks affecting
peoples’ livelihoods. Though households utilize their savings and assets to cope with shocks,
external interventions become necessary. This necessitate investment in human capital
development through formal education, and creating an enabling environment for on and off
farm investments that will raise household incomes as well as other interventions that will build
a production system that is resilient to shocks.
Key words: Pastoralists livelihoods, Shocks, Coping strategies

27
3.1 Introduction
Over 40% of the land surface on earth is categorized as drylands or ASAL’s (Bastin et al.,
2017). The main economic activity in SSA’s rangelands is pastoralism, which supports over 25
million people to meet income and food needs (WISP, 2010). Pastoralists derive over 50% of
their food and income needs from livestock. Pastoralism is characterized by extensive grazing
and transhumant movement across the rangelands they occupy (IIR and CTA, 2013).
Transhumant movement enables pastoralists to access grazing areas available during dry season,
avoid areas infested by diseases and parasites and conflict-prone areas, access minerals and herbs
that provide ethno-veterinary properties to livestock (Flintan, 2012; Little and McPeak, 2014). In
Kenya, pastoralism is the main livelihood activity for over 80% of the ASAL’s population.
According to the West Pokot County development plan (CIDP, 2013), at least 90% of the
population has strong cultural attachment to pastoralism as a way of life, besides enabling them
to meet their food and income needs.
Many rangelands face challenges posed by a combination of environmental and socio-economic
factors, such as population increase, climate change, landscape fragmentation, resource conflicts
and urbanization (Cotula, 2007). These challenges have multiple consequences such as
individualization and commercialization of land rights and the erosion of customary institutions
of rangeland governance that was openly accessed for grazing. Climate change brings with it
vagaries such as prolonged seasons of drought, erratic rains and increased prevalence of
livestock diseases (Little and McPeak, 2014). These challenges and shocks undermine
pastoralists’ resilience and threaten the survival of pastoralism and thus measures required to
build pastoralists’ resilience need to be considered in policy making processes.

28
Several studies have documented pastoralists’ exposure to shocks (Tesso et al., 2012; Opiyo et
al., 2014 and Ngigi et al., 2015). The most common shocks that pastoralists are exposed to are
droughts, livestock diseases and loss of grazing resources. Different shocks affect households
differently and call for different coping mechanisms. There is little evidence in literature on the
effects of and how households cope with each shock. This paper contributes to this body of
knowledge by isolating effects of shocks and how households cope with each particular shock.
3.2 Objectives and Methodology
The objective of this paper was to assess the demographic and socio economic characteristics of
households, their exposure to shocks and their coping strategies in West Pokot County, Kenya.
Data from the focus group discussion, Key informant interviews and individual household
interviews was qualitatively analyzed. The focus group discussion and key informant interviews
provided data on the historical trends on the transitions in the drylands, occurrence of shocks and
how pastoralists cope with them. The findings are summarized in table 2 below.

29
Table 2: A Historical perspective of pastoral livelihoods changes from 1980 to 2016
Livestock Migration Markets Governance
Institutions
Land use Culture
Ma
in c
ha
ng
es f
rom
19
80
– 2
01
6
Adoption of
improved breeds
such as Sahiwal dual
purpose cow, gala
goats and doper
sheep
More prevalence of
cattle diseases than
before
Rise in conflicts
among pastoral
communities
In Kapenguria,
Sigor and
Ortum, there has
been an influx
of people.
Reduced
transhumant
movements
Expansion of the
Chepareria
Livestock market.
New buyers from
distant markets e.g.
Nairobi
New markets for
maize, onions and
fruits
Increased number of
both government
and non government
organizations –
FAO, Peace and
Conflict Resolution
organizations and
Community-based
Organizations
Devolved
governance
Increased number of
community based
organizations
supporting women
Increased
number of
settlers around
Kapenguria,
Ortum and
Sigor
necessitates the
construction of
rental houses
Crop
production at
Weiwei and
Kongelai.
Gradual shift
from nomadic
to agro-
pastoralism
Reduction of
female genital
mutilation
(FGM) practice
Key
dri
ver
s o
f ch
an
ge
Increased demand for
milk necessitates
improved breeds.
Poor maintenance of
existing cattle dips
Increased incidences
of drought reducing
pasture availability
New businesses
opening up such
as banks.
Boundary
demarcation and
settlement of
people in
communally
accessed pasture
grounds
Increased number of
livestock buyers
Advocacy/promotion
of fruit production
by FAO, VI-Agro
forestry and West
Pokot County
government
New Country
constitution that
gave rise to
devolved
governance –
Ease of service
provision such as
extension in
community groups
Population
increase across
business
centres
Investment in
irrigation by
the national
government,
National
Cereals &
Produce Board
and Kerio
Valley
Development
Authority
Migration and
settlement in
former
transhumant
paths
Free Primary
Education
Enforcement of
anti FGM
legislation
Source: Survey Data (2017)

30
As shown in table 2, the major change in livelihood activities in West Pokot is a transition from
pure nomadic to a less transhumant pastoral system. Recent studies in West Pokot ( Nyberg et al.
2015; Verdoot et al. 2010) made similar observations. However, this transition is more prevalent
in highland regions of West Pokot; Kapenguria, Lelan, Chepareria and Sigor as opposed to the
extremely dry areas of Alale and Masol. A change in herd composition too has been noted over
the years where the pastoralists incorporate improved Sahiwal cattle, Gala goats and Dopper
sheep in their herds. These breeds offer double advantage; they are well adapted to the harsh
ecological zone of West Pokot and yield better than the traditional Zebu cattle and local goats
and sheep (WISP, 2010). However, incidences of livestock diseases have been on the increase.
This is largely attributed to climate variability as some diseases are more prevalent during
extremely dry periods and others during heavy rains. Similarly, the IPCC (2014) noted that as a
result of global climate change, plant and animal diseases are expected to prevail more than it
was before.
As expected from the induced innovation theory (Hayami and Ruttan, 1971), expansion of
business centres in West Pokot has created demand for residential units since rental returns are
higher than farm proceeds. Elsewhere in Weiwei, farmers under the Lord Aggrey irrigation
scheme benefit from being Kenya Seed Company’s maize seed out-growers. Farmers in Sigor
and Lomut are also benefiting from a project by the Food and Agriculture Organization of the
United Nations (FAO) that is promoting pawpaw, mangoes and water melon fruits production by
offering seeds and extension services at a low cost.
A major culture change observed in the area is the reduction of incidences of female genital
mutilation (FGM). This is due to the enforcement of anti-FGM regulations, and awareness
campaigns to stop the practice. The compulsory free primary education program has also played

31
a role in stopping FGM and promoting a more sedentary lifestyle as children have to attend
school. Other drivers of change are the devolved county government that has brought services
closer to the people and emerging markets for livestock and its products.
3.3 Characterization of households by demographic and socio-economic attributes
As shown in Table 2, most (82%) of the respondents were male. This is because in many pastoral
communities, men make important household decisions on production and marketing (Markakis,
2004). Also, according to the Pokot culture, women are more reserved and skeptical to talk to
strangers especially on livestock matters.
Table 3: Sample Respondents’ Characteristics
Variable Data category t-statistic
Arid area
n= 104
Semi-arid
area
n= 87
Pooled
sample
n=191
Average age (years) 45.7 47.0 46.2 (10.88) 0.8170
Gender of respondents (Percentage male
respondents)
80 83 82 0.3953
Average number of years of completed formal
education
3.9 6.4 5.0 (4.3) 3.9654**
Number of household members (average) 5.1(4.3)
Average dependency ratio 0.60 0.55 0.58 (0.008) 2.6698**
Average household total annual income (Kshs) 119014.0 167034.0 139143.9
(136205.00)
2.4435**
Average per capita annual income (Kshs) 16109.0 23093.0 19290.4
(17033.23)
2.8757**
Average years of practicing pastoralism 15.7 11.7 13.9(9.48)
Average land size (acres) 3.4 4.3 3.8 (3.76) 1.6201
Possession of title deed 10.0 63.0 35.0 9.0840**
Average Tropical Livestock units (TLUs) 15.8 8.5 12.5 (10.43) 5.1870**
Planned transhumant migration (% yes) 82.0 10.0 71.0 13.9049**
Households accessing communally owned pasture
grounds (% yes)
89.0 9.0 52.0 19.0870**
Average transhumance distance ( kilometers) 29.1 5.5 18.4 (15.4) 16.1578** Notes:** and * represent significant difference between the arid and semi arid areas at 5% and 10%, respectively.
Following WISP (2010), the TLU equivalents for various livestock were considered as: cattle = 1, camels = 1,
donkeys = 0.8, goats and sheep = 0.2 and poultry = 0.04.
1 USD$ was equivalent to Kenya Shillings (Kshs) 100 at the time of the study.
Source: Survey Data (2017).

32
The average experience of households in pastoralism was 13 years. From a mean age of 43 years,
this implies that most households began practicing pastoralism at least when they were adults.
This is consistent with the definition of pastoralism as a way of life for the people (WISP, 2010).
The mean tropical livestock unit (TLU) in this study was about 12 units. However, respondents
in the more arid region had a higher average of over 15 TLUs compared to those in the semi-arid
region who have an average of 8 TLUs. This difference can be attributed to the livelihood
diversity of the agro-pastoralists in the semi-arid region whereby besides livestock, their land can
be used for growing crops and thus the need to reduce herd sizes (Geutjes and Knutsson, 2014).
On the other hand, pastoralists in the arid areas make good use of extensive grazing on their land,
which cannot support other agricultural activities and keep huge herds to cushion themselves
against shocks such as droughts and diseases (Dinucci and Fre, 2003).
The average number of years of schooling was 5 years implying that most of the household heads
did not complete primary school education which takes 8 years. This is consistent with the
observation by the Kenya National Bureau of Statistics (KNBS) and Society for International
Development (SID), that over 50% of residents in West Pokot County had no formal education
(KNBS and SID, 2013). This implies that pastoral households are less endowed with formally
trained human capital, and this may have negative implications on livestock production and
marketing; use of rudimentary skills may lead to sub-optimal returns. The dependency ratio
measures the ratio of economically active people to the total household population. The
dependency ratio in the sampled population was 0.58. This can be attributed to the overall
population structure of the county whereby over 50% of the population is between 0 - 14 years
(KNBS and SID, 2013) and thus not economically active.
Figure 5 below shows the various livelihood activities that the pastoralist households in West
Pokot engage in.

33
Figure 5: Respondents’ Livelihood Activities
Source: Survey Data (2017).
Over 80% of the respondents derive more than three quarters of their food and income from
livestock. This finding concurs with those by other authors who noted that pastoralists derive
most of their food and income needs from livestock (Alinovi et al., 2010; Opiyo et.al, 2014;
Little and McPeak, 2014). Over 79% of the respondents acknowledged that besides food and
sale, livestock especially cattle play an important cultural role. This is evidenced from over 50%
of the respondents who acquired their initial stock as payment of bride price, ceremonial gifts
and inheritance from parents. In the semi-arid areas, agro-pastoralism is practiced with over 80%
of the respondents growing maize, 58% growing beans, 42% growing sorghum and 14.7%
growing mangoes, in addition to livestock keeping. Other sources of income included burning
and selling charcoal, remittances received from the county government for the elderly and
remittances received from family members working off farm.
The household average annual per capita income is slightly over Kshs 19,000. On average this
translates to Kshs 53 per day which is approximately half a dollar. This implies that most

34
pastoralist households live below the poverty threshold defined by the World Bank (2015) of
USD 1.90 per day. This is consistent with the county development plan that over 70% of the
population is poor and cannot meet their basic food and income needs. This implies negatively
on other development indicators. For instance, infant mortality is about 13% and literacy level
slightly above 50% against the nation’s average of 5% and 60%, respectively (CIDP, 2013). This
necessitates the urgency for external interventions to reverse this trend.
Land in the arid areas is mostly communally owned with only about 10% of the respondents
having private ownership compared to over 60% of respondents in the semi-arid area who even
have title deeds as proof of land ownership. Over 80% of the respondents from arid areas had
access to communally shared pasture grounds compared to less than 10% from the semi-arid
lands. This shows that pastoralism in the semi-arid area is more sedentary than in the arid areas.
These findings concur with Geutjes and Knutsson, 2014) who attribute this sedentarization to
private land ownership in the semi-arid region. The average transhumant distance is 37
kilometers. Respondents from the arid region moved the most with an average of about 60
kilometers compared to about 10 kilometers by those in the semi-arid areas. Turner et al. (2014)
noted that pastoralists can move up to an average of 50 kilometres in transhumance. This enables
them to explore new water and pasture grounds.
3.2 Pastoralists’ Exposure to Shocks and Coping Strategies
Shocks undermine pastoralists’ livelihood resilience. Almost all respondents were affected by
drought-related shocks and 96% were affected by livestock diseases, with the most common
diseases being Newcastle Disease in poultry and Foot and Mouth Disease (FMD) in cattle.
Nearly 60% were affected by market shocks and 42% were affected by crop pests and diseases.
Most crop losses were incurred post-harvest due to weevil attack on stored maize and crop

35
failure due to erratic rains. About one third of respondents were affected by conflicts with the
neighboring communities over water and pasture. In the arid regions, over 20% of the
respondents’ livestock were attacked by wild animals, while 8% of the respondents experienced
death of a household member. Some shocks occur concurrently. Some 87% of the households
noted that most livestock diseases occur during dry seasons and 2% reported that their livestock
got diseases during outward migrations. About 11% indicated that intercommunity conflicts over
water and pastures heightened during dry seasons. These conflicts result in cattle rustling and
loss of human lives. Opiyo et al. (2014) similarly noted that resource conflicts are high in dry
seasons among the Turkana pastoralists in Kenya and these conflicts have multiple negative
effects on households as shown in Figure 6.
Figure 6: Effects of Shocks on Households
Source: Survey Data (2017).
Drought brings about many negative effects. Due to the unavailability of pasture and water,
livestock become emaciated and the quality of their products deteriorates (FAO, 2102). In

36
extreme cases, the livestock die. Livestock are important assets to pastoralists’ households and
quality deterioration or worse still, death becomes a huge blow to livelihoods of the affected
households. Erratic rains and droughts are the major causes of crop failure to agro-pastoralists.
Market shocks experienced were mainly attributed to price and output fluctuations. It was noted
that during seasons of surplus, prices of commodities such as milk, maize and mangoes fell and
due to the perishable nature of these commodities, the households had no option except selling at
very low prices. Cattle traders also complained of middlemen offering very low prices for their
livestock. Similar observations have been noted in other pastoral communities (IIR and CTA,
2013). Most households in the arid areas complained of frequent attacks of their livestock by
wild dogs and hyenas on their livestock during transhumance.
Households cope with the shocks through different strategies (Figure 7).
Figure 7: Coping Mechanisms for Shocks
Source: Survey Data (2017).

37
For most shocks, households utilize their savings and assets to smoothen their consumption
patterns. However, if by doing so, the household depletes or has its assets drop below a
minimum threshold, the household falls into a deprivation trap and may need external
interventions to disentangle itself off the trap (Carter, et al., 2005). Less endowed households
resort to borrowing and even sending part of their family members to stay with other relatives
and friends during drought when the family cannot meet its food needs. Further, planned
transhumant migration helps pastoralists to get water and pasture that enables their livestock to
survive during drought (WISP, 2010). Due to food scarcity, some households resort to use of
edible wild fruit and tree leaves to meet their food needs. Humanitarian assistance in form of
food aid becomes important to these households during such times. Support from social groups is
also important as it helps households to cope when a family member is chronically ill and when
one’s livestock are affected by diseases. This support comes in form of food, cash, labor,
livestock treatment and even helping a household to restock in the event of loss of the entire
herd.
Most households accessing shared water and pasture grounds had agreed to a conflict resolution
mechanism that helped in mitigating cattle rustling. Respondents from the arid region who
shared pasture grounds with the Karamoja of Uganda had an accord that for each livestock
stolen, the culprit had to return it and pay a hefty fine of four more. This had contributed to a
reduction of incidences of conflicts between the two pastoralist communities, albeit at a small
scale but could be enhanced for greater conflict resolution.
3.4 Conclusion and Implications
This paper assesed the demographic and socio-economic characteristics, exposure to shocks and
coping strategies of pastoralists in West Pokot County. The results revealed low indices of

38
human development manifested by limited formal schooling and low per capita income. The
main shocks noted were droughts, livestock diseases and market shocks. It was noted that
although households utilise their savings and assets to cope with shocks, external interventions
are still necessary, especially for less-endowed households.
These findings call for investment in human capital development through formal education. Such
investments should consider the nature of pastoralists’ mobility especially in the arid areas. For
example, establishment of boarding primary schools and school feeding programme can provide
an incentive for pastoralists to take more of their children to school than sending them to other
familiy members in the event of food scarcity.
There is also the need for both on- and off-farm investment incentives that will help raise
households’ per capita income. This can be implemented through infrastructure development that
will open up pastoral areas to markets and investment in value addition of livestock products.
Such infrastructure include transport and communication that will help link pastoralists to
markets.
To be able to gain from market participation, pastoralists need to enhance the quality and
quantity of the livestock produced. Measures such as fodder conservation to smoothen grazing in
times of drought, vaccination to prevent diseases and incorporation of breeds that can survive the
harsh environment but still yield more output can help to improve the quality and quantity of
livestock produced. External interventions to encourage pastoralists’ own investment in these
measures can help to build resilience to shocks.

39
CHAPTER FOUR
4.0 Pastoralists’ Indigenous Knowledge and Uptake of External Interventions and their
Role in Helping Households Manage Shocks
Abstract
Pastoralists are stewards of and users of indigenous knowledge and practices, through which they
are able to make a living in the harsh arid and semi-arid lands (ASALs). However, recurrent
shocks occasioned by unpredictable vagaries of nature undermine pastoralists’ efforts towards
sustainable survival. In recent decades, researchers and development practitioners have explored
strategies to manage shocks in the ASALs especially through introduction of modern scientific
approaches and interventions; for instance promotion of exotic livestock breeds, but these
interventions have not yielded desired results. Recognizing the need for context-specific locally-
acceptable and adaptable solutions to pastoralists’ challenges, the study sought to understand the
indigenous knowledge and practices and the various external interventions and how they both
help pastoralists cope with shocks in West Pokot County, Kenya. Data was collected from key
informants’ interviews, focus group discussion (FGD) and individual surveys of 191 households.
Results demonstrate the value attached to traditional customs, local animal breeds, guided
migratory patterns and sustainable human-environment interactions in adapting to the harsh
environment shocks such as droughts and livestock diseases. External interventions that promote
fruit growing, bee keeping, camel rearing, livestock vaccination, enclosures and fodder growing
help in diversifying livelihoods, availing livestock feed even during droughts and preventing
livestock diseases. These together with local practices enable households cope with shocks
better. We recommend documentation of indigenous knowledge and practices, and their
integration in long-term programs and plans aimed at building resilience in pastoralist systems.
Key words: Pastoralists, Indigenous Knowledge, Local Practices

40
4.1 Introduction
The uniqueness of pastoralists’ social, cultural and economic conditions from other sections of
the national community qualifies them to be identified as Indigenous People (Emery, 2000). As a
result of managing rangelands for livestock production, pastoralists have acquired vital
knowledge, which enables them to manage resources within the rangelands and earn a living
(Mapinduzi et al., 2003). This knowledge is herein referred to as Indigenous Knowledge (IK),
which is the insight possesed by indigenous people that enables them to make a living in a given
environment (Woytek, 1998; Dinucci and Fre, 2003). This knowledge is well adapted to the
requirements of local people and conditions and is unique to a particular culture and society. It
regulates customs and traditions, and is useful for local decision making in agriculture, resource
management and other activities. Contrary to the conventional perception of many practitioners
that IK is old fashioned and archaic, it is creative and incorporates external influence and inside
innovations and thus is always dynamic.
The IK is different from formal knowledge generated by research institutions or private firms.
Formal knowledge is written and easily shared across people, cultures and generations, while IK
is tacit and engrafted in practices and experiences (Emery, 2000). It is worthwhile to note that IK
is more experiental than theoretical and is learnt through repetition. Moreover, IK is exchanged
orally by demonstration through apprentices, parents to children or neighbor to neighbor. This is
only possible where both the provider of IK and the recipient speak similar language and share
cultural practices than across cultures.
Over the last few decades, there has been considerable erosion of IK and practices among many
indigenous communities (Oba, 2009). Due to the erroneous perception that IK is old fashioned
and archaic , it has been disregarded by many practitioners. However, recent studies (Oba, 2009;
Selemani et al., 2013; Abate, 2016) have shown that IK in most communities is innovative and

41
actually help in reducing and mitigating risks. There is therefore a need to preserve IK, its
valuable skills and problem-solving strategies along modern technologies. This requires a clear
understanding of the critical role that IK plays in the overall process of sustainable development
(Gorjestani, 2004).
Recent occurences of droughts and other related shocks such as livestock diseases and inter-
community conflicts, however, undermine pastoralists’ resilience to food security. Previous
studies highlight the need for integrating IK with scientific knowledge in the development of a
common understanding of pastoralists’ livelihoods (Angassa and Oba, 2007; Abate, 2016).
Mutual understanding between local communities and external practitioners will go along way in
identifying best development solutions and innovations to adress challenges such as food
insecurity.
Because of heavy reliance on livestock to meet food and income needs, shocks such as drought
and livestock diseases increase pastoralists’ vulnerability (Opiyo et al., 2014; Ngigi et al., 2015).
Most previous studies have focused on assessing the role of IK in pastoralists’ rangeland
management (Mapinduzi et al., 2003; Oba, 2009; Oba, 2012; Selemani et al., 2012, Abate,
2016). Elsewhere, Dinnucci and Fre (2003) studied the role of IK in livestock management
among pastoralists in Eritrea. There is a striking knowledge gap regarding the role of IK and
various external interventions by the county governemnt together with other development
partners in helping pastoralists cope with shocks. The present study bridges this gap in
knowledge by documenting the IK and the external interventions and how they help pastoralists
manage shocks among the pastoralist community of West Pokot County, Kenya.
4.2 Objective and Methodology
42
The objective of this paper was to find out the local indigenous knowledge and practices and the
external interventions and the extent to which households apply them to manage effects of
shocks. From the review of literature, key informant interviews, focus group discussions and
household surveys, indigenous practices were identified. Individual household data was analyzed
on their local practices and uptake of external interventions. Data was analyzed qualitatively.
The findings are summarized in tables 4 and 5 below.
4.3 Indigenous knowledge and practices among the pastoralists’ community
Table 4 below shows the different indigenous practices used by pastoralist households in both
arid and semi-arid locations to cope with the shocks in West Pokot.

43
Table 4: Indigenous Knowledge and Practices
Indigenous Knowledge and Practices Proportion of respondents applying the strategy (%)
Arid area
(N=104)
Semi-arid
area
(N=87)
Pooled
sample
(N=191)
Proprtion
test statistic
Planned transhumant migration 82.0 10.0 49.2 13.90**
Herd splitting 75.0 22.0 50.8 8.58**
Increasing herd size during rainy seasons 68.0 51.0 60.2 2.5162*
Altering composition of grazers and
browsers in the herd
100.0 82.0 91.6 4.82**
Stocking female-dominated herds 99.0 93.0 96.3 2.19**
Grazing at night 90.0 20.0 58.1 14.06**
Grazing in groups/merging of herds 92.0 21.0 59.7 14.56**
Traditional pasture conservation 23.0 66.0 42.4 6.50**
Use of browse trees 100.0 83.0 92.1 4.63**
Use of wild herbs to treat livestock diseases 94.0 83.0 89.5 2.34*
Use of wild fruits as food 79.0 46.0 63.9 4.98**
Traditional bee keeping 34.0 10.0 22.5 4.19**
Post-harvest use of fields for grazing 86.0 96.0 90.6 2.61*
Planting drought-tolerant crop varieties 49.0 50.0 49.7 0.21
Use of naturally-occuring salt 93.0 68.0 81.7 4.77**
Rotational grazing 84.0 71.0 78.0 2.07*
Penalty imposed on violation of communal
grazing land
88.0 18.0 56.0 13.22**
Naming of livestock 98.0 70.0 85.3 5.88**
Livestock identification by body
nomenclature
94.0 64.0 80.6 5.58**
Branding of livestock 95.0 67.0 82.7 5.32**
Coincide calving to wet season 13.0 51.0 29.8 6.26**
Moving livestock to higher grounds during
wet seasons
67.0 37.0 53.4 4.39**
Controlled burning of pasture to control
pests and diseases
43.0 26.0 35.6 2.44**
Note: ** and *significant difference between the arid and semi-arid areas at 5% and 10%,
respectively.
Source: Survey Data (2017).

44
Planned transhumant migration enables pastoralists to adapt to changing vegetation patterns in
their environment. Transhumance allows herders to access seasonally available resources such as
wet season pastures or dry season forests and evade seasonal stresses such as parasites and
disease outbreaks. Other studies such as Turner et al. (2014) have shown that planned
transhumant migration enables pastoralists to escape shocks such as droughts. Herders take the
livestock to the shared grazing area (ka’ tich) before the onset of droughts and they return at the
start of rains. Splitting part of the herd into smaller groups and moving some of them to new
areas prevents overgrazing. Calves and lactating cows are left as the other part of the herd is
moved. This reduces competition for limited pasture resources and thus ensuring the in-calf,
calves and lactating cows, which cannot walk long distances thrive. A similar observation was
noted in a study of pastoralists’ indigineous knowledge in Eritrea by Dinucci and Fre (2003).
Regarding the herd composition, increasing herd size in wet seasons helps to cushion against
losses during dry periods. Altering herd composition between grazers and browsers also allows
pastoralists to make use of varying quality and amount of vegetation available at different times
(WISP, 2010). During wet seasons, grass is plenty and thus they usually stock more of grazers
(cows and sheep). In the dry seasons however, grass is scarce and thus browsers like goats and
camels thrive well on available trees and shrubs than the grazers. Female-dominated herds offset
the long calving periods, a characteristic of the indigineous cattle and thus ensure stable milk
production. This is because milk is an important part of the pastoralists’ dietary requirement
(Little et al., 2010; Farmer and Mwika, 2012). During drought seasons, herders graze their cattle
at night to escape the intense heat at day time. The herders graze their livestock in groups so as
to provide security to each other in the event of attacks by cattle raiders or even wild animals.
During the day, both the livestock and herders rest under sheds close to water points. This

45
limited movement during the day enables livestock to optimally utilize the little food available
and thus survive in the wake of intense drought. Similarly, Butt (2010) noted that reduced
livestock movement generally increases livestock productivity.
In seasons of surplus forage, pasture and crop residues, and stover are conserved for use during
the lean period. Harvested maize, millet and sorgum residues and grass is cut, dried and stored
on top of trees and will be released in small amounts for livestock use until the wet season. As
shown in Table 3, pastoralists from semi-arid areas are more likely to conserve pastures since
they have incorporated crop production and thus have more crop residues to store. Also they are
more sedentary, with less transhumant movement (average return distance of 10 kilometres)
compared to 50 kilometres for their counterparts in the arid areas.
Browse trees and shrubs that are locally adapted to harsh climate serve as both livestock and
human food. This ensures livestock productivity including milk yield does not fall drastically
during drought period and thus making households more food secure. The respondents
mentioned that besides serving as livestock feed, these trees and other shrubs possess ethno-
medicinal properties to both humans and livestock. Other indigeneous trees such as the tamarind
tree (locally known in the different villages as orolwo/arol, oron/ara and k’nyotwo/k’nyat) that
thrive well produce edible fruits for human consumption. Tamarind and honey are used for
traditional food preservation. Meat cuts are smoked then stored in a mixture of honey and
tamarind juice. This reduces bacterial activity and the meat can last for as long as a year in good
condition. This food is important especially in days of scarcity and for herders who are usually in
transit for long periods. Small amounts of honey are also eaten directly as food as well as for
other purposes such as making traditional beer (mayek) and for treatment of wounds.

46
Honey is produced in traditional log hives that are hung under shady trees especilly along river
banks and other quiet places. Bees have a preference for the traditional log hives made from
indigineous trees (locally known as mokong’wo and koral). The logs from the trees are made
hollow and the inside of the hollow log burnt. These indigenous trees produce an appealing smell
when burnt that attracts bees to the hive. Due to increased demand for quality honey, households
have become creative with the traditional log hive. The hive is partioned into two compartments
to separate the queen from worker bees thus keeping the honey clean as in the modern hives such
as the Kenya Top Bar Hive, but the few respondents having them mentioned that the bees still
prefer the traditional log hives over the modern types.
Agro-pastoralists make good use of their farms after harvesting crops. Livestock are allowed to
graze and feed on the crop residues. At the sime time, livestock drop dung as they graze, which
is useful in enhancing soil fertility. Pastoralists who do not grow any crops make arrangements
with those who do, sometimes as far as in the neighbouring Trans Nzoia county. The farmers
allow the pastoralists to graze catle on their farm in exchange for milk or a goat as a gift. In a few
instances, conflicts arise between the farmers and the pastoralists. Some farmers argue that as the
livestock graze on their fields, soils are compacted and thus become hard to cultivate. Others feel
that livestock dung propagates weeds on their fields.
Relatively older key informants and participants in the FGD recalled that in the previous years,
drought-tolerant crops such as sorghum, millet and cassava were mostly grown. The literature
shows that such crops enhance household food security as well as ability to cope with the
vagaries of weather (Mulwa et al., 2015). However, in the present study it was noted that with
increased demand for maize and its products, many farmers in West Pokot have abandoned the
traditional drought-tolerant crops for maize whose yields are generally low; an average of 4 bags

47
per acre in the arid areas and 8 bags in the semi-arid areas. Such low harvest compared to other
counties that record an average of 15 bags per acre, cannot sustain an average household untill
the next harvest season and thus many households who plant maize still cannot meet their annual
food requirements.
Natural salt sources (ngeny’) are important especially to pastoralists in the arid areas. Livestock
are taken at least once a week to ngeny’ whose rocks are rich in minerals. Some respondents
mentioned that this salt reduces livestock diarrhoea, which is a symptom of many livestock
diseases. However, most of them also reported that livestock pick up foot and mouth disease -
FMD (ngorion), from this source and many have lost part of their herds in this process.
Household who could not afford to buy livestock salt and relied on ‘ngeny’ excusively were the
most affected.
The practice of rotational grazing allows grass and forage to rejuvinate. Transhumant movement
is key to rotational grazing (Turner et al., 2014). More sedentary households divide their grazing
land into enclosures in which animals are grazed in a rotational manner. Grass and other pasture
species can be grown on these enclosures. This ensures there is enough livestock feed to last
through subsequent seasons.
Across most pastoral communities, there are traditional laws that govern the access and use of
communal grazing lands (ka’tich). As in the study area, Selemani et al. (2012) noted that in
Tanzania, the communal grazing land is only accessed during dry seasons. Grazers and browsers
are separated at the shared grounds due to different feed requirements. Theft is not allowed.
Herders violating any of these rules are penalised. Anyone found guilty of stealing is required to
return the stolen animal and a fine of four more animals is imposed.

48
Livestock identification practices play a crucial role at the ka’tich because all livestock from
different herders graze together. Cattle are named according to their skin color and shape of their
horns. For example a bull, red in color will be named parer and a female cow of the same color
is named cheparer. Only promising female cows with good mothering ability, that is high milk
productivity and adaptability to local conditions of less pasture, water and harsh terrain are
named. Their subsequent progeny displaying similar traits will also be named. Bulls are also
named later, usually a year after their birth. They are closely observed for desirable traits such as
their weight, adaptability and their being stalwart to household members but aggressive to
strangers. This is also true among Eritrean pastoralists (Dinucci and Fre, 2003). Named cattle
become the nucleus of the herd. They are rarely sold or slaughtered as they are expected to pass
these good traits to the next generation. This ensures high productivity and in turn household
food security. All livestock are branded immediately after birth. The most common method of
branding is by notching of the ears (ighata yitin). The design is unique to each family and clan
and thus makes it easy to identify livestock especially when herded as a group. Herders try their
best to prevent inbreeding between closely related livestock. They also calculate seasons and
prefer livestock especially cattle to conceive at particular times so that calving down dates are
during the rainy season when there is plenty of pasture. This will ensure both the cow and calf
thrive.
Pastoralists possess and use a wide array of ethno-veterinary practices. They know herbs and
trees that can be used to treat different livestock diseases. This also reduces milk quality
deterioration and possible transmission of foodborne diseases such as brucellosis to humans.
Besides this, preventive mechanisms are also put in place. Some households mentioned that the
transhumance pattern is such that at the start of the rainy season, livestock are moved to higher

49
grounds with proper drainage and thus reducing incidence of diseases such as contageous caprine
and bovine pleuropnemonia (lokoi). Livestock kraals are constructed in gently sloping areas to
allow for proper drainage. Another practice mentioned is the controlled burning of grass pasture.
This helps in reducing ticks prevalence because as the grass is burnt, the tick eggs and larva are
destroyed. The fresh grass that emerges after the burn (psikor) is perceived to have more
nutritional benefits to the livestock.
These practices have enabled pastoralists in West Pokot to continue thriving amidst shocks
previously discussed. However, with changing climate and other factors, the intensity of shocks
continue to magnify and thus necessiate external interventions to augment local knowledge. The
county governemnt of West Pokot together with other partners promote programmes that are
aimed at building household resilience (CCDP, 2013). These include growing fruits in
partnership with FAO and KVDA, bee keeping together with KVDA and Camels, Bees and Silk
Organization, CABESI and camel rearing in partnership with Action Aid. Other interventions
run by the county government are livestock vaccination campaigns and improving livestock
breed. The VI agroforestry together with Triple L project have been training farmers on
establishing enclosures on grazing land and planting fodder trees to help rehabilitate degraded
landscape. These activities present opportunities for livelihood diversification, providing
alternative income and thus build resilience. Table 5 below shows the percentage uptake of these
intervensionist programmes by pastoralists.

50
Table 5: Pastoralists’ Uptake of Intervensionist Programmes
Intervention programme Percentage Frequency t-statistic
Arid
population
N= 104
Semi arid
population
N= 87
Pooled
population
N=191
Vaccination campaigns 60.0 76.0 67.0 2.4017**
Establishing enclosures on land 30.0 92.0 58.0 11.0741**
Improving breeding herd 4.0 48.0 24.0 8.3137**
Camel rearing 10.0 0 5.0 3.0263**
Bee keeping 34.0 9.0 22.5 4.1915**
Growing fruits 14.0 24.0 19.0 1.7139*
Growing fodder 5.0 42.0 22.0 6.8771**
Note: ** and *significant difference between the arid and semi-arid areas at 5% and 10%,
respectively%.
Source: Survey Data (2017).
In order to prevent the spread of livestock diseases such as FMD and the resultant mass death,
the county government periodically runs vaccination campaigns. This is important because
livestock diseases and the subsequent losses incurred is the greatest shock affecting most
households. At a subsidized cost of Ksh 10 (USD 0.1) per livestock head, pastoralists get their
herds vaccinated. This reduces incidences of livestock diseases and the resultant losses in the
event of death, saves on incidental veterinary drug purchases and ensure quality livestock is
produced and marketed and thus build resilience (IIR and CTA, 2013).
More sedentary households divide their grazing land into enclosures in which animals are
allowed to graze rotationally. Grass and other pasture species can be grown on these enclosures.
This ensures there is enough livestock feed to last through all seasons. Nyberg et al. (2015) noted
that enclosures in West Pokot county has helped in reclaiming degraded land. Since transhumant
movement is reducing significantly in most pastoralist communities, enclosures provide an
opportunity for intensifying livestock production on the available land. Butt (2010) noted that
livestock that moved less distance utilized feed better as they needed less energy and thus gain

51
the needed marketable weight fast and even produce more milk. Proper intensification increases
production and assures pastoralists of more food and revenues (IIR and CTA, 2013).
Another emerging trend among pastoralists in the highland region is stocking improved livestock
breed. Little and McPeak (2014) noted that this is an emerging response to climate-related
challenges. These breeds are more marketable as they take a shorter time to mature and their
meat is more tender. Nearly 10% of the respondents stocked improved Sahiwal cattle breeds, 8%
cross cattle breed, 15% Gala goat breed, 3% cross goat breed, 16% Dopper sheep breed, and 3%
cross sheep breed. The main challenge noted with these breeds is that unlike the indigenous ones,
they are more susceptible to diseases and cannot move long distances. As a result, very few
respondents in the arid areas stocked them.
Incorporating camels is increasingly becoming important in many pastoralist communities.
Kagunyu and Wanjohi (2015) noted that pastoralists in northern Kenya are increasing the
number of camels in their herds because of their adaptability and few deaths during drought
compared to cattle. Being browsers, camels are able to survive on shrubs in drought times when
pastures dry up. Similarly, WISP (2010) noted that incorporating camels to herd helps
pastoralists adapt themselves to climate-related shocks and thus aptly build their resilience. This
is a viable intervention for the arid areas where land is largely communally-owned and thus there
is plenty of space and browse plant species for the camels.
Bee keeping is another viable intervention in the arid areas. Over 90% of the respondents
keeping bees were from the arid areas. The indigenous trees that produce nectar and used to
produce log hives that bees prefer are found in the arid areas. In the past, bees were left in the
wild and honey was collected only during hunger emergencies (WISP, 2010). However, with the

52
intervention of the county government, CABESI self-help group and the KVDA, it was noted
that over 22% of respondents in were involved in bee keeping. CABESI self-help group helps in
value addition and marketing of honey and thus the honey producers earn more revenues,
building their resilience.
Afforestation and fruit growing contributes positively to resilience. The most common
marketable fruit grown was mango. The arid and semi-arid climate makes mangoes thrive well
and have a sweet taste. The fruits are consumed locally and some sold, thus enabling household
earns extra revenue. The KVDA and FAO seedling stations propagate various tree species and
sell them at a subsidized price of Kshs 100 (1 USD) per seedling to the pastoralists. This amount
is quite expensive for most households who have an average daily income of about half a dollar.
Apart from the fruit trees, the other trees have multiple uses. Fodder trees such as Lucerne and
Caliandra complement livestock feed enhancing quality. Caliandra species has nitrogen fixing
properties that improve soil fertility and enhance crop productivity. These measures possibly
help to build resilience.
Fodder growing is an emerging enterprise in many pastoralist communities. This is because
pasture is perceived to grow naturally in open access grazing grounds. However, constraints on
communal land and increasing sedentarization reduce free movement of livestock and less
natural pasture is available for livestock. This has made many pastoralists to consider growing
fodder to ensure smooth availability of pasture. Fodder is mainly grown on land boundaries and
land that is less likely to be used for production of other crops. The livestock research centre in
Chepareria has grown different types of fodder grasses on demonstration fields and avails
various pasture seeds to the pastoralists.

53
There is a significant difference between pastoralists in the arid and semi-arid areas in the uptake
of enclosures, stocking improved breeds and growing fodder. This difference could be attributed
to difference in land tenure regime. Farmers who practice them would want exclusive land rights
in order to reap the benefits that accrue from them. Also, some initial investment costs such as
purchasing tree seedlings as well as labor and management is required and thus tenure security is
vital before applying the practices. The improved livestock breeds cannot do well in the arid
areas since they cannot move long distances in search of water and pasture. This explains the low
adoption of these practices in the arid areas where most land is still communally-owned with no
exclusive ownership rights. Similarly, Geutjes and Knutsson (2014) noted that pastoralists in
semi-arid areas were able to undertake various on-farm investments due to the
private/individualized tenure which was perceived to be more secure.
4.4 Conclusions and Policy Implications
This study assessed pastoralists’ IK and various external interventions and the role they play in
helping pastoralists cope with shocks. Understanding IK is vital in reaching out to pastoralists
because it is an important asset that they possess and use to make a living. Pastoralists’ value
their own IK and this forms an important pedestal for interventionists to learn and appreciate
pastoralists own coping mechanisms and thus contribute to the body of knowledge.
Of importance is that these practices, inter alia have the potential of helping pastoralists cope
with shocks such as drought, livestock diseases and intercommunity conflicts. The various
external interventions help pastoralists diversify their on-farm livelihood activities, an important
aspect of building resilience to shocks.
These findings form a basis for further research on how best these practices can be incorporated
in development programmes. There is also the need for documentation of IK and practices and

54
how they can be applied in other areas. This will ensure that these valuable practices are handed
over to future generations and thus reduce the threat of their extinction.
Planned transhumant migration enables pastoralists to escape shocks and thus reduces the effect
of these shocks on food security. There is need for more inclusive rights on land to allow for this
movement especially in the arid areas. Traditional institutions regarding access to and use of
communally-owned land need to be strengthened through recognition of communal land rights
bestowed on communities. This can provide an incentive for pastoralists to manage communal
land better. There is also need to address the issue of intellectual property rights to communities
who are stewards of IK.

55
CHAPTER FIVE
5.0 Effects of Indigenous Knowledge, Practices and External Interventions on Household
Resilience to Shocks
Abstract
Pastoralism is the main livelihood activity in the arid and semi arid areas. Most pastoralists’
households are adversely affected by climate-change shocks such as droughts and livestock
diseases. These shocks lead to deterioration of livestock quality and even mass death of herds.
This leaves pastoralists households vulnerable as they derive most of their food and income
needs from livestock, necessitating emergency disaster response and the need to build their long
term adaptive capacity. In most cases however, investments only focus on reducing risks when
disaster strike and not in building long term adaptation strategies. In order to build long term
pastoralists adaptive capacity, there is need to understand local or indigenous practices and
external interventions that work so that investments can be channeled towards them. This study
analyzed factors that build household resilience among the pastoralists of West Pokot County in
Kenya. The household resilience index was constructed using Principal Component Analysis,
PCA. An ordered probit regression was used to analyze the effect of socio-demographic,
institutional factors and adaptive practices on households’ resilience. It was noted that years of
schooling, household income, access to credit and extension and adaptive practices such as post
harvest use of field crops for grazing, enclosures, stocking improved breeds, bee keeping, ethno-
veterinary practices and afforestation have a positive and significant effect in building household
resilience to shocks. There is therefore the need to direct investment to bolster pastoralists own
efforts in this regard to realize the attainment of more resilient households.
Key words: Shocks, Vulnerability, Resilience, Pastoralists
5.1 Introduction
Resilience was originally introduced by Holling (1973) as a concept to help understand the
capacity of ecosystems with alternative attractors to persist in the original state subject to
perturbations. Walker et al. (2004) define resilience as the capacity of a system to absorb
disturbance and reorganize while undergoing change so as to still retain essentially the same

56
function, structure and feedbacks, and therefore identity, that is, the capacity to change in order
to maintain the same identity. Further, Walker and Salt (2006) consider resilience to be the
ability of a system to absorb disturbances and still retain its basic function and structure. They
also noted that in as much as changes occur, they are easily ignored or resisted and this increases
vulnerability and even foregoing emerging opportunities. As a result, options become limited.
Thus, a resilient system has capability for self-organization and adaptability to changing
conditions (Carpenter et al., 2001).
According to Chambers and Conway (1992), a sustainable livelihood is one which can cope and
recover from shocks and stress while maintaining and enhancing its capabilities and assets and
provide sustainable livelihood opportunities for the next generation. This is achieved by a
household having enough buffers against contingencies such as drought, crop failure, famine or
sickness and being able to adapt fast to new changes and shocks. Adaptability is the capacity of
actors to influence resilience by learning, combining experiences and knowledge, adjust its
responses to changing internal processes and continue developing with the current stability
(Berkes et al., 2003; Walker et al., 2004). Building resilience is an important step in attaining
sustainable development as it enables households thrive in the wake of shocks and even reduce
expenditure in disaster risk reduction.
The challenges experienced in many ASALs reduce pastoralists’ resilience. One major change is
the loss of grazing land as a result of urbanization and population growth. This has resulted to
land degradation due to overgrazing and heightened conflicts with other communities over
access rights to the little remaining grazing parcels (Verdoodt et al., 2010; Little and McPeak,
2014). The already bleak situation is worsened by the negative effects of climate change- related
shocks such as droughts. With little or no access to water and pasture, many pastoralists lose part
57
of their herds during drought periods (WISP, 2010; IIR and CTA, 2013). Loss of livestock,
which is the main source of food and income plunges households down the vulnerability path
and may take a long time to recover and ‘bounce back’ to normal ex ante condition.
Many studies have been done to ascertain pastoralists’ vulnerability and resilience to shocks
(Tesso et al., 2012; Opiyo et al., 2014; Ngigi et al., 2015). Alinovi et al (2010) constructed
resilience indices of different livelihood groups, among them pastoralists. In their analysis,
pastoralists recorded the lowest index compared to entrepreneurs, agro-pastoralists, small and
large scale farmers. Most of the studies that were reviewed documented pastoralists’ exposure to
shocks and their response mechanisms without providing empirical evidence on resilience-
building strategies and their outcomes on households. This study fills this knowledge gap by
assessing the effects of pastoralists’ own IK and external interventions in building their
resilience.
5.2 Objective and Methodology
The objective of this paper was to analyze the effects of indigenous and local knowledge and
practices and external interventions on household resilience to shocks. Primary household data
from 191 households was qualitatively and quantitavely analyzed. The framework for
quantitative analysis is discussed below.
5.3 Measurement of Household Resilience to Shocks
Resilience concept is of interest to many agencies and organizations because it has been seen to
provide a new perspective on how to effectively plan for and analyze the effects of shocks and
stressors that threaten the well-being of vulnerable populations. As a result, many organizations
have conceptualized resilience in different ways. These include;

58
5.3.1 DFID/TANGO Resilience Conceptual Framework
This framework describes resilience in four elements, the context, disturbance, the capacity to
deal with disturbance and reaction to disturbance (Constas et al., 2014). It seeks to answer the
following questions; whose resilience, resilience to what and how the system responds to the
disturbance. The DFID’s framework approaches resilience primarily from a disaster risk
reduction perspective.
5.3.2 Tufts Livelihoods Change Over Time (LCOT) Model
This model is based on a livelihood cycle framework. It involves understanding the shocks
common to a system or the targeted population and the effect of these shocks to the different
stages of the livelihood cycle such as the effect of a shock on assets and production decisions
(Constas et al., 2014).
The LCOT conceptual model captures static livelihood outcomes such as food security, health
status, and education level, which are typically measured in a fairly linear manner, as well as
more complex outcomes based on dynamic interactions between livelihood strategies, policies
and programmes, and institutions, which can enhance or limit household responses. Such
information is then used to identify who is most vulnerable to what types of shocks. Rather than
collect the large amount of data required to directly measure various parts of the livelihoods
cycle, a model is used to estimate relationships between initial asset levels, variables at different
stages of the livelihood cycle, and outcome measures of household resilience.
5.3.3 OXFAM and ACCRA
This approach focuses on the adaptive capacity that determines household and community
resilience. This capacity is measured based on characteristics without the consideration of shock.
Five dimensions are considered key to resilience; livelihood viability, innovation potential,

59
contingency resources and support access, integrity of natural and built environment, and social
and institutional capability.
Though Oxfam views these five dimensions as critical to household resilience, the specific
characteristics determining resilience and adaptation in a particular context vary widely.
Defining a set of resilient characteristics has the advantage of being adapted to different
geographical settings, cultures and environments. Identifying a set of characteristics as a proxy
for resilience tends to be case-specific and cannot be easily generalized.
Another significant limitation to the characteristics-based approach is that it does not address
whether the characteristics identified are actually relevant when different shocks occur. As Bene
et al. (2012) explains, resilience is not a static state but rather a process, therefore its
determinants keep on changing as the social, economic and environmental landscapes within
which households and communities operate also change.
5.3.4 FAO Resilience Index Measurement and Analysis (RIMA) Conceptual Framework
The FAO model builds on the other frameworks by explaining the interaction between shocks
and their effects on households, with resilience accounting for the difference in outcomes
between two similar households exposed to the same shock. Resilience is the outcome of the
coping and long-term mitigating strategies adopted by the pastoralists. According to FAO (2016)
this outcome being latent is measured in terms of income and food access, assets, access to basic
services, agricultural production technology, social safety nets, economic activity and adaptive
capacity. This can be expressed as (Equation 3):
R= f (IFA, ABS, AA, NAA, APT, SSN, AC EC) ……………………………………..….…....(3)
where R = resilience; IFA = income and food access; ABS = access to basic services; AA =
agricultural assets; NAA = non-agricultural assets; APT = agricultural practice and technology;

60
SSN = social safety nets; sensitivity; AC = adaptive capacity and EC = Economic Connectivity
(FAO, 2016).
This study adopted the FAO approach and built on its flexibility to be adopted in different real
life cases and in this study, pastoralist’s resilience to climate and other related shocks. The
Principal Component Analysis (PCA) method was applied to generate resilience indices for each
household. The PCA approach has been used by previous studies to generate the weights for the
variables included in resilience index (Keil et al., 2008; Browne et al., 2015; Mulat and Negussie
2010). The chosen variables should be consistent with the assumptions of PCA that variables
should have at least an interval level of measurement and should be linearly related to one
another. The Bartlett’s test of sphericity and Kaiser-Meyer Olkin (KMO) measure of sampling
adequacy were used to test variables’ suitability for PCA. The scores generated using PCA were
used to determine the indicator weights for the variables. Once the indicator weights have been
estimated and the index of resilience constructed, the index is applied to the individual
households and a score for each household is calculated (Equation 4):
Aj= f1 x (aj1 – a1) / (s1) + ... + fN x (ajN - aN) / (sN)………………………………………….(4).
where Aj is the resilience score for household j, f1 is the component loading generated by PCA
for the first variable, aj1 is the jth households value for the first variable, and a1 and s1 are the
mean and standard deviation, respectively, of the first variable over all the households (Browne
et al., 2014).
This can be summarized as; R= ∑j wj Fj………………………………………………………(5)

61
where the resilience index is a weighted sum of the factors. Table 6 below shows the variables
that were used in the PCA and their factor loadings.
Table 6: Factor Loadings of Variables used in PCA
Variable Factor score
Income
Log of total income (Farm and off farm income) 0.3767
Food security
Number of months that the household was unable to meet food
requirements
-0.3363
Assets
Log of value of farm implements 0.3370
Log of value of tropical livestock units 0.2879
Log of value of land 0.3362
Access to basic services – Health
Health expenditure 0.3084
Agricultural Practice and Technology
Count number of sustainable practices- agro forestry, terracing,
enclosures, drought tolerant crops, pasture conservation and use of
organic manure
0.3213
Adaptive Capacity
Dependency ratio -0.2378
Proportion of losses incurred during shocks to total income -0.3142
Increase savings to cushion against shocks 0.2863
Chi square = 1110.236, Degrees of Freedom= 45, P- value =0.000
H0 – Variables are not intercorrelated
Kaiser-Meyer Olkin, KMO measure of sampling adequacy = 0.908
Source: Survey Data (2017).
The Bartlett’s score of Sphericity has a p-value of 0.000 which is highly significant at 5%. Thus,
the null hypothesis is rejected since the variables are intercorrelated and this justifies the use of
PCA. The KMO statistic is above the recommended minimum of 0.70 and thus unbiased
inference can be drawn from the indices constructed using these variables.

62
The variable explaining the index the most is total income with a factor value of 0.3767. Income
is an aspect of livelihood, showing a household’s capacity to earn a living. It comprises income
derived from selling livestock, other farm products and income from formal and informal
employment. A diverse income stream cushions the household against drought-related shocks. It
enhances other resilience indicators since cash income can be converted into assets. Income also
enables households to access basic services such as healthcare and food, all which explain
resilience (Ciani and Romano, 2013).
The FAO (2016) defines a status of food security to be existing when all people at all times have
physical and economic access to sufficient, safe and nutritious food that meets their dietary
needs. There are four important components of food securty: availability, access, stability and
utilization. Food availabilty is determined by food production and stock level. Access to food is
determined by disposable income and food prices. Stability is determined by weather, political
and economic conditions. Utilization is determined by dietary diversity, energy and nuitrent
intake. Failure to meet food and dietary requirements leads to a situation of food insecurity.
Food security in this study was explained by the number of months in a year that the household
could not meet its’ annual food requirement. Over 53% of the respondents could not meet their
annual food requirements. Half of the respondents cited poor harvest and 45.7% attributed it to
high food prices. The average number of meals per day was 1.5. About 74% of the respondents
cope with food shortage by borrowing, about 60% by feeding on edible wild fruits and tree
leaves and 20% received food aid from government and non government institutions. Other
studies (Alinovi et al., 2010, Ciani and Romano, 2013) used number of meals and expenditure on
food to explain food security. However, these indicators vary across households. For example, a
household producing most of its food and livestock on the farm may have a lower expenditure

63
for food items but may not necessarily mean that it is not food secure. This study overcomes this
obstacle by using the number of months in a year a household is unable to meet its food
requirement over the last 12 months. As expected, more months of food insecurity makes a
household less resilient and this explains the negative factor coefficient of -0.3363.
Assets are a key element of a livelihood. They give a household the opportunity to have
something tradable; something to build an activity upon. By employing assets, households raise
both their on- and off-farm incomes (FAO, 2016). This in turn, has a positive outcome on the
households’ resilience. Consistent with observation of other studies (for example, Alinovi et al.,
2010; Ciani and Romano, 2013) the assets used in this analysis, value of farm implements, value
of land and value of the TLUs have positive factor values on the resilience index (0.3370, 0.3362
and 0.2879, respectively). Unlike previous studies, this study incorporated TLUs because of the
importance of livestock in pastoralists’ households.
Alinovi et al. (2010) and Ciani and Romano (2013) used distance to the nearest healthcare, water
source and school as indicators of access to basic services. Access to basic services such as
health, schools, and extension offices increases access to vital information and awareness
creation in case of need. Isolated households are more vulnerable to shocks and are less likely to
be accessed in times of need and because of this; these variables are treated as explanatory
determinants of resilience (see section 5.3) in this study. Health expenditure was used to compute
factor variable for access to basic services. It had a positive factor value of 0.3084. More resilient
households spend more on health because they can travel to better equipped hospitals.
Agricultural adaptation and production technology is crucial as it enables farmers counter the
effects of shocks in a system (Antle, 2009). Proper practices such as afforestation, use of terraces

64
and livestock enclosures have positive influence on the household resilience. Alinovi et al.
(2010) noted that more resilient households use more advanced agricultural technologies. In this
analysis, the count number of sustainable agricultural practices of a household was used to
compute the factor score of 0.3231. The individual practices are treated as explanatory variables
of resilience.
Ciani and Romano (2013) and Alinovi et al. (2010) used household education, number of
household members employed and other sources of income to explain adaptive capacity.
Education level improves the decisions made both on- and off-farm. Similarly, with a good
education, one can secure formal employment and thus earn off-farm income. Dependency ratio
is the proportion of economically inactive to the total household population. They include
children not yet in school, students, elderly and the sick. A household with a high dependency
ratio has few economically active members who have to meet the needs of all the other people in
the household. This reduces savings and puts great pressure on economic resources of the
household (Ellis, 2000).
In this study, adaptive capacity was explained using dependency ratio, proportion of losses
incurred during shocks and savings. As expected, higher dependency ratios imply negatively on
the household resilience index and that explains the negative factor score of -0.2378.
As in Carter et al. (2005), a household that looses most of its assets during a shock becomes
more vulnerable to subsequent shocks. This may lead the household to be entangled in a poverty
trap, which requires lots of external interventions. This explains the negative factor value of -
0.3142 for share of income and assets lost during shocks in this analysis. Savings was a dummy
variable measured in terms of whether the household sets apart some income and assets to be

65
used in the event of shocks. This has a positive effect on the household resilience index (factor
value of 0.2863).
Income and monetary value of assets was taken in the logarithm form in order to reduce the
range of variables and thus reduce outliers (Wooldridge, 2002). Following FAO (2016), the
resilience scores were re-scaled to range from 0 to 1. The average household resilience index for
the entire sample was found to be 0.4095. On a scale of 0 to 1, this is below average. Other
studies also found that pastoralists had the lowest resilience scores (Ciani and Romano, 2013;
Alinovi et al., 2010) compared to other livelihood groups. This is attributed to the shocks that
affect their main source of livelihood, livestock. These shocks in turn affect their assets and
access to basic services thus lowering their resilience index. Figure 8 below shows the
distribution of the resilience indices. Nearly half of the respondents in this study had an index
ranging from 0 to 0.33, at least 30% an index between 0.34 and 0.66 and about 20% had an index
between 0.67 and 0.99.
Figure 8: Household Resilience Categories
Source: Survey Data (2017).

66
There is a significant difference of resilience across respondents in the arid and semi-arid areas
in West Pokot County. The average index of respondents in the semi-arid locations is 0.50 while
that for those in arid locations is 0.33. Almost 60% of the respondents in the arid areas have an
index ranging between 0 – 0.33. Geutjes and Wernerson (2014) noted that in the semi-arid
locations there is livelihood diversification due to a more favorable climate, which in turn
contributes to building resilience.
5.4 Factors that Enhance Household Resilience to shocks
After computing the resilience index, most studies describe the distribution of the index across
the study population (Ciani and Romano, 2013; Alinovi et al., 2010). However, few studies have
employed quantitative methods to measure the effects of various factors on resilience. After
computing the vulnerability index among households in Turkana County Kenya, Opiyo et al.
(2014) used an ordered probit with 3 vulnerability categories to estimate the probability of a
household belonging to any of the three categories. Similarly, Tesso et al. (2012) used an ordered
probit to measure the number of years a household took to return to its original state after a
shock. This current study builds on this body of knowledge by employing an ordered probit
model with 3 categories of resilience and includes demographic factors, pastoralists’ own
indigenous knowledge and external interventions as the independent variables.
The ordered probit is derived from the latent variable model (Equation 6).
............................................................................................................................................…....(6)
Equation (6) can be reduced to equation (7) below:
…………………………………..………………………………………………..…(7)

67
Where is an error term, which follows standard normal distribution, with a normalized
variance equal to 1.
………………………………………………….……………………………………………..(8)
The model does not contain a constant. The model defines J threshold parameters, α whereby
α1˂ α2˂….. α j
The latent variable is not observable but we can observe the resilience categories according to
the following:
(
………………………………………………………………..………………………………(9)
In this study, the dependent variable is the household resilience index. The probability of a
household belonging in any of the three resilience categories given the independent variables can
be specified as follows:
………………………………………………………………………………………………….(10)

68
=
=
=
=
=
= ……………………………………………………………………………(11)
The sum of the three probabilities is equal to 1. Table 7 below shows the results of the ordered
probit model

69
Table 7: Ordered Probit Results on Determinants of Household Resilience
Variable Coefficient Marginal Effects
Prob
(Y=1)
Prob
(Y=2)
Prob
(Y=3)
Age 0.027 (0.127) -0.001 -0.001 0.003
Gender (1= Male headed household) -1.467**
(0.681)
0.079** 0.064 -0.144**
Years of schooling of the household head 0.154**(0.067) -0.008** -0.006** 0.015**
Title ownership of land owned 0.783 (0.630) -0.043 -0.034 0.077
Proportion of off -farm income of total income 3.585**(1.298) -0.195** -0.157* 0.352**
Distance to water source -0.005 (0.213) 0.0002 0.0002 -0.0005
Distance to the market 0.076 (0.066) -0.0041 -0.0033 0.0074
Distance to the health centre 0.033 (0.032) -0.0018 -0.0014 0.0032
Access to extension advice 3.512**
(0.873)
-0.191** -0.154* 0.345**
Access to credit 0.365**(0.160) -0.019** -0.016** 0.036**
Access to social safety support -1.049*(0.584) 0.057 0.046 -0.103*
Participation in governance institutions 0.680 (0.582) -0.037 -0.029 0.067
Livestock vaccination 0.780 (0.772) -0.042 -0.034 0.077
Pasture conservation 0.313 (0.468) -0.017 -0.013 0.031
Planting drought tolerant crop varieties 1.262 (0.155) -0.069 -0.055 0.124
Post-harvest use of crop fields 2.531**(0.858) -0.138** -0.111 0.249
Ethno-veterinary treatment of livestock 1.404**(0.535) -0.076** -0.062** 0.138**
Enclosing grazing land 3.162**(0.838) -0.172** -0.138** 0.311**
Agro forestry 0.659*(0.385) -0.036* -0.029 0.065*
Stocking improved livestock breeds 1.754**(0.505) -0.095** -0.077** 0.172**
Incorporating camels in the herd 0.522 (0.587) -0.028 -0.22 0.051
Bee Keeping 0.762*(0.438) -0.415* -0.033 0.075
Notes:
α1 = 14.298(2.398); α2 = 20.498 (2.947); Wald Chi-Square (22) = 79.55
Log Pseudo-likelihood = -30.538; Pseudo R2= 0.7256. Robust standard errors are in brackets.
** p-value significant at 5%, * p-value significant at 10%.
Marginal effects were calculated as a discrete change from 0 to 1 for dummy variables and at
means for continuous variables
Source: Survey Data (2017).
5.4.1 Household Demographic Characteristics
The demographic characteristics included in this study are age, gender, years of schooling of the
household head and proportion of off farm income to total income, a proxy variable to off-farm
diversification. It was noted that households headed by older members were more resilient than
those headed by younger counterparts. This could be attributed to the vast production experience
they have accumulated over the years. Similarly, Mulwa et al. (2015) noted that in Malawi, older
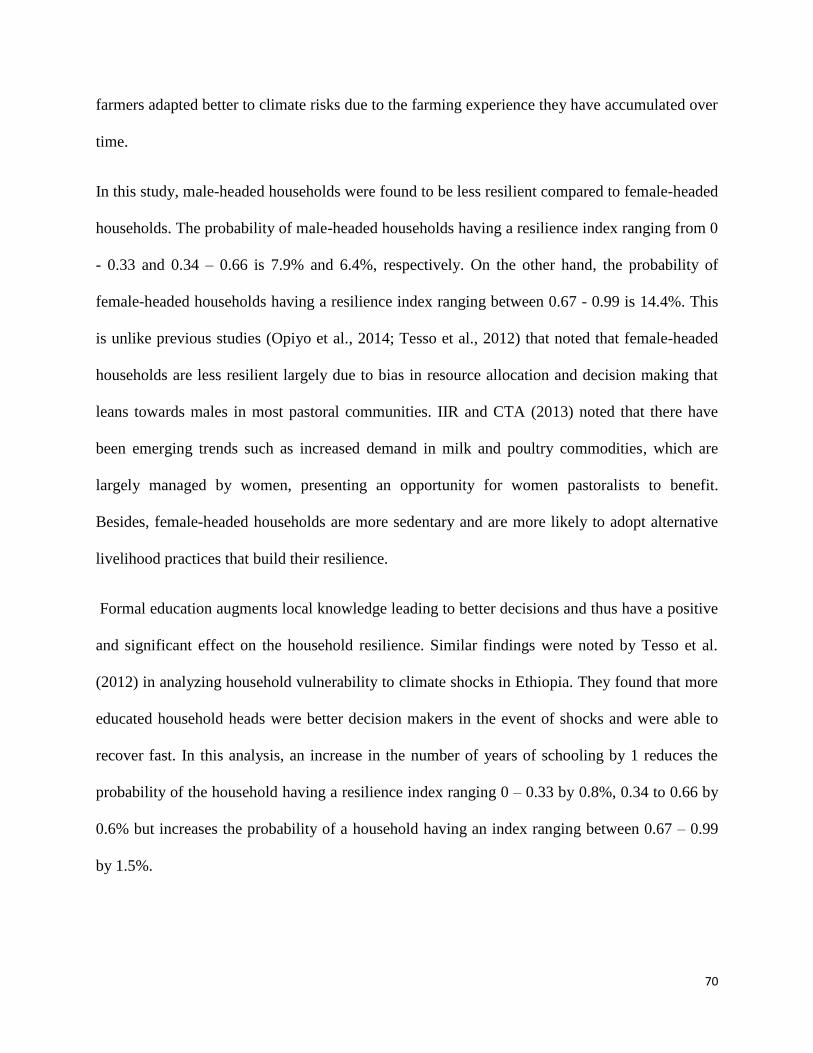
70
farmers adapted better to climate risks due to the farming experience they have accumulated over
time.
In this study, male-headed households were found to be less resilient compared to female-headed
households. The probability of male-headed households having a resilience index ranging from 0
- 0.33 and 0.34 – 0.66 is 7.9% and 6.4%, respectively. On the other hand, the probability of
female-headed households having a resilience index ranging between 0.67 - 0.99 is 14.4%. This
is unlike previous studies (Opiyo et al., 2014; Tesso et al., 2012) that noted that female-headed
households are less resilient largely due to bias in resource allocation and decision making that
leans towards males in most pastoral communities. IIR and CTA (2013) noted that there have
been emerging trends such as increased demand in milk and poultry commodities, which are
largely managed by women, presenting an opportunity for women pastoralists to benefit.
Besides, female-headed households are more sedentary and are more likely to adopt alternative
livelihood practices that build their resilience.
Formal education augments local knowledge leading to better decisions and thus have a positive
and significant effect on the household resilience. Similar findings were noted by Tesso et al.
(2012) in analyzing household vulnerability to climate shocks in Ethiopia. They found that more
educated household heads were better decision makers in the event of shocks and were able to
recover fast. In this analysis, an increase in the number of years of schooling by 1 reduces the
probability of the household having a resilience index ranging 0 – 0.33 by 0.8%, 0.34 to 0.66 by
0.6% but increases the probability of a household having an index ranging between 0.67 – 0.99
by 1.5%.

71
Livelihood diversification through off-farm activities has a positive impact on household
resilience. As noted by Ellis (2000), diversified livelihoods spread risks so that in the event of a
shock from one activity, the others offset the effects of the shock making the household resilient.
In this analysis, households augmenting farm income with off-farm income reduce the
probability of having a resilience index ranging 0 – 0.33 by 19.5%, 0.34 to 0.66 by 15.7% but
increases the probability of a household having an index ranging between 0.67 – 0.99 by 35.2%.
5.4.2 Effect of Proximity to Basic Services on Resilience
Markakis (2004) noted that most pastoralists generally live in areas geographically distant from
national capitals and regions where economic activity is concentrated. Their domain is
characterized with poor road infrastructure and poor access to basic services such as water,
education and healthcare. This isolation reduces pastoralists’ resilience. In this analysis, the
effect of household distance to their sources of water, their most used market and health facility
on resilience were assessed.
Distance moved to households’ water source had an overall negative effect on resilience. Herders
moved an average 32 kilometers during the dry season in search of water and pasture (Table 2).
Animals trekking such a long distance become weak and are more likely to lose weight and thus
fetch low revenues when marketed (IIR and CTA, 2013). This movement predisposes
pastoralists to other shocks such as conflicts with other communities and attack by wild animals
thus further undermining their resilience.
In this study, households who sold to more distant markets were more resilient than households
who sold to nearby markets. These distant markets include slaughter houses and institutions such
as hotels, schools and hospitals. Households selling to these markets need to meet the high
quality and quantity requirements but in turn earn more revenues (IIR and CTA, 2013). The most

72
marketing channel used by pastoralists is the open air markets which are nearby, an average
distance of 10 kilometres. However, as seen in Figure 8 below, with it comes exploitation by
middlemen leading to low returns which further undermine resilience.
Figure 9: Challenges in Various Market Channels
Source: Survey Data (2017).
Unlike previous studies on resilience whereby the distance to health facilities had a negative
effect on household resilience (Ciani and Romano, 2013) the present study found out that more
resilient households travelled to distant health care facilities that are better equipped. As noted
earlier (see section 5.2), the health expenditure had a positive factor loading implying more
resilient households spend more on health. This complements the findings herein that these
households are in a better position to travel to better equipped hospitals that could be far away.
5.4.3 Institutional Factors Affecting Household Resilience
Land tenure security influences the application of practices that build resilience such as
enclosing grazing land, conserving pasture, planting trees and growing fodder. This is because
farmers who practice them would want exclusive land rights in order to reap the benefits that

73
accrue from their investments. Also, some initial investment costs such as purchasing tree
seedlings as well as labor and management is required and thus tenure security is vital before
applying the practices. This explains the low adoption of these practices in the arid areas where
most land is still communally-owned with no exclusive ownership rights. Similarly, other studies
(WISP, 2010; IIR and CTA, 2013) noted that lack of tenure security is one of the main
hindrances to pastoralists’ innovations.
Access to extension training and advice has a positive influence in building household resilience.
Extension advice raises pastoralists’ awareness on issues that affect pastoralists such as climate
related shocks and land constraints and ways through which the shocks can be mitigated and thus
have a positive effect on household resilience. Other studies such as Mulwa et al. (2015) and
Maguza – Tembo et al. (2016) also found that extension advice augments local knowledge and
facilitates adoption of various farm management practices. In the present study, over one-third of
the respondents received extension advice through radio, 40% through county extension workers
and about 27% from fellow pastoralists. Extension advice reduces the probability of a household
having an index ranging from 0 – 0.33 by 19.1%, 0.34 to 0.66 by 15.4% but increases the
probability of a household having an index ranging between 0.67 – 0.99 by 34.5%.
In this study, access to credit was found to have a positive effect on household resilience. Over
40% of those having access to credit got it from table banking groups. The most cited group was
a savings and internal lending community popularly known as SILC which is a table banking
model introduced by the County Department of Gender and Social Services to enhance the
culture of saving, borrowing and investment. About a third had access to credit from formal
banks and micro finance institutions, 5% from family, friends and relatives and 5% through
mobile money platforms. Credit access helps in making available the capital needed to undertake

74
investments and thus facilitate the application of innovative practices. Mulwa et al. (2015) noted
that access to credit had a positive influence on many farm practices such as water and soil
conservation practices besides planting drought-tolerant crop varieties. In this analysis, a
household accessing credit reduces its probability of having an index ranging between 0 – 0.33
by 1.9%, 0.34 to 0.66 by 1.6% but increases the probability of a household having an index
ranging between 0.67 – 0.99 by 3.6%.
Social safety nets help cushion households in the event of shocks. Such support can be from
family, friends and relatives, group members, county and national government and non
government organizations. In this analysis, social safety nets had a negative overall effect on
household resilience unlike in other studies (Alinovi et al., 2010; Ciani and Romano, 2013).
Most households received support from family, friends and relatives in form of cash and the
most cited use of this cash was to buy food. This shows that these households are non-resilient
and need to smooth their consumption by the support received. The marginal effects show that
households receiving such kind of support are more likely to have an index ranging from 0 –
0.33 and 0.34 – 0.66 by a probability of 5.7% and 4.6% respectively. However, a t-test on
household resilience among those receiving support from NGO’s and group members showed a
positive difference (0.45 versus 0.38 for group support and 0.43 versus 0.38 for support from
NGOs). This is because the support is received in forms of inputs such as bee hives, tree
seedlings and marketing of honey. Such kind of support eventually builds resilience. Support
from group members and NGO’s was mainly in form of labor and inputs respectively. This
support helps to increase productivity, raise incomes and thus build resilience.
Pastoralists’ participation in governance institutions contributes positively to their resilience.
This gives pastoralists an avenue where they can air their concerns and collaborate with other

75
partners in prioritizing development projects that aim at building their resilience. This is
important because for a long time pastoralists across many countries have been ignored by policy
makers (Markakis, 2004). The most common governance institutions were those at the
community level. This is because of their proximity and thus members are at ease to meet and
interact with others.
5.4.3 Effect of Indigenous Knowledge, Innovations and Practices on Resilience
In this study, traditional pasture conservation, planting indigineous drought tolerant crop
varieties and ethno-veterinary treatment of livestock were analyzed to asses their influence on
household resilience.
Forage, pasture and crop residues are tradtionally conserved for use during the dry season.
Harvested maize, millet and sorgum residues and grass are cut, dried and stored on top of trees
and released in small amounts for livestock feeding the onset of a rainy season when pasture
will again be abundant until coming of the wet season. Feed availability helps to maintain the
livestock’s body condition, which when sold earn higher revenues thus stabilizing household
income. Fluctuations in milk production is reduced with the available feed, which enhances food
security at the household level and thus build resilience.
Post-harvest use of crop fields for grazing helps to augment locally available livestock pasture
and feed which can be scarce in supply especially during the dry season. Where crops are
harvested at the onset of a sry season, livestock are allowed to feed on the crop residues. This is
a short term strategy in solving pasture scarcity. Households doing so have a 24.9% likelihood of
having a higher index ranging from 0.67 to 0.99.
Drought tolerant crops such as millet, sorghum and cassava thrive well despite the erratic rains
that the county receives and thus households planting them improve their food sufficiency.

76
Mulwa et al. (2015) similarly noted that among other strategies, planting drought-tolerant crop
varieties in Malawi enabled farmers to cope with the vagaries of weather. Also, surplus produce
is sold thus earning the household income and hence contribute positively to the ovreall
resilience.
Ethno-veterinary knowledge and practice play an important role in livestock treatment, thus
averting effects related to shocks due to livestock diseases. This is important since most
pastoralists live far of modern veterinary and pharmaceuticals and may not have access to
modern treatment (IIR and CTA, 2013). From this study, households employing etho-veterinary
practices increase the probability of having a resilience index ranging from 0.67 – 0.99 by
13.8%.
5.4.4 Effect of External Interventions on Resilience
The county governemnt of West Pokot together with other partners promote programmes that are
aimed at building household resilience (CCDP, 2013; CIDP, 2013). These include growing fruits
in partnership with FAO and KVDA, bee keeping together with KVDA and CABESI and camel
rearing in partnership with Action Aid. Other interventions run by the county government are
livestock vaccination campaigns and improving livestock breed. These activities present
opportunities for livelihood diversification, providing alternative income and augment household
food requirement thus building resilience. In this study, the effects of livestock vaccination,
enclosing grazing land, growing fruits, stocking improved breeds, bee keeping and incorporating
camels in the herd on households’ resilience were assesed.
The county government periodically runs livestock vaccination campaigns. This is important
because as seen in Figure 2 in this study, livestock diseases and the losses incurred are the
greatest shocks affecting most households. Vaccination is a disease preventive measure and

77
reduces the likelihood of livestock disease outbreaks that usually result in mass death of
livestock. This cushions pastoralists of the losses that they would incur and instead, build their
resilience.
Enclosures ensure that there is enough livestock feed to last through all seasons. Nyberg et al,
(2015) noted that besides making livestock feed available, enclosures in West Pokot county has
helped in reclaiming degraded land. Since common access grazing resources is reducing
significantly in most pastoralist communities, enclosures provide an opportunity for intensifying
livestock production on the available land. Proper intensification increases production and
assures more food and revenues (IIR and CTA, 2013). The marginal effects show that enclosing
grazing land increases the probability of a household having a resilience index ranging between
0.67 – 0.99 by 31.1%.
Another emerging trend supported by the County government among pastoralists in the semi-arid
region is stocking improved livestock breed. These breeds are more marketable as they take a
shorter time to mature and their meat is more tender (IIR and CTA, 2013). Nearly 10% of the
respondents stocked improved Sahiwal cattle breeds, 8% cross cattle breed, 15% gala goat breed,
3% cross goat breed, 16% dopper sheep breed, and 3% cross sheep breed. The inability of these
breeds to walk for long distances in search of water and pastures makes it hard for them to
survive in the arid areas. As a result, very few respondents in the arid areas stocked them. For
those with these stocks, the study showed that they were more likely to have a higher resilience
index ranging between 0.67 – 0.99 by 17.2%.
Another form of livelihood diversification is bee keeping or apiculture. Bee keeping requires
very little initial capital and bee hives occupy less space compared to cattle. Besides, bee keeping

78
is not labor intensive since bees forage on their own. Honey produced complements domestic
food and surplus quantities can be sold earning households income. Bee keeping households
increase their probability of having a resilience index ranging between 0.67 – 0.99 by 7.5%.
Planting trees through afforestation and agro forestry has multiple benefits. Trees slow down
spoil erosion and thus can help restore degraded land, trees provide fuel wood, fodder trees
provide livestock feed and fruit trees provide food and surplus fruits can be sold earning
households extra income. Tree planting can be combined with bee keeping since tree shades and
flowers provide excellent shelter and food for bees. Households planting trees and growing fruits
increase their probability of having a higher resilience index between 0.67 – 0.99 by 6.5%.
5.5 Conclusion and Policy Implications
This paper assesed the effect of pastoralists own IK and external interventions on household
resilience to shocks. The analysis from PCA showed that on a scale of 0 to 1, the pastoralists had
an index below average of 0.41 with respondents from the semi-arid region having a higher index
than those in the arid areas. Both IK and practices and external interventions had a significant
effect on building household resilience. Female-headed households, number of years of formal
schooling, access to credit, extension, off farm income, pastoralists ethno veterinary practices,
afforestation, enclosing grazing land, bee keeping and fruit growing had a positive and
significant effect on resilience. The findings showed that camel rearing and bee keeping are
viable interventions to build resilience in the arid areas.
There is the need to document and learn indigenous practices of the various communities of
indigenous people because these practices build their resilience. External interventions designed
to build resilince should not undermine local practices but instead synergize them. Incorporating

79
pastoralists’ IK in external interventions such as development projects will produce better results
in building resilience as the projects would be more readily acceptible by the local people.

80
CHAPTER SIX
6.0 SUMMARY, CONCLUSION AND IMPLICATIONS TO POLICY
6.1 Summary
Building pastoralists resilience to shocks is an important aspect in achieving sustainable
livelihoods. The recent developments across many ASALs of SSA predispose pastoralists to
shocks. Open access pasture and water resources are increasingly becoming scarce and
transhumant movement is becoming more difficult with increasing population and human
encroachment on grazing resources. Together with climate-related shocks, most pastoralist
households find themselves entangled in the vulnerability trap.
Indigenous knowledge has enabled pastoralists to manage livestock production in the ASALs.
However, as the effects of the challenges they experience intensify, external interventions are
needed in order to bolster their own efforts to make a living.
This study analyzed the effects of pastoralists own IK and external interventions in building
resilience to shocks. The specific objectives were to: characterize pastoralists’ livelihood
strategies, shocks experienced and coping approaches; assess the pastoralists’ indigenous
knowledge and participation in external interventions and to analyze the effects of indigenous
knowledge and external interventions on household resilience to shocks. The PCA method was
used to compute the household resilience index. An ordered probit regression models were also
applied in data analysis.

81
The first paper assesed the shocks encountered by pastoralists, their coping strategies and the
effects of own mechanisms and external interventions in building their resilience. Results
showed that the most prevalent shocks across all households were drought and livestock diseases
and households utilize their savings and assets in coping with them. Less-endowed households
resorted to borrowing, relied on support from friends and food aid. The paper suggested the need
for external interventions in strengthening pastoralists own efforts in building resilience.
The second paper analyzed the effects of IK and external interventions in helping households
manage shocks. Findings showed that both Indigenous Knowledge and practices and external
interventions are important in helping households manage shocks. This forms a learning blue
print for external interventions that bolster IK in managing shocks.
The final paper assessed the effects of IK and external interventions on household resilience.
Household resilience was constructed using PCA and rescalled to range form 0 being the least
resilient household to 1 being the most resilient household. An ordered probit with three
resilience index categories ranging 0 – 0.33, 0.34 – 0.66 and 0.67 – 0.99 was used to estimate the
effcet of IK and external interventions in building resilience. The results showed indigenous
practices such as etho veterinary and post-harvest use of crop fields for grazing had positive and
significant effects on building resilience. On external interventions, enclosing grazing land,
agroforestry and bee keeping have a significant and positive effect on building household
resilience.
6.2 Conclusion and Implications to Policy
These results show that the efforts put in place by the county government and other partners are
yielding fruits as they are building pastoralists resilience. However, these efforts need to be
intesified so that more people can benefit. This study has isolated the viability of bee keeping

82
and camel rearing in the arid areas. These need to be strengthened since respondents from the
semi-arid areas are the least resilient. The inclusion of pastoralists especially at the county and
national government platforms is still low. This calls for a more bottom up approach in reaching
out to pastoralists.
Tenure security is a major contributor of the application of resilience building practices.
Innovating households need to have exclusive rights over the benefits that accrue from the
practices. Where applicable, tenure rights need to be bestowed upon individuals to drive the
innovation process. In line with K’onyango (2017), there is need to recognize and implement the
communal land act of 2016 so that the communities entitled to such land can manage it
innovatively. This will also safeguard pastoralists’ transhumant corridors since migration is an
important survival mechanism for pastoralists. This calls for further research on how benefits and
costs of innovations can be inclusively shared among users of communally owned land.
Institutional support in the forms of credit and extension need to be strengthened in the
pastoralists’ area. As shown in the results, households having access to formal credit and
extension advice were more resilient as they are provided with the knowhow and the needed
capital to undertake resilience building investments. Providers of such services need to put into
consideration the uniqueness of pastoralists’ livelihoods such as dependence on livestock for
income and seasonal mobility. Considering this will help them design credit products and
extension services that best suit the pastoralists. Formal credit can be embedded with livestock
insurance to cushion both the lender and the pastoralists in the event of catastrophic loss of
livestock. Extension programmes and campaigns such as livestock vaccination can be
implemented during seasons when pastoralists are more likely to be settled so that many
households can benefit.

83
Making markets work for pastoralists is an important aspect in building resilience. A
combination IK, practices and external interventions has the potential of increasing pastoralists’
livestock productivity so that they have a marketable surplus. For them to gain financially from
this surplus, markets need to work efficiently. This can be achieved through investment in
infrastructure such as transport, communication and livestock holding grounds in the markets.
There is also the need to reduce price and production risks and uncertainty. This can be achieved
through pastoralists’ context – specific risk management tools such as index- based livestock
insurance and emergency livestock take off before the onset of droughts. This calls for policy
objectives that support public and private partnerships to support such investments aimed at
building pastoralists’ resilience.
6.3 Contribution to Knowledge
This study contributes to the scarce quantitative studies involving pastoralists’ resilience to
shocks. It analyzes resilience at the household level and thus important viewpoint in
understanding household dynamics. The study contributed to the FAO’s quantitative framework
of measuring resilience to come up with the index by overcoming the obstacle of quantifying
food security as the number of months in a year that a household is unable to meet its food
requirements as opposed to food expenditure. Additionally, a quantitative analysis was done to
understand the effects of IK and external interventions in building resilience. The findings show
that both IK and external interventions contribute to resilience building. The study identifies bee
keeping and camel rearing as the most viable interventions in the arid areas. This is because of
the harsh climatic and environmental conditions that prevail in the arid areas.

84
6.4 Suggestions for Further Research
The findings herein that female respondents are more resilient calls for further gendered analysis
on a fairly distributed sample because the study had more male respondents than females thus the
findings are not conclusive. Being a cross section study, this study could not isolate the impact of
factors studied on household resilience. If the households can be observed over a period of time,
the impact of these interventions can be estimated. The study also looked at the households’
practices in the broadest sense. Further research can narrow down on the intensification of each
particular practice and the effect on household resilience. Finally, research should be done on
how best pastoralists’ own indigenous knowledge can be incorporated in external interventions.

85
6.0 References
Abate, T., 2016. Indigenous Ecological Knowledge and Pastoralist Perception on Rangeland
Management and Degradation in Guji Zone of South Ethiopia. Consilience: Journal of
Sustainable Development, 15(1), pp.192-218.N
African Union (2014). Malabo Declaration on accelerated agricultural growth and transformation
for shared prosperity and improved livelihoods. Malabo, 26–27 June 2014—Decisions,
Declarations, and Resolution of the Assembly of the Union Twenty-Third Ordinary
Session.
Aklilu, Y. (2008). Livestock marketing in Kenya and Ethiopia: a review of policies and
practice. Feinstein International Center, Addis Ababa, 38.
Alan, R. (2000). Integrating Indigenous Knowledge in Project Planning and Implementation. A
partnership publication of the International Labor Organization, the World Bank, the
Canadian Onternational Development Agency and Kivu Nature.
Alinovi, L., D’Errico, M., Mane, E., and Romano, D. (2010). Livelihoods strategies and
household resilience to food insecurity: An empirical analysis to Kenya. In conference
organized by the European Report of Development, Dakar, Senegal, June (pp. 28-30).
Alinovi, L., Mane, E., and Romano, D. (2008). Towards the measurement of household
resilience to food insecurity: applying a model to Palestinian household data. Sibrian
R.(ed.), Deriving Food Security Information From National Household Budget Surveys,
137-52.
Anderson, D., Sweeny, D. and Williams, T. (2007). Statistics for Business and Economics. 11th
edition, South-Western, Cengage Learning, USA.
Antle, J.M., 2009.Agriculture and the Food System Adaptation to Climate Change. RFF report
on Adaptation: An Initiative of the Climate Policy Program, Resources for the Future.
Barrow, E., Davies, J., Berhe, S., Matiru, V., Mohamed, N., Olenasha, W., and Rugadya, M.
(2007). Pastoralists as shrewd managers of risk and resilience in the Horn of
Africa. IUCN Eastern Africa Regional Office Policy Brief, (1).

86
Bastin, J. F., Berrahmouni, N., Grainger, A., Maniatis, D., Mollicone, D., Moore, R.and Aloui,
K. (2017). The extent of forest in dryland biomes. Science Journal, 356(6338), 635-638.
Bateman, I. J., R. T. Carson, M. Hanemann, N.Hanley, T.Hett, M. Jones-Lee, G. Loomes,E.
Ozdemiroglu, D. W. Pearce, R. Sugden, and Swanson, J. (2002), Economic Valuation
with Stated Preference Techniques, A manual, Department for Transport,ISBN 1-84376-
852-6, Edward Elgar, Cheltenham.
Béné, C., Wood, R. G., Newsham, A., and Davies, M. (2012). Resilience: new utopia or new
tyranny? Reflection about the potentials and limits of the concept of resilience in relation
to vulnerability reduction programmes. IDS Working Papers, 2012(405), 1-61.
Berkes, F., Colding, J., and Folke, C. (Eds.). (2008). navigating social-ecological systems:
building resilience for complexity and change. Cambridge University Press.
Browne, M., Ortmann, G. F., and Hendricks, S. L. (2014). Household food security monitoring
and evaluation using a resilience indicator: an application of categorical principal
component analysis and simple sum of assets in five African countries. Agrekon, 53(2),
25-46.
Butt, B. (2010). Seasonal space-time dynamics of cattle behavior and mobility among Maasai
pastoralists in semi-arid Kenya. Journal of Arid Environments, 74(3), 403-413.
Carter, M. R. (2009). Inducing innovation: risk instruments for solving the conundrum of rural
finance. Population and natural resources.
Carter, M. R., Little, P. D., Mogues, T., Negatu, W., and Ababa, A. (2005). The long-term
impacts of short-term shocks: Poverty traps and environmental disasters in Ethiopia and
Honduras. Basis Brief, 28.
Chhetri, N. (2011). Induced innovation: a conceptual approach in understanding agricultural
adaptation to climate change.
Combined County Livestock Development Plan for Turkana, West Pokot, Samburu and Baringo
CCDP 2013-2017. http://www.reliefweb.int/ CCDP 2013-2017. Accessed 12th May 2016.
Constas, M., Frankenberger, T., Hoddinott, J., Mock, N., Romano, D., Béné, C., and Maxwell,
D. (2014). A common analytical model for resilience measurement: causal framework

87
and methodological options. Food Security Information Network Resilience Measurement
Technical Working Group.
Cotula, L(ed) 2007. Changes in Customary Land Tenure Systems in Africa. ISBN: 978-1-84369-
657-5
County Government of West Pokot, 2013. First county integrated development plan 2013 –2017.
http://www.westpokot.go.ke/images/downloads/ CIDP final draft. Accessed 2nd May
2016
Davies, J., Niamir-Fuller, M., Kerven, C., and Bauer, K. (2013). Extensive livestock production
in transition. Livestock in a Changing Landscape, Volume 1: Drivers, Consequences, and
Responses, 285.
Delgado, C. L. 2003. “Rising consumption of meat and milk in developing countries has created
a new food revolution.”Journal of Nutrition vol. 133, no. 11, pp. 3907S–3910S.
DFID (2010). Pastoralism Information Notes. Series of Pastoralism Information Notes prepared
for DFID by John Morton of the Natural Resources Institute, University of Greenwich.
Dinucci, A., and Fre, Z. (2003). Understanding the indigenous knowledge and information
systems of pastoralists in Eritrea. Communication for Development Case Study (FAO).
Ellis, F. (2000). Rural livelihoods and diversity in developing countries. Oxford university press.
4-12
Emery, A.R (2000). Integrating Indigenous Knowledge in Project Planning and Implementation.
A partnership publication of the International Labor Organization, the World Bank, the
Canadian International Development Agency, and Kivu Nature
DFID (1999b) Sustainable Livelihoods and Poverty Elimination. London: Department for
International Development

88
FAO (2005).Kenya Livestock Sector Brief.Rome, Italy, FAO Livestock Information, Sector
Analysis and Policy Branch (AGAL).
FAO (2012) Pastoralism in sub-Saharan Africa; Know its advantages, Understand its challenges,
Act for its sustainability. Food sovereignty brief no 5.
FAO RIMA II 2016. Resilience Index Measurement and Analysis – II. Analysing Resilience for
better targeting and action.
Farmer, E., and Mbwika, J. (2012). End market analysis of Kenyan livestock and meat: a desk
study. Rep. no. MicroREPORT, 184. Project under USAID
Flintan, F.2012. Protecting Livestock Mobility Routes: Lessons Learnt. Learn Initiative 2012
brief.
Folke, C., Carpenter, S. R., Walker, B., Scheffer, M., Chapin, T., and Rockstrom, J. (2010).
Resilience thinking: integrating resilience, adaptability and transformability. Ecology and
Society 15(4): 20. [online]URL:http://www.ecologyandsociety.org/vol15/iss4/art20.
Gorjestani, N. (2004). Indigenous knowledge for development. Protecting AND Promoting
Traditional Knowledge: Systems, National Experiences AND International Dimensions,
265.
Geutjes and Knutsson, 2014. Coping with climate change variability in West Pokot, Kenya: The
influences of land use on responses to climate variability by pastoralists and agro
pastoralist communities in arid and semi arid areas of West Pokot Kenya. Master thesis in
global studies, University of Gothenburg.
Gronvall Antonio (2015) Transition from nomadic pastoralism to livestock based agro-
pastoralism - The case of animal husbandry in West Pokot, Kenya
Hayami, Y., and Ruttan, V. W. (1971). Induced innovation and agricultural development. Staff
Papers Series, 71(1).
Hensher, D. A., Rose, J. M. and Greene, W. H. (2005), Applied Choice Analysis: A Primer,
Huang, J., Wang, Y., and Wang, J. (2015). Farmers' Adaptation to Extreme Weather Events
through Farm Management and Its Impacts on the Mean and Risk of Rice Yield in
China. American Journal of Agricultural Economics, 97(2), 602-617.

89
IFAD. 2009. Livestock and climate change. Draft thematic paper. January12–13, 2009. Rome,
Italy.
Intergovernmental Panel on Climate Change, IPCC (2014). Climate Change 2014–Impacts,
Adaptation and Vulnerability: Regional Aspects. Cambridge University Press.
IIR and CTA, (2013). Moving herds, moving markets: making markets work for African
pastoralists. International Institute of Rural Reconstruction, Nairobi and the Technical
Centre for Agricultural and Rural Cooperation, Wageningen, Netherlands
Israel, Glenn D. 1992. Sampling the Evidence of Extension Program Impact. Program Evaluation
and Organizational Development, IFAS, University of Florida. PEOD-5. October.
Kagunyu, A., and Wanjohi, J. (2014). Camel rearing replacing cattle production among the
Borana community in Isiolo County of Northern Kenya, as climate variability bites.
Pastoralism Journal, 4(13), 1-5. doi:10.1186/s13570-014-0013-6
Keil, A., Zeller, M., Wida, A., Sanim, B., and Birner, R. (2008). What determines farmers’
resilience towards ENSO-related drought? An empirical assessment in Central Sulawesi,
Indonesia. Climatic Change, 86(3-4), 291-307.
Kenya Institute of Public Policy and Research, KIPPRA 2015. Empowering youth through
productive and decent employment.
Kenya National Bureau of Statistics (KNBS) 2009.Economic Survey 2009. Nairobi, Kenya
KNBS and SID (2013). Exploring Kenya’s inequality: Pulling apart or pooling together? West
Pokot County Report. Kenya National Bureau of Statistics and Society for International
Development. ISBN-978-9966-029-18-8.
Konyango, C.O.(2017). Land use planning and communal land tenure reforms in pastoral areas:
the experience of Kenya. National Land Commission of Kenya. Paper presented at the
2017 World Bank conference on Land and Poverty, Washington D.C
Little, P. D., and McPeak, J. G. (2014). Resilience and pastoralism in Africa South of the
Sahara. Resilience for food and nutrition security, 75.
Markakis, J. (2004). Pastoralism on the Margin (pp. 2-37). London: Minority Rights Group
International.

90
Mulat and Negussie, 2010. Household Resilience to Food Insecurity in Ethiopia: Panel Data
Evidence, FAO-ESA, mimeo.
Maguza- Tembo, F, Mangison, J, Edris, K.A and Kenamu, E (2016). Determinants of adoption
of multiple climate adaptation strategies in southern Malawi: An ordered probit analysis.
Journal of Development and Agriculture Economics Vol 9 (1) PP 1-7, DOI:
10.5897/JDAE 2016-0753.
Mulwa, C., Marenya, P., Rahut, D., and Kassie, M. (2015). ) Response to Climate Risks among
Smallholder Farmers in Malawi: A Multivariate Probit Assessment of the Role of
Information, Household Demographics and Farm Characteristics. Adoption Pathways
project discussion paper 3 February 2015.
National Drought Management Authority, NDMA 2016. Drought early warning bulletin for
West Pokot County for April 2016.
Ngigi, M., Mueller, U., and Birner, R. (2015). The role of livestock portfolios and group-based
approaches for building resilience in the face of accelerating climate change: An asset-
based panel data analysis from rural Kenya. Available at SSRN 2676574. , ZEF-
Discussion Papers on Development Policy No. 205, Center for Development Research,
Bonn, October 2015.
Nori, M., and Davies, J. (2007). Change of Wind or Wind of Change? Report on the conference
on Climate Change, Adaptation and Pastoralism, organized by the World Initiative for
Sustainable Pastoralism. Available online at; http://www.iucn.org/wisp/resources/?2339.
Nyariki, D. M., Makau, B. F., Ekaya, W. N., and Gathuma, J. M. (2005). Guidelines for
emergency livestock off-take handbook. Arid Lands Resource Management Project
(ALRMP), Agricultural Research Foundation (AGREF), Nairobi, Kenya.
Nyberg, G., Knutsson, P., Ostwald, M., Öborn, I., Wredle, E., Otieno, D. J. and Grönvall, A.
(2015). Enclosures in West Pokot, Kenya: Transforming land, livestock and livelihoods
in drylands. Pastoralism, 5(1), Pastoralism: Research, Policy and Practice (2015) 5:25
DOI 10.1186/s13570-015-0044-7.

91
Opiyo, F., Wasonga, O.V. and Nyangito, M.M (2014). Measuring household vulnerability to
climate induced stresses in pastoral rangelands of Kenya: Implications for resilience
programming. Pastoralism: Research, Policy and Practice, 2014 4:10.
Orina-Nyamwamu, C. (2010). From a centralized system to a devolved system of governments:
Past, present and future dynamics. In FES Conference on State of Implementation of the
Constitution since 2010.
Overseas Development Institute (2006) “Saving Lives through Livelihoods: critical gaps in the
response to the drought in the Greater Horn of Africa” HPG Briefing Note, ODI, London.
Online http://www.odi.org.uk/resources/download/1381.pdf Swift
Pain, A. and Levine, S. (2012). A conceptual analysis of livelihoods and resilience: addressing
the insecurity of agency’. Working Paper, Humanitarian Policy Group (HPG), Overseas
Development Institute (ODI), London. ISBN: 978-1-909464-00-1.
Republic of Kenya (2008). Ministry of Livestock Development Session Paper no. 2 of 2008 on
National Livestock Policy. November 2008.
Rodima-Taylor, D., Olwig, M. F., and Chhetri, N. (2012). Adaptation as innovation, innovation
as adaptation: An institutional approach to climate change. Applied Geography, 33, 107-
111.
Selemani, I. S., Eik, L. O., Aring, T., Mtengeti, E., and Mushi, D. (2012). The role of indigenous
knowledge and perceptions of pastoral communities on traditional grazing management
in north-western Tanzania. African Journal of Agricultural Research, 7(40), 5537-5547.
Shibia, M., Rahman, S., and Chidmi, B. (2017). Consumer demand for meat in Kenya: an
examination of the linear approximate almost ideal demand system. Available online with
updates at http://ageconsearch. umn. edu.
Solesbury, W. (2003). Sustainable livelihoods: A case study of the evolution of DFID policy.
London: Overseas Development Institute.
Steinfeld, H., Mooney, H. A., Schneider, F., and Neville, L. E. (Eds.). (2013). Livestock in a
changing landscape, Volume 1: Drivers, consequences, and responses. Island Press.
Tesso, G. Emana, B. and Mengistu K. (2012). Analysis of vulnerability and resilience to climate
change induced shocks in North Shewa, Ethiopia. Journal of Agricultural Sciences vol 3
No6 871-888 (2012). Online at http://dx.doi.org/10.4236/as/2012.36106

92
Thornton, P. K., Steeg, J., Notenbaert, A. M. O., and Herrero, M. (2008). The livestock-climate-
poverty nexus: A discussion paper on ILRI research in relation to climate change.
Train, K. E. (2009). Discrete choice methods with simulation. Cambridge university press. PP
100-130
Turner, M. D., McPeak, J. G., and Ayantunde, A. (2014). The role of livestock mobility in the
livelihood strategies of rural peoples in semi-arid West Africa. Human Ecology, 42(2),
231-247.
Verdoodt, A., Mureithi, S. M., and Van Ranst, E. (2010). Impacts of management and enclosure
age on recovery of the herbaceous rangeland vegetation in semi-arid Kenya. Journal of
Arid Environments, 74(9), 1066-1073.
Walker, B., and Salt, D. (2012). Resilience thinking: sustaining ecosystems and people in a
changing world. Island Press.
Walker, B., Holling, C. S., Carpenter, S. R., and Kinzig, A. (2004). Resilience, adaptability and
transformability in social--ecological systems. Ecology and society, 9(2), 5.
WISP 2010.Building climate change resilience for African livestock in sub-Saharan Africa -
World Initiative for Sustainable Pastoralism (WISP): a program of IUCN - The
International Union for Conservation of Nature, Eastern and Southern Africa Regional
Office, Nairobi, March 2010
Woytek, R. (1998). Indigenous knowledge for development: A framework for action
Wooldridge, JM (2005). Introductory econometrics: A modern approach.

93
Appendices
Appendix 1: Questionnaire for Focus Group Discussion
Theme: Understanding livelihood shocks and Resilience Mechanisms in West Pokot
Introduction
This Focus Group Discussion intends to provide useful insights in shocks experienced and
coping strategies in West Pokot and the necessary support needed. The information obtained will
only be used to inform policy decisions.
Location.......................................
Ward............................................
Date.............................................
Questions for Discussion:
1. What are the 5 main shocks that affect people’s lives and survival in this area?
a. Last 5 – 10 years
b. Current situation
c. Expected trends 5 years from now
2. How have these shocks affected welfare?
a. Health
b. Food Security
c. Education
d. Peace and Unity
3. What has been done at the following levels to enable people cope better with these
shocks?
a. Individuals
b. Community groups
c. County government
d. Development partners and NGO’s
4. What else needs to be done now and in the future to enable people deal better with these
shocks?
5. a. In the last 5 years, what market opportunities have emerged in this area?
b. Where have they emerged?
c. How have they been used?
d. What challenges are being encountered in the use of these markets?
e. What needs to be done now and in the future to address these challenges?

1
Appendix 2: Key Informant Interviews
Theme – Historical Perspective on Livestock Production in West Pokot
1. What changes have been experienced in the community over the years from 1980 to date. Please fill the table below:
Time
Period
Livestock
breeds
Average
Number per
Household
Yields Shocks
Encountered
1Drought
2Disease
3 Cattle
rustling
4 Other..
Frequency Coping
strategies
Migration
and
settlement
Markets Governance
Institutions
Land
use
Culture
Drivers of
change
1980-1990
1990’s
2000-2010
2010- date
2. What is the effect of these changes in welfare? Please fill the table below:
Changes Effect on
Yields
Income
Access to basic services
1 Health 2 Education
3Extension 4 other
Food security
1 availability
Assets
1 land
Cultural practices

2
2 distribution
3 Access
2 livestock
3 houses
4 Other

3
Appendix 3: Household Interview Questionnaire
UNIVERSITY OF NAIROBI
Pastoralists’ Livelihood Activities, Participation in Markets & Governance Institutions for Resilience Building in West Pokot,
Kenya
Household Survey Questionnaire, February 2017
Respondent
In this survey, household head, spouse or older family members above 18 years old, familiar with and involved in decision-making on household livelihood activities will be
interviewed. Only households that rear at least one type of livestock will be interviewed.
Purpose of this Survey
The reason for conducting this field survey is to get some insights on livestock production, marketing, shocks to the pastoral system, how pastoralists cope up
with the shocks and what support is needed to build their livelihood resilience. Your voluntary participation in answering questions on these issues is highly
appreciated. Your responses together with those from over 200 other households in other parts of West Pokot will be analyzed and the findings will be used to
inform policy makers on better strategies for improving pastoral livelihoods in West Pokot County. All the information obtained will be treated with utmost
confidentiality and will only be used for the purpose of this survey. This interview will take approximately ONE hour to complete. I request your permission to
start now.
For any further clarification, please contact Deborah Muricho 0720840902.

4
SECTION A : GENERAL INFORMATION
1) Enumerator’s name: ……………………………………………………… 2) Date of interview (dd-mm-yyyy):……………………………
3) Sub county………………………………………………………………...4) Ward ………………………………………………………….
5) Sub –location……………………………………………………………..6) Village………………………………………………………...
7) Household Number…………………………………………………………………………………………………………………………

5
SECTION B: FARM ENTERPRISE
8. What type of crops and livestock do you keep on your farm? Please fill the tables below; i. Livestock Livestock Breeds kept Numbers Number of Main How initial stock was acquired Land size allocated
years Practiced purpose/reason 1-Bought 2- Inherited for this enterprise – for engaging in 3-Received as bride price 4- housing, pasture this enterprise Received as gift 5- Other…… development/grazing 1-Food 2- Sale etc (acres) 3- Draught 4-
Cultural use
e.g. dowry
payment,
status symbol
etc.
5-Manure
6-Store of
wealth
Cattle
Sheep
Goats
Camels
Donkeys
Chicken
Bee keeping (hives)
ii. Crops
Three main crops grown Land size grown
(acres)
Yield in the last season
(kg)
Main purpose 1 – Food 2- Sale 3-both food and sale

6
9. How did you acquire the land you are currently using? Please fill the table below:
Method of Land acquisition Land size owned
(acres)
Tenure system
1. Private with title deed 2. Private without title deed 3.
Communal 4. Other……………
1. Allocated by clan
2. Inherited from parents
3. Bought
4. Rented
5.Leased
6. Received as institution/other people
gift from an
7. Settlement scheme
Other…………………….
10. Do you have access to communally owned grazing land and water sources? 1. Yes 2. No If yes, please fill table below: Location Pasture Water Number Challenges encountered
and Return Distance moved of years of access 1-Settlement by people 2- Increased number of users 3- Conflict with other community 4 -Other…………..
Dry Season
Wet Season

7
SECTION C: EXPOSURE TO SHOCKS AND COPING STRATEGIES
11. What kind of shocks did you experience during the last 12 months and how did you cope with them? Please fill the table below (Tick all that apply)
Type of
Shock
Did you
Experience
this shock in
the last 5
years?
1 = Yes;
2 = No
Duration of
the Shock
(1-Less than a
week
2-Two weeks
3-One month
4- More than
one month)
Freque
ncy
in the
last 12
months
(numb
er of
times it
occurr
ed)
Value of loss
in monetary
terms (Kshs)
Main effects (Rank them
in order of severity)
1 Quality deterioration of
livestock
2 Loss of livestock due to
death
3 Loss of household assets
4 Loss of cash income
5 Loss of crops
6 Loss of livestock
through rustling
7 Loss of human lives
8 Other……………..
What did you do to
manage this shock?
(rank them in the order
in which they were
applied)
1 Used up
Savings
2 Sold part of assets
3 Borrowed
4Migrated to another
area
5 Received aid from
NGO/County
6 Received
Support from social
groups
7 Sent children to
other
family members
8 Fed on wild fruits
and tree leaves
9 Other…………
What initiatives
have/are you putting
in place to manage
this shock better in
future? (rank them in
the order of your
preference)
1 On-farm livelihood
diversification
2 Off-farm livelihood
diversification
3 Adopting new
farming practices e.g.
drought tolerant
crops; new livestock
breeds; conservation
agriculture etc.
4 Increased
Savings
5 Moved to
Another area
6 Joined some peace
Initiative for
conflict resolution
7 Took an Insurance
policy 8 Other……………
Droughts
Livestock diseases
Crop pests and diseases
Conflict with

8
neighboring Communities
Chronic Illness of a household
member
Market
Shocks-
Market
closure, Low
Prices
Fire outbreak
Human –
wildlife conflict
Death of family member
12. Are there shocks that occur concurrently? Describe…………………………………………………………………………… ………………………………………………………………………………………………………………………………………

9
13. In your opinion, which ONE of the above shocks had the greatest effect on your household livelihood stability?
…………………………………………………….......................................................................................................
Please fill the table below on how you relied on various social safety nets to manage the main shock:
Type of safety net Did you
receive support
from this
source?
1 = Yes; 0 = No
Type of support received
1 = cash
2 = inputs
3 = labor
4 = evacuation
5 = food 6 = other….
What proportion of the losses
did this support enable you to
manage?
1) Up to 25%
2) 25% - 50%
3) 50% - 75% 4) More than 75%
Family members/relatives
Friends
Group members
NGOs – including religious organizations
National government programmes
County government programmes
14. Which livestock and crop practices have you put in place to cushion you against future shocks? Please fill table below:
Livestock Practices Do you
Practice (1-Yes 2-No)
Crop Practices Do you
Practice (1-Yes 2-No

10
1. Herd diversification (grazers,
browsers and different ages)
1.Crop diversification
(Specify combinations)
2.Improved breeds (Sahiwal cattle,
gala goats, doper sheep,camels etc)
2. Planting drought tolerant varieties –
Specify
3.Enclosures for livestock grazing 3.Irrigation

11
4. Conserving pasture (Specify method)
4. Took up crop insurance
5. Vaccination 5. Soil conservation – afforestation;
gabions; terracing; minimum tillage; organic manure
6.Took up livestock insurance 6. intensification and use of chemical fertilizer
15. Have you ever changed your livestock breed type and composition? 1- Yes 2- No. If yes, please fill the table below
Livestock Type Initial breed Current breed Motive for change Challenges with this 1-More drought tolerant breed 2-More disease tolerant 3- 1-Needs more feed 2- Yields more milk 4- Takes More susceptible to short time to mature 5- diseases 3-Other…….. Other……………..
Cattle
Goats
Sheep
Chicken
Other

12
16. Do you have an insurance policy covering your livestock and/ or crops in the event of loss? 1-Yes, 2- No. If Yes please fill the table below Policy Type Provider
1-Banks
2-Insurance
company(specify)
3-Other…..
Amount of
premium
paid
Mode of
premium
payment
1-Weekly
2-Monthly
3-Annually
4-Other…..
Extent of the insurance
cover
1- In the event of livestock
death
2- In the event of crop
failure
3- In the event of perils
such as fire………………..
Challenges
1- High premiums
2- Lack of information
3-Policy is
not comprehensive
4-Other
Livestock
Crops
Both livestock and crops
Other…..
17. If the household does not have an insurance policy why have you not taken up any of them? 1-Lack of information 2- Premiums are too high 3- Other…………….
18. Would you be willing to continue paying for an insurance policy that will compensate you in the event of livestock death or crop failure? 1- Yes, 2- No)

13
SECTION D: INDIGINEOUS KNOWLEDGE AND PRACTICES
19. Which of the following traditional practices in livestock management do you practice on your farm? Indigenous Practices Do you
practice
1-Yes, 2- No
How long have you
practiced it in the
last 5 years
(Months)
Why do you
prefer doing it (1-
Cheaper 2-
Convenient
3- Appropriate
Challenges
1-Insecurity
2- Lack of cooperation
3- Depletion of natural
resources 4- Other
Herd size management
Herd splitting during drought
Increasing size during rainy seasons
Stocking both grazers and browsers
Female dominated herds
Grazing
Night grazing
Group herding
Use of browse tree species
Post harvest use of fields
Use of naturally occurring salts
Access and use of communal resources
Limit herd size per household
Rotational access
Penalizing violators
Control breeding
Naming
Branding
Body nomenclature
Coincide calving with wet season
Ethno-veterinary
Move livestock to higher grounds in wet seasons
Controlled burning of pasture to reduce parasites
Use of wild herbs to treat diseases
Use of natural occurring salt

14
SECTION E: PARTICIPATION IN GOVERNANCE INSTITUTIONS
20. Do you belong in any of the following governance institutions? Please fill the table below:
Institution Type Participatio
n
1 Yes
2 No
Role:
1 Member
2 Leader
3 Sponsor
4 Other
Number of
Meetings
Attended In
last 12
months
Services provided by the group
1 Provide credit
2 Share information
3 Receive aid
4 Receive extension training
5 Link to market
6 Security
7 Environment conservation
8 Political committee
Key challenges
1 Lack of Communication
2 Mismanagement of resources
3 Poor leadership
4 Lack of commitment by other
members
5 High membership fees
6 Gender bias
7 Ethnic discrimination
8 Political interference
9 Other…………………..
1. Community
level groups
(Specify)
2. County government
committees
(Specify)
3. National
level
Programmes
(Specify)

15
21. Are you aware of livelihood development projects implemented by the County Government and Nongovernmental organizations 1. Yes 2. No. If yes, please fill the table below:
Programme Are you
aware of this
initiative?
1 = Yes; 0 =
No
Implemente
d by
1-County
government
2- NGO
(Specify)
3- Both
Do you
participate
in it?
1-Yes 0-No
Motivation
1-To increase yields,
2-Access to extension
3-Access to credit,
4- Ready market
output
5- Low cost
participation
for
of
Outcome Before
Participation
After
Participatio
n
Challenges
Encountered
1-High costs
2-Too
procedural
3-Other….
4-Favoritsm
5-Lack
information
6-Other….
of
1.Growing fodder and pastures
Milk (litres per cow)
2.Improving livestock breed
Crop yields
3. Enclosures Livestock value
sold in the market
4.Artificial insemination
Herd size
5. Vaccination Frequency diseases
of
6.Growing fruit Monetary value of losses during
drought
7.Bee keeping
8. Camel rearing
9. Other

16
SECTION F: (i) MARKET PARTICIPATION
22. Please fill the table below if you have participated in the following markets during the last 12 months:
Product Participati
on
1-Yes
2-No
Market type
1- Open air
market
2- Slaughter
house
3- Supermarket
4-
Schools/colleges
5-Hospitals
6-Prisons
7-Cereals
board
8- Religious
institution e.g.
church,
orphanage etc 9- Other..
Distance
To
market
(Km)
Frequen
cy of
particip
ation
Quantity
Bought
Buying
Price
Per unit
Quantity
Sold
Selling
Price
Per unit
Gender
participation
1=% men
2=% women
Challenges
1- Distance to
market
2- Poor market
infrastructure
3- Exploitation by
middlemen
4- Price
fluctuations
5-Output
fluctuations
6-High levies
Cattle
Goats
Sheep
Chicken
Milk (Litres)
Hides
Land (acres)
Hay/Fodder
-Maize -Beans
-Onions
-Green grams
-Mangoes
-Papaws -Melon

17
Information

18
Construction
Credit
Construction
ii); OFF TAKE RATES
23. Besides sales, please indicate your livestock off- take in the table below:
Livestock Type
Breed Numbers consumed at home
Number given as gift Number lost due to theft Number lost due to disease and drought
24. Do you sell any milk from your livestock? 1. Yes, 2. No. If yes, Please fill the table below:
Numbers of litres sold (Per
day)
Price(per
unit)
(Per day)
Litres sold in
Wet season
(Per day)
Litres sold in
Dry season
(Per day)
Amount consumed
in Wet Seasons (Per
day)
Amount consumed in
Dry Seasons (Per day)
25. In which months of the year do you receive high prices in the market? Please fill in the table below:
Commodity Months in the year when
prices are highest
How do you prepare to benefit from the high market prices
1-Target harvest to coincide with these months, 2-Stock breeds to be sold when
market prices are good, 3-Store harvest 4-Other…………………….
Cattle
Goats
Sheep
Chicken

19
Milk
Maize
Beans
Onions

20
26. Other Output How much do you produce of these? Please fill the table below;
Type Quantity Produced Used at farm Quantity sold Sale Price
Hides and Skin
Manure
Other
27. How much cost did you incur last year in the production of crops and livestock? Please fill the table below: Input Item Quantities Cost price per unit Total cost
Feeds
Salt
Drugs and vaccines
Acaricides
Fertilizer
Seeds
Plough land
Land rent
Pesticides and herbicides
Other…..
Total cost
28. Who does the following livestock practices on the farm? Please fill the table below;
Management
Activities
1- Adult males(>18 years)
2- Adult females (>18 years)
3- Children
(10-18 years)
4- Children (below 10 years) 5- Elderly (above 65 years)
Source
1-Family. 2-Hired
3-Other………
Number of
people involved
per week
Wages per week
paid to men
Wages Per week paid to
women
Milking
Herding

21
Watering

22
Calf management
Salt
supplementation
Vaccination and treatment
Ploughing
Planting
Weeding
Harvesting
Storage
Marketing
Cattle, sheep &
goats
Milk
Chicken & eggs
Crops
SECTION F: RESILIENCE OUTCOMES
a. Food Access 29. What is the average number of meals consumed in a day in your family?................. 30. How much does your household spend in buying food items per month?...Kshs…………………………. 31. Were there any months, in the past 12 months, in which you did not have enough food to meet your family’s needs?
1. Yes 2. No

23
If yes, in which months did the family experience inadequate food supplies? Please fill the table below;
Mar 16
April 16
May 16 June 16 July 16 Aug 16 Sept 16 Oct 16 Nov 16 Dec 16 Jan 17 Feb17
Record 1=Yes 0=N0
Extent of food
insecurity
1-missed food for
one day, 2-missed
food for two days
3- missed food
for a week
Average number
of meals your
household had in
a day
32. What was the cause of this inadequate food supply? 1. Low supply in the market 2. High prices 3. Poor harvest 4. Other……………………………………………………………..
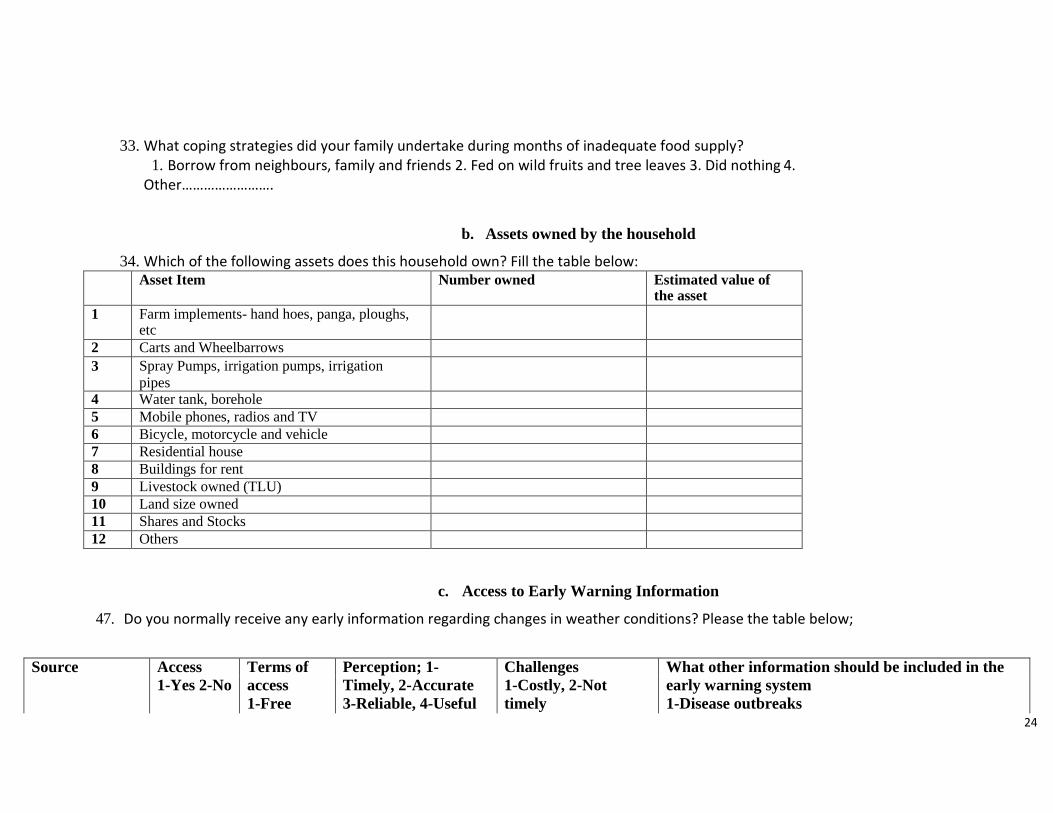
24
33. What coping strategies did your family undertake during months of inadequate food supply? 1. Borrow from neighbours, family and friends 2. Fed on wild fruits and tree leaves 3. Did nothing 4.
Other…………………….
b. Assets owned by the household
34. Which of the following assets does this household own? Fill the table below: Asset Item Number owned Estimated value of
the asset
1 Farm implements- hand hoes, panga, ploughs, etc
2 Carts and Wheelbarrows
3 Spray Pumps, irrigation pumps, irrigation
pipes
4 Water tank, borehole
5 Mobile phones, radios and TV
6 Bicycle, motorcycle and vehicle
7 Residential house
8 Buildings for rent
9 Livestock owned (TLU)
10 Land size owned
11 Shares and Stocks
12 Others
c. Access to Early Warning Information
47. Do you normally receive any early information regarding changes in weather conditions? Please the table below;
Source Access Terms of Perception; 1- Challenges What other information should be included in the 1-Yes 2-No access Timely, 2-Accurate 1-Costly, 2-Not early warning system 1-Free 3-Reliable, 4-Useful timely 1-Disease outbreaks

25
2-Paid for 3-Unreliable, 4- 2-Price changes, 3-Onset and end of rainy season Other
Radio
Television

26
Mobile phone
Social media
Internet
Print media
Other…
Access to Savings and Credit
54. Are you a member of any Savings and Credit institution/organization group? 1. Yes …… 2 No………. If yes, which type?
a. SACCO b. Table banking c. Merry go round d. Formal bank e. Mobile money (Specify)……………………. 55. Can you access credit from any of the sources if you needed it? 1. Yes …… 2 No……….
56. Have you received any credit in the last 12 months? If yes, fill the table below:
Source Amount
Received
Amount Received
Vs Amount
applied
(1=25%, 2=50%
3=75%,4=100%)
Use
(1=Buy farm inputs,
2.=Expand business,
3=Pay school fees,
4=Buy assets, 5=Buy
food
Proportion of loan
already repaid
(1= 25%, 2=50%
3=75%, 4=100%)
Challenges to credit access
credit
(1= Lack of collateral, 2
=High interest, 3
=Procedural 4 =Other…..)
Formal Bank
Micro finance institution
SACCO
Community groups
Relatives/friends

27
Mobile Money (specify)
57. If the household doesn’t have access to credit, what is the reason why you cannot access credit facilities?

28
1. No need 2. Not aware 3. Lack of enough collateral to secure a facility 4. High interests 5.Too procedural. 6. Other………
e. Access to Basic services
58. In the last 12 months have you been able to have access to the following: Service Did you get
this service
1 Yes 0 No
Distance Expenditure
In Kes
Challenges
(1 Distance 2 Expensive 3 Poor
services 4 No personnel 5 Poor quality)
Health service
Mobile clinic,
Dispensary,
Sub county Hospital,
County Hospital
Private Hospital
Water
Tap,
Borehole,
Stream
River
Lighting
Electricity
Solar panel
Solar lamps
Lantern lamps
58. In the last 12 months have you been able to have access any form of extension services? If so, please fill table below:

29
Provider
1- Private
2- County government
3- Farmer to farmer
4-Credit linked extension
5-Outgrower 6-Agro dealer
Channel:
1 Home visits
2 Phone
3 Field school
4 Other……….
Terms of provision
1 Free
2 Paid for
3 Other……
Challenges
1-Costly 2- Infrequent
visits 3-
Communication
barrier 4- Distance
5-Farmers not willing
to share information
What can be done
1-Reduce costs
2- Train more contact
farmers
3- Establish field
schools 4- Other………..

30
7- Church
8- Other……….
6-
Other…………………
f. Income
59. Non Livestock Farm Income Activities (in the last 12 months)
Enterprise Amount harvested Amount
consumed
Amount fed to
livestock
Amount sold
(units)
Price per unit
Maize (bags)
Beans (bags)
Onions (Kgs)
Green grams (Kgs)
Honey (Kgs)
Income Activities
60. What are your major sources of income?
Income source Amount Derived Proportion of income derived from
it
(1=none; 2=<25%; 3 = 25
-50%;4=50-75%; 5=>75%)
Number of male adults
involved
Number of female adults
involved
Crops – (list 3 main ones)

31
Livestock – (list 3 main ones)
Business
Employment
Investment Income
Artisan

32
Remittances from family or friends
Remittance from county government
Gold mining
Sand harvesting
Charcoal Burning
Brick Making
Other…….
SECTION G: FUTURE SCENARIO
61. What other enterprise would you want to engage or continue in the next 5 years? Please fill the table below:
Enterprise
(1- Livestock, 2-Crops, 3- Business,
Rent, etc 4- Other ............ )
Motivation
(1-More profitable, 2-Less time
consuming, 3-Resource availability
4- Reduced interest rates 5-Other……
Needed Support;
(1-Capacity building 2- Institution
framework, 3-Reduce bureaucracy 4-
Infrastructure development, 5- Security 6- Reduce taxes 7-Other……
SECTION H: DEMOGRAPHIC CHARACTERISTICS
Gender of Household Head (1= Male, 2= Female) Age of Household head (years) Marital status(1= Single, 2= Married 3= Widowed/divorced/separated) Years of schooling of Household head……………………….. Number of males------------------------------------------------------- Number of females…………………………………………….. Number of people who have lived in this household for the last 4 months……………..

33
SECTION I: EMPLOYMENT AND EDUCATION
Aged below 15
years
Aged 15-35 years
Aged 36- 65 years
Above 65
years Number of Household members
Labor disaggregation
Working on-farm only
Working off-farm only
Working both off & on-farm
Education (Quality of human capital)
Completed Primary education; male = female =
Completed Secondary education male = female=
Completed Tertiary education male = female =
Completed University education male = female =
Dropped out at primary male = female =
Dropped out at secondary school male = female =
THANK YOU!