a social portrait of communities in ireland - Office for Social Inclusion
100
A SOCIAL PORTRAIT OF COMMUNITIES IN IRELAND Building an Inclusive Society
Transcript of a social portrait of communities in ireland - Office for Social Inclusion

A SOCIAL PORTRAIT OFCOMMUNITIES IN IRELAND
Building an Inclusive Society


A SOCIAL PORTRAIT OFCOMMUNITIESIN IRELAND

Brian Nolan* and Bertrand Maitre**
*School of Applied Social Science, UCD,**The Economic and Social Research Institute
November 2008


4
THEOFFICEFOR
SO
CIA
LIN
CLU
SIO
N
Foreword from the Minister 6
Brollach ón Aire 7
Director’s Statement 8
Ráiteas an Stiúrthóra 9
Introduction 11
Chapter 1: Urban and rural disadvantage 13
Population composition 16
Access to services 19
Education in urban and rural areas 19
Employment 20
Health services 21
Transport and communication 22
Housing 24
Income, poverty and deprivation 27
Consistent poverty 28
‘At risk of poverty’ 29
Types of deprivation 30
Disadvantaged urban and rural areas 33
Future prospects and data needs 35
Chapter 2: Migrants and ethnic minority groups 37
Recent migration 38
Where are the immigrants coming from? 39
Different types of migration 40
Migration and population composition 43
Educational attainment 45
Employment 47
Housing, health and social provision 48
Migrants, ethnic minorities and discrimination 49
Future prospects and data needs 52
TABLE OF CONTENTS

5
CO
NTE
NTS
ASOCIALPORTR
AITOF
CO
MM
UN
ITIESIN
IRELA
ND
Chapter 3: The Traveller community 55
What is the Traveller community? 56
How many Travellers? 56
Where Travellers live 59
Families and households 59
The socio-economic circumstances of Travellers 62
Education 63
Employment 64
Health 66
Housing 67
Discrimination 68
Future prospects and data needs 68
Chapter 4: The homeless 69
What is homelessness? 71
How many homeless? 72
The socio-economic profile of the homeless 74
Experience of homelessness 78
Future prospects and data needs 81
Chapter 5: Conclusions 83
Glossary 89
Bibliography and further reading 93

6
THEOFFICEFOR
SO
CIA
LIN
CLU
SIO
N
This social portrait of communities in Ireland is oneof a series commissioned by the Office for SocialInclusion from the Economic and Social ResearchInstitute. These social portraits relate to the lifecycleapproach, which underpins the social partnershipagreement, Towards 2016, and the National ActionPlan for Social Inclusion 2007-2016 (NAPinclusion).
This portrait provides data and information on smallercommunities in Ireland that are particularly vulnerableto poverty and social exclusion. It deals with theposition of migrants and ethnic minorities, theTraveller community, the homeless, and the type ofdisadvantage experienced in urban and rural areas.It illustrates the importance of having clear andcomprehensive data for devising appropriate policiesto meet the varying needs of people experiencingpoverty, and for helping to ensure effectiveimplementation of those policies.
The information is also important not just forpolicymakers and administrators, but also for thepublic generally in working to create a more informedunderstanding of the nature and causes of povertyand social exclusion, and of the challenges to be metin working for their progressive elimination.
Because of the particular and varying circumstancesfaced by vulnerable groups and by those living inareas of urban and rural disadvantage, gathering theinformation required can be difficult. Nevertheless,the information made available in this portrait and theothers provides a clear picture overall of the oftenmultiple disadvantages that lead to poverty and socialexclusion. This information and analysis greatly helpsin developing policies and monitoring theeffectiveness of their implementation.
A key aim of the lifecycle approach is to promotemore integrated policies and their implementation toaddress, in particular, multiple disadvantages.The goal is to achieve a better balance betweenindividual policies such as social welfare, educationand health and improving overall welfare and well-being. A further key aim is to ensure thatGovernment resources are used to best effect inachieving social inclusion.
A key priority of the NAPinclusion is to improve thelives of people living in disadvantaged areas throughprogrammes designed to build viable and sustainablecommunities and social capital. Specially tailoredsupports, in addition to the normal social welfare,employment and other supports and services, areprovided to meet the particular needs of the othergroups described in this report.
The objectives of the NAPinclusion have beenprioritised in the commitments contained in theProgramme for Government, which underlines theGovernment’s fundamental commitment to protectthe vulnerable and less well-off in society, particularlyin these difficult economic times. The information inthis and the other portraits make a valuablecontribution to this strategic process.
I would like to thank the ESRI and, especially theauthors, Bertrand Maitre and Brian Nolan,who prepared this social portrait, and the Office forSocial Inclusion who commissioned it. Thanks arealso due to the National Adult Literacy Agency whoprovided guidance on plain English standards for theproduction of the portrait.
Mary Hanafin TDMinister for Social and Family Affairs
FOREWORD FROM THEMINISTER

7
MIN
ISTE
R’S
FOR
EW
OR
DB
RO
LLAC
HÓ
NA
IRE
ASOCIALPORTR
AITOF
CO
MM
UN
ITIESIN
IRELA
ND
Baineann an phortráid seo le sraith portráidí arnagcoimisiúnú ag an Oifig um Chuimsiú Sóisialta ónInstitiúid um Thaighde Eacnamaíochta agus Sóisialta.Baineann na portráidí sóisialta seo leis an gcurchuige saolré is bonn do chomhaontaú páirtíochtaI dTreo 2016, agus don Phlean GníomhaíochtaNáisiúnta um Chuimsiú Sóisialta 2007-2016(cuimsitheacht PGN)
Soláthraítear sa phortráid seo sonraí agus eolas faoina pobail níos lú in Éirinn is leochailí maidir lebochtaineacht agus le heisiamh sóisialta. Pléitear saphortráid seo le staid na n-imirceach agus namionlach eitneacha, leis an lucht siúl, le daoine ganáitreabh agus leis an saghas míbhuntaiste a chastarle lucht cónaithe uirbeacha agus tuaithe. Léiríonn séa thábhachtaí is atá sé sonraí cuimsitheacha soiléirea bheith ar fáil chun polasaithe iomchuí chun freastalar riachtanais éagsúla daoine i mbochtanas aguschun féachaint chuige go gcuirfear na polasaithe sini bhfeidhm go héifeachtach.
Ní hamháin go bhfuil an t-eolas sin tábhachtach dolucht déanta polasaithe agus do lucht riartha, achdon phobal i gcoitinne maidir leis an obair abhaineann le tuiscint níos fearr ar cad isbochtaineacht agus eisiamh sóisialta ann agus cad isbun leo, mar aon leis na dúshláin atá roimh dhaoine abhíonn ag obair chun deireadh a chur leo, diaidh arndiaidh.
I ngeall ar na dálaí áirithe éagsúla a gcaithfidh grúpaíleochaileacha agus daoine a chónaíonn i gceantairuirbeacha agus tuaithe faoi mhíbhuntáiste dul i ngleicleo, ní héasca an t-eolas a theastaíonn a bhailiú.Ina dhiaidh sin agus uile, soláthraíonn an fhaisnéis achuirtear ar fáil sa phortráid seo agus eile ollphictiúrsoiléir de na míbhuntáistí sin ar il-mhíbhuntáistí iad,go minic, a thugann ann don bhochtaineacht agusdon eisiamh sóisialta. Is mór an chabhair an fhaisnéissin agus an anailís sin chun polasaithe a fhorbairtagus chun monatóireacht a dhéanamh ar cé chomhhéifeachtach is a chuirtear i bhfeidhm iad.
Ceann de phríomhaidhmeanna an chur chuige saolréis ea é polasaithe níos comhtháite a chur chun cinnagus a chur i bhfeidhm chun aghaidh a thabhairt ar
il-mhíbhuntáistí, ach go háirithe. Is é an sprioc nácothromaíocht níos fearr a bhaint amach idirpolasaithe aonair, mar shampla, polasaithe leasashóisialaigh, oideachais agus sláinte, agus leassóisialach agus leas an phobail i gcoitinne a churchun cinn. Ceann eile de na príomhaidhmeanna isea é féachaint chuige go mbaintear an leas is fearr asacmhainní Rialtais chun cuimsiú sóisialta a thabhairti gcrích.
Ceann de phríomhthosaíochtaí a bhaineann lecuimsitheacht PGN is ea é feabhas a chur ar shaoldaoine a chónaíonn i gceantair faoi mhíbhuntáiste, tríchláir arna ndearadh chun pobail inmharthanachaagus inbhuanaithe a thógáil, mar aon le caipitealsóisialta. Soláthraítear tacaíochtaí speisialtasaincheaptha,mar aon lena mbíonn de thacaíochtaí leasashóisialaigh, fostaíochta agus eile ann de ghnáth,chun freastal ar na riachtanais ar leith atá ag nagrúpaí eile ar a bhfuil cur síos sa tuarascáil seo.
Tá na cuspóirí a bhaineann le cuimsitheacht PGNrangaithe in ord tosaíochta de réir na ngealltanas igClár an Rialtais, ina leagtar béim ar ghealltanasbunúsach an Rialtais cosaint a thabhairt doleochaileach agus do dhaibhir na sochaí, i laethantadeacra seo an gheilleagair, ach go háirithe. Cuireannan fhaisnéis sa phortráid seo agus sna portráidí eilego mór leis an bpróiseas straitéiseach seo.
Is mian liom mo bhuíochas a chur in iúl don ESRIagus do Bertrand Maitre agus Brian Nolan, na húdaira d’ullmhaigh an phortráid shóisialta seo, agus leis anOifig um Chuimsiú Sóisialta a dhein a choimisiúnú.Tá buíochas ag dul, chomh maith, don ÁisíneachtNáisiúnta Litearthachta do Aosaigh, a chuir treoir arfáil maidir le caighdeáin ghlan-Bhéarla i dtáirgeadh naportráide seo.
Mary Hanafin TDAire Gnóthaí Sóisialacha agus Teaghlaigh
BROLLACHÓN AIRE

8
THEOFFICEFOR
SO
CIA
LIN
CLU
SIO
N
Social inclusion is about working to ensure thatpeople who are marginalised have, at a minimum,the standards of living, access to services and sociallife that are the norm for the majority of people inIreland. Government policies and programmes makean enormous contribution to social well-being, but weneed to constantly evaluate their effectiveness inrelation to the outcomes being achieved.
The series of social portraits make an importantcontribution to this process. They not only provideinformation on how each of the groups at variousstages of the lifecycle are faring, but assist us inmonitoring the extent to which progress is beingmade in achieving the goals and targets under theNational Action Plan for Social Inclusion 2007-2016(NAPinclusion) and its related strategies, as set outin the social partnership agreement Towards 2016,and the social inclusion chapter of the NationalDevelopment Plan, 2007 – 2013.
People experiencing poverty are not a homogenousgroup, as is evident from the varying circumstancesof the groups described in this social portrait andtheir vulnerability to poverty and social exclusion.The accompanying analysis in the portrait alsoexplains the multifaceted and deep seated nature ofpoverty and the need for special targeted support ifvulnerable groups are to overcome poverty anddisadvantage. The integrated and targeted approachneeded, being further facilitated and promotedthrough the lifecycle approach, is now embedded inthe governance structures in the form of theNAPinclusion and its related social inclusionstrategies.
We need to apply indicators in measuring progressand, in particular, for inputs, outputs and mostimportantly outcomes. The effectiveness of indicatorsdepends on the adequacy of data, which is alsonecessary for the development of evidence basedpolicy. This social portrait illustrates how availabledata can be compiled and analysed to provide agood understanding of the circumstances of thegroups covered. However, it also highlights theexistence of data and information gaps that mayhinder a fuller understanding of their position. This isparticularly the case for smaller groups, such asthose covered in this portrait, who are too small tohave details of their particular situation captured inthe key sample surveys such as the EU Survey onIncome and Living Conditions, which measurespoverty levels, and the Quarterly National HouseholdSurvey, which measures participation in the labourmarket.
Improving our understanding of the characteristics ofthese groups will, therefore, require innovative use ofadministrative data. This has the potential to helpproduce a more in-depth picture. The issues of datagaps and data availability are being addressed by theTechnical Advisory Group, which advises the Officefor Social Inclusion on data provision and relatedmatters. This Group meets on a regular basis andprovides a forum for stakeholders, including thesocial partners, to exchange information ondevelopments in the area of data and indicators.The data strategies of Government departments alsofocus on data availability and collection, and theirimportance and value for policy development andevaluation. The development of these data strategiesform part of the work programme, undertaken acrossGovernment, to improve the quality and range ofsocial and equality statistics available to supportpolicy.
The Office for Social Inclusion is fully engaged in allaspects of monitoring and evaluating the progressbeing made in achieving social inclusion under thevarious strategies. The Office reports regularly on theoutcomes being achieved to all stakeholders and thegeneral public at national level, and to the EuropeanUnion. The social portraits greatly assist in providinga context for this work and the backgroundinformation needed to evaluate progress and identifypriorities for future development.
Finally, I wish to join with the Minister in thanking theESRI authors for producing this portrait, and the staffof this Office working on the project.
Gerry ManganDirectorOffice for Social Inclusion
DIRECTOR’SSTATEMENT

9
DIR
EC
TOR
’SS
TATEM
EN
RÁ
ITEA
SA
NS
TIÚR
THÓ
RA
ASOCIALPORTR
AITOF
CO
MM
UN
ITIESIN
IRELA
ND
Baineann cuimsiú sóisialta leis an obair is gá adhéanamh chun féachaint chuige go mbíonn, ar angcuid is lú de, fáil ag daoine imeallaithe ar nacaighdeáin maireachtála, rochtain ar sheirbhísí agusan saol sóisialta acu a áirítear mar an norm dothromlach na ndaoine in Éirinn. Cuireann polasaitheagus cláir an Rialtais go mór le leas an phobail, achis gá dúinn a bheith de shíor ag measúnú an-éifeachta ó thaobh torthaí de.
Cuid thábhachtach den phróiseas sin is ea an tsraithpórtráidí sóisialta seo. Ní hamháin go soláthraítearfaisnéis iontu maidir le conas atá ag éirí leis na grúpaísin ag céimeanna éagsúla saolré, ach cabhraíonnsiad linn monatóireacht a dhéanamh ar dhul chuncinn maidir leis na spriocanna agus na cuspóirí aleagtar síos sa Phlean Gníomhaíochta Náisiúnta umChuimsiú Sóisialta 2007-2016 (cuimsitheacht PGN)agus na straitéisí a ghabann leis, mar a leagtaramach sa chomhaontú páirtíochta sóisialta, I dTreo2016, agus san alt a bhaineann le cuimsiú sóisialtasa Phlean Forbartha Náisiúnta, 2007-2013.
Ní dream aonchineálach daoine a mbíonn anbhochtaineacht ag cur orthu, mar is léir ach breathnúar dhálaí éagsúla na ngrúpaí ar a bhfuil cur síos saphortráid seo agus ar a leochailí is atá siad maidir lebochtaineacht agus le heisiamh sóisialta. Míníonn ananailís a ghabann leis na cúrsaí sin sa phortráid seo ariachtanaí is atá tacaíocht speisialta shaindírithe, chungo mbeidh grúpaí leochailleacha i gcumas teacht slánas bochtaineacht agus as míbhuntáiste. Tá an curchuige comhtháite saindírithe is gá anois ina chuid dena struchtúir rialála i bhfoirm cuimsitheacht PGNagus na straitéisí um chuimsiú sóisialta a bhaineannleis.
Is gá dúinn táscairí a chur i bhfeidhm maidir le dulchun cinn agus ó thaobh ionchur agus aschur deagus ó thaobh torthaí de, thar aon ní eile. Braitheannéifeacht na dtáscairí ar leordhóthain sonraí a bheithar fáil, rud is gá chun polasaí bunaithe ar fhianaise afhorbairt, chomh maith. Léiríonn an phortráidshóisialta conas is féidir na sonraí a bhíonn ar fáil athiomsú agus anailís a dhéanamh orthu chun tuiscintmhaith a fháil ar dhálaí na ngrúpaí a chlúdaítear.
Ina theannta sin, áfach, léiríonn sé bearnaí sonraíagus faisnéise a chuireann bac ar thuiscint níosiomláine maidir leis an riocht ina bhfuil siad. Is fíorsin, ach go háirithe, i gcás grúpaí níos lú, ar an-áirítear na grúpaí a chlúdaítear sa phortráid seo,atá róbheag chun go ngabhfaí sonraí a ndálaí ar leithi suirbhéanna eochairshamplaí mar an Suirbhé AE ar
Ioncam agus Dhálaí Maireachtála (EU-SILC); agusan Suirbhé Buiséid Teaghlaigh gach ráithe, aghlacann miosúr na rannpháirtíochta sa mhargadhsaothair.
Ar an ábhar sin, caithfear úsáid nuálach a bhaint assonraí riaracháin chun ár dtuiscint ar shainghnéithena ngrúpaí a fheabhsú. Ba chúnamh é sin chunpictiúr níos doimhne a sholáthar. Tá an GrúpaComhairleach Teicniúil, a chuireann comhairle ar anOifig um Chuimsiú Sóisialta maidir le soláthar sonraíagus cúrsaí gaolmhara, ag dul i ngleic le ceist nambearnaí sonraí agus na sonraí a bhíonn ar fáil.Tagann an Grúpa le chéile go tráthrialta agussoláthraíonn sé fóram do lucht leasmhara, ar an-áirítear na comhpáirtithe sóisialta, chun eolas amhalartú maidir le forbairtí a bhaineann le sonraí agusle táscairí. Leagtar béim, chomh maith, i straitéisísonraí na Ranna Rialtais ar an saghas sonraí a bhíonnar fáil agus á mbailiú, agus ar an tábhacht abhaineann leo maidir le polasaithe a fhorbairt agus amheasúnú. Tá forbairt na straitéisí sonraí mar chuidden chlár oibre Rialtais i gcoitinne, chun feabhas achur ar cháilíocht agus ar réimse na staitisticísóisialta agus comhionannais a bhíonn ar fáil marthaca le polasaí.
Tá an Oifig um Chuimsiú Sóisialta lánghafa le gachgné de mhonatóireacht agus de mheasúnú ar an dulchun cinn a bhíonn á dhéanamh i dtreo sóisialta achur i gcrích faoi na straitéisí éagsúla. Déanann anOifig tuairisciú rialta ar na haschuir don luchtleasmhara ar fad agus don phobal ar an leibhéalnáisiúnta agus don Aontas Eorpach. Is mór anchabhair na portráidí sóisialta chun comhthéacs asholáthar i gcomhair na hoibre sin, mar aon leis aneolas cúlra a theastaíonn chun dul chun cinn a mheasagus tosaíochtaí a aithint le forbairt amach anseo.
Mar fhocal scoir, is mian liom mo bhuíochas féin achur leis an mbuíochas a ghaibh an tAire leis nahúdair ESRI as an phortráid seo a sholáthar, agus lebaill na hOifige seo atá ag obair ar an tionscadal seo.
Gerry ManganStiúrthóirAn Oifig um Chuimsiú Sóisialta
RÁITEAS ANSTIÚRTHÓRA

10
THEOFFICEFOR
SO
CIA
LIN
CLU
SIO
N

INTRODUCTION
THEOFFICEFOR
SO
CIA
LIN
CLU
SIO
N
12
This is the fourth report in the series of social portraits of the lifecycleof groups as set out in the National Action Plan for Social Inclusion,2007 – 2016. In this report we aim to make key facts and figures aboutseveral particularly vulnerable groups in Ireland in an accessible way.These groups are:
• people living in areas of urbanand rural disadvantage;
• migrants and ethnic minorities;
• the Traveller community; and
• the homeless.
This information is particularly relevant to policy, including the NationalAction Plan for Social Inclusion (NAPinclusion).Some of the NAPinclusion’s aims are to:
• build viable and sustainable communities; and
• to improve the lives of those people living inareas or situations of poverty.
These groups face a particularly high risk of poverty and exclusion andit is difficult to gather the information to draw accurate social portraitsof them. This report will show that the features of these groups meanthat getting a reliable picture of them through conventional informationsources, such as household surveys, is very difficult.
Among other things, this means that unlike other social portraits in theseries, we cannot present figures for these groups using the widely-used measures of living standards and poverty. An example of one ofthese is the consistent poverty measure used in target-setting in theNAPinclusion. However, the information available does allow us to say agood deal about the circumstances of these groups, and we can alsoidentify the key gaps in that information.

CHAPTER 1.URBAN AND RURALDISADVANTAGE

The aims of the National Action Plan for SocialInclusion (NAPinclusion) include:• building viable and sustainable communities;• improving the lives of people living in
disadvantaged areas;• building social capital; and• tackling disadvantage in urban and rural
areas.
Urban and rural poverty can manifest themselvesin different ways. While poverty is spatially widelyspread throughout the country (Nolan, Whelanand Williams 1998, 1999; Watson et al 2005),some poor households in urban areas live incommunities where there are high levels ofunemployment, concentrations of poverty,and poor environmental and social infrastructures.Rural disadvantage on the other hand can beassociated with limited employment opportunities,lack of transport and other services, highdependency levels and isolation. This section ofthe social portrait provides relevant informationon the urban and rural population that puts theirdifferent situations in context. It also drawsattention to distinctive features of urban andrural disadvantage.

15
UR
BA
NA
ND
RU
RA
LD
ISA
DVA
NTA
GE
ASOCIALPORTR
AITOF
CO
MM
UN
ITIESIN
IRELA
ND
In Ireland, as well as there being generalmethodological issues when looking at thesevulnerable groups, we have to interpret someindicators differently in urban areas to those ofrural areas. For example, small-scale farmingmeans that unemployment is a less accurateproxy for levels of generalised deprivation in ruralareas than it is in urban areas. Previous researchfocused on specific indicators. Watson et al(2005), using results from the 2002 Census,distinguished between counties and countyboroughs and presented three key indicators,namely unemployment, economic dependencyand absence of educational qualifications.Various researchers are currently analysingsimilar results from the 2006 Census. We canidentify very specific areas or pockets ofconcentrated disadvantage using theseindicators. However, it is useful to set thesepockets in a broader comparison between urbanand rural populations; as well as across towns ofvarious sizes.
In this portrait, we use the 2006 Census and theEU-SILC household survey as sources to:
• describe the overall profile of these pockets ofconcentrated disadvantage in terms of age,education and employment;
• discuss the nature and extent of poverty anddeprivation; and
• compare and contrast the distinctive nature ofpoverty and exclusion in urban areas to thatof rural areas.
The Census of Population is the key source available to assess andcompare levels of disadvantage in specific urban or rural geographicalareas. This is because (unlike household surveys) it providesinformation on each household in the country and thus can be used tocompare the characteristics of the households in one small area(notably District Electoral Divisions) with another. However, because theCensus does not provide direct information on income or poverty, wemust use other indicators that may be associated with poverty anddeprivation as “proxies”. The most important of these proxies areunemployment and dependency, the age structure and the social classprofile of areas. Each of these indicators can be looked at separately,or they can be combined to show a composite measure of multipledeprivation. Combining these indicators has been done in Ireland andelsewhere to rank areas on a summary deprivation index (see forexample SARU, 1999; Haase, 2005).

THEOFFICEFOR
SO
CIA
LIN
CLU
SIO
N
16 1 1 For census purposes towns fall into two types. 1. Townswith legally defined boundaries, comprising five cities, fiveboroughs, and 75 towns. 2. Towns without legally definedboundaries, identified for census purposes by the CentralStatistics Office as a cluster of 50 or more occupieddwellings in which, within a distance of 800 metres, there isa nucleus of either 30 occupied houses on both sides of theroad or 20 occupied houses on one side of the road. Thismore generous interpretation of a “town” would includetowns with a population of fewer than 1,500. Using thesecriteria, 68% of the population of the State live in towns.
Population composition
The 2006 Census shows that 60.7% of thepopulation live in what the Central StatisticsOffice calls “aggregate town areas”, that is,cities or towns with a population of at least1,500; while the remaining 39.3% live in“aggregate rural areas”. From this point forwardwe describe “aggregate town areas” here asurban, while we simply call “aggregate ruralareas” rural.
The percentage living in urban areas rangesfrom:
• 75% in Leinster;
• 52% in Munster;
• 34% in Connacht; to
• only 26% in the three Ulster counties.1
In comparison, over half the population of theenlarged European Union live in rural areas.The State is divided into eight regionalauthorities.
Figure 1.1 compares the percentage of thepopulation of each regional authority area living intowns of various sizes (from 1,500 upwards),with those living in rural areas. Only Dublin andCork cities exceed 100,000 in population, whileGalway city has a population of about 72,000,Limerick city has 53,000 and Waterford city has46,000. (In each case this refers to those livingwithin the official town boundaries only.) We seethat most of the population of the Dublin region iscategorised as living in towns. By contrast,almost two-thirds of the population of the borderregion and 64% of the West live in rural areas.

17
UR
BA
NA
ND
RU
RA
LD
ISA
DVA
NTA
GE
ASOCIALPORTR
AITOF
CO
MM
UN
ITIESIN
IRELA
ND
Towns 100,000+
Towns 10,000-99,999
Towns 1,500-9,999
Aggregate rural area
Border
Mid-East Dublin
Midland
Mid-West
West
South-East
South-West
5
54.7%
31.9%
13.5%
5
23.5%
12.6% 63.8%
3
44.4%
30.7%
13.2%
11.7%
21.9%
13.0%65.2%
8
23.6%
39.4% 37.0%
5
58.8%16.0%
25.2%
88.1%
2.3%
4.0%5.7%
56.5%
27.1%
16.4%
Figure 1.1: Population in towns of various size by region, 2006Source:C
ensusofP
opulation,2006

18
THEOFFICEFOR
SO
CIA
LIN
CLU
SIO
N
%
0-14 years
15-24 years
25-44 years
45-64 years
65 years and over
40
35
30
25
20
15
10
5
0
Greate
r DublinAre
aStat
e
Aggregate
Town Are
a
Aggregate
Rural A
rea
Towns
5,000
- 9,999
population
Towns
1,500
- 4,999
population
Towns
10,00
0 population an
d over
Other
Cities
Source:C
ensusofP
opulation,2006
Figure 1.2: Age profile, cities, towns and rural areas, 2006
The census shows that the age profile of ruralareas is older than that of urban areas. Thoseaged 65 or more comprise 12% of those living inrural areas compared with 10% of those in urbanareas. Rural areas also have a higher proportionof children, with those aged below 14 making up22% of rural populations compared with 19% inurban areas. Figure 1.2 shows that theproportion of children is particularly low in Dublinand the other cities. This age profile means thatthe average dependency rate – the ratio ofchildren and older persons to the working agepopulation – is 34% in rural areas but 30% inurban ones. This reflects a complex variety offactors, including: employment, migration andfertility patterns. For example, greater labourmarket opportunities in urban areas attractpeople of working age, who come from ruralareas as well as those who immigrate fromabroad. Higher fertility rates in rural areas reflectcultural and economic factors and why childrenform a higher percentage of the population inthese areas.
The 2006 Census also shows that householdshave different profiles in urban and rural areas.Whereas 31% of urban households are made upof a couple with children, the correspondingfigure for rural areas is 42%. Lone parenthouseholds are more common in urban areas,where they comprise 11% of the total, comparedwith 8% in rural areas. Average household size isslightly higher in rural areas, where it is 2.95persons per household, compared with urbanareas where it is 2.72.
Between the Census of 2002 and 2006 theoverall population of the State grew by 8.2%.The growth in urban and rural areas wassubstantially different. Population growth was10.3% in urban areas and 5.2% in rural areas.The most rapid growth, of more than 20%, wasin urban areas in the Mid-East and Midlandregions.

19
UR
BA
NA
ND
RU
RA
LD
ISA
DVA
NTA
GE
ASOCIALPORTR
AITOF
CO
MM
UN
ITIESIN
IRELA
ND
Access to services
Access to services can play a crucial role inpeople’s quality of life. Problems in relation toaccess, as might happen more in rural areas,could undermine that quality of life. In thefollowing sections, we look at access in relationto:
• education;
• employment;
• health services;
• transport and communication; and
• housing.
Education in urban and rural areas
The educational level attained by those living incities and towns of various sizes versus ruralareas is shown in Figure 1.3. The proportionhaving only primary education is highest in ruralareas. This is linked to the age structure of thepopulation in rural areas, but also to the relianceon farming as a source of employment,particularly in the past. By contrast theproportion with university education is a gooddeal higher in Dublin than in other urban areas,and is lowest in rural areas. This reflects theconcentration of jobs requiring that level ofeducation in urban areas, and in the Dublin areain particular.
Figure 1.3: Education profile, Cites, towns and rural areas, 2006
%
35
30
25
20
15
10
5
0
Primary LowerSecondary
UpperSecondary
Third level,non-degree
Third level,degree
Greater DublinArea
OtherCities
Towns 10,000 population and over
Towns5,000-9,999
population
Towns1,500-4,999
population
RuralAreas
Source:C
ensusofP
opulation,2006

20
THEOFFICEFOR
SO
CIA
LIN
CLU
SIO
N
While schools are generally larger in urbanareas, the average class size at primary level incities is below the national average of 24 childrenin a primary school class (2005/06 school year).In 2006, the school transport scheme carriedabout 140,000 pupils each school day onapproximately 5,000 bus routes.
They included:
• 55,000 post-primary pupils;
• 76,000 primary pupils; and
• 9,000 pupils with special needs.
The Census 2006 shows that 67% of thechildren and student population aged five to 18who travelled to school by bus or coach werefrom rural areas.
Employment
Patterns of employment and non-employmentalso vary across urban and rural areas. In theState as a whole, 57% of those aged 15 or overare in work. The corresponding figures are 58%for urban areas and 56% in rural areas.Figure 1.4 shows that the proportion at work ishigher in Dublin and other town areas than it is inthe cities of Cork, Limerick, Galway andWaterford. The slightly below-average proportionin work in rural areas reflects the high proportionof retired people and those working in the home.This in turn is affected by the older age profile inrural compared with urban areas.
70
60
50
40
30
20
10
0
%
58.4
Greater DublinArea
At work
53.5
Other Cities
59.1
Towns 10,000populationand over
58.2
Towns5,000-9,999population
58.5
Towns1,500-4,999population
56.2
Rural Areas
Source:C
ensusofP
opulation,2006
Figure 1.4: Percentage of population aged 15+ at work in cities, townsand rural areas, 2006

21
ASOCIALPORTR
AITOF
CO
MM
UN
ITIESIN
IRELA
ND
UR
BA
NA
ND
RU
RA
LD
ISA
DVA
NTA
GE
%
16
14
12
10
8
6
4
2
0Greater Dublin
AreaOther Cities Towns 10,000
populationand over
Towns5,000-9,999population
Towns1,500-4,999population
Rural Areas
Unemployed Home Retired lll/disabled Student
U
6.0
9.4
11.1
3.5
11.2
6.1
10.0 10.5
4.8
14.5
6.2
10.49.8 9.8
6.4
11.610.7
4.5
8.2
5.7
11.4 11.5
13.6
12.0
4.9
7.7
4.1 4.1
9.7
4.1
Figure 1.5: Percentage of population aged 15+ unemployed, in the home, retired,ill/disabled and students in cities, towns and rural areas, 2006
Source:C
ensusofP
opulation,2006
As far as the nature of non-employment isconcerned, Figure 1.5 shows that the proportionof unemployed is lower in rural areas thanelsewhere. This is partly because of the role ofsmall-scale farming. There is little variation inunemployment across different types of urbanareas. Later in this social portrait we discuss theextent to which urban unemployment isconcentrated in certain areas within cities andtowns. The proportion of those working full-timein the home is relatively high in rural areas, 95%of those involved being female. This reflectsfactors such as limited opportunities for taking uppaid work, including part-time work, as well astheir older age profile. In comparison, thelocation of third-level institutions in urban areasexplains the higher proportion of students foundin Dublin and other cities. In rural areas, a higherproportion of those at work are self-employed(including farming) than in urban areas. Some16% of the rural population at work in the Stateare self-employed, whereas in Dublin, Cork orGalway, for example, that figure is only about10%.
Health services
People living in urban and rural areas havedifferent levels of access to health services.This may arise for a variety of reasons. Hospital-based services are generally concentrated inurban areas and lack of transport in rural areasmay affect access to health services. Thispotential “urban bias” is a common concern inother countries, as well as in Ireland. Thisconcern may grow as the health service movestowards greater concentration of services aimedat promoting improvements in the quality ofspecialised care. The evidence about howpeople use health services, suggests that thoseliving in a rural area may, for example, visit theirGP less often than similar individuals in urbanareas. However, it is difficult to make thiscomparison fully, taking other factors such as theperson’s health status into account. This issomething that requires in-depth investigation inrelation to the whole range of in-patient and out-patient services. Putting the Department ofHealth and Children’s Primary Care strategy inplace to establish team-based delivery of primarycare services across the country is particularlyimportant in the context of “urban bias” and thedifferent use of GP services between urban andrural areas.
22
THEOFFICEFOR
SO
CIA
LIN
CLU
SIO
N
54.6
4 .5
2 .9
6 .0
F
Urban
Rural
4 .9
1 .4
0 .5
70 .8
0 .6
5 .6
5 .8
13 .2
14.8
9 .2
4 .9
0 10 20 30 40 50 60 70 80%
0 .4
0 .9
On fo ot
Bi c y c l e
Bus , m in ibus or c o a ch
Tra in , DART or LUAS
Motor c y c l e o r s c o o ter
Mot o r c a r : Dr iver
Mot o r c a r : Passenger
Lorry o r van
Figure 1.6: Mode of travel to work by urban versus rural location, 2006
Source:C
ensusofP
opulation,2006
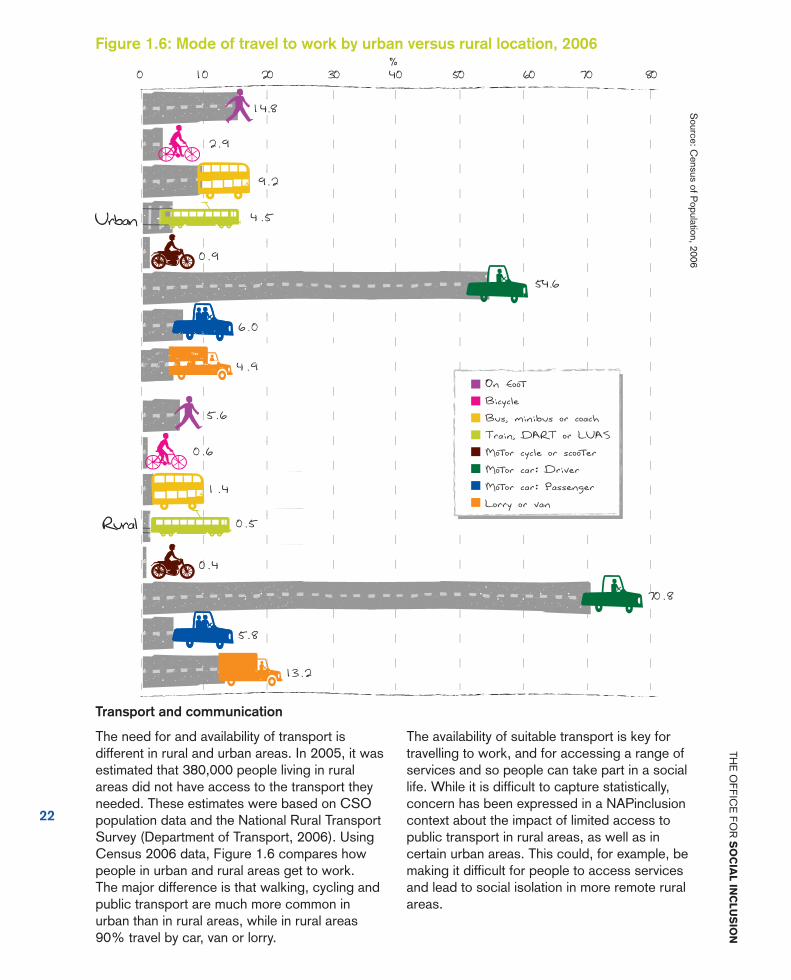
Transport and communication
The need for and availability of transport isdifferent in rural and urban areas. In 2005, it wasestimated that 380,000 people living in ruralareas did not have access to the transport theyneeded. These estimates were based on CSOpopulation data and the National Rural TransportSurvey (Department of Transport, 2006). UsingCensus 2006 data, Figure 1.6 compares howpeople in urban and rural areas get to work.The major difference is that walking, cycling andpublic transport are much more common inurban than in rural areas, while in rural areas90% travel by car, van or lorry.
The availability of suitable transport is key fortravelling to work, and for accessing a range ofservices and so people can take part in a sociallife. While it is difficult to capture statistically,concern has been expressed in a NAPinclusioncontext about the impact of limited access topublic transport in rural areas, as well as incertain urban areas. This could, for example, bemaking it difficult for people to access servicesand lead to social isolation in more remote ruralareas.
23
ASOCIALPORTR
AITOF
CO
MM
UN
ITIESIN
IRELA
ND
UR
BA
NA
ND
RU
RA
LD
ISA
DVA
NTA
GE
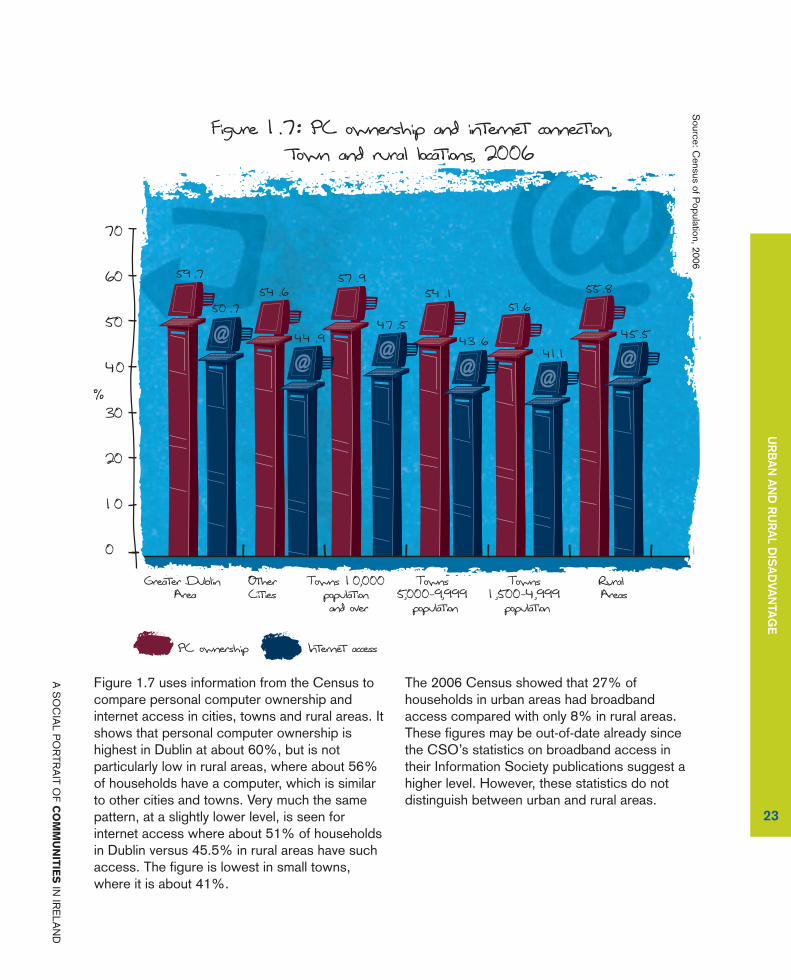
Figure 1.7 uses information from the Census tocompare personal computer ownership andinternet access in cities, towns and rural areas. Itshows that personal computer ownership ishighest in Dublin at about 60%, but is notparticularly low in rural areas, where about 56%of households have a computer, which is similarto other cities and towns. Very much the samepattern, at a slightly lower level, is seen forinternet access where about 51% of householdsin Dublin versus 45.5% in rural areas have suchaccess. The figure is lowest in small towns,where it is about 41%.
The 2006 Census showed that 27% ofhouseholds in urban areas had broadbandaccess compared with only 8% in rural areas.These figures may be out-of-date already sincethe CSO’s statistics on broadband access intheir Information Society publications suggest ahigher level. However, these statistics do notdistinguish between urban and rural areas.
57 .9
47 .5
54 .151.6
55 .8
45 .5
41.143 .6
50 .7
59 .7
54 .6
44 .9
70
60
50
40
30
20
10
0
%
Greater DublinArea
OtherCities
Towns 10,000 populationand over
Towns5,000-9,999
population
Towns1,500-4,999
population
Rural Areas
PC ownership Internet access
Figure 1.7: PC ownership and internet connection, town and rural locations, 2006
Source:C
ensusofP
opulation,2006
24
THEOFFICEFOR
SO
CIA
LIN
CLU
SIO
NFigure 1.8 Housing tenure by town/rural location, 2006
%
50
45
40
35
30
25
20
15
10
5
0
Greater DublinArea
Other Cities Towns 10,000populationand over
Towns5,000-9,999population
Towns1,500-4,999population
Rural Areas
Owner occupied with loan
Owner occupied without loan
Purchased from Local Authority/Voluntary Body
Rented from Local Authority
Private rented
37.8
34.1
43.842.4
39.6
28.8
38.5
46.5
1.91.1
5.4
3.9
13.7
11.2
24.8
26.927.4
15.9 16.2
26.9
2.21.6 1.7 1.8
13.013.9
10.712.2
13.514.6
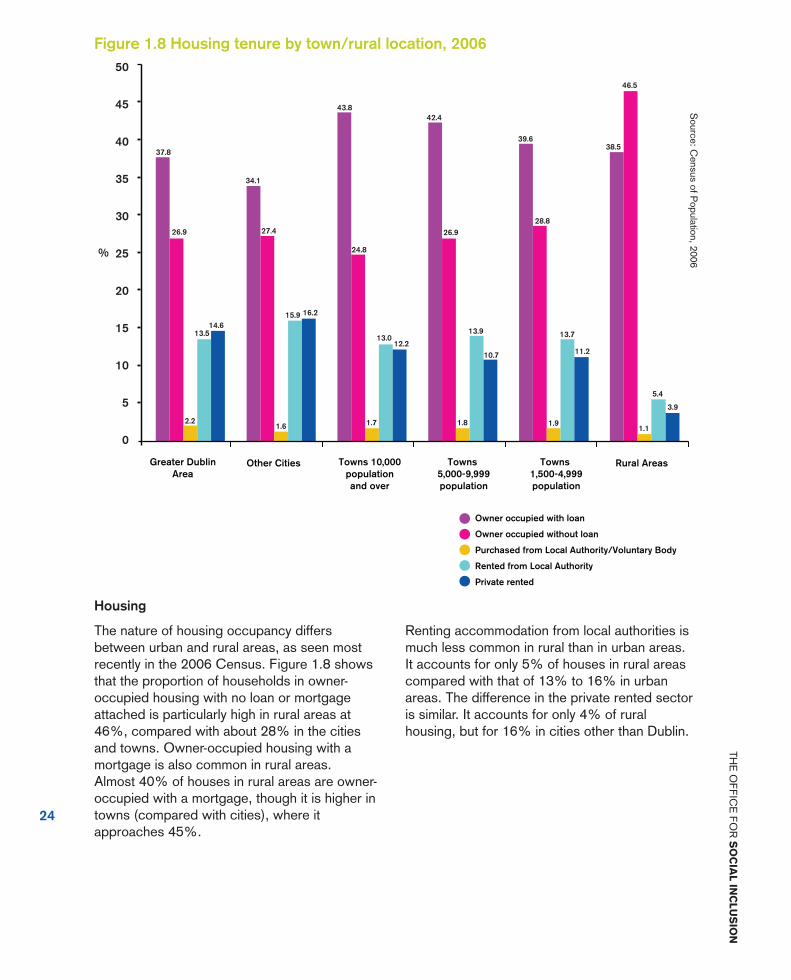
Housing
The nature of housing occupancy differsbetween urban and rural areas, as seen mostrecently in the 2006 Census. Figure 1.8 showsthat the proportion of households in owner-occupied housing with no loan or mortgageattached is particularly high in rural areas at46%, compared with about 28% in the citiesand towns. Owner-occupied housing with amortgage is also common in rural areas.Almost 40% of houses in rural areas are owner-occupied with a mortgage, though it is higher intowns (compared with cities), where itapproaches 45%.
Renting accommodation from local authorities ismuch less common in rural than in urban areas.It accounts for only 5% of houses in rural areascompared with that of 13% to 16% in urbanareas. The difference in the private rented sectoris similar. It accounts for only 4% of ruralhousing, but for 16% in cities other than Dublin.
Source:C
ensusofP
opulation,2006

25
UR
BA
NA
ND
RU
RA
LD
ISA
DVA
NTA
GE
ASOCIALPORTR
AITOF
CO
MM
UN
ITIESIN
IRELA
ND
Figure 1.9: Percentage without central heating by town/rural location, 2006
%
14
12
10
8
6
4
2
0
Greater DublinArea
7.7
11.6
8.0
10.0 10.0
11.0
Other Cities Towns 10,000populationand over
Towns5,000-9,999population
Towns1,500-4,999population
Rural Areas
The Census also has information about the typesof housing and the facilities available tohouseholds in different areas. This informationincludes whether or not they have hot and coldrunning water, central heating and what type ofsewage system they have. Nearly all houses nowhave hot and cold running water. The numberwithout central heating is now down to about9%. Figure 1.9 shows that the proportionwithout central heating is lowest in Dublin, but isno higher in rural areas than in other cities or insmall towns.
Source:C
ensusofP
opulation,2006

26
THEOFFICEFOR
SO
CIA
LIN
CLU
SIO
N
0.3
0.25
0.2
0.15
0.1
0.05
0Cities & suburbs Towns
population5,000 +
Townspopulation1,000-5,000
Mixedurban/rural
Rural
H
0.8
0.7
0.6
0.5
0.4
0.3
0.2
0.1
0Cities & suburbs Towns
population5,000 +
Townspopulation1,000-5,000
Mixedurban/rural
Rural
E
Figure 1.10: Mean score on housing deprivation index by town/rural location, 2006
Source:E
U-SILC
,2006Source:E
U-SILC
,2006
Figure 1.11: Mean score on local environment deprivation index by town/rural location, 2006
The EU-SILC survey gives information onhousing-related deprivation in urban versus ruralareas. This information allows us to create anindex of deprivation from items relating tohousing and housing-related facilities. The indexgives each household a score and measures thenumber doing without:
• a bath or shower;
• an internal toilet;
• hot running water; or
• central heating.
Figure 1.10 shows that housing-relateddeprivation is highest in rural areas, with cities inparticular having a much lower averagedeprivation score. On the other hand, focusingon deprivation in terms of the local environmentshows that rural areas have by far the lowestlevels of deprivation. This type of deprivationincludes crime, vandalism and graffiti in theneighbourhood. This index measures how manyof these households are exposed toenvironmental deprivation. Figure 1.11, usingdata, also from EU-SILC, shows that cities inparticular and larger towns have much higherlevels of this type of deprivation than rural areas.

27
ASOCIALPORTR
AITOF
CO
MM
UN
ITIESIN
IRELA
ND
UR
BA
NA
ND
RU
RA
LD
ISA
DVA
NTA
GE
2 Note that a threshold of 1,000 population is used todistinguish urban versus rural in this case, whereas in theCensus it is 1,500.
17 .3
24 .2
25 .7
16 .6
20 .6
19 .0
20 .9
24 .6
12 .6
18 .5
30
25
20
15
10
5
0
%
Bottom 20% 2nd. 3rd. 4th. Top 20%
Urban pop => 1000 Rural pop < 1000
Figure 1.12: Location in the income distribution, urban versus rural population, 2005
3rd.
,
Source:E
U-SILC
,2005
Income, poverty and deprivation
As already noted, the Census of Population doesnot provide data on income. When comparingurban and rural areas in terms of income andpoverty levels, we will draw on data fromhousehold surveys, most recently the EU-SILCsurvey carried out by the CSO. Overall, thissurvey shows that the average income ofhouseholds in urban areas is about 24% higherthan in rural areas.2 When differences inhousehold size are taken into account incalculating average income, the variation isgreater at about 29%. This reflects the generaltendency for higher-paid employment to bemainly in urban areas, and the higher proportionof retired people living in rural areas.
The higher income in urban areas is alsoreflected in their overall position in the incomedistribution. If we divide that distribution intoincome quintiles, Figure 1.12 shows that about50% of the rural population are in the bottomtwo-fifths of the distribution, compared to only34% of the urban population. By contrast,24.6% of the urban population is in the top one-fifth of the distribution, compared with only12.6% of the rural population.
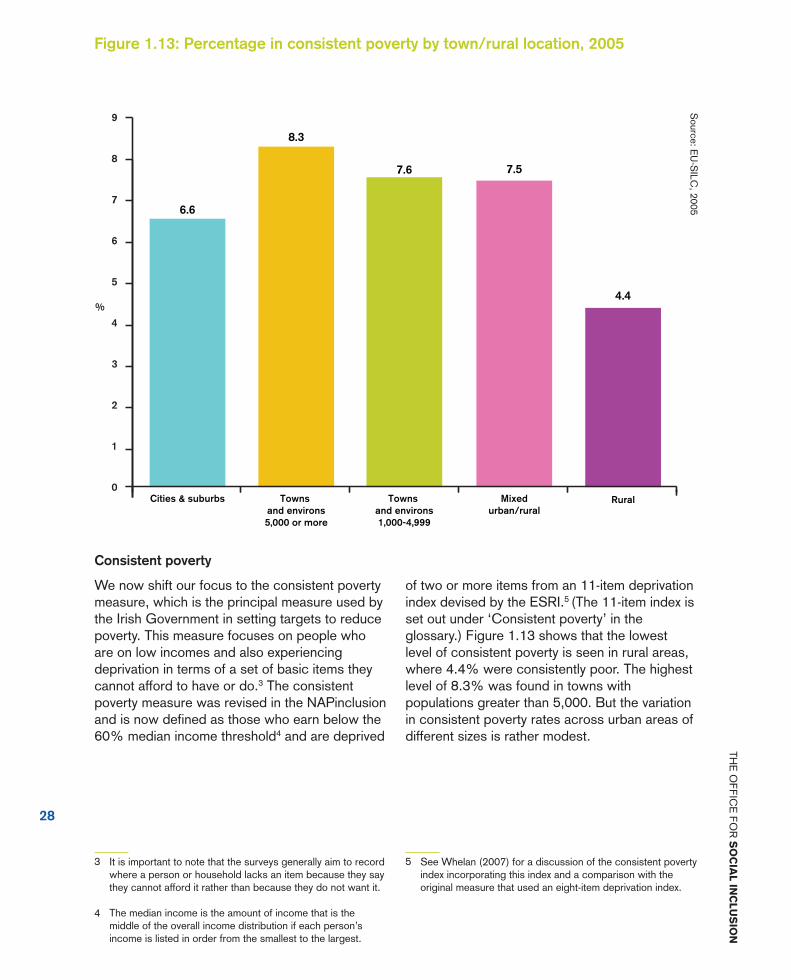
Consistent poverty
We now shift our focus to the consistent povertymeasure, which is the principal measure used bythe Irish Government in setting targets to reducepoverty. This measure focuses on people whoare on low incomes and also experiencingdeprivation in terms of a set of basic items theycannot afford to have or do.3 The consistentpoverty measure was revised in the NAPinclusionand is now defined as those who earn below the60% median income threshold4 and are deprived
of two or more items from an 11-item deprivationindex devised by the ESRI.5 (The 11-item index isset out under ‘Consistent poverty’ in theglossary.) Figure 1.13 shows that the lowestlevel of consistent poverty is seen in rural areas,where 4.4% were consistently poor. The highestlevel of 8.3% was found in towns withpopulations greater than 5,000. But the variationin consistent poverty rates across urban areas ofdifferent sizes is rather modest.
28
THEOFFICEFOR
SO
CIA
LIN
CLU
SIO
N
3
4
It is important to note that the surveys generally aim to recordwhere a person or household lacks an item because they saythey cannot afford it rather than because they do not want it.
The median income is the amount of income that is themiddle of the overall income distribution if each person’sincome is listed in order from the smallest to the largest.
5 See Whelan (2007) for a discussion of the consistent povertyindex incorporating this index and a comparison with theoriginal measure that used an eight-item deprivation index.
9
8
7
6
5
4
3
2
1
0Cities & suburbs Towns
and environs5,000 or more
Townsand environs1,000-4,999
Mixedurban/rural
Rural
C
6.6
8.3
7.6 7.5
4.4%
Figure 1.13: Percentage in consistent poverty by town/rural location, 2005
Source:E
U-SILC
,2005

29
ASOCIALPORTR
AITOF
CO
MM
UN
ITIESIN
IRELA
ND
UR
BA
NA
ND
RU
RA
LD
ISA
DVA
NTA
GE
‘At risk of poverty’
We now turn to relative income poverty, alsoknown as the ‘at risk of poverty’ indicator.A person is said to be ‘at risk of poverty’ whentheir household receives less than 60% ofmedian income.6 While the ‘at risk of poverty’measure is often used to make comparisonsbetween countries, there are several factors thatlimit its usefulness. These factors includedifferent levels of economic developmentbetween countries or within a countryundergoing rapid economic growth, as has beenthe case in Ireland. However, the measure is oneof several used at EU level to monitor progress intackling poverty.
Figure 1.14 shows the percentage of thepopulation ‘at risk of poverty’ in towns of varioussizes versus rural areas.7 Overall, the ‘risk ofpoverty’ is greatest in rural areas and lowest inlarge towns and cities. In cities the percentage‘at risk of poverty’ is 14.2%. This rises to 18.7%for towns with populations greater than 5,000and to 25.3% for the towns with a population ofless than 5,000, 23.7% for mixed urban/ruralareas and 23.4% for rural areas. The majorcontrast is between the cities (including theirsuburbs) and large towns compared with the rest– rather than rural areas themselves beingdistinctive. This pattern is very different to theone displayed by the consistent poverty measurewhich showed that urban areas were most atrisk.
6 The 60% threshold is most commonly used at EU level, butthe Organisation for Economic Co-operation andDevelopment (OECD) and the United Nations (UN) use athreshold of 50%. The threshold is adjusted for householdsize, so, for example, the threshold for a household with anadult couple and one child is about twice that for a singleadult household.
7 The categorisation by town size in EU-SILC is not identical tothat in the Census.
30
25
20
20
15
10
5
0Cities & suburbs Towns
and environs5,000 or more
Townsand environs1,000-4,999
Mixedurban/rural
Rural
A
14.2
18.7
25.323.7
23.4
%
Figure 1.14: Percentage ‘at risk of poverty’ by town/rural location, 2005
Source:E
U-SILC
,2005

Types of deprivation
In Figure 1.15, we look at the items used tomeasure deprivation. As already mentioned oneof the ways consistent poverty is measured is byusing an index that shows when people aredeprived of at least two items from a list of 11.For 10 of the 11 items on this revised list, peoplein rural areas are slightly less deprived thanpeople in urban areas. However, people in ruralareas are slightly less able to afford new clothes:7.4% of people in rural areas report such
deprivation compared to 6.4% in urban areas.The deprivation indicator which shows thegreatest difference between urban and ruralareas is the inability to afford new furniture:11.5% in rural areas compared to 15.2% inurban areas. In both rural and urban areasfurniture is the most difficult for people to afford,but the least difficult to afford was a warmwaterproof overcoat which could not bepurchased by 2.3% in rural areas and 3.1% inurban areas.
30
THEOFFICEFOR
SO
CIA
LIN
CLU
SIO
N
%
Go without heating
0 2 4 6 8 10 12 14 16
Two pairs of shoes
Roast joint orequivalent
Meals with meat,fish or chicken
New clothes
Warm overcoat
House adequatelywarm
New furniture
Family for drink or meal
Afternoon or evening out
Presents for family/friends
Urban
Rural
Total Population
5.67.0
6.5
3.72.6
3.3
4.53.6
4.2
3.32.3
2.9
6.47.4
6.8
3.12.3
2.8
4.23.6
4.0
15.211.5
13.8
12.110.7
11.5
11.48.7
10.4
5.03.9
4.5
Figure 1.15: Deprivation levels on basic items by town/rural location, 2005
Source:E
U-SILC
,2005

31
ASOCIALPORTR
AITOF
CO
MM
UN
ITIESIN
IRELA
ND
UR
BA
NA
ND
RU
RA
LD
ISA
DVA
NTA
GE
%
0 5 10 15 20
Freezer4.7
4.0
4.5
3 .7
4.3
3 .9
3 .4
4.0
3.6
10.0
9 .49 .3
9 .36 .9
8 .2
17.8
14.2
8 .4
Stereo
ClothesDryer
Video
Phone
Car
Figure 1.16: Deprivation in consumer durables by town/rural location, 2005
Urban
Rural
Total population
Deprivation of consumer durables
In Figure 1.16, we extend our analysis ofdeprivation to a number of widely ownedconsumer durables such as a landline telephone,video and stereo. Most people in both rural andurban areas own each of these items. We cansee that those in rural areas are less likely to bedoing without a car or a telephone, and there islittle difference between urban and rural areas forownership of items such as a stereo or freezer.
Subjective economic pressures
Here we extend our analysis beyond objectivecircumstances to take into account people’ssubjective assessments of their own situationusing five indicators:
• going into arrears in relation to rent, mortgageor hire purchase commitments;
• incurring debts in relation to routine expenses;
• inability to cope with unexpected expenses;
• having difficulty or great difficulty in makingends meet; and
• experiencing housing costs as a great burden.
Source:E
U-SILC
,2005

30
25
20
15
10
5
0
%
18.720.7
27.3
25.2
17.2
Cities & suburbs Towns and environs
5,000 +
Townsand environs1,000 – 5,000
Mixedurban/rural
areas
Rural
C
Figure 1.17 shows that those in urban areas aremore likely to have debts or be in arrears onregular bills such as gas or electricity, and alsomore likely to say they would have difficultycoping with unexpected expenses. On the otherhand, those in rural areas are more likely to saythat they are having serious difficulty makingends meet.
Economic vulnerability
There is an interesting broader indicator thatmeasures people’s economic vulnerability. Itcombines information about whether thehousehold is: below ‘at risk of poverty’
thresholds; experiencing enforced basicdeprivation; and reporting difficulty in makingends meet. Statistical analysis, using ‘latent classanalysis’, identifies underlying connectionsbetween these categories of information. Itshows that about one-fifth of the overallpopulation is categorised as economicallyvulnerable. A slightly higher proportion of peoplein urban areas are economically vulnerablecompared with rural areas. Figure 1.18 showsthat in urban areas, levels of economicvulnerability are highest for people in smallertowns and lowest in cities or rural areas.
32
THEOFFICEFOR
SO
CIA
LIN
CLU
SIO
N
Figure 1.18: Levels of economic vulnerability by town/rural location, 2005
Figure 1.17: Levels of subjective economic pressures by town/rural location, 2005
Source:E
U-SILC
,2005Source:E
U-SILC
,2005
%
Urban
Rural
Total Population
0 5 10 15 20 25 30
Housing costs agreat pressure
Difficulty in makingends meet
Unable to copewith unexpected
expenses
Debts
Arrears
23.522.5
23.1
23.926.3
24.8
25.118.2
22.5
11.27.9
10.0
10.87.3
9.5

33
ASOCIALPORTR
AITOF
CO
MM
UN
ITIESIN
IRELA
ND
UR
BA
NA
ND
RU
RA
LD
ISA
DVA
NTA
GE
Disadvantaged urban andrural areas
As already noted, the Census of Populationallows us to compare urban and rural areas.It can also be used to compare thecharacteristics of households in one small areawith another and this allows us to compare levelsof disadvantage in specific urban or ruralgeographical areas. The main indicators availablethat we use to compare areas are:
• unemployment and dependency;
• the age structure; and
• the social class profile.
A range of studies using these data have beencarried out.8 Based on available indicators, theyidentify which urban and rural areas are relativelyadvantaged or disadvantaged. If we focus on theunemployment rate, for example, the indicatorsshow that the areas with unemployment ratesabove the average are: County Donegal, CountyLouth and certain areas in towns and cities.
In the same way we see that both urban andrural areas with very high levels of dependencyand with relatively low levels of educationalattainment include, for example, countiesDonegal, Cavan, Mayo, Leitrim and Monaghan.A high proportion of the population from thesecounties left full-time education with only primarylevel education. This also often reflects, at leastin part, the older age profile of the population.But certain urban areas can also be identifiedwhere educational attainment is low despite arelatively young age profile.
Using these indicators, analysis of the small areadata from the 2006 Census of Population willprovide a detailed and up-to-date picture ofdisadvantage on a geographical basis acrossurban and rural areas. This type of information isvaluable because it allows policies to bedeveloped that respond to the needs of specificurban and rural areas, and to target resources tothose areas and needs. The development ofprogrammes for specific areas to combatdisadvantage is a major focus of the NationalAction Plan for Social Inclusion. Pobal9 has beenvery involved in developing programmes neededby specific areas to counter disadvantagethrough local social and economic development.These include programmes aimed specifically ataddressing social inclusion issues at local leveland developing an integrated focus on socialgroups experiencing cumulative disadvantage.Such programmes include the Rural TransportProgramme and the Community ServicesProgramme.
8 These include studies for Pobal (for example, Haase, 2005,2006) and at the ESRI, SARU at Trinity College Dublin, andNIRSA at NUI Maynooth.
9 Pobal is a not-for-profit company with charitable status thatmanages local social and economic developmentprogrammes on behalf of the Irish Government and the EU.It was formerly known as Area DevelopmentManagement Ltd.

When we identify areas with particularly highlevels of disadvantage, it means that as well ashelping to target resources and design anddeliver services, we can assess and address thepotential impact that these areas have on thepeople who live there. The impact can includedamaging effects on individuals through, forexample, stigmatisation and discrimination.People are then at risk of being alienated fromtaking part in social and political activities. Areainitiatives, such as RAPID and CLÁR, also focuson involving local communities in developing thelocal economy and social interaction to build upwhat is now often referred to as “social capital”in the area.
These area-based initiatives also reflect thaturban and rural disadvantage have distinctivefeatures. This is brought out both by the overallcomparison of urban and rural areas and bylooking at a detailed breakdown that highlightsparticularly disadvantaged areas. Disadvantagedurban areas tend to be characterised by:
• high levels of unemployment and economicinactivity;
• low levels of educational attainment;
• sometimes, relatively poor public servicesand environmental and social infrastructure;and
• a minority with relatively high levels of publicdisorder.
Disadvantage in a rural context, on the otherhand, may as often be associated with:
• under-employment as unemployment; and
• there may be particular problems with socialisolation and lack of transport.
The evidence about these types ofcharacteristics in relation to urban and ruraldisadvantage, and where they are found, needsto be strengthened. We discuss this in the nextsection.
34
THEOFFICEFOR
SO
CIA
LIN
CLU
SIO
N

35
ASOCIALPORTR
AITOF
CO
MM
UN
ITIESIN
IRELA
ND
UR
BA
NA
ND
RU
RA
LD
ISA
DVA
NTA
GE
Future prospects and data needs
Ireland is becoming a more urban country.When framing policy directed towards reducingpoverty and promoting social inclusion, policymakers need to consider both the nature ofurban living and the situation for those remainingin rural areas. At present, though, we don’t fullyunderstand either the nature of the challengesposed by areas of concentrated disadvantage inurban areas, or the difficulties of providingadequate services and combating social isolationin rural areas. This means we need to prioritisegathering in-depth information about people livingin those very different situations that combinesthe focused geographic coverage that is possiblewith the Census of Population and the in-depthinformation about income, deprivation and socialcontact and so on, that can be provided in alarge-scale household survey such as EU-SILC.This could be done by selecting a small numberof pilot areas for intensive data gathering,ensuring an adequate coverage of different typesof urban and rural areas. Information could alsobe gathered about more advantaged and lessadvantaged areas.
Another way to collect data is to integrateinformation from various public administrativesystems. This has shown significant potentialelsewhere and is a complementary approach.This type of information could be collected fromthe administrations in the different areas, forexample: social welfare, education, health,transport, the Gardai. The first step would be tobring about much greater harmonisation in the
geographic areas that the different systems usein collating data. The increasing availability ofgeographic coding, which is used to classify thecountry into small geographical areas, and theproposals regarding the use of a nationwidesystem of postcodes are helpful developments.But administrative data can be further exploitedto assist in research and policy development totackle urban and rural disadvantage andexclusion.The development of the Irish Spatial DataInfrastructure (ISDI), as part of the NationalSpatial Strategy, will play a critical role in thisrespect. The Department of Environment,Heritage and Local Government is taking thelead role in developing an appropriate frameworkfor the operation of the ISDI. The ISDI aims toensure that spatial data from multiple sources isavailable and drawn together to enhancecapacity for strategic planning and policydevelopment. The system should facilitateaccess to spatial information, provide moreaccurate and up-to-date information and as aresult underpin better service delivery.

36
THEOFFICEFOR
SO
CIA
LIN
CLU
SIO
N
CHAPTER 2:MIGRANTS ANDETHNIC MINORITYGROUPS
38
THEOFFICEFOR
SO
CIA
LIN
CLU
SIO
N
100
80
60
40
20
0
-20
-40
-60
-80
000.Emigration
Immigration
Net Migration
19871989
19911993
19951997
19992001
20032005
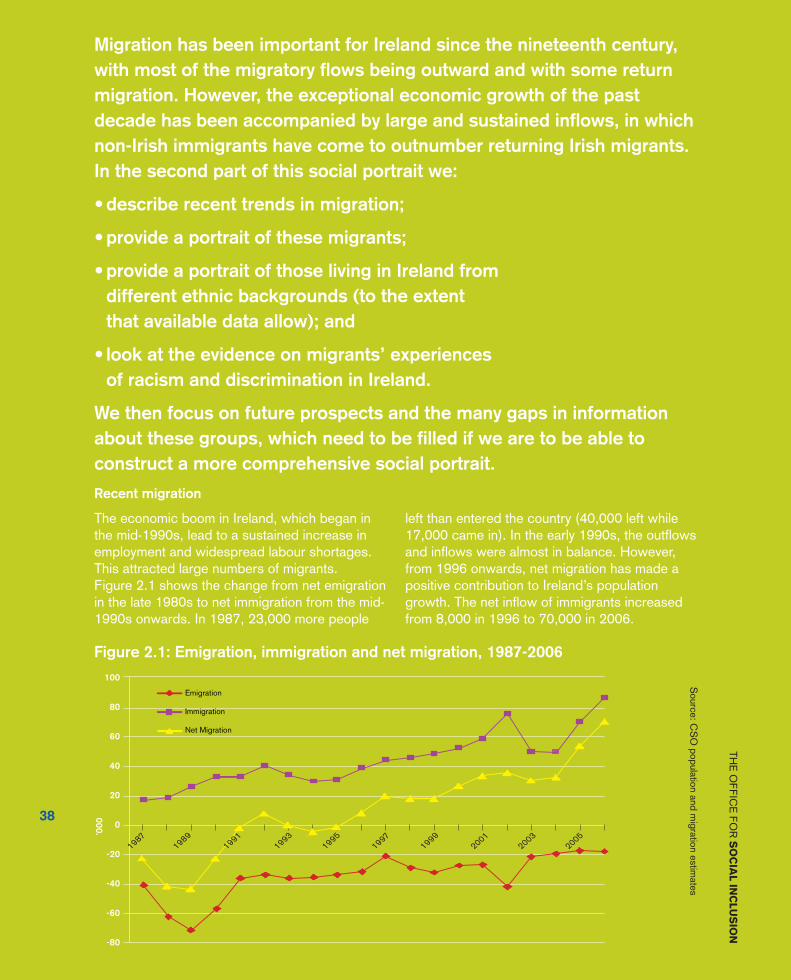
Figure 2.1: Emigration, immigration and net migration, 1987-2006Migration has been important for Ireland since the nineteenth century,with most of the migratory flows being outward and with some returnmigration. However, the exceptional economic growth of the pastdecade has been accompanied by large and sustained inflows, in whichnon-Irish immigrants have come to outnumber returning Irish migrants.In the second part of this social portrait we:
• describe recent trends in migration;
• provide a portrait of these migrants;
• provide a portrait of those living in Ireland fromdifferent ethnic backgrounds (to the extentthat available data allow); and
• look at the evidence on migrants’ experiencesof racism and discrimination in Ireland.
We then focus on future prospects and the many gaps in informationabout these groups, which need to be filled if we are to be able toconstruct a more comprehensive social portrait.
Source:C
SOpopulation
andmigration
estimates
Recent migration
The economic boom in Ireland, which began inthe mid-1990s, lead to a sustained increase inemployment and widespread labour shortages.This attracted large numbers of migrants.Figure 2.1 shows the change from net emigrationin the late 1980s to net immigration from the mid-1990s onwards. In 1987, 23,000 more people
left than entered the country (40,000 left while17,000 came in). In the early 1990s, the outflowsand inflows were almost in balance. However,from 1996 onwards, net migration has made apositive contribution to Ireland’s populationgrowth. The net inflow of immigrants increasedfrom 8,000 in 1996 to 70,000 in 2006.
Figure 2.1: Emigration, immigration and net migration, 1987-2006

39
MIG
RA
NTS
AN
DE
THN
ICM
INO
RITY
GR
OU
PS
ASOCIALPORTR
AITOF
CO
MM
UN
ITIESIN
IRELA
ND
Where are the immigrants comingfrom?
The nationality of people coming into Ireland hasbecome increasingly diverse. The percentage ofpeople coming into the country who are Irishpeople returning home has fallen continuouslysince 1991. Irish people returning home sincethen have totalled:
• in 1991, two thirds of the gross populationinflow (22,600 out of 33,300);
• in 1996, less than half the gross populationinflow of 39,200;
• in 2005, one quarter of the gross populationinflow (19,000 out of 70,000).
By 2005, nearly three-fifths of the grosspopulation inflow comprised nationals from otherEU countries, including the new Member Statesfrom Central and Eastern Europe 10 who joinedthe European Union on 1 May 2004. (From thedate of enlargement, Ireland granted nationalsfrom these countries full rights under EU law inrelation to access to the labour market and socialsecurity, as did Sweden and the UK.) Almostfour-fifths of the non-Irish migrants in 2005 werenationals of the EU-25 (NESC 2006a, p. 7).
Figure 2.2 shows how the country of origin ofimmigrants changed between 1991 and 2007.We see that currently immigrants from the EU,other than the UK, and from the rest of the worldaccount for a large proportion of the total inflow.This is very different from the situation in the early1990s.
Figure 2.3 compares the nationality of peopleimmigrating into Ireland in 2000 and in 2007 andshows clearly the effect of the accession of newEU Member States. Some 53,000 out of a totalof 110,000 immigrants came from the 12 newMember States in 2007. In 2007, only 20,000 ofthese immigrants were Irish nationals returningfrom abroad; whereas in 2000, Irish nationalsaccounted for 25,000 out of 52,000 immigrants.
0
20
40
60
80
100
120
000.
19871989
19911993
19951997
19992001
20032005
2007
Irish
UK
Other EU - 15
EU - 12
USA
Other
Total
Figure 2.2: Estimated flow of all immigrants by nationality 1987-2007, (thousands)
Source:C
SOPopulation
andMigration
Estim
ates;notebefore
2005EU-12
areincluded
in“other”
10 Eight Countries from Eastern and Central Europe joined theEU in May 2004: Czech Republic, Estonia, Hungary, Latvia,Lithuania, Poland, Slovakia and Slovenia. In addition Cyprusand Malta also became EU Member States.
Figure 2.3: Estimated immigration flowsclassified by country of origin, 2000 and2007
60
50
40
30
20
10
0
‘000
UK Rest ofEU - 15
EU - 12 USA Rest of World
20.8
13.4
52.1
5.5 4.2
14.5
25.7
14.111.7
2000
2007
Source:C
SO(2007),P
opulationand
Migration
Estim
ates
Note: Prior to 2005 data for EU 12 included in the 'Rest ofWorld' category.

40
THEOFFICEFOR
SO
CIA
LIN
CLU
SIO
N
Different types of migration
As we have seen, currently most migrants toIreland come from the EU. Those from outsidethe EU account for about one-quarter of the total.For these migrants there are various legal routesinto Ireland, as outlined in Figure 2.4 (adaptedfrom Ruhs, 2005; NESC 2006a). Employment-led immigrants include work permit holders,visa or authorisation holders, intra-companytransfers/trainees and business permit holders.Non-employment related immigrants includeasylum applicants, students, family members anddependants of both Irish and EEA nationals aswell as non-Irish and non-EEA nationals.11
As well as asylum applications, 116 peoplewere admitted in 2005 under the Resettlementprogramme, which has admitted 200 peopleeach year since 2006.
Most non-EEA nationals coming to Ireland to takeup work are work-permit holders. The totalnumber of work permits issued (new permits andrenewals) increased from around 6,000 in 1999to 48,000 in 2003. There was a substantial fall inthe number issued in 2004 as nationals of thenew EU Member States no longer required workpermits after 1 May 2004. The figures for workpermits issued between 2005 and 2007 were:
• 2005: 27,000 including almost 19,000renewals;
• 2006: 23,898 including 16,600 renewals; and
• 2007: 23,604 including 13,457 renewals.
Figure 2.4: Channels of legal immigration into Ireland for non-EU nationals
Employment-basedimmigration
Non employment-basedimmigration
New workpermits
7,354 in2005
10,020 in2004
New workvisas and
authorisations1,953
Jan - Oct 051,444 in
2004
Intra-companytransfers*
Suspendedsince 2002
Businesspermits
283 in2004
Students
21,270 in2004
Workingholidaymakers
About 3,000in 2003
Applicationsfor asylum
4,323 in2005
4,766 in2004
Dependents
N/A
Trainees
Suspendedsince 2002
*Issued on a concessionary basis.
Total immigration
11 The European Economic Area (EEA) comprises all EUMember States plus Iceland, Lichtenstein, Norway andSwitzerland.
Notes: NA indicates the data are not available.

41
MIG
RA
NTS
AN
DE
THN
ICM
INO
RITY
GR
OU
PS
ASOCIALPORTR
AITOF
CO
MM
UN
ITIESIN
IRELA
ND
As Figure 2.5 shows, workers coming fromoutside the EEA are comprised of a broadspread of nationalities, with a substantial numbercoming from Asia, particularly the Philippines,India and China, as well as from Brazil, SouthAfrica and the USA.
Students also represent a substantial migrantflow: in 2004 there were 21,270 registered non-EEA students in Ireland, approximately half ofwhom came from China (Ruhs, 2005). Until April2005 all non-EEA students could access the Irishlabour market. But now only students who arepursuing courses which are of at least one year’s
duration and which lead to a ‘recognisedqualification’ may enter the Irish labour market(Department of Justice, Equality and LawReform, December 2004). In 2005, there were27,000 registered non-EEA students in Ireland,just over half of whom were in higher educationinstitutions. There were a further 9,000international students from elsewhere in the EUregistered in higher education institutions. As faras dependants are concerned, data from theCSO’s Quarterly National Household Surveyshow that 28% of immigrants aged 15 and overare dependants, which, is substantially less thanthe 39% of Irish nationals who are dependants.
Figure 2.5: Countries with the highest number of work permits issued in 2007
Country Number of work permits % of total (n ew and renewals) issued
Australia 808 3.4
Bangladesh 666 2.8
Brazil 1,173 5.0
China 1,188 5.0
India 4,068 17.2
Malaysia 796 3.4
Pakistan 813 3.4
Philippines 3,885 16.5
South Africa 1,461 6.2
Ukraine 1,412 6.0
USA 1,208 5.1
Other 6,126 26.0
Total 23,604 100
C
Source:D
epartmentofTrade,E
nterpriseand
Employm
entwebsite
http://www.entem
p.ie

42
THEOFFICEFOR
SO
CIA
LIN
CLU
SIO
N
Figure 2.6 focuses on asylum seekers andshows that applications for asylum began to buildup from a very low base of 39 in 1992 to around8,000 by the end of the decade. They reached apeak of 11,600 in 2002. The number of asylumapplications made in Ireland then fell by almosttwo thirds to around 4,300 in 2006. Asylumapplicants may not work in Ireland and they mustlive in direct provision centres where all food andboard costs are met by the State. In 2006, 9.4%of the applications finalised resulted inpermission to stay being granted.
Immigrants are sometimes allowed to live inIreland on other exceptional grounds. Forexample, an unsuccessful asylum applicant maybe granted leave to remain by the Minister forJustice, Equality and Law Reform. During 2005the Department of Justice, Equality and LawReform processed almost 18,000 applicationsfor permission to remain in Ireland based on theapplicant being the parent of an Irish childcitizen. Of these 16,700 applications wereapproved (Quinn, 2006).
Finally, not all migration is via legal channels, butthe scale of illegal immigration and the number ofillegally resident non-nationals in Ireland is by itsnature very difficult to assess. (Such illegalmigrants are not likely to be captured in thesurveys from which the figures presented in thissocial portrait are mostly drawn.) Other relevantstatistics are: the number of outstandingdeportation orders, currently about 9,000; andthe number of people refused leave to land,which was 4,477 in 2004.
Two categories of illegal immigrant are:
• the 23% of people who enter the State illegallyand continue to reside illegally; and
• the 77% of people who enter legally andwhose residence status later becomesirregular (when for example their applicationto stay is rejected).
This data comes from the Immigrant Council ofIreland and is based on the illegal residentmigrants they deal with.
12000
10000
8000
6000
4000
2000
0
19921993
19941995
19961997
19981999
20002001
20042005
20062003
2002
Figure 2.6: Number of asylum applications, 1992–2006
Source:O
fficeofthe
Refugee
Applications
Com
missioner

43
MIG
RA
NTS
AN
DE
THN
ICM
INO
RITY
GR
OU
PS
ASOCIALPORTR
AITOF
CO
MM
UN
ITIESIN
IRELA
ND
Migration and population composition
The changing patterns of migration describedhave affected the makeup of the population’snationality and ethnic origin. The 2006 Census ofPopulation revealed that 10.1% of the usuallyresident population at that time were not of Irishnationality, as Table 2.1 shows. Some 66% ofthose who were not of Irish nationality were fromanother EU country.
• 37% were from the EU15 including the UK.
• 29% were from the 10 countries that joinedthe European Union in 2004.
• 11% were from Asia.
• 8% were from Africa.
• 5% were from America.
The Census also shows that, including childrenborn to Irish nationals living abroad at the time,14.6% of the population in 2006 were bornoutside Ireland, and of those:
• 72% were born in another EU-25 country,including the UK;
• 9% in Asia;
• 7% in Africa; and
• 6% in America.
The latest population and migration projectionsmade by the CSO (2008) assume that inwardmigration will continue at the rate of 70,000-80,000 per annum from 2006 to 2011, and thendecline. However, the basis upon which theseassumptions were originally made havesomewhat change given the current slowdownin the economy.
Nationality Number
Irish 3,706,683
UK 112,548
Other EU 15 42,693
EU 10 120,534
Other Europe 24,425
Africa 35,326
Asia 46,952
America (USA) 21,124
Other (incl. not stated) 61,728
Total Population 4,172,013
Non-Irish Population 419,733
Percent non-Irish 10.1%
?
Table 2.1: Total population in 2006 classified by nationality
Source:C
ensusofP
opulation,2006

44
THEOFFICEFOR
SO
CIA
LIN
CLU
SIO
N60
50
40
30
20
10
0
%
0-14 15-24 25-44 45-64 65+
21.5
12.514.5
18.0
52.2
22.8
13.611.8
3.6
29.4
Irish
Non-Irish
0.1% 0.4%
1.1%1.0%0.9%
0.5%6.9%
87.4%
IIrishIrish TravellerAny other White backgroundAfricanAny other Black backgroundChineseAny other Asian backgroundOther including mixed backgrounds
Figure 2.7: Population profile in 2006 by age group and nationality
Source:C
ensusofP
opulation,2006Source:C
ensusofP
opulation,2006
Figure 2.8: Population by ethnic background, 2006
Migrants are distinctive in terms of age profile,and thus also have an impact on the profile of thepopulation. As Figure 2.7 shows, those who arenot Irish nationals are young relative to the“native” population. The non-Irish are heavilyconcentrated in the ages 25-44, with 52.2% inthat age range compared with 29.4% of Irishnationals. By contrast, those aged 65 or overmake up only 3.6% of the non-Irish populationcompared with 11.8% of Irish nationals.
As pointed out by Barrett, Bergin, and Duffy(2006), this relatively young profile of non-Irishimmigrants is particularly interesting in thecontext of Ireland’s ageing population, since ayounger inflow will offset the ageing population.CSO population projections to 2026 have beenpresented on “high migration” and “lowmigration” assumptions. The projected overalldependency rate varies between 56% and 57%depending on the assumption made aboutmigration. In terms of their gender profile, thenon-Irish immigrants were roughly half males andhalf females, as in the native population.
The 2006 Census also allows the population tobe categorised by ethnic or cultural background,distinguishing the following groups:
• Irish;
• Irish Traveller;
• any other white background;
• African;
• any other black background;
• Chinese;
• any other Asian background;
• other, including mixed background; or
• not stated.
Figure 2.8 shows that most of the population(87.4%) is categorised as ‘Irish’. ‘Other white’,with 6.9%, is the only other group that makes upmore than 1% of the population. About 2.5% ofthe population is collectively African, Chinese orother Asian.

45
MIG
RA
NTS
AN
DE
THN
ICM
INO
RITY
GR
OU
PS
ASOCIALPORTR
AITOF
CO
MM
UN
ITIESIN
IRELA
ND
Educational attainment
Educational attainment is a key determinant ofoutcomes in the labour market for migrants andethnic minorities, as for others. However, the factthat migrants will usually have had their educationelsewhere is a complicating factor. As Figure 2.9shows, non-Irish nationals have higher levels ofeducational qualifications than those born inIreland. About 30% of adults who are non-Irishnationals have a third-level degree, comparedwith 17% of Irish nationals. On the other hand,20% of Irish nationals compared with 6% ofnon-Irish nationals have no more than primarylevel education.
Those coming from the UK have lower levels ofattainment than other non-Irish nationals, thoughstill higher than the percentage for Irish nationals.These differences partly reflect the older ageprofile of Irish nationals, but even within age
groups there is a differential between Irishnationals and non-Irish nationals in educationalattainment.
Barrett et al (2006) used the Quarterly NationalHousehold Survey to look at the educationalattainment levels of non-Irish immigrants whoarrived in the 10 years before 2003 and were inthe labour force at that date. Once again thesenon-Irish immigrants were seen to haveconsiderably higher levels of educationalqualifications than the “native” labour force. Justover 54% of immigrants had third levelqualifications, which was twice the figure of thenative population. At the other end of thespectrum, only 6% had no educationalqualification beyond primary level, compared with14% of the Irish group.
Figure 2.9: Highest level of education of Irish and non-Irish adults, 2006
%
60
50
40
30
20
10
0
Primary Lower Secondary
UpperSecondary
Third level,non-degree
Third level,degree
Irish nationals U K Other EU-15 OtherEU-10
Source:C
ensusofP
opulation,2006

46
THEOFFICEFOR
SO
CIA
LIN
CLU
SIO
N
Another source of information on educationalattainment is a specially designed survey onwork-permit holders and asylum seekers carriedout in 2005. It focused on discrimination and isreported in McGinnity et al (2006). We discussthis survey in more detail below when we cometo the topic of discrimination, but here it is ofinterest to present the educational profile of thework-permit holders and asylum seekersinterviewed. Table 2.2 shows once again thatthese immigrants were highly educated, withover half of the sample having attended third-level education. Work permit holders tend tohave higher educational attainment than asylumseekers. Some 58% of work permit holderscompared with 44% of all asylum seekers have athird-level qualification.
This survey also allows some distinctions to bemade among immigrants by country of origin. Wesee from the table that ‘East Europeans’ are themost highly educated group, with 71% havingattended third-level education. They are followedby ‘South and Central white Africans’ and‘Asians’, more than 50% of whom have attainedthird-level qualifications.
An exception can be seen, however, in the caseof ‘North Africans’, 40% of whom have primarylevel education or no qualifications at all. Thislow level of education is in fact a feature of NorthAfrican asylum seekers, whereas ‘North African’work-permit holders had all completed at leastsome secondary education. The survey alsolooked at whether or not respondents hadobtained some vocational qualification orapprenticeship. It found that almost 80% of EastEuropeans had a vocational qualification, but thiswas true of fewer than 30% of White Africans,who did show high levels of educationalattainment. ‘North Africans’ combined low levelsof educational attainment with a scarcity ofvocational qualifications.
Table 2.2: Distribution of work-permit holders and asylum seekers by education,2005
Source:M
cGinnity
etal(2006)Black White North Asian Non-EU
and other South/Central African EastSouth/Central African European Total
African
% % % % % %
Primary or less 7.4 0.0 40.6 6.1 1.2 7.1
1-3 years secondary 10.1 2.6 14.1 13.5 2.3 9.5
4+ years secondary 33.2 34.2 20.3 22.7 13.1 23.6
Tertiary education 47.7 52.6 12.5 51.1 71.0 52.7
Other 1.7 10.5 12.5 6.6 12.4 7.1
All 100.0 100.0 100.0 100.0 100.0 100.0

47
MIG
RA
NTS
AN
DE
THN
ICM
INO
RITY
GR
OU
PS
ASOCIALPORTR
AITOF
CO
MM
UN
ITIESIN
IRELA
ND
Figure 2.10: Labour force status of Irish versus non-Irish nationals (adults), 2006
Source:C
ensusofP
opulation,2006
90
80
70
60
50
40
30
20
10
0Irish nationals UK Other EU - 15 EU - 10
56.1
6.7
56.7
8.5
1.06.8
3.65.4
74.2
84.3
0.24.02.2
8.812.0
4.4
13.06.94.8
10.5 12.04.5
11.9
0.3
%
At work
Unemployed
Student
Home
Retired
lll/disabled
Employment
The labour market situation for migrants iscentrally important to both their living standardsand the role they play in Irish society. Once againthe Census of Population is a key source, andFigure 2.10 uses 2006 data to compare thelabour force status of non-Irish nationals aged 15or over with those of Irish nationality. Almost67% of non-Irish nationals are in work comparedwith 56% for the Irish. However, the Irish have alower unemployment rate, so the difference inoverall labour force participation (employed plusunemployed) is less. This varies by area of origin,with the proportion in work being highest forthose from the EU 15. This partly reflects thatnon-Irish nationals are more heavily concentratedin the younger age groups. But even within ageranges non-Irish nationals are more likely to be inwork than Irish nationals.
The occupational distribution and earning levelsof the employed are also of considerable interest.The 2006 Census shows that non-Irish nationalshave higher proportions in the personal service 12
and, to a lesser extent, associate professionaland technical categories than the “native”workforce. More than 15% of non-Irish workerscompared with 9% of Irish workers are inpersonal services. Irish nationals, on the otherhand, have higher proportions in the managerialand professional categories. About 6% of Irishworkers compared with 4% of non-Irish workersare managers or executives.
While this could partly be attributable to theolder age profile of employed Irish nationals,immigrants other than those from the UK orthe US, are less likely to be in the top threeoccupational categories than Irish workers.This was shown in the statistical analysis ofQuarterly National Household Survey datacarried out by Barrett et al (2006). This was trueeven taking their education and age into account.The over-concentration of immigrants from non-English speaking countries in relatively low-skilloccupations suggests that weak Englishlanguage skills may be a contributory factor.Difficulties for employers in recognising foreignqualifications may also result in a gap betweenqualifications and occupations. Immigrants mayalso be more ready to take up relatively lowskilled occupations in Ireland, as the wages paidin these jobs can be significantly higher than thewages paid for more highly skilled jobs in theirown country, where there may also be relativelyhigh levels of unemployment.
As far as earnings are concerned, there is someevidence that many of the immigrants who havecome from Central and Eastern Europeancountries since 2004 are working in unskilledjobs that only pay around the minimum wage.Also, workers from outside the EU on workpermits may be particularly vulnerable toexploitation, since these permits are issued fora limited period for a specific job, for a namedindividual. The Employment Permits Act 2006has introduced measures to protect migrantworkers.
12 Personal services covers a very wide range of occupationssuch as childcare workers, domestic employees, and thosedelivering services such as hairdressing, cleaning andlaundry.

48
THEOFFICEFOR
SO
CIA
LIN
CLU
SIO
NHousing, health and social provision
Migrants and housing
Migrants affect the demand for social provisionand services, both through their impact on theoverall size of the population and through thespecific pattern of needs they display. As far ashousing is concerned, there was an increase inthe number of non-EU households on the waitinglist for social housing from 2,700 in 2002 to3,664 in 2005 (NESC 2006b, p. 127). Also, asignificant proportion of recipients of socialwelfare rent supplement are non-Irish nationals.The study by Pillinger (2006) suggests thatgrowing numbers from the new EU 10 memberstates are homeless. Asylum seekers are in aparticular situation with respect toaccommodation; all are offered accommodationin groups or collective housing such asconverted hotels by the Reception andIntegration Agency, and only a small minority optto live in independent accommodation.The Reception and Integration Agency also has asmall number of self-catering units for peoplediagnosed with special medical needs, or whohave been long-term residents in the Receptionand Integration Agency accommodation.For further information on migrants andhomelessness, see Chapter 4 of this socialportrait.
Migrants and the health services
There is little evidence about migrants’ or ethnicminorities’ use of health services or needs,though they can face barriers due to lack ofinformation, language and cultural factors.However, in a recent survey of doctors by theIrish College of General Practice, respondentsdid highlight difficulty experienced by somegroups, particularly refugees (ICGP, 2005),which included difficulty with communication andinterpretation, poor health status, and poormental health. Data from the National DiseaseSurveillance Centre show foreign-born residentsin Ireland are over-represented as regards HIVand tuberculosis. A National Intercultural HealthStrategy was launched by the Health ServicesExecutive (HSE) in February 2008. The HSE isalso developing a National Equality Strategy.Health screening is made available to all asylumseekers, and the uptake of this service is high.
Migrants and education
As far as education is concerned, the numbers ofmigrant children in primary and secondaryeducation are not known. But it is clear thatcertain schools have substantial numbers,particularly in the Dublin area, and those childrenfor whom English is not the native language canboth face and pose particular problems.Additional supports have been introduced inschools, to address the needs of recently arrivedchildren with English language needs. In theschool year 2006-2007, 802 whole-timeequivalent language support teachers were put inplace at primary level and 346 whole-timeequivalent teachers at second level. Their job isto support children whose first language is notEnglish, and this support represents aninvestment of €66.6 million. This compares to149 and 113 teachers respectively in the schoolyear 2001-2002 (Department of Education,2007).

49
MIG
RA
NTS
AN
DE
THN
ICM
INO
RITY
GR
OU
PS
ASOCIALPORTR
AITOF
CO
MM
UN
ITIESIN
IRELA
ND
Migrants, ethnic minorities anddiscrimination
A major concern about the position of migrantsand members of ethnic minorities is that they mayexperience discrimination in various aspects oflife. Discrimination is a complex phenomenon thatis difficult to capture in statistical form. But thereare a number of recent sources of data that shedsome light on the extent and nature ofdiscrimination and how it varies across differenttypes of migrant or ethnic minority groups.
One such source is a special module ofadditional questions in relation to equality issuesincluded in the Quarterly National HouseholdSurvey carried out by the CSO in late 2004(CSO, 2005). Everyone aged 18 years and overwas asked these questions. The results showedthat those who were of non-Irish nationality andthose from non-white ethnic backgrounds bothreported relatively high levels of discrimination.As Figure 2.11 illustrates, overall, almost 25% ofthose of non-Irish nationality reportedexperiencing some form of discrimination in theprevious two years, compared with 11.5% ofthose with Irish nationality. The gap was evenwider when it came to ethnic background, withalmost 31.5% of those from ethnic backgroundsother than ‘White’ reporting some discriminationcompared with 12% of those of White ethnicbackground. The researchers also investigatedhow often discrimination was experienced andthis showed a very similar pattern in terms ofdifferences across the groups.
This discrimination was reported as occurringacross various aspects of life including financialinstitutions, the workplace, shops, education,housing, health and other public services.Where the perceived grounds for thediscrimination were race, skin colour, ethnicgroup or nationality, discrimination wasmentioned most often in the areas of transport,shops, pubs and restaurants, looking for work,and accommodation. Interestingly, when askedhow serious the effect of the discrimination wason their lives, both those of non-Irish nationalityand those from non-White ethnic backgroundswere more likely than others to say it had noeffect, and less likely to say it had a seriouseffect.
%
35
30
25
20
15
10
5
0
Irish
11.5
24.4
12.0
31.5
Non-Irish White Other than white
Source:C
SO,Q
NHS2005
Figure 2.11: Percentage reporting discrimination, 2004
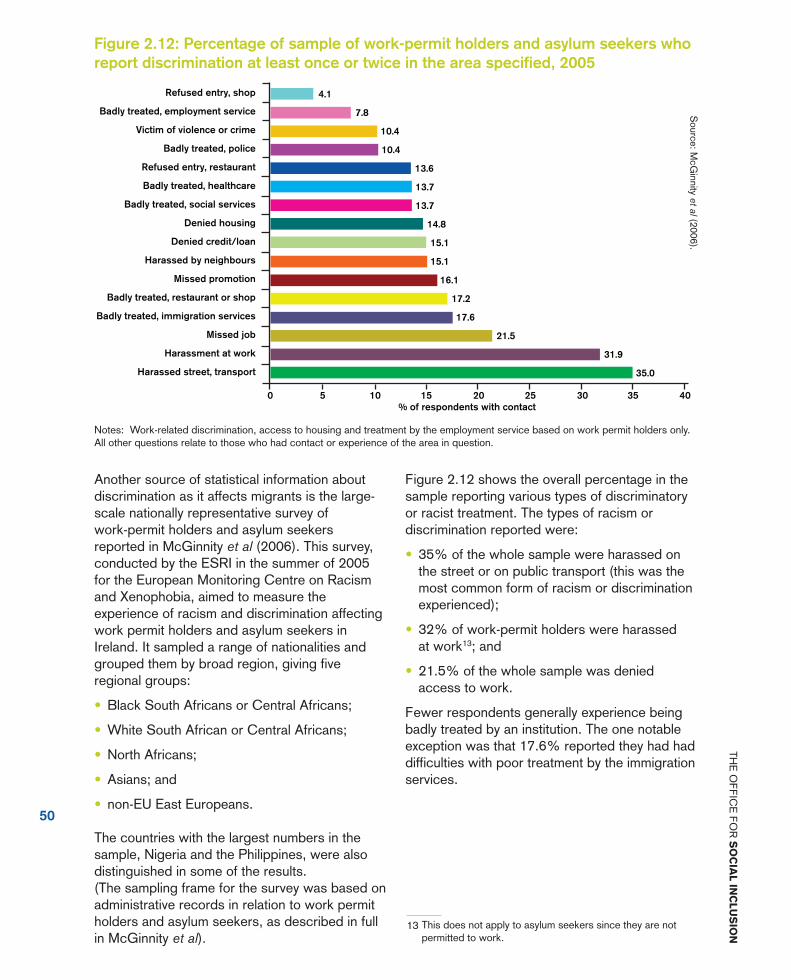
Another source of statistical information aboutdiscrimination as it affects migrants is the large-scale nationally representative survey ofwork-permit holders and asylum seekersreported in McGinnity et al (2006). This survey,conducted by the ESRI in the summer of 2005for the European Monitoring Centre on Racismand Xenophobia, aimed to measure theexperience of racism and discrimination affectingwork permit holders and asylum seekers inIreland. It sampled a range of nationalities andgrouped them by broad region, giving fiveregional groups:
• Black South Africans or Central Africans;
• White South African or Central Africans;
• North Africans;
• Asians; and
• non-EU East Europeans.
The countries with the largest numbers in thesample, Nigeria and the Philippines, were alsodistinguished in some of the results.(The sampling frame for the survey was based onadministrative records in relation to work permitholders and asylum seekers, as described in fullin McGinnity et al).
Figure 2.12 shows the overall percentage in thesample reporting various types of discriminatoryor racist treatment. The types of racism ordiscrimination reported were:
• 35% of the whole sample were harassed onthe street or on public transport (this was themost common form of racism or discriminationexperienced);
• 32% of work-permit holders were harassedat work13; and
• 21.5% of the whole sample was deniedaccess to work.
Fewer respondents generally experience beingbadly treated by an institution. The one notableexception was that 17.6% reported they had haddifficulties with poor treatment by the immigrationservices.
50
THEOFFICEFOR
SO
CIA
LIN
CLU
SIO
N
Refused entry, shop
Badly treated, employment service
Victim of violence or crime
Badly treated, police
Refused entry, restaurant
Badly treated, healthcare
Badly treated, social services
Denied housing
Denied credit/loan
Harassed by neighbours
Missed promotion
Badly treated, restaurant or shop
Badly treated, immigration services
Missed job
Harassment at work
Harassed street, transport
20 25 30 35 400 5 10 15% of respondents with contact
4.1
7.8
10.4
10.4
13.6
13.7
13.7
14.8
15.1
15.1
16.1
17.2
17.6
21.5
31.9
35.0
Source:M
cGinnity
etal(2006).
Figure 2.12: Percentage of sample of work-permit holders and asylum seekers whoreport discrimination at least once or twice in the area specified, 2005
Notes: Work-related discrimination, access to housing and treatment by the employment service based on work permit holders only.All other questions relate to those who had contact or experience of the area in question.
13 This does not apply to asylum seekers since they are notpermitted to work.

51
MIG
RA
NTS
AN
DE
THN
ICM
INO
RITY
GR
OU
PS
ASOCIALPORTR
AITOF
CO
MM
UN
ITIESIN
IRELA
ND
About 17.2% of respondents reported beingbadly treated in a restaurant or shop. About 15%reported being denied access to housingbecause of their national or ethnic origin.14
A similar percentage reported being deniedcredit or a loan or being harassed by neighbours.Between 10% and 15% of the sample reportedbeing badly treated by healthcare or socialservices or being refused entry into a restaurantbecause of their ethnic or national origin. 10% orless of the sample reported being badly treatedby the police, a victim of violence or crime, badlytreated by employment services or refused entryto a shop. This pattern of racial discrimination isbroadly similar to that found in similar surveys inother European countries, where work-relateddiscrimination and harassment on the streetgenerally features highly.
There were substantial differences across thegroups in terms of their experiences, with forexample over half of the Black South/CentralAfricans being harassed on the street or onpublic transport. This group was seen toexperience the most discrimination of all thegroups studied, even when other factors likeeducation, age and length of stay were taken intoaccount. A detailed comparison of Nigerians andFilipinos showed that Nigerians were more likelyto experience discrimination than Filipinos in allthe aspects studied.
Looking at other characteristics, the highlyeducated were significantly more likely toexperience discrimination in employment andpublic arenas, young people were more likely toexperience discrimination than older people inmost areas, and asylum seekers were muchmore likely to experience discrimination thanwork permit holders. Other statistical evidencerelating to different treatment of migrants andethnic minorities showed that school pupils fromnon-Irish national backgrounds were significantlymore likely to report having been bullied thanother students. Non-Irish national students weremore likely to report feeling isolated in schooland were much less likely to see themselves aspopular (see Smyth et al., 2004, 2006).Almost one third of all cases taken by theEquality Authority in 2004 under the EmploymentEquality Acts related to allegations ofdiscrimination in the workplace on the basis ofrace.
14 It is not entirely clear what respondents mean by beingdenied access to housing – it could mean access to social oraffordable housing options from local authorities, but mostwork-permit holders are housed in the private-rented sector,so they may mean difficulty accessing such accommodation.
52
THEOFFICEFOR
SO
CIA
LIN
CLU
SIO
N
Future prospects and data needs
The factors underpinning recent migration trendssuggest that significant inward migration is likelyto continue to be a feature of Ireland’s economyand society into the future. As the NESC recentlyput it, “international migration is a pervasivefeature across the world and […] pressure formigration from poorer countries will besustained” (2006a, p. 106). The gap in averageliving standards between the ‘old’ EU 15 and the‘new’ EU 10 is also an important aspect of thecontext, with Ireland now firmly among the richerMember States.
The evolution of Ireland’s economy is clearly amajor factor from year to year, with the scale ofrecent migration driven by very strong economicgrowth in Ireland, weak growth in continentalEurope and transitional arrangements in mostother EU 15 Member States limiting accessthere. However, the extent of that income gapbetween the old EU 15 and the new EU 10, in aUnion where free movement of labour is a keytenet, is a critical longer-term consideration.
In this context, the NESC report on migration(2006a) stresses that there are many gaps ininformation and understanding about migration toIreland, and how important it is that these befilled. To have an accurate picture of the currentsituation and to be able to frame anti-povertypolicy for the future, we need reliable data on thefollowing key areas:
• the wages of migrants and their impact onoverall wage dispersion;
• how rapidly migrants progress in the labourmarket to occupations that reflect theireducational qualifications;
• how many migrants settle permanently inIreland compared with those who return totheir country of origin (or migrate elsewhere);
• the potential scale of migration associated withfamily reunification;
• the current and future impact of migration onthe housing market;
• the overall impact of migration on the Irisheconomy; and
• the social needs of migrants and their impacton health, education and social services.

53
MIG
RA
NTS
AN
DE
THN
ICM
INO
RITY
GR
OU
PS
ASOCIALPORTR
AITOF
CO
MM
UN
ITIESIN
IRELA
ND
More data on different ethnic groups and theirsituation could also facilitate more effective,targeted action. Another important issue in datacollection is the distinction between migrantsfrom EU countries enjoying freedom ofmovement and migrants from outside the EU.
To fill these gaps we will need improved regularstatistical information. The first priority is toensure that the main statistical informationsources allow migrants or ethnic groups to beidentified in a harmonised way – covering bothmigration status and ethnicity. This relates both tohousehold surveys and the Census ofPopulation, but also to the emerging potential ofadministrative sources of data. The priorities interms of the type of information needed inrelation to these groups from these variedsources include:
• The length of time migrants have been inIreland. This is available in the QuarterlyNational Household Survey (QNHS) but wealso need it in other datasets because therates at which migrants assimilate, or fail toassimilate, are important.
• English-language fluency.
• How well skills and qualifications arerecognised.
• Family situation: nationality of spouse, whenmarried, and whether spouse and family are inIreland.
• Nationality and race, as well as age andgender.
• Migration intentions (whether migrants intendto settle permanently in Ireland).
• As far as social provision is concerned,housing situation (issues like tenure, type ofdwelling, mortgage or rent, number inhousehold) is critical.
• Household surveys can also give us importantinformation about health, but developingadministrative data collection systems withinthe health services is critical so we cancapture the particular health needs of thesevulnerable groups and how successfully theyare being met.
• Similarly, major development of administrativedata collection systems within the educationsystem, particularly at primary level, isimportant so we can capture the particulareducational needs of these vulnerable groups.
We also need in-depth research on:
• the nature of migration;
• the situation of recent migrants; and
• on recent migrants’ access to services.
A range of studies are under way in institutionssuch as the Economic and Social ResearchInstitute, Trinity College Dublin, and UniversityCollege Dublin. These will produce research ona wide range of topics relating to the nature ofmigration and the situation of migrants in Ireland.

54
THEOFFICEFOR
SO
CIA
LIN
CLU
SIO
N

HEADINGCHAPTER 3:THE TRAVELLERCOMMUNITY

56
What is the Traveller community?
Irish Travellers are an indigenous minority whohave been part of Irish society for centuries. Theyhave a value system, language, customs andtraditions that make them an identifiable groupboth to themselves and to others. Under theEqual Status Act, 2000 the “Travellercommunity’’ means the community of people whoare commonly called Travellers and who areidentified (both by themselves and others) aspeople with a shared history, culture andtraditions and, historically, a nomadic way of lifeon the island of Ireland. The Travellercommunity’s distinctive lifestyle and culture,based on a nomadic tradition and emphasisingthe importance of the extended family, sets themapart from settled people. Travellers havetraditionally been commercial nomads, whoseoccupations in the past included tinsmithing,farm labour, door-to-door sales and recycling.Gypsies and Roma in other countries alsopursue a nomadic lifestyle and culture, but arefrom different origins.
How many Travellers?
Knowledge about the size of the Travellercommunity, and most of the other statisticalinformation about its members currentlyavailable, comes from the Census of Populationcarried out by the Central Statistics Office everyfive years.
The 2006 Census asked each person:“What is your ethnic or cultural background?”One of the response options was “IrishTraveller”. The resulting figures show there were22,435 Travellers living in the Republic of Ireland.This means that Irish Travellers comprised 0.5%of the population of the Republic at that date.Furthermore, there are estimated to be about1,500 Travellers living in Northern Ireland.
This may underestimate the number of Travellersin the country. The annual count carried out bylocal authorities estimated that in 2006 therewere a total of 7,691 Traveller families in theState. Multiplied by the average size of Travellerhouseholds in the Census, this would give anestimate of the total number of Travellersconsiderably more than the figure shown in the2006 Census.
Generally, the number of people who are notincluded in the Census is thought to be very lowindeed, but it may be higher for Travellers. Inaddition, not all Travellers responding to theCensus may identify themselves as such.Nonetheless, the Census remains the onlyavailable statistical source on which an in-depthpicture of Travellers can be based. It is thesource on which this section of the social portraitrelies.
The next group we look at in this portrait is the Irish Travellercommunity. We discuss the nature of the Traveller community and its:
• size;
• profile in terms of age, gender and marital status;
• household;
• socio-economic circumstances;
• education and employment; and
• health and housing.
We end this section by discussing the limitations in the data availableabout the Traveller community and the gaps in information that need tobe filled most urgently.

57
THE
TRA
VE
LLER
CO
MM
UN
ITY
ASOCIALPORTR
AITOF
CO
MM
UN
ITIESIN
IRELA
ND
Figure 3.1 shows the age breakdown of the22,435 Travellers in the 2006 Census. We seethat the age profile of Travellers is markedlydifferent from that of the population as a whole.
• Over 40% of Travellers are children agedbetween 0 and 14, which is twice as large asthe corresponding figure for the population.
• Only 24% of Travellers are aged 35 or over,which is half the figure for the population.
• Most strikingly, only about 3% of Travellers areaged 65 or over, compared with 11% for thepopulation.
As a consequence, Travellers accounted for1.1% of the total in the 0-14 age group but only0.1% of those in the 65 and over age group. Inthe 2006 Census, only 594 Travellers aged 65 ormore were reported. This is a stark illustration ofthe gap between Travellers and others in termsof health and life expectancy to which we willreturn later on. In terms of the gender profile ofTravellers, just over half (50.6%) are female, butthis rises to 54% for those aged 65 and over,similar to the population as a whole.
Travellers
Total Population
%
45
40
35
30
25
20
15
10
5
0
41.5
20.4
0 - 14 15 - 24 25 - 34 35 - 44 45 - 54 55 - 64 65 and over
20.5
14.9 14.4
17.0
10.8
14.7
6.5
12.3
3.6
9.6
2.6
11.0
Source:C
ensusofP
opulation,2006
Figure 3.1: Distribution of Travellers and total population by age (%) in 2006

58
THEOFFICEFOR
SO
CIA
LIN
CLU
SIO
N
Figure 3.2 shows the marital status of Travellersaged 15 or more, which differs markedly fromthe corresponding figures for the population as awhole in 2006, shown in Figure 3.3. In theyounger age ranges, Travellers are much morelikely to be married than others. Between theages of 15 and 24, for example, almost a quarterof Travellers are married compared with only 2%of the population as a whole, and there is also asharp differential in the 25-34 age range. On the
other hand, in the middle to older age ranges,Travellers are more likely than others to beseparated, divorced or widowed. In the 55 to 64age range, for example, 20% of Travellers areseparated/divorced (9%) or widowed (11%)compared with 15% of the population as a wholewhose marital status is separated, divorced, orwidowed. Among those aged 65 plus, 39% arewidowed compared with 31% for the populationas a whole.
Figure 3.2: Marital status for Travellers aged 15 or over, 2006
%
100
80
60
40
20
0
15 - 24 25 - 34 35 - 44 45 - 54 55 - 64 65 +
74.0
2.1
30.4
58.6
16.3
67.9
11.0
71.7
9.7
17.4
70.1
11.2
46.841.9
20.215.9
10.9
23.9
AgeSingle
Married
Separated/divorced/widowed
S
Figure 3.3: Marital status for population aged 15 or over, 2006
Single
Married
Separated/divorced/widowed
97.8
0.1
65.5
32.325.0
66.6
14.8
72.1
12.613.1
72.3
16.5
49.9
33.6
15.18.4
2.22.0
%
100
80
60
40
20
0
15 - 24 25 - 34 35 - 44 45 - 54 55 - 64 65 +Age
Source:C
ensusofP
opulation,2006Source:C
ensusofP
opulation,2006

59
THE
TRA
VE
LLER
CO
MM
UN
ITY
ASOCIALPORTR
AITOF
CO
MM
UN
ITIESIN
IRELA
ND
15 Department of the Environment annual enumerations give asimilar regional distribution of Traveller families.
16 Persons in Traveller encampments were enumerated asprivate households.
Where Travellers live
The distribution of Travellers and of the overallpopulation across the country’s eight planningregions is shown in Table 3.1. The greater Dublinarea had 22.6% of Travellers compared with28% of the total population in 2006. On theother hand, Travellers were more heavilyconcentrated in the Midlands and West regionsthan the overall population.15 About 50% ofTravellers live in Counties Dublin, Galway,Limerick or Cork. Travellers are also more likelythan others to live in urban areas: in the 2006Census, 74% of Travellers compared to about60% of the overall population lived in towns.
Families and households
We now turn to the families and households inwhich Travellers are living. The Censusdistinguishes persons living in private householdsfrom those living in what are termed communalestablishments. A private household comprisesof a person living alone or a group of people
(not necessarily related) living at the sameaddress and with common housekeepingarrangements. A “non-private household” orcommunal establishment includes, for example, ahotel, guesthouse, hostel, nursing home orprison.16 On the night of the 2006 Census 433Travellers were living in communalestablishments, accounting for 2% of allTravellers.
Of these:
• 3% were in hotels or guest houses;
• 41% were in hospital, nursing home orchildren’s home;
• 33% were in prison; and
• 19% were in a shelter or refuge.
The overall percentage in communalestablishments is similar to the populationas a whole.
Travellers Total Population % %
Border 7.7 11.0
Dublin 22.6 28.0
Mid-East 7.8 11.2
Midland 10.7 5.9
Mid-West 11.3 8.5
South-East 11.7 10.9
South-West 8.8 14.6
West 19.5 9.8
Source:C
ensusofP
opulation,2006
Table 3.1: Travellers by planningregion, 2006

The 2006 Census reported that for the 98% ofTravellers who were living in private householdsrather than communal establishments, 4,371 ofthese were Traveller households and 1,465households comprised both Travellers and non-Travellers. Figure 3.4 shows these categorisedby the number of people in the household,compared with all private households in theState.
Traveller households and households comprisingTravellers and non-Travellers are much largerthan the overall average, with about 30%containing six or more people compared withonly 5% for the overall population.
60
THEOFFICEFOR
SO
CIA
LIN
CLU
SIO
N
Traveller and non-TravellerTravellersAll private households
3.4
3.1
2.7
2.2
4.9
4.6
0.1
0.3
0.1
8.07.0
1.0
12.7
11.73.7
14.5
12.7
9.3
18.214.2
16.6
14.4
17.0
18.1
18.915.7
28.3
14.022.4
10 +
9 persons
8 persons
7 persons
6 persons
5 persons
4 persons
3 persons
2 persons
1 person
%
0 5 10 15 20 25 30
Source:C
ensusofP
opulation,2006
Figure 3.4: Households by size, 2006
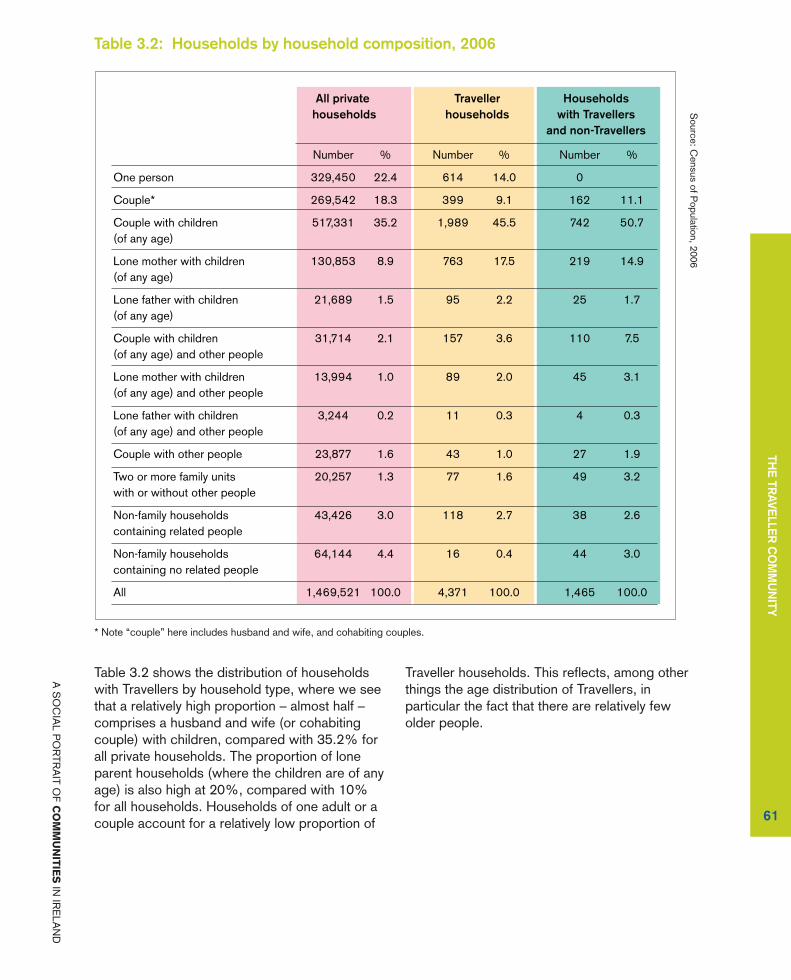
61
THE
TRA
VE
LLER
CO
MM
UN
ITY
ASOCIALPORTR
AITOF
CO
MM
UN
ITIESIN
IRELA
ND
Table 3.2: Households by household composition, 2006
Source:C
ensusofP
opulation,2006
Number % Number % Number %
One person 329,450 22.4 614 14.0 0
Couple* 269,542 18.3 399 9.1 162 11.1
Couple with children 517,331 35.2 1,989 45.5 742 50.7(of any age)
Lone mother with children 130,853 8.9 763 17.5 219 14.9(of any age)
Lone father with children 21,689 1.5 95 2.2 25 1.7(of any age)
Couple with children 31,714 2.1 157 3.6 110 7.5(of any age) and other people
Lone mother with children 13,994 1.0 89 2.0 45 3.1(of any age) and other people
Lone father with children 3,244 0.2 11 0.3 4 0.3(of any age) and other people
Couple with other people 23,877 1.6 43 1.0 27 1.9
Two or more family units 20,257 1.3 77 1.6 49 3.2with or without other people
Non-family households 43,426 3.0 118 2.7 38 2.6containing related people
Non-family households 64,144 4.4 16 0.4 44 3.0containing no related people
All 1,469,521 100.0 4,371 100.0 1,465 100.0
All private Traveller Householdshouseholds households with Travellers
and non-Travellers
Table 3.2 shows the distribution of householdswith Travellers by household type, where we seethat a relatively high proportion – almost half –comprises a husband and wife (or cohabitingcouple) with children, compared with 35.2% forall private households. The proportion of loneparent households (where the children are of anyage) is also high at 20%, compared with 10%for all households. Households of one adult or acouple account for a relatively low proportion of
Traveller households. This reflects, among otherthings the age distribution of Travellers, inparticular the fact that there are relatively fewolder people.
* Note “couple” here includes husband and wife, and cohabiting couples.

62
THEOFFICEFOR
SO
CIA
LIN
CLU
SIO
N
The socio-economic circumstancesof Travellers
A detailed picture of the socio-economiccircumstances of different groups in thepopulation and how they are changing cangenerally be based on information from regularhousehold surveys on income and livingconditions. These include the EU-SILC survey,which has been conducted by the CSO since2003, and previously the Living in IrelandSurveys carried out by the ESRI from 1994 to2001. These allow key indicators on income andpoverty to be produced, for example in relation tochildren, older people and vulnerable groups ofworking age such as lone parents and peoplewith disabilities. Such indicators include thepercentage ‘at risk of poverty’ in relation to the60% of median income threshold, and thepercentage in consistent poverty, a measure thathas been important in the targets adopted in theNational Action Plan for Social Inclusion (seeglossary). However, the situation of Travellers,like other small groups in the population, cannotbe reliably captured through such surveys. TheCensus does not include information aboutincome or most aspects of living standards ordeprivation. This means it is impossible topresent figures for these conventional measuresof living standards and poverty for the Travellercommunity, and compare their situation withothers in those terms.
It is also generally impossible to assess howstate services or the social welfare system areused because Travellers are not distinguishedfrom other citizens when they use them. Small-scale studies available suggest that members ofthe Traveller community often experience veryhigh levels of deprivation compared with non-Travellers, but it is difficult to build up an overallstatistical picture from such studies. The Censusof Population and some other relevant sourcesdo include information and statistics abouteducation and employment for the Travellercommunity. Since both education andemployment are key determinants of livingstandards, they will be the focus of the next twosections. As we will see, these data show levelsof unemployment, poor health, disability, loweducational attainment, inadequate housing, andpremature mortality among the Travellercommunity, which suggest that they are alsoexposed to distinctively high levels of poverty anddeprivation.

63
THE
TRA
VE
LLER
CO
MM
UN
ITY
ASOCIALPORTR
AITOF
CO
MM
UN
ITIESIN
IRELA
ND
Education
The 2006 Census shows that the highest level ofeducation completed for more than two-thirds ofTravellers aged 15 or over is primary level. This isthe lowest level, excluding any formal educationalqualifications. Figure 3.5 shows that:
• 16% had completed lower secondary(Junior or Intermediate Certificate);
• only 4% had completed upper secondary;
• less than 1% had some third level education,and
• a substantial proportion had given no responseto the Census question.
The picture is broadly similar for both men andwomen, though a slightly higher proportion ofwomen had lower secondary rather than primarylevel only and the proportion with third-leveleducation, though still only 1%, was alsomarginally higher for women.
Other figures in the 2006 Census show that43% of Travellers aged 15 or over had leftschool before the age of 15, while a further 32%gave no response to the relevant question in theCensus. Only 1% had been in education beyondthe age of 18.
Other indicators of educational attainmentconfirm this picture of severe educationaldisadvantage. For example, in 2004 theDepartment of Education and Science’sinspectorate carried out a survey of Travellereducation provision in a number of primary andpost-primary schools. They found that the meanachievement level of Traveller pupils was verylow compared with the population generally.More than two-thirds achieved scores that wereat or below the 20th percentile – the level underwhich only one in five of the general populationfell below. In mathematics, almost two-thirds ofTraveller pupils achieved scores that were at orbelow the 20th percentile.
%
70
60
50
40
30
20
10
0Lower Secondary
UpperSecondary
Third level,non-degree
Third level,degree
Other
69 . 3
16 . 2
0 . 4 0 . 33 . 7
10 . 1
Figure 3.5: Highest educational attainment for Travellers aged 15 or over, 2006
Primary
Source:C
ensusofP
opulation,2006

64
THEOFFICEFOR
SO
CIA
LIN
CLU
SIO
N
Employment
Employment is crucial to a household’s income,and the labour force status of Travellers agedbetween 15 and 64 as captured in the 2006Census is shown in Figure 3.6. Only 14.4% ofall Travellers in that age range are recorded asbeing in work, compared with 65.2% of thepopulation as a whole aged 15 or over. Some43% of Travellers of normal working age arereported as being unemployed, compared with6% for the working-age population as a whole.About 22% of Travellers are “in home duties”,in other words working full-time in the home,compared with 10% for the population as awhole. The percentage of Travellers reported asunable to work due to illness or disability is alsorelatively high at 8%, compared with 4% for thepopulation.
The type of work traditionally common in theTraveller community, with an emphasis on self-employment, trading and casual work, may meanthat the Census and other statistical sourcesunderestimate the percentage who are at work.
Since labour force status varies systematically byage, it is also worth comparing the percentage inwork at different age ranges, as shown in Figure3.7. This shows that the gap is widest in “prime”working age, between 25 and 54. Thepercentage of Travellers in work is remarkablystable at 20% across the age ranges. However,in the population as a whole almost 80% ofpeople aged 25 to 34 are at work.
%
70
60
50
40
30
20
10
0
Travellers
Total Population
0.4
14.4
65.2
43.1
6.2
22.3
10.1
0.5 2.3
8.33.9
9.712.0
1.7
At work Unemployed Home Duties Retired Unable to work Student Other inactive
Travellers
Total Population
%
100
80
60
40
20
0
15.3
38.5
78.1
18.1
72.3
21.0
66.2
45.7
18.2 18.2
15 - 24 25 - 34 35 - 44 45 - 54 55 - 64Age
Source:C
ensusofP
opulation,2006
Figure 3.6: Labour force status for Travellers versus total population,age 15-64, 2006
Figure 3.7: Percentage at work for Travellers versus total population,age 15-64, 2006 S
ource:Census
ofPopulation,2006

65
THE
TRA
VE
LLER
CO
MM
UN
ITY
ASOCIALPORTR
AITOF
CO
MM
UN
ITIESIN
IRELA
ND
Labour force status also varies systematically bygender. Figure 3.8 compares the percentage atwork for male and female Travellers across theage ranges. More men than women are in workat each age range except 15-24, though thedifferences are not as great as for the populationas a whole.
Among Travellers, the divergence between menand women is greater in relation tounemployment. As Figure 3.9 brings out, theCensus reports that in the age range of 15 to 54about 50% to 60% of Traveller men are reported
as unemployed. For women in that age band, thepercentage unemployed is generally around20%, although it reaches 35.4% for those aged15-24. This lower (though still of course veryhigh) unemployment rate for Traveller women, isbalanced by the fact that about 50% of Travellerwomen aged 25 or more report that they areengaged in home duties.
%
25
20
15
10
5
0
Male
Female
13.715.7
19.2
14.4 14.2
21.0 20.1
15.9
18.0
12.7
15 - 24 25 - 34 35 - 44 45 - 54 55 - 64
Age
Figure 3.8: Percentage at work for male versus female Travellers, age 15-64, 2006
Source:C
ensusofP
opulation,2006
Male
Female
%
70
60
50
40
30
20
10
015 - 24 25 - 34 35 - 44 45 - 54 55 - 64
Age
56.5
35.4
61.9
24.0
57.7
49.5
15.9
33.1
8.9
16.3
Figure 3.9: Percentage unemployed for male versus female Travellers,age 15-64, 2006
Source:C
ensusofP
opulation,2006

66
THEOFFICEFOR
SO
CIA
LIN
CLU
SIO
NHealth
Traveller health is substantially lower that of therest of the population. The main source ofstatistical information in this respect is still the1987 in-depth study carried out by Barry, Herityand Solan for the Health Research Board andthe Department of Health (The Travellers HealthStatus Study: Vital Statistics of TravellingPeople). Based on this study, it is estimated thatthe life expectancy for Traveller males is 10 yearsless than for the general population, while forfemales the gap is even larger, at 12 years.No more up-to-date information of this type iscurrently available (though this is in the course ofbeing addressed as we discuss below).
The 1995 Task Force Report on the TravellingCommunity identified that the provision of healthservices and in particular gaining access to theseservices and making use of them, was a majorconcern to the Traveller community. TravellerHealth – A National Strategy 2002-2005,published by the Department of Health in 2002,described the extent of the disadvantage that theTraveller community faced, what caused thisdisadvantage and set out the intended policyresponse to the issue of Travellers’ health.Some of the differences noted between theTraveller community and the general populationare outlined as follows.
• Mortality in early life is much higher forTravellers, with:- a perinatal mortality (that is, stillbirths anddeath during the first week) two and a halftimes more than that of the generalpopulation; and
- an infant mortality (that is, deaths within thefirst year) rate that is twice that of thegeneral population.
• The occurrence of sudden infant deathsyndrome was:- 8.8 per 1,000 live births for Travellers; and- 0.7 per 1,000 for the general population.
More recently, the Census of Population includesinformation about the numbers affected bydisability for Travellers as for others. Figure 3.10shows the disability rates for Travellers comparedwith the general population. Travellers are seento have much higher rates, with, for example,35.4% of those aged 55-64 reporting a disabilityversus 15.3% for the general population.
The Traveller Health Strategy included acommitment to “carry out a Traveller NeedsAssessment and Health Status Study to updateand extend the indicators used in the lastsurvey”. The Department of Health later set upthe Travellers Ethics, Research and InformationWorking Group. One of the group’sresponsibilities is to co-ordinate and monitorsuch a study. The Institute of Public Health(2004) prepared a design study for a TravellersAll-Ireland Health Study. It is currently under wayand will run until 2010.
Travellers
Total Population
%
50
45
40
35
30
25
20
15
10
5
0
4.83.8
7.7
4.6
12.4
4.8
17.0
7.0
26.6
10.1
35.4
15.3
45.3
29.5
0 - 14 15 - 24 25 - 34 35 - 44 45 - 54 55 - 64 65 andover
Source:C
ensusofP
opulation,2006
Figure 3.10: Percentage with a disabilityfor Travellers by age, 2006

67
THE
TRA
VE
LLER
CO
MM
UN
ITY
ASOCIALPORTR
AITOF
CO
MM
UN
ITIESIN
IRELA
ND
Owner occupied with loan or mortgage
Owner occupied without loan or mortgage
Being purchased from a local authority
Rented from a local authority
Rented from Voluntary Body
Private rented
Not stated
10.3%
5.9%
51.2%
11.6%5.7%
10.1%
5.3%
Source:C
ensusofP
opulation,2006
Figure 3.11: Traveller households in permanent housing units by tenure type, 2006
17 See also the Review of the Operation of the Housing(Traveller Accommodation) Act 1988 carried out by theNTACC in 2004 for a detailed description of this countingexercise and how it has changed over time.
Housing
Accommodation is a particular problem for manyTraveller families. As noted earlier, the 2006Census showed 433 Travellers living incommunal establishments such as hostels andhospitals, accounting for 2% of all Travellers.The 98% of Travellers who were living in privatehouseholds rather than communal establishmentswere living in 4,371 Traveller households and1,465 households with Travellers and otherpeople. Of the 4,371 Traveller households, 2,900or 66% were in permanent housing units. Some1,221 or 28% of Traveller households were inwhat the Census defines as “temporary housingunits” (a caravan, mobile home or othertemporary dwelling). The remaining 250 did notprovide information about the nature of theiraccommodation.
Some indicators in relation to the quality of theaccommodation in which Traveller householdslive, whether permanent or temporary housingunits, are obtained in the Census. Most of thoseliving in permanent housing units had pipedwater (90%), sewerage facilities (89%) andcentral heating (72%). However, of those intemporary housing 32% had no piped water orgave no response to that question; 32% had nosewerage facilities or gave no response to thatquestion; and only 8% had central heating.
Of the permanent housing units in whichTraveller households live, Figure 3.11 shows that57% are rented from the local authority orvoluntary housing body and 10% are privatelyrented. Only 16% are owner-occupied (with orwithout a mortgage), while a further 5% arebeing purchased from a local authority. About12% did not supply this information about theirhousing. Therefore, these figures show that ofthose Traveller households who did respondabout one quarter are in owner-occupiedhousing; and about three quarters are renting.
The other key source on Travelleraccommodation is the annual count of Travellerfamilies carried out by the local authorities andreported to the National TravellerAccommodation Consultative Committee.17
The 2006 annual count estimated that there werea total of 7,691 Traveller families in that year, ofwhom 5,880 were in accommodation providedby local authorities or with local authorityassistance. Of these, 1,131 were on localauthority halting sites, while the remainder werein housing provided by the local authorities orvoluntary bodies with local authority assistance.A total of 629 families, 8.2% of all Travellerfamilies, were on unauthorized sites, down from939 in 2002.

68
THEOFFICEFOR
SO
CIA
LIN
CLU
SIO
NDiscrimination
Discrimination directed at members of theTraveller community is a major and persistentconcern. However, it is extremely difficult tocapture the extent and nature of thatdiscrimination. This is illustrated by the results ofthe special module of additional questions inrelation to equality issues included in theQuarterly National Household Survey (QNHS)carried out by the CSO in late 2004 (CSO,2005). We discuss this survey in detail in thesection dealing with migrants and ethnic minoritygroups. While the questionnaire design couldpotentially have captured discrimination directedat members of the Traveller community, thenumbers involved – even in what is by moststandards a very large survey – were too small toallow this in practice. Other indicators ofdiscrimination, such as cases taken on the basisof the Equal Status legislation, are suggestive butdo not provide a robust overall picture. Filling thisinformation gap, although extremely challenging,is a priority; other areas where such gaps ariseare highlighted in the next section.
Future prospects and data needs
Specific data gaps are a problem for many of thevulnerable groups towards which social inclusionstrategies are directed. For Travellers, theinformation base on which policy has to be madeis particularly sparse and filling key gaps hasbeen recognised as a priority. Health status isone of the most important areas where thisapplies. This is being addressed at presentthrough the Traveller Needs Assessment andHealth Status Study described above. However,such an exercise must also be repeated in thefuture on a regular basis if progress is to bemonitored. The Department of Education andScience is considering the inclusion of a Travelleridentifier in the context of the development ofpost primary and primary databases, which canbe used to record enrolments in schools andmonitor the progression of pupils through theeducation system.
The housing situation of Travellers is also acritical issue. Each November local authorityTraveller accommodation staff carry out a countfor the Department of the Environment. The aimis to assess the accommodation status ofTraveller families. The results are published eachyear in the Annual Bulletin of Housing Statistics.
It is worth considering carefully to see if they canbe aligned more closely with regular statisticalinquiries like the Census. The accurateidentification of Travellers in those regularstatistical sources is an important issue.However, general household surveys will neverprovide a basis for an accurate picture of such arelatively small and hard-to-capture group. Thismakes their tracking through administrativesources of information all the more important.
As the Traveller Health Strategy recognised,current systems of data collection do not identifyTravellers as a particular minority community –and this is the case generally rather than in thehealth care area in particular. Efforts to addressthis are under way on a pilot basis. Butsuccessful “capture” of this group throughadministrative systems, which record theprovision of services, is essential to produce datain a form suitable for analysis to monitor theevolving situation of Travellers in the requireddepth.
The Report of the High Level Group on TravellerIssues (2006) looked at ways of enhancing thedelivery of services and supports by the Statesector. One of its recommendations includeddata. The Report recommended that relevantdepartments would work together with the CSOand the Office for Social Inclusion to improve therange of available data. They should do this in thecontext of the development of social and equalitystatistics under the guidance of the SeniorOfficials Group on Social Inclusion and theNational Statistics Board.

CHAPTER 4:THE HOMELESS

70
Homelessness represents one of the mostextreme forms of social exclusion. Those affectedby it form a group that is also highly vulnerableacross many areas other than housing. They poseparticular challenges for policy that need to betaken into account in the context of the NationalAction Plan for Social Inclusion (NAPinclusion).
In the final part of this social portrait we:• discuss what homelessness means and entails;• look at the numbers affected – to the extent
that available data allow; and• focus on gaps in the information currently
available on a regular basis abouthomelessness.

71
THE
HO
ME
LES
S
ASOCIALPORTR
AITOF
CO
MM
UN
ITIESIN
IRELA
ND
What is homelessness?
Before looking at the numbers affected, thedefinition of what constitutes homelessness isitself problematic. Homelessness occurs along ascale, and decisions have to be made aboutwhere to draw the dividing line. Homelessnesscertainly includes people who are sleeping roughor staying in emergency hostels or refuges, butwhat about those staying temporarily with friendsbecause they have nowhere else to go?The variety of circumstances that could beconstrued as homelessness is illustrated forexample by the categories produced byFEANTSA,18 the European Federation ofNational Organisations working with theHomeless. It distinguishes different situationsranging from rooflessness to forms of insecureand inadequate accommodation.
There are different views on how narrowly orbroadly the definition is most usefully framed.For example, a European Task Force set up in2001 and including representatives of thenational statistical institutes and non-governmental organisations active in this area,illustrated the difficulties in arriving at a standarddefinition. It resulted in a very valuable in-depthreport on the topic by the French nationalstatistical office INSEE (Brousse, 2004).It proposed measuring homelessness byfocusing on those who were homeless and whowere sleeping rough, in shelters, or in short-stayhostels. They counted separately those whowere in insecure or inadequate housing. Thisincluded people who were without legal tenancyagreements, facing eviction orders, or inhabitingunfit or overcrowded housing.
From an Irish perspective, the legal definition ofhomelessness comes from the 1988 HousingAct. This states that a person shall be regardedas being homeless if:
a) there is no accommodation available which,in the opinion of the authority, he, together withany other person who normally resided withhim or might be reasonably expected to residewith him, can reasonably occupy or remain inoccupation of; or
b)he is living in a hospital, county home, nightshelter or other such institution, and is so livingbecause he has no accommodation of thekind referred to in paragraph (a), and he is,in the opinion of the authority, unable toprovide accommodation from his ownresources.
It is worth noting that Focus Irelandincludes three categories in their definition ofhomeless (O'Sullivan, 1996):
• Visible homeless: those sleeping rough and/orthose accommodated in emergency sheltersor Bed and Breakfasts.
• Hidden homeless: those families or individualsinvoluntarily sharing with family and friends,those in insecure accommodation or thoseliving in housing that is woefully inadequate orsub-standard.
• At risk of homelessness: those who currentlyhave housing but are likely to becomehomeless due to economic difficulties, toohigh a rent burden, insecure tenure or healthdifficulties.
18 FEANTSA stands in French for “Fédération Européenned'Associations Nationales Travaillant avec les Sans-Abris”.

72
THEOFFICEFOR
SO
CIA
LIN
CLU
SIO
N
19 For a summary of approaches to measuring homelessnesssee Williams and O'Connor, 1999.
How many homeless?
Measuring the true extent of homelessness isdifficult, partly because people who arehomeless move frequently and partly becausemany of them are, by definition, hidden. It is hardto capture a small, mobile and fluctuatingpopulation.19 In Ireland, local authorities mustassess the numbers of people who are homelessin their area at least every three years, as part ofthe more general review of housing needs. Thesereviews are generally based on administrativedata held by local authorities and on informationsupplied by voluntary bodies and health boards.In an attempt to address the shortcomings of thisapproach, a more thorough method wasdeveloped and applied for the first time in the1999 assessment in Dublin, Kildare andWicklow.
This method was based on a week-long surveyof everyone who was in contact with a homelessservice and, or, registered with a local authorityduring that week. People who used the servicesfor the homeless returned questionnaires and theEconomic and Social Research Institute(Williams and O’Connor, 1999) analysed thedata. A follow-up review, using the samemethodology was completed in 2002 in Dublin(Williams and Gorby, 2002). The results of thesetwo assessments showed the numbers ofhomeless adults in Dublin to be 2,900 people in1999, (2,690 households) and 2,920 people in2002, (2,560 households). In addition, thenumber of dependant children in homelesshouseholds rose from 990 in 1999 to 1,140 in2002.
A further review of homelessness in Dublin wascarried out for the Homeless Agency in 2005(Homeless Agency, 2005). There were technicaldifferences between this review and the previoustwo reviews and the results are not directlycomparable. The reference period for this reviewwas the last week in March, and like the previousreviews the aim was to follow the definition ofhomelessness in the Housing Act 1988, butexcluding people currently living in stateinstitutions. The results showed a total of 2,015people, 1,361 households, as homeless inDublin. (A further such exercise was carried outin April 2008 and the results will be available indue course.)
The local authority assessments of housing needshow the total number of homeless householdsin the State in 2005 as 2,399. Of these, Table4.1 shows that most (63%) were in Dublin thatis, Dublin City, Dun Laoghaire-Rathdown, SouthDublin County and Fingal County with 15% inCork. These homeless households comprisedmostly a single adult (87%) but there were 149comprising of couples (with or without children),and 172 comprising of an adult with one or morechildren.
To complement this ‘point-in-time’ assessment ofhomelessness, the Homeless Agency isdeveloping a more comprehensive internet-basedinformation system which records information onpeople who present themselves to homelessservices in Dublin. This system is intended toprovide more accurate and up-to-dateinformation

73
THE
HO
ME
LES
S
ASOCIALPORTR
AITOF
CO
MM
UN
ITIESIN
IRELA
ND
Area Households Single Couples Single adults with child
Dublin City Council 1,348 1,132 115 101
Cork City Council 341 311 5 25
Galway City Council 81 78 3
Limerick City Council 132 132
Waterford City Council 59 52 1 6
County Councils total 302 249 24 29
Of which
Cork South 20 19 1
Dun Laoghaire Rathdown 134 105 15 14
Fingal 25 18 2 5
Kilkenny 14 14
Limerick 27 24 3 1
Meath 14 9 3 2
Borough Councils total 37 36 1
Of which
Drogheda 12 11 1
Sligo 18 18
Wexford 7 7
Town Councils total 9 9 88 3 8
Of which
Bray 14 14
Carlow 13 13
Dundalk 22 21 1
Tullamore 15 11 2 2
Overall total 2,399 2,078 149 172
?
Source:D
epartmentofthe
Environm
ent,Heritage
andLocalG
overnment,(2006)
Table 4.1: Homeless persons in Ireland by area, 2005

74
THEOFFICEFOR
SO
CIA
LIN
CLU
SIO
N
The socio-economic profile of thehomeless
Homelessness comes about as a result of avariety of societal and individual factors. Thereare many different routes into homelessness, butexamples of life events or crisis points that canact as a trigger include marital or relationshipbreakdown, leaving institutional care, leavingprison, eviction, a sharp deterioration of mentalhealth, and increased drug or alcohol misuse.20
Migrants and members of the Travellers’community are also more vulnerable toexperiencing homelessness during their life.These routes into homelessness are reflected inthe types of people who find themselves withouta home. Given the data available, it is onlypossible in the case of Ireland to look at theprofile of those affected by homelessness in theDublin area. This profile is based on the“Counted in 2005” study for the HomelessAgency. There is no similar information to allow aprofile of those affected by homelessnesselsewhere in Ireland.
Of the 2,015 persons counted as homeless inDublin in that 2005 assessment, 463 or 23%were children (aged under 18); and theremaining 1,552 or 77% were adults. A detailedage profile of these adults is shown in Figure 4.1and it shows that:
• the largest group, comprising 46% of the total,were aged between 26 and 39;
• about 18% were aged 25 or under, most ofthese being 21 or over;
• about 32% of homeless adults were agedbetween 40 and 64; and
• only 3% were aged 65 or over.
20 No aggregate statistics on the importance of these differentroutes into homelessness are available, but valuableinformation about them has been obtained in a range ofstudies by voluntary bodies such as Focus Ireland. Theypoint to the role of, for example, family difficulties orbreakdown, addiction and substance abuse, and mentalhealth.
Figure 4.1: Homeless adults in Dublin by age, 2005
%
50
40
30
20
10
0
14.3
46.1
2.8
Age
4.4
20 or under 21-25 26-39
32.4
40-64 65+
Source:H
omeless
Agency,2005

75
THE
HO
ME
LES
S
ASOCIALPORTR
AITOF
CO
MM
UN
ITIESIN
IRELA
ND
Focusing on gender, most homeless people weremale (66%). As Figure 4.2 shows, this variedsubstantially by age, with older homeless peoplemost likely to be male, but a majority of thoseaged 20 or less were female.21
Turning from the individual to the household,22
Figure 4.3 shows the type of householdhomeless people are in and it shows that, ofthese households:
• 77% – the overwhelming majority – are madeup of just the individual adult;
• 9% are a lone parent with a child or children;
• 7% are couples with no children; and
• 7% are couples with children.
21 This age by gender breakdown refers to the individuals whoresponded to the survey on behalf of their household ratherthan all adults, but they represent 88% of adult homelesspeople in the survey.
A household in this context is used to refer to single personsand to family members who normally live together.
22
77 .0
Figure 4.3: Homeless people in Dublin by household type, 2005
Single person
7 .0
Couple only
7 .0 9 .0
Couple + child (ren) Lone parent
80
70
60
50
40
30
20
10
0
%
Source:H
omeless
Agency,2005
Source:H
omeless
Agency,2005
Figure 4.2: Homeless adults byage and gender in Dublin, 2005
%
70
60
50
40
30
20
10
0
Male
Female
1.0 2.17.4 6.4
28.3 26.8
65.6
34.5
0.92.17.8
17.3
20or
under
21-25 26-39 40-64 65+ All
Age

76
THEOFFICEFOR
SO
CIA
LIN
CLU
SIO
N
Homeless individuals in single adult householdsare more likely to be male than homeless peoplein general. In single adult homeless households,75% are men and 25% are women. Figure 4.4shows the age profile of homeless single adults.It is generally similar to that of all homeless adults(see Figure 4.1), but with a higher proportionaged between 40 and 64.
Turning to homeless households with children –whether with one or both parents – the ages ofthe children are shown in Figure 4.5. Ofhomeless children more than 40% are aged fiveor under, while a much smaller proportion, 27%,are aged 12 or over. Nobody aged 16 or less,and only one person aged 17, was reported ason their own and homeless – that is, a singleperson household – in 2005.
Figure 4.4: Homeless single adults in Dublin by age, 2005
%
50
40
30
20
10
0
3
12
43
39
3
20 or under 21 - 25 26 - 39 40 - 64 65+
Age
Source:H
omeless
Agency,2005
Age
%
50
40
30
20
10
0
17
32
41
10
0 - 5 6 - 11 12 - 15 16 - 18
Source:H
omeless
Agency,2005
Figure 4.5: Homeless children in Dublin by age, 2005

77
THE
HO
ME
LES
S
ASOCIALPORTR
AITOF
CO
MM
UN
ITIESIN
IRELA
ND
The Dublin survey also provided information onthe citizenship of homeless people. Figure 4.6shows that 67% of single person householdswere Irish, 6% were from elsewhere in the EU,and 24% provided no response. For homelesshouseholds with children and for couples, theproportion of Irish was even higher, at over 80%and 90% respectively.
The survey also asked respondents to say wheretheir last permanent address was, though thelevel of non-response was high. Of those whodid supply information the responses varied fromspecific to vague. For about 60% of homelesshouseholds, the county in Ireland where theylived could be identified: of these, 84% wereDublin city and a further 8% were in Dublincounty. Only 4% gave a last address outsideIreland, and two-thirds of those were in England.There were very few addresses from the newMember States of the European Union.
However, a special study was carried out for theHomeless Agency on the use of homelessservices by nationals of the 10 new EU MemberStates (TSA Consultancy, 2006). It found that
while on an average day in September 2005 onlyone or two nationals from the EU 10 wereaccommodated in hostels for homeless people,between 35 and 85 were using food centres.Between 10 and 25 nationals from the EU 10who were without an income or were homelessmet with information and support organisationsduring an average week, while contact withstatutory agencies was very limited. The studyconcluded that between 60 and 120 nationalsfrom the EU 10 were seeking support fromservices for homeless people in Dublin on anaverage day at that point.
Some information was sought in the survey aboutsources of incomes. 38% of homelesshouseholds said that Jobseekers’ Assistance orBenefit (but mostly Assistance) was their incomesource. About 19% gave a disability-relatedsocial welfare payment as their income source,5% gave a lone parent payment as source, andsmall numbers gave a variety of other sources.Since the level of household income is not knownit is not possible to categorise homelesshouseholds in terms of conventional income-based measures of poverty.
Figure 4.6: Homeless households by type and citizenship, 2005
67
82
92
6 62 2 23 3
24
10
%
100
80
60
40
20
0Irish Other EU Non-EU No response
Single personWith childrenCouples
Source:H
omeless
Agency,2005

78
THEOFFICEFOR
SO
CIA
LIN
CLU
SIO
N
23 The data obtained on length of time homeless refers only tothe current spell; no information is available on repeatedspells of homelessness.
Figure 4.7: Homeless households in Dublin by duration of current spell ofhomelessness, 2005
8.1
24.1
13.8
25.2
13.6
11.2
7.4
14.4
43.1
56.4
38.6
7.48.9
14.912.9
%
60
50
40
30
20
10
0
Under 6 months 6 - 12 months 12 - 24 months 24 - 36 months More than 36 months
Single personCoupleWith children
Source:H
omeless
Agency,2005
Experience of homelessness
The length of time spent homeless is a criticalaspect of the experience of homelessness.Figure 4.7 shows how the length of time variesby household type. It shows that many of thosecounted as homeless in Dublin had beenhomeless for a very substantial length of time.Single people and those with child dependantshad slightly shorter durations than coupleswithout children, but still about 40% had been
homeless for three years or more.Among couples without children this figure waseven higher, at 56.4%. At the other end of therange, about one-quarter of single homelesspeople and households with child dependantshad been homeless for less than six months,compared with only 13.6% of homelesscouples.23
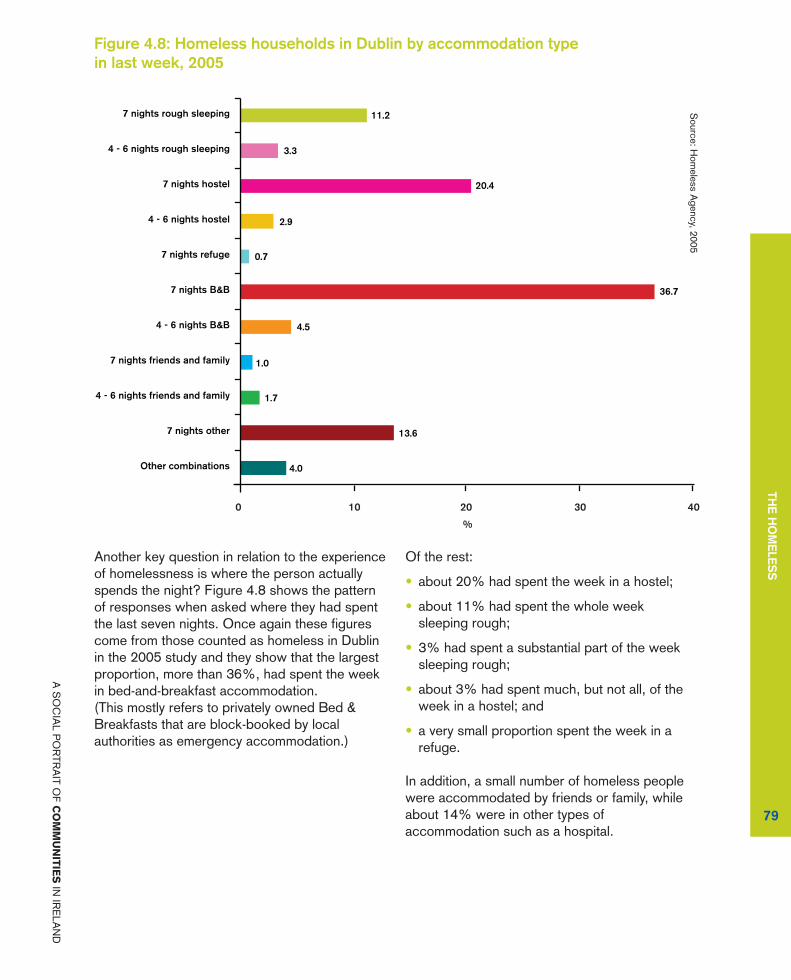
79
THE
HO
ME
LES
S
ASOCIALPORTR
AITOF
CO
MM
UN
ITIESIN
IRELA
ND
Another key question in relation to the experienceof homelessness is where the person actuallyspends the night? Figure 4.8 shows the patternof responses when asked where they had spentthe last seven nights. Once again these figurescome from those counted as homeless in Dublinin the 2005 study and they show that the largestproportion, more than 36%, had spent the weekin bed-and-breakfast accommodation.(This mostly refers to privately owned Bed &Breakfasts that are block-booked by localauthorities as emergency accommodation.)
Of the rest:
• about 20% had spent the week in a hostel;
• about 11% had spent the whole weeksleeping rough;
• 3% had spent a substantial part of the weeksleeping rough;
• about 3% had spent much, but not all, of theweek in a hostel; and
• a very small proportion spent the week in arefuge.
In addition, a small number of homeless peoplewere accommodated by friends or family, whileabout 14% were in other types ofaccommodation such as a hospital.
Figure 4.8: Homeless households in Dublin by accommodation typein last week, 2005
11.2
3.3
20.4
2.9
0.7
36.7
4.5
1.0
1.7
4.0
13.6
%
7 nights rough sleeping
4 - 6 nights rough sleeping
7 nights hostel
4 - 6 nights hostel
7 nights refuge
7 nights B&B
4 - 6 nights B&B
7 nights friends and family
4 - 6 nights friends and family
7 nights other
Other combinations
0 10 20 30 40
Source:H
omeless
Agency,2005

80
THEOFFICEFOR
SO
CIA
LIN
CLU
SIO
N
The information in Figure 4.9 show thataccommodation patterns vary for single people,couples without children, and homelesshouseholds with dependant children.This shows that while B&B accommodation wasthe most common accommodation for all threehousehold types, single homeless people andcouples were much more likely to have spentmost or all of the week sleeping rough or in ahostel than homeless households with children.
Focusing specifically on those sleeping rough formost or all of the week, 185 adults (14%) werereported as sleeping rough for four or morenights in the previous week. This is less than thenumber reported to be doing so in similarexercises in 1999 and 2002. However, themethodology used was different in 2005 – theprevious two exercises included a street count ofpeople sleeping rough. Of those people sleepingrough:
• 70% were male;
• 38% were aged between 26 and 39;
• 32% were aged between 40 and 64;
• about 40% had been homeless for three yearsor more;
• almost 90% were in single person households;
• most of the rest were couples withoutdependants; and
• around 80% were sleeping in Dublin citycentre.
Figure 4.9: Homeless households in Dublin by accommodation patternin last week, 2005
16.8
26.6
17.0
10.2
31.9
58.5
77.6
16.0
3.0
%
90
80
70
60
50
40
30
20
10
04+ nights rough
sleeping4+ nights hostel 4+ nights B&B
Single personCoupleWith children
Source:H
omeless
Agency,2005

81
THE
HO
ME
LES
S
ASOCIALPORTR
AITOF
CO
MM
UN
ITIESIN
IRELA
ND
Future prospects and data needs
With reference to homelessness, the PartnershipAgreement Towards 2016 states that theGovernment’s Integrated and PreventativeHomeless Strategies are being amalgamated,taking on board the recommendations of therecent independent review (FitzpatrickAssociates, 2006). The objective of theserevised amalgamated strategies will be toeliminate homelessness by 2010. Particularemphasis will be placed on improvedco-ordination of service provision at local level.A National Homelessness ConsultativeCommittee has been set up to involve thevoluntary and cooperative housing sector.The new Integrated Strategy on Homelessnesswas published in August 2008.
In framing policy the data available onhomelessness in Ireland, as in many othercountries, has serious limitations. The mostpressing need is for a regular measurementexercise carried out in a standard method acrossthe country. It should try to capture the extent ofhomelessness throughout the year. We alsocurrently lack regularly updated information,broken down by gender, ethnic background andso on, about:
• how people become homeless;
• the types of people most affected;
• their socio-economic backgrounds andexperiences; and
• effective routes out of homelessness.
This points to the need for regular structureddata about the individuals affected and alsoabout their overall experience of homelessnessover a sustained period. We also need to capturethe interaction between those affected byhomelessness and the various social services ina way that focuses on the homeless personrather than divided up on the basis of differentservices. Finally, although there appears to besome relationship between homelessness andmental health, as well as perhaps intellectualdisability, more information on these links wouldbe particularly valuable in framing appropriatepolicy responses.

82
THEOFFICEFOR
SO
CIA
LIN
CLU
SIO
N
CHAPTER 5:CONCLUSIONS
84
This Social Portrait has focused on severalparticularly vulnerable groups in Ireland, namely:• people living in areas of urban and rural disadvantage;
• migrants and ethnic minorities;
• the Traveller community; and
• the homeless.
The aims of the National Action Plan for Social Inclusion includebuilding viable and sustainable communities and improving the lives ofpeople living in areas or situations of poverty. The particular needs ofthese groups or communities need to be understood and addressed inthat context.
Urban and rural disadvantage
Poverty is spatially widely spread throughout thecountry. However, some poor households inurban areas are living in communities wherethere are high levels of unemployment andconcentrations of poverty and whereenvironmental and social infrastructures may alsobe poor. Rural disadvantage, on the other hand,may be associated with limited employmentopportunities, lack of transport and otherservices, high dependency levels and isolation.About 61% of the population live in cities ortowns with a population of at least 1,500, whilethe remaining 39% live in what the CSO refer toas “aggregate rural areas”. The population inrural areas has an older age profile and a higherdependency rate than urban areas. In addition,households in rural areas include more coupleswith children.
There are also marked differences betweenurban and rural areas in terms of educationalattainment, the structure of employment,transport and access to services across a rangeof areas. Income levels are higher on average inurban areas, and income-based measures ofpoverty correspondingly lower. However,generalised deprivation levels are if anythinghigher in urban areas and thus consistent povertylower in rural ones.
While home ownership rates are particularly highin rural areas, measures of housing-relateddeprivation are also high. Areas wheredisadvantage is particularly concentrated orpronounced are the focus of a range of policiesand programmes aimed at building communitiesand meeting their specific needs.

85
CO
NC
LUS
ION
S
ASOCIALPORTR
AITOF
CO
MM
UN
ITIESIN
IRELA
ND
Migrants and ethnic minorities
The economic boom in Ireland from the mid-1990s resulted in substantial immigration. Theexcess of immigrants over those migrating out ofthe country rose from 8,000 a year in 1996 to70,000 in 2006. This made a significantcontribution to population growth. Thecomposition of migratory flows to Ireland hasbecome increasingly diverse. Currentlyimmigrants from the EU, other than the UK, andfrom the rest of the world account for a largeproportion of the total inflow. This is very differentfrom the situation that prevailed in the early1990s.
Migrants come via a variety of legal channels,with those from outside the EU mostly being onwork permits; the number of asylum-seekerspeaked in 2002 and is now considerably lower.Migration has had a significant impact on thecomposition of the population by nationality andethnic origin. In 2006, 10.1% of the usuallyresident population were not of Irish nationality,with 66% of those nationals coming from anotherEU country, 11% from Asia, 8% from Africa, and5% from America. Those who are not Irishnationals are young relative to the “native”population, are relatively well-educated, and ahigher proportion are at work. Access to healthcare, housing and education may be a particularconcern for migrants and members of ethnicminorities.
It is also of concern that migrants may beexperiencing discrimination in various aspects oflife. Discrimination is a complex phenomenon,which is difficult to capture in statistical form. Butthe pattern found in specially designed surveys isbroadly similar to that found in similar surveys inother European countries. Work-relateddiscrimination and harassment on the streetgenerally feature highly.
86
THEOFFICEFOR
SO
CIA
LIN
CLU
SIO
N
The Traveller community
Under the Equal Status Act, 2000 the “Travellercommunity’’ means the community of people whoare commonly called Travellers and who areidentified (both by themselves and others) aspeople with a shared history, culture andtraditions, and historically, a nomadic way of lifeon the island of Ireland. Figures from the 2006Census show 22,435 Travellers are living in theRepublic of Ireland. The annual count carried outby local authorities in 2006 estimated that therewere a total of 7,691 Traveller families in theState at that time. Given the average family sizefor Travellers, this suggests a larger number ofpeople than the Census indicates.
The age profile of Travellers is markedly differentfrom that of the population as a whole. More than40% of Travellers are children aged between 0and 14, which is twice as large as thecorresponding figure for the population. Whileonly about 3% of Travellers are aged 65 or over,compared with 11% for the population. There isa pronounced gap in life expectancy betweenTravellers and the rest of the population, as wellas in other health indicators.
Census 2006 also indicates more than 66% ofTravellers aged 15 or over had only completededucation to primary level. Only 14% ofTravellers of working age are recorded as beingin work, compared with 65% of the populationas a whole. About 28% of Traveller householdsin 2006 were in what the Census defines as“temporary housing units” – a caravan, mobilehome or other temporary dwelling. The 2006annual count by local authorities estimates thatabout three-quarters of Traveller families were inaccommodation provided by local authorities orwith local authority assistance. Discriminationexperienced by Travellers is an on-goingconcern, although it is difficult to capture itsscale and nature statistically.

87
CO
NC
LUS
ION
S
ASOCIALPORTR
AITOF
CO
MM
UN
ITIESIN
IRELA
ND
The homeless
Homelessness represents one of the mostextreme forms of social exclusion, and thoseaffected are also highly vulnerable across manyother dimensions. Measuring the extent ofhomelessness is difficult, but the assessments ofhousing need carried out by local authoritiesshowed the total number of homelesshouseholds in the State in 2005 as 2,399. About63% of these were in Dublin, and 87%comprised a single adult. To complement this‘point-in-time’ assessment of homelessness, theHomeless Agency is developing a morecomprehensive internet-based informationsystem. It records information on people whopresent themselves to homeless services inDublin, and is intended to produce moreaccurate and up-to-date information.
There are many different routes intohomelessness, but examples of life events orcrisis points that can act as a trigger includemarital or relationship breakdown, leavinginstitutional care, leaving prison, eviction, a sharpdeterioration of mental health, and increaseddrug or alcohol misuse. The length of time spenthomeless is a critical aspect. Many of thosecounted as homeless in Dublin had beenhomeless for a very substantial length of time.
Homelessness may involve sleeping rough, in ahostel, in a refuge, or in bed-and-breakfast, theaccommodation used mostly by local authoritiesas emergency accommodation. Migrants mayalso be vulnerable to homelessness, with a 2006study showing that between 60 and 120nationals from the EU 10 were seeking supportfrom services to homeless people in Dublin on anaverage day.

88
THEOFFICEFOR
SO
CIA
LIN
CLU
SIO
N

GLOSSARY

90
THEOFFICEFOR
SO
CIA
LIN
CLU
SIO
N
‘At risk of poverty’ thresholds: Incomethresholds derived as proportions of medianincome, for example, 60% of the median incomein a sample
Asylum seeker: A refugee from another countrywho is seeking protection and permission toremain, in this context from the Irish government
Consistent poverty: Originally, a measure ofpoverty of those who were ‘at risk of poverty’and deprived of at least one out of thefollowing eight items considered necessary toensure a basic standard of living:
• Two pairs of strong shoes
• A warm waterproof overcoat
• Buy new not second-hand clothes
• Eat meals with meat, chicken, fish(or vegetarian equivalent) every second day
• Have a roast joint or its equivalent once a week
• Had to go without heating during the last yearthrough lack of money
• Had a day in the last two weeks without asubstantial meal due to lack of money
• Experienced debt problems arising fromordinary living expenses
Now a measure of poverty of those who are ‘atrisk of poverty’ and deprived of at least two outof the following 11 items:
• Without heating at some stage in the past yeardue to lack of money
• Unable to afford two pairs of strong shoes
• Unable to afford a roast joint (or its equivalent)once a week
• Unable to afford a meal with meat, chicken orfish (or vegetarian equivalent) every secondday
• Unable to afford new (not second-hand)clothes
• Unable to afford a warm waterproof coat
• Keep the home adequately warm
• Presents for family or friends at least oncea year
• Replace any worn out furniture
• Have family or friends for a drink or meal oncea month
• Have a morning, afternoon or evening out inthe last fortnight, for entertainment
Dependency rate or ratio: Generally used torefer to the number of children plus older peoplein the population as a proportion or percentageof the population of working age
Discrimination: Generally used to refer to unfairtreatment of a person on the basis of theirmembership of a particular group, in terms of, forexample, gender, nationality or race
EEA: The European Economic Area comprisesall member states of the EU plus Iceland,Lichtenstein, Norway and Switzerland
Ethnic minority: Generally used to describe agroup of the same race or nationality who sharea distinctive culture that is different from most ofthe population

91
GLO
SS
AR
Y
ASOCIALPORTR
AITOF
CO
MM
UN
ITIESIN
IRELA
ND
EU-SILC: European Union Statistics on Incomeand Living Conditions; in Ireland an annualsurvey carried out by the Central Statistics Officesince 2003
EU 10: The 10 member states who acceded tothe EU on 1 May 2004, namely Cyprus, theCzech Republic, Estonia, Hungary, Latvia,Lithuania, Malta, Poland, Slovakia and Slovenia
EU 12: The EU 10 plus the two new memberstates who acceded to the EU on 1 January2007, namely Bulgaria and Romania
EU 15: Member States of the European Unionprior to the accession of 10 new member stateson 1 May 2004: namely Austria, Belgium,Denmark, Finland, France, Germany, Greece,Ireland, Italy, Luxembourg, the Netherlands,Portugal, Spain, Sweden and the UnitedKingdom
Homeless: The legal definition of homelessnessin the 1988 Housing Act states that a personshall be regarded as being homeless if:a) there is no accommodation available which,in the opinion of the authority, he, together withany other person who normally resided withhim or might be reasonably expected to residewith him, can reasonably occupy or remain inoccupation of; or
b)he is living in a hospital, county home, nightshelter or other such institution, and is so livingbecause he has no accommodation of thekind referred to in paragraph (a), and he is, inthe opinion of the authority, unable to provideaccommodation from his own resources.
Household: A household is usually defined forstatistical purposes as either a person livingalone or a group of people (not necessarilyrelated) living at the same address with commonhousekeeping arrangements – that is, sharing atleast one meal a day or sharing a living room orsitting room
Infant mortality: Deaths within the first year oflife as a proportion of total births
Labour force participation: The labour forceparticipation rate is a measure of the proportionof the working-age population that engagesactively in the labour market, either by working orlooking for work
Life expectancy: The number of years that aperson could expect to live on average, based onthe mortality rates of the population in a givenyear
LIIS: Living in Ireland Survey, a household surveycarried out by the Economic and SocialResearch Institute between 1994 and 2001
Lone parent: A parent who has primary custodyof a dependant child and is not living with theother parent
Mean: the average value (for example, theaverage income in a sample obtained through ahousehold survey)
Median: The value that divides a sample in half,for example the income level exactly in the middleof a scale of income from highest to lowest
Migrant: Someone who moves from one regionor, in the context of this social portrait, from onecountry to another
92
THEOFFICEFOR
SO
CIA
LIN
CLU
SIO
N
Perinatal mortality: Stillbirths and deaths duringthe first week of life
Planning region: The eight regions into whichIreland has been divided for certain planning andadministrative purposes
Quintile: One-fifth of a sample divided into fiveequal parts to show how income, for example, isspread throughout the population; each quintilerepresents where a person’s or household’sincome is located
Risk of poverty: A term used by the EuropeanUnion to denote whether a household falls belowthe 60% median income threshold
Social capital: A term that has a variety ofmeanings, but broadly speaking describes thepattern and intensity of networks among peopleand the shared values, which arise from thosenetworks. While definitions of social capital vary,the main aspects are:
• citizenship;
• neighbourliness;
• trust and shared values;
• community involvement;
• volunteering;
• social networks; and
• civic participation
Social welfare transfers: Cash paid fromvarious social welfare schemes to individuals orhouseholds
Temporary housing units: Defined in theCensus of Population as a caravan, mobile homeor other temporary dwelling
Traveller community: Under the Equal Status ofAct, 2000 the “Traveller community’’ means thecommunity of people who are commonly calledTravellers and who are identified (both bythemselves and others) as people with a sharedhistory, culture and traditions including,historically, a nomadic way of life on the island ofIreland
Urban/rural location: In EU-SILC, each countryis divided into eight levels based on populationdensity. These areas are further grouped intourban and rural areas as follows:
• Urban:
- Cities, suburbs of cities, mixed urban/ruralareas bordering on the suburbs of cities,towns and surrounding areas withpopulations of 5,000 or over (large urban);
- mixed urban/rural areas bordering largertowns; and
- towns and surrounding areas with apopulation of 1,000 to 5,000 (other urban)
• Rural:- mixed urban/rural areas, and rural areas
Work permit: In general, someone from outsidethe European Economic Area (EEA) needs anemployment permit to be allowed work legally inIreland; this may take the form of a work permit,working visa or work authorisation

BIBLIOGRAPHY ANDFURTHER READING

94
THEOFFICEFOR
SO
CIA
LIN
CLU
SIO
NBarrett, A., A. Bergin and D. Duffy (2006), “TheLabour Market Characteristics and LabourMarket Impact of Immigrants in Ireland”, TheEconomic and Social Review, vol. 37, no. 1, pp1-26.
Barry, J., B. Herity and J. Solan (1989), TheTravellers Health Status Study: Vital Statistics ofTravelling People 1987, Health Research Board:Dublin.
Brousse, C. (2005), The Production of Data onHomelessness and Housing Deprivation in theEuropean Union: Survey and Proposals, Reportfor Eurostat: Luxembourg.
Central Statistics Office (2004), Census 2002Volume 8: Irish Traveller Community, StationaryOffice: Dublin/Cork.
Central Statistics Office (2004), Population andLabour Force Projections, 2006-2036,Stationery Office: Dublin/Cork.
Central Statistics Office (2005), Population andMigration Estimates April 2005, StationeryOffice: Dublin/Cork.
Central Statistics Office (2005b), QuarterlyNational Household Survey Quarter 4 2004:Equality, Stationery Office: Dublin/Cork.
Central Statistics Office (2006, 2007) Census ofPopulation 2006, Volumes 1-11, StationeryOffice: Dublin/Cork.
Department of Education and Science (2005),Survey of Traveller Educational Provision,Stationery Office: Dublin.
Department of Education and Science (2007),Annual Report 2006, Stationery Office: Dublin.
Department of the Environment, Heritage andLocal Government (2006), Housing NeedsAssessment 2005, Detailed Results,http://www.environ.ie/en/Publications/StatisticsandRegularPublications/HousingStatistics/
Department of the Environment Heritage andLocal Government (2007), Annual Bulletin ofHousing Statistics 2006, Stationery Office:Dublin.
Department of Health (2002), Travellers NationalHealth Strategy 2002-2005, Department ofHealth: Dublin.
Department of Justice, Equality and Law Reform(2005), Immigration and Residence in Ireland:Outline Policy Proposals for an Immigration andResidence Bill, Stationery Office: Dublin.
Department of Justice, Equality and Law Reform(2000), Integration: A two way process, Dublin.
Doyle, N., G. Hughes, and E. Wadensjö (2006),Freedom of Movement for Workers from Centraland Eastern Europe: Experiences in Ireland andSweden, Swedish Institute for European PolicyStudies: Stockholm.
Fitz Gerald, J., A. Bergin, I. Kearney, A. Barrett,D. Duffy, S. Garrett, Y. McCarthy (2005),Medium-Term Review 2005-2012,The Economic and Social Research Institute:Dublin.
Fitzpatrick Associates (2006), Review of theImplementation of the Government’s Integratedand Preventative Homeless Strategies, Reportfor the Minister for Housing and Urban Renewal:Dublin.
Haase T., J. Pratschke (2005), Deprivation andits spatial articulation in the Republic of Ireland:new measures of deprivation based on theCensus of Population, 1991, 1996 and 2002,Area Development Management: Dublin.
Homeless Agency (2005), Counted In 2005,Homeless Agency: Dublin.
Homeless Agency (2006), Annual Report 2005:Making it Home, Homeless Agency: Dublin.
McGinnity, F., P. O’Connell, E. Quinn, and J.Williams (2006), Migrants’ Experience of Racismand Discrimination in Ireland, The Economic andSocial Research Institute: Dublin.
MacLachlan, M., and M. O’Connell (eds.),(2000) Cultivating Pluralism: Psychological,Social and Cultural Perspectives on a ChangingIreland, Oaktree Press: Dublin.

95
BIB
LIOG
RA
PH
YA
ND
FUR
THE
RR
EA
DIN
G
ASOCIALPORTR
AITOF
CO
MM
UN
ITIESIN
IRELA
ND
Murphy, M. (2005), Review of Implementation ofTraveller Health National Strategy 2002-2005,Conference Presentation at RCSI, October.
National Consultative Committee on Racism andInterculturalism (2004), NCCRI Progress Report2002-2004 and Strategy Statement 2005-2007,NCCRI: Dublin.
National Economic and Social Council (2006a),Migration Policy, NESDO: Dublin.
National Economic and Social Council (2006b),Managing Migration in Ireland: A Social andEconomic Analysis, A Report by theInternational Organization for Migration,NESDO: Dublin.
National Traveller Accommodation ConsultativeCommittee (2002), Annual Report 2002,NTACC: Dublin.
National Traveller Accommodation ConsultativeCommittee (2004a), Annual Report 2004,NTACC: Dublin.
National Traveller Accommodation ConsultativeCommittee (2004b), Review of the Operation ofthe Housing (Traveller Accommodation) Act1988: Report to the Minister for Housing andUrban Renewal, NTACC: Dublin.
Nolan, B., C. T. Whelan (2000), “Urban Housingand the Role of 'Underclass' Processes: theCase of Ireland”, Journal of European SocialPolicy, Vol. 10., No. 1, pp 5 – 21.
Nolan, B., C.T. Whelan, J. Williams (1998),Where Are Poor Households? The SpatialDistribution of Poverty and Deprivation inIreland, Oak Tree Press in association withCombat Poverty Agency: Dublin.
Nolan, B., C.T. Whelan, J. Williams (1999),“Spatial Aspects of Poverty and Deprivation inIreland”, in D. Pringle, J. Walsh and M. Hennessy(eds.), Poor People and Poor Places: AGeography of Poverty and Deprivation inIreland, Oak Tree Press: Dublin.
Task Force Report on the Travelling Community(1995).
TSA Consultancy (2006), Away from home andhomeless, Homeless Agency: Dublin.
Watson, D., C.T. Whelan, J. Williams, and S.Blackwell (2005), Mapping Poverty: National,Regional and County Patterns, Institute of PublicAdministration & Combat Poverty Agency:Dublin.
Williams, J. and S. Gorby (2002), Counted In2002, Homeless Agency: Dublin.
Williams, J. and M. O’Connor (1999), CountedIn: The Report of the 1999 Assessment ofHomelessness in Dublin, Kildare and Wicklow,Homeless Initiative/The Economic and SocialResearch Initiative: Dublin.

96


Department of Social and Family Affairs, Gandon House, Amiens Street, Dublin 1.Tel: + 353 1 7043 851 Fax: + 353 1 7043 032e-mail: [email protected] www.socialinclusion.ie
Department of Social and Family Affairs,Gandon House, Amiens Street, Dublin 1.Tel: + 353 1 7043 851 Fax: + 353 1 7043 032e-mail: [email protected] www.socialinclusion.ie